
You are currently viewing a beta version of our website. If you spot anything unusual, kindly let us know.
Preprint
Review
Refracted Gravity Solutions from Small to Large Scales
Altmetrics
Downloads
99
Views
30
Comments
0
A peer-reviewed article of this preprint also exists.


This version is not peer-reviewed
Abstract
If visible matter alone is present in the Universe, General Relativity (GR) and its Newtonian weak field limit cannot explain several pieces of evidence, from the largest to the smallest scales. The most investigated solution is the cosmological model ΛCDM, where GR is valid and two dark components are introduced, dark energy and dark matter, to explain the ∼70% and ∼25% of the mass-energy budget of the Universe, respectively. An alternative approach is provided by modified gravity theories, where a departure of the gravity law from ΛCDM is assumed and no dark components are included. This work presents refracted gravity (RG), a modified theory of gravity formulated in a classical way where the presence of DM is mimicked by a gravitational permittivity ϵ(ρ) monotonically increasing with the local mass density ρ, which causes the field lines to be refracted in small density environments. Specifically, the flatter the system the stronger the refraction effect and, thus, the larger the mass discrepancy if interpreted in Newtonian gravity. RG presented several encouraging results in modelling the dynamics of disk and elliptical galaxies and the temperature profiles of the hot X-ray emitting gas in galaxy clusters and a covariant extension of the theory seems to be promising.
Keywords:
Subject: Physical Sciences - Astronomy and Astrophysics
1. Introduction
In the Universe, several pieces of evidence cannot reconcile with General Relativity (GR), if we only assume the presence of visible (baryonic) matter. A mass discrepancy of ∼80-90% is observed from the largest scales (e.g., the cosmic microwave background (CMB) [1], the large-scale structure [2,3], gravitational lensing effects where Bullet Cluster example is worth mentioning [4,5,6], light elements abundances [7], and galaxy clusters dynamics [8]) to the smallest scales (e.g., the flat trend of disk galaxies rotation curves [9,10,11]).
The most investigated solution to explain this phenomenology is to assume the presence of a non-baryonic and cold, i.e., non-relativistic at the epoch of decoupling from radiation, form of matter which only gravitationally interacts with baryonic matter: the cold dark matter (CDM) [12]. However, the only presence of dark+baryonic matter is again not sufficient to account for all the pieces of evidence in the Universe, which suggest a further discrepancy of ∼70%. The most studied cosmological model is the CDM, which assumes GR as gravity theory and introduces two dark constituents besides visible matter: dark energy (DE) and dark matter (DM), which can explain the ∼70% and ∼25% of the mass-energy budget of the Universe. Specifically, DE is an exotic fluid with negative pressure which justifies the accelerated expansion of the Universe, as observed from the Hubble diagram of Ia Supernovae (SNaeIa) [13,14], and it can be identified with the cosmological constant .
Even if CDM can account for the majority of the observations in the Universe, it presents some problems, both on large and on small scales. On large scales, we observe the cosmological constant problem [15,16], the coincidence problem [17], and the tensions between the values of some cosmological parameters measured from probes of the late and the early Universe [1,18,19]. On small scales, we observe several discrepancies between CDM simulations and observations. These generate the cusp/core, missing satellites, too-big-to-fail, and planes of satellite galaxies problems (e.g., see [20,21] for a review).
It is remarkable to cite also the presence of some observed regularities on galaxy scale which are hard to explain in a CDM paradigm, where a stochastic merging process of structures is invoked. Some of these regularities are very tight scaling relations between a property of the dark matter and of the baryonic matter in galaxies, which might be counter-intuitive since DM represents the ∼90% of the galaxy content, whereas baryonic matter only represents its ∼10%. Among these relations, we can mention (1) the Baryonic Tully-Fisher Relation [22], (2) the Mass Discrepancy-Acceleration Relation [23], and (3) the Radial Acceleration Relation [24]. The three relations see the emergence of the same acceleration scale m s−2, which, if expressed in natural units, is , suggesting a connection between the DM and the DE sectors. These coincidences are even less intuitive in a CDM context.
An alternative way to explain these discrepancies or regularities is provided by alternative theories of gravity, without the addition of any dark constituent. One of the most investigated modified theories of gravity formulated in a nonrelativistic ways is MOdified Newtonian Dynamics (MOND) [25,26,27]. MOND assumes a modification of the law of gravity dependent on the value of the background acceleration: when its value goes below the acceleration scale , the gravitational field departs from Newtonian gravity, being subjected to a boost that mimics the effect of DM. MOND not only explains more intuitively but actually predicted several aspects of the dynamics of galaxies, such as, the flatness of the rotation curves of disk galaxies and the three mentioned scaling relations.
Matsakos and Diaferio [28] proposed in 2016 a different approach. They formulated Refracted Gravity (RG), a classical modified theory of gravity which does not assume the presence of DM and is regulated by the value of the local mass density , rather than of the acceleration a. The Poisson equation of RG is modified at first member by the presence of the gravitational permittivity, , a monotonic increasing function of which boosts the gravitational field in regions where the density goes below a critical value, reproducing the effect of DM in Newtonian gravity. A covariant version of RG was recently formulated [29] and it seems to describe both the DE and DM sectors with a single scalar field and to reproduce the the Hubble diagram of SNaeIa.
RG has obtained some encouraging results in modelling the dynamics of galaxies and galaxy clusters, and on the covariant side. The paper develops as follows. Section 2 describes RG theory. Section 3, Section 4, Section 5, and Section 6 recap the main analyses and results obtained with RG in the field of disk galaxies, elliptical galaxies, galaxy clusters, and covariant RG, respectively. Section 7 discusses the future projects of RG and concludes the paper.
2. Refracted Gravity
Refracted Gravity (RG) is a theory of modified gravity formulated in a classical way, which can be interpreted in analogy to electrodynamics in matter [28]: as an electric field line suffers a change both in direction and in magnitude when it crosses a dielectric medium with a nonuniform permittivity, a gravitational field line suffers the same changes when it passes from a high-density to a low-density environment. This behaviour of the gravitational field is encoded in this modified Poisson equation:
where is the gravitational potential and is the gravitational permittivity. The following asymptotic limits are adopted for the gravitational permittivity:
where and are the gravitational permittivity in vacuum and the critical density, respectively, two of the three free parameters of the theory. When , Newtonian Poisson equation is recovered:
whereas, when , we are in fully RG regime.
Differently from MOND, the RG gravitational field has a different behaviour for spherical and flat systems. For spherical systems, the RG Poisson equation (Equation (1)) reduces to:
where is the mass of the spherical system enclosed within the spherical radius r and is Newtonian gravitational field. In this case, the RG field direction and r-dependence remain Newtonian and the RG field magnitude increases compared to the Newtonian one where , i.e., where (right panels of Figure 1).
The analogy with electrodynamics in matter, i.e., the refraction of the field lines where the density decreases, is observed for flattened systems. Expanding the left-hand side of Equation (1), we obtain:
In this configuration, the RG field depends both on the density (second term in the left-hand side of Equation (5)), as for spherical systems, and on its gradient (first term in the left-hand side of Equation (5)). In particular, the term “” is different from zero in non-spherical configurations and causes the field lines to refract. The acceleration boost in the external regions of disk galaxies that in Newtonian gravity is explained by the presence of DM, in RG is explained by the refraction of the field lines toward the equatorial plane of the disk caused by the low-density regions above and below the disk plane (left panels of Figure 1). Following Equation (5), RG predicts that the flatter the system, the larger the mass discrepancy if interpreted in Newtonian gravity. This might explain a positive correlation between ellipticity and DM content of elliptical galaxies [30,31] and the different DM quantity of globular clusters and dwarf galaxies, where the former are nearly spherical and DM-free (e.g., [32]) and the latter are flatter and one of the darkest objects in the Universe (e.g., [33]).
Where in flat systems, e.g., in the outskirts of disk galaxies, the gravitational field assumes the asymptotic trend , where is the MOND critical acceleration set by the normalization of the BTFR:
where is the asymptotic value of the flat part of the rotation curve of disk galaxies and M is the total baryonic mass of the disk galaxy. In this regime, the RG field trend deviates from the Newtonian inverse square law. This asymptotic limit coincides with MOND asymptotic limit for the gravitational field where , which might indicate that RG shares the majority of MOND successes on galaxy scale. The difference between RG and MOND is better observed in spherical systems, where the field trend in RG is Newtonian () where , preserving the Gauss theorem, but the field trend in MOND is where , as in flattened systems.
Different functions can be adopted for the gravitational permittivity, such that it accomplishes the asymptotic limits of Equation (2). For all the analyses performed with RG, the following smooth step function of the mass density was employed:
represented in Figure 2. Besides and , a third free parameter, Q, is present in RG, where Q regulates the steepness of the transition between the two asymptotic limits of Equation (2). In Figure 2, Equation (7) is represented for three values of Q, showing that the larger its value, the steeper the transition between the two asymptotic regimes of Equation (2). The three RG free parameters are supposed to be universal.
3. Dynamics of disk galaxies
Matsakos and Diaferio [28] presented some preliminary encouraging results, according to which RG properly models the BTFR of galaxies (Equation (6)) and the rotation curves of the high-surface brigthness (HSB) disk galaxy NGC6946 and low-surface brightness (LSB) disk galaxy NGC1560. Cesare et al. [34] demonstrated that RG can properly model the dynamics of disk galaxies. For their analysis, they considered the rotation curves and the vertical velocity dispersion radial profiles of 30 disk galaxies in the DiskMass Survey (DMS) [35] at low redshift. They chose this sample since these galaxies are close to face-on, which allowed the measurement of both their rotation curves and vertical velocity dispersions. In this way, Cesare et al. [34] could obtain a single constraint of the RG parameters from two kinematic profiles taken at the same time rather than from the rotation curves alone, which provided a more robust analysis. These results are also summarised in [36].
Cesare et al. [34] modelled with RG (1) the rotation curves alone of each DMS galaxy, (2) the rotation curves and the vertical velocity dispersions at the same time of each DMS galaxy, (3) the rotation curves and the vertical velocity dispersions of all the 30 DMS galaxies at the same time, and (4) the RAR of DMS galaxies.
3.1. Mass model
Cesare et al. [34] modelled the baryonic mass density profile , which generates the total gravitational potential since DM is not present, with (1) an axisymmetric exponential disk for the stars, (2) a spherical stellar bulge, and (3) two razor-thin disks for the atomic and molecular gas. The 3D mass density of the stellar disk is modelled with an exponential profile of this kind:
where is the surface brightness radial profile of the stellar disk, R and z are the cylindrical coordinates (R is the radius projected on the sky, oriented along the major axis of the disk and z is the vertical coordinate, oriented perpendicular to the disk equatorial plane), and and are the stellar mass-to-light ratio and the disk scale height, two of the five free parameters of the dynamic model adopted by [34].
The surface brightness of the disk is modelled with a linear interpolation of the measured surface brightness data, to catch the specific features of the luminous matter distribution, which generally correspond to features in the rotation curve, following the “Renzo’s rule” [37]. The disk surface brightness in the innermost galaxy regions, where the bulge is dominant, is modelled with an exponential profile [38,39],
obtained by fitting the surface brightness points of the outermost stellar disk, where the stellar disk alone dominates.
DMS galaxies are disk-dominated, being the stellar disk-over-stellar bulge total luminosity ratio around . For this reason, the bulge was approximated as a sphere, introducing negligible systematic errors. The 3D mass density of the bulge is modelled with this Abel integral:
where is the surface brightness radial profile of the bulge, and
is the 3D radius. Being the bulge contribution subdominant, Cesare, et al. [34] assumed the mass-to-light ratio of the bulge equal to the mass-to-light ratio of the disk, , without introducing an additional degree of freedom. They modelled the surface brightness of the bulge with a Sérsic spherical profile [40]:
To account for the seeing, which is not negligible since the measurements where taken from the ground with the 3.5 m diameter Calar Alto Observatory, they modelled the observed surface brightness of the bulge with Equation (12) convolved with a Gaussian point spread function.
The 3D mass density of the atomic and molecular gas are modelled with two razor-thin disks:
and
where and are the surface mass densities of the atomic and molecular gas, respectively, which Cesare, et al. [34] modelled with a linear interpolation of the data for the same reason as the stellar disk, and is the Dirac function.
3.2. Dynamical model
From the total 3D mass density profile given by Equation (15), Cesare et al. [34] derived the RG gravitational potential by solving the RG Poisson equation (1). To solve the RG Poisson equation, they used an iterative Poisson solver based on the Successive-Over-Relaxation method, given by combining the Jacobi and Gauss-Seidel methods [41]. From the RG potential, they derived the models for the rotation curve, , and the vertical velocity dispersion radial profile, :
and
where Equation (17) is the vertical velocity dispersion for a vertically-decreasing exponential disk whose density follows Equation (8).
The dynamical model has five free parameters: the stellar mass-to-light ratio , the stellar disk scale height , and the three RG parameters, , Q, and . They estimated the free parameters of the model firstly from the rotation curve alone of each galaxy and then from the rotation curve and the vertical velocity dispersion taken at the same time of each galaxy with a Monte Carlo-Markov Chain (MCMC) algorithm with Metropolis-Hastings acceptance criterion. They adopted the following priors for the free parameters of the model. For , they adopted a Gaussian prior based on the stellar population synthesis (SPS) model of Bell and de Jong [42], keeping into account that the surface brightness is measured in the K-band, where the Gaussian tail for was set to 0. For , they adopted a Gaussian prior peaked on , a scale height obtained with the following relation, derived from a combined sample of 60 edge-on late-type galaxies by Bershady, et al. [43]:
where the term indicates the ∼25% intrinsic scatter. Estimating was essential to have a comparison reference for DMS galaxies where, due to their nearly face-on configuration, their cannot be directly measured. For the three RG parameters, they adopted a flat prior in the following intervals: for , for Q, and for .
3.3. Results
RG models the kinematic profiles of DMS galaxies with sensible parameters. Figure 3 shows the RG models (blue solid lines) of the rotation curves (panels (a) and (b)) and the vertical velocity dispersion profiles (panels (c)) against the DMS data (red dots with error bars) for three DMS galaxies (UGC 3091, UGC 3701, and UGC 4256). The blue curves for the rotation curves in panels (a) are computed with the parameters estimated from the rotation curves of each galaxy alone. The blue curves for the rotation curves in panels (b) are computed with the parameters found by modelling the rotation curves and the vertical velocity dispersion profiles of each galaxy at the same time. In panels (c), the cyan solid lines are the RG vertical velocity dispersions calculated with the same parameters as the blue curves but with disk-scale heights set equal to (Equation (18)). In all panels, the dashed magenta vertical lines identify the bulge effective radius ( in Equation (12)), and the dashed green vertical lines represent the bulge radius adopted in the disk-bulge decomposition for the surface brightness modelling (see Section 3.1). We can see that RG properly models both kinematic profiles and that the substructures of the rotation curves are properly reproduced following the Renzo’s rule (see Section 3.1).
Both in the only-rotation curve and in the combined rotation curve + vertical velocity dispersion analyses, Cesare, et al. [34] found mass-to-light ratios consistent with the SPS model of Bell and de Jong [42]. In the only-rotation curve analysis, the estimated were generally consistent with the derived from Equation (18). Instead, in the combined analysis, the estimated systematically resulted smaller than the correspondent . Angus, et al. [44] found a similar result by modelling the DMS galaxies with QUMOND theory [45], a modified gravity version of MOND theory. Yet, this result seems not to indicate a flaw in the two modified theories of gravity but, instead, an observational bias. Indeed, the disk scale height found by Cesare, et al. [34] and by Angus, et al. [44] was estimated from the vertical velocity dispersions, which are measured with spectroscopy from a signal derived from a mixed stellar population of young and old stars, where the signal from the young population is dominant [46]. The young stellar population distributes in a disk thinner and with a smaller vertical velocity dispersion than the old stellar population [46]. Instead, the disk scale heights of edge-on galaxies, from which Equation (18) is derived to determine , are directly measured from near-Infrared photometry, whose signal is dominated by the old stellar population [46], having higher and than the young stellar population. It is possible to simulate the vertical velocity dispersion of the old stellar population by artificially increasing the vertical velocity dispersion of the young stellar population by a proper factor. Cesare et al. [34] computed this factor which resulted equal to , in agreement with the work of Aniyan, et al. [46]. Cesare et al. [34] artificially increased of this factor the vertical velocity dispersions of five DMS galaxies, obtaining disk scale heights in agreement with the correspondent .
The three RG parameters derived from the rotation curves and the vertical velocity dispersions of each galaxy are in agreement with each other: their average errors are larger than the standard deviation of their distribution. This suggests their universality, as should be from the theory formulation. To better test their universality, Cesare, et al. [34] estimated a unique combination of RG free parameters from the two kinematic profiles of all the 30 galaxies taken at the same time, to verify their agreement with the average of the RG parameters found from the rotation curves and the vertical velocity dispersions of each galaxy. The mean RG parameters derived from the single galaxies with their mean errors are , , (purple squares with error bars in Figure 4), whereas the unique combination of free parameters is , , , where their estimates and error bars are the medians (green dots in Figure 4) and the and percentiles of their posterior distributions (blue shaded areas in Figure 4). In Figure 4, the yellow, red, and black contours show the 1, 2, and 3 levels. The code used to find this unique combination of RG parameters is written in C++ and parallelized with OpenMP. It is publicly available on GitHub under the name “astroMP”1 and it is described in [47,48].
The unique combination of RG parameters was found with an approximate procedure, in which the mass-to-light ratios and the disk scale heights were kept fixed to the values found from the single galaxies. The fact that this unique combination of free parameters provides a limited worsening of the agreement between the RG models and the kinematic data and that the unique , Q, and agree with the correspondent RG parameters estimated from the single galaxies within , , and , respectively, further enforces the hypothesis of the universality of these parameters. With a proper exploration of the 63-dimensional parameter space for this galaxy sample (one and one for each of the 30 galaxies and three RG parameters for all the galaxies), a better consistency between model and measurements and a more precise estimate of the unique combination of RG parameters might be achieved.
With the parameters obtained from the two kinematic profiles of each galaxy, Cesare, et al. [34] also modelled the RAR of the DMS galaxies. McGaugh, et al. [24] fitted the RAR of 153 edge-on disk galaxies in the SPARC sample [50] with this relation:
where is the observed centripetal acceleration derived from the measured rotation curve ,
is the Newtonian acceleration due to baryonic matter alone, and is the only free parameter of the model. This relation properly interpolated the SPARC data with m s−2, which agrees with the MOND acceleration scale within 1.
The RG models of the RAR for the DMS galaxies (blue solid lines in Figure 5) properly interpolate the measured RAR of the DMS data (red dots with error bars in Figure 5) and reproduce the asymptotic limits of Equation (19). However, RG reproduces the RAR of DMS galaxies with a too large intrinsic scatter ( dex vs dex as found by Li et al. [51] from SPARC galaxies) and with residuals strongly correlated, at largely more than 5, with some galaxy properties dependent on the distance from the galaxies centre, apparently at odds with the results found by Lelli et al. [52] with SPARC galaxies. Yet, this problem requires further investigation since also the RAR of DMS galaxies presents some, although weaker, correlations between its residuals from Equation (19) and some galaxy properties. A galaxy sample such as the DMS, made of only 30 galaxies and where the galaxies are close to face-on and, thus, rotation curves might not be so accurately measured, might not be particularly suitable to investigate the RAR but a larger sample of edge-on disk galaxies, such as SPARC, should be considered for further analyses.
4. Dynamics of Elliptical Galaxies
In addition to the dynamics of flat systems (disk galaxies), RG has also been tested on the dynamics of spherical systems. To test RG for this class of systems, Cesare, et al. [49] considered a sample of three nearby massive E0 elliptical galaxies, NGC 1407, NGC 4486 (better known ad M87), and NGC 5846, belonging to the SLUGGS survey [53,54,55], a spectrophotometric survey of more than 4000 extragalactic GCs around 27 early-type galaxies at low redshift. This test was essential to verify whether the boost of the gravitational field can be determined by the gravitational permittivity alone, without any dependence on the refraction of the RG gravitational field lines. The results of this work are also summarised in [36].
Since NGC 1407, NGC 4486, and NGC 5846 have a minor-to-major axis ratio q of , , and , and, consequently, an ellipticity of , , and , they can be approximated as spherical systems. Cesare, et al. [49] chose these galaxies since the kinematic information of SLUGGS galaxies was measured up to their most external regions (≳10 effective radii), where Newonian gravity does not work anymore unless DM is present and the viability of RG could, thus, be tested. It was possible to measure these extended kinematic profiles thanks to GCs, which are present in these galaxy regions. In general, the measurement of the kinematic information in the external regions of elliptical galaxies can be uniquely done thanks to the presence of kinematic tracers, such as X-ray emitting gas [56], planetary nebulae [57] and GCs [53], which settle in the galaxies outskirts. Specifically, the choice of [49] was driven by the fact that the GC population divides in two sub-populations of blue and red GCs, having different kinematic properties and formation histories. In this way, it was possible to constrain RG from two rather than one extended kinematic profile, providing a more robust test for the theory.
4.1. Mass model
Cesare et al. [49] modelled, at the same time, the root-mean-square (RMS) velocity dispersions of the stars, concentrated within about one effective radius (; the radius which encloses half galaxy luminosity), and of the blue and red GCs, distributed up to the galaxy outskirts, of each E0 galaxy. In particular, the kinematic profiles of the GCs are ∼5, ∼48, and ∼13 times more extended than the kinematic profiles of the stars in NGC 1407, NGC 4486, and NGC 5846, respectively. Cesare et al. [49] derived the model for the RMS velocity dispersion from the RG gravitational field computed with Equation (4) for spherical systems. To model the total mass enclosed within the spherical radius r present in Equation (4), Cesare et al. [49] considered the contribution of (1) the stars, (2), the X-ray emitting gas, and (3) the central super massive black hole (SMBH). The total mass of GCs only contributed ∼1% to the total galaxy mass and it was, thus, neglected in the computation of the gravitational field. However, their surface and 3D number densities were modelled, since they were needed for the dynamical model (see Section 4.2).
The quantities entering the dynamical model were differently modelled for the three galaxies. The surface brightness of the stars of NGC 1407, measured in the B-band [58], was modelled with a Sérsic profile of this kind, with parameters from [53]:
where
is such that half of the total luminosity of the stars is enclosed within 1 . The circularised radius R is given for every galaxy by:
where and are coordinates oriented along the major and minor axes of the galaxies.
Integrating Equation (21) with the Abel integral below yields the 3D luminosity density distribution for the stars of NGC 1407:
and integrating Equation (24) in spherical coordinates yields its cumulative stellar luminosity profile:
For the surface brightness of the stars of NGC 4486 and NGC 5846, measured in the r-band [59], Cesare, et al. [49] adopted a Multi-Gaussian Expansion (MGE) model in a spherical configuration, with the parameters of [59]:
The 3D luminosity density distribution of the stars of NGC 4486 and NGC 5846 is given by
and their cumulative luminosity stellar profile is obtained by Equation (25), where is Equation (27). The cumulative mass profile of the stars, , is obtained by:
where is Equation (25) and is the stellar mass-to-light ratio, one of the seven free parameters of the dynamical model.
The 2D number density profiles of the blue and red GCs in NGC 1407 and NGC 5846 are modelled with a Sérsic profile of this kind:
where Cesare, et al. [49] adopted the parameters of [58] for NGC 1407 and estimated the parameters from the data of [53] with a MCMC, for NGC 5846. For NGC 4486, they adopted a different parametrisation:
with the parameters of [60]. The 3D number density profiles are obtained by integrating Equations (29) and (30) with the Abel integral:
Cesare, et al. [49] modelled the mass density profile of the gas of NGC 1407 and NGC 5846 using the two- functional form:
with the parameters of [61], for NGC 1407, and estimating the parameters from the data of [62] with a MCMC for NGC 5846. In Equation (32), and kg are the mean molecular weight and the atomic unit mass, respectively. For NGC 4486, they adopted this profile with the parameters of [63]:
The cumulative mass density profile of the gas, , is obtained by integrating in spherical coordinates from Equation (32), for NGC 1407 and NGC 5846, and Equation (33), for NGC 4486:
The central SMBH was modelled as a point mass with values of , , and for NGC 1407, NGC 4486, and NGC 5846, respectively, obtained from [64]. Therefore, the cumulative mass profile of the SMBH for each galaxy is a constant given by:
4.2. Dynamical model
Cesare, et al. [49] modelled the RMS velocity dispersion profiles of each kinematic tracer, stars, blue GCs, and red GC, with this solution of the spherical Jeans equations [58,65,66,67]:
where (1) indicates the tracer, (2) is either the surface brightness of the stars (Equations (21) or (26)) or the 2D number density of the GCs (Equations (29) or (30)), (3) is either the 3D luminosity density of the stars (Equations (24) or (27)) or the 3D number density of the GCs (Equation (31)), (4) is the gravitational potential and, thus, is the gravitational field (Equation (4)), (5) R is the 2D radius (Equation (23)), (6) r is the 3D spherical radius, (7) is the orbital anysotropy parameter, where and are the tangential and the radial velocity dispersions, and (8) K is the kernel:
given by Equation (A16) of [66], where is the Euler gamma function and is the incomplete beta function. The orbital anisotropy parameters , , are three of the seven free parameters of the dynamical model and they are assumed to be constant with radius [68,69].
The gravitational field in Equation (36) is given by RG field in a spherical configuration (Equation (4)), and, thus, Equation (36) transforms into:
The cumulative mass profile in Equation (38) is given by the sum of the cumulative mass profiles of the stars (Equation (28)), of the gas (Equation (34)) and of the SMBH (Equation (35)):
This dynamical model has seven free parameters. Four are common to the three tracers, the stellar mass-to-light ratio , and the three RG parameters, , Q, and , entering the gravitational permittivity in Equation (38), which generate the RG gravitational potential to which every kinematic tracer is subject. Three are specific to each tracer, and they are the orbital anisotropy parameters , , and .
To explore the parameter space, Cesare, et al. [49] adopted a MCMC method based on Metropolis-Hastings acceptance criterion. They assumed a uniform prior on every free parameter. For , the uniform prior is based on the SPS models of Humphrey et al. [70] and Zhang et al. [61], for NGC 1407, and of Bell et al. [71] and Zibetti et al. [72], for NGC 4486 and NGC 5846. The space of the three RG free parameters was explored in the ranges of , , and for , Q, and , respectively. At last, they explored the parameter space of the parameters , , in the uniform range of , which spans from very tangential to very radial orbits.
4.3. Results
The RG model (38) properly interpolates the kinematic profiles of the three tracers in each E0 galaxy with sensible parameters (Figure 6).
The resulting mass-to-light ratios are consistent with the corresponding SPS models and the orbital anisotropy parameters of NGC 1407 are in agreement with the literature [58]. The RG parameters are consistent among the three galaxies within 2, which supports their universality (orange squares with error bars in Figure 4). The mean of the values resulting from the three single galaxies are , , and . To better check their universality, Cesare, et al. [49] compared these values with the mean and the unique combinations of RG parameters resulting from the DMS, , , (purple squares with error bars in Figure 4), and , , (green dots with blue shaded posterior distributions in Figure 4). The RG parameters derived from the elliptical galaxies are consistent with the mean combination obtained in the DMS: Q and within 1 and within 3. The parameters Q and from the E0 galaxies are also in agreement with the unique values from the DMS, within and , respectively. Instead, the parameter presents a tension.
The reasons for the tension can be multiple. A first possible reason could be due to the approximate procedure with which the unique combination of RG parameters in the DMS was derived. A limited freedom was given to this unique combination of parameters to vary, since the mass parameters, and , were constrained to the values derived from a previous analysis and this led to a very small width of the posterior distribution of (see the light blue shaded area and yellow, red, and black contours in the bottom-left panel of Figure 4). As said in Section 3.3, a more complete analysis could be performed by exploring the 63 parameter space of the mass parameters and the three RG parameters in the DMS.
If, instead, the posterior distribution of is not particularly underestimated, other reasons could EXPLAIN the discrepancy, such as, a too approximated model for the elliptical galaxies, a wrong functional form for the gravitational permittivity , or, a fundamental problem of RG. One of the approximations introduced in the analysis of elliptical galaxies was to consider these systems as isolated, whereas these kind of galaxies typically live in dense environments. Specifically, NGC 1407 and NGC 5846 settle within galaxy groups and NGC 4486 is the central galaxy of the Virgo cluster. Differently from Newtonian gravity, the RG gravitational field of a system, as MOND gravitational field, depends on the gravitational field produced by the environment where this system settles. Therefore, this environmental effect might explain, in part or entirely, the inconsistency between the s. Another approximation adopted in modelling the elliptical galaxies was to neglect their net rotation, although these three galaxies are slow rotators [49]. Moreover, or in alternative, the functional form of the gravitational permittivity (Equation (7)) might not be suitable, in particular in the low-density regime, and a more precise answer in this sense might be given by the weak-field limit (WFL) of the covariant formulation of RG [29]. If all these reasons will not be able to alleviate the tension, this might be due to a fault in the theory that needs to be fixed. To conclude, a remarkable fact is that the best agreement between the elliptical and the disk galaxies is obtained for the parameter, which sets the density scale where the transition between the Newtonian and the RG regimes occurs, as in MOND.
5. Dynamics of Galaxy Clusters
The encouraging results obtained for the dynamics of disk and elliptical galaxies suggest that RG is able to properly describe the dynamics on galaxy scale. Therefore, a class of tests at larger scale has been needed to be performed for a more complete investigation of the theory.
Some preliminary studies have already been performed by Matsakos and Diaferio [28] to study the viability of RG in modelling the hot X-ray emitting gas temperature radial profile of galaxy clusters. Matsakos and Diaferio [28] modelled the gas temperature radial profiles of two low-redshift and relaxed galaxy clusters, A1991 and A1795, with two different gas temperatures (Figure 7). Specifically, the two clusters have a spectroscopic gas temperature, averaged between 70 kpc and , of keV (A1991) and keV (A1795), where is the distance from the centre of the cluster where the average density is 500 times larger than the critical density of the Universe. These data are taken with the Chandra satellite [74]. The model that Matsakos and Diaferio [28] adopted presented different assumptions. They assumed dynamical equilibrium at every distance from the cluster centre and a spherical configuration for the density distribution, deriving the equation of hydrostatic equilibrium from the RG gravitational field obtained, in turn, from Equation (4). They also assumed the validity of the ideal-gas equation of state and the smooth step function given by Equation (7) for the gravitational permittivity with RG parameters fixed a priori and not left free to vary. In particular, they set the RG parameters to and , for A1991 and A1795, respectively, and g cm−3. At last, they assumed in A1991 the presence of a stellar component of mass M⊙ up to a distance from the cluster centre of kpc. This model resulted in agreement with the Chandra data of the two galaxy clusters.
This model is certainly simplistic and it involves a too small sample of galaxy clusters. It, therefore, certainly needs to be extended to understand if RG is able to correctly describe the gas temperature radial profiles of galaxy clusters and further tests have to be performed to investigate the capacity of RG to model the dynamics of these systems. An important test that has to be perfomed is to repeat the above analysis by constraining the RG parameters from the temperature data, and not by fixing them a priori, to verify if the obtained parameters are in agreement with the values obtained on galaxy scale, to better test their universality.
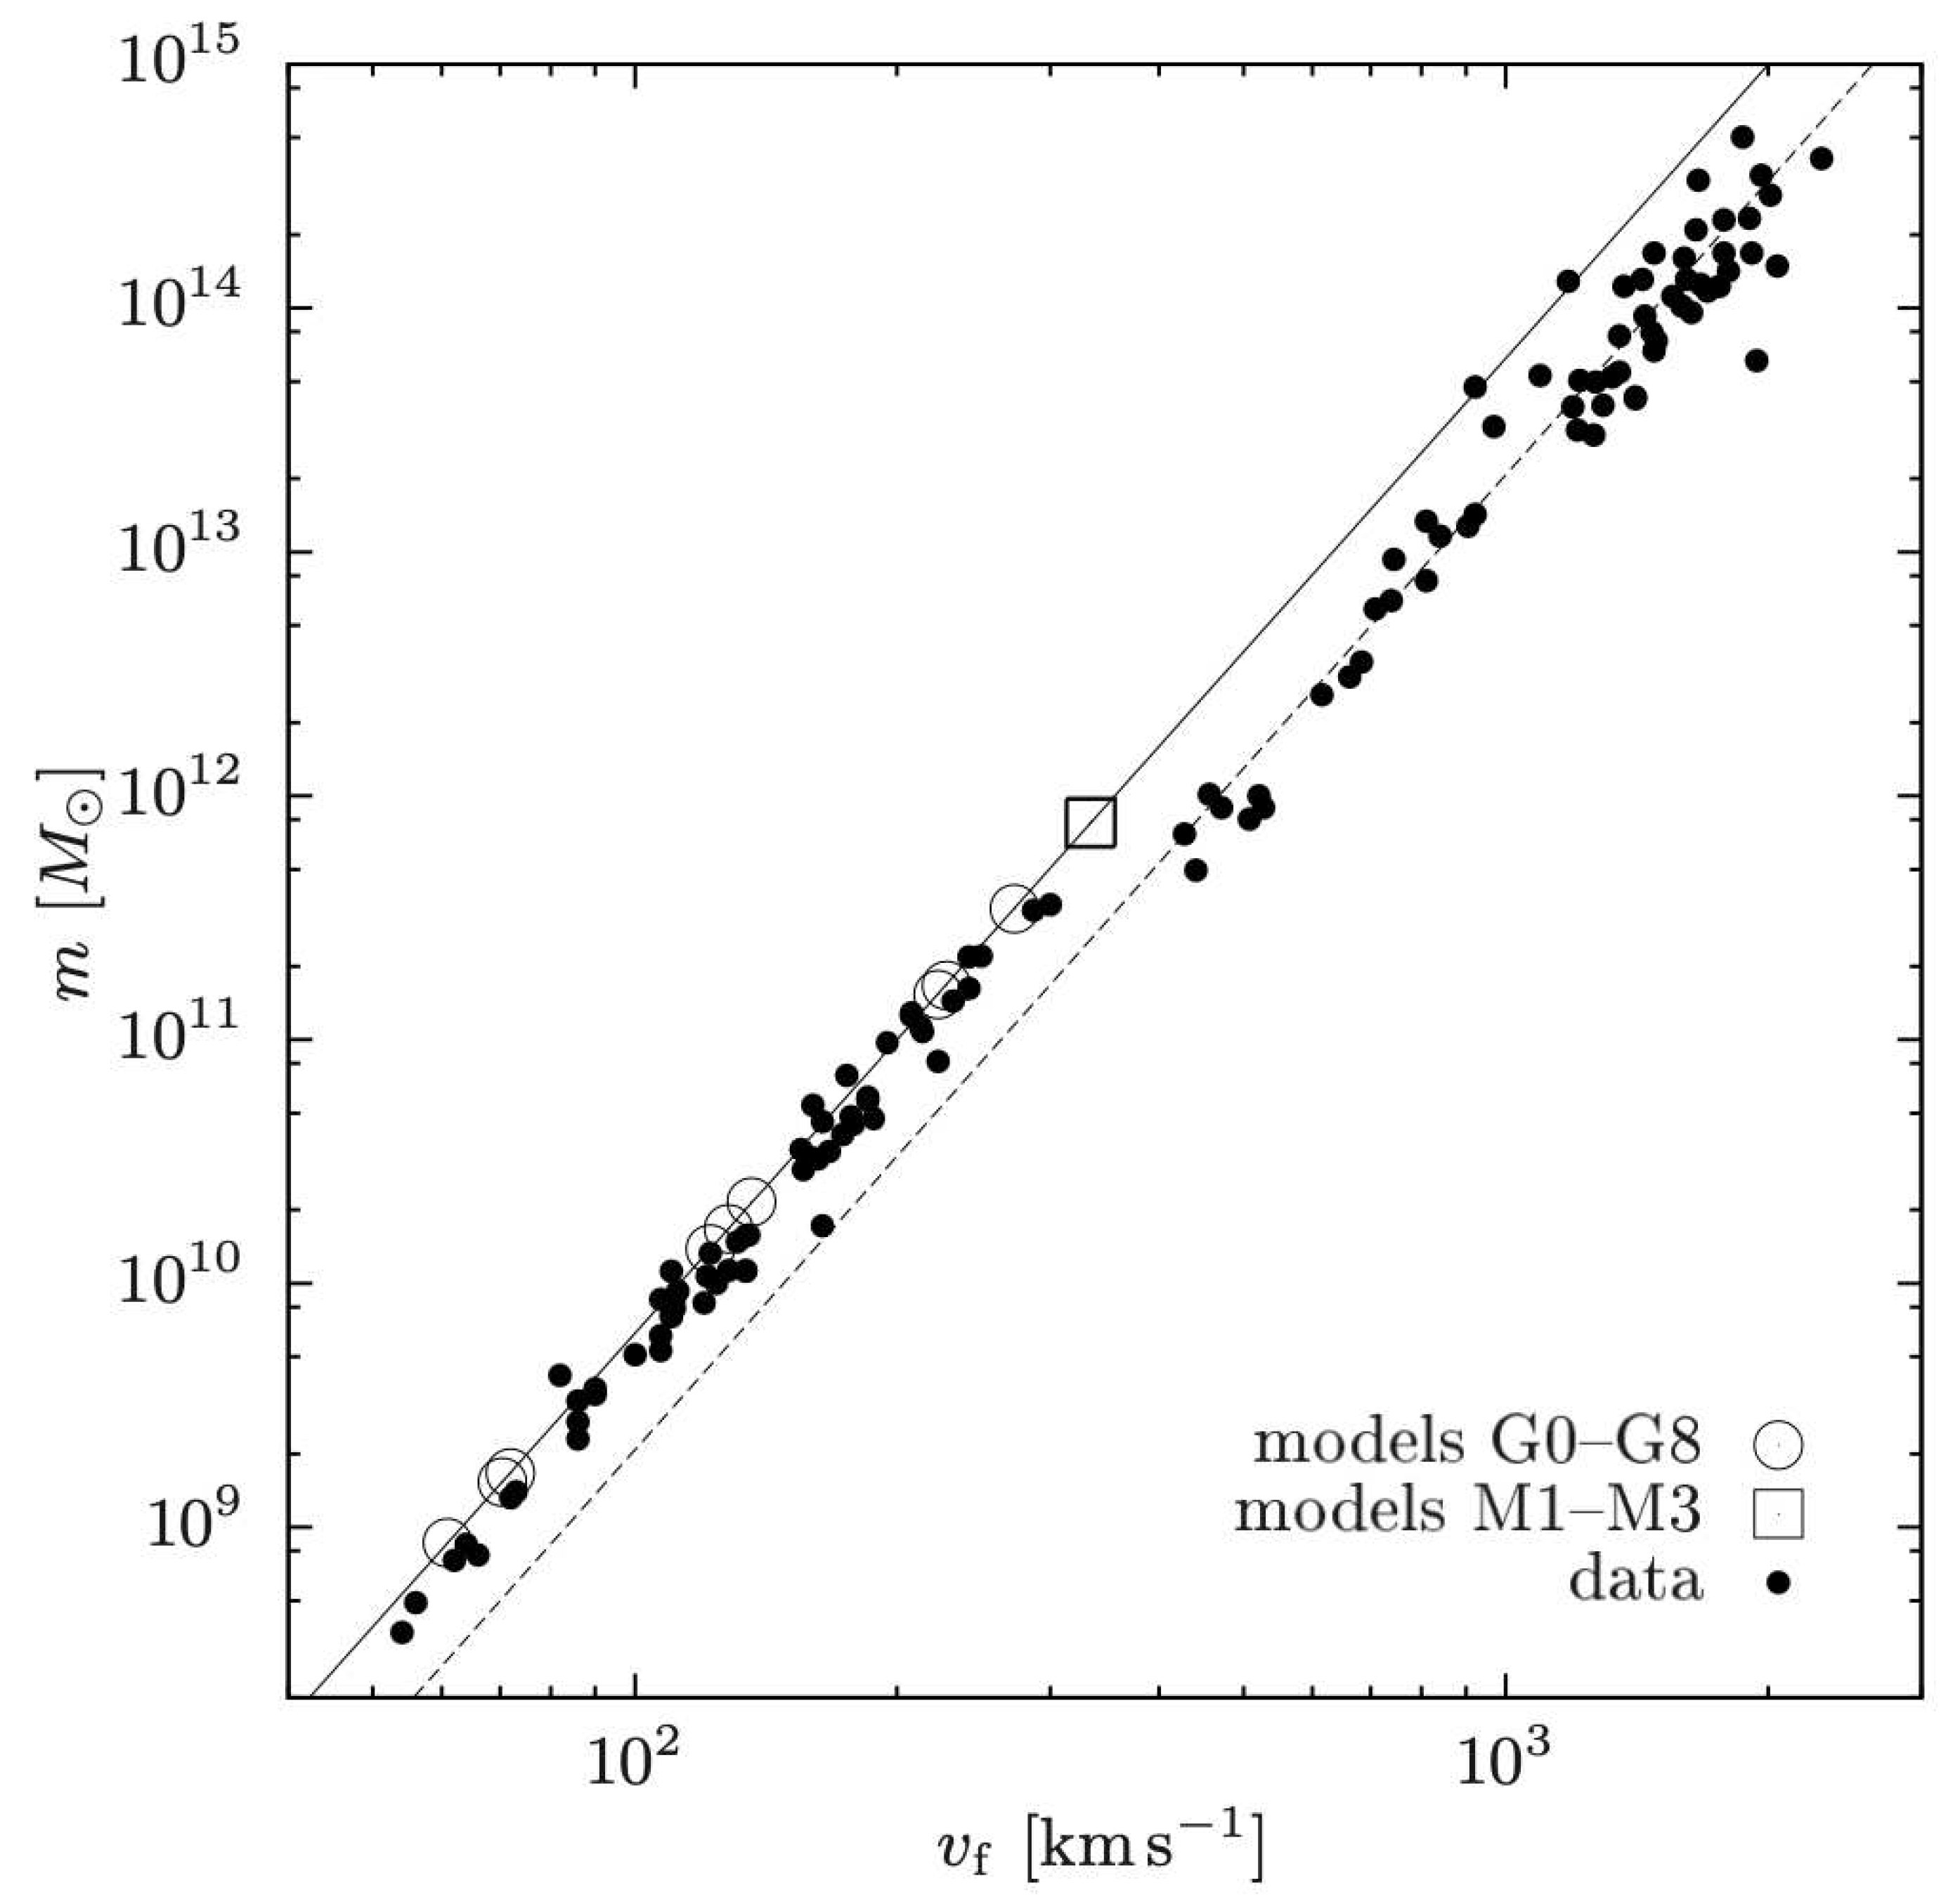
Another aspect of RG on cluster scale that Matsakos and Diaferio [28] began to explore is the gravitational interaction between galaxies in galaxy groups and clusters. These interactions are not simple to handle in RG, since the field lines in each galaxy suffer from refraction in low-density regions. A first-order analysis could be performed by assuming that the gravitational field at large distances from the centre of each galaxy decreases proportional to and that the only difference with respect to Newtonian gravity is that it is enhanced by . With these assumptions, the following expression for the BTFR would hold for galaxy groups and clusters:
where is the velocity dispersion of the galaxies in the cluster, k is the number of galaxies, m is the mass of each galaxy, A is the BTFR normalisation, and is a geometric factor that describes that, accounting for the anisotropic geometry of the RG field in disk galaxies, only a fraction of the k galaxies in the clusters will cross the plane of a specific disk galaxy where the field is . The comparison of this extended BTFR with the observed one for galaxy groups and clusters would represent another test for RG and a method to set a lower bound for and to constrain .
Figure 8.
The BTFR up to mass and velocity scales to include galaxy groups and galaxy clusters, besides galaxies. The solid line is the BTFR given by Equation (6) and the dashed line is the BTFR given by Equation (40) for . The open circles and squares represent simulated galaxies [28]. The black dots are observational data from [75,76,77]. The figure is reproduced from Figure 17 in [28].
6. Covariant Refracted Gravity
A covariant version of RG was recently formulated by Sanna, et al. [29]. The fact that in RG the transition between the Newtonian and the modified gravity regimes is regulated by a scalar quantity, the mass density , rather than by a vector quantity, such as the acceleration as in MOND, made the built of a covariant extension of RG less challenging than in MOND (e.g. [78]). Some relativistic extensions of MOND, such as Tensor Vector Scalar gravity (TeVeS) [78], were formulated while presenting some problems [79,80], even if more recent results might look more promising [81,82].
Covariant refracted gravity (CRG) is formulated as a scalar tensor theory with the presence of a single scalar field, , nonminimally coupled to the metric, which accounts for the phenomenologies both of DM on galaxy scale and of DE on larger scales, i.e., explaining the accelerated cosmic expansion. This peculiar feature of a unified dark sector is shared by a restricted class of modified theories of gravity (e.g., [83,84,85,86,87,88,89,90,91,92,93,94,95]), and is suggested by the observed intriguing coincidence [29] (see Section 1).
The general action of scalar-tensor theories is:
where the functional forms of the self-interaction potential and the general differentiable function of the scalar field define a specific scalar-tensor theory. For CRG, and are:
and
where is a constant. Replacing Equations (42) and (43) in Equation (41), the CRG action becomes:
In the WFL of the theory, the scalar field results to be twice the gravitational permittivity . Indeed, the WFL of CRG yields the original classical formulation of RG:
which is RG Poisson equation (Equation (1)) if . This result confirms that the scalar field mimics the phenomenology of DM on galaxy scale.
The fact that in RG the modification of the law of gravity depends on a density rather than on an acceleration scale might be less intuitive, since the acceleration scale emerges from several pieces of evidence on galaxy scale, such as the BTFR, the MDAR, and the RAR (see Section 1). Yet, the acceleration scale emerges from the WFL of CRG. This can be seen by calculating the CRG gravitational field far from a spherical source with density , monotonically decreasing with r, settling in a homogeneous background with constant density . Sanna, et al. [29] found that, far from this source, the transition from Newtonian to RG regimes occurs when the acceleration goes below the acceleration scale:
where . This recalls MOND theory, where the acceleration scale regulates the gravity behaviour. At large distances from the spherical source, the following limit holds:
and, therefore, Equation (46) reduces to:
Being , as found by an independent calculation [29] explained below, Equation (48) implies that m s−2, which coincides with MOND acceleration scale .
Sanna, et al. [29] also derived with CRG the modified Friedmann equations for a flat, expanding, homogeneous, and isotropic Universe described with the Friedmann-Lematre-Robertson-Walker (FLRW) metric, where the Universe content is modelled as a perfect fluid. In these modified Friedmann equations, the term
appears, where is the Hubble parameter. This term is analogous to the density parameter related to the cosmological constant in CDM:
which indicates that , i.e, that plays the role of in CDM, accounting for the accelerated expansion of the Universe. At the present time, Equations (49) and (50) become:
and
where is the Hubble parameter at the present time. We have seen before that sets the value of the acceleration scale (Equation (46)) which defines the transition between Newtonian and RG regimes far from a spherical source, playing the role of in MOND and, thus, accounting for DM phenomenology. Being , also accounts for DE phenomenology, providing a unification of the two dark sectors. Moreover, inserting in Equation (46), the observed relation naturally emerges in CRG.
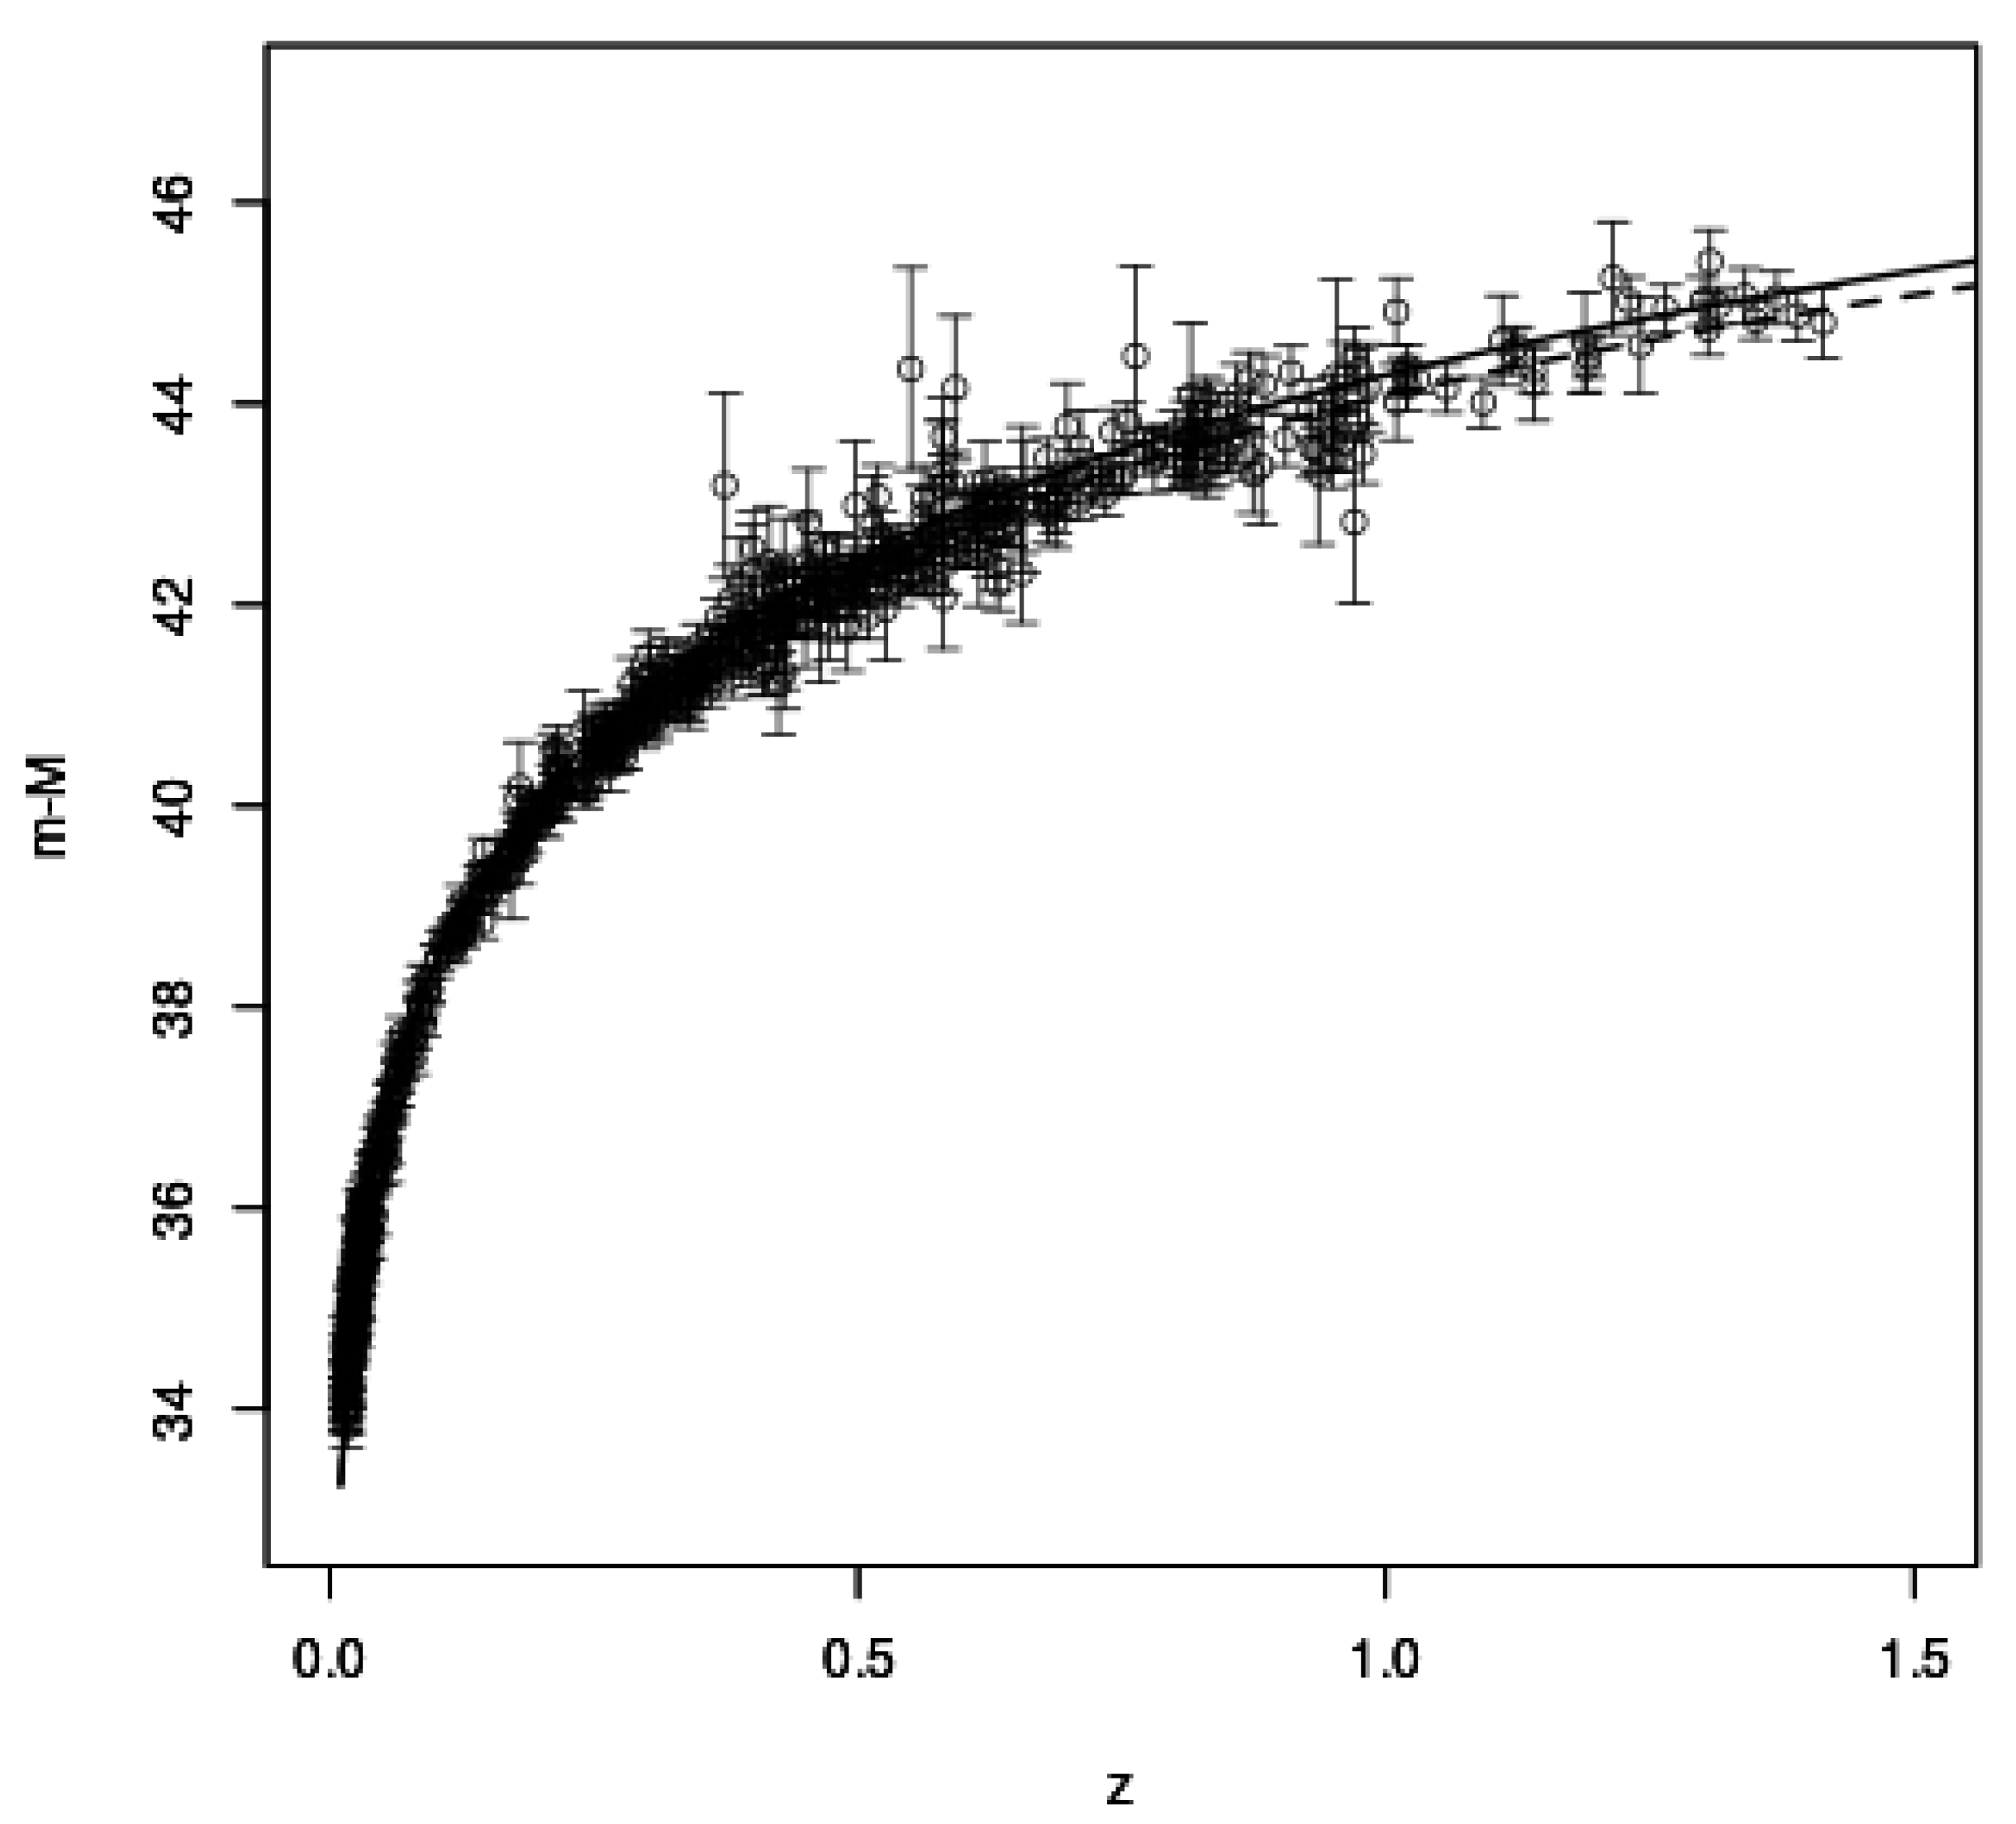
By rearranging the modified Friedmann equations in CRG, Sanna, et al. [29] found two solutions for the Hubble parameter , that refer as CRG- and CRG+ and, properly integrating , they found the corresponding two solutions for the scale factor . Properly combining CRG- and CRG+, the bound is derived. From the derived , the luminosity distance can be calculated and constrained from the observed Hubble diagram of SNaeIa at high redshift z of the Supernova Cosmology Project Union Compilation [96]. Comparing the CRG model with the data, the cosmological parameters can be derived to verify if the tensions observed in CDM can be either reduced or cancelled, which would provide a fundamental test for CRG. By comparing the distance modulus , where m and M are the apparent and absolute magnitudes, respectively, derived from the luminosity distance computed in CRG for the solutions CRG- and CRG+ with the data of the high-redshift SNaeIa from [96], Sanna, et al. [29] found that , for CRG-, and , for CRG+, assuming the values km s−1 Mpc−1 and for the Hubble constant and the ratio between the densities of the baryonic matter and the critical density of the Universe at the present epoch, respectively [1]. Replacing the values of and km s−1 Mpc−1 in Equation (52) implies again that , as independently determined before.
Figure 9.
Hubble diagram of SNaeIa modelled with CRG. The dashed and solid lines are the CRG- and CRG+ models, respectively. For the CRG- and CRG+ curves, the km s−1 Mpc−1, , and parameters are adopted. The open circles with error bars are the data from the Supernova Cosmology Project Union 2.1 Compilation [96]. The figure is reproduced from Figure E.2 in [29].
Sanna, et al. [29] derived the equation of state of the effective DE in CRG, , where and are the pressure and the density of the effective DE, by properly rearranging the CRG Friedmann equations and by comparing them with the Friedmann equations of a general scalar-tensor theory with a non-minimal coupling between the scalar field and the metric. The parameter depends on redshift z. At the present time, , the parameter becomes:
Inserting , consistent with the equation of state of DE in CDM [1], and , is obtained, which is consistent with the CRG- solution.
Values of different from -1 are anyway consistent with several pieces of evidence (e.g. [97,98,99,100,101,102]). Generally, the observational constraints on the equation of state of the effective DE can depend on the adopted model, even if model-independent reconstructions exist [102]. For CRG, the parametrisation [103,104]:
can be assumed for . At the present time (), Equation (54) only depends on , allowing a wide range of DE models, either with (phantom models) or with [97,98,99,105,106]. The parameter is constrained to be approximately in the range of by measurements of the baryonic acoustic oscillation (BAO), SNaeIa, and CMB [100,107]. This limit on translates in a limit on , in agreement with the values of estimated from the SNaeIa data.
7. Discussion and conclusions
In this work, the main analyses and results of the theory of modified gravity Refracted Gravity (RG) are summarised. RG demonstrated to be able to model the dynamics of disk and elliptical galaxies with sensible mass and structural parameters (stellar mass-to-light ratios, disk scale heights, and orbital anisotropy parameters) and with RG parameters consistent among the different galaxies, suggesting their universality. Preliminary encouraging results were obtained at the scale of galaxy clusters and a covariant extension of the theory might look promising, since it seems to properly describe the accelerated expansion of the Universe, to retrieve the MOND acceleration scale at galaxy scale, and to explain both the DM and the DE sectors with a single scalar field.
Several further studies could be performed to complete the tests of this gravity theory. On galaxy scale, two issues presented by the theory require additional investigation. They are (1) the prediction of a RAR with a too large intrinsic scatter and correlations between its residuals from Equation (19) and some galaxy properties, and (2) the tension presented by the vacuum permittivity , which might indicate its nonuniversality.
The RAR built with RG presents some strong correlations, at more than 5, with some radially-dependent galaxy properties. However, also the RAR built from DMS data shows some, despite weaker, correlations with some galaxy properties and a further investigation is needed to understand whether the correlations presented by the RG RAR are partially driven by the data correlations. The correlations presented by DMS data are apparently at odds with the claimed uncorrelations observed in the RAR derived from SPARC data [50], suggesting a difference between the two samples. Moreover, the question of the RAR is even more puzzling, since the DMS is not the only sample where a correlation between the RAR residuals and some galaxy properties is observed. Di Paolo, et al. [108] found a correlation between the RAR residuals and the galaxy radius from the accurate mass profiles of 36 dwarf disk spirals and 72 LSB galaxies. A better assessment of whether the result obtained in RG for the RAR depends on the theory itself or on the chosen galaxy sample can be performed by reproducing in RG the RAR of SPARC disk galaxies [50], that differently from DMS galaxies are nearly edge-on and, thus, their measured rotation curves, from which the RAR is derived, are much more accurate. Moreover, SPARC sample counts much more galaxies than the DMS (153 vs 30 galaxies), which would make this study much more statistically significant. For this study, the rotation curves of SPARC galaxies have to be modelled with RG and the RAR has to be built from these models. The scatter and the residuals from Equation (19) of the obtained RAR have to be compared with the results of Lelli et al. [52]. Another interesting study that can be performed with the RAR, would be to compute the RAR in RG separately for the groups of normal spirals and dwarf galaxies present in SPARC and in the sample considered by Di Paolo, et al. [108]. This study might shed light on the works of Santos-Santos, et al. [109] and Di Paolo, et al. [108], which found that the RAR might differently behave in these two categories of galaxies, besides providing a further test for RG theory.
As said at the end of Section 4.3, the tension of the vacuum permittivity might have different origins, either the approximate derivation of the unique in the DMS sample, or a too simplistic dynamical model for the elliptical galaxies, or an incorrect assumption for the functional form of the gravitational permittivity (Equation (7)), or, in the worst case, a fundamental issue in RG theory. Generally, the study of elliptical galaxies is incomplete, both because the considered sample only counted three galaxies and because it only considered E0 ellipticals, with a nearly spherical shape. To better investigate the possible (non)universality of , the performed study on the three E0 galaxies should be repeated removing the adopted approximations. In the new model, the interaction with the surrounding environment of the ellipticals should be considered possibly resorting to N-body simulations. Additional E0 galaxies with extended kinematic profiles should be considered to enrich the galaxy sample in ths new study. The E0 galaxies in the ePN.S survey [57], where extended kinematic profiles up to ∼13 from the galaxy centres are measured thanks to the presence of planetary nebulae in the galaxies outskirts, should be suitable candidates. Other candidates ideal to test the viability of RG are the round elliptical galaxies in the samples of [110,111,112]. Their velocity dispersion profiles present a flattening beyond a certain radius, where both this radius and the intensity of the velocity dispersion in this plateau are in agreement with MOND expectations. In the outer regions of spherical systems, where the density drops below , RG predicts a field proportional to , as in the Newtonian case (see Section 2). Modelling in RG the velocity dispersion profiles of the round elliptical galaxies in [110,111,112] would show whether they can be reproduced by a field in the galaxy outskirts or if they necessarily require a field as in MOND, which would represent an issue with the current formulation of RG.
After focussing on spherical elliptical galaxies alone, a more complete study should be performed considering elliptical galaxies with different ellipticities, to further test the capability of RG of modelling the dynamics of systems with different shapes with a unique set of RG parameters. This study would also permit to investigate the positive correlation found by Deur [30,31] between the total mass-to-light ratios and the ellipticities of elliptical galaxies, already mentioned in Section 1, which naturally arises within the RG context. Employing elliptical galaxies with kinematic profiles ∼10 times more extended than the data used by [30,31] might be crucial to validate or reject this correlation. At last, all these studies might shed light on the correctness of Equation (7) for the gravitational permittivity .
A further test of the RG prediction that the flatter the system, the larger the mass discrepancy, if considered in Newtonian gravity, might be performed with the kinematic data of dwarf and LSB galaxies and GCs, besides of elliptical galaxies with different flatness degrees. Indeed, dwarf galaxies and GCs have similar baryonic masses but very different dynamical properties, the former being one of the darkest systems on galaxy scale and the latter being nearly DM-free (Section 1), which represented a challenge for MOND (e.g., [32,113,114,115,116,117,118]). This feature of RG might be tested by modelling the rotation curves of a sample of dwarf galaxies, e.g., in the Milky Way halo [119], in the LITTLE THINGS survey [120] in SPARC [50], and in Di Paolo, et al. [108], and the internal velocity dispersion of a sample of GCs located in the most external regions of the Milky Way (e.g., [32,113,114,115,116,117,118]), where the background density drops below .
On the scale of galaxy clusters, the tests are incomplete and a deeper investigation is required. The sample considered by Matsakos and Diaferio [28] is too small, counting two galaxy clusters, and the analysis of the temperature profiles is approximated. For their study, Matsakos and Diaferio [28] considered the data from [74], whose sample contains other 11 low-redshift and relaxed galaxy clusters. This analysis should be extended to these other galaxy clusters, by directly constraining the RG parameters from their temperature profiles to check their agreement with one another and with the results obtained on galaxy scale. In a second step, the same analysis should be repeated by adopting a less approximate modelling by including the mass profiles of the individual galaxies present in the clusters, exploiting the results from N-body simulations.
Besides on the temperature profiles, RG should be tested on the dynamics of galaxy clusters. A study of this kind is already underway. Specifically, it should be verified whether RG is able to model the galaxy dispersion profiles of clusters of galaxies with sensible parameters. Possible samples for this analysis are CIRS and HeCS, which present the radial velocity dispersion profiles taken from the Sloan Digital Sky Survey and the ROSAT All-Sky Survey of 130 galaxy clusters in a redshift range of [0.0, 0.3] and with different dynamical properties, from nonmerging and relaxed to merging and dynamically active. This study allows to investigate how the RG parameters are affected by the environment, either relaxed or interacting, extending on larger scales the possible future study for the elliptical galaxies. Also the study of the BTFR extended to galaxy groups and clusters (Equation (40)) could be expanded, by considering how the uncertainties on the equation of state and on the entropy profiles of the gas and the possible local deviations from hydrostatic equilibrium due to X-ray gas flows might affect the values of the RG parameters.
Also CRG leaves room for additional investigation. The emergence of MOND acceleration scale in the WFL of CRG should be further explored. Indeed, differently from , (Equation (46)) is not a constant but depends on the mass density of the source, even if this dependence drops at large distances from the source since . Future studies are required to test if the connection between and subsists for a generic case besides to a source with a specific density configuration.
The parameter of the equation of state of the effective DE found by Sanna, et al. [29] in CRG appears to be dependent on redshift, differently from CDM where is a constant equal to -1. However, tends to -1 at the present epoch, in agreement with the observations. The parameter in CRG could be constrained from the measurements of the expansion rate of the Universe performed by the Dark Energy Survey (DES)2 [121], which have observed thousands of supernovae since August 31th 2013. Moreover, the Euclid3 mission [122], launched on July 1st 2023, is expected to measure the variation of the cosmic acceleration to an accuracy better than the 10% level, which would be crucial to disentangle CRG from CDM and other DE models [123]. Future observations of the large-scale structure of the Universe and the evolution of DE will be crucial to constrain the value of in Equation (54) and, consequently, the value of (see Section 6).
The Lagrangian density of CRG, derived from the CRG action (Equation (44)) should be constrained from the power spectrum of the temperature anisotropies of the CMB and the power spectrum of the matter density perturbations (e.g. [124,125]), for example, by comparing the CRG predictions with the latest measurements from the Planck satellite [126]. By estimating the cosmological parameters from different low-redshift galaxy surveys, such as Kilo-Degree Survey (KIDS) 4 [127], CFHTLS 5 [128], and DES, and from the CMB power spectrum, we can also assess whether RG can solve the tensions observed in the cosmological parameters in the CDM model.
Another essential test for CRG would consist in analysing the evolution of the density perturbations, at least in the linear regime, and how the scalar field and its perturbations would impact on the large-scale structure formation, evolution, and distribution (e.g., [129,130,131,132]). A possible way to accomplish this task, would be to modify the publicly available code GADGET-2 [133], to run N-body simulations in the CRG framework. The results from these N-body simulations could be compared with the data from the DES survey, which probed the formation of structures with weak gravitational lensing and galaxy clusters, and the distribution of galaxies with the two-point correlation function. Further constraints could be given by the measurements taken with the Dark Energy Spectroscopic Instrument (DESI) 6 [134], which started to observe in 2019, with Euclid, and with upcoming experiments such as the Square Kilometer Array (SKA) 7 [135].
Funding
This work has been funded by the Spoke 1 “FutureHPC & Big- Data” of the ICSC-Centro Nazionale di Ricerca in High Performance Computing, Big Data and Quantum Computing-and hosting entity, funded by European Union-Next GenerationEU.
Institutional Review Board Statement
Not applicable.
Informed Consent Statement
Not applicable.
Data Availability Statement
No new data were created or analyzed in this study. Data sharing is not applicable to this article.
Acknowledgments
Part of this work is the result of my Ph. D. activity at the Physics Department of the University of Turin (2017–2021). I sincerely thank all the people that helped me during my Ph. D., in particular, Antonaldo Diaferio, my Ph. D. supervisor, Titos Matsakos, who formulated RG together with Antonaldo Diaferio, Garry Angus, who collaborated in the study of RG in DMS galaxies, and Andrea Sanna, who formulated CRG, together with Antonaldo Diaferio, and Titos Matsakos. This work has been supported by the Spoke 1 “FutureHPC & Big- Data” of the ICSC-Centro Nazionale di Ricerca in High Performance Computing, Big Data and Quantum Computing-and hosting entity, funded by European Union-Next GenerationEU.
Conflicts of Interest
The authors declare no conflict of interest.
Abbreviations
| The following abbreviations are used in this manuscript | baryonic Tully-Fisher relation | |
| BTFR | baryonic Tully-Fisher relation | |
| CMB | cosmic microwave background | |
| CRG | covariant refracted gravity | |
| DE | dark energy | |
| DM | dark matter | |
| DMS | DiskMass Survey | |
| GCs | globular clusters | |
| GR | General Relativity | |
| HSB | high surface brightness | |
| CDM | cold dark matter | |
| LSB | low surface brightness | |
| MDAR | mass discrepancy–acceleration relation | |
| MOND | MOdified Newtonian Dynamics | |
| RAR | radial acceleration relation | |
| RG | Refracted Gravity | |
| SNaeIa | Ia Supernovae | |
| SPARC | Spitzer Photometry and Accurate Rotation Curves | |
| SPS | stellar population synthesis | |
| TeVeS | Tensor Vector Scalar gravity | |
| WFL | weak field limit | |
References
- Planck Collaboration; Aghanim, N.; Akrami, Y.; Ashdown, M.; Aumont, J.; Baccigalupi, C.; Ballardini, M.; Banday, A.J.; Barreiro, R.B.; Bartolo, N.; et al. Planck 2018 results. VI. Cosmological parameters. A&A, 2020; 641, A6arXiv:astro-ph.CO/1807.06209]. [Google Scholar] [CrossRef]
- Davis, M.; Efstathiou, G.; Frenk, C.S.; White, S.D.M. The evolution of large-scale structure in a universe dominated by cold dark matter. ApJ 1985, 292, 371–394. [Google Scholar] [CrossRef]
- Springel, V.; Frenk, C.S.; White, S.D.M. The large-scale structure of the Universe. Nature 2006, 440, 1137–1144. [Google Scholar] [CrossRef]
- Markevitch, M. Chandra Observation of the Most Interesting Cluster in the Universe. The X-ray Universe 2005; Wilson, A., Ed., 2006, Vol. 604, ESA Special Publication, p. 723, [arXiv:astro-ph/astro-ph/0511345]. [CrossRef]
- Clowe, D.; Bradač, M.; Gonzalez, A.H.; Markevitch, M.; Randall, S.W.; Jones, C.; Zaritsky, D. A Direct Empirical Proof of the Existence of Dark Matter. ApJL 2006, 648, L109–L113. [Google Scholar] [CrossRef]
- Paraficz, D.; Kneib, J.P.; Richard, J.; Morandi, A.; Limousin, M.; Jullo, E.; Martinez, J. The Bullet cluster at its best: weighing stars, gas, and dark matter. A&A, 2016; 594, A121arXiv:astro-ph.CO/1209.0384]. [Google Scholar] [CrossRef]
- Cyburt, R.H.; Fields, B.D.; Olive, K.A.; Yeh, T.H. Big bang nucleosynthesis: Present status. Reviews of Modern Physics, 2016; 88, 015004arXiv:astro-ph.CO/1505.01076]. [Google Scholar] [CrossRef]
- Zwicky, F. Die Rotverschiebung von extragalaktischen Nebeln. Helvetica Physica Acta 1933, 6, 110–127. [Google Scholar]
- Rubin, V.C.; Ford, W. Kent, J. Rotation of the Andromeda Nebula from a Spectroscopic Survey of Emission Regions. ApJ 1970, 159, 379. [Google Scholar] [CrossRef]
- Bosma, A. The distribution and kinematics of neutral hydrogen in spiral galaxies of various morphological types. PhD thesis, University of Groningen, University of Groningen, 1978. [Google Scholar]
- Sanders, R.H. Mass discrepancies in galaxies: dark matter and alternatives. A&ARv 1990, 2, 1–28. [Google Scholar] [CrossRef]
- Dodelson, S.; Gates, E.I.; Turner, M.S. Cold Dark Matter. Science 1996, 274, 69–75. [Google Scholar] [CrossRef]
- Kirshner, R. Measuring the Universe with Supernovae. APS Meeting Abstracts, 1996, APS Meeting Abstracts, p. F4.01.
- Peebles, P.J.; Ratra, B. The cosmological constant and dark energy. Reviews of Modern Physics 2003, 75, 559–606. [Google Scholar] [CrossRef]
- Weinberg, S. The cosmological constant problem. Reviews of Modern Physics 1989, 61, 1–23. [Google Scholar] [CrossRef]
- Luo, M.J. The cosmological constant problem and re-interpretation of time. Nuclear Physics B, 2014; 884, 344–356arXiv:physics.gen-ph/1312.2759]. [Google Scholar] [CrossRef]
- Velten, H.E.S.; vom Marttens, R.F.; Zimdahl, W. Aspects of the cosmological “coincidence problem”. European Physical Journal C, 2014; 74, 3160arXiv:astro-ph.CO/1410.2509]. [Google Scholar] [CrossRef]
- Fleury, P.; Dupuy, H.; Uzan, J.P. Can All Cosmological Observations Be Accurately Interpreted with a Unique Geometry? Phys. Rev. Lett. 2013; 111, 091302arXiv:astro-ph.CO/1304.7791]. [Google Scholar] [CrossRef] [PubMed]
- Douspis, M.; Salvati, L.; Aghanim, N. On the tension between Large Scale Structures and Cosmic Microwave Background. arXiv e-prints, arXiv:1901.05289, [arXiv:astro-ph.CO/1901.05289].
- Del Popolo, A.; Le Delliou, M. Small Scale Problems of the ΛCDM Model: A Short Review. Galaxies, 2017; 5, 17arXiv:astro-ph.CO/1606.07790]. [Google Scholar] [CrossRef]
- de Martino, I.; Chakrabarty, S.S.; Cesare, V.; Gallo, A.; Ostorero, L.; Diaferio, A. Dark Matters on the Scale of Galaxies. Universe 2020, 6. [Google Scholar] [CrossRef]
- McGaugh, S.S.; Schombert, J.M.; Bothun, G.D.; de Blok, W.J.G. The Baryonic Tully-Fisher Relation. ApJL 2000, 533, L99–L102. [Google Scholar] [CrossRef] [PubMed]
- McGaugh, S.S. The Mass Discrepancy-Acceleration Relation: Disk Mass and the Dark Matter Distribution. ApJ 2004, 609, 652–666. [Google Scholar] [CrossRef]
- McGaugh, S.S.; Lelli, F.; Schombert, J.M. Radial Acceleration Relation in Rotationally Supported Galaxies. Phys. Rev. Lett. 2016; 117, 201101arXiv:astro-ph.GA/1609.05917]. [Google Scholar] [CrossRef]
- Milgrom, M. A modification of the Newtonian dynamics as a possible alternative to the hidden mass hypothesis. ApJ 1983, 270, 365–370. [Google Scholar] [CrossRef]
- Milgrom, M. A modification of the Newtonian dynamics - Implications for galaxies. ApJ 1983, 270, 371–383. [Google Scholar] [CrossRef]
- Milgrom, M. A modification of the newtonian dynamics : implications for galaxy systems. ApJ 1983, 270, 384–389. [Google Scholar] [CrossRef]
- Matsakos, T.; Diaferio, A. Dynamics of galaxies and clusters in {refracted gravity}. arXiv e-prints, 2016; arXiv:1603.04943, [arXiv:astro-ph.GA/1603.04943]. [Google Scholar]
- Sanna, A.P.; Matsakos, T.; Diaferio, A. Covariant formulation of refracted gravity. A&A, 2023; 674, A209arXiv:astro-ph.CO/2109.11217]. [Google Scholar] [CrossRef]
- Deur, A. A relation between the dark mass of elliptical galaxies and their shape. MNRAS, 2014; 438, 1535–1551arXiv:astro-ph.GA/1304.6932]. [Google Scholar] [CrossRef]
- Deur, A. A correlation between the dark content of elliptical galaxies and their ellipticity. arXiv e-prints, 2020; arXiv:2010.06692, [arXiv:astro-ph.GA/2010.06692]. [Google Scholar]
- Sollima, A.; Nipoti, C. Globular clusters in modified Newtonian dynamics: velocity dispersion profiles from self-consistent models. MNRAS, 2010; 401, 131–142arXiv:astro-ph.GA/0909.1656]. [Google Scholar] [CrossRef]
- Mateo, M.L. Dwarf Galaxies of the Local Group. Ann. Rev. Astron. Astrophys. 1998, 36, 435–506. [Google Scholar] [CrossRef]
- Cesare, V.; Diaferio, A.; Matsakos, T.; Angus, G. Dynamics of DiskMass Survey galaxies in refracted gravity. A&A, 2020; 637, A70arXiv:astro-ph.GA/2003.07377]. [Google Scholar] [CrossRef]
- Bershady, M.A.; Verheijen, M.A.W.; Swaters, R.A.; Andersen, D.R.; Westfall, K.B.; Martinsson, T. The DiskMass Survey. I. Overview. ApJ 2010, arXiv:astro-ph.CO/1004.4816]716, 198–233. [Google Scholar] [CrossRef]
- Cesare, V. Dynamics of Disk and Elliptical Galaxies in Refracted Gravity. Physical Sciences Forum 2021, 2. [Google Scholar] [CrossRef]
- Sancisi, R. The visible matter – dark matter coupling. Dark Matter in Galaxies, [arXiv:astro-ph/astro-ph/0311348]. Ryder, S., Pisano, D., Walker, M., Freeman, K., Eds.; 2004; Volume 220, 233. [Google Scholar] [CrossRef]
- de Vaucouleurs, G. General Physical Properties of External Galaxies. Handbuch der Physik 1959, 53, 311. [Google Scholar] [CrossRef] [PubMed]
- Freeman, K.C. On the Disks of Spiral and S0 Galaxies. ApJ 1970, 160, 811. [Google Scholar] [CrossRef]
- Sérsic, J.L. Influence of the atmospheric and instrumental dispersion on the brightness distribution in a galaxy. Boletin de la Asociacion Argentina de Astronomia La Plata Argentina 1963, 6, 41–43. [Google Scholar]
- Young, D. Iterative Methods for Solving Partial Difference Equations of Elliptic Type. Transactions of the American Mathematical Society 1954, 76, 92–111. [Google Scholar] [CrossRef]
- Bell, E.F.; de Jong, R.S. Stellar Mass-to-Light Ratios and the Tully-Fisher Relation. ApJ 2001, 550, 212–229. [Google Scholar] [CrossRef]
- Bershady, M.A.; Verheijen, M.A.W.; Westfall, K.B.; Andersen, D.R.; Swaters, R.A.; Martinsson, T. The DiskMass Survey. II. Error Budget. ApJ, 2010; 716, 234–268arXiv:astro-ph.CO/1004.5043]. [Google Scholar] [CrossRef]
- Angus, G.W.; Gentile, G.; Swaters, R.; Famaey, B.; Diaferio, A.; McGaugh, S.S.; Heyden, K.J.v.d. Mass models of disc galaxies from the DiskMass Survey in modified Newtonian dynamics. MNRAS, 2015; 451, 3551–3580arXiv:astro-ph.GA/1505.05522]. [Google Scholar] [CrossRef]
- Milgrom, M. Quasi-linear formulation of MOND. MNRAS, 2010; 403, 886–895arXiv:astro-ph.CO/0911.5464]. [Google Scholar] [CrossRef]
- Aniyan, S.; Freeman, K.C.; Gerhard, O.E.; Arnaboldi, M.; Flynn, C. The influence of a kinematically cold young component on disc-halo decompositions in spiral galaxies: insights from solar neighbourhood K-giants. MNRAS, 2016; 456, 1484–1494arXiv:astro-ph.GA/1511.06047]. [Google Scholar] [CrossRef]
- Cesare, V.; Colonnelli, I.; Aldinucci, M. Practical Parallelization of Scientific Applications. 2020 28th Euromicro International Conference on Parallel, Distributed and Network-Based Processing (PDP), 2020, pp. 376–384. [CrossRef]
- Aldinucci, M.; Cesare, V.; Colonnelli, I.; Martinelli, A.R.; Mittone, G.; Cantalupo, B.; Cavazzoni, C.; Drocco, M. Practical parallelization of scientific applications with OpenMP, OpenACC and MPI. Journal of Parallel and Distributed Computing 2021, 157, 13–29. [Google Scholar] [CrossRef]
- Cesare, V.; Diaferio, A.; Matsakos, T. The dynamics of three nearby E0 galaxies in refracted gravity. A&A, 2022; 657, A133arXiv:astro-ph.GA/2102.12499]. [Google Scholar] [CrossRef]
- Lelli, F.; McGaugh, S.S.; Schombert, J.M. SPARC: Mass Models for 175 Disk Galaxies with Spitzer Photometry and Accurate Rotation Curves. AJ, 2016; 152, 157arXiv:astro-ph.GA/1606.09251]. [Google Scholar] [CrossRef]
- Li, P.; Lelli, F.; McGaugh, S.; Schombert, J. Fitting the radial acceleration relation to individual SPARC galaxies. A&A, 2018; 615, A3arXiv:astro-ph.GA/1803.00022]. [Google Scholar] [CrossRef]
- Lelli, F.; McGaugh, S.S.; Schombert, J.M.; Pawlowski, M.S. One Law to Rule Them All: The Radial Acceleration Relation of Galaxies. ApJ, 2017; 836, 152arXiv:astro-ph.GA/1610.08981]. [Google Scholar] [CrossRef]
- Pota, V.; Forbes, D.A.; Romanowsky, A.J.; Brodie, J.P.; Spitler, L.R.; Strader, J.; Foster, C.; Arnold, J.A.; Benson, A.; Blom, C.; Hargis, J.R.; Rhode, K.L.; Usher, C. The SLUGGS Survey: kinematics for over 2500 globular clusters in 12 early-type galaxies. MNRAS, 2013; 428, 389–420arXiv:astro-ph.CO/1209.4351]. [Google Scholar] [CrossRef]
- Brodie, J.P.; Romanowsky, A.J.; Strader, J.; Forbes, D.A.; Foster, C.; Jennings, Z.G.; Pastorello, N.; Pota, V.; Usher, C.; Blom, C.; Kader, J.; Roediger, J.C.; Spitler, L.R.; Villaume, A.; Arnold, J.A.; Kartha, S.S.; Woodley, K.A. The SAGES Legacy Unifying Globulars and GalaxieS Survey (SLUGGS): Sample Definition, Methods, and Initial Results. ApJ, 2014; 796, 52arXiv:astro-ph.GA/1405.2079]. [Google Scholar] [CrossRef]
- Forbes, D.A.; Alabi, A.; Brodie, J.P.; Romanowsky, A.J.; Strader, J.; Foster, C.; Usher, C.; Spitler, L.; Bellstedt, S.; Pastorello, N.; Villaume, A.; Wasserman, A.; Pota, V. The SLUGGS Survey: A Catalog of Over 4000 Globular Cluster Radial Velocities in 27 Nearby Early-type Galaxies. AJ, 2017; 153, 114arXiv:astro-ph.GA/1701.04835]. [Google Scholar] [CrossRef]
- Mathews, W.G.; Brighenti, F. Hot Gas in and around Elliptical Galaxies. Ann. Rev. Astron. Astrophys. 2003, 41, 191–239. [Google Scholar] [CrossRef]
- Pulsoni, C.; Gerhard, O.; Arnaboldi, M.; Coccato, L.; Longobardi, A.; Napolitano, N.R.; Moylan, E.; Narayan, C.; Gupta, V.; Burkert, A.; Capaccioli, M.; Chies-Santos, A.L.; Cortesi, A.; Freeman, K.C.; Kuijken, K.; Merrifield, M.R.; Romanowsky, A.J.; Tortora, C. The extended Planetary Nebula Spectrograph (ePN.S) early-type galaxy survey: The kinematic diversity of stellar halos and the relation between halo transition scale and stellar mass. A&A, 2018; 618, A94arXiv:astro-ph.GA/1712.05833]. [Google Scholar] [CrossRef]
- Pota, V.; Romanowsky, A.J.; Brodie, J.P.; Peñarrubia, J.; Forbes, D.A.; Napolitano, N.R.; Foster, C.; Walker, M.G.; Strader, J.; Roediger, J.C. The SLUGGS survey: multipopulation dynamical modelling of the elliptical galaxy NGC 1407 from stars and globular clusters. MNRAS, 2015; 450, 3345–3358arXiv:astro-ph.GA/1504.03325]. [Google Scholar] [CrossRef]
- Scott, N.; Cappellari, M.; Davies, R.L.; Verdoes Kleijn, G.; Bois, M.; Alatalo, K.; Blitz, L.; Bournaud, F.; Bureau, M.; Crocker, A.; Davis, T.A.; de Zeeuw, P.T.; Duc, P.A.; Emsellem, E.; Khochfar, S.; Krajnović, D.; Kuntschner, H.; McDermid, R.M.; Morganti, R.; Naab, T.; Oosterloo, T.; Sarzi, M.; Serra, P.; Weijmans, A.M.; Young, L.M. The ATLAS3D project - XXI. Correlations between gradients of local escape velocity and stellar populations in early-type galaxies. MNRAS, 2013; 432, 1894–1913arXiv:astro-ph.CO/1211.4615]. [Google Scholar] [CrossRef]
- Strader, J.; Romanowsky, A.J.; Brodie, J.P.; Spitler, L.R.; Beasley, M.A.; Arnold, J.A.; Tamura, N.; Sharples, R.M.; Arimoto, N. Wide-field Precision Kinematics of the M87 Globular Cluster System. ApJS, 2011; 197, 33arXiv:astro-ph.CO/1110.2778]. [Google Scholar] [CrossRef]
- Zhang, Z.; Xu, H.; Wang, Y.; An, T.; Xu, Y.; Wu, X.P. Probing the Mass Distributions in NGC 1407 and Its Associated Group with the X-Ray Imaging Spectroscopic and Optical Photometric and Line-Strength Indices Data. ApJ 2007, 656, 805–817. [Google Scholar] [CrossRef]
- Paggi, A.; Kim, D.W.; Anderson, C.; Burke, D.; D’Abrusco, R.; Fabbiano, G.; Fruscione, A.; Gokas, T.; Lauer, J.; McCollough, M.; Morgan, D.; Mossman, A.; O’Sullivan, E.; Trinchieri, G.; Vrtilek, S.; Pellegrini, S.; Romanowsky, A.J.; Brodie, J. Constraining the Physical State of the Hot Gas Halos in NGC 4649 and NGC 5846. ApJ, 2017; 844, 5arXiv:astro-ph.GA/1706.02303]. [Google Scholar] [CrossRef]
- Fabricant, D.; Lecar, M.; Gorenstein, P. X-ray measurements of the mass of M 87. ApJ 1980, 241, 552–560. [Google Scholar] [CrossRef]
- Rusli, S.P.; Erwin, P.; Saglia, R.P.; Thomas, J.; Fabricius, M.; Bender, R.; Nowak, N. Depleted Galaxy Cores and Dynamical Black Hole Masses. AJ, 2013; 146, 160arXiv:astro-ph.CO/1310.5310]. [Google Scholar] [CrossRef]
- Jeans, J.H. On the theory of star-streaming and the structure of the universe. MNRAS 1915, 76, 70–84. [Google Scholar] [CrossRef]
- Mamon, G.A.; okas, E.L. Dark matter in elliptical galaxies - II. Estimating the mass within the virial radius. MNRAS 2005, 363, 705–722. [Google Scholar] [CrossRef]
- Cappellari, M. Measuring the inclination and mass-to-light ratio of axisymmetric galaxies via anisotropic Jeans models of stellar kinematics. MNRAS, 2008; 390, 71–86arXiv:astro-ph/0806.0042]. [Google Scholar] [CrossRef]
- Thomas, J.; Saglia, R.P.; Bender, R.; Erwin, P.; Fabricius, M. The Dynamical Fingerprint of Core Scouring in Massive Elliptical Galaxies. ApJ, 2014; 782, 39arXiv:astro-ph.GA/1311.3783]. [Google Scholar] [CrossRef]
- Rantala, A.; Johansson, P.H.; Naab, T.; Thomas, J.; Frigo, M. The Simultaneous Formation of Cored, Tangentially Biased, and Kinematically Decoupled Centers in Massive Early-type Galaxies. ApJL, 2019; 872, L17arXiv:astro-ph.GA/1812.02732]. [Google Scholar] [CrossRef]
- Humphrey, P.J.; Buote, D.A.; Gastaldello, F.; Zappacosta, L.; Bullock, J.S.; Brighenti, F.; Mathews, W.G. A Chandra View of Dark Matter in Early-Type Galaxies. ApJ 2006, 646, 899–918. [Google Scholar] [CrossRef]
- Bell, E.F.; McIntosh, D.H.; Katz, N.; Weinberg, M.D. The Optical and Near-Infrared Properties of Galaxies. I. Luminosity and Stellar Mass Functions. ApJS 2003, 149, 289–312. [Google Scholar] [CrossRef]
- Zibetti, S.; Charlot, S.; Rix, H.W. Resolved stellar mass maps of galaxies - I. Method and implications for global mass estimates. MNRAS, 2009; 400, 1181–1198arXiv:astro-ph.CO/0904.4252]. [Google Scholar] [CrossRef]
- Cappellari, M.; Emsellem, E.; Krajnovic, D.; McDermid, R.M.; Scott, N.; Verdoes Kleijn, G.A.; Young, L.M.; Alatalo, K.; Bacon, R.; Blitz, L.; Bois, M.; Bournaud, F.; Bureau, M.; Davies, R.L.; Davis, T.A.; De Zeeuw, P.T.; Duc, P.A.; Khochfar, S.; Kuntschner, H.; Lablanche, P.Y.; Morganti, R.; Naab, T.; Oosterloo, T.; Sarzi, M.; Serra, P.; Weijmans, A.M. VizieR Online Data Catalog: ATLAS3D project. I. (Cappellari+, 2011). VizieR Online Data Catalog.
- Vikhlinin, A.; Kravtsov, A.; Forman, W.; Jones, C.; Markevitch, M.; Murray, S.S.; Van Speybroeck, L. Chandra Sample of Nearby Relaxed Galaxy Clusters: Mass, Gas Fraction, and Mass-Temperature Relation. ApJ 2006, 640, 691–709. [Google Scholar] [CrossRef]
- McGaugh, S.S. The Baryonic Tully-Fisher Relation of Galaxies with Extended Rotation Curves and the Stellar Mass of Rotating Galaxies. ApJ 2005, 632, 859–871. [Google Scholar] [CrossRef]
- Sanders, R.H. Clusters of galaxies with modified Newtonian dynamics. MNRAS 2003, 342, 901–908. [Google Scholar] [CrossRef]
- McGaugh, S.S. A tale of two paradigms: the mutual incommensurability of ΛCDM and MOND. Canadian Journal of Physics, 2015; 93, 250–259arXiv:astro-ph.CO/1404.7525]. [Google Scholar] [CrossRef]
- Bekenstein, J.D. Relativistic gravitation theory for the modified Newtonian dynamics paradigm. Phys. Rev. D 2004, 70, 083509. [Google Scholar] [CrossRef]
- Skordis, C. TOPICAL REVIEW: The tensor-vector-scalar theory and its cosmology. Classical and Quantum Gravity, 2009; 26, 143001arXiv:astro-ph.CO/0903.3602]. [Google Scholar] [CrossRef]
- Bekenstein, J.D. Tensor-vector-scalar-modified gravity: from small scale to cosmology. Philosophical Transactions of the Royal Society of London Series A, 2011; 369, 5003–5017arXiv:astro-ph.CO/1201.2759]. [Google Scholar] [CrossRef] [PubMed]
- Hernandez, X.; Sussman, R.A.; Nasser, L. Approaching the Dark Sector through a bounding curvature criterion. MNRAS, 2019; 483, 147–151arXiv:astro-ph.GA/1705.06356]. [Google Scholar] [CrossRef]
- Skordis, C.; Złośnik, T. New Relativistic Theory for Modified Newtonian Dynamics. Phys. Rev. Lett. 2021; 127, 161302arXiv:astro-ph.CO/2007.00082]. [Google Scholar] [CrossRef] [PubMed]
- Kunz, M.; Liddle, A.R.; Parkinson, D.; Gao, C. Constraining the dark fluid. Phys. Rev. D, 2009; 80, 083533arXiv:astro-ph.CO/0908.3197]. [Google Scholar] [CrossRef]
- Kunz, M. Degeneracy between the dark components resulting from the fact that gravity only measures the total energy-momentum tensor. Phys. Rev. D 2009, 80, 123001. [Google Scholar] [CrossRef]
- Makler, M.; de Oliveira, S.Q.; Waga, I. Constraints on the generalized Chaplygin gas from supernovae observations. Physics Letters B 2003, 555, 1–6. [Google Scholar] [CrossRef]
- Bento, M.C.; Bertolami, O.; Sen, A.A. Letter: Generalized Chaplygin Gas Model: Dark Energy-Dark Matter Unification and CMBR Constraints. General Relativity and Gravitation 2003, 35, 2063–2069. [Google Scholar] [CrossRef]
- Scherrer, R.J. Purely Kinetic k Essence as Unified Dark Matter. Phys. Rev. Lett. 2004, 93, 011301. [Google Scholar] [CrossRef]
- Bruni, M.; Lazkoz, R.; Rozas-Fernández, A. Phenomenological models for unified dark matter with fast transition. MNRAS, 2013; 431, 2907–2916arXiv:astro-ph.CO/1210.1880]. [Google Scholar] [CrossRef]
- Cadoni, M.; Casadio, R.; Giusti, A.; Mück, W.; Tuveri, M. Effective fluid description of the dark universe. Physics Letters B, 2018; 776, 242–248arXiv:gr-qc/1707.09945]. [Google Scholar] [CrossRef]
- Sotiriou, T.P.; Faraoni, V. f(R) theories of gravity. Reviews of Modern Physics, 2010; 82, 451–497arXiv:gr-qc/0805.1726]. [Google Scholar] [CrossRef]
- Sebastiani, L.; Vagnozzi, S.; Myrzakulov, R. Mimetic gravity: a review of recent developments and applications to cosmology and astrophysics. arXiv e-prints, 2016; arXiv:1612.08661, [arXiv:gr-qc/1612.08661]. [Google Scholar] [CrossRef]
- Berezhiani, L.; Khoury, J.; Wang, J. Universe without dark energy: Cosmic acceleration from dark matter-baryon interactions. Phys. Rev. D, 2017; 95, 123530arXiv:hep-th/1612.00453]. [Google Scholar] [CrossRef]
- Ferreira, E.G.M.; Franzmann, G.; Khoury, J.; Brandenberger, R. Unified superfluid dark sector. JCAP, 2019; 2019, 027arXiv:astro-ph.CO/1810.09474]. [Google Scholar] [CrossRef]
- Arbey, A.; Coupechoux, J.F. Unifying dark matter, dark energy and inflation with a fuzzy dark fluid. JCAP, 2021; 2021, 033arXiv:astro-ph.CO/2007.05376]. [Google Scholar] [CrossRef]
- Campigotto, M.C.; Diaferio, A.; Fatibene, L. Conformal gravity: light deflection revisited and the galactic rotation curve failure. Classical and Quantum Gravity, 2019; 36, 245014arXiv:astro-ph.CO/1712.03969]. [Google Scholar] [CrossRef]
- Suzuki, N.; Rubin, D.; Lidman, C.; Aldering, G.; Amanullah, R.; Barbary, K.; Barrientos, L.F.; Botyanszki, J.; Brodwin, M.; Connolly, N.; et al. The Hubble Space Telescope Cluster Supernova Survey. V. Improving the Dark-energy Constraints above z > 1 and Building an Early-type-hosted Supernova Sample. ApJ, 2012; 746, 85arXiv:astro-ph.CO/1105.3470]. [Google Scholar] [CrossRef]
- Amendola, L.; Tsujikawa, S. Dark Energy: Theory and Observations; Cambridge University Press, 2015. [Google Scholar]
- Copeland, E.J.; Sami, M.; Tsujikawa, S. Dynamics of Dark Energy. International Journal of Modern Physics D 2006, 15, 1753–1935. [Google Scholar] [CrossRef]
- Frusciante, N.; Perenon, L. Effective field theory of dark energy: A review. Physics Reports, 2020; 857, 1–63arXiv:astro-ph.CO/1907.03150]. [Google Scholar] [CrossRef]
- Wen, S.; Wang, S.; Luo, X. Comparing dark energy models with current observational data. JCAP, 2018; 2018, 011arXiv:astro-ph.CO/1708.03143]. [Google Scholar] [CrossRef]
- Capozziello, S.; Nojiri, S.; Odintsov, S.D. Dark energy: the equation of state description versus scalar-tensor or modified gravity. Physics Letters B 2006, 634, 93–100. [Google Scholar] [CrossRef]
- Gerardi, F.; Martinelli, M.; Silvestri, A. Reconstruction of the Dark Energy equation of state from latest data: the impact of theoretical priors. JCAP, 2019; 2019, 042arXiv:astro-ph.CO/1902.09423]. [Google Scholar] [CrossRef]
- Chevallier, M.; Polarski, D. Accelerating Universes with Scaling Dark Matter. International Journal of Modern Physics D 2001, 10, 213–223. [Google Scholar] [CrossRef]
- Linder, E.V. Exploring the Expansion History of the Universe. Phys. Rev. Lett. 2003, 90, 091301. [Google Scholar] [CrossRef] [PubMed]
- Bean, R.; Melchiorri, A. Current constraints on the dark energy equation of state. Phys. Rev. D 2002, 65, 041302. [Google Scholar] [CrossRef]
- Solà, J.; Štefančić, H. Effective equation of state for dark energy: Mimicking quintessence and phantom energy through a variable Λ. Physics Letters B 2005, 624, 147–157. [Google Scholar] [CrossRef]
- Hazra, D.K.; Majumdar, S.; Pal, S.; Panda, S.; Sen, A.A. Post-Planck dark energy constraints. Phys. Rev. D, 2015; 91, 083005arXiv:astro-ph.CO/1310.6161]. [Google Scholar] [CrossRef]
- Di Paolo, C.; Salucci, P.; Fontaine, J.P. The Radial Acceleration Relation (RAR): Crucial Cases of Dwarf Disks and Low-surface-brightness Galaxies. ApJ, 2019; 873, 106arXiv:astro-ph.GA/1810.08472]. [Google Scholar] [CrossRef]
- Santos-Santos, I.M.E.; Navarro, J.F.; Robertson, A.; Benítez-Llambay, A.; Oman, K.A.; Lovell, M.R.; Frenk, C.S.; Ludlow, A.D.; Fattahi, A.; Ritz, A. Baryonic clues to the puzzling diversity of dwarf galaxy rotation curves. MNRAS, 2020; 495, 58–77arXiv:astro-ph.GA/1911.09116]. [Google Scholar] [CrossRef]
- Jiménez, M.A.; Garcia, G.; Hernandez, X.; Nasser, L. The Massive Elliptical Galaxy NGC 4649 from the Perspective of Extended Gravity. ApJ, 2013; 768, 142arXiv:astro-ph.CO/1210.8183]. [Google Scholar] [CrossRef]
- Durazo, R.; Hernandez, X.; Cervantes Sodi, B.; Sánchez, S.F. A Universal Velocity Dispersion Profile for Pressure Supported Systems: Evidence for MONDian Gravity across Seven Orders of Magnitude in Mass. ApJ, 2017; 837, 179arXiv:astro-ph.GA/1506.04099]. [Google Scholar] [CrossRef]
- Durazo, R.; Hernandez, X.; Cervantes Sodi, B.; Sanchez, S.F. A Test of MONDian Gravity in ∼300 Pressure-supported Elliptical Galaxies from the MaNGA Survey. ApJ, 2018; 863, 107arXiv:astro-ph.GA/1804.01581]. [Google Scholar] [CrossRef]
- Baumgardt, H.; Grebel, E.K.; Kroupa, P. Using distant globular clusters as a test for gravitational theories. MNRAS 2005, 359, L1–L4. [Google Scholar] [CrossRef]
- Jordi, K.; Grebel, E.K.; Hilker, M.; Baumgardt, H.; Frank, M.; Kroupa, P.; Haghi, H.; Côté, P.; Djorgovski, S.G. Testing Fundamental Physics with Distant Star Clusters: Analysis of Observational Data on Palomar 14. AJ, 2009; 137, 4586–4596arXiv:astro-ph.GA/0903.4448]. [Google Scholar] [CrossRef]
- Baumgardt, H.; Côté, P.; Hilker, M.; Rejkuba, M.; Mieske, S.; Djorgovski, S.G.; Stetson, P. The velocity dispersion and mass-to-light ratio of the remote halo globular cluster NGC2419. MNRAS, 2009; 396, 2051–2060arXiv:astro-ph.GA/0904.3329]. [Google Scholar] [CrossRef]
- Ibata, R.; Sollima, A.; Nipoti, C.; Bellazzini, M.; Chapman, S.C.; Dalessandro, E. The Globular Cluster NGC 2419: A Crucible for Theories of Gravity. ApJ, 2011; 738, 186arXiv:astro-ph.CO/1106.4909]. [Google Scholar] [CrossRef]
- Ibata, R.; Sollima, A.; Nipoti, C.; Bellazzini, M.; Chapman, S.C.; Dalessandro, E. Polytropic Model Fits to the Globular Cluster NGC 2419 in Modified Newtonian Dynamics. ApJ, 2011; 743, 43arXiv:astro-ph.CO/1110.3892]. [Google Scholar] [CrossRef]
- Frank, M.J.; Hilker, M.; Baumgardt, H.; Côté, P.; Grebel, E.K.; Haghi, H.; Küpper, A.H.W.; Djorgovski, S.G. The velocity dispersion and mass function of the outer halo globular cluster Palomar 4. MNRAS, 2012; 423, 2917–2932arXiv:astro-ph.GA/1205.2693]. [Google Scholar] [CrossRef]
- Salucci, P.; Wilkinson, M.I.; Walker, M.G.; Gilmore, G.F.; Grebel, E.K.; Koch, A.; Frigerio Martins, C.; Wyse, R.F.G. Dwarf spheroidal galaxy kinematics and spiral galaxy scaling laws. MNRAS, 2012; 420, 2034–2041arXiv:astro-ph.CO/1111.1165]. [Google Scholar] [CrossRef]
- Oh, S.H.; Hunter, D.A.; Brinks, E.; Elmegreen, B.G.; Schruba, A.; Walter, F.; Rupen, M.P.; Young, L.M.; Simpson, C.E.; Johnson, M.C.; Herrmann, K.A.; Ficut-Vicas, D.; Cigan, P.; Heesen, V.; Ashley, T.; Zhang, H.X. High-resolution Mass Models of Dwarf Galaxies from LITTLE THINGS. AJ, 2015; 149, 180arXiv:astro-ph.GA/1502.01281]. [Google Scholar] [CrossRef]
- The Dark Energy Survey Collaboration. The Dark Energy Survey. <italic>arXiv e-prints</italic> <b>2005</b>, pp. The Dark Energy Survey Collaboration. The Dark Energy Survey. arXiv e-prints, a: astro–ph/0510346, [arXiv, 0510. [Google Scholar] [CrossRef]
- Euclid Collaboration; Scaramella, R. ; Amiaux, J.; Mellier, Y.; Burigana, C.; Carvalho, C.S.; Cuillandre, J.C.; Da Silva, A.; Derosa, A.; Dinis, J.; et al. Euclid preparation. I. The Euclid Wide Survey. A&A, 2022; 662, A112arXiv:astro-ph.CO/2108.01201]. [Google Scholar] [CrossRef]
- Amendola, L.; Appleby, S.; Avgoustidis, A.; Bacon, D.; Baker, T.; Baldi, M.; Bartolo, N.; Blanchard, A.; Bonvin, C.; Borgani, S.; et al. Cosmology and fundamental physics with the Euclid satellite. Living Reviews in Relativity, 2018; 21, 2arXiv:astro-ph.CO/1606.00180]. [Google Scholar] [CrossRef] [PubMed]
- Huterer, D.; Kirkby, D.; Bean, R.; Connolly, A.; Dawson, K.; Dodelson, S.; Evrard, A.; Jain, B.; Jarvis, M.; Linder, E.; Mandelbaum, R.; May, M.; Raccanelli, A.; Reid, B.; Rozo, E.; Schmidt, F.; Sehgal, N.; Slosar, A.; van Engelen, A.; Wu, H.Y.; Zhao, G. Growth of cosmic structure: Probing dark energy beyond expansion. Astroparticle Physics, 2015; 63, 23–41arXiv:astro-ph.CO/1309.5385]. [Google Scholar] [CrossRef]
- Noller, J.; Nicola, A. Cosmological parameter constraints for Horndeski scalar-tensor gravity. Phys. Rev. D, 2019; 99, 103502arXiv:astro-ph.CO/1811.12928]. [Google Scholar] [CrossRef]
- Planck Collaboration; Aghanim, N. ; Akrami, Y.; Arroja, F.; Ashdown, M.; Aumont, J.; Baccigalupi, C.; Ballardini, M.; Banday, A.J.; Barreiro, R.B.; et al. Planck 2018 results. I. Overview and the cosmological legacy of Planck. A&A, 2020; 641, A1arXiv:astro-ph.CO/1807.06205]. [Google Scholar] [CrossRef]
- de Jong, J.T.A.; Kuijken, K.; Applegate, D.; Begeman, K.; Belikov, A.; Blake, C.; Bout, J.; Boxhoorn, D.; Buddelmeijer, H.; Buddendiek, A.; et al. The Kilo-Degree Survey. The Messenger 2013, 154, 44–46. [Google Scholar] [CrossRef]
- Gwyn, S.D.J. The Canada-France-Hawaii Telescope Legacy Survey: Stacked Images and Catalogs. AJ, 2012; 143, 38arXiv:astro-ph.CO/1101.1084]. [Google Scholar] [CrossRef]
- di Porto, C.; Amendola, L. Observational constraints on the linear fluctuation growth rate. Phys. Rev. D, 2008; 77, 083508arXiv:astro-ph/0707.2686]. [Google Scholar] [CrossRef]
- Bueno Sánchez, J.C.; Perivolaropoulos, L. Dark energy and matter perturbations in scalar-tensor theories of gravity. Journal of Physics Conference Series, 2011, Vol. 283, Journal of Physics Conference Series, p. 012006. [CrossRef]
- Pace, F.; Moscardini, L.; Crittenden, R.; Bartelmann, M.; Pettorino, V. A comparison of structure formation in minimally and non-minimally coupled quintessence models. MNRAS, 2014; 437, 547–561arXiv:astro-ph.CO/1307.7026]. [Google Scholar] [CrossRef]
- Kofinas, G.; Lima, N.A. Dynamics of cosmological perturbations in modified Brans-Dicke cosmology with matter-scalar field interaction. Phys. Rev. D, 2017; 96, 084016arXiv:gr-qc/1704.08925]. [Google Scholar] [CrossRef]
- Springel, V. The cosmological simulation code GADGET-2. MNRAS 2005, 364, 1105–1134. [Google Scholar] [CrossRef]
- DESI Collaboration; Adame, A.G.; Aguilar, J.; Ahlen, S.; Alam, S.; Aldering, G.; Alexander, D.M.; Alfarsy, R.; Allende Prieto, C.; Alvarez, M.; et al. The Early Data Release of the Dark Energy Spectroscopic Instrument. arXiv e-prints, [arXiv:astro-ph.CO/2306.06308]. 2023; arXiv:2306.06308. [Google Scholar] [CrossRef]
- Grainge, K.; Alachkar, B.; Amy, S.; Barbosa, D.; Bommineni, M.; Boven, P.; Braddock, R.; Davis, J.; Diwakar, P.; Francis, V.; et al. Square Kilometre Array: The radio telescope of the XXI century. Astronomy Reports 2017, 61, 288–296. [Google Scholar] [CrossRef]
Figure 1.
Comparison between the behaviour of Newtonian (top panels) and RG (bottom panels) gravitational field lines for flat (left panels) and spherical (right panels) systems. The figure is reproduced from Figure 16 in [28].
Figure 1.
Comparison between the behaviour of Newtonian (top panels) and RG (bottom panels) gravitational field lines for flat (left panels) and spherical (right panels) systems. The figure is reproduced from Figure 16 in [28].
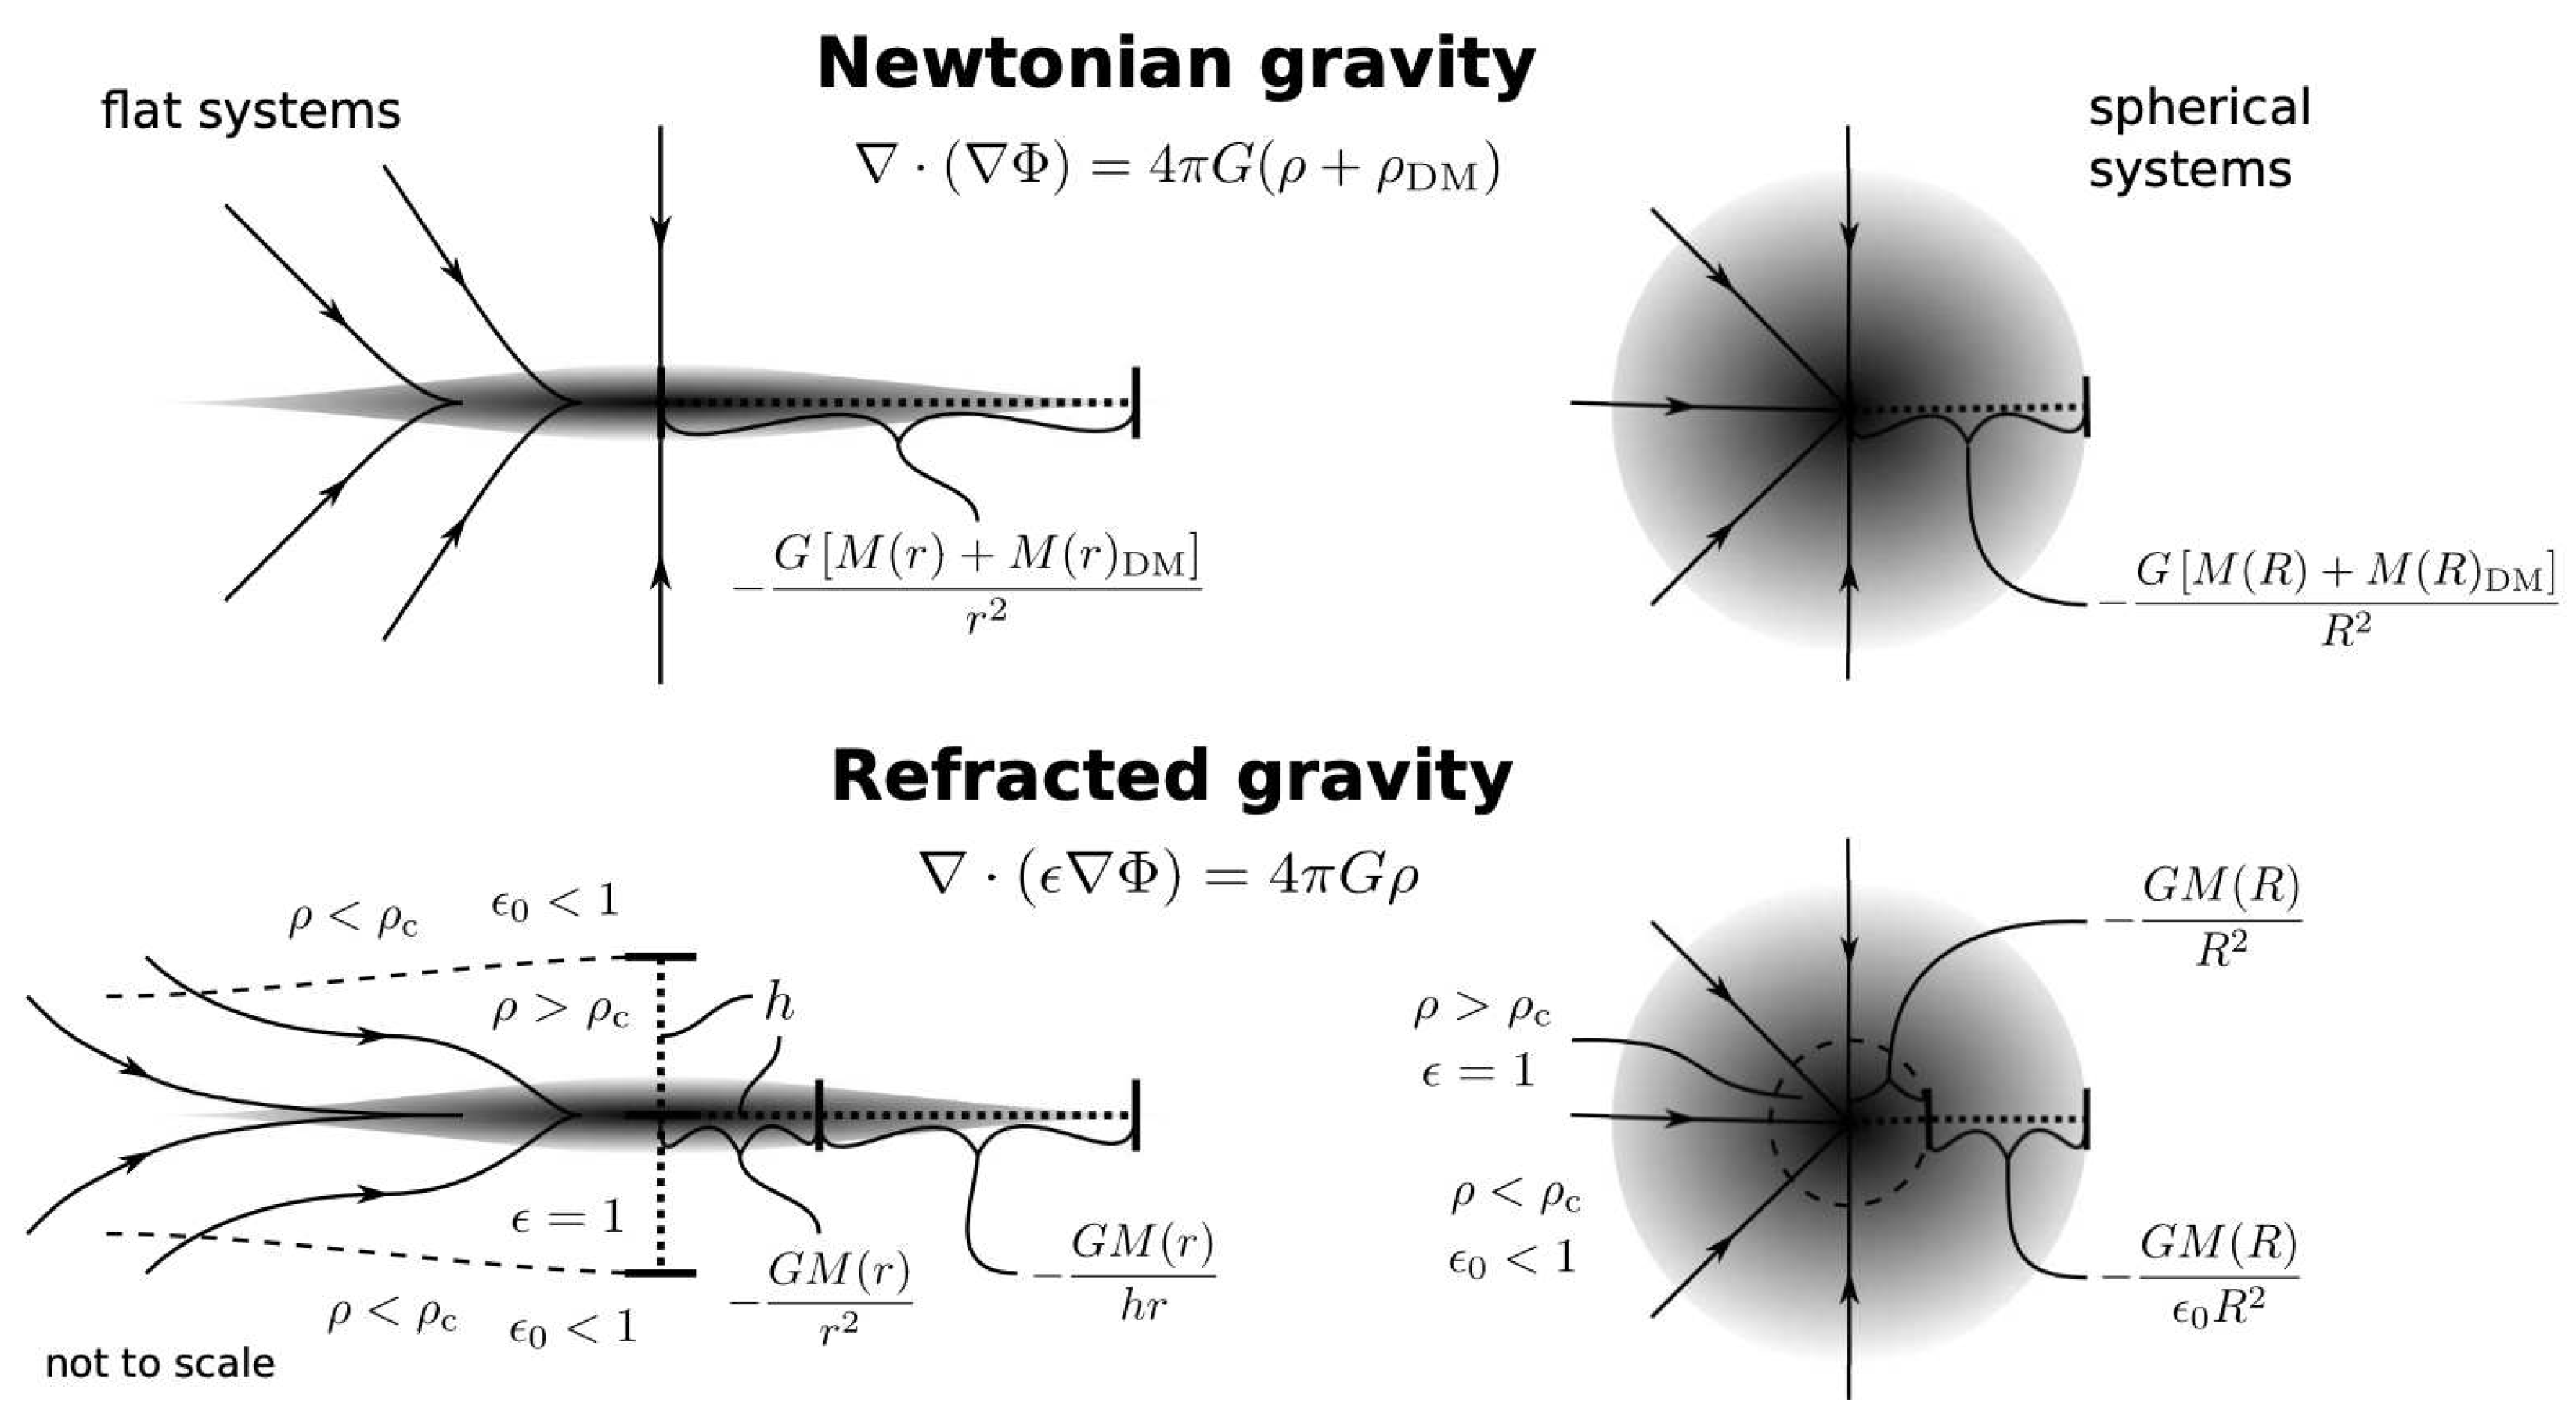
Figure 2.
Gravitational permittivity adopted in RG (Equation (7)) for different values of the RG free parameter Q. The larger the value of Q, the steeper the transition between the two asymptotic limits of Equation (2). The black dashed line represents . The figure is reproduced from Figure 1 in [34]. Credit: Cesare V., Diaferio A., Matsakos T., and Angus G., A&A, 637, A70, 2020, reproduced with permission © ESO.
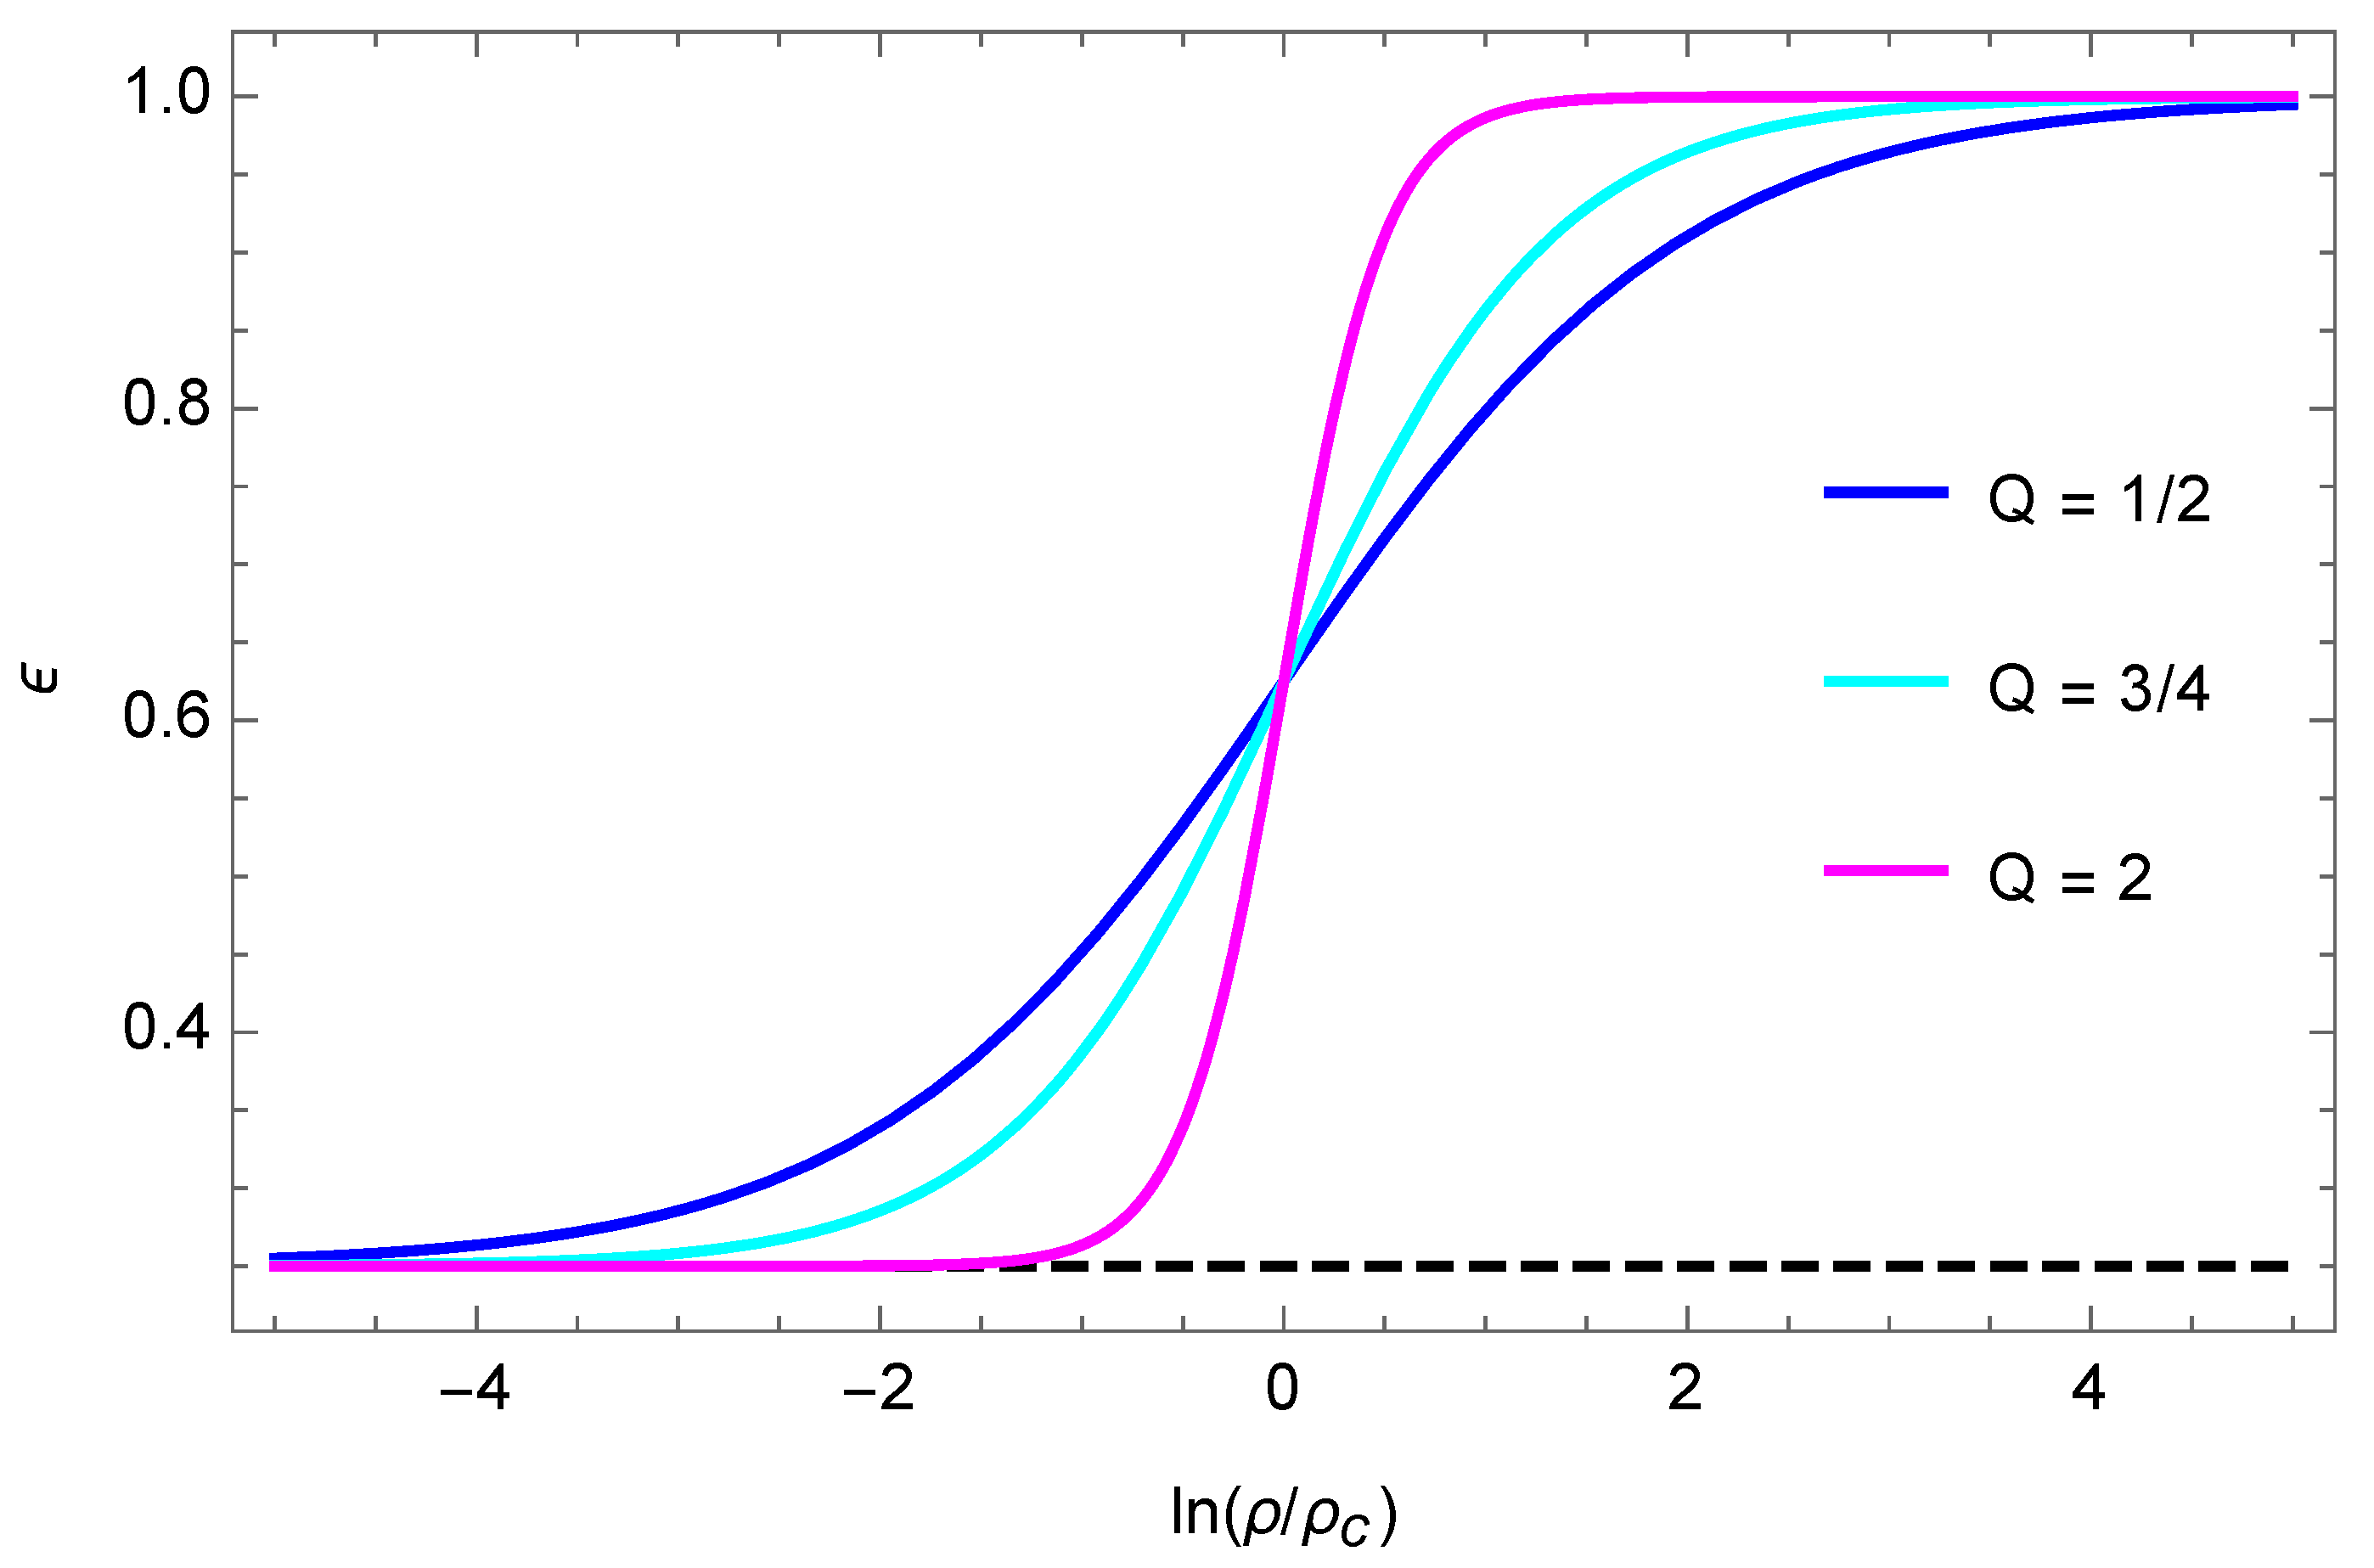
Figure 3.
RG models (blue solid lines) of the rotation curves and the vertical velocity dispersion profiles against the DMS data (red dots with error bars) for three DMS galaxies. Figure 3a: rotation curves computed with the parameters found by modelling the rotation curves of each galaxy alone. Figure 3b: rotation curves computed with the parameters found by modelling the rotation curves and the vertical velocity dispersion profiles of each galaxy at the same time. Figure 3c: vertical velocity dispersion profiles computed with the parameters found by modelling the rotation curves and the vertical velocity dispersion profiles of each galaxy at the same time. The cyan solid lines are the RG vertical velocity dispersions calculated with the same parameters as the blue curves but with disk-scale heights (Equation (18)), and the dashed magenta and green vertical lines show the bulge effective radius ( in Equation (12)) and the bulge radius adopted in the disk-bulge decomposition for the surface brightness modelling, respectively. The figure is readapted from Figures D.1 and D.2 in [34]. Credit: Cesare V., Diaferio A., Matsakos T., and Angus G., A&A, 637, A70, 2020, reproduced with permission © ESO.
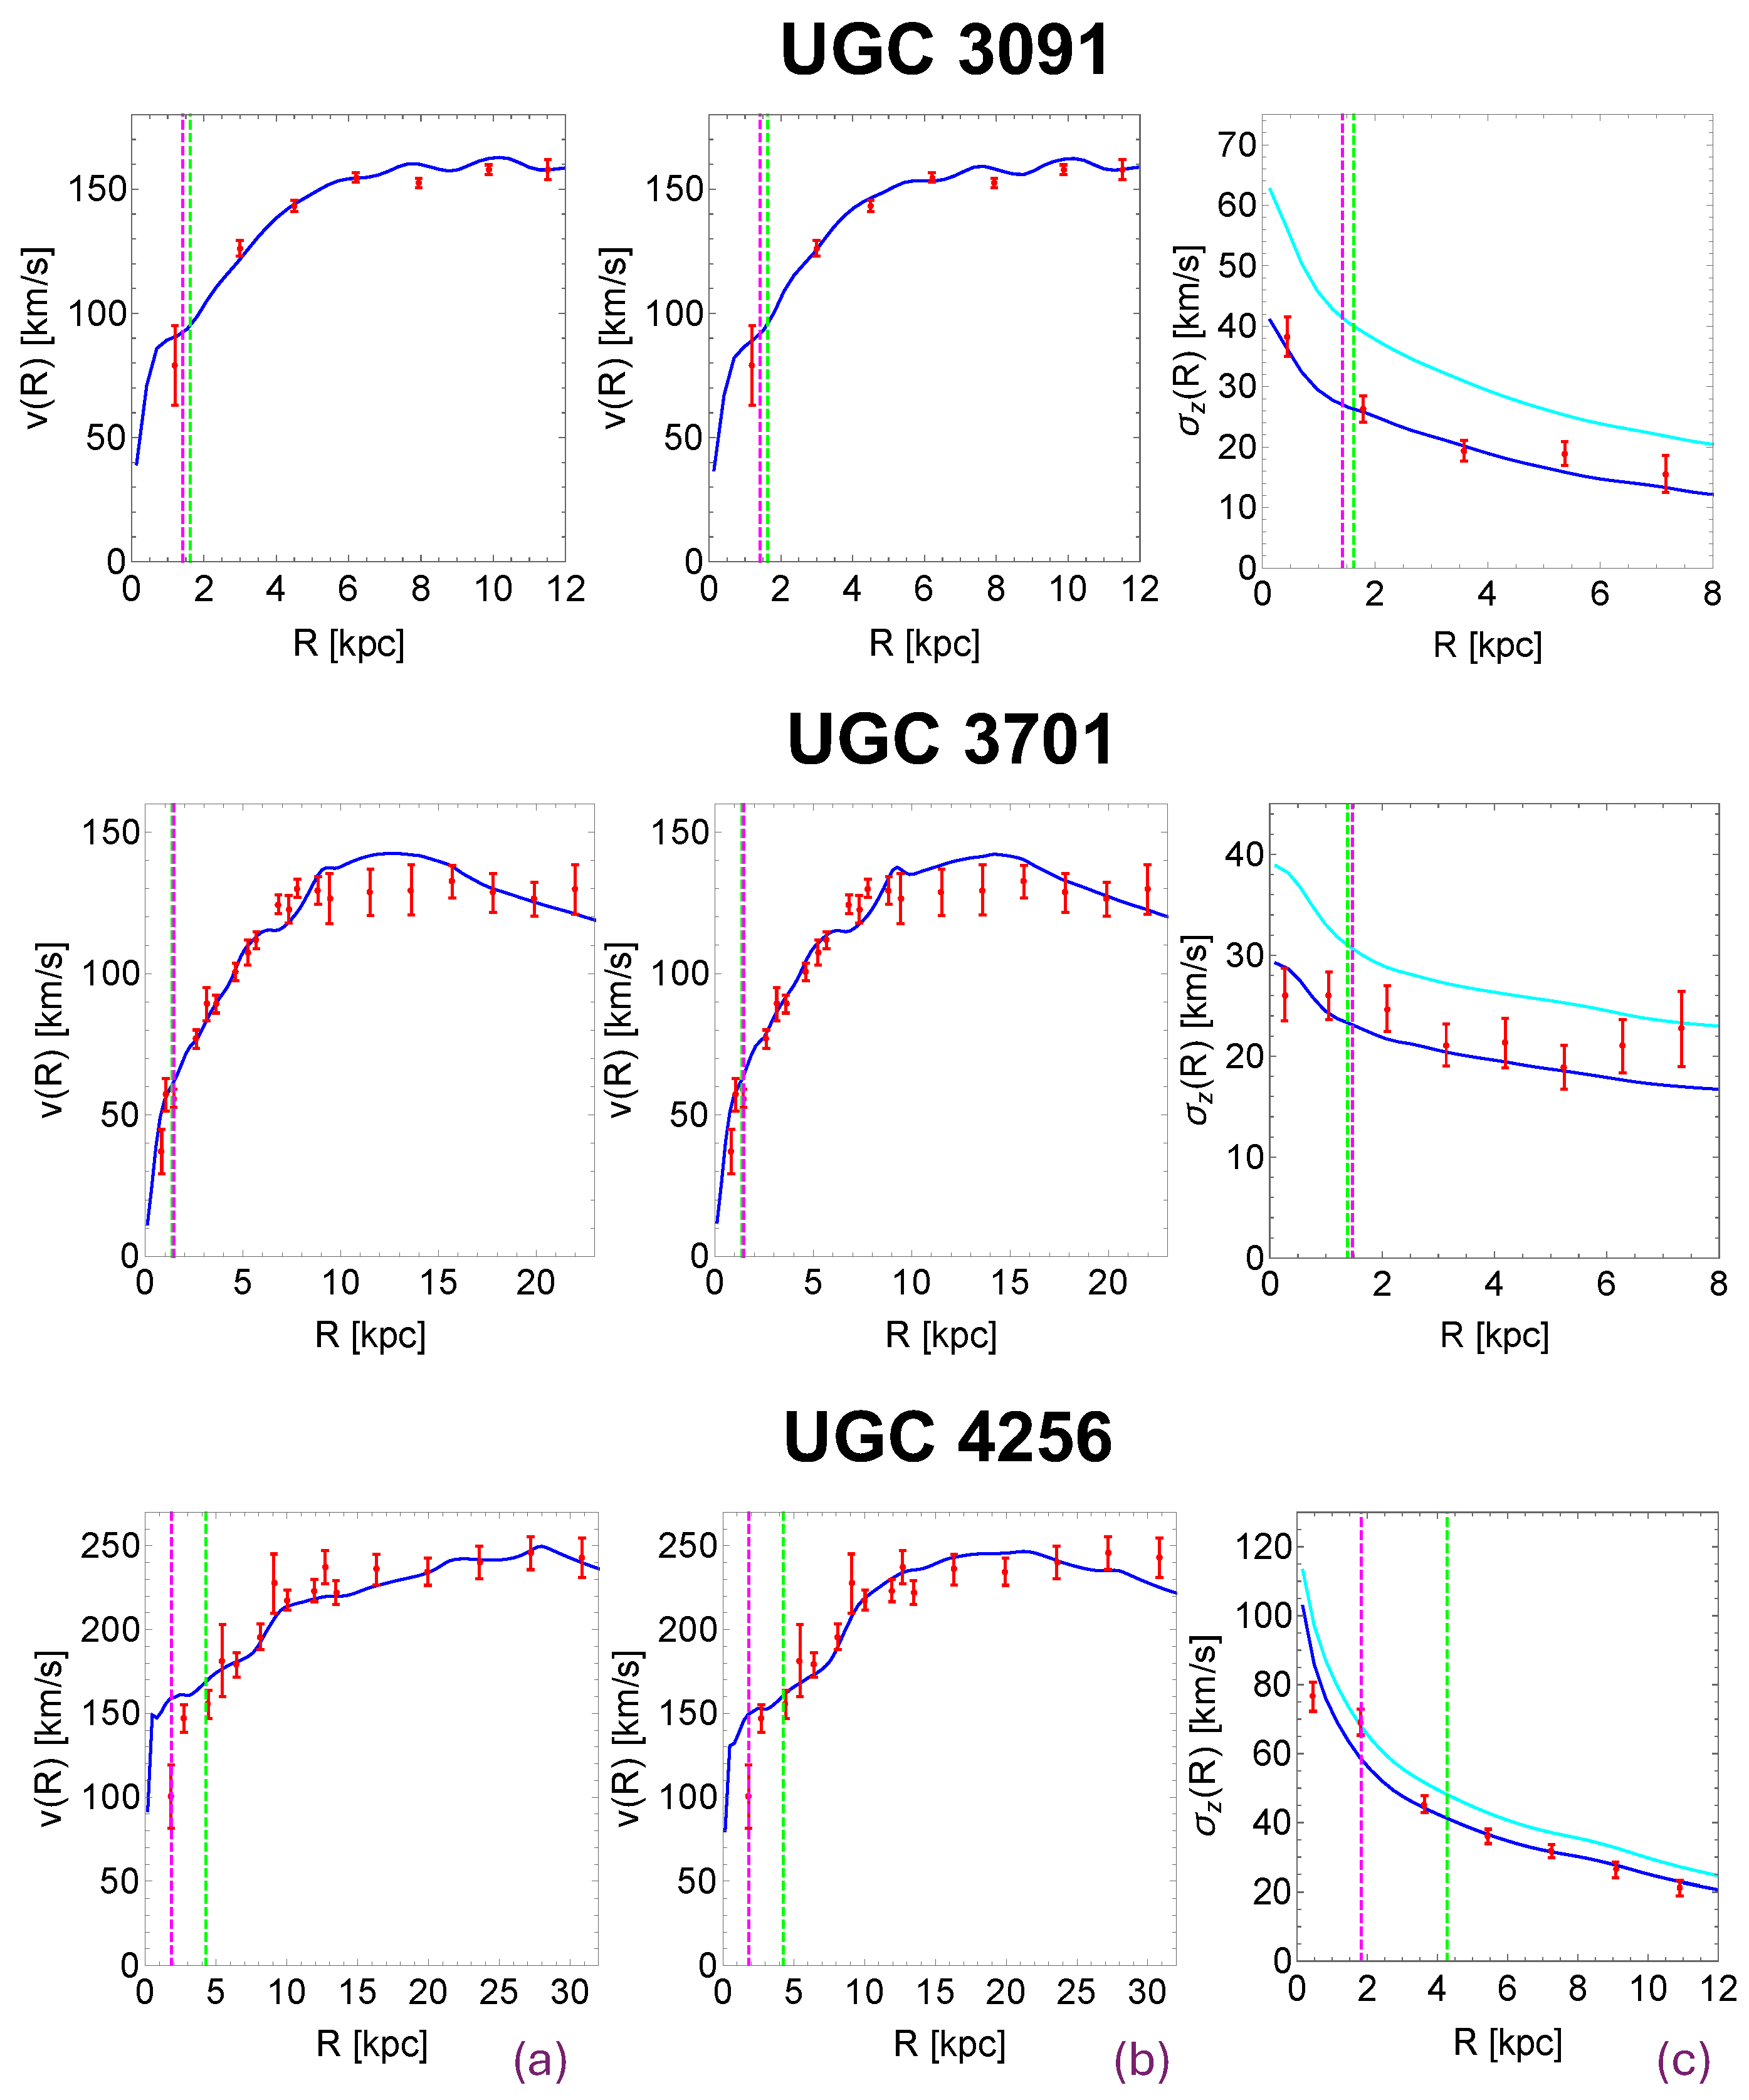
Figure 4.
Free parameters of the RG gravitational permittivity estimated from the DMS and the three elliptical E0 galaxies. The purple squares with error bars represent the means of the permittivity parameters estimated, at the same time, from the rotation curves and the vertical velocity dispersion profiles of each DMS galaxy. The light blue shaded areas indicate the posterior distributions of the unique combination of RG parameters estimated from the entire DMS sample at the same time, where their medians and 1, 2, and 3 levels are shown as green dots and yellow, red, and black contours, respectively. The orange squares with error bars are the permittivity parameters derived from each elliptical E0 galaxy. The figure is reproduced from Figure 9 in [49]. Credit: Cesare V., Diaferio A., and Matsakos T., A&A, 657, A133, 2022, reproduced with permission © ESO.
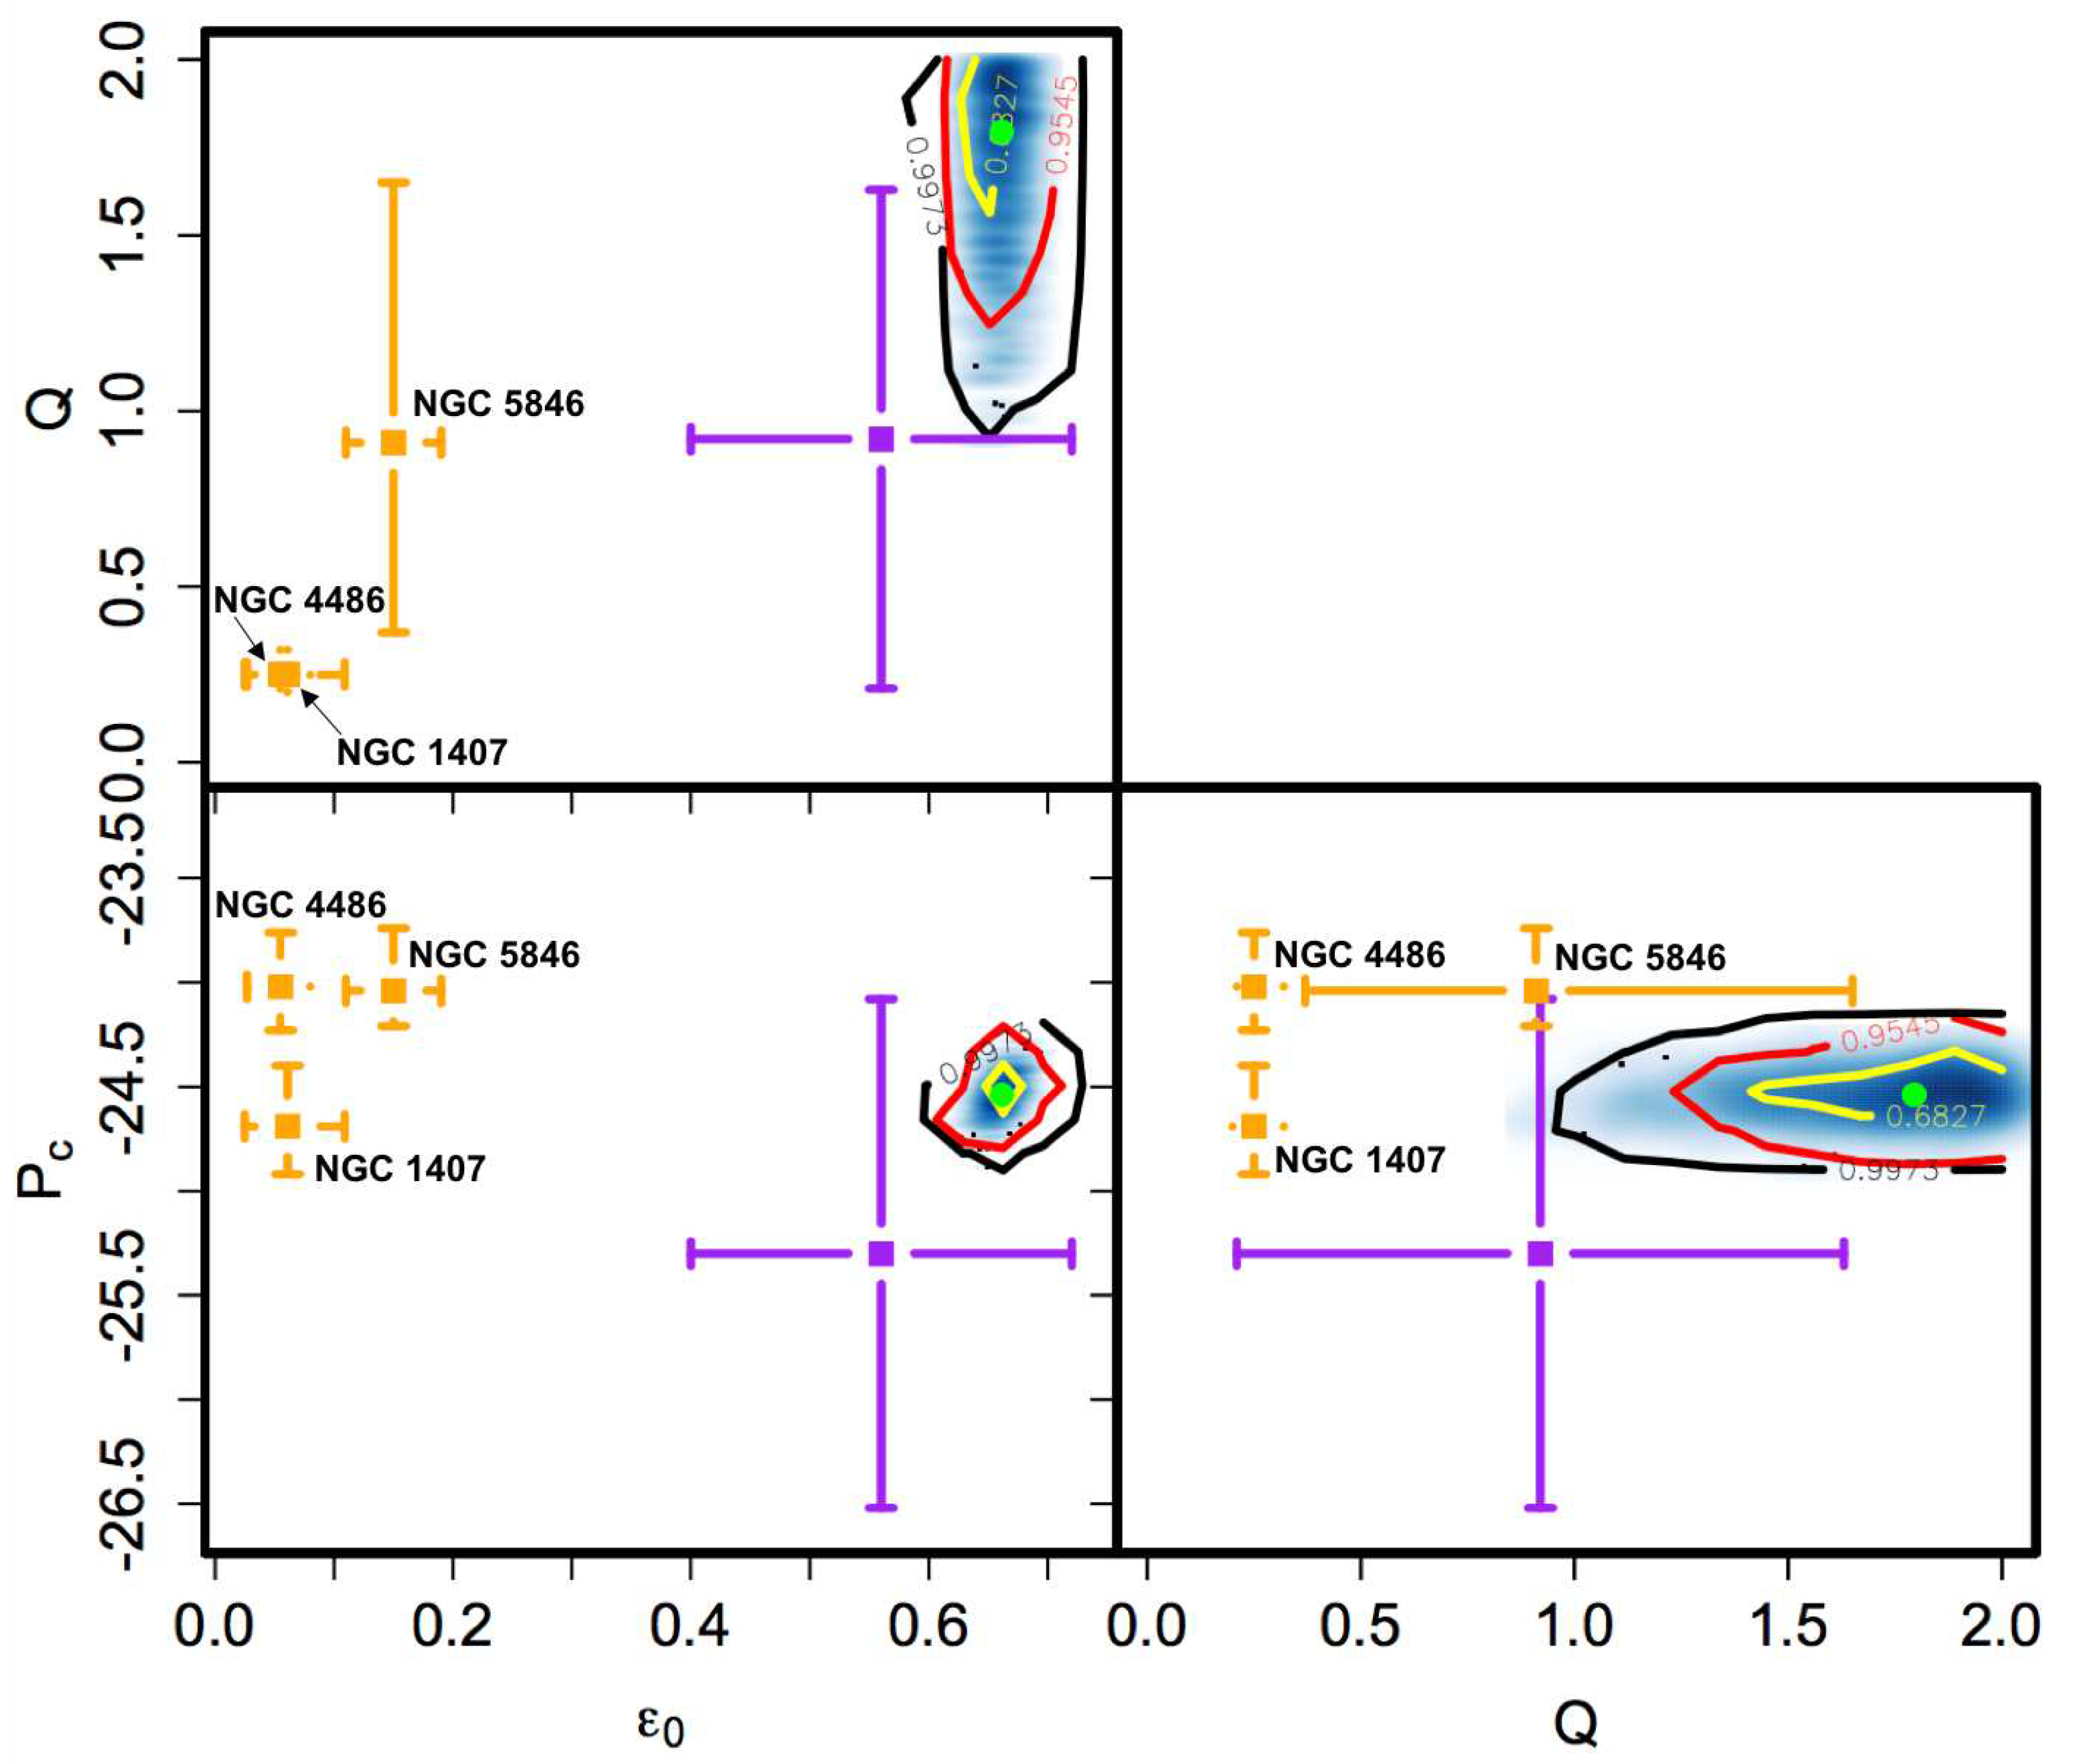
Figure 5.
RAR models calculated with RG (blue solid lines) with the parameters obtained from the MCMC analysis of the rotation curves and vertical velocity dispersion profiles of each galaxy at the same time, superimposed to the RAR of the DMS data (red points with error bars). The black solid line is the RAR fitting relation (Equation (19)) obtained by McGaugh, et al. [23] from SPARC galaxies and the black dashed line is the relation, plotted as references. The figure is readapted from Figure 11 in [34]. Credit: Cesare V., Diaferio A., Matsakos T., and Angus G., A&A, 637, A70, 2020, reproduced with permission © ESO.
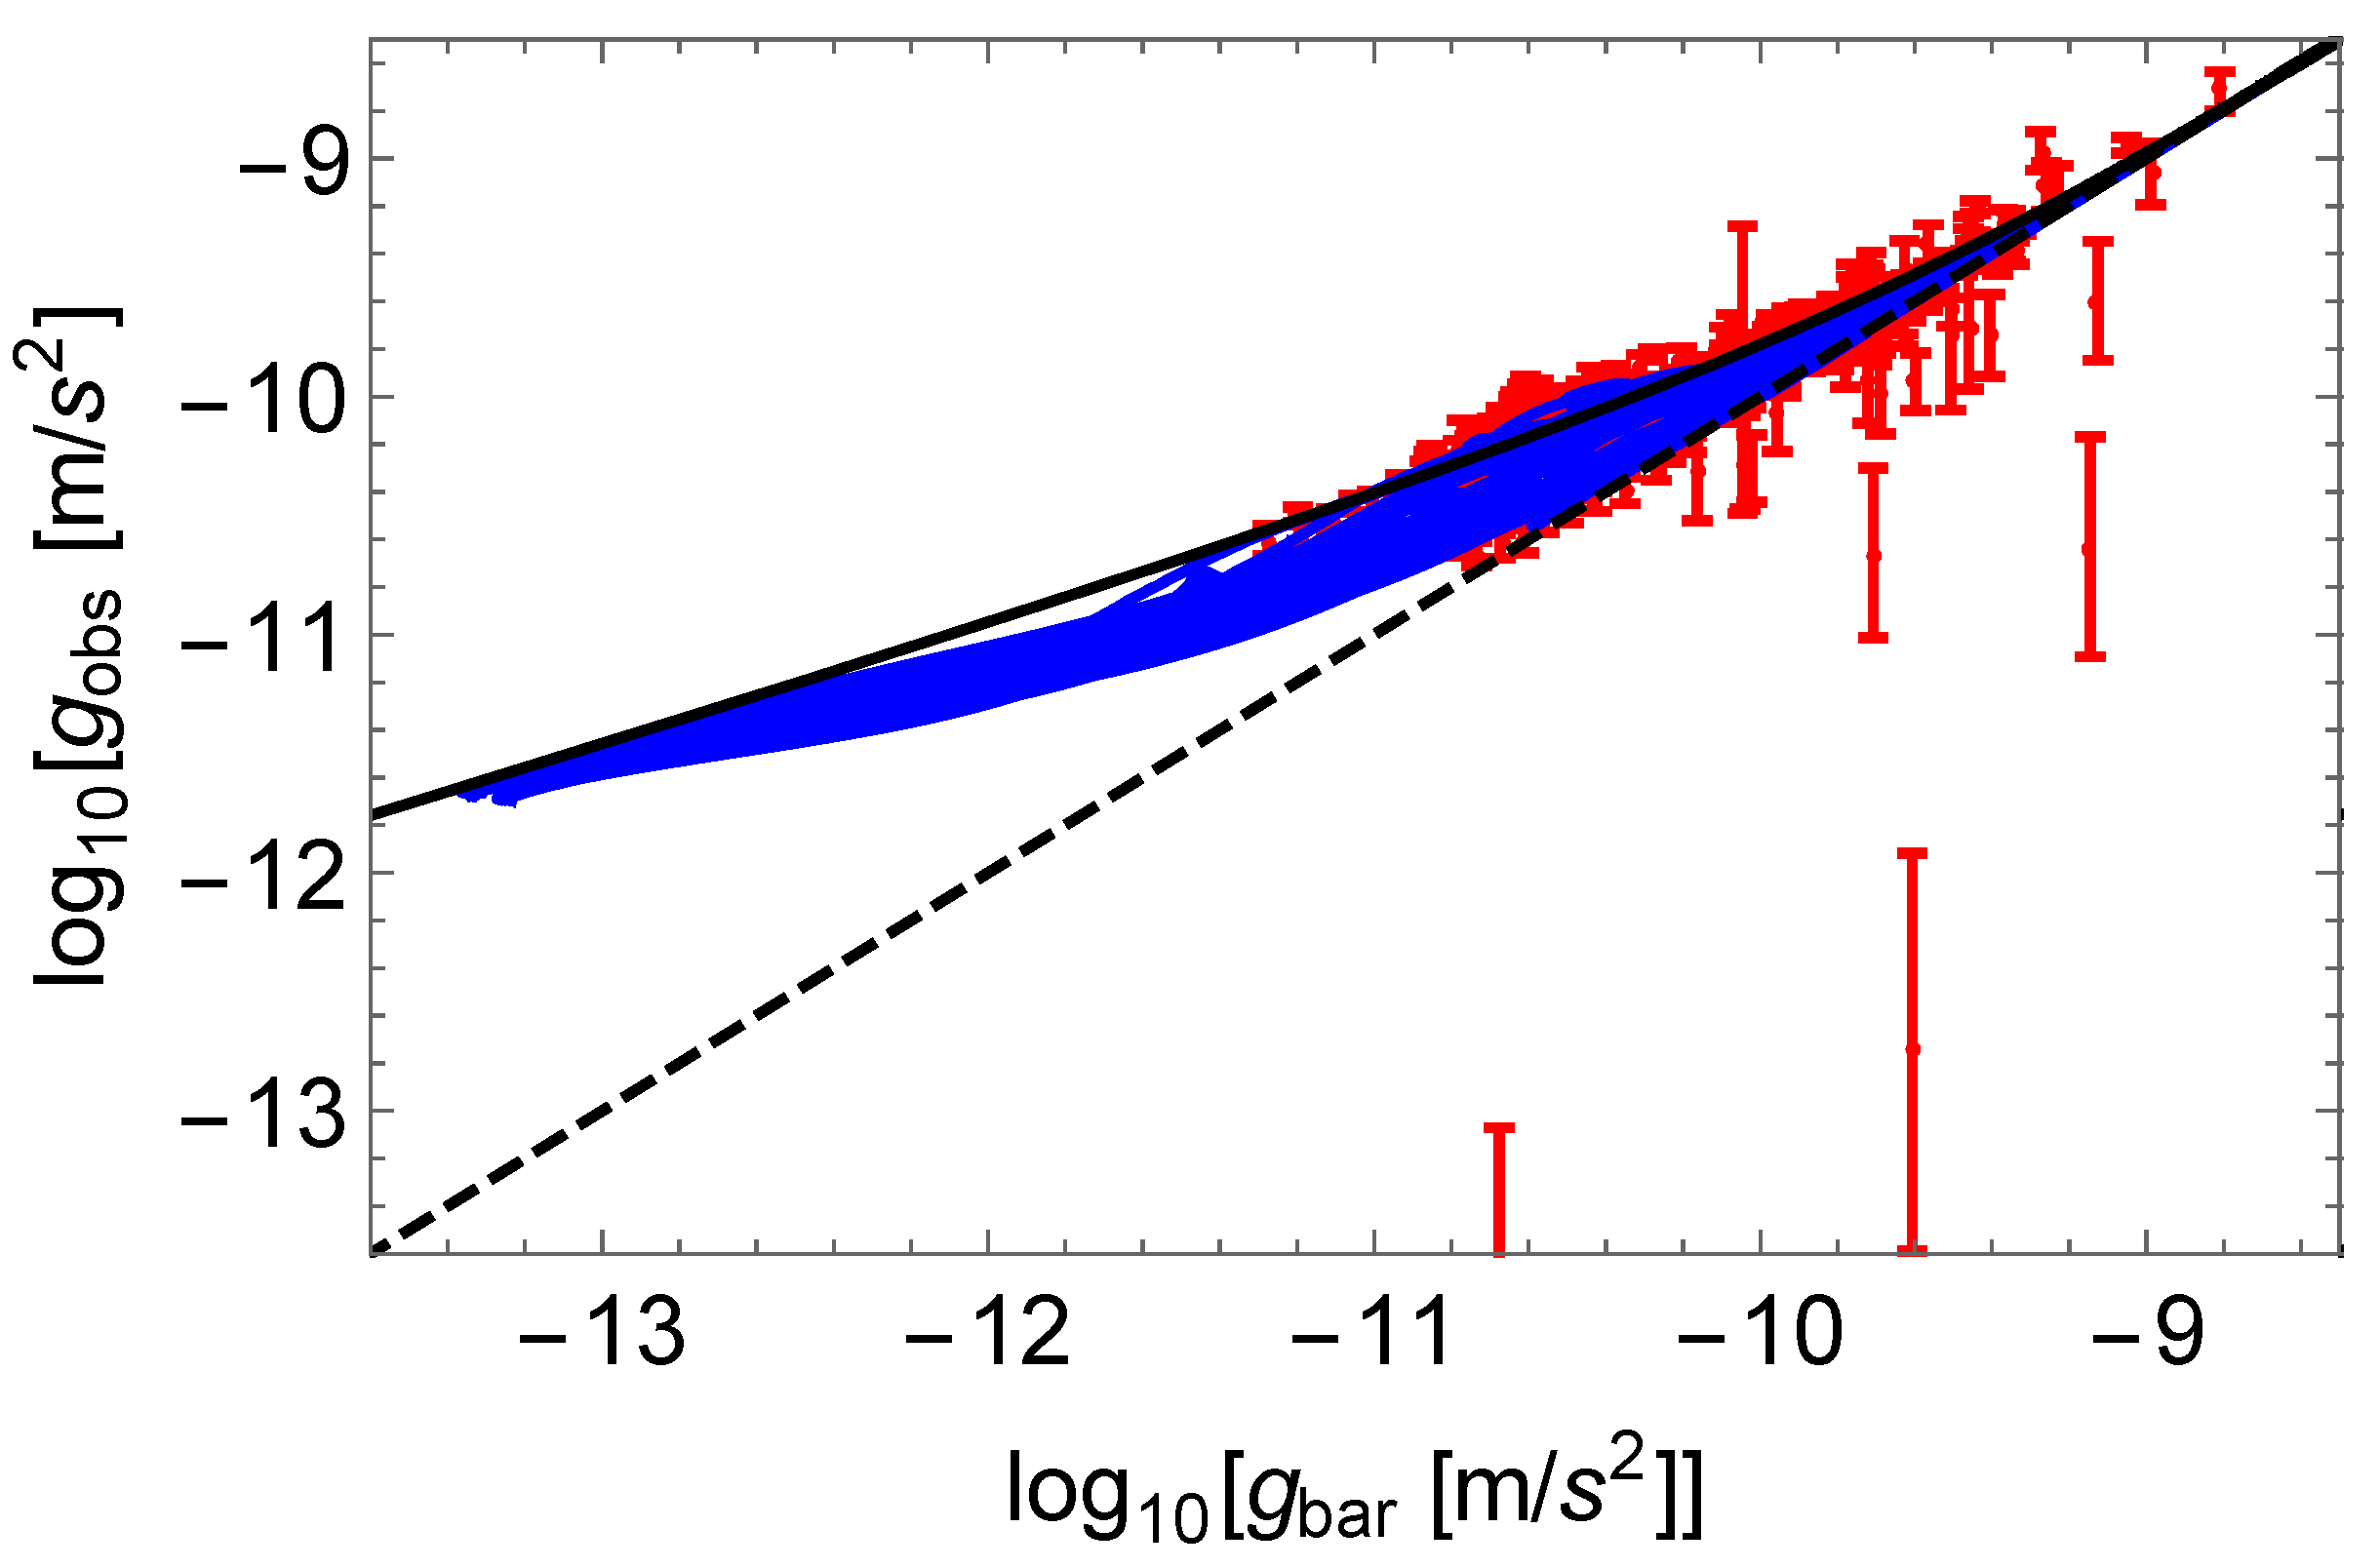
Figure 6.
Root-mean-square velocity dispersion profiles computed with RG with the parameters resulting from the MCMC analysis of [49], considering the stars, blue GCs, and red GCs kinematic profiles at the same time for each elliptical E0 galaxy. Upper panels: the green, blue, and red solid lines represent the RG models for the stars, blue GCs, and red GCs, respectively. The dashed lines with the same colours are computed with the same and parameters as the solid lines but with Newtonian gravity without DM. Lower panels: zoom-in of the upper panels for the stars alone. The black, blue, and red dots with error bars show the kinematic data for the stars, blue GCs, and red GCs, respectively. The figure is reproduced from Figure 8 in [49]. Credit: Cesare V., Diaferio A., and Matsakos T., A&A, 657, A133, 2022, reproduced with permission © ESO.
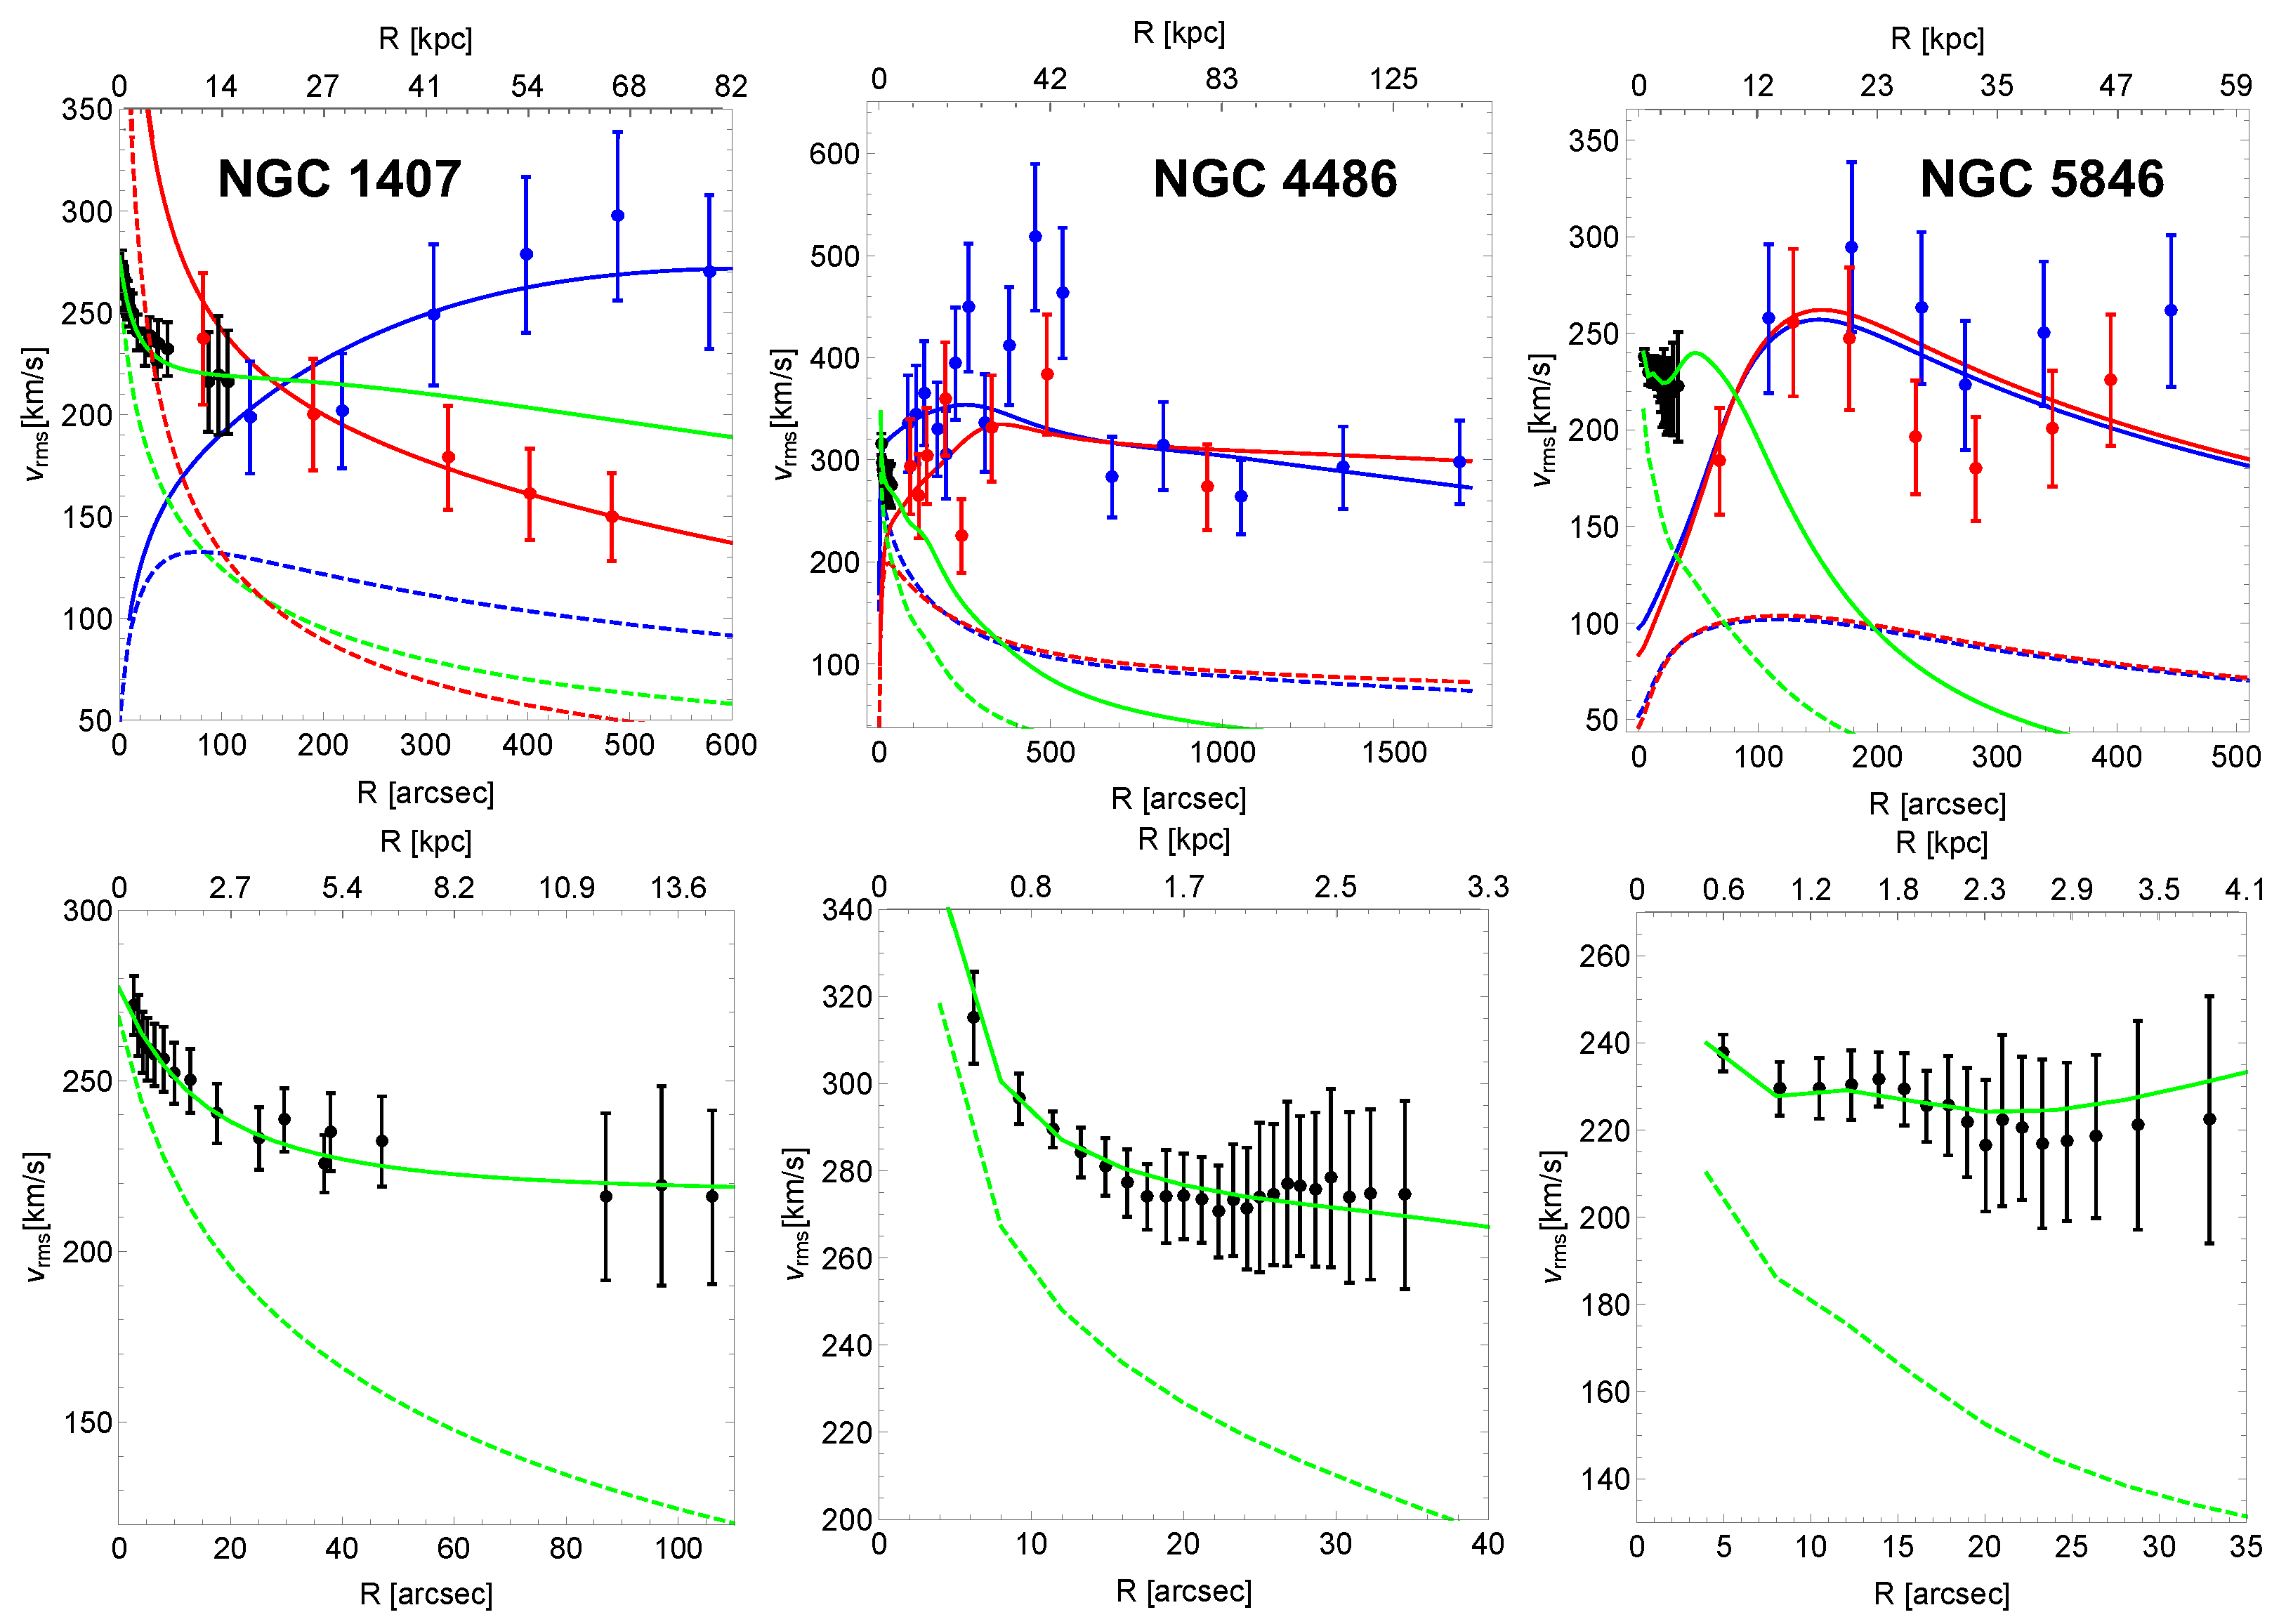
Figure 7.
Temperature radial profiles of the hot, X-ray emitting gas in the low-redshift and relaxed galaxy clusters A1991 (top panel) and A1795 (bottom panel). The solid and dashed lines are the RG and Newtonian models, respectively, and the dots with error bars are the measurements taken with Chandra satellite from [74]. A Hubble constant of km s−1 Mpc−1 is adopted. The figure is reproduced from Figure 14 in [28].
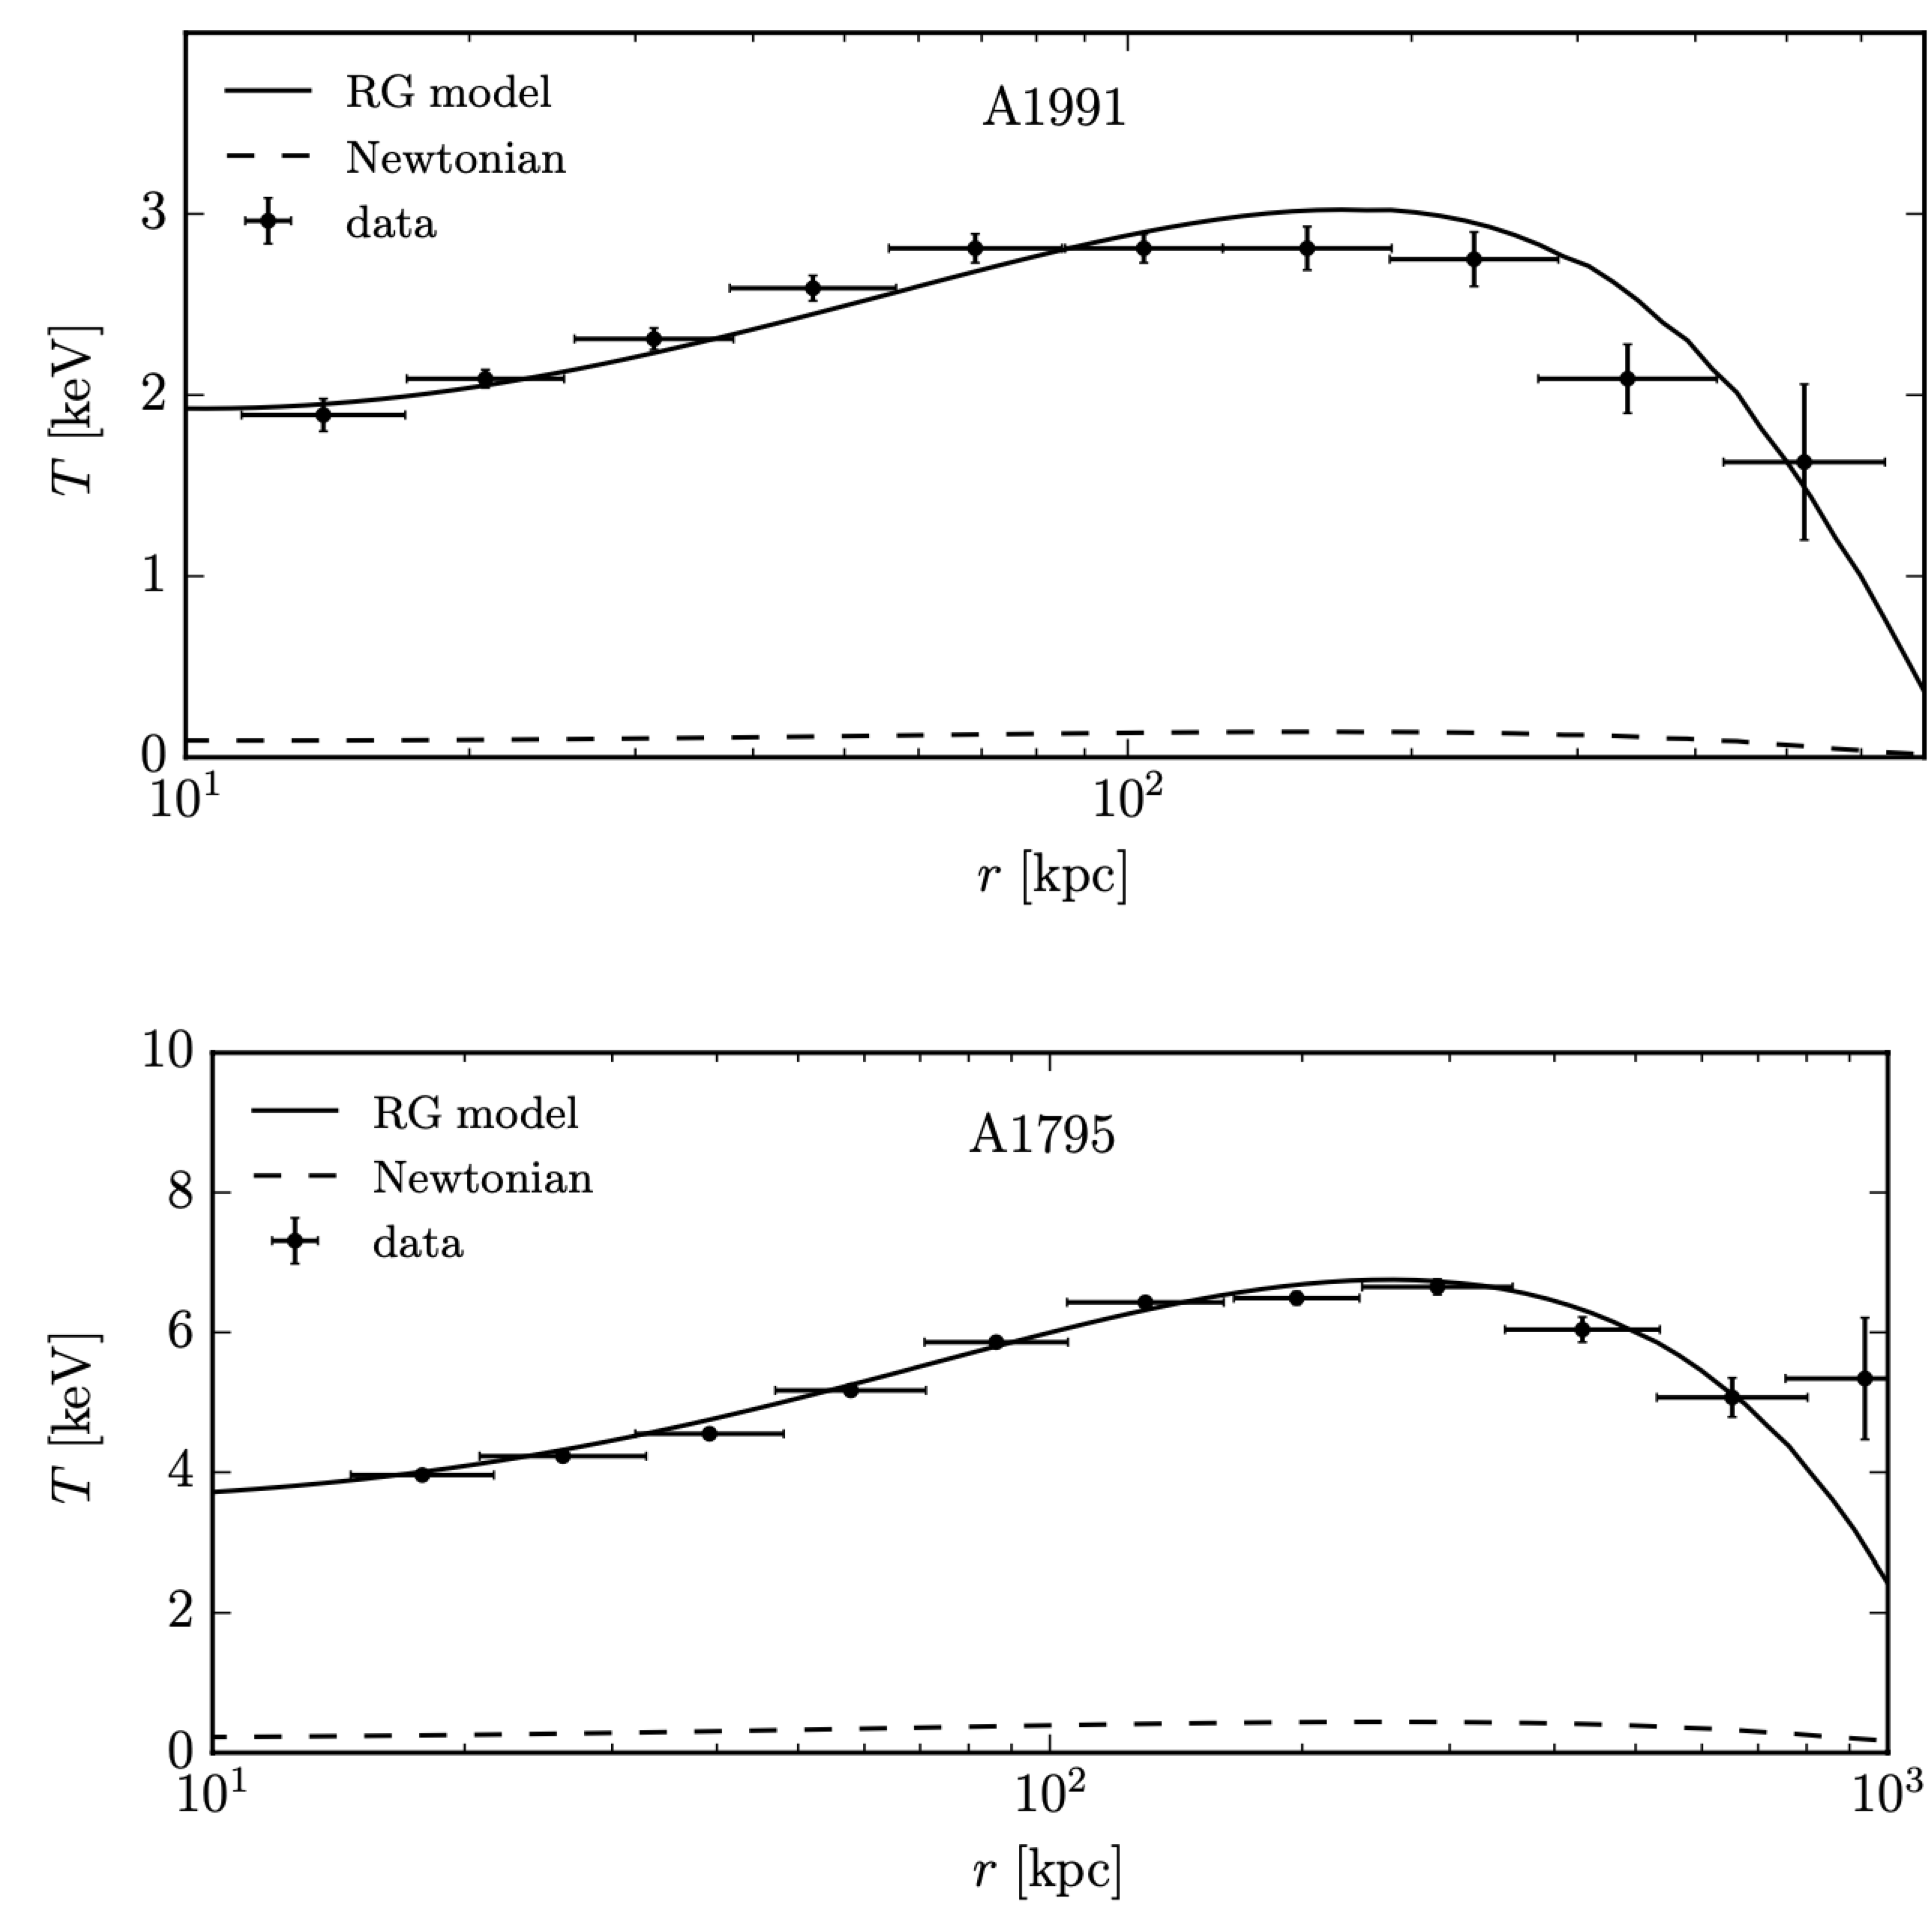
Disclaimer/Publisher’s Note: The statements, opinions and data contained in all publications are solely those of the individual author(s) and contributor(s) and not of MDPI and/or the editor(s). MDPI and/or the editor(s) disclaim responsibility for any injury to people or property resulting from any ideas, methods, instructions or products referred to in the content. |
© 2024 by the authors. Licensee MDPI, Basel, Switzerland. This article is an open access article distributed under the terms and conditions of the Creative Commons Attribution (CC BY) license (http://creativecommons.org/licenses/by/4.0/).
Copyright: This open access article is published under a Creative Commons CC BY 4.0 license, which permit the free download, distribution, and reuse, provided that the author and preprint are cited in any reuse.
Submitted:
31 January 2024
Posted:
01 February 2024
You are already at the latest version
Alerts
A peer-reviewed article of this preprint also exists.
This version is not peer-reviewed
Submitted:
31 January 2024
Posted:
01 February 2024
You are already at the latest version
Alerts
Abstract
If visible matter alone is present in the Universe, General Relativity (GR) and its Newtonian weak field limit cannot explain several pieces of evidence, from the largest to the smallest scales. The most investigated solution is the cosmological model ΛCDM, where GR is valid and two dark components are introduced, dark energy and dark matter, to explain the ∼70% and ∼25% of the mass-energy budget of the Universe, respectively. An alternative approach is provided by modified gravity theories, where a departure of the gravity law from ΛCDM is assumed and no dark components are included. This work presents refracted gravity (RG), a modified theory of gravity formulated in a classical way where the presence of DM is mimicked by a gravitational permittivity ϵ(ρ) monotonically increasing with the local mass density ρ, which causes the field lines to be refracted in small density environments. Specifically, the flatter the system the stronger the refraction effect and, thus, the larger the mass discrepancy if interpreted in Newtonian gravity. RG presented several encouraging results in modelling the dynamics of disk and elliptical galaxies and the temperature profiles of the hot X-ray emitting gas in galaxy clusters and a covariant extension of the theory seems to be promising.
Keywords:
Subject: Physical Sciences - Astronomy and Astrophysics
1. Introduction
In the Universe, several pieces of evidence cannot reconcile with General Relativity (GR), if we only assume the presence of visible (baryonic) matter. A mass discrepancy of ∼80-90% is observed from the largest scales (e.g., the cosmic microwave background (CMB) [1], the large-scale structure [2,3], gravitational lensing effects where Bullet Cluster example is worth mentioning [4,5,6], light elements abundances [7], and galaxy clusters dynamics [8]) to the smallest scales (e.g., the flat trend of disk galaxies rotation curves [9,10,11]).
The most investigated solution to explain this phenomenology is to assume the presence of a non-baryonic and cold, i.e., non-relativistic at the epoch of decoupling from radiation, form of matter which only gravitationally interacts with baryonic matter: the cold dark matter (CDM) [12]. However, the only presence of dark+baryonic matter is again not sufficient to account for all the pieces of evidence in the Universe, which suggest a further discrepancy of ∼70%. The most studied cosmological model is the CDM, which assumes GR as gravity theory and introduces two dark constituents besides visible matter: dark energy (DE) and dark matter (DM), which can explain the ∼70% and ∼25% of the mass-energy budget of the Universe. Specifically, DE is an exotic fluid with negative pressure which justifies the accelerated expansion of the Universe, as observed from the Hubble diagram of Ia Supernovae (SNaeIa) [13,14], and it can be identified with the cosmological constant .
Even if CDM can account for the majority of the observations in the Universe, it presents some problems, both on large and on small scales. On large scales, we observe the cosmological constant problem [15,16], the coincidence problem [17], and the tensions between the values of some cosmological parameters measured from probes of the late and the early Universe [1,18,19]. On small scales, we observe several discrepancies between CDM simulations and observations. These generate the cusp/core, missing satellites, too-big-to-fail, and planes of satellite galaxies problems (e.g., see [20,21] for a review).
It is remarkable to cite also the presence of some observed regularities on galaxy scale which are hard to explain in a CDM paradigm, where a stochastic merging process of structures is invoked. Some of these regularities are very tight scaling relations between a property of the dark matter and of the baryonic matter in galaxies, which might be counter-intuitive since DM represents the ∼90% of the galaxy content, whereas baryonic matter only represents its ∼10%. Among these relations, we can mention (1) the Baryonic Tully-Fisher Relation [22], (2) the Mass Discrepancy-Acceleration Relation [23], and (3) the Radial Acceleration Relation [24]. The three relations see the emergence of the same acceleration scale m s−2, which, if expressed in natural units, is , suggesting a connection between the DM and the DE sectors. These coincidences are even less intuitive in a CDM context.
An alternative way to explain these discrepancies or regularities is provided by alternative theories of gravity, without the addition of any dark constituent. One of the most investigated modified theories of gravity formulated in a nonrelativistic ways is MOdified Newtonian Dynamics (MOND) [25,26,27]. MOND assumes a modification of the law of gravity dependent on the value of the background acceleration: when its value goes below the acceleration scale , the gravitational field departs from Newtonian gravity, being subjected to a boost that mimics the effect of DM. MOND not only explains more intuitively but actually predicted several aspects of the dynamics of galaxies, such as, the flatness of the rotation curves of disk galaxies and the three mentioned scaling relations.
Matsakos and Diaferio [28] proposed in 2016 a different approach. They formulated Refracted Gravity (RG), a classical modified theory of gravity which does not assume the presence of DM and is regulated by the value of the local mass density , rather than of the acceleration a. The Poisson equation of RG is modified at first member by the presence of the gravitational permittivity, , a monotonic increasing function of which boosts the gravitational field in regions where the density goes below a critical value, reproducing the effect of DM in Newtonian gravity. A covariant version of RG was recently formulated [29] and it seems to describe both the DE and DM sectors with a single scalar field and to reproduce the the Hubble diagram of SNaeIa.
RG has obtained some encouraging results in modelling the dynamics of galaxies and galaxy clusters, and on the covariant side. The paper develops as follows. Section 2 describes RG theory. Section 3, Section 4, Section 5, and Section 6 recap the main analyses and results obtained with RG in the field of disk galaxies, elliptical galaxies, galaxy clusters, and covariant RG, respectively. Section 7 discusses the future projects of RG and concludes the paper.
2. Refracted Gravity
Refracted Gravity (RG) is a theory of modified gravity formulated in a classical way, which can be interpreted in analogy to electrodynamics in matter [28]: as an electric field line suffers a change both in direction and in magnitude when it crosses a dielectric medium with a nonuniform permittivity, a gravitational field line suffers the same changes when it passes from a high-density to a low-density environment. This behaviour of the gravitational field is encoded in this modified Poisson equation:
where is the gravitational potential and is the gravitational permittivity. The following asymptotic limits are adopted for the gravitational permittivity:
where and are the gravitational permittivity in vacuum and the critical density, respectively, two of the three free parameters of the theory. When , Newtonian Poisson equation is recovered:
whereas, when , we are in fully RG regime.
Differently from MOND, the RG gravitational field has a different behaviour for spherical and flat systems. For spherical systems, the RG Poisson equation (Equation (1)) reduces to:
where is the mass of the spherical system enclosed within the spherical radius r and is Newtonian gravitational field. In this case, the RG field direction and r-dependence remain Newtonian and the RG field magnitude increases compared to the Newtonian one where , i.e., where (right panels of Figure 1).
The analogy with electrodynamics in matter, i.e., the refraction of the field lines where the density decreases, is observed for flattened systems. Expanding the left-hand side of Equation (1), we obtain:
In this configuration, the RG field depends both on the density (second term in the left-hand side of Equation (5)), as for spherical systems, and on its gradient (first term in the left-hand side of Equation (5)). In particular, the term “” is different from zero in non-spherical configurations and causes the field lines to refract. The acceleration boost in the external regions of disk galaxies that in Newtonian gravity is explained by the presence of DM, in RG is explained by the refraction of the field lines toward the equatorial plane of the disk caused by the low-density regions above and below the disk plane (left panels of Figure 1). Following Equation (5), RG predicts that the flatter the system, the larger the mass discrepancy if interpreted in Newtonian gravity. This might explain a positive correlation between ellipticity and DM content of elliptical galaxies [30,31] and the different DM quantity of globular clusters and dwarf galaxies, where the former are nearly spherical and DM-free (e.g., [32]) and the latter are flatter and one of the darkest objects in the Universe (e.g., [33]).
Where in flat systems, e.g., in the outskirts of disk galaxies, the gravitational field assumes the asymptotic trend , where is the MOND critical acceleration set by the normalization of the BTFR:
where is the asymptotic value of the flat part of the rotation curve of disk galaxies and M is the total baryonic mass of the disk galaxy. In this regime, the RG field trend deviates from the Newtonian inverse square law. This asymptotic limit coincides with MOND asymptotic limit for the gravitational field where , which might indicate that RG shares the majority of MOND successes on galaxy scale. The difference between RG and MOND is better observed in spherical systems, where the field trend in RG is Newtonian () where , preserving the Gauss theorem, but the field trend in MOND is where , as in flattened systems.
Different functions can be adopted for the gravitational permittivity, such that it accomplishes the asymptotic limits of Equation (2). For all the analyses performed with RG, the following smooth step function of the mass density was employed:
represented in Figure 2. Besides and , a third free parameter, Q, is present in RG, where Q regulates the steepness of the transition between the two asymptotic limits of Equation (2). In Figure 2, Equation (7) is represented for three values of Q, showing that the larger its value, the steeper the transition between the two asymptotic regimes of Equation (2). The three RG free parameters are supposed to be universal.
3. Dynamics of disk galaxies
Matsakos and Diaferio [28] presented some preliminary encouraging results, according to which RG properly models the BTFR of galaxies (Equation (6)) and the rotation curves of the high-surface brigthness (HSB) disk galaxy NGC6946 and low-surface brightness (LSB) disk galaxy NGC1560. Cesare et al. [34] demonstrated that RG can properly model the dynamics of disk galaxies. For their analysis, they considered the rotation curves and the vertical velocity dispersion radial profiles of 30 disk galaxies in the DiskMass Survey (DMS) [35] at low redshift. They chose this sample since these galaxies are close to face-on, which allowed the measurement of both their rotation curves and vertical velocity dispersions. In this way, Cesare et al. [34] could obtain a single constraint of the RG parameters from two kinematic profiles taken at the same time rather than from the rotation curves alone, which provided a more robust analysis. These results are also summarised in [36].
Cesare et al. [34] modelled with RG (1) the rotation curves alone of each DMS galaxy, (2) the rotation curves and the vertical velocity dispersions at the same time of each DMS galaxy, (3) the rotation curves and the vertical velocity dispersions of all the 30 DMS galaxies at the same time, and (4) the RAR of DMS galaxies.
3.1. Mass model
Cesare et al. [34] modelled the baryonic mass density profile , which generates the total gravitational potential since DM is not present, with (1) an axisymmetric exponential disk for the stars, (2) a spherical stellar bulge, and (3) two razor-thin disks for the atomic and molecular gas. The 3D mass density of the stellar disk is modelled with an exponential profile of this kind:
where is the surface brightness radial profile of the stellar disk, R and z are the cylindrical coordinates (R is the radius projected on the sky, oriented along the major axis of the disk and z is the vertical coordinate, oriented perpendicular to the disk equatorial plane), and and are the stellar mass-to-light ratio and the disk scale height, two of the five free parameters of the dynamic model adopted by [34].
The surface brightness of the disk is modelled with a linear interpolation of the measured surface brightness data, to catch the specific features of the luminous matter distribution, which generally correspond to features in the rotation curve, following the “Renzo’s rule” [37]. The disk surface brightness in the innermost galaxy regions, where the bulge is dominant, is modelled with an exponential profile [38,39],
obtained by fitting the surface brightness points of the outermost stellar disk, where the stellar disk alone dominates.
DMS galaxies are disk-dominated, being the stellar disk-over-stellar bulge total luminosity ratio around . For this reason, the bulge was approximated as a sphere, introducing negligible systematic errors. The 3D mass density of the bulge is modelled with this Abel integral:
where is the surface brightness radial profile of the bulge, and
is the 3D radius. Being the bulge contribution subdominant, Cesare, et al. [34] assumed the mass-to-light ratio of the bulge equal to the mass-to-light ratio of the disk, , without introducing an additional degree of freedom. They modelled the surface brightness of the bulge with a Sérsic spherical profile [40]:
To account for the seeing, which is not negligible since the measurements where taken from the ground with the 3.5 m diameter Calar Alto Observatory, they modelled the observed surface brightness of the bulge with Equation (12) convolved with a Gaussian point spread function.
The 3D mass density of the atomic and molecular gas are modelled with two razor-thin disks:
and
where and are the surface mass densities of the atomic and molecular gas, respectively, which Cesare, et al. [34] modelled with a linear interpolation of the data for the same reason as the stellar disk, and is the Dirac function.
3.2. Dynamical model
From the total 3D mass density profile given by Equation (15), Cesare et al. [34] derived the RG gravitational potential by solving the RG Poisson equation (1). To solve the RG Poisson equation, they used an iterative Poisson solver based on the Successive-Over-Relaxation method, given by combining the Jacobi and Gauss-Seidel methods [41]. From the RG potential, they derived the models for the rotation curve, , and the vertical velocity dispersion radial profile, :
and
where Equation (17) is the vertical velocity dispersion for a vertically-decreasing exponential disk whose density follows Equation (8).
The dynamical model has five free parameters: the stellar mass-to-light ratio , the stellar disk scale height , and the three RG parameters, , Q, and . They estimated the free parameters of the model firstly from the rotation curve alone of each galaxy and then from the rotation curve and the vertical velocity dispersion taken at the same time of each galaxy with a Monte Carlo-Markov Chain (MCMC) algorithm with Metropolis-Hastings acceptance criterion. They adopted the following priors for the free parameters of the model. For , they adopted a Gaussian prior based on the stellar population synthesis (SPS) model of Bell and de Jong [42], keeping into account that the surface brightness is measured in the K-band, where the Gaussian tail for was set to 0. For , they adopted a Gaussian prior peaked on , a scale height obtained with the following relation, derived from a combined sample of 60 edge-on late-type galaxies by Bershady, et al. [43]:
where the term indicates the ∼25% intrinsic scatter. Estimating was essential to have a comparison reference for DMS galaxies where, due to their nearly face-on configuration, their cannot be directly measured. For the three RG parameters, they adopted a flat prior in the following intervals: for , for Q, and for .
3.3. Results
RG models the kinematic profiles of DMS galaxies with sensible parameters. Figure 3 shows the RG models (blue solid lines) of the rotation curves (panels (a) and (b)) and the vertical velocity dispersion profiles (panels (c)) against the DMS data (red dots with error bars) for three DMS galaxies (UGC 3091, UGC 3701, and UGC 4256). The blue curves for the rotation curves in panels (a) are computed with the parameters estimated from the rotation curves of each galaxy alone. The blue curves for the rotation curves in panels (b) are computed with the parameters found by modelling the rotation curves and the vertical velocity dispersion profiles of each galaxy at the same time. In panels (c), the cyan solid lines are the RG vertical velocity dispersions calculated with the same parameters as the blue curves but with disk-scale heights set equal to (Equation (18)). In all panels, the dashed magenta vertical lines identify the bulge effective radius ( in Equation (12)), and the dashed green vertical lines represent the bulge radius adopted in the disk-bulge decomposition for the surface brightness modelling (see Section 3.1). We can see that RG properly models both kinematic profiles and that the substructures of the rotation curves are properly reproduced following the Renzo’s rule (see Section 3.1).
Both in the only-rotation curve and in the combined rotation curve + vertical velocity dispersion analyses, Cesare, et al. [34] found mass-to-light ratios consistent with the SPS model of Bell and de Jong [42]. In the only-rotation curve analysis, the estimated were generally consistent with the derived from Equation (18). Instead, in the combined analysis, the estimated systematically resulted smaller than the correspondent . Angus, et al. [44] found a similar result by modelling the DMS galaxies with QUMOND theory [45], a modified gravity version of MOND theory. Yet, this result seems not to indicate a flaw in the two modified theories of gravity but, instead, an observational bias. Indeed, the disk scale height found by Cesare, et al. [34] and by Angus, et al. [44] was estimated from the vertical velocity dispersions, which are measured with spectroscopy from a signal derived from a mixed stellar population of young and old stars, where the signal from the young population is dominant [46]. The young stellar population distributes in a disk thinner and with a smaller vertical velocity dispersion than the old stellar population [46]. Instead, the disk scale heights of edge-on galaxies, from which Equation (18) is derived to determine , are directly measured from near-Infrared photometry, whose signal is dominated by the old stellar population [46], having higher and than the young stellar population. It is possible to simulate the vertical velocity dispersion of the old stellar population by artificially increasing the vertical velocity dispersion of the young stellar population by a proper factor. Cesare et al. [34] computed this factor which resulted equal to , in agreement with the work of Aniyan, et al. [46]. Cesare et al. [34] artificially increased of this factor the vertical velocity dispersions of five DMS galaxies, obtaining disk scale heights in agreement with the correspondent .
The three RG parameters derived from the rotation curves and the vertical velocity dispersions of each galaxy are in agreement with each other: their average errors are larger than the standard deviation of their distribution. This suggests their universality, as should be from the theory formulation. To better test their universality, Cesare, et al. [34] estimated a unique combination of RG free parameters from the two kinematic profiles of all the 30 galaxies taken at the same time, to verify their agreement with the average of the RG parameters found from the rotation curves and the vertical velocity dispersions of each galaxy. The mean RG parameters derived from the single galaxies with their mean errors are , , (purple squares with error bars in Figure 4), whereas the unique combination of free parameters is , , , where their estimates and error bars are the medians (green dots in Figure 4) and the and percentiles of their posterior distributions (blue shaded areas in Figure 4). In Figure 4, the yellow, red, and black contours show the 1, 2, and 3 levels. The code used to find this unique combination of RG parameters is written in C++ and parallelized with OpenMP. It is publicly available on GitHub under the name “astroMP”1 and it is described in [47,48].
The unique combination of RG parameters was found with an approximate procedure, in which the mass-to-light ratios and the disk scale heights were kept fixed to the values found from the single galaxies. The fact that this unique combination of free parameters provides a limited worsening of the agreement between the RG models and the kinematic data and that the unique , Q, and agree with the correspondent RG parameters estimated from the single galaxies within , , and , respectively, further enforces the hypothesis of the universality of these parameters. With a proper exploration of the 63-dimensional parameter space for this galaxy sample (one and one for each of the 30 galaxies and three RG parameters for all the galaxies), a better consistency between model and measurements and a more precise estimate of the unique combination of RG parameters might be achieved.
With the parameters obtained from the two kinematic profiles of each galaxy, Cesare, et al. [34] also modelled the RAR of the DMS galaxies. McGaugh, et al. [24] fitted the RAR of 153 edge-on disk galaxies in the SPARC sample [50] with this relation:
where is the observed centripetal acceleration derived from the measured rotation curve ,
is the Newtonian acceleration due to baryonic matter alone, and is the only free parameter of the model. This relation properly interpolated the SPARC data with m s−2, which agrees with the MOND acceleration scale within 1.
The RG models of the RAR for the DMS galaxies (blue solid lines in Figure 5) properly interpolate the measured RAR of the DMS data (red dots with error bars in Figure 5) and reproduce the asymptotic limits of Equation (19). However, RG reproduces the RAR of DMS galaxies with a too large intrinsic scatter ( dex vs dex as found by Li et al. [51] from SPARC galaxies) and with residuals strongly correlated, at largely more than 5, with some galaxy properties dependent on the distance from the galaxies centre, apparently at odds with the results found by Lelli et al. [52] with SPARC galaxies. Yet, this problem requires further investigation since also the RAR of DMS galaxies presents some, although weaker, correlations between its residuals from Equation (19) and some galaxy properties. A galaxy sample such as the DMS, made of only 30 galaxies and where the galaxies are close to face-on and, thus, rotation curves might not be so accurately measured, might not be particularly suitable to investigate the RAR but a larger sample of edge-on disk galaxies, such as SPARC, should be considered for further analyses.
4. Dynamics of Elliptical Galaxies
In addition to the dynamics of flat systems (disk galaxies), RG has also been tested on the dynamics of spherical systems. To test RG for this class of systems, Cesare, et al. [49] considered a sample of three nearby massive E0 elliptical galaxies, NGC 1407, NGC 4486 (better known ad M87), and NGC 5846, belonging to the SLUGGS survey [53,54,55], a spectrophotometric survey of more than 4000 extragalactic GCs around 27 early-type galaxies at low redshift. This test was essential to verify whether the boost of the gravitational field can be determined by the gravitational permittivity alone, without any dependence on the refraction of the RG gravitational field lines. The results of this work are also summarised in [36].
Since NGC 1407, NGC 4486, and NGC 5846 have a minor-to-major axis ratio q of , , and , and, consequently, an ellipticity of , , and , they can be approximated as spherical systems. Cesare, et al. [49] chose these galaxies since the kinematic information of SLUGGS galaxies was measured up to their most external regions (≳10 effective radii), where Newonian gravity does not work anymore unless DM is present and the viability of RG could, thus, be tested. It was possible to measure these extended kinematic profiles thanks to GCs, which are present in these galaxy regions. In general, the measurement of the kinematic information in the external regions of elliptical galaxies can be uniquely done thanks to the presence of kinematic tracers, such as X-ray emitting gas [56], planetary nebulae [57] and GCs [53], which settle in the galaxies outskirts. Specifically, the choice of [49] was driven by the fact that the GC population divides in two sub-populations of blue and red GCs, having different kinematic properties and formation histories. In this way, it was possible to constrain RG from two rather than one extended kinematic profile, providing a more robust test for the theory.
4.1. Mass model
Cesare et al. [49] modelled, at the same time, the root-mean-square (RMS) velocity dispersions of the stars, concentrated within about one effective radius (; the radius which encloses half galaxy luminosity), and of the blue and red GCs, distributed up to the galaxy outskirts, of each E0 galaxy. In particular, the kinematic profiles of the GCs are ∼5, ∼48, and ∼13 times more extended than the kinematic profiles of the stars in NGC 1407, NGC 4486, and NGC 5846, respectively. Cesare et al. [49] derived the model for the RMS velocity dispersion from the RG gravitational field computed with Equation (4) for spherical systems. To model the total mass enclosed within the spherical radius r present in Equation (4), Cesare et al. [49] considered the contribution of (1) the stars, (2), the X-ray emitting gas, and (3) the central super massive black hole (SMBH). The total mass of GCs only contributed ∼1% to the total galaxy mass and it was, thus, neglected in the computation of the gravitational field. However, their surface and 3D number densities were modelled, since they were needed for the dynamical model (see Section 4.2).
The quantities entering the dynamical model were differently modelled for the three galaxies. The surface brightness of the stars of NGC 1407, measured in the B-band [58], was modelled with a Sérsic profile of this kind, with parameters from [53]:
where
is such that half of the total luminosity of the stars is enclosed within 1 . The circularised radius R is given for every galaxy by:
where and are coordinates oriented along the major and minor axes of the galaxies.
Integrating Equation (21) with the Abel integral below yields the 3D luminosity density distribution for the stars of NGC 1407:
and integrating Equation (24) in spherical coordinates yields its cumulative stellar luminosity profile:
For the surface brightness of the stars of NGC 4486 and NGC 5846, measured in the r-band [59], Cesare, et al. [49] adopted a Multi-Gaussian Expansion (MGE) model in a spherical configuration, with the parameters of [59]:
The 3D luminosity density distribution of the stars of NGC 4486 and NGC 5846 is given by
and their cumulative luminosity stellar profile is obtained by Equation (25), where is Equation (27). The cumulative mass profile of the stars, , is obtained by:
where is Equation (25) and is the stellar mass-to-light ratio, one of the seven free parameters of the dynamical model.
The 2D number density profiles of the blue and red GCs in NGC 1407 and NGC 5846 are modelled with a Sérsic profile of this kind:
where Cesare, et al. [49] adopted the parameters of [58] for NGC 1407 and estimated the parameters from the data of [53] with a MCMC, for NGC 5846. For NGC 4486, they adopted a different parametrisation:
with the parameters of [60]. The 3D number density profiles are obtained by integrating Equations (29) and (30) with the Abel integral:
Cesare, et al. [49] modelled the mass density profile of the gas of NGC 1407 and NGC 5846 using the two- functional form:
with the parameters of [61], for NGC 1407, and estimating the parameters from the data of [62] with a MCMC for NGC 5846. In Equation (32), and kg are the mean molecular weight and the atomic unit mass, respectively. For NGC 4486, they adopted this profile with the parameters of [63]:
The cumulative mass density profile of the gas, , is obtained by integrating in spherical coordinates from Equation (32), for NGC 1407 and NGC 5846, and Equation (33), for NGC 4486:
The central SMBH was modelled as a point mass with values of , , and for NGC 1407, NGC 4486, and NGC 5846, respectively, obtained from [64]. Therefore, the cumulative mass profile of the SMBH for each galaxy is a constant given by:
4.2. Dynamical model
Cesare, et al. [49] modelled the RMS velocity dispersion profiles of each kinematic tracer, stars, blue GCs, and red GC, with this solution of the spherical Jeans equations [58,65,66,67]:
where (1) indicates the tracer, (2) is either the surface brightness of the stars (Equations (21) or (26)) or the 2D number density of the GCs (Equations (29) or (30)), (3) is either the 3D luminosity density of the stars (Equations (24) or (27)) or the 3D number density of the GCs (Equation (31)), (4) is the gravitational potential and, thus, is the gravitational field (Equation (4)), (5) R is the 2D radius (Equation (23)), (6) r is the 3D spherical radius, (7) is the orbital anysotropy parameter, where and are the tangential and the radial velocity dispersions, and (8) K is the kernel:
given by Equation (A16) of [66], where is the Euler gamma function and is the incomplete beta function. The orbital anisotropy parameters , , are three of the seven free parameters of the dynamical model and they are assumed to be constant with radius [68,69].
The gravitational field in Equation (36) is given by RG field in a spherical configuration (Equation (4)), and, thus, Equation (36) transforms into:
The cumulative mass profile in Equation (38) is given by the sum of the cumulative mass profiles of the stars (Equation (28)), of the gas (Equation (34)) and of the SMBH (Equation (35)):
This dynamical model has seven free parameters. Four are common to the three tracers, the stellar mass-to-light ratio , and the three RG parameters, , Q, and , entering the gravitational permittivity in Equation (38), which generate the RG gravitational potential to which every kinematic tracer is subject. Three are specific to each tracer, and they are the orbital anisotropy parameters , , and .
To explore the parameter space, Cesare, et al. [49] adopted a MCMC method based on Metropolis-Hastings acceptance criterion. They assumed a uniform prior on every free parameter. For , the uniform prior is based on the SPS models of Humphrey et al. [70] and Zhang et al. [61], for NGC 1407, and of Bell et al. [71] and Zibetti et al. [72], for NGC 4486 and NGC 5846. The space of the three RG free parameters was explored in the ranges of , , and for , Q, and , respectively. At last, they explored the parameter space of the parameters , , in the uniform range of , which spans from very tangential to very radial orbits.
4.3. Results
The RG model (38) properly interpolates the kinematic profiles of the three tracers in each E0 galaxy with sensible parameters (Figure 6).
The resulting mass-to-light ratios are consistent with the corresponding SPS models and the orbital anisotropy parameters of NGC 1407 are in agreement with the literature [58]. The RG parameters are consistent among the three galaxies within 2, which supports their universality (orange squares with error bars in Figure 4). The mean of the values resulting from the three single galaxies are , , and . To better check their universality, Cesare, et al. [49] compared these values with the mean and the unique combinations of RG parameters resulting from the DMS, , , (purple squares with error bars in Figure 4), and , , (green dots with blue shaded posterior distributions in Figure 4). The RG parameters derived from the elliptical galaxies are consistent with the mean combination obtained in the DMS: Q and within 1 and within 3. The parameters Q and from the E0 galaxies are also in agreement with the unique values from the DMS, within and , respectively. Instead, the parameter presents a tension.
The reasons for the tension can be multiple. A first possible reason could be due to the approximate procedure with which the unique combination of RG parameters in the DMS was derived. A limited freedom was given to this unique combination of parameters to vary, since the mass parameters, and , were constrained to the values derived from a previous analysis and this led to a very small width of the posterior distribution of (see the light blue shaded area and yellow, red, and black contours in the bottom-left panel of Figure 4). As said in Section 3.3, a more complete analysis could be performed by exploring the 63 parameter space of the mass parameters and the three RG parameters in the DMS.
If, instead, the posterior distribution of is not particularly underestimated, other reasons could EXPLAIN the discrepancy, such as, a too approximated model for the elliptical galaxies, a wrong functional form for the gravitational permittivity , or, a fundamental problem of RG. One of the approximations introduced in the analysis of elliptical galaxies was to consider these systems as isolated, whereas these kind of galaxies typically live in dense environments. Specifically, NGC 1407 and NGC 5846 settle within galaxy groups and NGC 4486 is the central galaxy of the Virgo cluster. Differently from Newtonian gravity, the RG gravitational field of a system, as MOND gravitational field, depends on the gravitational field produced by the environment where this system settles. Therefore, this environmental effect might explain, in part or entirely, the inconsistency between the s. Another approximation adopted in modelling the elliptical galaxies was to neglect their net rotation, although these three galaxies are slow rotators [49]. Moreover, or in alternative, the functional form of the gravitational permittivity (Equation (7)) might not be suitable, in particular in the low-density regime, and a more precise answer in this sense might be given by the weak-field limit (WFL) of the covariant formulation of RG [29]. If all these reasons will not be able to alleviate the tension, this might be due to a fault in the theory that needs to be fixed. To conclude, a remarkable fact is that the best agreement between the elliptical and the disk galaxies is obtained for the parameter, which sets the density scale where the transition between the Newtonian and the RG regimes occurs, as in MOND.
5. Dynamics of Galaxy Clusters
The encouraging results obtained for the dynamics of disk and elliptical galaxies suggest that RG is able to properly describe the dynamics on galaxy scale. Therefore, a class of tests at larger scale has been needed to be performed for a more complete investigation of the theory.
Some preliminary studies have already been performed by Matsakos and Diaferio [28] to study the viability of RG in modelling the hot X-ray emitting gas temperature radial profile of galaxy clusters. Matsakos and Diaferio [28] modelled the gas temperature radial profiles of two low-redshift and relaxed galaxy clusters, A1991 and A1795, with two different gas temperatures (Figure 7). Specifically, the two clusters have a spectroscopic gas temperature, averaged between 70 kpc and , of keV (A1991) and keV (A1795), where is the distance from the centre of the cluster where the average density is 500 times larger than the critical density of the Universe. These data are taken with the Chandra satellite [74]. The model that Matsakos and Diaferio [28] adopted presented different assumptions. They assumed dynamical equilibrium at every distance from the cluster centre and a spherical configuration for the density distribution, deriving the equation of hydrostatic equilibrium from the RG gravitational field obtained, in turn, from Equation (4). They also assumed the validity of the ideal-gas equation of state and the smooth step function given by Equation (7) for the gravitational permittivity with RG parameters fixed a priori and not left free to vary. In particular, they set the RG parameters to and , for A1991 and A1795, respectively, and g cm−3. At last, they assumed in A1991 the presence of a stellar component of mass M⊙ up to a distance from the cluster centre of kpc. This model resulted in agreement with the Chandra data of the two galaxy clusters.
This model is certainly simplistic and it involves a too small sample of galaxy clusters. It, therefore, certainly needs to be extended to understand if RG is able to correctly describe the gas temperature radial profiles of galaxy clusters and further tests have to be performed to investigate the capacity of RG to model the dynamics of these systems. An important test that has to be perfomed is to repeat the above analysis by constraining the RG parameters from the temperature data, and not by fixing them a priori, to verify if the obtained parameters are in agreement with the values obtained on galaxy scale, to better test their universality.
Another aspect of RG on cluster scale that Matsakos and Diaferio [28] began to explore is the gravitational interaction between galaxies in galaxy groups and clusters. These interactions are not simple to handle in RG, since the field lines in each galaxy suffer from refraction in low-density regions. A first-order analysis could be performed by assuming that the gravitational field at large distances from the centre of each galaxy decreases proportional to and that the only difference with respect to Newtonian gravity is that it is enhanced by . With these assumptions, the following expression for the BTFR would hold for galaxy groups and clusters:
where is the velocity dispersion of the galaxies in the cluster, k is the number of galaxies, m is the mass of each galaxy, A is the BTFR normalisation, and is a geometric factor that describes that, accounting for the anisotropic geometry of the RG field in disk galaxies, only a fraction of the k galaxies in the clusters will cross the plane of a specific disk galaxy where the field is . The comparison of this extended BTFR with the observed one for galaxy groups and clusters would represent another test for RG and a method to set a lower bound for and to constrain .
Figure 8.
The BTFR up to mass and velocity scales to include galaxy groups and galaxy clusters, besides galaxies. The solid line is the BTFR given by Equation (6) and the dashed line is the BTFR given by Equation (40) for . The open circles and squares represent simulated galaxies [28]. The black dots are observational data from [75,76,77]. The figure is reproduced from Figure 17 in [28].
Figure 8.
The BTFR up to mass and velocity scales to include galaxy groups and galaxy clusters, besides galaxies. The solid line is the BTFR given by Equation (6) and the dashed line is the BTFR given by Equation (40) for . The open circles and squares represent simulated galaxies [28]. The black dots are observational data from [75,76,77]. The figure is reproduced from Figure 17 in [28].
6. Covariant Refracted Gravity
A covariant version of RG was recently formulated by Sanna, et al. [29]. The fact that in RG the transition between the Newtonian and the modified gravity regimes is regulated by a scalar quantity, the mass density , rather than by a vector quantity, such as the acceleration as in MOND, made the built of a covariant extension of RG less challenging than in MOND (e.g. [78]). Some relativistic extensions of MOND, such as Tensor Vector Scalar gravity (TeVeS) [78], were formulated while presenting some problems [79,80], even if more recent results might look more promising [81,82].
Covariant refracted gravity (CRG) is formulated as a scalar tensor theory with the presence of a single scalar field, , nonminimally coupled to the metric, which accounts for the phenomenologies both of DM on galaxy scale and of DE on larger scales, i.e., explaining the accelerated cosmic expansion. This peculiar feature of a unified dark sector is shared by a restricted class of modified theories of gravity (e.g., [83,84,85,86,87,88,89,90,91,92,93,94,95]), and is suggested by the observed intriguing coincidence [29] (see Section 1).
The general action of scalar-tensor theories is:
where the functional forms of the self-interaction potential and the general differentiable function of the scalar field define a specific scalar-tensor theory. For CRG, and are:
and
where is a constant. Replacing Equations (42) and (43) in Equation (41), the CRG action becomes:
In the WFL of the theory, the scalar field results to be twice the gravitational permittivity . Indeed, the WFL of CRG yields the original classical formulation of RG:
which is RG Poisson equation (Equation (1)) if . This result confirms that the scalar field mimics the phenomenology of DM on galaxy scale.
The fact that in RG the modification of the law of gravity depends on a density rather than on an acceleration scale might be less intuitive, since the acceleration scale emerges from several pieces of evidence on galaxy scale, such as the BTFR, the MDAR, and the RAR (see Section 1). Yet, the acceleration scale emerges from the WFL of CRG. This can be seen by calculating the CRG gravitational field far from a spherical source with density , monotonically decreasing with r, settling in a homogeneous background with constant density . Sanna, et al. [29] found that, far from this source, the transition from Newtonian to RG regimes occurs when the acceleration goes below the acceleration scale:
where . This recalls MOND theory, where the acceleration scale regulates the gravity behaviour. At large distances from the spherical source, the following limit holds:
and, therefore, Equation (46) reduces to:
Being , as found by an independent calculation [29] explained below, Equation (48) implies that m s−2, which coincides with MOND acceleration scale .
Sanna, et al. [29] also derived with CRG the modified Friedmann equations for a flat, expanding, homogeneous, and isotropic Universe described with the Friedmann-Lematre-Robertson-Walker (FLRW) metric, where the Universe content is modelled as a perfect fluid. In these modified Friedmann equations, the term
appears, where is the Hubble parameter. This term is analogous to the density parameter related to the cosmological constant in CDM:
which indicates that , i.e, that plays the role of in CDM, accounting for the accelerated expansion of the Universe. At the present time, Equations (49) and (50) become:
and
where is the Hubble parameter at the present time. We have seen before that sets the value of the acceleration scale (Equation (46)) which defines the transition between Newtonian and RG regimes far from a spherical source, playing the role of in MOND and, thus, accounting for DM phenomenology. Being , also accounts for DE phenomenology, providing a unification of the two dark sectors. Moreover, inserting in Equation (46), the observed relation naturally emerges in CRG.
By rearranging the modified Friedmann equations in CRG, Sanna, et al. [29] found two solutions for the Hubble parameter , that refer as CRG- and CRG+ and, properly integrating , they found the corresponding two solutions for the scale factor . Properly combining CRG- and CRG+, the bound is derived. From the derived , the luminosity distance can be calculated and constrained from the observed Hubble diagram of SNaeIa at high redshift z of the Supernova Cosmology Project Union Compilation [96]. Comparing the CRG model with the data, the cosmological parameters can be derived to verify if the tensions observed in CDM can be either reduced or cancelled, which would provide a fundamental test for CRG. By comparing the distance modulus , where m and M are the apparent and absolute magnitudes, respectively, derived from the luminosity distance computed in CRG for the solutions CRG- and CRG+ with the data of the high-redshift SNaeIa from [96], Sanna, et al. [29] found that , for CRG-, and , for CRG+, assuming the values km s−1 Mpc−1 and for the Hubble constant and the ratio between the densities of the baryonic matter and the critical density of the Universe at the present epoch, respectively [1]. Replacing the values of and km s−1 Mpc−1 in Equation (52) implies again that , as independently determined before.
Figure 9.
Hubble diagram of SNaeIa modelled with CRG. The dashed and solid lines are the CRG- and CRG+ models, respectively. For the CRG- and CRG+ curves, the km s−1 Mpc−1, , and parameters are adopted. The open circles with error bars are the data from the Supernova Cosmology Project Union 2.1 Compilation [96]. The figure is reproduced from Figure E.2 in [29].
Figure 9.
Hubble diagram of SNaeIa modelled with CRG. The dashed and solid lines are the CRG- and CRG+ models, respectively. For the CRG- and CRG+ curves, the km s−1 Mpc−1, , and parameters are adopted. The open circles with error bars are the data from the Supernova Cosmology Project Union 2.1 Compilation [96]. The figure is reproduced from Figure E.2 in [29].
Sanna, et al. [29] derived the equation of state of the effective DE in CRG, , where and are the pressure and the density of the effective DE, by properly rearranging the CRG Friedmann equations and by comparing them with the Friedmann equations of a general scalar-tensor theory with a non-minimal coupling between the scalar field and the metric. The parameter depends on redshift z. At the present time, , the parameter becomes:
Inserting , consistent with the equation of state of DE in CDM [1], and , is obtained, which is consistent with the CRG- solution.
Values of different from -1 are anyway consistent with several pieces of evidence (e.g. [97,98,99,100,101,102]). Generally, the observational constraints on the equation of state of the effective DE can depend on the adopted model, even if model-independent reconstructions exist [102]. For CRG, the parametrisation [103,104]:
can be assumed for . At the present time (), Equation (54) only depends on , allowing a wide range of DE models, either with (phantom models) or with [97,98,99,105,106]. The parameter is constrained to be approximately in the range of by measurements of the baryonic acoustic oscillation (BAO), SNaeIa, and CMB [100,107]. This limit on translates in a limit on , in agreement with the values of estimated from the SNaeIa data.
7. Discussion and conclusions
In this work, the main analyses and results of the theory of modified gravity Refracted Gravity (RG) are summarised. RG demonstrated to be able to model the dynamics of disk and elliptical galaxies with sensible mass and structural parameters (stellar mass-to-light ratios, disk scale heights, and orbital anisotropy parameters) and with RG parameters consistent among the different galaxies, suggesting their universality. Preliminary encouraging results were obtained at the scale of galaxy clusters and a covariant extension of the theory might look promising, since it seems to properly describe the accelerated expansion of the Universe, to retrieve the MOND acceleration scale at galaxy scale, and to explain both the DM and the DE sectors with a single scalar field.
Several further studies could be performed to complete the tests of this gravity theory. On galaxy scale, two issues presented by the theory require additional investigation. They are (1) the prediction of a RAR with a too large intrinsic scatter and correlations between its residuals from Equation (19) and some galaxy properties, and (2) the tension presented by the vacuum permittivity , which might indicate its nonuniversality.
The RAR built with RG presents some strong correlations, at more than 5, with some radially-dependent galaxy properties. However, also the RAR built from DMS data shows some, despite weaker, correlations with some galaxy properties and a further investigation is needed to understand whether the correlations presented by the RG RAR are partially driven by the data correlations. The correlations presented by DMS data are apparently at odds with the claimed uncorrelations observed in the RAR derived from SPARC data [50], suggesting a difference between the two samples. Moreover, the question of the RAR is even more puzzling, since the DMS is not the only sample where a correlation between the RAR residuals and some galaxy properties is observed. Di Paolo, et al. [108] found a correlation between the RAR residuals and the galaxy radius from the accurate mass profiles of 36 dwarf disk spirals and 72 LSB galaxies. A better assessment of whether the result obtained in RG for the RAR depends on the theory itself or on the chosen galaxy sample can be performed by reproducing in RG the RAR of SPARC disk galaxies [50], that differently from DMS galaxies are nearly edge-on and, thus, their measured rotation curves, from which the RAR is derived, are much more accurate. Moreover, SPARC sample counts much more galaxies than the DMS (153 vs 30 galaxies), which would make this study much more statistically significant. For this study, the rotation curves of SPARC galaxies have to be modelled with RG and the RAR has to be built from these models. The scatter and the residuals from Equation (19) of the obtained RAR have to be compared with the results of Lelli et al. [52]. Another interesting study that can be performed with the RAR, would be to compute the RAR in RG separately for the groups of normal spirals and dwarf galaxies present in SPARC and in the sample considered by Di Paolo, et al. [108]. This study might shed light on the works of Santos-Santos, et al. [109] and Di Paolo, et al. [108], which found that the RAR might differently behave in these two categories of galaxies, besides providing a further test for RG theory.
As said at the end of Section 4.3, the tension of the vacuum permittivity might have different origins, either the approximate derivation of the unique in the DMS sample, or a too simplistic dynamical model for the elliptical galaxies, or an incorrect assumption for the functional form of the gravitational permittivity (Equation (7)), or, in the worst case, a fundamental issue in RG theory. Generally, the study of elliptical galaxies is incomplete, both because the considered sample only counted three galaxies and because it only considered E0 ellipticals, with a nearly spherical shape. To better investigate the possible (non)universality of , the performed study on the three E0 galaxies should be repeated removing the adopted approximations. In the new model, the interaction with the surrounding environment of the ellipticals should be considered possibly resorting to N-body simulations. Additional E0 galaxies with extended kinematic profiles should be considered to enrich the galaxy sample in ths new study. The E0 galaxies in the ePN.S survey [57], where extended kinematic profiles up to ∼13 from the galaxy centres are measured thanks to the presence of planetary nebulae in the galaxies outskirts, should be suitable candidates. Other candidates ideal to test the viability of RG are the round elliptical galaxies in the samples of [110,111,112]. Their velocity dispersion profiles present a flattening beyond a certain radius, where both this radius and the intensity of the velocity dispersion in this plateau are in agreement with MOND expectations. In the outer regions of spherical systems, where the density drops below , RG predicts a field proportional to , as in the Newtonian case (see Section 2). Modelling in RG the velocity dispersion profiles of the round elliptical galaxies in [110,111,112] would show whether they can be reproduced by a field in the galaxy outskirts or if they necessarily require a field as in MOND, which would represent an issue with the current formulation of RG.
After focussing on spherical elliptical galaxies alone, a more complete study should be performed considering elliptical galaxies with different ellipticities, to further test the capability of RG of modelling the dynamics of systems with different shapes with a unique set of RG parameters. This study would also permit to investigate the positive correlation found by Deur [30,31] between the total mass-to-light ratios and the ellipticities of elliptical galaxies, already mentioned in Section 1, which naturally arises within the RG context. Employing elliptical galaxies with kinematic profiles ∼10 times more extended than the data used by [30,31] might be crucial to validate or reject this correlation. At last, all these studies might shed light on the correctness of Equation (7) for the gravitational permittivity .
A further test of the RG prediction that the flatter the system, the larger the mass discrepancy, if considered in Newtonian gravity, might be performed with the kinematic data of dwarf and LSB galaxies and GCs, besides of elliptical galaxies with different flatness degrees. Indeed, dwarf galaxies and GCs have similar baryonic masses but very different dynamical properties, the former being one of the darkest systems on galaxy scale and the latter being nearly DM-free (Section 1), which represented a challenge for MOND (e.g., [32,113,114,115,116,117,118]). This feature of RG might be tested by modelling the rotation curves of a sample of dwarf galaxies, e.g., in the Milky Way halo [119], in the LITTLE THINGS survey [120] in SPARC [50], and in Di Paolo, et al. [108], and the internal velocity dispersion of a sample of GCs located in the most external regions of the Milky Way (e.g., [32,113,114,115,116,117,118]), where the background density drops below .
On the scale of galaxy clusters, the tests are incomplete and a deeper investigation is required. The sample considered by Matsakos and Diaferio [28] is too small, counting two galaxy clusters, and the analysis of the temperature profiles is approximated. For their study, Matsakos and Diaferio [28] considered the data from [74], whose sample contains other 11 low-redshift and relaxed galaxy clusters. This analysis should be extended to these other galaxy clusters, by directly constraining the RG parameters from their temperature profiles to check their agreement with one another and with the results obtained on galaxy scale. In a second step, the same analysis should be repeated by adopting a less approximate modelling by including the mass profiles of the individual galaxies present in the clusters, exploiting the results from N-body simulations.
Besides on the temperature profiles, RG should be tested on the dynamics of galaxy clusters. A study of this kind is already underway. Specifically, it should be verified whether RG is able to model the galaxy dispersion profiles of clusters of galaxies with sensible parameters. Possible samples for this analysis are CIRS and HeCS, which present the radial velocity dispersion profiles taken from the Sloan Digital Sky Survey and the ROSAT All-Sky Survey of 130 galaxy clusters in a redshift range of [0.0, 0.3] and with different dynamical properties, from nonmerging and relaxed to merging and dynamically active. This study allows to investigate how the RG parameters are affected by the environment, either relaxed or interacting, extending on larger scales the possible future study for the elliptical galaxies. Also the study of the BTFR extended to galaxy groups and clusters (Equation (40)) could be expanded, by considering how the uncertainties on the equation of state and on the entropy profiles of the gas and the possible local deviations from hydrostatic equilibrium due to X-ray gas flows might affect the values of the RG parameters.
Also CRG leaves room for additional investigation. The emergence of MOND acceleration scale in the WFL of CRG should be further explored. Indeed, differently from , (Equation (46)) is not a constant but depends on the mass density of the source, even if this dependence drops at large distances from the source since . Future studies are required to test if the connection between and subsists for a generic case besides to a source with a specific density configuration.
The parameter of the equation of state of the effective DE found by Sanna, et al. [29] in CRG appears to be dependent on redshift, differently from CDM where is a constant equal to -1. However, tends to -1 at the present epoch, in agreement with the observations. The parameter in CRG could be constrained from the measurements of the expansion rate of the Universe performed by the Dark Energy Survey (DES)2 [121], which have observed thousands of supernovae since August 31th 2013. Moreover, the Euclid3 mission [122], launched on July 1st 2023, is expected to measure the variation of the cosmic acceleration to an accuracy better than the 10% level, which would be crucial to disentangle CRG from CDM and other DE models [123]. Future observations of the large-scale structure of the Universe and the evolution of DE will be crucial to constrain the value of in Equation (54) and, consequently, the value of (see Section 6).
The Lagrangian density of CRG, derived from the CRG action (Equation (44)) should be constrained from the power spectrum of the temperature anisotropies of the CMB and the power spectrum of the matter density perturbations (e.g. [124,125]), for example, by comparing the CRG predictions with the latest measurements from the Planck satellite [126]. By estimating the cosmological parameters from different low-redshift galaxy surveys, such as Kilo-Degree Survey (KIDS) 4 [127], CFHTLS 5 [128], and DES, and from the CMB power spectrum, we can also assess whether RG can solve the tensions observed in the cosmological parameters in the CDM model.
Another essential test for CRG would consist in analysing the evolution of the density perturbations, at least in the linear regime, and how the scalar field and its perturbations would impact on the large-scale structure formation, evolution, and distribution (e.g., [129,130,131,132]). A possible way to accomplish this task, would be to modify the publicly available code GADGET-2 [133], to run N-body simulations in the CRG framework. The results from these N-body simulations could be compared with the data from the DES survey, which probed the formation of structures with weak gravitational lensing and galaxy clusters, and the distribution of galaxies with the two-point correlation function. Further constraints could be given by the measurements taken with the Dark Energy Spectroscopic Instrument (DESI) 6 [134], which started to observe in 2019, with Euclid, and with upcoming experiments such as the Square Kilometer Array (SKA) 7 [135].
Funding
This work has been funded by the Spoke 1 “FutureHPC & Big- Data” of the ICSC-Centro Nazionale di Ricerca in High Performance Computing, Big Data and Quantum Computing-and hosting entity, funded by European Union-Next GenerationEU.
Institutional Review Board Statement
Not applicable.
Informed Consent Statement
Not applicable.
Data Availability Statement
No new data were created or analyzed in this study. Data sharing is not applicable to this article.
Acknowledgments
Part of this work is the result of my Ph. D. activity at the Physics Department of the University of Turin (2017–2021). I sincerely thank all the people that helped me during my Ph. D., in particular, Antonaldo Diaferio, my Ph. D. supervisor, Titos Matsakos, who formulated RG together with Antonaldo Diaferio, Garry Angus, who collaborated in the study of RG in DMS galaxies, and Andrea Sanna, who formulated CRG, together with Antonaldo Diaferio, and Titos Matsakos. This work has been supported by the Spoke 1 “FutureHPC & Big- Data” of the ICSC-Centro Nazionale di Ricerca in High Performance Computing, Big Data and Quantum Computing-and hosting entity, funded by European Union-Next GenerationEU.
Conflicts of Interest
The authors declare no conflict of interest.
Abbreviations
| The following abbreviations are used in this manuscript | baryonic Tully-Fisher relation | |
| BTFR | baryonic Tully-Fisher relation | |
| CMB | cosmic microwave background | |
| CRG | covariant refracted gravity | |
| DE | dark energy | |
| DM | dark matter | |
| DMS | DiskMass Survey | |
| GCs | globular clusters | |
| GR | General Relativity | |
| HSB | high surface brightness | |
| CDM | cold dark matter | |
| LSB | low surface brightness | |
| MDAR | mass discrepancy–acceleration relation | |
| MOND | MOdified Newtonian Dynamics | |
| RAR | radial acceleration relation | |
| RG | Refracted Gravity | |
| SNaeIa | Ia Supernovae | |
| SPARC | Spitzer Photometry and Accurate Rotation Curves | |
| SPS | stellar population synthesis | |
| TeVeS | Tensor Vector Scalar gravity | |
| WFL | weak field limit | |
References
- Planck Collaboration; Aghanim, N.; Akrami, Y.; Ashdown, M.; Aumont, J.; Baccigalupi, C.; Ballardini, M.; Banday, A.J.; Barreiro, R.B.; Bartolo, N.; et al. Planck 2018 results. VI. Cosmological parameters. A&A, 2020; 641, A6arXiv:astro-ph.CO/1807.06209]. [Google Scholar] [CrossRef]
- Davis, M.; Efstathiou, G.; Frenk, C.S.; White, S.D.M. The evolution of large-scale structure in a universe dominated by cold dark matter. ApJ 1985, 292, 371–394. [Google Scholar] [CrossRef]
- Springel, V.; Frenk, C.S.; White, S.D.M. The large-scale structure of the Universe. Nature 2006, 440, 1137–1144. [Google Scholar] [CrossRef]
- Markevitch, M. Chandra Observation of the Most Interesting Cluster in the Universe. The X-ray Universe 2005; Wilson, A., Ed., 2006, Vol. 604, ESA Special Publication, p. 723, [arXiv:astro-ph/astro-ph/0511345]. [CrossRef]
- Clowe, D.; Bradač, M.; Gonzalez, A.H.; Markevitch, M.; Randall, S.W.; Jones, C.; Zaritsky, D. A Direct Empirical Proof of the Existence of Dark Matter. ApJL 2006, 648, L109–L113. [Google Scholar] [CrossRef]
- Paraficz, D.; Kneib, J.P.; Richard, J.; Morandi, A.; Limousin, M.; Jullo, E.; Martinez, J. The Bullet cluster at its best: weighing stars, gas, and dark matter. A&A, 2016; 594, A121arXiv:astro-ph.CO/1209.0384]. [Google Scholar] [CrossRef]
- Cyburt, R.H.; Fields, B.D.; Olive, K.A.; Yeh, T.H. Big bang nucleosynthesis: Present status. Reviews of Modern Physics, 2016; 88, 015004arXiv:astro-ph.CO/1505.01076]. [Google Scholar] [CrossRef]
- Zwicky, F. Die Rotverschiebung von extragalaktischen Nebeln. Helvetica Physica Acta 1933, 6, 110–127. [Google Scholar]
- Rubin, V.C.; Ford, W. Kent, J. Rotation of the Andromeda Nebula from a Spectroscopic Survey of Emission Regions. ApJ 1970, 159, 379. [Google Scholar] [CrossRef]
- Bosma, A. The distribution and kinematics of neutral hydrogen in spiral galaxies of various morphological types. PhD thesis, University of Groningen, University of Groningen, 1978. [Google Scholar]
- Sanders, R.H. Mass discrepancies in galaxies: dark matter and alternatives. A&ARv 1990, 2, 1–28. [Google Scholar] [CrossRef]
- Dodelson, S.; Gates, E.I.; Turner, M.S. Cold Dark Matter. Science 1996, 274, 69–75. [Google Scholar] [CrossRef]
- Kirshner, R. Measuring the Universe with Supernovae. APS Meeting Abstracts, 1996, APS Meeting Abstracts, p. F4.01.
- Peebles, P.J.; Ratra, B. The cosmological constant and dark energy. Reviews of Modern Physics 2003, 75, 559–606. [Google Scholar] [CrossRef]
- Weinberg, S. The cosmological constant problem. Reviews of Modern Physics 1989, 61, 1–23. [Google Scholar] [CrossRef]
- Luo, M.J. The cosmological constant problem and re-interpretation of time. Nuclear Physics B, 2014; 884, 344–356arXiv:physics.gen-ph/1312.2759]. [Google Scholar] [CrossRef]
- Velten, H.E.S.; vom Marttens, R.F.; Zimdahl, W. Aspects of the cosmological “coincidence problem”. European Physical Journal C, 2014; 74, 3160arXiv:astro-ph.CO/1410.2509]. [Google Scholar] [CrossRef]
- Fleury, P.; Dupuy, H.; Uzan, J.P. Can All Cosmological Observations Be Accurately Interpreted with a Unique Geometry? Phys. Rev. Lett. 2013; 111, 091302arXiv:astro-ph.CO/1304.7791]. [Google Scholar] [CrossRef] [PubMed]
- Douspis, M.; Salvati, L.; Aghanim, N. On the tension between Large Scale Structures and Cosmic Microwave Background. arXiv e-prints, arXiv:1901.05289, [arXiv:astro-ph.CO/1901.05289].
- Del Popolo, A.; Le Delliou, M. Small Scale Problems of the ΛCDM Model: A Short Review. Galaxies, 2017; 5, 17arXiv:astro-ph.CO/1606.07790]. [Google Scholar] [CrossRef]
- de Martino, I.; Chakrabarty, S.S.; Cesare, V.; Gallo, A.; Ostorero, L.; Diaferio, A. Dark Matters on the Scale of Galaxies. Universe 2020, 6. [Google Scholar] [CrossRef]
- McGaugh, S.S.; Schombert, J.M.; Bothun, G.D.; de Blok, W.J.G. The Baryonic Tully-Fisher Relation. ApJL 2000, 533, L99–L102. [Google Scholar] [CrossRef] [PubMed]
- McGaugh, S.S. The Mass Discrepancy-Acceleration Relation: Disk Mass and the Dark Matter Distribution. ApJ 2004, 609, 652–666. [Google Scholar] [CrossRef]
- McGaugh, S.S.; Lelli, F.; Schombert, J.M. Radial Acceleration Relation in Rotationally Supported Galaxies. Phys. Rev. Lett. 2016; 117, 201101arXiv:astro-ph.GA/1609.05917]. [Google Scholar] [CrossRef]
- Milgrom, M. A modification of the Newtonian dynamics as a possible alternative to the hidden mass hypothesis. ApJ 1983, 270, 365–370. [Google Scholar] [CrossRef]
- Milgrom, M. A modification of the Newtonian dynamics - Implications for galaxies. ApJ 1983, 270, 371–383. [Google Scholar] [CrossRef]
- Milgrom, M. A modification of the newtonian dynamics : implications for galaxy systems. ApJ 1983, 270, 384–389. [Google Scholar] [CrossRef]
- Matsakos, T.; Diaferio, A. Dynamics of galaxies and clusters in {refracted gravity}. arXiv e-prints, 2016; arXiv:1603.04943, [arXiv:astro-ph.GA/1603.04943]. [Google Scholar]
- Sanna, A.P.; Matsakos, T.; Diaferio, A. Covariant formulation of refracted gravity. A&A, 2023; 674, A209arXiv:astro-ph.CO/2109.11217]. [Google Scholar] [CrossRef]
- Deur, A. A relation between the dark mass of elliptical galaxies and their shape. MNRAS, 2014; 438, 1535–1551arXiv:astro-ph.GA/1304.6932]. [Google Scholar] [CrossRef]
- Deur, A. A correlation between the dark content of elliptical galaxies and their ellipticity. arXiv e-prints, 2020; arXiv:2010.06692, [arXiv:astro-ph.GA/2010.06692]. [Google Scholar]
- Sollima, A.; Nipoti, C. Globular clusters in modified Newtonian dynamics: velocity dispersion profiles from self-consistent models. MNRAS, 2010; 401, 131–142arXiv:astro-ph.GA/0909.1656]. [Google Scholar] [CrossRef]
- Mateo, M.L. Dwarf Galaxies of the Local Group. Ann. Rev. Astron. Astrophys. 1998, 36, 435–506. [Google Scholar] [CrossRef]
- Cesare, V.; Diaferio, A.; Matsakos, T.; Angus, G. Dynamics of DiskMass Survey galaxies in refracted gravity. A&A, 2020; 637, A70arXiv:astro-ph.GA/2003.07377]. [Google Scholar] [CrossRef]
- Bershady, M.A.; Verheijen, M.A.W.; Swaters, R.A.; Andersen, D.R.; Westfall, K.B.; Martinsson, T. The DiskMass Survey. I. Overview. ApJ 2010, arXiv:astro-ph.CO/1004.4816]716, 198–233. [Google Scholar] [CrossRef]
- Cesare, V. Dynamics of Disk and Elliptical Galaxies in Refracted Gravity. Physical Sciences Forum 2021, 2. [Google Scholar] [CrossRef]
- Sancisi, R. The visible matter – dark matter coupling. Dark Matter in Galaxies, [arXiv:astro-ph/astro-ph/0311348]. Ryder, S., Pisano, D., Walker, M., Freeman, K., Eds.; 2004; Volume 220, 233. [Google Scholar] [CrossRef]
- de Vaucouleurs, G. General Physical Properties of External Galaxies. Handbuch der Physik 1959, 53, 311. [Google Scholar] [CrossRef] [PubMed]
- Freeman, K.C. On the Disks of Spiral and S0 Galaxies. ApJ 1970, 160, 811. [Google Scholar] [CrossRef]
- Sérsic, J.L. Influence of the atmospheric and instrumental dispersion on the brightness distribution in a galaxy. Boletin de la Asociacion Argentina de Astronomia La Plata Argentina 1963, 6, 41–43. [Google Scholar]
- Young, D. Iterative Methods for Solving Partial Difference Equations of Elliptic Type. Transactions of the American Mathematical Society 1954, 76, 92–111. [Google Scholar] [CrossRef]
- Bell, E.F.; de Jong, R.S. Stellar Mass-to-Light Ratios and the Tully-Fisher Relation. ApJ 2001, 550, 212–229. [Google Scholar] [CrossRef]
- Bershady, M.A.; Verheijen, M.A.W.; Westfall, K.B.; Andersen, D.R.; Swaters, R.A.; Martinsson, T. The DiskMass Survey. II. Error Budget. ApJ, 2010; 716, 234–268arXiv:astro-ph.CO/1004.5043]. [Google Scholar] [CrossRef]
- Angus, G.W.; Gentile, G.; Swaters, R.; Famaey, B.; Diaferio, A.; McGaugh, S.S.; Heyden, K.J.v.d. Mass models of disc galaxies from the DiskMass Survey in modified Newtonian dynamics. MNRAS, 2015; 451, 3551–3580arXiv:astro-ph.GA/1505.05522]. [Google Scholar] [CrossRef]
- Milgrom, M. Quasi-linear formulation of MOND. MNRAS, 2010; 403, 886–895arXiv:astro-ph.CO/0911.5464]. [Google Scholar] [CrossRef]
- Aniyan, S.; Freeman, K.C.; Gerhard, O.E.; Arnaboldi, M.; Flynn, C. The influence of a kinematically cold young component on disc-halo decompositions in spiral galaxies: insights from solar neighbourhood K-giants. MNRAS, 2016; 456, 1484–1494arXiv:astro-ph.GA/1511.06047]. [Google Scholar] [CrossRef]
- Cesare, V.; Colonnelli, I.; Aldinucci, M. Practical Parallelization of Scientific Applications. 2020 28th Euromicro International Conference on Parallel, Distributed and Network-Based Processing (PDP), 2020, pp. 376–384. [CrossRef]
- Aldinucci, M.; Cesare, V.; Colonnelli, I.; Martinelli, A.R.; Mittone, G.; Cantalupo, B.; Cavazzoni, C.; Drocco, M. Practical parallelization of scientific applications with OpenMP, OpenACC and MPI. Journal of Parallel and Distributed Computing 2021, 157, 13–29. [Google Scholar] [CrossRef]
- Cesare, V.; Diaferio, A.; Matsakos, T. The dynamics of three nearby E0 galaxies in refracted gravity. A&A, 2022; 657, A133arXiv:astro-ph.GA/2102.12499]. [Google Scholar] [CrossRef]
- Lelli, F.; McGaugh, S.S.; Schombert, J.M. SPARC: Mass Models for 175 Disk Galaxies with Spitzer Photometry and Accurate Rotation Curves. AJ, 2016; 152, 157arXiv:astro-ph.GA/1606.09251]. [Google Scholar] [CrossRef]
- Li, P.; Lelli, F.; McGaugh, S.; Schombert, J. Fitting the radial acceleration relation to individual SPARC galaxies. A&A, 2018; 615, A3arXiv:astro-ph.GA/1803.00022]. [Google Scholar] [CrossRef]
- Lelli, F.; McGaugh, S.S.; Schombert, J.M.; Pawlowski, M.S. One Law to Rule Them All: The Radial Acceleration Relation of Galaxies. ApJ, 2017; 836, 152arXiv:astro-ph.GA/1610.08981]. [Google Scholar] [CrossRef]
- Pota, V.; Forbes, D.A.; Romanowsky, A.J.; Brodie, J.P.; Spitler, L.R.; Strader, J.; Foster, C.; Arnold, J.A.; Benson, A.; Blom, C.; Hargis, J.R.; Rhode, K.L.; Usher, C. The SLUGGS Survey: kinematics for over 2500 globular clusters in 12 early-type galaxies. MNRAS, 2013; 428, 389–420arXiv:astro-ph.CO/1209.4351]. [Google Scholar] [CrossRef]
- Brodie, J.P.; Romanowsky, A.J.; Strader, J.; Forbes, D.A.; Foster, C.; Jennings, Z.G.; Pastorello, N.; Pota, V.; Usher, C.; Blom, C.; Kader, J.; Roediger, J.C.; Spitler, L.R.; Villaume, A.; Arnold, J.A.; Kartha, S.S.; Woodley, K.A. The SAGES Legacy Unifying Globulars and GalaxieS Survey (SLUGGS): Sample Definition, Methods, and Initial Results. ApJ, 2014; 796, 52arXiv:astro-ph.GA/1405.2079]. [Google Scholar] [CrossRef]
- Forbes, D.A.; Alabi, A.; Brodie, J.P.; Romanowsky, A.J.; Strader, J.; Foster, C.; Usher, C.; Spitler, L.; Bellstedt, S.; Pastorello, N.; Villaume, A.; Wasserman, A.; Pota, V. The SLUGGS Survey: A Catalog of Over 4000 Globular Cluster Radial Velocities in 27 Nearby Early-type Galaxies. AJ, 2017; 153, 114arXiv:astro-ph.GA/1701.04835]. [Google Scholar] [CrossRef]
- Mathews, W.G.; Brighenti, F. Hot Gas in and around Elliptical Galaxies. Ann. Rev. Astron. Astrophys. 2003, 41, 191–239. [Google Scholar] [CrossRef]
- Pulsoni, C.; Gerhard, O.; Arnaboldi, M.; Coccato, L.; Longobardi, A.; Napolitano, N.R.; Moylan, E.; Narayan, C.; Gupta, V.; Burkert, A.; Capaccioli, M.; Chies-Santos, A.L.; Cortesi, A.; Freeman, K.C.; Kuijken, K.; Merrifield, M.R.; Romanowsky, A.J.; Tortora, C. The extended Planetary Nebula Spectrograph (ePN.S) early-type galaxy survey: The kinematic diversity of stellar halos and the relation between halo transition scale and stellar mass. A&A, 2018; 618, A94arXiv:astro-ph.GA/1712.05833]. [Google Scholar] [CrossRef]
- Pota, V.; Romanowsky, A.J.; Brodie, J.P.; Peñarrubia, J.; Forbes, D.A.; Napolitano, N.R.; Foster, C.; Walker, M.G.; Strader, J.; Roediger, J.C. The SLUGGS survey: multipopulation dynamical modelling of the elliptical galaxy NGC 1407 from stars and globular clusters. MNRAS, 2015; 450, 3345–3358arXiv:astro-ph.GA/1504.03325]. [Google Scholar] [CrossRef]
- Scott, N.; Cappellari, M.; Davies, R.L.; Verdoes Kleijn, G.; Bois, M.; Alatalo, K.; Blitz, L.; Bournaud, F.; Bureau, M.; Crocker, A.; Davis, T.A.; de Zeeuw, P.T.; Duc, P.A.; Emsellem, E.; Khochfar, S.; Krajnović, D.; Kuntschner, H.; McDermid, R.M.; Morganti, R.; Naab, T.; Oosterloo, T.; Sarzi, M.; Serra, P.; Weijmans, A.M.; Young, L.M. The ATLAS3D project - XXI. Correlations between gradients of local escape velocity and stellar populations in early-type galaxies. MNRAS, 2013; 432, 1894–1913arXiv:astro-ph.CO/1211.4615]. [Google Scholar] [CrossRef]
- Strader, J.; Romanowsky, A.J.; Brodie, J.P.; Spitler, L.R.; Beasley, M.A.; Arnold, J.A.; Tamura, N.; Sharples, R.M.; Arimoto, N. Wide-field Precision Kinematics of the M87 Globular Cluster System. ApJS, 2011; 197, 33arXiv:astro-ph.CO/1110.2778]. [Google Scholar] [CrossRef]
- Zhang, Z.; Xu, H.; Wang, Y.; An, T.; Xu, Y.; Wu, X.P. Probing the Mass Distributions in NGC 1407 and Its Associated Group with the X-Ray Imaging Spectroscopic and Optical Photometric and Line-Strength Indices Data. ApJ 2007, 656, 805–817. [Google Scholar] [CrossRef]
- Paggi, A.; Kim, D.W.; Anderson, C.; Burke, D.; D’Abrusco, R.; Fabbiano, G.; Fruscione, A.; Gokas, T.; Lauer, J.; McCollough, M.; Morgan, D.; Mossman, A.; O’Sullivan, E.; Trinchieri, G.; Vrtilek, S.; Pellegrini, S.; Romanowsky, A.J.; Brodie, J. Constraining the Physical State of the Hot Gas Halos in NGC 4649 and NGC 5846. ApJ, 2017; 844, 5arXiv:astro-ph.GA/1706.02303]. [Google Scholar] [CrossRef]
- Fabricant, D.; Lecar, M.; Gorenstein, P. X-ray measurements of the mass of M 87. ApJ 1980, 241, 552–560. [Google Scholar] [CrossRef]
- Rusli, S.P.; Erwin, P.; Saglia, R.P.; Thomas, J.; Fabricius, M.; Bender, R.; Nowak, N. Depleted Galaxy Cores and Dynamical Black Hole Masses. AJ, 2013; 146, 160arXiv:astro-ph.CO/1310.5310]. [Google Scholar] [CrossRef]
- Jeans, J.H. On the theory of star-streaming and the structure of the universe. MNRAS 1915, 76, 70–84. [Google Scholar] [CrossRef]
- Mamon, G.A.; okas, E.L. Dark matter in elliptical galaxies - II. Estimating the mass within the virial radius. MNRAS 2005, 363, 705–722. [Google Scholar] [CrossRef]
- Cappellari, M. Measuring the inclination and mass-to-light ratio of axisymmetric galaxies via anisotropic Jeans models of stellar kinematics. MNRAS, 2008; 390, 71–86arXiv:astro-ph/0806.0042]. [Google Scholar] [CrossRef]
- Thomas, J.; Saglia, R.P.; Bender, R.; Erwin, P.; Fabricius, M. The Dynamical Fingerprint of Core Scouring in Massive Elliptical Galaxies. ApJ, 2014; 782, 39arXiv:astro-ph.GA/1311.3783]. [Google Scholar] [CrossRef]
- Rantala, A.; Johansson, P.H.; Naab, T.; Thomas, J.; Frigo, M. The Simultaneous Formation of Cored, Tangentially Biased, and Kinematically Decoupled Centers in Massive Early-type Galaxies. ApJL, 2019; 872, L17arXiv:astro-ph.GA/1812.02732]. [Google Scholar] [CrossRef]
- Humphrey, P.J.; Buote, D.A.; Gastaldello, F.; Zappacosta, L.; Bullock, J.S.; Brighenti, F.; Mathews, W.G. A Chandra View of Dark Matter in Early-Type Galaxies. ApJ 2006, 646, 899–918. [Google Scholar] [CrossRef]
- Bell, E.F.; McIntosh, D.H.; Katz, N.; Weinberg, M.D. The Optical and Near-Infrared Properties of Galaxies. I. Luminosity and Stellar Mass Functions. ApJS 2003, 149, 289–312. [Google Scholar] [CrossRef]
- Zibetti, S.; Charlot, S.; Rix, H.W. Resolved stellar mass maps of galaxies - I. Method and implications for global mass estimates. MNRAS, 2009; 400, 1181–1198arXiv:astro-ph.CO/0904.4252]. [Google Scholar] [CrossRef]
- Cappellari, M.; Emsellem, E.; Krajnovic, D.; McDermid, R.M.; Scott, N.; Verdoes Kleijn, G.A.; Young, L.M.; Alatalo, K.; Bacon, R.; Blitz, L.; Bois, M.; Bournaud, F.; Bureau, M.; Davies, R.L.; Davis, T.A.; De Zeeuw, P.T.; Duc, P.A.; Khochfar, S.; Kuntschner, H.; Lablanche, P.Y.; Morganti, R.; Naab, T.; Oosterloo, T.; Sarzi, M.; Serra, P.; Weijmans, A.M. VizieR Online Data Catalog: ATLAS3D project. I. (Cappellari+, 2011). VizieR Online Data Catalog.
- Vikhlinin, A.; Kravtsov, A.; Forman, W.; Jones, C.; Markevitch, M.; Murray, S.S.; Van Speybroeck, L. Chandra Sample of Nearby Relaxed Galaxy Clusters: Mass, Gas Fraction, and Mass-Temperature Relation. ApJ 2006, 640, 691–709. [Google Scholar] [CrossRef]
- McGaugh, S.S. The Baryonic Tully-Fisher Relation of Galaxies with Extended Rotation Curves and the Stellar Mass of Rotating Galaxies. ApJ 2005, 632, 859–871. [Google Scholar] [CrossRef]
- Sanders, R.H. Clusters of galaxies with modified Newtonian dynamics. MNRAS 2003, 342, 901–908. [Google Scholar] [CrossRef]
- McGaugh, S.S. A tale of two paradigms: the mutual incommensurability of ΛCDM and MOND. Canadian Journal of Physics, 2015; 93, 250–259arXiv:astro-ph.CO/1404.7525]. [Google Scholar] [CrossRef]
- Bekenstein, J.D. Relativistic gravitation theory for the modified Newtonian dynamics paradigm. Phys. Rev. D 2004, 70, 083509. [Google Scholar] [CrossRef]
- Skordis, C. TOPICAL REVIEW: The tensor-vector-scalar theory and its cosmology. Classical and Quantum Gravity, 2009; 26, 143001arXiv:astro-ph.CO/0903.3602]. [Google Scholar] [CrossRef]
- Bekenstein, J.D. Tensor-vector-scalar-modified gravity: from small scale to cosmology. Philosophical Transactions of the Royal Society of London Series A, 2011; 369, 5003–5017arXiv:astro-ph.CO/1201.2759]. [Google Scholar] [CrossRef] [PubMed]
- Hernandez, X.; Sussman, R.A.; Nasser, L. Approaching the Dark Sector through a bounding curvature criterion. MNRAS, 2019; 483, 147–151arXiv:astro-ph.GA/1705.06356]. [Google Scholar] [CrossRef]
- Skordis, C.; Złośnik, T. New Relativistic Theory for Modified Newtonian Dynamics. Phys. Rev. Lett. 2021; 127, 161302arXiv:astro-ph.CO/2007.00082]. [Google Scholar] [CrossRef] [PubMed]
- Kunz, M.; Liddle, A.R.; Parkinson, D.; Gao, C. Constraining the dark fluid. Phys. Rev. D, 2009; 80, 083533arXiv:astro-ph.CO/0908.3197]. [Google Scholar] [CrossRef]
- Kunz, M. Degeneracy between the dark components resulting from the fact that gravity only measures the total energy-momentum tensor. Phys. Rev. D 2009, 80, 123001. [Google Scholar] [CrossRef]
- Makler, M.; de Oliveira, S.Q.; Waga, I. Constraints on the generalized Chaplygin gas from supernovae observations. Physics Letters B 2003, 555, 1–6. [Google Scholar] [CrossRef]
- Bento, M.C.; Bertolami, O.; Sen, A.A. Letter: Generalized Chaplygin Gas Model: Dark Energy-Dark Matter Unification and CMBR Constraints. General Relativity and Gravitation 2003, 35, 2063–2069. [Google Scholar] [CrossRef]
- Scherrer, R.J. Purely Kinetic k Essence as Unified Dark Matter. Phys. Rev. Lett. 2004, 93, 011301. [Google Scholar] [CrossRef]
- Bruni, M.; Lazkoz, R.; Rozas-Fernández, A. Phenomenological models for unified dark matter with fast transition. MNRAS, 2013; 431, 2907–2916arXiv:astro-ph.CO/1210.1880]. [Google Scholar] [CrossRef]
- Cadoni, M.; Casadio, R.; Giusti, A.; Mück, W.; Tuveri, M. Effective fluid description of the dark universe. Physics Letters B, 2018; 776, 242–248arXiv:gr-qc/1707.09945]. [Google Scholar] [CrossRef]
- Sotiriou, T.P.; Faraoni, V. f(R) theories of gravity. Reviews of Modern Physics, 2010; 82, 451–497arXiv:gr-qc/0805.1726]. [Google Scholar] [CrossRef]
- Sebastiani, L.; Vagnozzi, S.; Myrzakulov, R. Mimetic gravity: a review of recent developments and applications to cosmology and astrophysics. arXiv e-prints, 2016; arXiv:1612.08661, [arXiv:gr-qc/1612.08661]. [Google Scholar] [CrossRef]
- Berezhiani, L.; Khoury, J.; Wang, J. Universe without dark energy: Cosmic acceleration from dark matter-baryon interactions. Phys. Rev. D, 2017; 95, 123530arXiv:hep-th/1612.00453]. [Google Scholar] [CrossRef]
- Ferreira, E.G.M.; Franzmann, G.; Khoury, J.; Brandenberger, R. Unified superfluid dark sector. JCAP, 2019; 2019, 027arXiv:astro-ph.CO/1810.09474]. [Google Scholar] [CrossRef]
- Arbey, A.; Coupechoux, J.F. Unifying dark matter, dark energy and inflation with a fuzzy dark fluid. JCAP, 2021; 2021, 033arXiv:astro-ph.CO/2007.05376]. [Google Scholar] [CrossRef]
- Campigotto, M.C.; Diaferio, A.; Fatibene, L. Conformal gravity: light deflection revisited and the galactic rotation curve failure. Classical and Quantum Gravity, 2019; 36, 245014arXiv:astro-ph.CO/1712.03969]. [Google Scholar] [CrossRef]
- Suzuki, N.; Rubin, D.; Lidman, C.; Aldering, G.; Amanullah, R.; Barbary, K.; Barrientos, L.F.; Botyanszki, J.; Brodwin, M.; Connolly, N.; et al. The Hubble Space Telescope Cluster Supernova Survey. V. Improving the Dark-energy Constraints above z > 1 and Building an Early-type-hosted Supernova Sample. ApJ, 2012; 746, 85arXiv:astro-ph.CO/1105.3470]. [Google Scholar] [CrossRef]
- Amendola, L.; Tsujikawa, S. Dark Energy: Theory and Observations; Cambridge University Press, 2015. [Google Scholar]
- Copeland, E.J.; Sami, M.; Tsujikawa, S. Dynamics of Dark Energy. International Journal of Modern Physics D 2006, 15, 1753–1935. [Google Scholar] [CrossRef]
- Frusciante, N.; Perenon, L. Effective field theory of dark energy: A review. Physics Reports, 2020; 857, 1–63arXiv:astro-ph.CO/1907.03150]. [Google Scholar] [CrossRef]
- Wen, S.; Wang, S.; Luo, X. Comparing dark energy models with current observational data. JCAP, 2018; 2018, 011arXiv:astro-ph.CO/1708.03143]. [Google Scholar] [CrossRef]
- Capozziello, S.; Nojiri, S.; Odintsov, S.D. Dark energy: the equation of state description versus scalar-tensor or modified gravity. Physics Letters B 2006, 634, 93–100. [Google Scholar] [CrossRef]
- Gerardi, F.; Martinelli, M.; Silvestri, A. Reconstruction of the Dark Energy equation of state from latest data: the impact of theoretical priors. JCAP, 2019; 2019, 042arXiv:astro-ph.CO/1902.09423]. [Google Scholar] [CrossRef]
- Chevallier, M.; Polarski, D. Accelerating Universes with Scaling Dark Matter. International Journal of Modern Physics D 2001, 10, 213–223. [Google Scholar] [CrossRef]
- Linder, E.V. Exploring the Expansion History of the Universe. Phys. Rev. Lett. 2003, 90, 091301. [Google Scholar] [CrossRef] [PubMed]
- Bean, R.; Melchiorri, A. Current constraints on the dark energy equation of state. Phys. Rev. D 2002, 65, 041302. [Google Scholar] [CrossRef]
- Solà, J.; Štefančić, H. Effective equation of state for dark energy: Mimicking quintessence and phantom energy through a variable Λ. Physics Letters B 2005, 624, 147–157. [Google Scholar] [CrossRef]
- Hazra, D.K.; Majumdar, S.; Pal, S.; Panda, S.; Sen, A.A. Post-Planck dark energy constraints. Phys. Rev. D, 2015; 91, 083005arXiv:astro-ph.CO/1310.6161]. [Google Scholar] [CrossRef]
- Di Paolo, C.; Salucci, P.; Fontaine, J.P. The Radial Acceleration Relation (RAR): Crucial Cases of Dwarf Disks and Low-surface-brightness Galaxies. ApJ, 2019; 873, 106arXiv:astro-ph.GA/1810.08472]. [Google Scholar] [CrossRef]
- Santos-Santos, I.M.E.; Navarro, J.F.; Robertson, A.; Benítez-Llambay, A.; Oman, K.A.; Lovell, M.R.; Frenk, C.S.; Ludlow, A.D.; Fattahi, A.; Ritz, A. Baryonic clues to the puzzling diversity of dwarf galaxy rotation curves. MNRAS, 2020; 495, 58–77arXiv:astro-ph.GA/1911.09116]. [Google Scholar] [CrossRef]
- Jiménez, M.A.; Garcia, G.; Hernandez, X.; Nasser, L. The Massive Elliptical Galaxy NGC 4649 from the Perspective of Extended Gravity. ApJ, 2013; 768, 142arXiv:astro-ph.CO/1210.8183]. [Google Scholar] [CrossRef]
- Durazo, R.; Hernandez, X.; Cervantes Sodi, B.; Sánchez, S.F. A Universal Velocity Dispersion Profile for Pressure Supported Systems: Evidence for MONDian Gravity across Seven Orders of Magnitude in Mass. ApJ, 2017; 837, 179arXiv:astro-ph.GA/1506.04099]. [Google Scholar] [CrossRef]
- Durazo, R.; Hernandez, X.; Cervantes Sodi, B.; Sanchez, S.F. A Test of MONDian Gravity in ∼300 Pressure-supported Elliptical Galaxies from the MaNGA Survey. ApJ, 2018; 863, 107arXiv:astro-ph.GA/1804.01581]. [Google Scholar] [CrossRef]
- Baumgardt, H.; Grebel, E.K.; Kroupa, P. Using distant globular clusters as a test for gravitational theories. MNRAS 2005, 359, L1–L4. [Google Scholar] [CrossRef]
- Jordi, K.; Grebel, E.K.; Hilker, M.; Baumgardt, H.; Frank, M.; Kroupa, P.; Haghi, H.; Côté, P.; Djorgovski, S.G. Testing Fundamental Physics with Distant Star Clusters: Analysis of Observational Data on Palomar 14. AJ, 2009; 137, 4586–4596arXiv:astro-ph.GA/0903.4448]. [Google Scholar] [CrossRef]
- Baumgardt, H.; Côté, P.; Hilker, M.; Rejkuba, M.; Mieske, S.; Djorgovski, S.G.; Stetson, P. The velocity dispersion and mass-to-light ratio of the remote halo globular cluster NGC2419. MNRAS, 2009; 396, 2051–2060arXiv:astro-ph.GA/0904.3329]. [Google Scholar] [CrossRef]
- Ibata, R.; Sollima, A.; Nipoti, C.; Bellazzini, M.; Chapman, S.C.; Dalessandro, E. The Globular Cluster NGC 2419: A Crucible for Theories of Gravity. ApJ, 2011; 738, 186arXiv:astro-ph.CO/1106.4909]. [Google Scholar] [CrossRef]
- Ibata, R.; Sollima, A.; Nipoti, C.; Bellazzini, M.; Chapman, S.C.; Dalessandro, E. Polytropic Model Fits to the Globular Cluster NGC 2419 in Modified Newtonian Dynamics. ApJ, 2011; 743, 43arXiv:astro-ph.CO/1110.3892]. [Google Scholar] [CrossRef]
- Frank, M.J.; Hilker, M.; Baumgardt, H.; Côté, P.; Grebel, E.K.; Haghi, H.; Küpper, A.H.W.; Djorgovski, S.G. The velocity dispersion and mass function of the outer halo globular cluster Palomar 4. MNRAS, 2012; 423, 2917–2932arXiv:astro-ph.GA/1205.2693]. [Google Scholar] [CrossRef]
- Salucci, P.; Wilkinson, M.I.; Walker, M.G.; Gilmore, G.F.; Grebel, E.K.; Koch, A.; Frigerio Martins, C.; Wyse, R.F.G. Dwarf spheroidal galaxy kinematics and spiral galaxy scaling laws. MNRAS, 2012; 420, 2034–2041arXiv:astro-ph.CO/1111.1165]. [Google Scholar] [CrossRef]
- Oh, S.H.; Hunter, D.A.; Brinks, E.; Elmegreen, B.G.; Schruba, A.; Walter, F.; Rupen, M.P.; Young, L.M.; Simpson, C.E.; Johnson, M.C.; Herrmann, K.A.; Ficut-Vicas, D.; Cigan, P.; Heesen, V.; Ashley, T.; Zhang, H.X. High-resolution Mass Models of Dwarf Galaxies from LITTLE THINGS. AJ, 2015; 149, 180arXiv:astro-ph.GA/1502.01281]. [Google Scholar] [CrossRef]
- The Dark Energy Survey Collaboration. The Dark Energy Survey. <italic>arXiv e-prints</italic> <b>2005</b>, pp. The Dark Energy Survey Collaboration. The Dark Energy Survey. arXiv e-prints, a: astro–ph/0510346, [arXiv, 0510. [Google Scholar] [CrossRef]
- Euclid Collaboration; Scaramella, R. ; Amiaux, J.; Mellier, Y.; Burigana, C.; Carvalho, C.S.; Cuillandre, J.C.; Da Silva, A.; Derosa, A.; Dinis, J.; et al. Euclid preparation. I. The Euclid Wide Survey. A&A, 2022; 662, A112arXiv:astro-ph.CO/2108.01201]. [Google Scholar] [CrossRef]
- Amendola, L.; Appleby, S.; Avgoustidis, A.; Bacon, D.; Baker, T.; Baldi, M.; Bartolo, N.; Blanchard, A.; Bonvin, C.; Borgani, S.; et al. Cosmology and fundamental physics with the Euclid satellite. Living Reviews in Relativity, 2018; 21, 2arXiv:astro-ph.CO/1606.00180]. [Google Scholar] [CrossRef] [PubMed]
- Huterer, D.; Kirkby, D.; Bean, R.; Connolly, A.; Dawson, K.; Dodelson, S.; Evrard, A.; Jain, B.; Jarvis, M.; Linder, E.; Mandelbaum, R.; May, M.; Raccanelli, A.; Reid, B.; Rozo, E.; Schmidt, F.; Sehgal, N.; Slosar, A.; van Engelen, A.; Wu, H.Y.; Zhao, G. Growth of cosmic structure: Probing dark energy beyond expansion. Astroparticle Physics, 2015; 63, 23–41arXiv:astro-ph.CO/1309.5385]. [Google Scholar] [CrossRef]
- Noller, J.; Nicola, A. Cosmological parameter constraints for Horndeski scalar-tensor gravity. Phys. Rev. D, 2019; 99, 103502arXiv:astro-ph.CO/1811.12928]. [Google Scholar] [CrossRef]
- Planck Collaboration; Aghanim, N. ; Akrami, Y.; Arroja, F.; Ashdown, M.; Aumont, J.; Baccigalupi, C.; Ballardini, M.; Banday, A.J.; Barreiro, R.B.; et al. Planck 2018 results. I. Overview and the cosmological legacy of Planck. A&A, 2020; 641, A1arXiv:astro-ph.CO/1807.06205]. [Google Scholar] [CrossRef]
- de Jong, J.T.A.; Kuijken, K.; Applegate, D.; Begeman, K.; Belikov, A.; Blake, C.; Bout, J.; Boxhoorn, D.; Buddelmeijer, H.; Buddendiek, A.; et al. The Kilo-Degree Survey. The Messenger 2013, 154, 44–46. [Google Scholar] [CrossRef]
- Gwyn, S.D.J. The Canada-France-Hawaii Telescope Legacy Survey: Stacked Images and Catalogs. AJ, 2012; 143, 38arXiv:astro-ph.CO/1101.1084]. [Google Scholar] [CrossRef]
- di Porto, C.; Amendola, L. Observational constraints on the linear fluctuation growth rate. Phys. Rev. D, 2008; 77, 083508arXiv:astro-ph/0707.2686]. [Google Scholar] [CrossRef]
- Bueno Sánchez, J.C.; Perivolaropoulos, L. Dark energy and matter perturbations in scalar-tensor theories of gravity. Journal of Physics Conference Series, 2011, Vol. 283, Journal of Physics Conference Series, p. 012006. [CrossRef]
- Pace, F.; Moscardini, L.; Crittenden, R.; Bartelmann, M.; Pettorino, V. A comparison of structure formation in minimally and non-minimally coupled quintessence models. MNRAS, 2014; 437, 547–561arXiv:astro-ph.CO/1307.7026]. [Google Scholar] [CrossRef]
- Kofinas, G.; Lima, N.A. Dynamics of cosmological perturbations in modified Brans-Dicke cosmology with matter-scalar field interaction. Phys. Rev. D, 2017; 96, 084016arXiv:gr-qc/1704.08925]. [Google Scholar] [CrossRef]
- Springel, V. The cosmological simulation code GADGET-2. MNRAS 2005, 364, 1105–1134. [Google Scholar] [CrossRef]
- DESI Collaboration; Adame, A.G.; Aguilar, J.; Ahlen, S.; Alam, S.; Aldering, G.; Alexander, D.M.; Alfarsy, R.; Allende Prieto, C.; Alvarez, M.; et al. The Early Data Release of the Dark Energy Spectroscopic Instrument. arXiv e-prints, [arXiv:astro-ph.CO/2306.06308]. 2023; arXiv:2306.06308. [Google Scholar] [CrossRef]
- Grainge, K.; Alachkar, B.; Amy, S.; Barbosa, D.; Bommineni, M.; Boven, P.; Braddock, R.; Davis, J.; Diwakar, P.; Francis, V.; et al. Square Kilometre Array: The radio telescope of the XXI century. Astronomy Reports 2017, 61, 288–296. [Google Scholar] [CrossRef]
Figure 1.
Comparison between the behaviour of Newtonian (top panels) and RG (bottom panels) gravitational field lines for flat (left panels) and spherical (right panels) systems. The figure is reproduced from Figure 16 in [28].
Figure 1.
Comparison between the behaviour of Newtonian (top panels) and RG (bottom panels) gravitational field lines for flat (left panels) and spherical (right panels) systems. The figure is reproduced from Figure 16 in [28].
Figure 2.
Gravitational permittivity adopted in RG (Equation (7)) for different values of the RG free parameter Q. The larger the value of Q, the steeper the transition between the two asymptotic limits of Equation (2). The black dashed line represents . The figure is reproduced from Figure 1 in [34]. Credit: Cesare V., Diaferio A., Matsakos T., and Angus G., A&A, 637, A70, 2020, reproduced with permission © ESO.
Figure 3.
RG models (blue solid lines) of the rotation curves and the vertical velocity dispersion profiles against the DMS data (red dots with error bars) for three DMS galaxies. Figure 3a: rotation curves computed with the parameters found by modelling the rotation curves of each galaxy alone. Figure 3b: rotation curves computed with the parameters found by modelling the rotation curves and the vertical velocity dispersion profiles of each galaxy at the same time. Figure 3c: vertical velocity dispersion profiles computed with the parameters found by modelling the rotation curves and the vertical velocity dispersion profiles of each galaxy at the same time. The cyan solid lines are the RG vertical velocity dispersions calculated with the same parameters as the blue curves but with disk-scale heights (Equation (18)), and the dashed magenta and green vertical lines show the bulge effective radius ( in Equation (12)) and the bulge radius adopted in the disk-bulge decomposition for the surface brightness modelling, respectively. The figure is readapted from Figures D.1 and D.2 in [34]. Credit: Cesare V., Diaferio A., Matsakos T., and Angus G., A&A, 637, A70, 2020, reproduced with permission © ESO.
Figure 4.
Free parameters of the RG gravitational permittivity estimated from the DMS and the three elliptical E0 galaxies. The purple squares with error bars represent the means of the permittivity parameters estimated, at the same time, from the rotation curves and the vertical velocity dispersion profiles of each DMS galaxy. The light blue shaded areas indicate the posterior distributions of the unique combination of RG parameters estimated from the entire DMS sample at the same time, where their medians and 1, 2, and 3 levels are shown as green dots and yellow, red, and black contours, respectively. The orange squares with error bars are the permittivity parameters derived from each elliptical E0 galaxy. The figure is reproduced from Figure 9 in [49]. Credit: Cesare V., Diaferio A., and Matsakos T., A&A, 657, A133, 2022, reproduced with permission © ESO.
Figure 5.
RAR models calculated with RG (blue solid lines) with the parameters obtained from the MCMC analysis of the rotation curves and vertical velocity dispersion profiles of each galaxy at the same time, superimposed to the RAR of the DMS data (red points with error bars). The black solid line is the RAR fitting relation (Equation (19)) obtained by McGaugh, et al. [23] from SPARC galaxies and the black dashed line is the relation, plotted as references. The figure is readapted from Figure 11 in [34]. Credit: Cesare V., Diaferio A., Matsakos T., and Angus G., A&A, 637, A70, 2020, reproduced with permission © ESO.
Figure 6.
Root-mean-square velocity dispersion profiles computed with RG with the parameters resulting from the MCMC analysis of [49], considering the stars, blue GCs, and red GCs kinematic profiles at the same time for each elliptical E0 galaxy. Upper panels: the green, blue, and red solid lines represent the RG models for the stars, blue GCs, and red GCs, respectively. The dashed lines with the same colours are computed with the same and parameters as the solid lines but with Newtonian gravity without DM. Lower panels: zoom-in of the upper panels for the stars alone. The black, blue, and red dots with error bars show the kinematic data for the stars, blue GCs, and red GCs, respectively. The figure is reproduced from Figure 8 in [49]. Credit: Cesare V., Diaferio A., and Matsakos T., A&A, 657, A133, 2022, reproduced with permission © ESO.
Figure 7.
Temperature radial profiles of the hot, X-ray emitting gas in the low-redshift and relaxed galaxy clusters A1991 (top panel) and A1795 (bottom panel). The solid and dashed lines are the RG and Newtonian models, respectively, and the dots with error bars are the measurements taken with Chandra satellite from [74]. A Hubble constant of km s−1 Mpc−1 is adopted. The figure is reproduced from Figure 14 in [28].
Disclaimer/Publisher’s Note: The statements, opinions and data contained in all publications are solely those of the individual author(s) and contributor(s) and not of MDPI and/or the editor(s). MDPI and/or the editor(s) disclaim responsibility for any injury to people or property resulting from any ideas, methods, instructions or products referred to in the content. |
© 2024 by the authors. Licensee MDPI, Basel, Switzerland. This article is an open access article distributed under the terms and conditions of the Creative Commons Attribution (CC BY) license (http://creativecommons.org/licenses/by/4.0/).
Copyright: This open access article is published under a Creative Commons CC BY 4.0 license, which permit the free download, distribution, and reuse, provided that the author and preprint are cited in any reuse.
The Teleparallel Equivalent of General Relativity and the Gravitational Centre of Mass
José Maluf
Universe,
2016
Nonlocal Gravity: Modification of Newtonian Gravitational Force in the Solar System
Mahmood Roshan
et al.
Universe,
2022
Modeling the Rising Tails of Galaxy Rotation Curves
Fan Zhang
Galaxies,
2019


MDPI Initiatives
Important Links
© 2024 MDPI (Basel, Switzerland) unless otherwise stated