1. Introduction
Water is one of the most vital natural resources, and it is essential for life to exist and it is also required for practically all human activities, including industrial use, household use, irrigation, power generation, navigation, recreation, and animal consumption purposes and worldwide water scarcity is the most difficult problem to solve. Water distribution network is part of the water supply distribution system to transport water from the service reservoir to point of users. A water distribution system comprises of pipe, nodes and pump (sometimes link sometimes node), reservoir, junctions, valves (the same as pump), and storage tanks. The primary problem for water authorities around the world is not ensuring that the water distribution system (WDS) operates to users' satisfaction. Water distribution systems are difficult to build and maintain, and they need a significant investment from asset owners. Around 80 % of the total cost of a water supply project is invested for water distribution system (Sangroula et al., 2022), this implies huge amount of investment is applied to construct for a WDS for a planned town.
According to Tiwari, (2016) water consumption is affected by population increase, urbanization, and climate fluctuation, putting additional strain on water systems. There has been developed a big imbalance between the supply and demand of water as a result of population growth, and shortage of source, improving the living standard of the customer in Sokota town. The most significant aspect of a lifetime of projected loading circumstances are the design and operation of a water distribution system.
Optimization of a water distribution network aims to find the optimal pipe diameters in the network for the given layout and demand requirements. Due to these reasons implementing optimization of water distribution system using Bentley Water GEMS Darwin Designer is safe. This software is easy and simple to use, most water engineering experts should know the application and use of Water GEMS to optimize the pipe diameter using Darwin Designer. WDN optimization can be divided into several categories, including design, operation and rehabilitation, calibration, level-of-service, monitoring system, and network testing. This paper is concerned with evaluation of water distribution system performance and determining the optimal diameter of pipes in a predetermined water distribution network.
2. Material and methods
2.1. Description of the study area
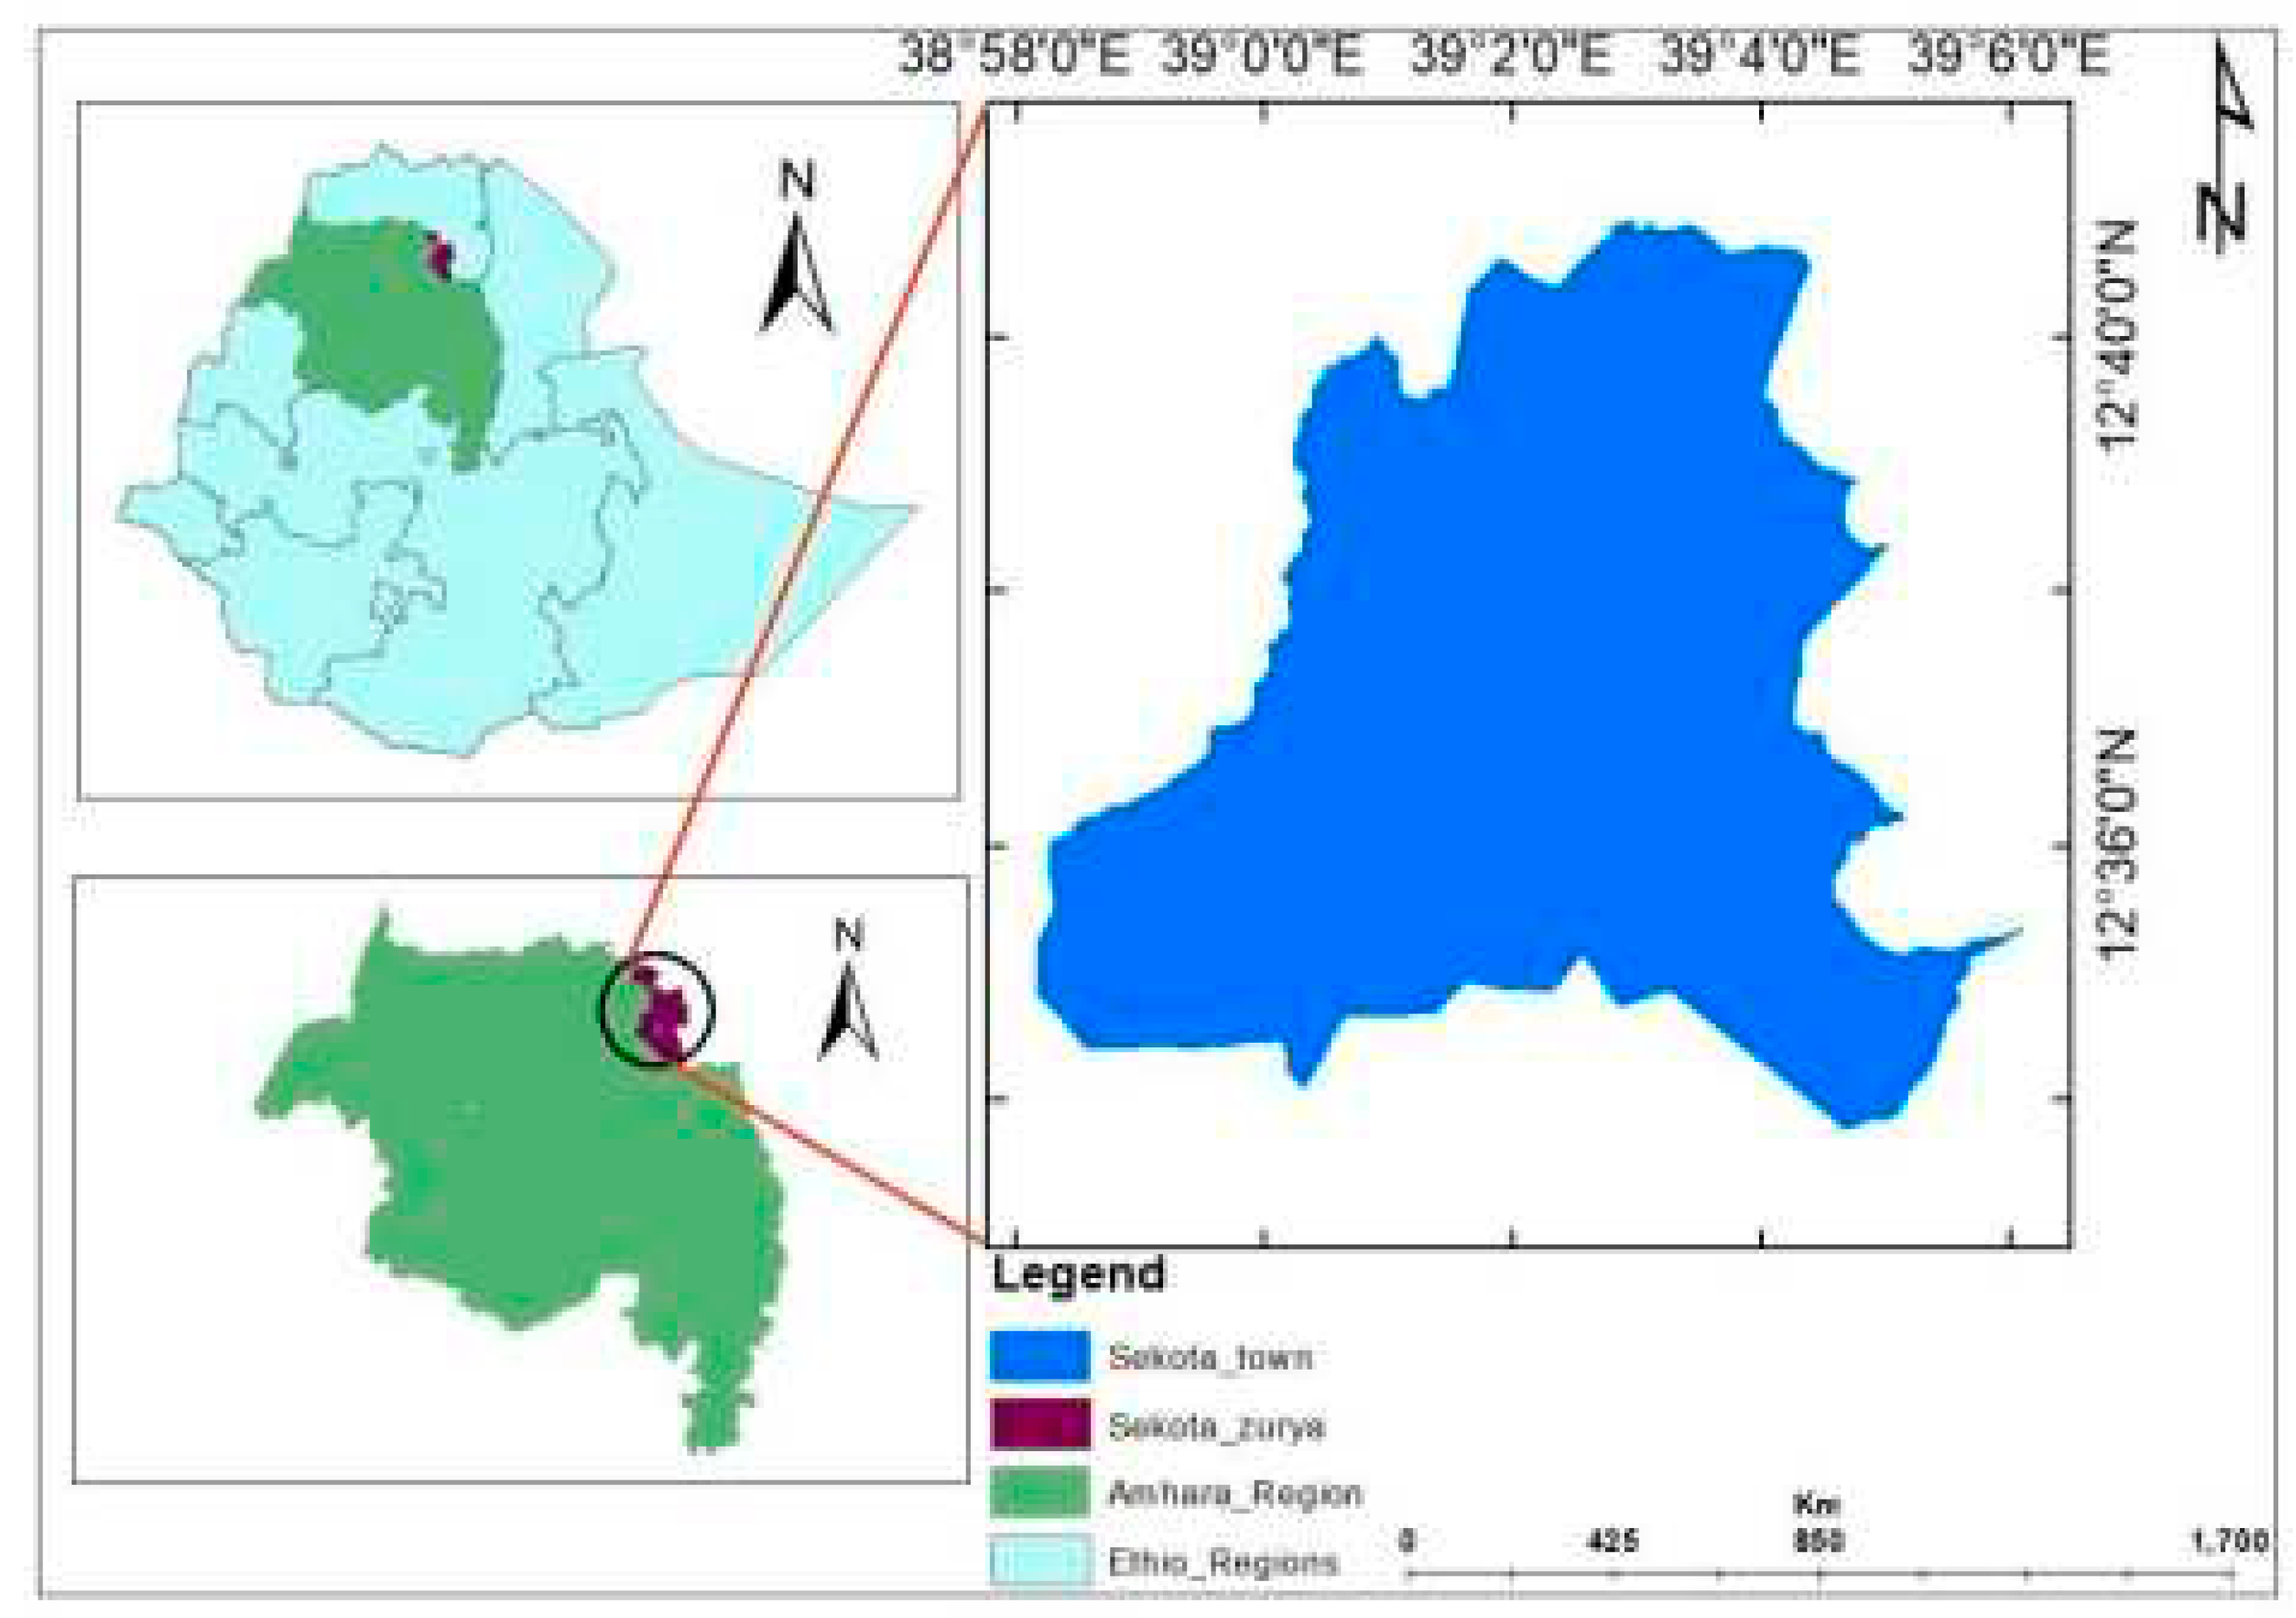
Sekota town is located in Amhara region at 720km from Addis Ababa via the road of Addis Abeba-Weldiya-Alamata, or from regional state of Bahir Dar via Lalibela at approximately 440km (source from
www.distancesto.com). It is a zonal state of Wag-Himra and lies between 12°33′30′′-12°41′00′′N and 38°58′00′′-39°06′00′′E.
Figure 5.
Map of the study area.
Figure 5.
Map of the study area.
2.2. Materials used
The materials used in this research to achieve the research goal. Because of materials are key elements to facilitate the research work. Materials, which were used in this research topographical map, computer, Mobile camera, and GPS.
Table 1.
Material used and their functions.
Table 1.
Material used and their functions.
| No
|
Material used |
Function |
| 1 |
Water GEMS for ArcMap |
Use to extracted elevation of junctions, prepare the map of the study area, make shapefiles |
| 2 |
Gauge pressure |
Used to measure the pressure for the selected sample points |
| 3 |
Water GEMS |
To analyze the hydraulic and optimize the hydraulic parameters like pressure, velocity and from the beginning to the end design water distribution network. |
| 4 |
GPS |
Used to find the x and y coordinate of the storage tank, sources (reservoirs), and collection chambers. |
| 5 |
AutoCAD LT 2016-English |
Used for convert for the layout from “dwg” format to DXF format |
| 6 |
Google Earth pro |
Used for connect the source and collection chamber with the distribution network |
2.3. Methods of data analysis
2.3.1. Hydraulic modeling
Using physical characteristics and equations, a pipe network is represented through the process of hydraulics modeling. In a hydraulic model, the fluid or water is moved through the network by gravity or pressure difference. The SWSDS model has 63 demand nodes, 98 pipe links from the source to distribution network, 1 storage tank, 2 collection chambers, 3 sources (reservoir), 3 submersible pumps and 2 booster pumps. Water GEMS Connected Edition V10.02.03.06 is a hydraulic software, which was used for water distribution modeling and optimization, and made it simple to design and optimization a distribution network for continuous and intermittent water supply.
Nodal elevation extraction
The elevation of each junction was extracted using TRex in Water GEMS and it is integrated with ArcMap. Using the following steps extract the elevation of each node.
Figure 8.
Extraction of nodal elevation.
Figure 8.
Extraction of nodal elevation.
2.3.2. Calibration and Validation
A model's reliability is ensured if its output or simulated value is accurately corresponding to the values observed in the field. Therefore, a model needs to be calibrated in order to have confidence in its results. Calibration was implemented using Darwin Calibrator for the measured pressure value.
Coefficient of determination (R2): -The degree of the association between the observed and simulated values is indicated by the coefficient of determination (R
2). R
2 's description of the linear relationship between the two data sets is one of its main limitations, therefore using a faulty model that continually overestimates or underestimates the observations may result in a high R
2 value (Dufour, 2011).
Where: - 𝑃𝑜𝑏, 𝑖= observed pressure for junction i
𝑜𝑏= mean observed pressure for sample junction
𝑃𝑠𝑖𝑚, 𝑖= simulated pressure for junction i
𝑠𝑖𝑚= mean simulated pressure for sample junction
Mean error (ME): The difference between the measured and computed pressures is the mean error. Values closer to zero demonstrate better agreement between simulated and observed values, and the ranges from -∞ to +∞ (ATSDR, 2000).
Pob,i = observed pressure for junction i
Psim,i = simulated pressure for junction i
n = number of sample points
Root means square error (RMSE): The difference between observed and simulated values is measured on an individual basis using the simulation error's standard deviation (RMSE) (based on individual residues). Its values vary from 0 to +∞, with values nearer zero indicating better agreement between simulated and actual values. More values of RMSE imply poorer model performance, whereas lower values show higher accuracy of the model performance (Chai & Draxler, 2014).
Pob,i = observed pressure for junction i
Psim,i = simulated pressure for junction i
n = number of sample points
As Hunter, (2002) explained a good data set should have a pressure average difference of ±1.5m to a maximum of ±5.0m, and a poor data set should have a pressure average difference of ±3.0m to a maximum difference of ±10m
The sample points for the study area are listed in
Table 3.
2.4. Water supply coverage analysis
The total annual consumption divide by the number of days of year (365) is called average day demand.
2.5. Average day demand by mode of service
The annual consumption by mode of service for Sekota town was gathered and shown in
Table 4 for Sep. 2020 to Aug. 202.
2.6. Distribution system analysis
2.6.1. Model performance evaluation
Running the model for the current year, Sep. 2020 to Aug. 2021, average daily demand, at demand peaks, and at temporal variations with extended period simulation allowed for the analysis of the existing system's model.
2.6.2. Sustainability analysis using hydraulic performance
As Genetie, (2019) studies the sustainability index, that explain, is the product of reliability, resilience, and vulnerability.
Where: - Rel= reliability, Res = resilience, and Vul = vulnerability Reliability: the probability that the WDN is in a suitable state is known as reliability (Rel), and it is defined as follows:
Resilience: reflects how quickly the system recovers from failure. The capacity of a system to recover back after a breakdown and carry on with respectable operation is known as resilience (Res). If there is no failure on the system resilience is one, otherwise it is below one (Jalal, 2008).
The vulnerability is calculated by dividing the total amount of unsatisfactory values by the total amount of values across the simulation time.
Pressure analysis
The pressure of water supply distribution system for Sekota town was estimated or calculated using Water GEMS.
Velocity analysis
The analysis of the pipe velocity is the same as pressure analysis. The boundary of the pipe flow velocity is, minimum 0.3m/s and maximum 3m/s MoWR, (2006).
Head loss analysis
Flow velocity, length and diameter of pipe, roughness coefficient and Reynolds number all these affects how much head loss happens in a pipe. Head loss is reduction of total head of water as moves through the system and it is not avoidable. Head loss has direct relationship with velocity. Water GEMS calculated the head loss using the Hazen-Williams formula.
Where: -
hl = head loss (m), Q = flow in pipe segment (m3/s), L = length of the discrete pipe (m),
D = diameter of the pipe (m), C = Hazen-William’s roughness coefficient
2.6. Optimization of water distribution network
Water GEMS is one of the most popular and user-friendly hydraulic modeling and optimization software package (Sonaje & Joshi, 2015). In this study, Darwin designer will be used to optimize WDN based on genetic algorithm in Water GEMS model. In order to solve optimization problems with very vast solution spaces that cannot be solved using more conventional optimization techniques within the GA parameters, Darwin Designer was utilized (Ali, Abozeid, Darweesh, & Mamdouh, 2015).
Objective function
The goal of this thesis is to reduce the economic cost of pipe while meeting the minimum pressure, velocity and tank volume requirements.
Where: - z = total pipe cost (birr), k = unit cost of pipe i which has specific diameter (birr/m), L = length of a pipe (m), d = diameter of a pipe i (mm)
Hydraulic constraints
Water distribution system must be constrained with pressure, velocity, and diameter in case of pipe, junction.
Pipe constraints
Any “n” pipe associated with velocity over time interval t may be limited by minimum and maximum value denoted as:
Where: Vn(t) is the flow velocity of pipe “n” at time t and Vmin and Vmax represents the minimum and maximum allowable flow velocity for any pipe respectively.
Node constraints
The pressure at any junction “j” may be limited between a maximum value and a minimum value for each operating time interval. This can be stated as follows:
Where: - Pmin = allowable minimum pressure Pj(t) = simulated pressure at junction j at time t Pmax = maximum allowable pressure
Where: - Qi and Qo discharge in and out of the junction whereas q = is external demand at a junction.
Energy balance constraints
Where: hf = is the conservation of energy state that the head loss for a loop as in equation above described the summation energy balance for a loop is equals zero.
3. Result and Discussion
3.1. Hydraulic modeling
Due to rapid population growth and high-water losses from the distribution network, the system’s total water demand in Sekota Town exceeds the water supply at the moment. Higher pressure systems, that are regularly employed to limit overall demand and encourage unequitable distribution of the water supply.
Demand pattern
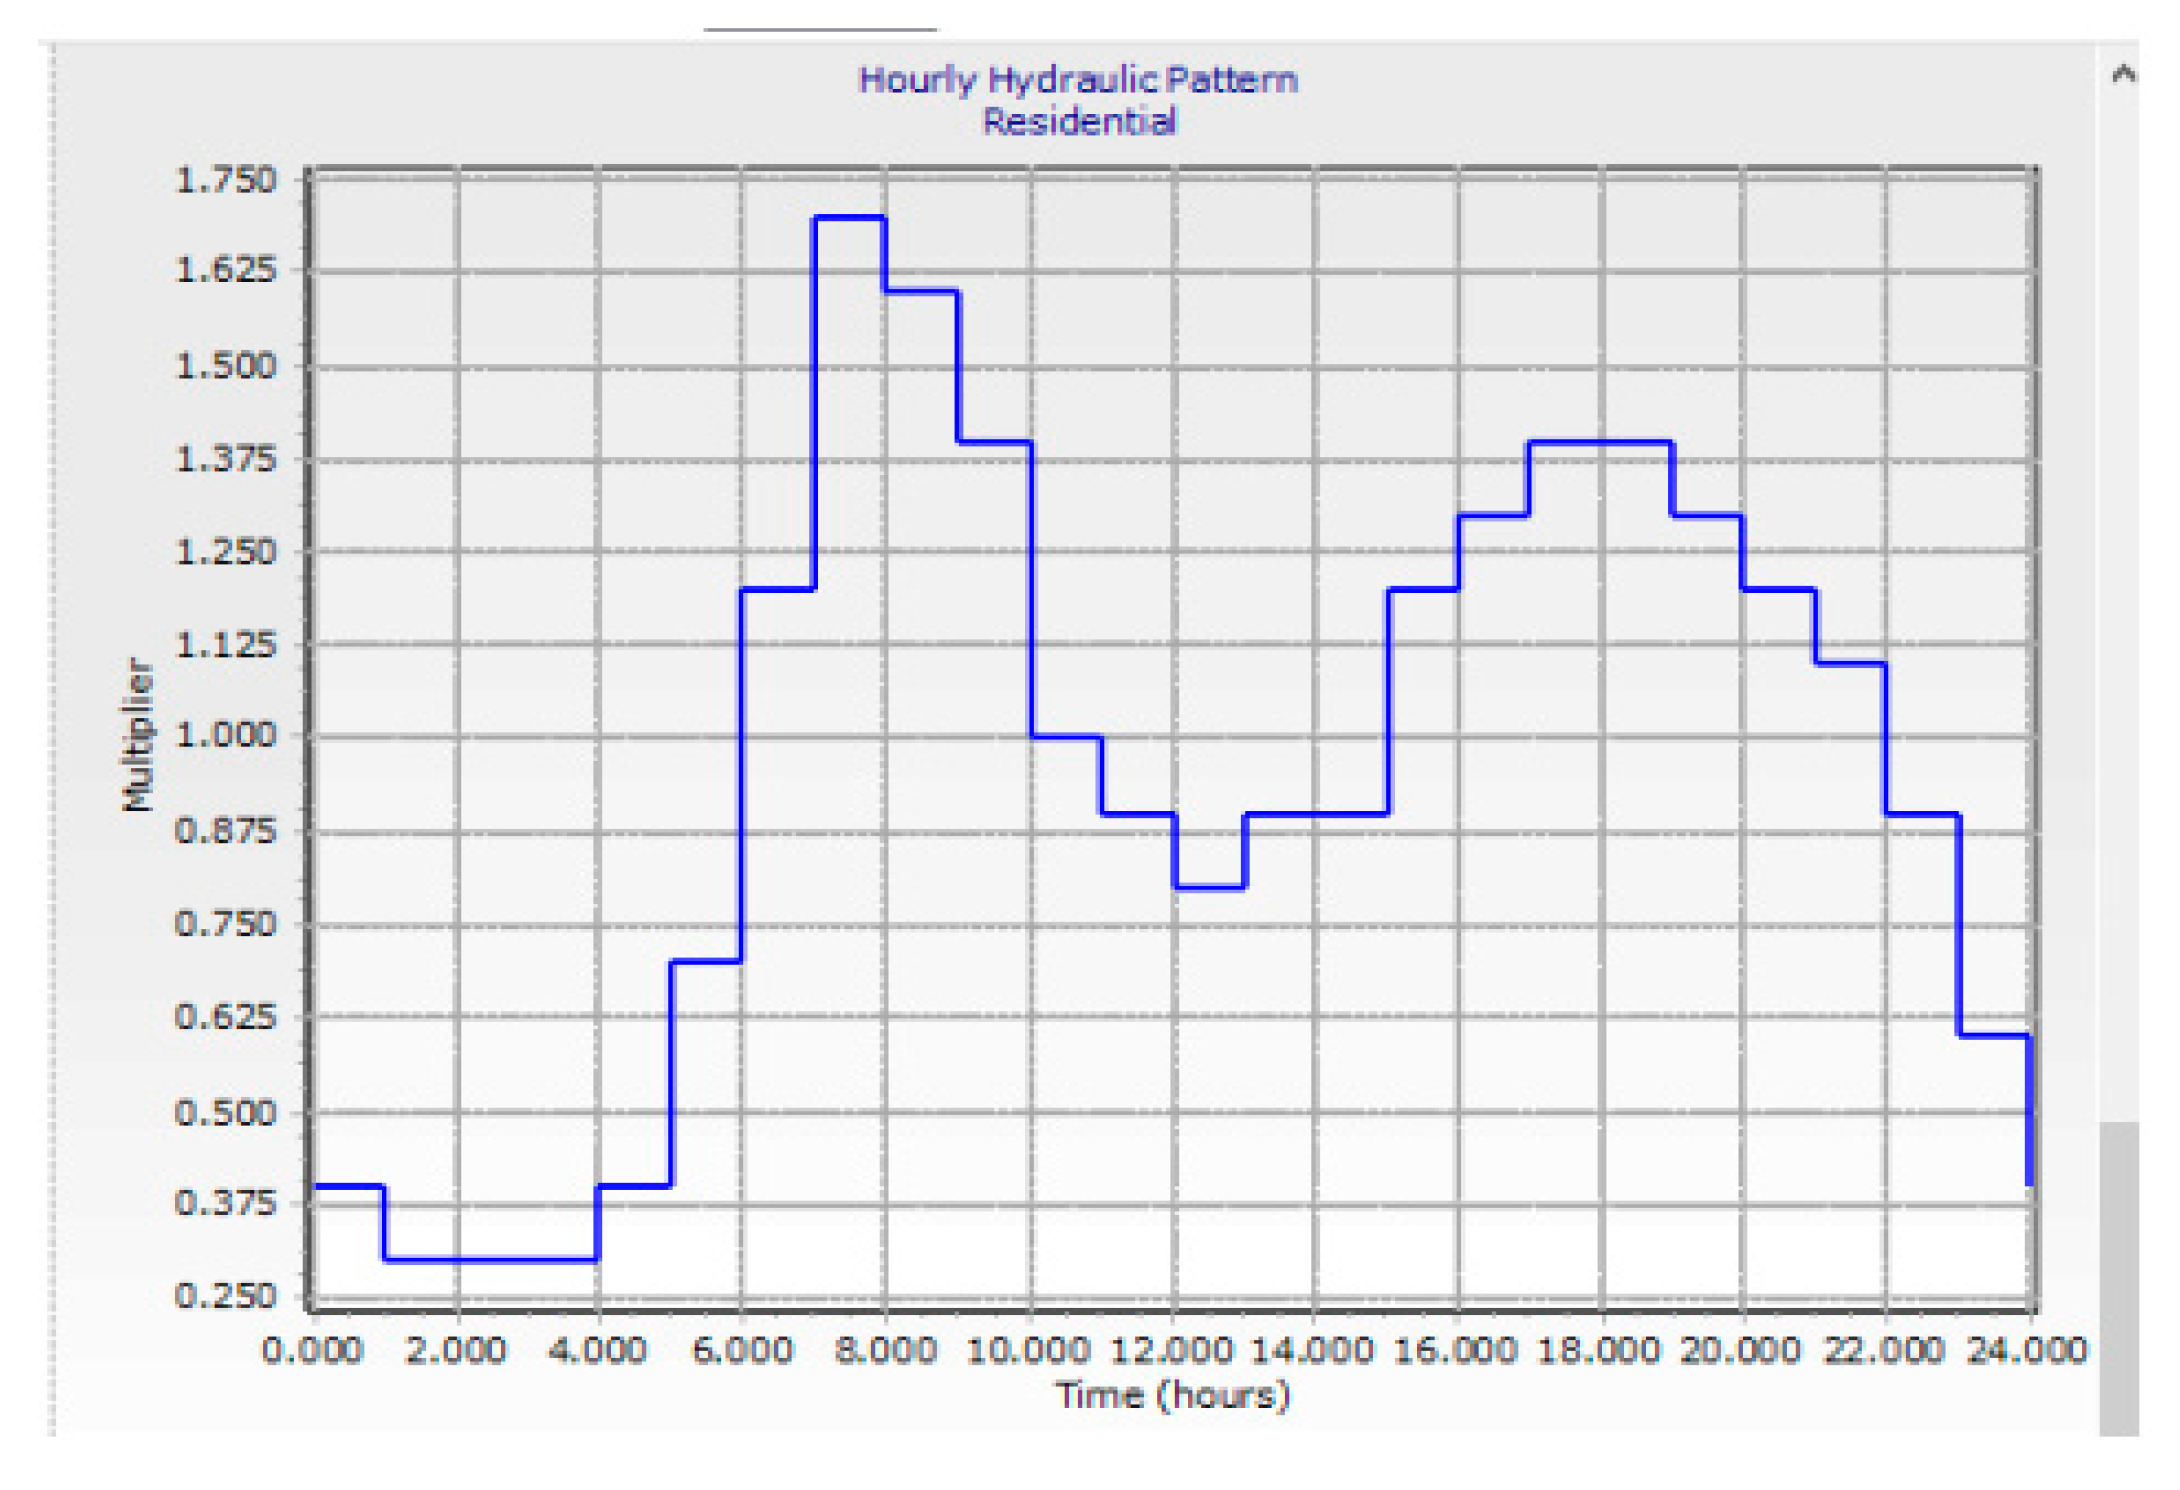
As SWSSO yearly reported, the hourly water demand pattern in the existing WDS as shown
Figure 12. Examining the present water demand pattern in the area is critical for simulating and optimizing the WDS in Water GEMS using EPS.
Figure 12.
Hourly demand factor for Sekota town.
Figure 12.
Hourly demand factor for Sekota town.
Calibration and validation
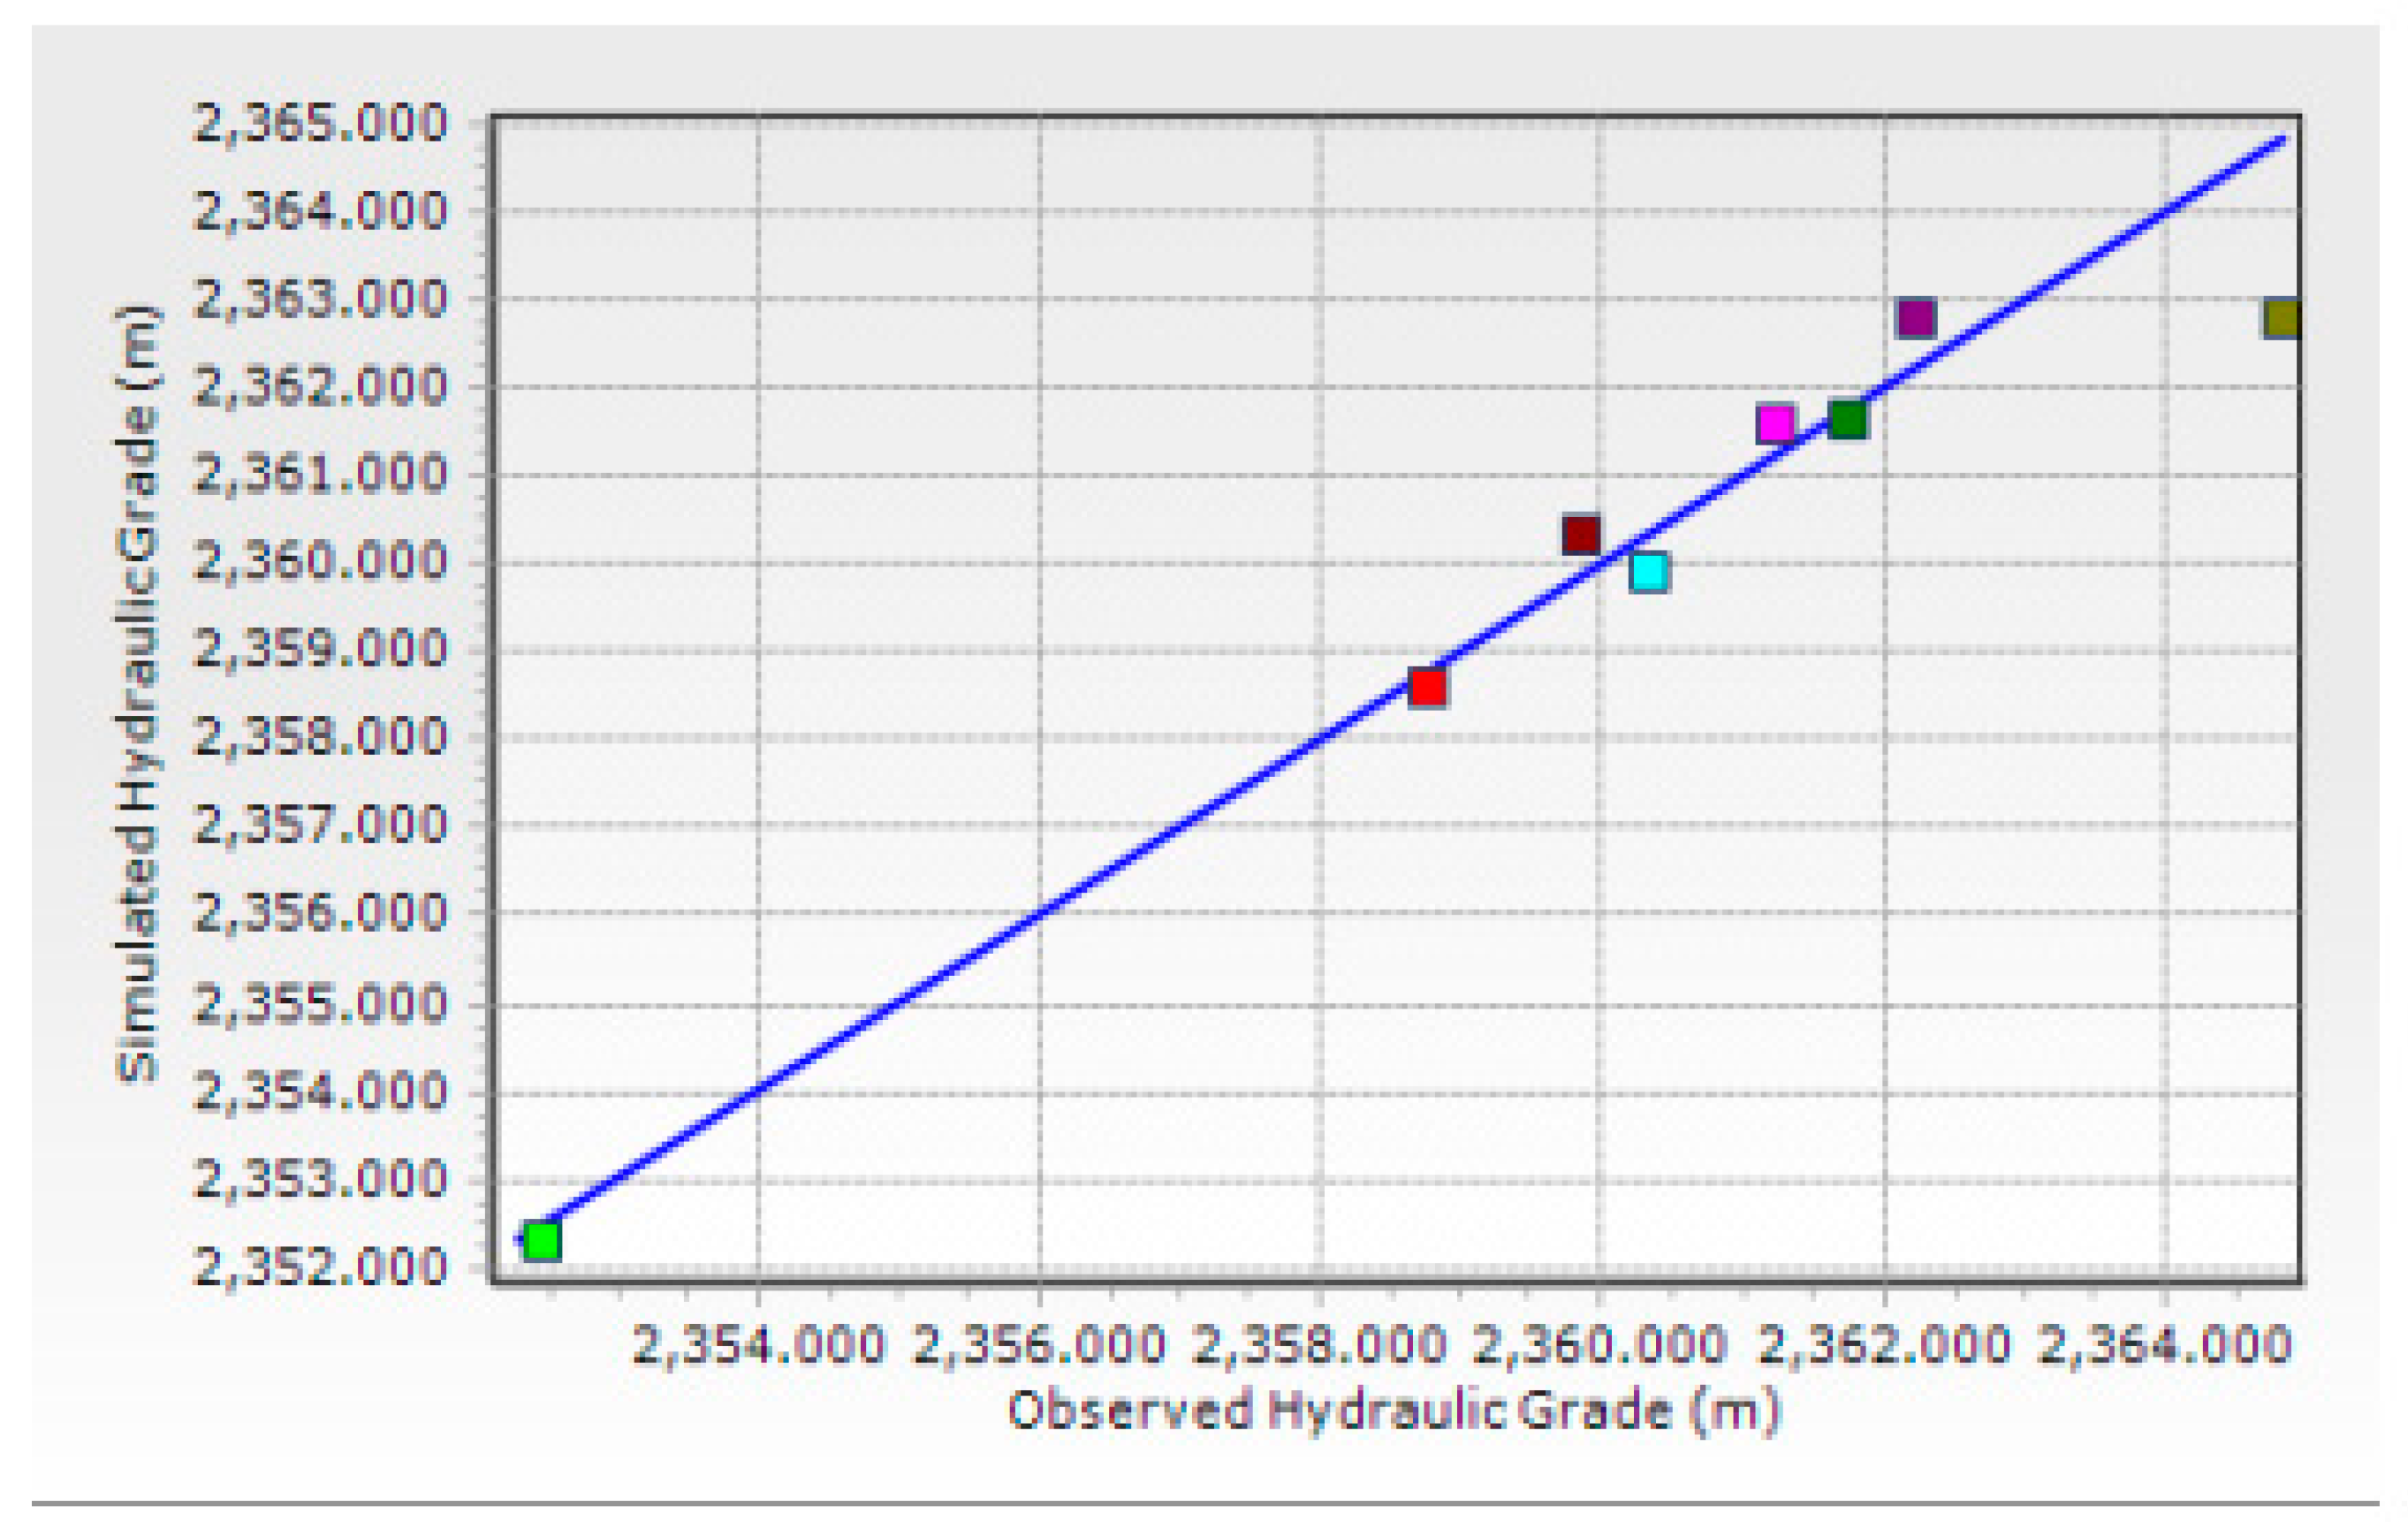
Figure 13 shows a strong correlation between the simulated pressure values using Bentley Water GEMS with measured values obtained from the sample points using pressure gauge.
And the fitness value of this graph is 1.96, thus it indicates the model is best and accurate to run hydraulic model and got ready to analysis.
Figure 13.
Calibration of hydraulic model using Darwin Calibrator.
Figure 13.
Calibration of hydraulic model using Darwin Calibrator.
Model performance evaluation criteria
The Water GEMS model performance was evaluated using statistical evaluation methods such as R
2, ME, and RSME, the obtained results are presented in Table 10. Table 11 Summery of performance criteria.
| Performance criteria |
Results |
| R2
|
0.988 |
| ME |
0.0175 |
| RSME |
2.79 |
The performance evaluation results revealed that the Water GEMS has a promising approach to simulate the water pressure at nodes in the WDS. As explained in ATSDR (2000) an ME of pressure difference of ± 15.2kPa (± 1.52 m) with a maximum difference of ± 50.3 kPa (± 5.03 m) characterizes a good performance set. The ME of the Sekota, on the case, is 0.0175. As a result of these calculated pressures, the Water GEMS model has a very good pressure performance in the research area.
3.1.1. Pressure analysis
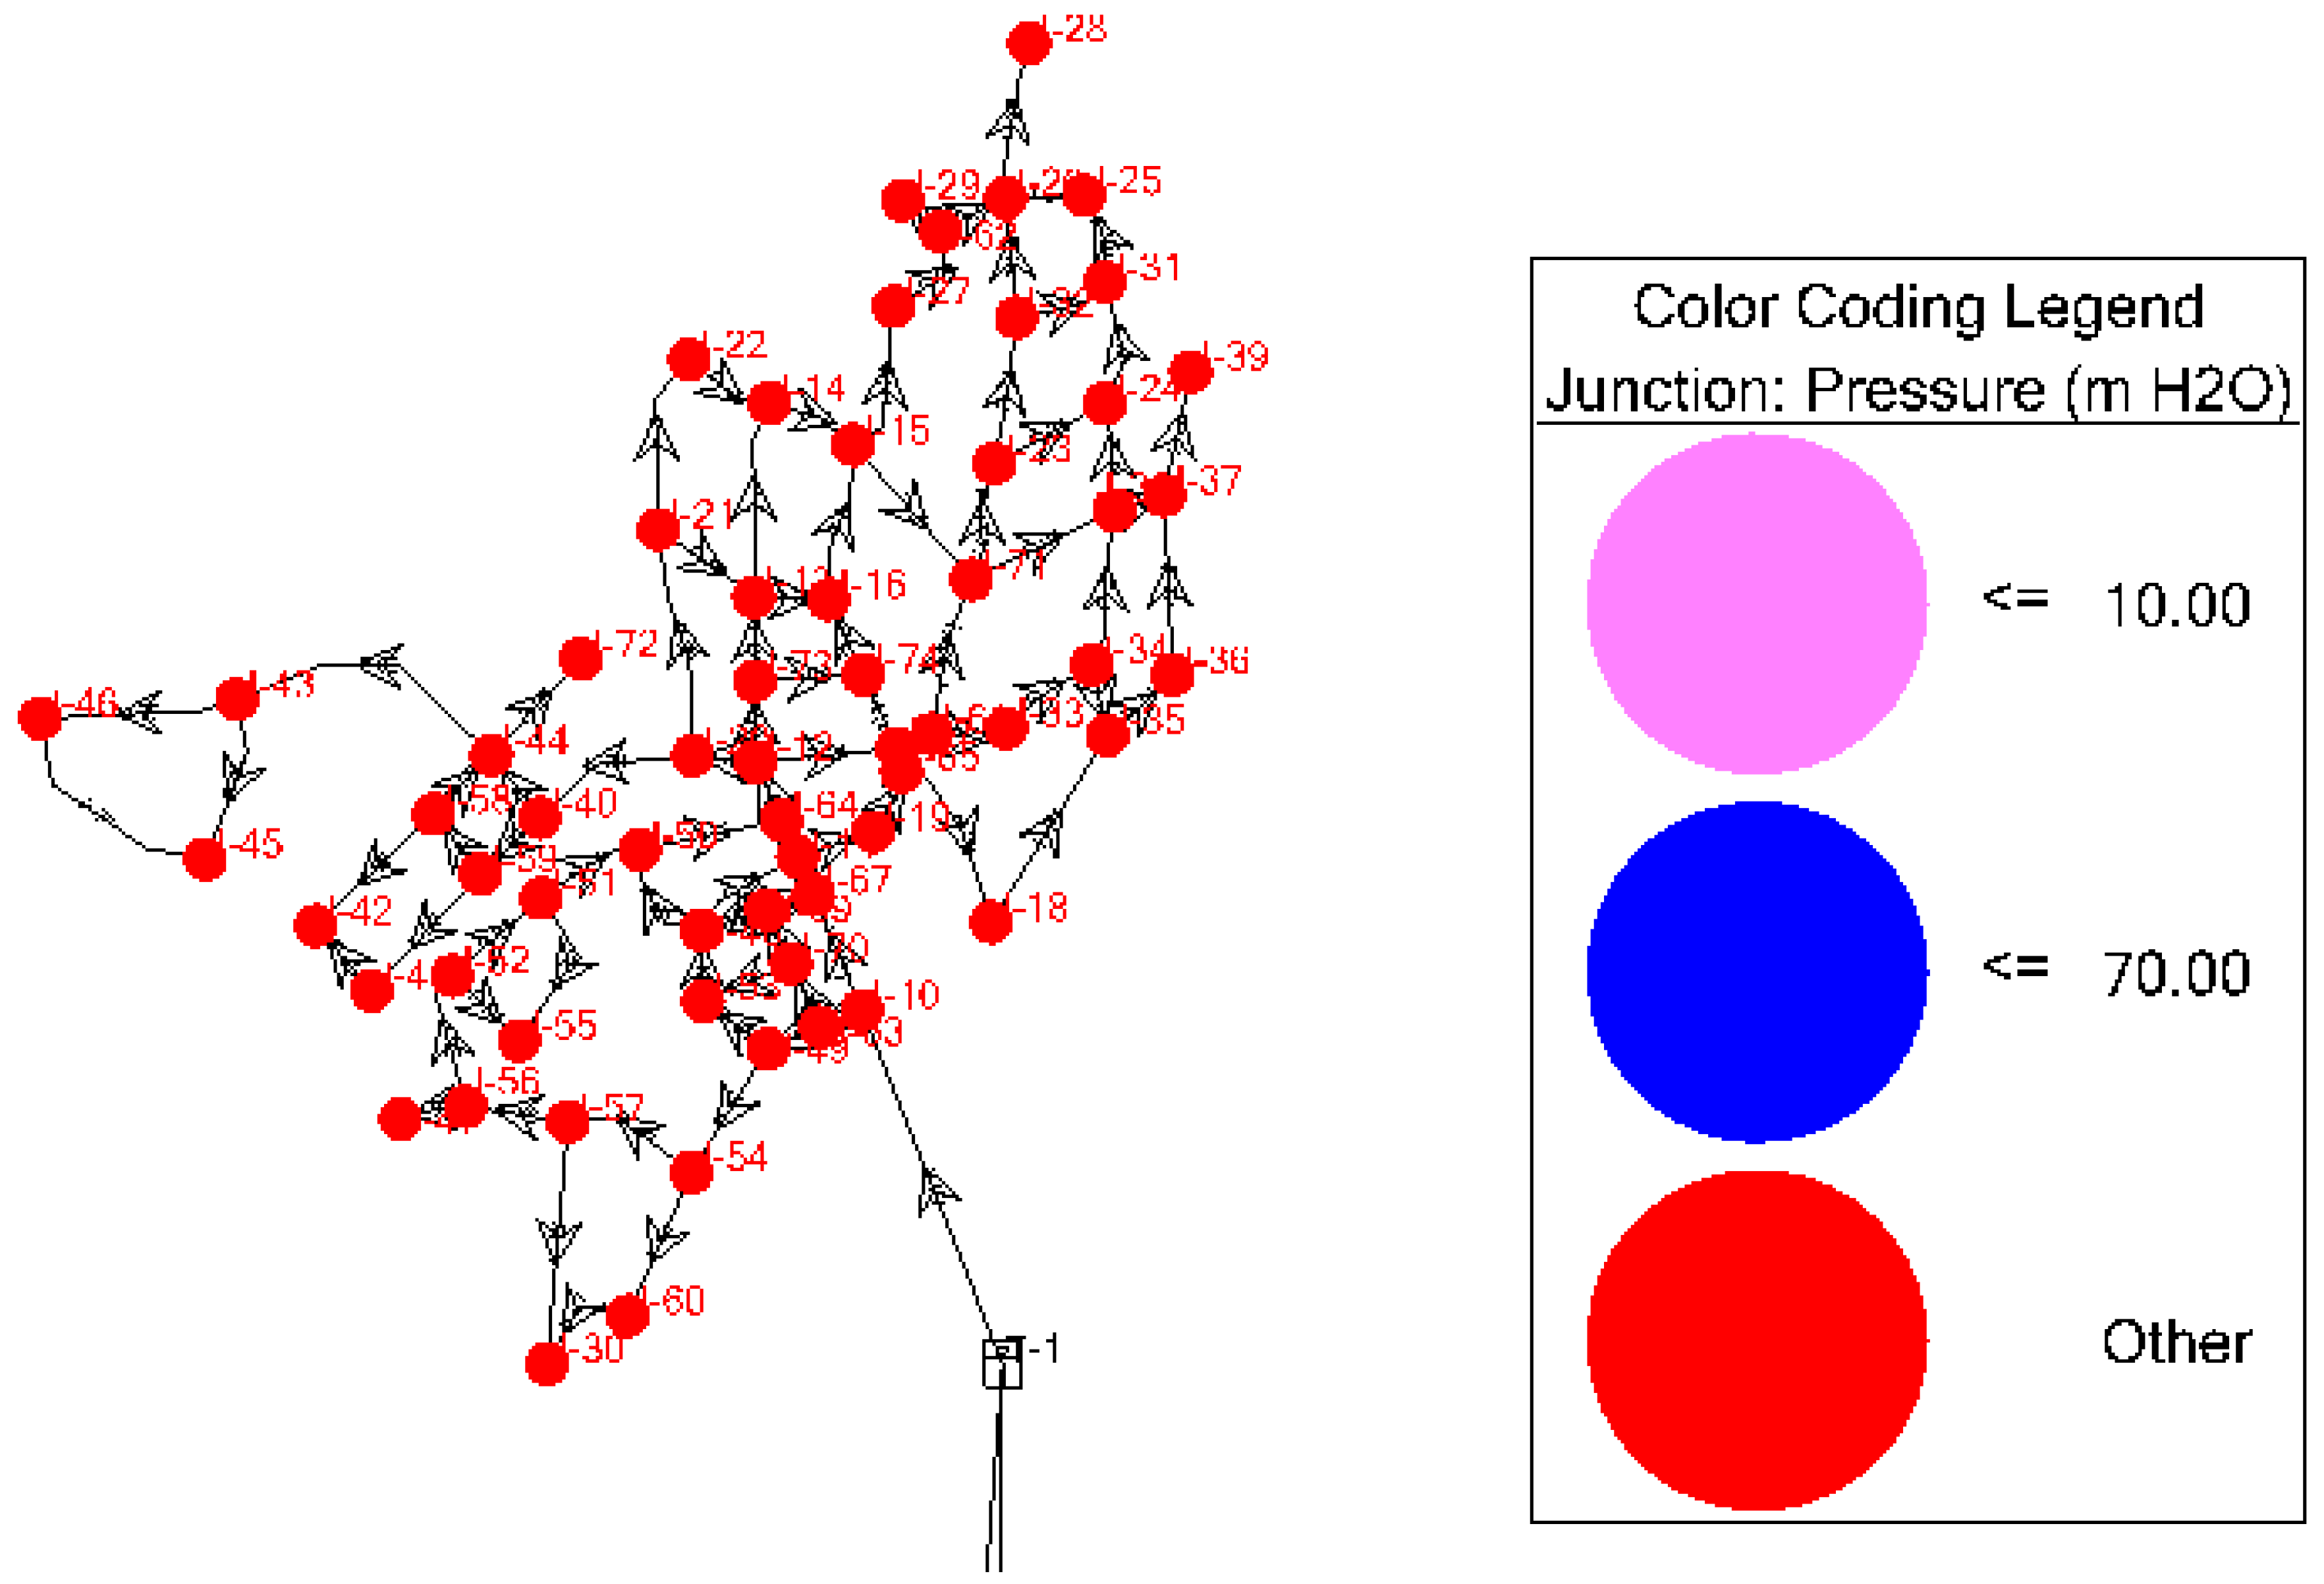
For water supply distribution network's minimum and maximum operating pressures are 10 m and 70 m respectively with regard to MoWR, (2006) guideline.
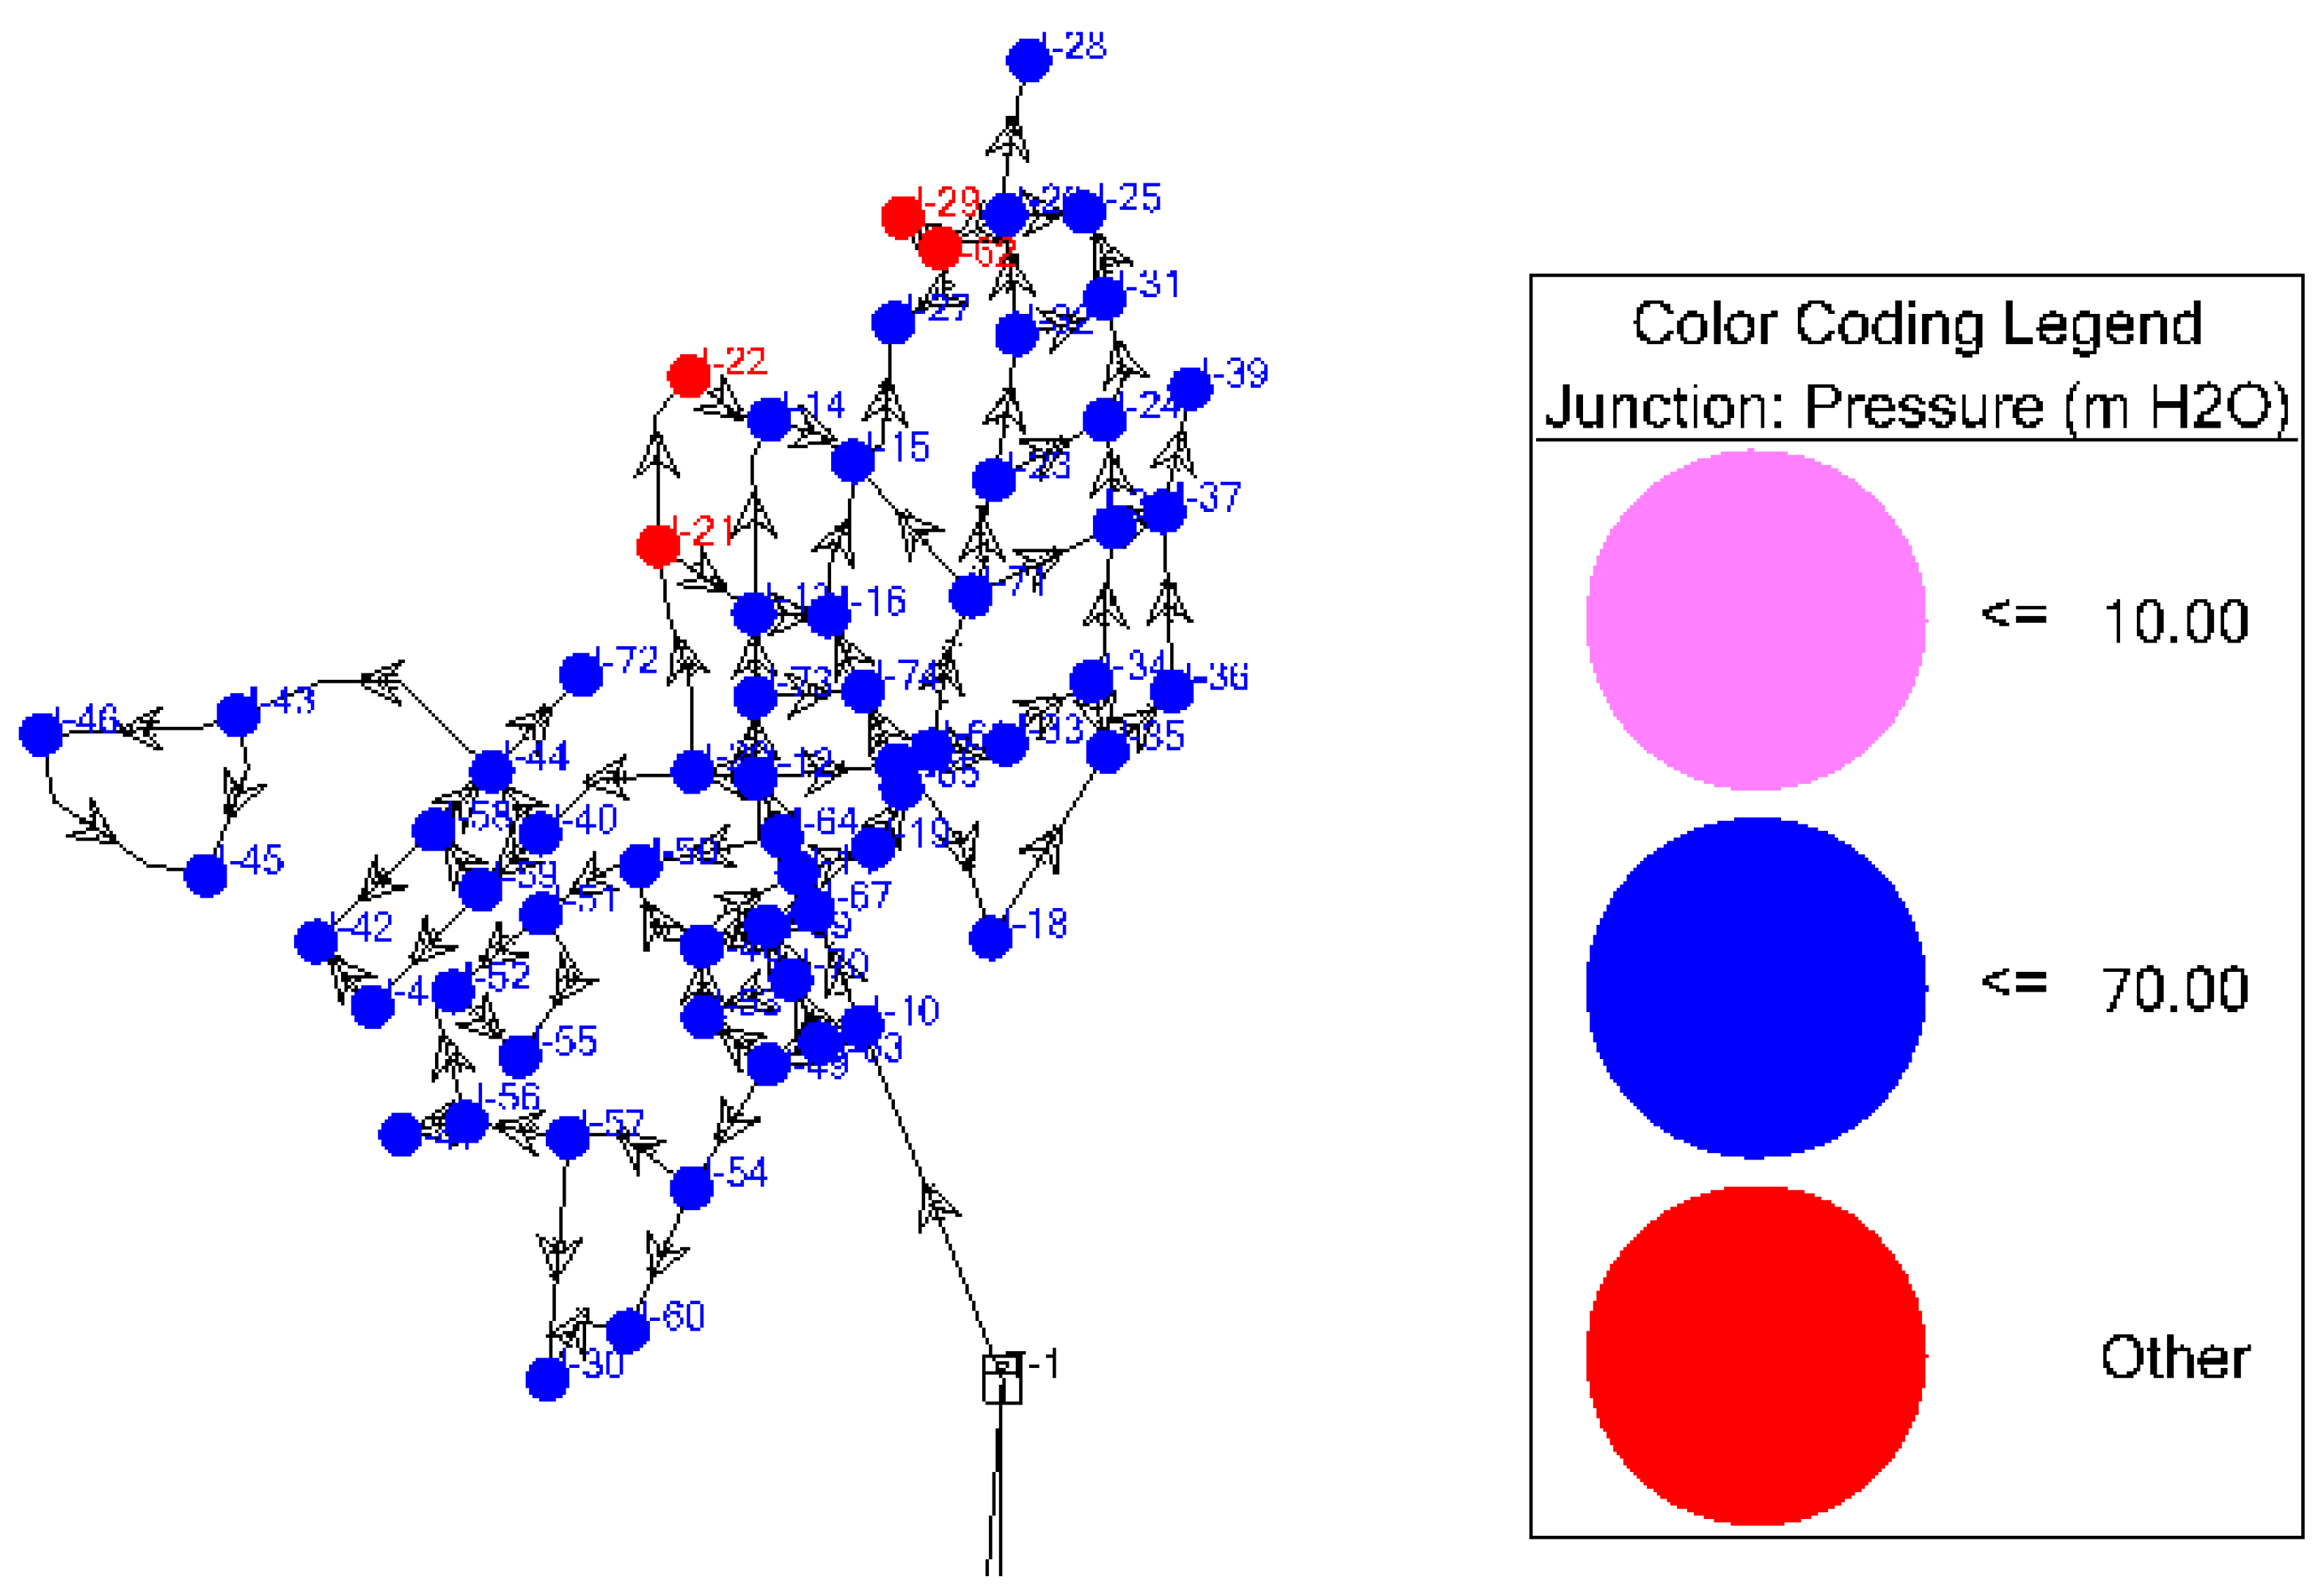
Figure 16.
Existing SWDN pressure analysis.
Figure 16.
Existing SWDN pressure analysis.
This result indicates 100% of the system is under risks, therefore it should be improved for good performance and to get permissible pressure using Water GEMS.
3.1.2. Velocity analysis
In order to prevent structural problems or undesirable hydraulic regimes brought on by high flow rates or to lessen the detrimental impact of extremely low flow rates on delivered water quality, it is required to control flow velocities in water distribution networks.
3.2. Hydraulic performance analysis
The first and most obvious activity to focus on when enhancing hydraulic performance is performance evaluation.
Sustainable analysis
The sustainable index of the system is below 0.5, due to this result the performance of SWDN is very low.
3.3. Optimized pipe diameter
Based on objective function and commercially available pipe sizes, the WDS's pipe diameter optimization was completed.
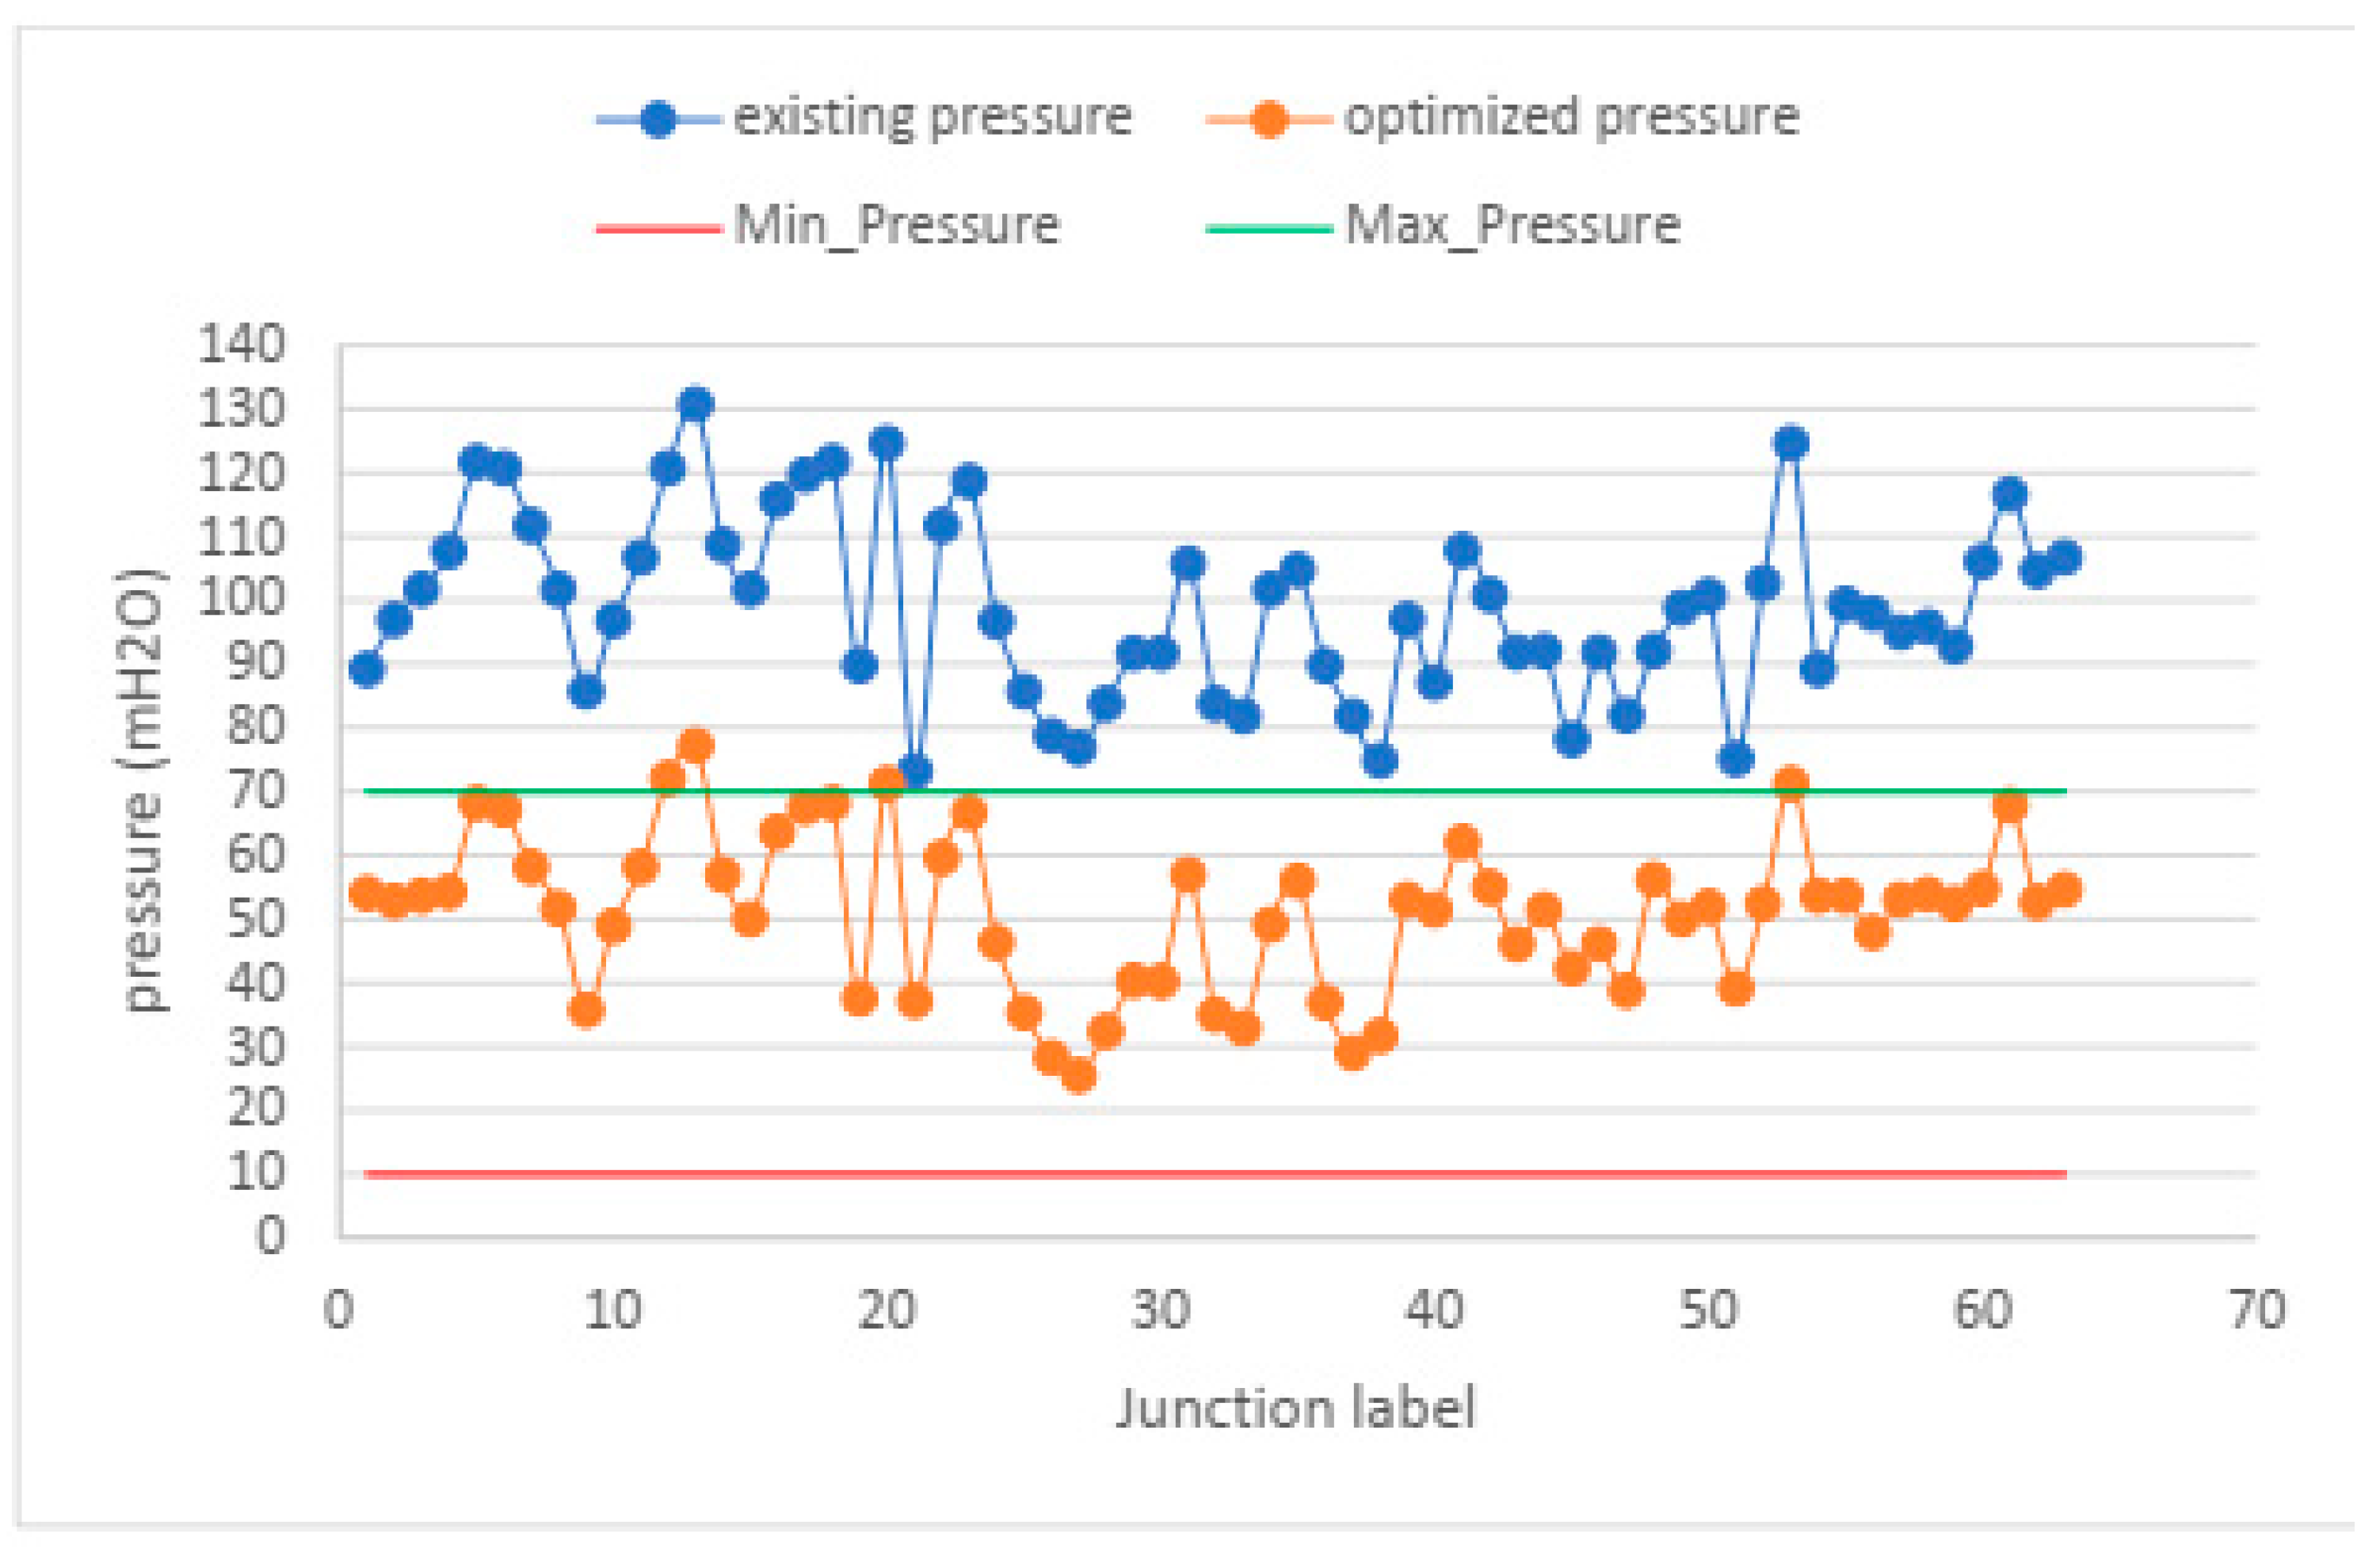
Figure 18.
Pressure value for optimized water distribution system.
Figure 18.
Pressure value for optimized water distribution system.
Figure 19.
pressure before and after optimized using scatter graph.
Figure 19.
pressure before and after optimized using scatter graph.
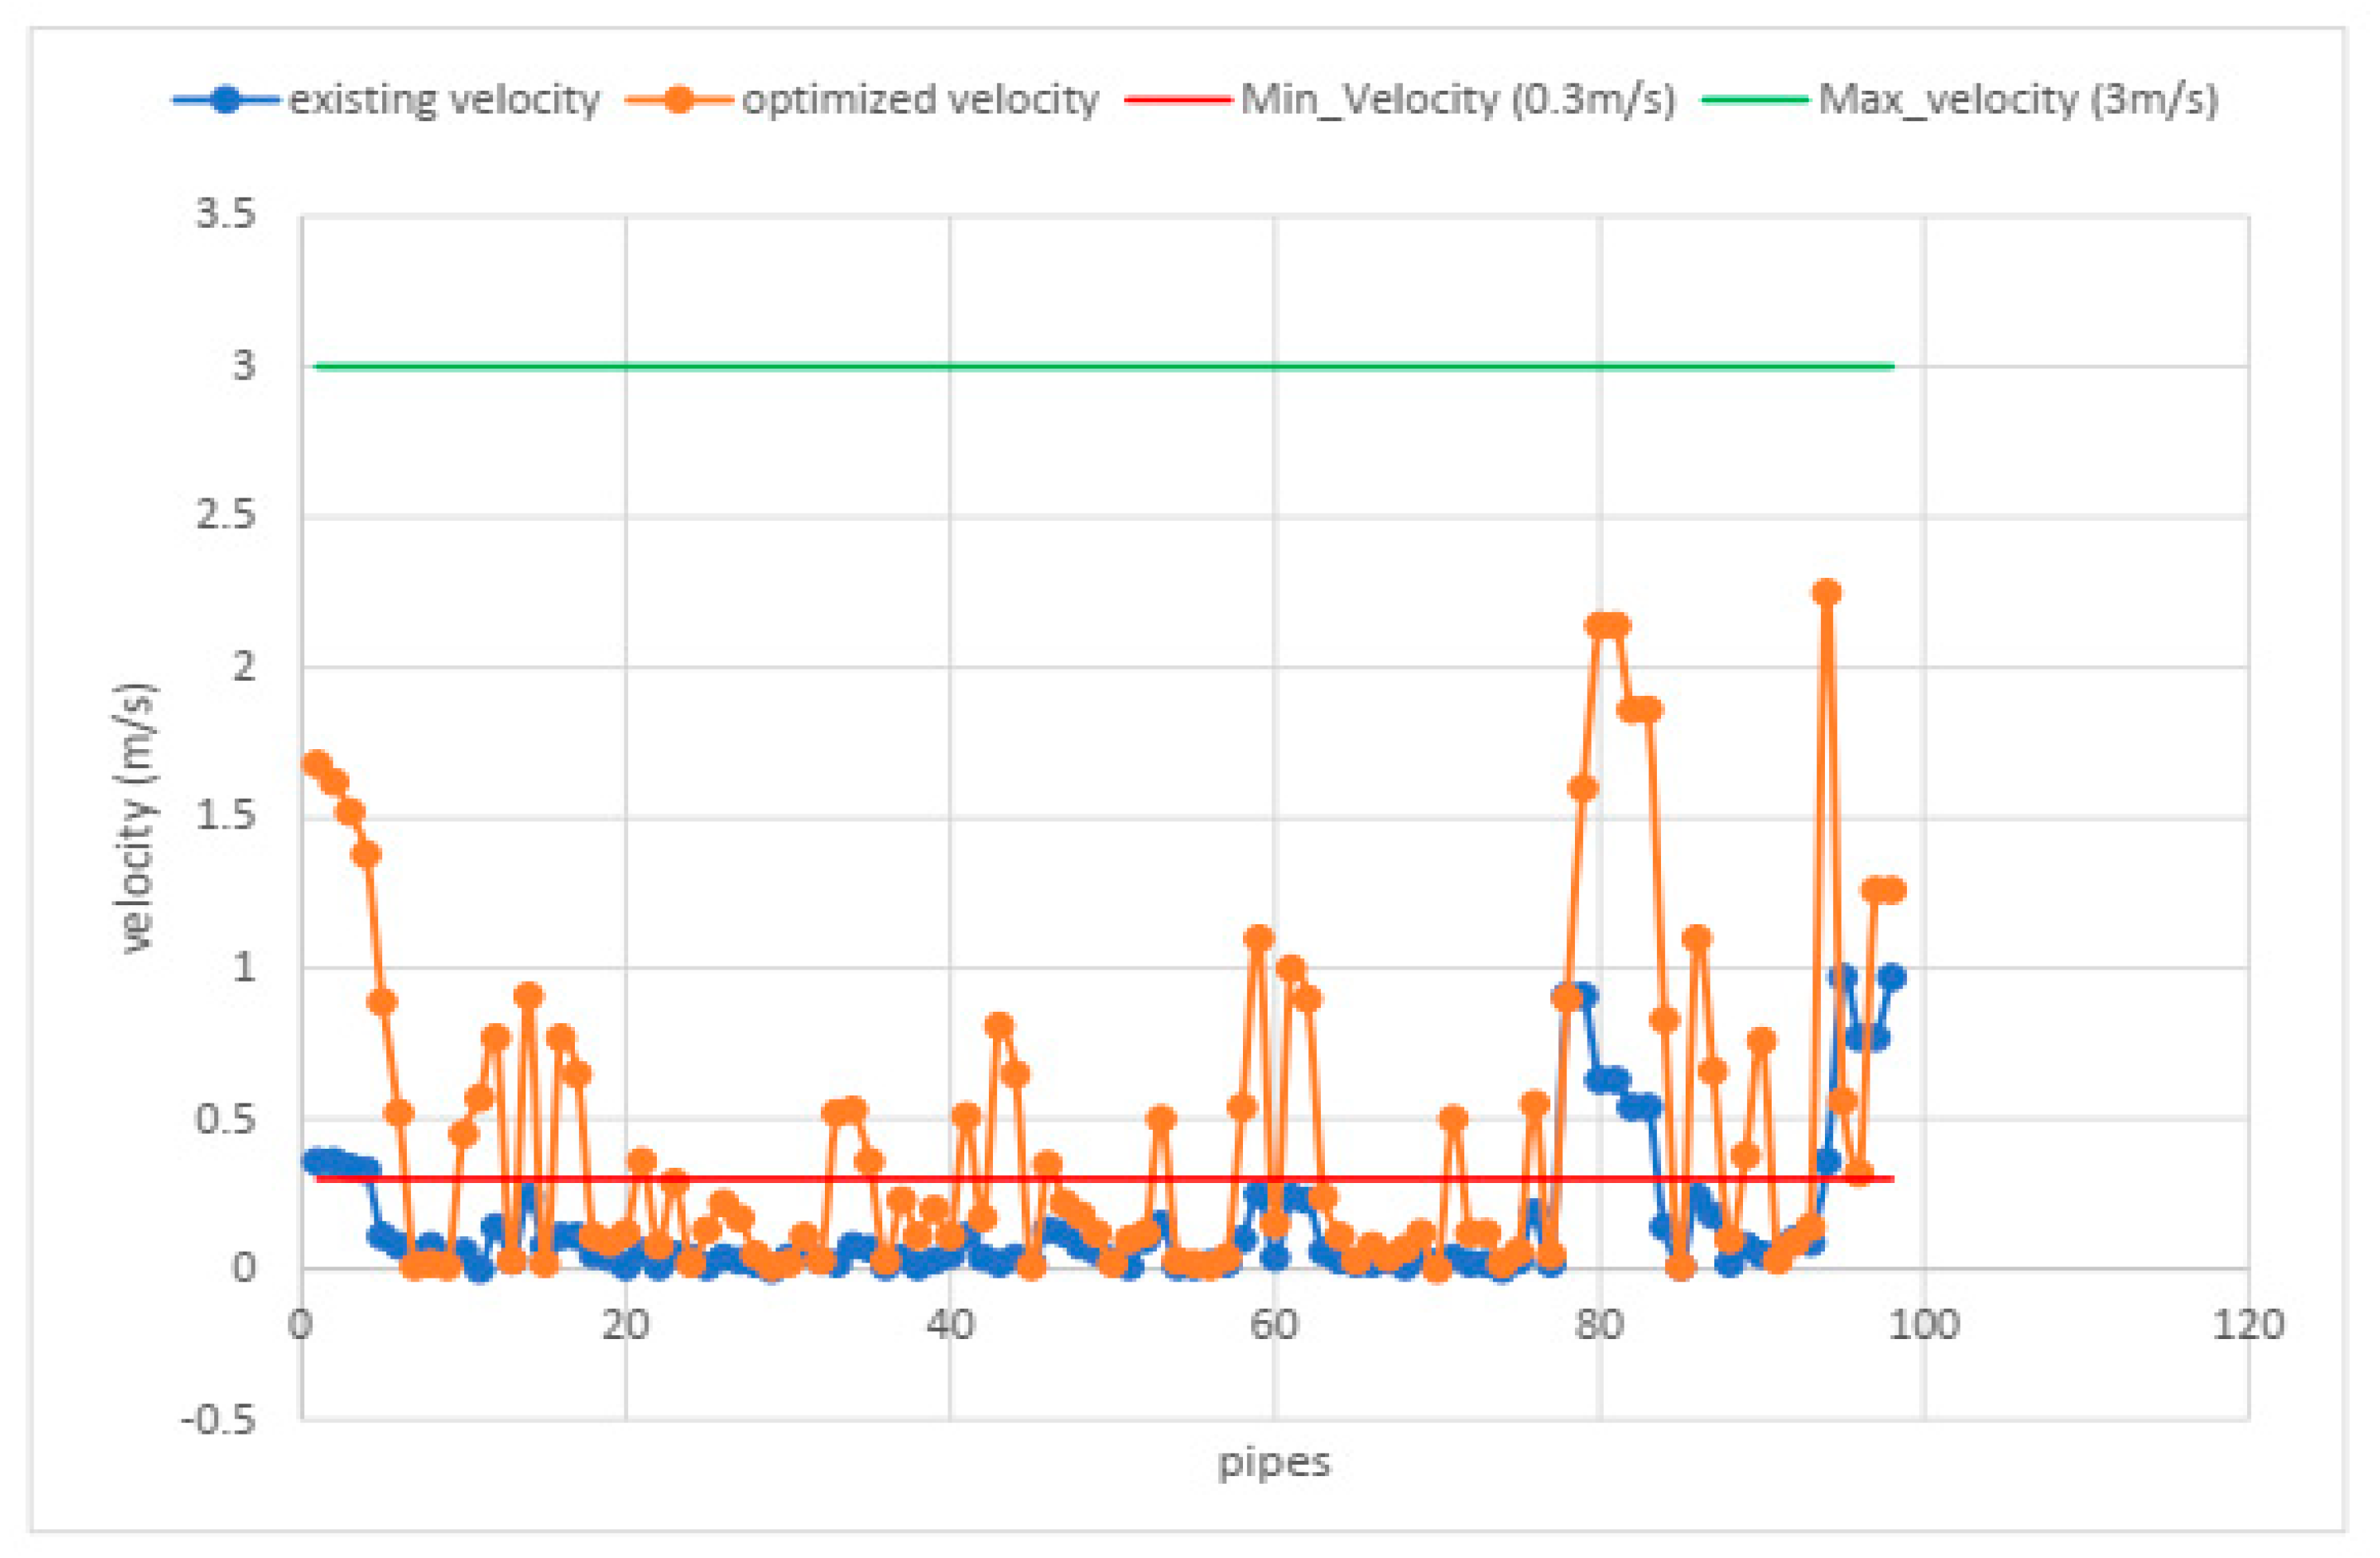
Velocity analysis after optimization
Making sure that water flow velocity is appropriate in water distribution system for its functioning correctly.
Figure 21.
velocity after and before optimization using scatter graph.
Figure 21.
velocity after and before optimization using scatter graph.
Pipe cost
The total pipe length of existing and optimized of Sekota water supply distribution system is the same, which is 30,229m. When decreasing pipe diameter during optimization, its unit cost also decreasing with somehow proportion at the same time. Pipe cost and pipe diameter haven’t directed proportion but have positive relationship. The optimized was accomplished only for the existing one not added any system.
Table 14.
Unit and total cost for existing pipe diameter.
Table 14.
Unit and total cost for existing pipe diameter.
| Diameter (mm) |
Length (m) |
Cost per unitlength (Birr/m) |
Total cost (Birr) |
| HDPE Pipes |
| 37 |
635 |
39.29875 |
24954.70625 |
| 50 |
335 |
69.37 |
23238.95 |
| 80 |
2281 |
178.86 |
407979.66 |
| 100 |
6330 |
286.49 |
1813469.04 |
| DCI Pipes |
| 150 |
4111 |
2915 |
11983565 |
| 200 |
15886 |
3922 |
62304892 |
| 250 |
651 |
5088 |
3312288 |
| Total length (m) |
30229 |
Total cost (Birr) |
79,870,387.36 |
Table 15.
Total cost of optimized pipe diameter.
Table 15.
Total cost of optimized pipe diameter.
Diameter
(mm) |
Material |
Total length
each diameter
(m) |
Cost per unit
length (Birr/m) |
Total cost
(Birr) |
| 32 |
HDPE |
5780 |
29.73 |
171,839.4 |
| 40 |
HDPE |
1562 |
45.04 |
70,352.48 |
| 50 |
HDPE |
1295 |
69.37 |
89,834.15 |
| 63 |
HDPE |
190 |
110.59 |
21,012.1 |
| 75 |
HDPE |
653 |
156.09 |
101,926.8 |
| 80 |
HDPE |
197 |
178.86 |
35,235.42 |
| 100 |
HDPE |
134 |
286.488 |
38,389.39 |
| 140 |
HDPE |
100 |
534.84 |
53,484 |
| 150 |
HDPE |
88 |
616.48 |
54,250.24 |
| 100 |
DCI |
19813 |
1939.8 |
38,433,257 |
| 125 |
DCI |
126 |
283.29 |
35,694.54 |
| 150 |
DCI |
15 |
2915 |
43,725 |
| 160 |
DCI |
85 |
698.12 |
59,340.2 |
| 180 |
DCI |
161 |
883.11 |
142,180.7 |
| 200 |
DCI |
30 |
3922 |
117,660 |
| |
Grand length (m) |
30,229 |
Grand cost(Birr) |
39,335,188 |
The total cost of the existing and optimized system is 79,870,387.36 Birr and 39,335,187.56 Birr respectively.
Decrease in pipe cost = 50.75%
This result indicated the optimized pipe is decreased its total cost by 50.75% that approximately half of the existing pipe cost.
4. Conclusion
Water GEMS software was used in this study to create the optimal water supply network design for a specific area of Sekota town. To perform this thesis first evaluated the water supply coverage and performance of Sekota water distribution network using Water GEMS, second, optimizing the existing water distribution network for least cost while not violating the hydraulic parameters especially pressure constraint for the existing network. The pressure values for the existing WSDS of Sekota town are greater than the permissible pressure value. As MoWR, 2006 guideline, the maximum pressure value of water distribution network is 70mH2O, above this value the pressure made risk on the pipe system. In case of velocity analysis, the velocity values of the system ,85% of the system, are below 0.3m/s. For branched system velocity below the value 0.3m/s is impossible, whereas in looped system like Sekota water supply distribution system, even zero velocity is possible, (MoWR 2006). For the optimal network, the findings demonstrated that the least cost solutions were discovered that somehow met the nodes and pipes requirements for pressure and velocity respectively. However, for the result of pipe velocity it is very small even in optimized network. This small value is due to small in supply water to the customer, even the water production from the source is very small. For the pipes that have small velocity values need treatment using chlorin because stagnant of water is occurred. The ratio of the existing pipe cost to the optimized cost is 36.66%, this indicated that the existing pipe network cost has been increased by 36.66%.
Generally, there were some assumptions to conduct this study, like head loss calculation was estimated using Hazen Williams formula and to calculate the cost of each pipe was used the dollar currency as birr.
References
- Brhane Beyene, T.; Demeku, S. Modeling of Urban Water Supply and Water Loss in Distribution System of Adwa Town Using Water Gems V8I Software. Int. J. Adv. Res. 2019. [CrossRef] [PubMed]
- Brownlee AE, I.; Wallace, A.; Cairns, D. Mining Markov network surrogates to explain the results of metaheuristic optimisation. CEUR Workshop Proc. 2021, 2894, 64–70. [Google Scholar]
- Chai, T.; Draxler, R.R. Root mean square error (RMSE) or mean absolute error (MAE)? -Arguments against avoiding RMSE in the literature. Geosci. Model Dev. 2014, 7, 1247–1250. [Google Scholar] [CrossRef]
- Gems, W. , Barani, G., Khalifeh, V., & Zonemat-kermani, M. (n.d.). 8931 ،هس ۀرامش ،مود و یس لاس. 8. [CrossRef]
- Gutiérrez-Bahamondes, J.H.; Mora-Melia, D.; Valdivia-Muñoz, B.; Silva-Aravena, F.; Iglesias-Rey, P.L. Infeasibility Maps: Application to the Optimization of the Design of Pumping Stations in Water Distribution Networks. Mathematics 2023, 11. [Google Scholar] [CrossRef]
- Kidanu, R.A.; Cunha, M.; Salomons, E.; Ostfeld, A. Improving Multi-Objective Optimization Methods of Water Distribution Networks. Water 2023, 15, 1–17. [Google Scholar] [CrossRef]
- Lee, S.; Kim, J.H. Quantitative measure of sustainability for water distribution systems: A comprehensive review. Sustainability 2020, 12, 1–19. [Google Scholar] [CrossRef]
- Mala-Jetmarova, H.; Sultanova, N.; Savic, D. Lost in optimisation of water distribution systems? A literature review of system design. Water 2018, 10. [Google Scholar] [CrossRef]
- Mazumder, R.K.; Salman, A.M.; Li, Y.; Yu, X. Performance Evaluation of Water Distribution Systems and Asset Management. J. Infrastruct. Syst. 2018, 24. [Google Scholar] [CrossRef]
- Mehta, D.; Yadav, V.; Prajapati, K.; Waikhom, S. Design of optimal water distribution systems using WaterGEMS: a case study of Surat city. E-Proceedings of the 37th IAHR World Congress, 20 December.
- Pineda, E.; García-Ruiz, M.J.; Guaya, D.; Manrique, J.; Osorio, F. Elimination of total coliforms and Escherichia coli from water by means of filtration with natural clays and silica sand in developing countries. Environ. Geochem. Health 2021, 43, 195–207. [Google Scholar] [CrossRef] [PubMed]
- Sangroula, U.; Han, K.H.; Koo, K.M.; Gnawali, K.; Yum, K.T. Optimization of Water Distribution Networks Using Genetic Algorithm Based SOP–WDN Program. Water 2022, 14, 1–24. [Google Scholar] [CrossRef]
- Sitzenfrei, R.; Wang, Q.; Kapelan, Z.; Savić; D. Using Complex Network Analysis for Optimization of Water Distribution Networks. Using Complex Network Analysis for Optimization of Water Distribution Networks. Water Resour. Res. 2020, 56. [Google Scholar] [CrossRef]
- Sonaje, N.P.; Joshi, M.G. a Review of Modeling and Application of Water Distribution Networks (Wdn) Softwares. Int. J. Tech. Res. Appl. 2015, 3, 174–178. [Google Scholar]
- Sunela, M. (2017). Real-Time Control Optimization of Water Distribution System with Storage, 9007. [Google Scholar]
Table 3.
Measured and simulated results of pressure at selected nodes.
Table 3.
Measured and simulated results of pressure at selected nodes.
| Junction |
Date |
Time |
observed (khalifeh et al.) |
Observed (mH2O) |
simulated |
difference |
| J-14 |
6/12/2022 |
8:00:00 AM |
11.8 |
118 |
120.8 |
2.8 |
| J-15 |
6/12/2022 |
8:30:00 AM |
12.2 |
122 |
119.77 |
-2.23 |
| J-22 |
6/13/2022 |
8:30:00 AM |
13.15 |
131.5 |
129.78 |
-1.72 |
| J-47 |
6/14/2022 |
7:00:00 PM |
7.2 |
72 |
74.2 |
2.2 |
| J-54 |
6/15/2022 |
7:00:00 PM |
7.5 |
75 |
77.59 |
2.59 |
| J-56 |
6/15/2022 |
8:00:00 AM |
7.8 |
78 |
81.2 |
3.2 |
| J-60 |
6/16/2022 |
8:00:00 AM |
7.9 |
79 |
74.57 |
-4.43 |
| J-62 |
6/16/2022 |
7:00:00 PM |
12.6 |
126 |
123.73 |
-2.27 |
| |
Summation of absolute value deference |
21.04 |
Table 4.
Water consumption based on mode of service for Sep. 2020 to Aug. 2021.
Table 4.
Water consumption based on mode of service for Sep. 2020 to Aug. 2021.
| Type of connection |
No of people served |
Total water consumed (l/day) |
Per capita demand (l/c/d) |
| House connection |
2374 |
106,830 |
45 |
| Yard shared (Brownlee et al.) |
6935 |
242,725 |
35 |
| Yard connection (shared) |
6498 |
178,695 |
27.5 |
| Public fountain |
3830 |
95,750 |
25 |
| Total |
19637 |
624,000 |
|
|
Disclaimer/Publisher’s Note: The statements, opinions and data contained in all publications are solely those of the individual author(s) and contributor(s) and not of MDPI and/or the editor(s). MDPI and/or the editor(s) disclaim responsibility for any injury to people or property resulting from any ideas, methods, instructions or products referred to in the content. |
© 2024 by the authors. Licensee MDPI, Basel, Switzerland. This article is an open access article distributed under the terms and conditions of the Creative Commons Attribution (CC BY) license (http://creativecommons.org/licenses/by/4.0/).
