
You are currently viewing a beta version of our website. If you spot anything unusual, kindly let us know.
Preprint
Article
The Impact of Digital Economy on Total Factor Energy Efficiency: A Quasi-experimental Study Based on the “Broadband China” Pilot Policy
Altmetrics
Downloads
88
Views
31
Comments
0

This version is not peer-reviewed
Abstract
In the context of the coordinated development of digital economy and environmental protection, we take the strategy of "Broadband China" as a quasi-natural experiment, adopts the panel data of 284 cities from 2007 to 2020, and evaluates the policy effect of digital economy on total factor energy efficiency through the progressive DID model. The results show that: The construction of "Broadband China" demonstration city has significantly promoted the improvement of the total factor energy efficiency of the demonstration city, but there is also significant urban heterogeneity, which is manifested in the significant improvement of the total factor energy efficiency of the eastern city, the southern city, the big city and the non-resource-based city. It has no significant effect on the total factor energy efficiency of central and western cities, northern cities, small and medium-sized cities and resource-based cities. The construction of "Broadband China" demonstration cities can improve total factor energy efficiency by promoting technological progress and strengthening environmental regulations. Therefore, we should further strengthen the construction of digital infrastructure and give full play to its positive effects. Different cities should seek differentiated development paths based on their own resource endowments and development conditions, so that the digital economy can effectively improve the total factor energy efficiency.
Keywords:
Subject: Business, Economics and Management - Economics
1. Introduction
After the reform and opening up, China's economy has continued to grow rapidly, creating a miracle of world economic growth. However, the traditional extensive mode of economic development has also led to prominent constraints on resources and environment (Huang and Chen,2023) [1]. the contradiction between economic growth and environmental pollution and resource consumption has become increasingly prominent (Wang and Cheng,2023) [2]. At present, China has become the world's largest energy consumer, and the flow constraint and stock constraint of energy supply coexist, which seriously restricts the sustainable development of economy. China's energy efficiency is relatively low, far below that of developed economies such as Europe and the United States (Liu et al.,2020) [3]. Therefore, in the new development stage, improving energy efficiency is one of the key points to achieve high-quality development. At the same time, the digital economy based on the rapid development of digital technology has become a new form and new driving force for economic growth, and its proportion in the total economy has increased year by year. According to the "China Urban Digital Economy Development Report (2023)" shows that at present, the scale of China's digital economy exceeds 50 trillion yuan, ranking second in the world, accounting for 41.5% of GDP, and the integration of digital economy and real economy is becoming closer. The report of the Party's 20th National Congress pointed out that it is necessary to further promote the energy revolution, deeply integrate digital construction with the energy revolution, and make full use of digital construction to balance economic growth and ecological environment maintenance. The impact of the development of digital economy on energy efficiency and its impact path have become the focus of attention of all sectors of society, and relevant theoretical and empirical research results continue to emerge (Tang and He,2021) [4]. However, the research and analysis of domestic and foreign literatures mainly focus on the impact of comprehensive indicators of digital economy on energy efficiency and their path analysis (Huang and Chen,2023) [1], and rarely discuss its impact on total factor energy efficiency from the perspective of the connotation of digital economy (that is, digital infrastructure construction). Compared with the existing literature that uses proxy variables such as Internet comprehensive development index and Internet penetration rate to construct digital infrastructure (Ren et al., 2021; Wu et al., 2021; Lin and Zhou, 2021) [5,6,7], to a certain extent, the endogeneity problem caused by measurement errors is avoided.
In the new round of scientific and technological revolution, the construction of digital infrastructure has helped the "Internet of everything" and accelerated the development of the digital economy (Shen et al.,2023) [8]. It can be said that the quantity and quality of digital infrastructure determine the speed and height of the development of the digital economy(Song,2022)[9]. The construction of digital infrastructure and inclusive broadband network infrastructure, represented by 5G, artificial intelligence and big data centers, has become the driving force for the sustainable development of the digital economy (Shen et al.,2023) [8]. Since the Internet is one of the important foundations for the development of digital economy, and broadband is the basis for the development of Internet (Wu et al.,2021) [6], this paper uses the "broadband China" pilot policy, a quasi-natural experiment, to study and analyze the impact of digital economy development on total factor energy efficiency and its impact mechanism from the perspective of broadband construction. Throughout the existing research, the literature closely related to this paper mainly includes the following three categories. The first category is the literature on energy efficiency measurement. Many scholars have studied and analyzed the index system and measurement methods of energy efficiency measurement. The index system of energy efficiency is mainly divided into two categories: single factor energy efficiency (Xu and Kanaado,2022; Zhou et al.,2022; Wurlod and Noailly,2018)[10,11,12] and total factor energy efficiency (Wang et al.,2012; Camioto F C, Mariano et al.,2018; Watanabe and Tanaka,2007; Bi et al.,2014;)[13,14,15,16]. The energy efficiency measurement methods are also divided into two types: stochastic frontier method (SFA) with parameter method (Sun et al.,2022; Liu et al.,2023; Aigner et al.,1977) [17,18,19] and data envelopment method (DEA) with non-parameter method (Banker and Charnes,1984; Baležentis et al.,2016) [20,21]. The second category is related literature on energy efficiency influencing factors. Scholars have studied the influencing factors of energy efficiency from multiple perspectives. Current relevant literature shows that in addition to economic development (Ohene-Asare et al.,2016) [22], environmental regulation (Lin and Xu,2017) [23], industrial structure (Wang et al.,2021) [24], technological innovation (Wang and Wang,2020) [25], financial development (Shah et al.,2022) [26], foreign direct investment (Cao et al.,2020) [27] and other factors will also have a significant impact on energy efficiency. The third category is related research on the social and economic effects of the development of digital economy. Existing literature has discussed the causal effect of the development of digital economy, and empirically tested the impact of the development of digital economy on the upgrading of industrial structure (Ma et al.,2022) [28], green total factor productivity (Lyu et al.,2023) [29], innovation performance (Zhang et al.,2022) [30], fiscal decentralization (Kopina and Kopin,2019)[31] and high-quality economic development(Li and Wu,2023)[32]. Existing studies have mainly standardized analysis of the relationship between the development of digital economy and social and economic factors. At present, there are few literatures to discuss the impact and mechanism of digital economy development on total factor energy efficiency from the perspective of digital infrastructure construction, and explore the relationship between digital economy development and total factor energy efficiency to promote the perfection and improvement of modern environmental governance system and modern energy system. Alleviating the environmental pollution and the relative shortage of energy and other practical problems has a certain theoretical and practical significance.
In view of this, we use the balance panel data of 284 cities in China from 2007 to 2020, and based on the quasi-natural experiment of "Broadband China" strategy, uses the multi-phase DID model to explore the impact of digital economy development on total factor energy efficiency, its mechanism of action, heterogeneity, and the regulatory effects of technological progress and environmental regulations. The study found that the development of the digital economy significantly improved total factor energy efficiency. Moreover, the development of digital economy has significant differences in the improvement effect of total factor energy efficiency in cities with different characteristics. Among them, the development of digital economy has a more prominent effect on the improvement of total factor energy efficiency in eastern cities, southern cities, large cities and non-resource-based cities. Environmental regulation and technological progress are important ways to improve total factor energy efficiency in the development of digital economy.
The marginal contributions of this paper are as follows: (1) Based on the perspective of digital infrastructure construction, we examine the impact of digital economy development on total factor energy efficiency, expands the research framework of digital economy development and energy efficiency, makes up for the shortcomings of previous studies that ignored the relationship between digital economy and total factor energy efficiency, and provides a scientific basis for improving total factor energy efficiency and alleviating environmental pollution and relative energy shortage. (2) The impact mechanism and heterogeneity of digital economy development on total factor energy efficiency are further discussed, which not only helps to understand the internal relationship between digital economy development and total factor energy efficiency, but also helps to deepen the understanding of the impact of digital economy development on the difference of total factor energy efficiency of various subjects with different characteristics. (3) We not only used the multi-phase DID method for research, but also used PSM-DID and other methods to effectively alleviate the selectivity bias problem. In addition, a series of robustness tests were conducted to ensure the robustness of the research conclusions, which made the research conclusions highly reliable.
The following structure is arranged as follows: The second part analyzes the theoretical mechanism of the impact of digital economy on total factor energy efficiency, and proposes hypotheses; The third part discusses the identification strategy of this paper, and introduces the samples and variables. The fourth part reports the results of baseline analysis and tests the parallel trend hypothesis. The fifth part carries on further analysis, including robustness test, heterogeneity analysis and mechanism analysis; The sixth part summarizes and summarizes the conclusions of the article, and puts forward policy recommendations accordingly.
2. Theoretical mechanisms and research hypotheses
2.1. Digital economy and energy efficiency
Existing studies show that the development of digital economy can significantly promote the improvement of regional energy efficiency (Zhang et al, 2022) [33], the improvement of digital infrastructure can not only promote the development of digital economy, but also directly promote the improvement of urban energy efficiency. First, the positive externalities generated by the construction of digital infrastructure will improve urban energy efficiency. On the one hand, the construction of digital infrastructure will stimulate the investment demand of enterprises and consumers, affect the structural transformation of the energy industry through income effect and price effect, and build the whole industrial chain of energy digitalization, thus improving urban energy efficiency. On the other hand, the construction of digital infrastructure helps to transform and upgrade the energy production, operation and sales service processes, expand energy access channels, optimize the efficiency of energy allocation, and thus promote the energy efficiency of more links in the industrial chain. Second, the improvement of digital infrastructure will reduce information asymmetry in the process of energy production, transportation, storage and consumption (Zhang and Ran, 2023) [34], reduce transaction costs, and thus improve output efficiency and reduce energy consumption per unit output, which is conducive to the improvement of energy efficiency. Third, data inputs are cleaner and more efficient than physical inputs (capital, labor, etc.). According to Moore's Law, when the construction of digital infrastructure optimizes the input of regional factors, the substitution effect brought by it becomes increasingly prominent, which is conducive to improving energy efficiency. According to the theory of process reengineering, the construction of digital infrastructure can promote the interoperability and sharing of information and factor resources in the energy industry (Goldfarb et al, 2019) [35], so that the energy products and services in the middle and upstream can better match the differentiated needs of the downstream, thus promoting the overall energy efficiency of the supply chain.
Based on the above analysis, we propose hypothesis 1: digital economy will promote energy efficiency.
2.2. Heterogeneity of cities with different characteristics
The distribution of resources among different regions in China is uneven. The environmental quality, the level of economic development, the development level of digital infrastructure and digital economy is different. The difference in resource endowment and development status will lead to the heterogeneity of the impact of digital infrastructure construction on energy efficiency. To this end, we mainly based on geographical location, city size and resource endowment of three city characteristics of the preliminary analysis. First, from the perspective of geographical heterogeneity, compared with cities in the central and western regions and cities in the north, cities in the east and south have significant economic and market advantages, higher dependence on and consumption of energy, stronger motivation to improve energy efficiency and higher capacity to improve energy efficiency. Therefore, the improvement of digital infrastructure may have a more significant effect on energy efficiency. Second, the size of city may lead to heterogeneity there are differences between larger cities and smaller cities in terms of industrial structure, resource concentration and technological development. Generally, compared with small cities, big cities often have the advantages of agglomeration of innovative factors and resources, and their industrial base, financialization level, and transportation level are also higher. These differences may lead to heterogeneity. Third, heterogeneity of urban resource endowment. Resource-based cities often have rich reserves of energy resources, and may be less motivated to improve energy efficiency because of the "resource curse". At the same time, their secondary industries are generally more developed and may also be difficult to significantly improve energy efficiency in the short term due to "path dependence". However, non-resource-based cities will be more active in improving energy efficiency due to the scarcity of resources, and seek solutions to resource constraints from various aspects. Therefore, compared with resource-based cities, non-resource-based cities will take full advantage of the improvement of digital infrastructure to improve their energy efficiency.
Based on the above analysis, we propose hypothesis 2: the energy efficiency improvement effect of digital infrastructure construction has urban heterogeneity, which is manifested as more significant energy efficiency improvement effect on eastern cities (relative to central and western cities), southern cities (relative to northern cities), large cities (relative to small and medium-sized cities) and non-resource-based cities (relative to resource cities).
2.3. Mechanism of digital economy affecting energy efficiency
First, according to Porter's innovation-driven theory, technological innovation drives economic growth by improving production efficiency. Existing studies have shown that technological progress can significantly promote energy efficiency (Wang and Wang,2020) [25], in particular, green technology innovation can reduce energy consumption from the production and consumption end, which is conducive to the green transformation of energy industry structure, and thus improve energy efficiency (Shan et al.,2021) [36]. The construction of digital infrastructure can stimulate the innovation vitality of microeconomic entities and optimize their innovation paths by reducing the cost of information communication, thus promoting the technological change of production and improving energy efficiency. It can also improve the development path of economic entities by promoting new production methods and economic formats, lead the development direction of green technology innovation, and ultimately promote the continuous improvement of energy efficiency.
Second, digital infrastructure construction improves the information transparency of environmental testing systems and big data platforms, reduces the cost and threshold of public participation in environmental governance. On the one hand, the government can better supervise the pollution control situation of enterprises; on the other hand, enterprises will independently improve energy efficiency under the pressure of government supervision.
Based on the above analysis, we propose hypothesis 3: digital infrastructure construction can improve energy efficiency by technological progress and strengthened environmental regulations.
3. Methods and variable description
3.1. Econometric Strategy
In order to test the causal relationship between digital economy and total factor energy efficiency, this paper takes the exogenous policy impact of "Broadband China" pilot policy as the proxy variable of digital economy, and uses the difference-in-difference method (DID) to evaluate. The "Broadband China" pilot policy was gradually promoted by the Ministry of Industry and Information Technology and the National Development and Reform Commission in 2014, 2015 and 2016, and the traditional DID is only applicable to the evaluation of the effect of a single point in time policy implementation. Therefore, we refer to Beck et al. (2010) [37]to construct a multi-phase DID model to identify the net effect of the "Broadband China" pilot policy on total factor energy efficiency, the specific model is constructed as follows:
In Formula (1), subscript i represents city; The subscript t indicates the year. stands for total factor energy efficiency, indicates the "Broadband China" pilot policy, and its coefficient reflects the policy effect of the "Broadband China" pilot. is the set of other control variables that affect total factor energy efficiency, including the level of economic development, financial development, degree of openness to the outside world, population size, educational development, R&D investment, and fiscal decentralization. is the coefficient corresponding to the set of control variables. and represent individual fixed effects and time fixed effects, respectively. represents the random error term. This model can effectively control the characteristic difference and time change trend between pilot cities and non-pilot cities.
3.2. Variable Definitions
1. Explained Variable: Total Factor Energy Efficiency (TFEE)
With reference to the research of Hu and Wang (2006)[38], we take total factor energy efficiency (TFEE) as the explained variable. we select labor, capital and energy as inputs, gross regional product as expected outputs, and industrial sulfur dioxide, industrial smoke dust and industrial wastewater emissions as non-expected outputs, and uses SBM-GML to measure the total factor energy efficiency of each prefecture level city. The specific indicators are shown in Table 1.
2. Core Explanatory Variable: Digital Economy (did)
We take the "broadband China" pilot policy as the proxy variable of the digital economy. The "Broadband China" pilot policy is a dummy variable. First, construct inter-group virtual variable (treat): If the city is a pilot city of "Broadband China", the value is 1 (treat=1), otherwise it is 0. Then, the time virtual variable (time) is set: for pilot cities, the value of "Broadband China" strategy implementation year and after is assigned to 1, otherwise the value is 0; For non-pilot cities, the value is 0. Finally, the interaction term of the previous two is the variable concerned in this paper - "broadband China" pilot policy.
3. Mediation Variable
(1) Technological Progress(TP): we use number of patented inventions granted per 10,000 people to represent technological progress.
(2) Environmental Regulation(ER): harmless treatment rate of household garbage can be a good proxy.
4. Control Variables
In order to avoid bias caused by missing variables and obtain more accurate estimation results, this paper refers to existing research results and controls other factors affecting total factor energy efficiency, including: (1) economic development level(pgdp): measured by urban per capita GDP and logarithmic; (2) Financial development level(fin): we adopt the proportion of institutional deposit and loan balances to the gross regional product; (3) Level of opening up(fdi): we measure the ratio of the actual amount of foreign capital used by a city in the current year to the gross regional product; (4) Population size(pop): the total population of each city at the end of the year is measured and logarithmic; (5) Research and development investment(rd): the ratio of each city's science and technology expenditure to the expenditure in the financial budget; (6) The level of education development(edu): the ratio of the education expenditure of each city to the expenditure in the financial budget; (7) Fiscal decentralization(fic): It is expressed by the ratio of revenue within the fiscal budget to expenditure within the fiscal budget.
3.3. Data Resources and Descriptive Statistics
According to the completeness and availability of the data, we finally conducted a study on 284 prefecture-level and above cities from 2007 to 2020 (due to the unavailability and lack of data, the data of Tibet, Bijie and other regions were excluded). The list of "Broadband China" pilot cities is from the official website of China's Ministry of Industry and Information Technology. The data required for other variables were obtained from China Energy Statistical Yearbook, China City Statistical Yearbook, provincial and municipal Statistical Yearbook and statistical Bulletin of each year. Some missing values were supplemented by interpolation method or mean value method. Descriptive statistics of main variables are shown in Table 2.
4. Empirical Analysis
4.1. Benchmark Regression Analysis
In order to answer the question of whether the digital economy has an impact on total factor energy efficiency, this paper takes the pilot policy of "Broadband China" as an exogenous impact and tests the correlation between the two. The benchmark regression results are shown in Table 3. Column (1) of Table 3 (1) lists the estimated results without adding control variables, and the estimated coefficient of digital economy is positive at the significance level of 1% , which means that the digital economy promotes the improvement of urban total factor energy efficiency. Considering the change of time trend of total factor energy efficiency, time dummy variable is added to column (1) in Table 3, that result is in column (2), and the regression coefficient is still significantly positive. In addition, other factors may affect the total factor energy efficiency. In order to avoid endogeneity problems caused by missing variables as much as possible, which may lead to bias in the estimation results, we add a series of control variables based on column (2) of Table 3. The regression results are shown in column (3) of Table 3. Although the regression coefficient decreases, it is still significant at the 1% confidence level. Column (4) of Table 3 further controls the individual fixed effect on the basis of column (3) to avoid bias in the estimated results due to the omission of factors that are not observed and do not change over time. The results have not changed substantially and are still significantly positive. The above results all confirm that the digital economy is conducive to improving total factor energy efficiency. In addition, from column (4) of Table 3, it can also be seen that the level of opening up has a significant negative impact on total factor energy efficiency, indicating that foreign investment reduces regional energy efficiency. This is mainly because foreign investment is mainly concentrated in pollution-intensive industries. The higher the level of opening-up, the lower the energy efficiency. This is basically consistent with the conclusions of previous literature studies.
4.2. Parallel trend hypothesis testing
The premise of using the DID model for policy evaluation is to rationalize the industrial structure of the experimental group and the control group before the pilot approval. There is no systematic difference between the advanced level and the advanced level, or if there is a difference, the difference is fixed. Based on Beck (2010)[37], we use "event analysis" to test parallel trends by constructing the following model.
In Formula (2), i and t represent the city and year, respectively. represents the total factor energy efficiency of city i in year t. is a dummy variable, indicating that "Broadband China" pilot set up this "event". Its assignment rules are as follows: is used to indicate the specific year of the establishment of the "Broadband China" pilot. If -4, then , otherwise equal zero(to avoid multicollinearity, merge =-6,-5 in to -4). If =k, then , otherwise equal zero. Regarding the setting of k, it is because the pilot year was phase 0. The first batch of pilots was in 2014, so 2020 is the sixth year after the implementation of the pilot, that is, the maximum value of k in the sample is 6; At the same time, there are 7 periods before the pilot, and more than 4 periods are set as a dummy variable. We take the "Broadband China" pilot year as the baseline year. The coefficient reflects the influence of "Broadband China" on the level of urban industrial structure before and after the pilot. The results of parallel trend test are shown in Figure 1. There is no significant difference between the experimental group and the control group before the implementation of the "Broadband China" pilot, which satisfies the hypothesis of parallel trend. In addition, it can be observed from Figure 1 that the policy effect did not appear until the second year after the implementation of "Broadband China" and gradually weakened over time, which proves that the policy effect has a certain lag, but it is not long-term
5. Further Analysis
5.1. Robustness Test
The results of the previous study found that the digital economy is conducive to improving total factor energy efficiency. In order to further verify the reliability of the results, we conducted the following robustness tests by removing part of the samples, bilateral tail reduction processing, changing the policy implementation time and PSM-DID, the robustness test results are as follows.
5.1.1. Excluded municipalities sample
Municipalities have special economic and political status. From the point of view of legal administrative levels, municipalities and provinces and autonomous regions are provincial administrative units, and the relationship between them is the same level of units. From the actual situation, the status of municipalities may be higher than provinces and autonomous regions, because they have more superior economic infrastructure, infrastructure construction, talent and other conditions. Therefore, this paper carried out regression after removing sample data from four municipalities directly under the Central government, and the results were shown in column (1) of Table 4. The regression coefficient was still positive at the significance level of 5%, indicating that the above conclusion was still valid.
5.1.2. Double-tailed processing
In order to reduce the interference of outliers on the regression results, this paper carried out bilateral tail reduction treatment on all variables at the 1% level, and conducted regression analysis. The results were shown in column (2) of Table 4. The core explanatory variable promoted total factor energy efficiency at the 5% significant level, indicating that the research results were robust.
5.1.3. Estimation of PSM-DID
The samples selected in this paper cover 284 cities across the country, and the samples are distributed all over the country, with great differences in regional and economic development level. This leads to a "selectivity bias" in the differential method, which does not ensure that pilot cities and non-pilot cities have the same individual characteristics before the implementation of the "Broadband China" pilot policy. Therefore, in order to eliminate the estimation bias caused by the differences between samples, this paper adopts the propensity score matching method (PSM), which takes the control variables as the characteristic variables to carry out cross-sectional propensity score matching, and matches the pilot cities and non-pilot cities. Then, based on the matched results, the differential method was used for regression. The estimated results are shown in column (3) of Table 4. The results again show that the conclusion is robust.
5.1.4. Counter-fact check
In addition to the policy change of the establishment of "Broadband China" demonstration cities, other policies or random factors may also lead to differences in urban total factor energy efficiency, and such differences are not related to the establishment of "broadband China" demonstration cities, which may lead to the invalidity of the above conclusions. In order to eliminate the interference of other factors, we refer to the practice of Lu and Yu [39]and conducts a counter-fact test by advancing the implementation time of "Broadband China" strategy pilot cities by one year. The test results are shown in column (4) of Table 4. The estimated results show that the interaction term coefficient 1 year in advance is not significant, which verifies the robustness of the baseline regression results in this paper.
5.2. Heterogeneity Analysis
China has a vast territory, and there are gaps in resource endowment, foreign trade, institutional constraints and industrial structure, which have evolved into regional development gaps. Therefore, the impact of digital economy on total factor energy efficiency is heterogeneous. On the basis of the previous research, we will explore whether the impact of digital economy on total factor energy efficiency will be different due to the differences in location choice, city size and urban resource endowment.
5.2.1. Regional heterogeneity
Uncoordinated regional development embodies the contradiction of unbalanced economic development in China. After the reform and opening up, China's regional gap is mainly reflected in the gap between the east and the west, with the implementation of "western development" and "central rise" and other strategies, the gap between the east and the west shows a narrowing trend. With China's economy entering the new normal, a new phenomenon, the North-South gap, has emerged in China's regional economic gap. Compared with the central and western regions and the northern regions, the eastern and southern regions have higher advantages in talent introduction, innovation factor concentration and industrial structure upgrading, which may lead to regional heterogeneity in the impact of digital economy on total factor energy efficiency. Based on this, this paper divides the sample cities according to the two criteria of "East-West" and "North-South", and the specific regression results are shown in Table 5. Columns (1) and (2) of Table 5 show the east-west differences in the impact of the digital economy. The results show that the improvement effect of digital economy development on total factor energy efficiency is significantly different between eastern and central and western regions. The development of digital economy significantly improves the total factor energy efficiency in eastern cities, but does not improve the total factor energy efficiency in central and western cities. The reason for the difference may be that the development level of digital economy is different in spatial dimension, and its spatial distribution is gradually decreasing from the eastern coast to the central and western inland. Columns (3) and (4) in Table 5 reflect the North-South difference in the impact of digital economy. The regression coefficient of the southern region is significantly positive, while that of the northern region is positive, but fails the significance test. This suggests that there is also a north-south difference in the impact of the digital economy on total factor energy efficiency. In northern China, mining, smelting, steel and other energy-intensive industries account for a relatively high proportion, and the "high carbonization" of residential heating in winter exacerbates the difficulty of carbon emission reduction, which offsetting the promotion effect of the digital economy; Compared with the northern region, the southern region is rich in hydropower resources and has more advantages in energy structure, and relies less on high-carbon energy such as coal and oil in economic development. At the same time, the southern region has a stronger ability of technological innovation and achievement transformation, and the regional technology market is more perfect, so the digital economy has a stronger effect on the promotion of total factor energy efficiency in the southern region.
5.2.2. Urban size heterogeneity
The larger a city is, the more human capital and enterprise resources it has, and the agglomeration economy within the city will also be strengthened. This resource difference caused by the difference in city size is likely to affect the implementation effect of the pilot policy of "Broadband China". China Business News and New First-tier City Research Institute released the "2020 City Business Charm Ranking", which divides domestic cities into six categories based on the concentration of commercial resources, urban hub, lifestyle diversity and future plasticity of major cities. Based on this classification standard, we combine first-tier cities, new first-tier cities and second-tier cities into first-tier cities, third-tier cities as second-tier cities, fourth-tier cities and fifth-tier cities into third-tier cities, and tests the digital economy impact on total factor energy efficiency. Due to the heterogeneity of city size through grouping regression, the results of regression are shown in Table 6. In the first class city group, the regression coefficient of the pilot policy of "Broadband China" is significantly positive, while in the second and third class city groups, the regression coefficient is not significant, which indicates that the impact of digital economy on total factor energy efficiency is more obvious in the first class city group, and the impact of the policy is not obvious in the other city groups.
5.2.3. Resource endowment heterogeneity
There are certain differences in the resource endowment of different cities, and the economic development mode and industrial structure of different resource-based cities are also different, so that the digital economy of various cities may have a heterogeneous impact on the total factor energy efficiency of cities. Therefore, according to the classification criteria of resource-based cities in the National Plan for Sustainable Development of Resource-Based Cities (2013-2020) issued by The State Council, we divide the research samples into resource-based cities and non-resource-based cities, and carries out grouping regression. The regression results are shown in columns (4) and (5) of Table 6. The digital economy has a positive impact on the total factor energy efficiency of non-resource-based cities at the significant level of 1%, while the impact on resource-based cities is not significant. This may be that resource-based cities are more dependent on the development of resource-based industries, the adjustment of industrial structure is difficult, there is path dependence and lock-in effect of economic development, and it will compete for funds and talents from other emerging industries, aggravating the "resource curse". Traditional resource-based industries cannot organically integrate with digital technology, and the correlation and dependence are not high, which weakens the promotion role of digital economy. On the contrary, the development of non-resource-based cities is not so dependent on resource-based industries, and the development of digital economy will promote the transfer of factors to sectors such as the service industry, optimize the industrial structure, and promote the improvement of energy efficiency of non-resource-based cities.
5.3. Mechanism Analysis
Based on the above theoretical analysis, it is found that the development of digital economy may affect total factor energy efficiency through the level of innovation and environmental regulations. In view of this, based on the practice of Baron and Kenny (1986)[40], we use the intermediary effect model to empirically test the path through which digital economy can improve total factor energy efficiency. The construction of the mediation effect model is as follows:
in Formulas (3) and (4) represents the intermediary variable, which is measured in this paper from two aspects of technological progress and environmental regulation. the testing steps of the mediation effect are as follows: (1) The urban total factor energy efficiency was taken as the explained variable, and the "Broadband China" pilot policy was taken as the explanatory variable for regression;(2) The intermediate variables, such as urban technological progress and environmental regulation, were taken as explained variables respectively, and the pilot policy of "Broadband China" was taken as explained variables for regression;(3) The pilot policy of "Broadband China" and the intermediary variables are included in the regression model to observe the impact of both on the growth of urban total factor productivity. If the coefficients and are both significant, and is smaller or less significant than , it indicates the existence of intermediary effect. First of all, for the quantification of urban technological progress, we choose the number of invention patents granted per 10,000 people as the proxy variable of technological progress, and takes its logarithm. Secondly, we use the harmless disposal rate of domestic waste as the proxy variable of environmental regulation. Columns (1) - (3) of Table 7 report the empirical results of technological progress as a mediating variable. Column (1) is the result of the first step of the intermediary effect test. The regression result shows that the regression coefficient of the pilot policy of "Broadband China" is 0.741, and it has passed the significance level test of 1%, which means that the pilot policy of "Broadband China" can improve the urban total factor energy efficiency. Column (2) examines the impact of the "Broadband China" pilot policy on technological progress, corresponding to the second step of the intermediation effect test. According to the regression results, the regression coefficient of the "Broadband China" pilot policy is significantly positive, which confirms the positive impact of the policy on technological progress. Column (3) takes into account both the "Broadband China" pilot policy and technological progress, which is the third step in the intermediation effect test. The regression coefficients of both policies and technological progress are significantly positive, and the regression coefficient of the pilot policy of "Broadband China" in column (3) is smaller than that of column (1), indicating that the pilot policy of "Broadband China" can affect urban total factor energy efficiency through the intermediary variable of technological progress, and technological progress plays a part of the intermediary role in this process. According to the research conclusion, hypothesis H2 is verified.
The model (3) - (6) in Table 7 reports the empirical results of environmental regulation as a mediating variable. Column (4) is the first step of the mediation effect test, and the empirical results are consistent with the results of column (1) and baseline regression, confirming the effect of the pilot policy of "Broadband China" on the improvement of urban total factor energy efficiency. The second step of the intermediary effect model needs to verify the size and direction of the impact of the pilot policy of "Broadband China" on the intermediary factor, namely environmental regulation. According to the regression results in column (5), the regression coefficient of the pilot policy of "Broadband China" is 0.103, which is significant at the 5% level, which means that after a city is included in the list of pilot cities of "Broadband China", The intensity of environmental regulations will be increased. Further, the impact of the pilot policy of "Broadband China" and environmental regulations on urban total factor energy efficiency is examined. The relevant regression results are reported in column (6). The regression coefficient of "Broadband China" pilot policy is 0.732, which is slightly lower than the regression result in column (4), and has passed the significance level test of 1%. The conclusions of this part of the study support the hypothesis 3.
6. Conclusions and Policy Implications
Improving energy efficiency and reducing pollution are the inherent requirements for high-quality economic development, so the central government has issued a number of policy measures. Based on the pilot policy of "Broadband China", we construct a quasi-natural experiment. On the basis of theoretical analysis, panel data of 284 cities from 2007 to 2020 are selected, and multi-period DID is used for analysis to empirically test the impact of the development level of digital economy on the total factor energy efficiency of cities. The following conclusions are drawn: (1) Digital economy significantly improves urban total factor energy efficiency, and this conclusion is still valid after parallel trend test, counter-fact test and a series of robustness tests; (2) Digital economy has a more significant promoting effect on the total factor energy efficiency of eastern regions, southern regions, large cities and non-resource-based cities, while the influence of central and western regions, northern regions, small cities and resource-based cities is not significant; (3) Digital economy can improve urban total factor energy efficiency mainly through technological progress and environmental regulations.
Based on the above research conclusions and combined with the current national conditions of our country, we put forward the following policy recommendations:
First, it is necessary to continue to develop the digital economy, promote the construction of "digital China", and promote the digital economy to play its role in promoting energy efficiency. Specifically, different cities should comprehensively determine their urban positioning and industrial development goals according to their own geographical location, resource endowment conditions, and economic development level. On this basis, formulate policies and measures to encourage the development of the digital economy which focus on the establishment and improvement of the policy framework and guide more market forces to participate in it. Thus, we can establish a market-based digital economy development model, and promote the synchronous development of the digital industry and the economy and society as a whole, so that the digital economy can play its role in promoting energy efficiency.
Second, based on the advantages of pilot areas, network infrastructure construction should be carried out according to local conditions. In China's eastern regions, southern regions, larger cities, non-resource-based cities, we should continue to develop the digital economy to improve the prerequisite for energy efficiency. For China's central and western regions, northern regions, smaller cities, and resource-based cities, it is necessary to speed up the construction of network infrastructure and improve coverage, guide everyone to participate in and share digital life, and avoid the digital divide and regional disparity that may be caused by digital transformation.
Finally, the results of mechanism analysis show that the improvement of total factor energy efficiency in digital economy mainly comes from technological progress and environmental regulation. So first it is necessary to increase financial investment in science and technology, strengthen the training of innovative talents, and take network infrastructure as the starting point, promote the co-construction and sharing of innovation platforms, and enhance the city's innovation capacity. At the same time, we should make full use of Internet technology and constantly promote the development of emerging industries such as big data, cloud computing and artificial intelligence. Second build an information exchange platform and adjust the intensity of environmental regulations. Through the deep integration of digital technology construction process and information dissemination, timely jump out of the information depression, fully understand the environmental regulation policies of various regions, based on the actual local needs and formulate a reasonable environmental regulation system and environmental tax rate. It is necessary to fully understand the real feedback information of "high energy consumption, high pollution and high emission" enterprises on the regulatory situation. At the same time, the government needs to provide detailed guidelines and policy answers.
Although we study the impacts of digital economy on total factor energy efficiency, and analyze its heterogeneity and mechanism, there are still some limitations. First, we take the "broadband China" pilot policy as the proxy variable of the digital economy which measures the digital economy from the perspective of digital infrastructure. However, the connotation of digital economy is very rich, so the estimated coefficient can only partially explain the impact of digital economy on total factor energy efficiency. In the future, we can deeply study the connotation of digital economy. Second, due to the lack of data, the environmental regulation data at the municipal level cannot be well measured.
Author Contributions
Conceptualization, H.L. and X.Y.; methodology, X.Y.; software, X.Y.; validation, X.Y.; formal analysis, X.Y.; investigation, X.Y.; resources, X.Y.; data curation, X.Y.; writing—original draft preparation, X.Y.; writing—review and editing, H.L. and X.Y.; supervision, X.Y. All authors have read and agreed to the published version of the manuscript.
Funding
This research was funded by National Natural Science Foundation of China (NSFC) Project “Assessment of the Ability to Pay Real Estate Tax and Research on Tax System Design under the Condition that Housing Value is not commensurate with Residents’ Income” (71873049); National Natural Science Foundation of China Project "Research on the Impact of Real Estate Tax Reform on Residents' Behavior under the Open Background" (71673094).
Institutional Review Board Statement
Not applicable.
Informed Consent Statement
Not applicable.
Data Availability Statement
All data generated or analyzed during this study are included in this published article.
Acknowledgments
We would like to express our gratitude to everyone who helped us in writing this article. I sincerely thank Professor Fu Shuke of Wuhan Institute of Technology for his guidance and assistance in the topic selection. At the same time, I would like to thank Professor Liu Hua and colleagues of the School of Management of Huazhong University of Science and Technology for their help, so that I have more time to research and write this paper.
Conflicts of Interest
The authors declare no conflict of interest.
References
- Huang S, Chen L. The Impact of the Digital Economy on the Urban Total-Factor Energy Efficiency: Evidence from 275 Cities in China[J]. Sustainability, 2023, 15(4): 3195. [CrossRef]
- Wang H, Cheng Y. Impact of the digital economy on total factor energy efficiency: evidence from 268 Chinese cities[J]. Environmental Science and Pollution Research, 2023: 1-16. [CrossRef]
- Liu H, Zhang Z, Zhang T, et al. Revisiting China’s provincial energy efficiency and its influencing factors[J]. Energy, 2020, 208: 118361. [CrossRef]
- Tang L, He G. How to improve total factor energy efficiency? An empirical analysis of the Yangtze River economic belt of China[J]. Energy, 2021, 235: 121375. [CrossRef]
- Ren S, Hao Y, Xu L, et al. Digitalization and energy: How does internet development affect China's energy consumption?[J]. Energy Economics, 2021, 98: 105220. [CrossRef]
- Wu H, Xue Y, Hao Y, et al. How does internet development affect energy-saving and emission reduction? Evidence from China[J]. Energy Economics, 2021, 103: 105577. [CrossRef]
- Lin B, Zhou Y. Does the Internet development affect energy and carbon emission performance?[J]. Sustainable Production and Consumption, 2021, 28: 1-10. [CrossRef]
- Shen S, Li H, Li M. Transportation Infrastructure and Digital Economy—Evidence from Chinese Cities[J]. Sustainability, 2023, 15(22): 16024. [CrossRef]
- Song J. The Impact of Infrastructure, Digital Production, E-Commerce, and Virtual Economy on Digital Economy Construction in China[C]//2022 International Conference on Economics, Smart Finance and Contemporary Trade (ESFCT 2022). Atlantis Press, 2022: 1187-1195. [CrossRef]
- Xu X Y, Kanaado M B, Epadile M. The impact of technological innovation, research and development, and energy intensity on carbon emissions: an experience from BRICS and OECD countries[J]. International Journal of Sustainable Development & World Policy, 2022, 11(1): 1-17. [CrossRef]
- Zhou Q, Li T, Gong L. The effect of tax incentives on energy intensity: Evidence from China's VAT reform[J]. Energy Economics, 2022, 108: 105887. [CrossRef]
- Wurlod J D, Noailly J. The impact of green innovation on energy intensity: An empirical analysis for 14 industrial sectors in OECD countries[J]. Energy Economics, 2018, 71: 47-61. [CrossRef]
- Wang Q, Zhou P, Zhou D. Efficiency measurement with carbon dioxide emissions: the case of China[J]. Applied Energy, 2012, 90(1): 161-166. [CrossRef]
- Camioto F C, Mariano E B, Santana N B, et al. Renewable and sustainable energy efficiency: An analysis of Latin American countries[J]. Environmental Progress & Sustainable Energy, 2018, 37(6): 2116-2123. [CrossRef]
- Watanabe M, Tanaka K. Efficiency analysis of Chinese industry: A directional distance function approach[J]. Energy policy, 2007, 35(12): 6323-6331. [CrossRef]
- Bi G B, Song W, Zhou P, et al. Does environmental regulation affect energy efficiency in China's thermal power generation? Empirical evidence from a slacks-based DEA model[J]. Energy Policy, 2014, 66: 537-546. [CrossRef]
- Sun H, Edziah B K, Sun C, et al. Institutional quality and its spatial spillover effects on energy efficiency[J]. Socio-Economic Planning Sciences, 2022, 83: 101023. [CrossRef]
- Liu F, Sim J, Sun H, et al. Assessing the role of economic globalization on energy efficiency: Evidence from a global perspective[J]. China Economic Review, 2023, 77: 101897. [CrossRef]
- Aigner D, Lovell C A K, Schmidt P. Formulation and estimation of stochastic frontier production function models[J]. Journal of econometrics, 1977, 6(1): 21-37. [CrossRef]
- Banker R D, Charnes A, Cooper W W. Some models for estimating technical and scale inefficiencies in data envelopment analysis[J]. Management science, 1984, 30(9): 1078-1092. [CrossRef]
- Baležentis T, Li T, Streimikiene D, et al. Is the Lithuanian economy approaching the goals of sustainable energy and climate change mitigation? Evidence from DEA-based environmental performance index[J]. Journal of Cleaner Production, 2016, 116: 23-31. [CrossRef]
- Ohene-Asare K, Tetteh E N, Asuah E L. Total factor energy efficiency and economic development in Africa[J]. Energy Efficiency, 2020, 13(6): 1177-1194. [CrossRef]
- Lin J, Xu C. The impact of environmental regulation on total factor energy efficiency: A cross-region analysis in China[J]. Energies, 2017, 10(10): 1578. [CrossRef]
- Wang Q S, Su C W, Hua Y F, et al. Can fiscal decentralisation regulate the impact of industrial structure on energy efficiency? [J]. Economic research-Ekonomska istraživanja, 2021, 34(1): 1727-1751. [CrossRef]
- Wang H, Wang M. Effects of technological innovation on energy efficiency in China: Evidence from dynamic panel of 284 cities[J]. Science of the total environment, 2020, 709: 136172. [CrossRef]
- Shah W U H, Hao G, Yan H, et al. The impact of trade, financial development and government integrity on energy efficiency: An analysis from G7-Countries[J]. Energy, 2022, 255: 124507. [CrossRef]
- Cao W, Chen S, Huang Z. Does foreign direct investment impact energy intensity? Evidence from developing countries[J]. Mathematical Problems in Engineering, 2020, 2020: 1-11. [CrossRef]
- Ma X J, Li Y C, Fu Z, et al. The impact of digital economy on industrial structure upgrading from the perspective of spatial effects[C]//Stat. Inf. Forum. 2022, 37: 14-25.
- Lyu Y, Wang W, Wu Y, et al. How does digital economy affect green total factor productivity? Evidence from China[J]. Science of The Total Environment, 2023, 857: 159428. [CrossRef]
- Zhang J, Lyu Y, Li Y, et al. Digital economy: An innovation driving factor for low-carbon development[J]. Environmental Impact Assessment Review, 2022, 96: 106821. [CrossRef]
- Kopina A, Kopin D. Fiscal Federalism and Tax Autonomy: Digital Economy Challenges[J]. Financial Law Review, 2019 (14): 2. [CrossRef]
- Li X, Wu Q. The impact of digital economy on high-quality economic development: Research based on the consumption expansion[J]. Plos one, 2023, 18(12): e0292925. [CrossRef]
- Zhang L, Mu R, Zhan Y, et al. Digital economy, energy efficiency, and carbon emissions: Evidence from provincial panel data in China[J]. Science of The Total Environment, 2022, 852: 158403. [CrossRef]
- Zhang Y, Ran C. Effect of digital economy on air pollution in China? New evidence from the “National Big Data Comprehensive Pilot Area” policy[J]. Economic Analysis and Policy, 2023, 79: 986-1004. [CrossRef]
- Goldfarb A, Tucker C. Digital economics[J]. Journal of economic literature, 2019, 57(1): 3-43. [CrossRef]
- Shan S, Genç S Y, Kamran H W, et al. Role of green technology innovation and renewable energy in carbon neutrality: A sustainable investigation from Turkey[J]. Journal of Environmental Management, 2021, 294: 113004. [CrossRef]
- Beck T, Levine R, Levkov A. Big bad banks? The winners and losers from bank deregulation in the United States[J]. The journal of finance, 2010, 65(5): 1637-1667. [CrossRef]
- Hu J L, Wang S C. Total-factor energy efficiency of regions in China[J]. Energy policy, 2006, 34(17): 3206-3217. [CrossRef]
- Lu Y, Yu L. Trade liberalization and markup dispersion: evidence from China's WTO accession[J]. American Economic Journal: Applied Economics, 2015, 7(4): 221-253. [CrossRef]
- Baron R M, Kenny D A. The moderator–mediator variable distinction in social psychological research: Conceptual, strategic, and statistical considerations[J]. Journal of personality and social psychology, 1986, 51(6): 1173. [CrossRef]
Figure 1.
Parallel trend test.
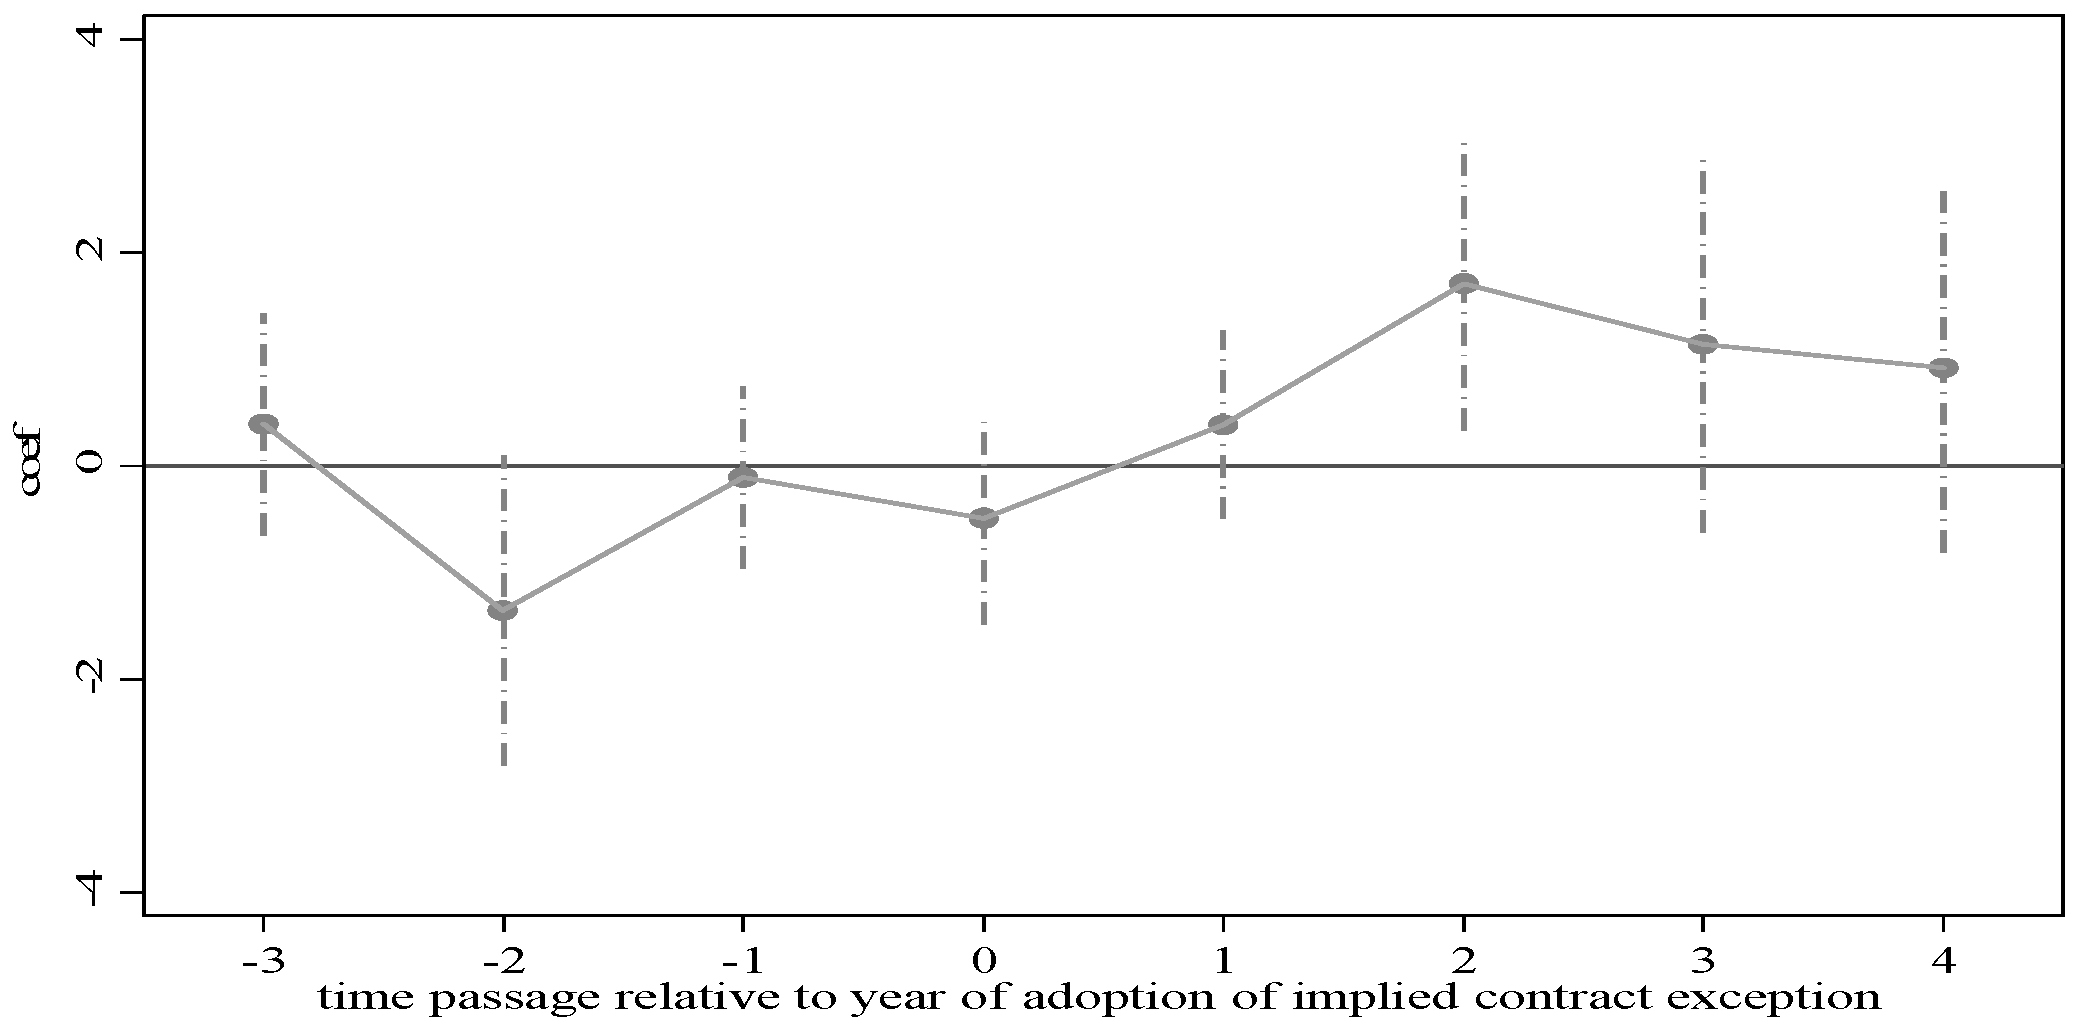

Table 1.
Descriptions of variables.
| Variables | Definition | |
| Input | Energy | The total consumption of coal, oil, and natural gas (converted into standard coal) |
| Labor | employees at the end of the year | |
| Capital | Perpetual Inventory Method (PIM) is used to calculate the capital stock at 2000 comparable prices.A capital depreciation rate of 10.96% was selected | |
| output | Expect output | Real GDP of each city based on the year 2000 |
| Unexpected output | Emissions of sulfur dioxide, waste water and dust in each city | |
Table 2.
Descriptive Statistics.
| Variable | Obs | Mean | Std.Dev. | Min | Max |
| TFEE | 3976 | 100.207 | 4.6502 | 48.8448 | 165.503 |
| did | 3976 | 0.1622 | 0.3687 | 0 | 1 |
| pgdp | 3976 | 10.511 | 0.6807 | 8.1309 | 13.0557 |
| fin | 3976 | 2.3016 | 1.1597 | 0.56 | 21.3014 |
| fdi | 3976 | 0.1006 | 3.4779 | 0 | 203.595 |
| pop | 3976 | 5.8802 | 0.6943 | 2.8981 | 8.1397 |
| rd | 3976 | 0.0156 | 0.0156 | 0.0006 | 0.2068 |
| edu | 3976 | 0.1805 | 0.0424 | 0.0177 | 0.3774 |
| fic | 3976 | 0.4628 | 0.2281 | 0.0544 | 1.5413 |
Table 3.
Benchmark regression results.
| VARIABLES | (1) | (2) | (3) | (4) |
| did | 2.550*** | 1.095*** | 0.647*** | 0.741*** |
| (0.278) | (0.304) | (0.234) | (0.276) | |
| lnpgdp | 1.362*** | 0.062 | ||
| (0.288) | (0.546) | |||
| fin | 0.259*** | -0.142 | ||
| (0.100) | (0.157) | |||
| fdi | -0.0602*** | -0.0710*** | ||
| (0.002) | (0.002) | |||
| lnpop | 0.654*** | 0.96 | ||
| (0.142) | (1.301) | |||
| rd | -2.761 | -8.572 | ||
| (9.954) | (20.820) | |||
| edu | -5.443*** | -0.478 | ||
| (1.719) | (3.682) | |||
| fic | -1.443** | -0.617 | ||
| (0.695) | (1.037) | |||
| Constant | 99.79*** | 98.85*** | 83.20*** | 93.46*** |
| (0.061) | (0.188) | (3.245) | (10.110) | |
| year | NO | YES | YES | YES |
| city | NO | NO | NO | YES |
| Observations | 3,976 | 3,976 | 3,976 | 3,976 |
| R-squared | 0.0392 | 0.1314 | 0.1316 | 0.135 |
Table 4.
Robustness test.
| VARIABLES | (1) | (2) | (3) | (4) |
| Partial sample | winsorize | PSM-DID | Counterfactuals | |
| did | 0.540** | 0.443** | 0.705** | 0.151 |
| (0.251) | (0.215) | (0.272) | (0.312) | |
| lnpgdp | -0.073 | 0.123 | 0.244 | -0.0547 |
| (0.540) | (0.409) | (0.548) | (0.538) | |
| fin | -0.103 | -0.0748 | -0.129 | -0.151 |
| (0.146) | (0.136) | (0.157) | (0.158) | |
| fdi | -0.0719*** | -0.0452*** | -8.724** | -0.0724*** |
| (0.002) | (0.001) | (3.953) | (0.002) | |
| lnpop | 0.602 | 0.647 | 0.959 | 1.185 |
| (1.219) | (1.112) | (1.356) | (1.310) | |
| rd | -5.724 | -8.491 | -7.711 | -7.228 |
| (20.510) | (15.770) | (22.190) | (20.800) | |
| edu | -1.549 | 2.113 | -0.955 | -0.144 |
| (3.580) | (2.695) | (3.717) | (3.608) | |
| fic | -0.331 | -0.525 | -0.591 | -0.482 |
| (0.956) | (0.858) | (1.041) | (1.033) | |
| Constant | 96.80*** | 94.04*** | 91.91*** | 93.14*** |
| (9.684) | (8.105) | (10.400) | (10.140) | |
| year | YES | YES | YES | YES |
| city | YES | YES | YES | YES |
| Observations | 3,920 | 3,976 | 3,950 | 3,976 |
| R-squared | 0.15 | 0.186 | 0.134 | 0.133 |
Table 5.
Heterogeneity test.
| VARIABLES | (1) | (2) | (3) | (4) |
| East | Mid& West | North | South | |
| did | 1.475** | 0.384 | 0.711 | 0.807** |
| (0.585) | (0.240) | (0.430) | (0.338) | |
| lnpgdp | 1.157 | 0.377 | 2.258** | 0.276 |
| (1.043) | (0.595) | (0.930) | (0.957) | |
| fin | -0.073 | -0.155 | 0.0522 | -0.861*** |
| (0.204) | (0.295) | (0.159) | (0.210) | |
| fdi | -24.46** | -0.0719*** | -0.0652*** | -7.428** |
| (11.280) | (0.002) | (0.003) | (2.932) | |
| lnpop | -2.269 | 0.905 | 5.780** | 1.432 |
| (2.570) | (1.249) | (2.519) | (1.456) | |
| rd | 11.39 | -14.71 | -15.57 | 6.715 |
| (40.590) | (13.580) | (22.550) | (24.810) | |
| edu | 5.281 | -4.206 | 9.695* | -3.804 |
| (7.564) | (3.198) | (5.208) | (5.276) | |
| fic | 3.536 | -1.111 | -3.927* | 0.668 |
| (2.398) | (1.003) | (2.190) | (1.139) | |
| Constant | 98.09*** | 91.81*** | 43.68** | 89.66*** |
| (17.740) | (10.650) | (17.320) | (14.880) | |
| year | YES | YES | YES | YES |
| city | YES | YES | YES | YES |
| Observations | 1,680 | 2,296 | 1,820 | 2,156 |
| R-squared | 0.151 | 0.165 | 0.212 | 0.115 |
Table 6.
Heterogeneity test.
| VARIABLES | (1) | (2) | (3) | (4) | (5) |
| first | second | third | resource | non-resource | |
| did | 2.149** | -0.149 | 0.0635 | 0.23 | 1.067*** |
| (1.040) | (0.260) | (0.323) | (0.365) | (0.374) | |
| lnpgdp | 3.24 | -0.0319 | 0.307 | 0.736 | -0.348 |
| (2.506) | (0.845) | (0.547) | (0.796) | (0.790) | |
| fin | -1.335** | -0.247 | 0.00395 | 0.146 | -0.32 |
| (0.610) | (0.332) | (0.108) | (0.335) | (0.242) | |
| fdi | -47.98** | -5.297** | -0.0716*** | -6.39 | -0.0702*** |
| (21.540) | (2.110) | (0.003) | (8.045) | (0.003) | |
| lnpop | -3.474 | -0.0172 | 0.853 | -1.112 | 3.180** |
| (3.117) | (1.379) | (2.595) | (1.304) | (1.258) | |
| rd | -61.43** | 0.276 | 7.785 | 31.96 | -41.30*** |
| (23.240) | (35.760) | (12.000) | (32.700) | (14.390) | |
| edu | -5.753 | -1.32 | 0.0903 | -6.193 | 5.868 |
| (15.850) | (5.099) | (3.710) | (4.523) | (5.277) | |
| fic | 3.917 | 0.545 | -4.068*** | -2.263 | -0.00485 |
| (3.242) | (1.101) | (1.514) | (1.710) | (1.226) | |
| Constant | 92.39*** | 99.85*** | 92.70*** | 100.3*** | 83.04*** |
| (30.120) | (14.380) | (14.300) | (12.370) | (11.740) | |
| year | YES | YES | YES | YES | YES |
| city | YES | YES | YES | YES | YES |
| Observations | 686 | 2,114 | 1,176 | 1,596 | 2,380 |
| R-squared | 0.191 | 0.153 | 0.161 | 0.158 | 0.138 |
Table 7.
Mechanism analysis.
| VARIABLES | (1) | (2) | (3) | (4) | (5) | (6) |
| Technical Progress | Environmental Regulation | |||||
| TFEE | TP | TFEE | TFEE | ER | TFEE | |
| did | 0.741*** | 0.184*** | 0.546** | 0.741*** | -0.103** | 0.732*** |
| (0.276) | (0.038) | (0.270) | (0.276) | (0.052) | (0.275) | |
| M | 1.060** | -0.0846 | ||||
| (0.424) | (0.109) | |||||
| lnpgdp | 0.062 | -0.155*** | 0.226 | 0.062 | 0.144 | 0.0741 |
| (0.546) | (0.052) | (0.552) | (0.546) | (0.107) | (0.547) | |
| fin | -0.142 | -0.0124 | -0.129 | -0.142 | -0.0116 | -0.143 |
| (0.157) | (0.011) | (0.154) | (0.157) | (0.019) | (0.157) | |
| fdi | -0.0710*** | 0.00156*** | -0.0727*** | -0.0710*** | 0.00298*** | -0.0707*** |
| (0.002) | (0.000) | (0.002) | (0.002) | (0.000) | (0.002) | |
| lnpop | 0.96 | 0.492** | 0.438 | 0.96 | -0.205 | 0.943 |
| (1.301) | (0.240) | (1.187) | (1.301) | (0.276) | (1.297) | |
| rd | -8.572 | 7.384*** | -16.4 | -8.572 | -1.596 | -8.707 |
| (20.820) | (1.794) | (23.220) | (20.820) | (0.991) | (20.840) | |
| edu | -0.478 | 1.671*** | -2.249 | -0.478 | -1.122 | -0.572 |
| (3.682) | (0.347) | (3.593) | (3.682) | (0.760) | (3.691) | |
| fic | -0.617 | -0.328*** | -0.269 | -0.617 | -0.284 | -0.641 |
| (1.037) | (0.121) | (1.029) | (1.037) | (0.226) | (1.042) | |
| Constant | 93.46*** | -1.502 | 95.05*** | 93.46*** | 4.252** | 93.82*** |
| (10.110) | (1.462) | (9.617) | (10.110) | (2.007) | (10.050) | |
| year | YES | YES | YES | YES | YES | YES |
| city | YES | YES | YES | YES | YES | YES |
| Observations | 3,976 | 3,976 | 3,976 | 3,976 | 3,976 | 3,976 |
| R-squared | 0.135 | 0.596 | 0.137 | 0.135 | 0.138 | 0.135 |
Disclaimer/Publisher’s Note: The statements, opinions and data contained in all publications are solely those of the individual author(s) and contributor(s) and not of MDPI and/or the editor(s). MDPI and/or the editor(s) disclaim responsibility for any injury to people or property resulting from any ideas, methods, instructions or products referred to in the content. |
© 2024 by the authors. Licensee MDPI, Basel, Switzerland. This article is an open access article distributed under the terms and conditions of the Creative Commons Attribution (CC BY) license (http://creativecommons.org/licenses/by/4.0/).
Copyright: This open access article is published under a Creative Commons CC BY 4.0 license, which permit the free download, distribution, and reuse, provided that the author and preprint are cited in any reuse.
Submitted:
01 February 2024
Posted:
02 February 2024
You are already at the latest version
Alerts
This version is not peer-reviewed
Submitted:
01 February 2024
Posted:
02 February 2024
You are already at the latest version
Alerts
Abstract
In the context of the coordinated development of digital economy and environmental protection, we take the strategy of "Broadband China" as a quasi-natural experiment, adopts the panel data of 284 cities from 2007 to 2020, and evaluates the policy effect of digital economy on total factor energy efficiency through the progressive DID model. The results show that: The construction of "Broadband China" demonstration city has significantly promoted the improvement of the total factor energy efficiency of the demonstration city, but there is also significant urban heterogeneity, which is manifested in the significant improvement of the total factor energy efficiency of the eastern city, the southern city, the big city and the non-resource-based city. It has no significant effect on the total factor energy efficiency of central and western cities, northern cities, small and medium-sized cities and resource-based cities. The construction of "Broadband China" demonstration cities can improve total factor energy efficiency by promoting technological progress and strengthening environmental regulations. Therefore, we should further strengthen the construction of digital infrastructure and give full play to its positive effects. Different cities should seek differentiated development paths based on their own resource endowments and development conditions, so that the digital economy can effectively improve the total factor energy efficiency.
Keywords:
Subject: Business, Economics and Management - Economics
1. Introduction
After the reform and opening up, China's economy has continued to grow rapidly, creating a miracle of world economic growth. However, the traditional extensive mode of economic development has also led to prominent constraints on resources and environment (Huang and Chen,2023) [1]. the contradiction between economic growth and environmental pollution and resource consumption has become increasingly prominent (Wang and Cheng,2023) [2]. At present, China has become the world's largest energy consumer, and the flow constraint and stock constraint of energy supply coexist, which seriously restricts the sustainable development of economy. China's energy efficiency is relatively low, far below that of developed economies such as Europe and the United States (Liu et al.,2020) [3]. Therefore, in the new development stage, improving energy efficiency is one of the key points to achieve high-quality development. At the same time, the digital economy based on the rapid development of digital technology has become a new form and new driving force for economic growth, and its proportion in the total economy has increased year by year. According to the "China Urban Digital Economy Development Report (2023)" shows that at present, the scale of China's digital economy exceeds 50 trillion yuan, ranking second in the world, accounting for 41.5% of GDP, and the integration of digital economy and real economy is becoming closer. The report of the Party's 20th National Congress pointed out that it is necessary to further promote the energy revolution, deeply integrate digital construction with the energy revolution, and make full use of digital construction to balance economic growth and ecological environment maintenance. The impact of the development of digital economy on energy efficiency and its impact path have become the focus of attention of all sectors of society, and relevant theoretical and empirical research results continue to emerge (Tang and He,2021) [4]. However, the research and analysis of domestic and foreign literatures mainly focus on the impact of comprehensive indicators of digital economy on energy efficiency and their path analysis (Huang and Chen,2023) [1], and rarely discuss its impact on total factor energy efficiency from the perspective of the connotation of digital economy (that is, digital infrastructure construction). Compared with the existing literature that uses proxy variables such as Internet comprehensive development index and Internet penetration rate to construct digital infrastructure (Ren et al., 2021; Wu et al., 2021; Lin and Zhou, 2021) [5,6,7], to a certain extent, the endogeneity problem caused by measurement errors is avoided.
In the new round of scientific and technological revolution, the construction of digital infrastructure has helped the "Internet of everything" and accelerated the development of the digital economy (Shen et al.,2023) [8]. It can be said that the quantity and quality of digital infrastructure determine the speed and height of the development of the digital economy(Song,2022)[9]. The construction of digital infrastructure and inclusive broadband network infrastructure, represented by 5G, artificial intelligence and big data centers, has become the driving force for the sustainable development of the digital economy (Shen et al.,2023) [8]. Since the Internet is one of the important foundations for the development of digital economy, and broadband is the basis for the development of Internet (Wu et al.,2021) [6], this paper uses the "broadband China" pilot policy, a quasi-natural experiment, to study and analyze the impact of digital economy development on total factor energy efficiency and its impact mechanism from the perspective of broadband construction. Throughout the existing research, the literature closely related to this paper mainly includes the following three categories. The first category is the literature on energy efficiency measurement. Many scholars have studied and analyzed the index system and measurement methods of energy efficiency measurement. The index system of energy efficiency is mainly divided into two categories: single factor energy efficiency (Xu and Kanaado,2022; Zhou et al.,2022; Wurlod and Noailly,2018)[10,11,12] and total factor energy efficiency (Wang et al.,2012; Camioto F C, Mariano et al.,2018; Watanabe and Tanaka,2007; Bi et al.,2014;)[13,14,15,16]. The energy efficiency measurement methods are also divided into two types: stochastic frontier method (SFA) with parameter method (Sun et al.,2022; Liu et al.,2023; Aigner et al.,1977) [17,18,19] and data envelopment method (DEA) with non-parameter method (Banker and Charnes,1984; Baležentis et al.,2016) [20,21]. The second category is related literature on energy efficiency influencing factors. Scholars have studied the influencing factors of energy efficiency from multiple perspectives. Current relevant literature shows that in addition to economic development (Ohene-Asare et al.,2016) [22], environmental regulation (Lin and Xu,2017) [23], industrial structure (Wang et al.,2021) [24], technological innovation (Wang and Wang,2020) [25], financial development (Shah et al.,2022) [26], foreign direct investment (Cao et al.,2020) [27] and other factors will also have a significant impact on energy efficiency. The third category is related research on the social and economic effects of the development of digital economy. Existing literature has discussed the causal effect of the development of digital economy, and empirically tested the impact of the development of digital economy on the upgrading of industrial structure (Ma et al.,2022) [28], green total factor productivity (Lyu et al.,2023) [29], innovation performance (Zhang et al.,2022) [30], fiscal decentralization (Kopina and Kopin,2019)[31] and high-quality economic development(Li and Wu,2023)[32]. Existing studies have mainly standardized analysis of the relationship between the development of digital economy and social and economic factors. At present, there are few literatures to discuss the impact and mechanism of digital economy development on total factor energy efficiency from the perspective of digital infrastructure construction, and explore the relationship between digital economy development and total factor energy efficiency to promote the perfection and improvement of modern environmental governance system and modern energy system. Alleviating the environmental pollution and the relative shortage of energy and other practical problems has a certain theoretical and practical significance.
In view of this, we use the balance panel data of 284 cities in China from 2007 to 2020, and based on the quasi-natural experiment of "Broadband China" strategy, uses the multi-phase DID model to explore the impact of digital economy development on total factor energy efficiency, its mechanism of action, heterogeneity, and the regulatory effects of technological progress and environmental regulations. The study found that the development of the digital economy significantly improved total factor energy efficiency. Moreover, the development of digital economy has significant differences in the improvement effect of total factor energy efficiency in cities with different characteristics. Among them, the development of digital economy has a more prominent effect on the improvement of total factor energy efficiency in eastern cities, southern cities, large cities and non-resource-based cities. Environmental regulation and technological progress are important ways to improve total factor energy efficiency in the development of digital economy.
The marginal contributions of this paper are as follows: (1) Based on the perspective of digital infrastructure construction, we examine the impact of digital economy development on total factor energy efficiency, expands the research framework of digital economy development and energy efficiency, makes up for the shortcomings of previous studies that ignored the relationship between digital economy and total factor energy efficiency, and provides a scientific basis for improving total factor energy efficiency and alleviating environmental pollution and relative energy shortage. (2) The impact mechanism and heterogeneity of digital economy development on total factor energy efficiency are further discussed, which not only helps to understand the internal relationship between digital economy development and total factor energy efficiency, but also helps to deepen the understanding of the impact of digital economy development on the difference of total factor energy efficiency of various subjects with different characteristics. (3) We not only used the multi-phase DID method for research, but also used PSM-DID and other methods to effectively alleviate the selectivity bias problem. In addition, a series of robustness tests were conducted to ensure the robustness of the research conclusions, which made the research conclusions highly reliable.
The following structure is arranged as follows: The second part analyzes the theoretical mechanism of the impact of digital economy on total factor energy efficiency, and proposes hypotheses; The third part discusses the identification strategy of this paper, and introduces the samples and variables. The fourth part reports the results of baseline analysis and tests the parallel trend hypothesis. The fifth part carries on further analysis, including robustness test, heterogeneity analysis and mechanism analysis; The sixth part summarizes and summarizes the conclusions of the article, and puts forward policy recommendations accordingly.
2. Theoretical mechanisms and research hypotheses
2.1. Digital economy and energy efficiency
Existing studies show that the development of digital economy can significantly promote the improvement of regional energy efficiency (Zhang et al, 2022) [33], the improvement of digital infrastructure can not only promote the development of digital economy, but also directly promote the improvement of urban energy efficiency. First, the positive externalities generated by the construction of digital infrastructure will improve urban energy efficiency. On the one hand, the construction of digital infrastructure will stimulate the investment demand of enterprises and consumers, affect the structural transformation of the energy industry through income effect and price effect, and build the whole industrial chain of energy digitalization, thus improving urban energy efficiency. On the other hand, the construction of digital infrastructure helps to transform and upgrade the energy production, operation and sales service processes, expand energy access channels, optimize the efficiency of energy allocation, and thus promote the energy efficiency of more links in the industrial chain. Second, the improvement of digital infrastructure will reduce information asymmetry in the process of energy production, transportation, storage and consumption (Zhang and Ran, 2023) [34], reduce transaction costs, and thus improve output efficiency and reduce energy consumption per unit output, which is conducive to the improvement of energy efficiency. Third, data inputs are cleaner and more efficient than physical inputs (capital, labor, etc.). According to Moore's Law, when the construction of digital infrastructure optimizes the input of regional factors, the substitution effect brought by it becomes increasingly prominent, which is conducive to improving energy efficiency. According to the theory of process reengineering, the construction of digital infrastructure can promote the interoperability and sharing of information and factor resources in the energy industry (Goldfarb et al, 2019) [35], so that the energy products and services in the middle and upstream can better match the differentiated needs of the downstream, thus promoting the overall energy efficiency of the supply chain.
Based on the above analysis, we propose hypothesis 1: digital economy will promote energy efficiency.
2.2. Heterogeneity of cities with different characteristics
The distribution of resources among different regions in China is uneven. The environmental quality, the level of economic development, the development level of digital infrastructure and digital economy is different. The difference in resource endowment and development status will lead to the heterogeneity of the impact of digital infrastructure construction on energy efficiency. To this end, we mainly based on geographical location, city size and resource endowment of three city characteristics of the preliminary analysis. First, from the perspective of geographical heterogeneity, compared with cities in the central and western regions and cities in the north, cities in the east and south have significant economic and market advantages, higher dependence on and consumption of energy, stronger motivation to improve energy efficiency and higher capacity to improve energy efficiency. Therefore, the improvement of digital infrastructure may have a more significant effect on energy efficiency. Second, the size of city may lead to heterogeneity there are differences between larger cities and smaller cities in terms of industrial structure, resource concentration and technological development. Generally, compared with small cities, big cities often have the advantages of agglomeration of innovative factors and resources, and their industrial base, financialization level, and transportation level are also higher. These differences may lead to heterogeneity. Third, heterogeneity of urban resource endowment. Resource-based cities often have rich reserves of energy resources, and may be less motivated to improve energy efficiency because of the "resource curse". At the same time, their secondary industries are generally more developed and may also be difficult to significantly improve energy efficiency in the short term due to "path dependence". However, non-resource-based cities will be more active in improving energy efficiency due to the scarcity of resources, and seek solutions to resource constraints from various aspects. Therefore, compared with resource-based cities, non-resource-based cities will take full advantage of the improvement of digital infrastructure to improve their energy efficiency.
Based on the above analysis, we propose hypothesis 2: the energy efficiency improvement effect of digital infrastructure construction has urban heterogeneity, which is manifested as more significant energy efficiency improvement effect on eastern cities (relative to central and western cities), southern cities (relative to northern cities), large cities (relative to small and medium-sized cities) and non-resource-based cities (relative to resource cities).
2.3. Mechanism of digital economy affecting energy efficiency
First, according to Porter's innovation-driven theory, technological innovation drives economic growth by improving production efficiency. Existing studies have shown that technological progress can significantly promote energy efficiency (Wang and Wang,2020) [25], in particular, green technology innovation can reduce energy consumption from the production and consumption end, which is conducive to the green transformation of energy industry structure, and thus improve energy efficiency (Shan et al.,2021) [36]. The construction of digital infrastructure can stimulate the innovation vitality of microeconomic entities and optimize their innovation paths by reducing the cost of information communication, thus promoting the technological change of production and improving energy efficiency. It can also improve the development path of economic entities by promoting new production methods and economic formats, lead the development direction of green technology innovation, and ultimately promote the continuous improvement of energy efficiency.
Second, digital infrastructure construction improves the information transparency of environmental testing systems and big data platforms, reduces the cost and threshold of public participation in environmental governance. On the one hand, the government can better supervise the pollution control situation of enterprises; on the other hand, enterprises will independently improve energy efficiency under the pressure of government supervision.
Based on the above analysis, we propose hypothesis 3: digital infrastructure construction can improve energy efficiency by technological progress and strengthened environmental regulations.
3. Methods and variable description
3.1. Econometric Strategy
In order to test the causal relationship between digital economy and total factor energy efficiency, this paper takes the exogenous policy impact of "Broadband China" pilot policy as the proxy variable of digital economy, and uses the difference-in-difference method (DID) to evaluate. The "Broadband China" pilot policy was gradually promoted by the Ministry of Industry and Information Technology and the National Development and Reform Commission in 2014, 2015 and 2016, and the traditional DID is only applicable to the evaluation of the effect of a single point in time policy implementation. Therefore, we refer to Beck et al. (2010) [37]to construct a multi-phase DID model to identify the net effect of the "Broadband China" pilot policy on total factor energy efficiency, the specific model is constructed as follows:
In Formula (1), subscript i represents city; The subscript t indicates the year. stands for total factor energy efficiency, indicates the "Broadband China" pilot policy, and its coefficient reflects the policy effect of the "Broadband China" pilot. is the set of other control variables that affect total factor energy efficiency, including the level of economic development, financial development, degree of openness to the outside world, population size, educational development, R&D investment, and fiscal decentralization. is the coefficient corresponding to the set of control variables. and represent individual fixed effects and time fixed effects, respectively. represents the random error term. This model can effectively control the characteristic difference and time change trend between pilot cities and non-pilot cities.
3.2. Variable Definitions
1. Explained Variable: Total Factor Energy Efficiency (TFEE)
With reference to the research of Hu and Wang (2006)[38], we take total factor energy efficiency (TFEE) as the explained variable. we select labor, capital and energy as inputs, gross regional product as expected outputs, and industrial sulfur dioxide, industrial smoke dust and industrial wastewater emissions as non-expected outputs, and uses SBM-GML to measure the total factor energy efficiency of each prefecture level city. The specific indicators are shown in Table 1.
2. Core Explanatory Variable: Digital Economy (did)
We take the "broadband China" pilot policy as the proxy variable of the digital economy. The "Broadband China" pilot policy is a dummy variable. First, construct inter-group virtual variable (treat): If the city is a pilot city of "Broadband China", the value is 1 (treat=1), otherwise it is 0. Then, the time virtual variable (time) is set: for pilot cities, the value of "Broadband China" strategy implementation year and after is assigned to 1, otherwise the value is 0; For non-pilot cities, the value is 0. Finally, the interaction term of the previous two is the variable concerned in this paper - "broadband China" pilot policy.
3. Mediation Variable
(1) Technological Progress(TP): we use number of patented inventions granted per 10,000 people to represent technological progress.
(2) Environmental Regulation(ER): harmless treatment rate of household garbage can be a good proxy.
4. Control Variables
In order to avoid bias caused by missing variables and obtain more accurate estimation results, this paper refers to existing research results and controls other factors affecting total factor energy efficiency, including: (1) economic development level(pgdp): measured by urban per capita GDP and logarithmic; (2) Financial development level(fin): we adopt the proportion of institutional deposit and loan balances to the gross regional product; (3) Level of opening up(fdi): we measure the ratio of the actual amount of foreign capital used by a city in the current year to the gross regional product; (4) Population size(pop): the total population of each city at the end of the year is measured and logarithmic; (5) Research and development investment(rd): the ratio of each city's science and technology expenditure to the expenditure in the financial budget; (6) The level of education development(edu): the ratio of the education expenditure of each city to the expenditure in the financial budget; (7) Fiscal decentralization(fic): It is expressed by the ratio of revenue within the fiscal budget to expenditure within the fiscal budget.
3.3. Data Resources and Descriptive Statistics
According to the completeness and availability of the data, we finally conducted a study on 284 prefecture-level and above cities from 2007 to 2020 (due to the unavailability and lack of data, the data of Tibet, Bijie and other regions were excluded). The list of "Broadband China" pilot cities is from the official website of China's Ministry of Industry and Information Technology. The data required for other variables were obtained from China Energy Statistical Yearbook, China City Statistical Yearbook, provincial and municipal Statistical Yearbook and statistical Bulletin of each year. Some missing values were supplemented by interpolation method or mean value method. Descriptive statistics of main variables are shown in Table 2.
4. Empirical Analysis
4.1. Benchmark Regression Analysis
In order to answer the question of whether the digital economy has an impact on total factor energy efficiency, this paper takes the pilot policy of "Broadband China" as an exogenous impact and tests the correlation between the two. The benchmark regression results are shown in Table 3. Column (1) of Table 3 (1) lists the estimated results without adding control variables, and the estimated coefficient of digital economy is positive at the significance level of 1% , which means that the digital economy promotes the improvement of urban total factor energy efficiency. Considering the change of time trend of total factor energy efficiency, time dummy variable is added to column (1) in Table 3, that result is in column (2), and the regression coefficient is still significantly positive. In addition, other factors may affect the total factor energy efficiency. In order to avoid endogeneity problems caused by missing variables as much as possible, which may lead to bias in the estimation results, we add a series of control variables based on column (2) of Table 3. The regression results are shown in column (3) of Table 3. Although the regression coefficient decreases, it is still significant at the 1% confidence level. Column (4) of Table 3 further controls the individual fixed effect on the basis of column (3) to avoid bias in the estimated results due to the omission of factors that are not observed and do not change over time. The results have not changed substantially and are still significantly positive. The above results all confirm that the digital economy is conducive to improving total factor energy efficiency. In addition, from column (4) of Table 3, it can also be seen that the level of opening up has a significant negative impact on total factor energy efficiency, indicating that foreign investment reduces regional energy efficiency. This is mainly because foreign investment is mainly concentrated in pollution-intensive industries. The higher the level of opening-up, the lower the energy efficiency. This is basically consistent with the conclusions of previous literature studies.
4.2. Parallel trend hypothesis testing
The premise of using the DID model for policy evaluation is to rationalize the industrial structure of the experimental group and the control group before the pilot approval. There is no systematic difference between the advanced level and the advanced level, or if there is a difference, the difference is fixed. Based on Beck (2010)[37], we use "event analysis" to test parallel trends by constructing the following model.
In Formula (2), i and t represent the city and year, respectively. represents the total factor energy efficiency of city i in year t. is a dummy variable, indicating that "Broadband China" pilot set up this "event". Its assignment rules are as follows: is used to indicate the specific year of the establishment of the "Broadband China" pilot. If -4, then , otherwise equal zero(to avoid multicollinearity, merge =-6,-5 in to -4). If =k, then , otherwise equal zero. Regarding the setting of k, it is because the pilot year was phase 0. The first batch of pilots was in 2014, so 2020 is the sixth year after the implementation of the pilot, that is, the maximum value of k in the sample is 6; At the same time, there are 7 periods before the pilot, and more than 4 periods are set as a dummy variable. We take the "Broadband China" pilot year as the baseline year. The coefficient reflects the influence of "Broadband China" on the level of urban industrial structure before and after the pilot. The results of parallel trend test are shown in Figure 1. There is no significant difference between the experimental group and the control group before the implementation of the "Broadband China" pilot, which satisfies the hypothesis of parallel trend. In addition, it can be observed from Figure 1 that the policy effect did not appear until the second year after the implementation of "Broadband China" and gradually weakened over time, which proves that the policy effect has a certain lag, but it is not long-term
5. Further Analysis
5.1. Robustness Test
The results of the previous study found that the digital economy is conducive to improving total factor energy efficiency. In order to further verify the reliability of the results, we conducted the following robustness tests by removing part of the samples, bilateral tail reduction processing, changing the policy implementation time and PSM-DID, the robustness test results are as follows.
5.1.1. Excluded municipalities sample
Municipalities have special economic and political status. From the point of view of legal administrative levels, municipalities and provinces and autonomous regions are provincial administrative units, and the relationship between them is the same level of units. From the actual situation, the status of municipalities may be higher than provinces and autonomous regions, because they have more superior economic infrastructure, infrastructure construction, talent and other conditions. Therefore, this paper carried out regression after removing sample data from four municipalities directly under the Central government, and the results were shown in column (1) of Table 4. The regression coefficient was still positive at the significance level of 5%, indicating that the above conclusion was still valid.
5.1.2. Double-tailed processing
In order to reduce the interference of outliers on the regression results, this paper carried out bilateral tail reduction treatment on all variables at the 1% level, and conducted regression analysis. The results were shown in column (2) of Table 4. The core explanatory variable promoted total factor energy efficiency at the 5% significant level, indicating that the research results were robust.
5.1.3. Estimation of PSM-DID
The samples selected in this paper cover 284 cities across the country, and the samples are distributed all over the country, with great differences in regional and economic development level. This leads to a "selectivity bias" in the differential method, which does not ensure that pilot cities and non-pilot cities have the same individual characteristics before the implementation of the "Broadband China" pilot policy. Therefore, in order to eliminate the estimation bias caused by the differences between samples, this paper adopts the propensity score matching method (PSM), which takes the control variables as the characteristic variables to carry out cross-sectional propensity score matching, and matches the pilot cities and non-pilot cities. Then, based on the matched results, the differential method was used for regression. The estimated results are shown in column (3) of Table 4. The results again show that the conclusion is robust.
5.1.4. Counter-fact check
In addition to the policy change of the establishment of "Broadband China" demonstration cities, other policies or random factors may also lead to differences in urban total factor energy efficiency, and such differences are not related to the establishment of "broadband China" demonstration cities, which may lead to the invalidity of the above conclusions. In order to eliminate the interference of other factors, we refer to the practice of Lu and Yu [39]and conducts a counter-fact test by advancing the implementation time of "Broadband China" strategy pilot cities by one year. The test results are shown in column (4) of Table 4. The estimated results show that the interaction term coefficient 1 year in advance is not significant, which verifies the robustness of the baseline regression results in this paper.
5.2. Heterogeneity Analysis
China has a vast territory, and there are gaps in resource endowment, foreign trade, institutional constraints and industrial structure, which have evolved into regional development gaps. Therefore, the impact of digital economy on total factor energy efficiency is heterogeneous. On the basis of the previous research, we will explore whether the impact of digital economy on total factor energy efficiency will be different due to the differences in location choice, city size and urban resource endowment.
5.2.1. Regional heterogeneity
Uncoordinated regional development embodies the contradiction of unbalanced economic development in China. After the reform and opening up, China's regional gap is mainly reflected in the gap between the east and the west, with the implementation of "western development" and "central rise" and other strategies, the gap between the east and the west shows a narrowing trend. With China's economy entering the new normal, a new phenomenon, the North-South gap, has emerged in China's regional economic gap. Compared with the central and western regions and the northern regions, the eastern and southern regions have higher advantages in talent introduction, innovation factor concentration and industrial structure upgrading, which may lead to regional heterogeneity in the impact of digital economy on total factor energy efficiency. Based on this, this paper divides the sample cities according to the two criteria of "East-West" and "North-South", and the specific regression results are shown in Table 5. Columns (1) and (2) of Table 5 show the east-west differences in the impact of the digital economy. The results show that the improvement effect of digital economy development on total factor energy efficiency is significantly different between eastern and central and western regions. The development of digital economy significantly improves the total factor energy efficiency in eastern cities, but does not improve the total factor energy efficiency in central and western cities. The reason for the difference may be that the development level of digital economy is different in spatial dimension, and its spatial distribution is gradually decreasing from the eastern coast to the central and western inland. Columns (3) and (4) in Table 5 reflect the North-South difference in the impact of digital economy. The regression coefficient of the southern region is significantly positive, while that of the northern region is positive, but fails the significance test. This suggests that there is also a north-south difference in the impact of the digital economy on total factor energy efficiency. In northern China, mining, smelting, steel and other energy-intensive industries account for a relatively high proportion, and the "high carbonization" of residential heating in winter exacerbates the difficulty of carbon emission reduction, which offsetting the promotion effect of the digital economy; Compared with the northern region, the southern region is rich in hydropower resources and has more advantages in energy structure, and relies less on high-carbon energy such as coal and oil in economic development. At the same time, the southern region has a stronger ability of technological innovation and achievement transformation, and the regional technology market is more perfect, so the digital economy has a stronger effect on the promotion of total factor energy efficiency in the southern region.
5.2.2. Urban size heterogeneity
The larger a city is, the more human capital and enterprise resources it has, and the agglomeration economy within the city will also be strengthened. This resource difference caused by the difference in city size is likely to affect the implementation effect of the pilot policy of "Broadband China". China Business News and New First-tier City Research Institute released the "2020 City Business Charm Ranking", which divides domestic cities into six categories based on the concentration of commercial resources, urban hub, lifestyle diversity and future plasticity of major cities. Based on this classification standard, we combine first-tier cities, new first-tier cities and second-tier cities into first-tier cities, third-tier cities as second-tier cities, fourth-tier cities and fifth-tier cities into third-tier cities, and tests the digital economy impact on total factor energy efficiency. Due to the heterogeneity of city size through grouping regression, the results of regression are shown in Table 6. In the first class city group, the regression coefficient of the pilot policy of "Broadband China" is significantly positive, while in the second and third class city groups, the regression coefficient is not significant, which indicates that the impact of digital economy on total factor energy efficiency is more obvious in the first class city group, and the impact of the policy is not obvious in the other city groups.
5.2.3. Resource endowment heterogeneity
There are certain differences in the resource endowment of different cities, and the economic development mode and industrial structure of different resource-based cities are also different, so that the digital economy of various cities may have a heterogeneous impact on the total factor energy efficiency of cities. Therefore, according to the classification criteria of resource-based cities in the National Plan for Sustainable Development of Resource-Based Cities (2013-2020) issued by The State Council, we divide the research samples into resource-based cities and non-resource-based cities, and carries out grouping regression. The regression results are shown in columns (4) and (5) of Table 6. The digital economy has a positive impact on the total factor energy efficiency of non-resource-based cities at the significant level of 1%, while the impact on resource-based cities is not significant. This may be that resource-based cities are more dependent on the development of resource-based industries, the adjustment of industrial structure is difficult, there is path dependence and lock-in effect of economic development, and it will compete for funds and talents from other emerging industries, aggravating the "resource curse". Traditional resource-based industries cannot organically integrate with digital technology, and the correlation and dependence are not high, which weakens the promotion role of digital economy. On the contrary, the development of non-resource-based cities is not so dependent on resource-based industries, and the development of digital economy will promote the transfer of factors to sectors such as the service industry, optimize the industrial structure, and promote the improvement of energy efficiency of non-resource-based cities.
5.3. Mechanism Analysis
Based on the above theoretical analysis, it is found that the development of digital economy may affect total factor energy efficiency through the level of innovation and environmental regulations. In view of this, based on the practice of Baron and Kenny (1986)[40], we use the intermediary effect model to empirically test the path through which digital economy can improve total factor energy efficiency. The construction of the mediation effect model is as follows:
in Formulas (3) and (4) represents the intermediary variable, which is measured in this paper from two aspects of technological progress and environmental regulation. the testing steps of the mediation effect are as follows: (1) The urban total factor energy efficiency was taken as the explained variable, and the "Broadband China" pilot policy was taken as the explanatory variable for regression;(2) The intermediate variables, such as urban technological progress and environmental regulation, were taken as explained variables respectively, and the pilot policy of "Broadband China" was taken as explained variables for regression;(3) The pilot policy of "Broadband China" and the intermediary variables are included in the regression model to observe the impact of both on the growth of urban total factor productivity. If the coefficients and are both significant, and is smaller or less significant than , it indicates the existence of intermediary effect. First of all, for the quantification of urban technological progress, we choose the number of invention patents granted per 10,000 people as the proxy variable of technological progress, and takes its logarithm. Secondly, we use the harmless disposal rate of domestic waste as the proxy variable of environmental regulation. Columns (1) - (3) of Table 7 report the empirical results of technological progress as a mediating variable. Column (1) is the result of the first step of the intermediary effect test. The regression result shows that the regression coefficient of the pilot policy of "Broadband China" is 0.741, and it has passed the significance level test of 1%, which means that the pilot policy of "Broadband China" can improve the urban total factor energy efficiency. Column (2) examines the impact of the "Broadband China" pilot policy on technological progress, corresponding to the second step of the intermediation effect test. According to the regression results, the regression coefficient of the "Broadband China" pilot policy is significantly positive, which confirms the positive impact of the policy on technological progress. Column (3) takes into account both the "Broadband China" pilot policy and technological progress, which is the third step in the intermediation effect test. The regression coefficients of both policies and technological progress are significantly positive, and the regression coefficient of the pilot policy of "Broadband China" in column (3) is smaller than that of column (1), indicating that the pilot policy of "Broadband China" can affect urban total factor energy efficiency through the intermediary variable of technological progress, and technological progress plays a part of the intermediary role in this process. According to the research conclusion, hypothesis H2 is verified.
The model (3) - (6) in Table 7 reports the empirical results of environmental regulation as a mediating variable. Column (4) is the first step of the mediation effect test, and the empirical results are consistent with the results of column (1) and baseline regression, confirming the effect of the pilot policy of "Broadband China" on the improvement of urban total factor energy efficiency. The second step of the intermediary effect model needs to verify the size and direction of the impact of the pilot policy of "Broadband China" on the intermediary factor, namely environmental regulation. According to the regression results in column (5), the regression coefficient of the pilot policy of "Broadband China" is 0.103, which is significant at the 5% level, which means that after a city is included in the list of pilot cities of "Broadband China", The intensity of environmental regulations will be increased. Further, the impact of the pilot policy of "Broadband China" and environmental regulations on urban total factor energy efficiency is examined. The relevant regression results are reported in column (6). The regression coefficient of "Broadband China" pilot policy is 0.732, which is slightly lower than the regression result in column (4), and has passed the significance level test of 1%. The conclusions of this part of the study support the hypothesis 3.
6. Conclusions and Policy Implications
Improving energy efficiency and reducing pollution are the inherent requirements for high-quality economic development, so the central government has issued a number of policy measures. Based on the pilot policy of "Broadband China", we construct a quasi-natural experiment. On the basis of theoretical analysis, panel data of 284 cities from 2007 to 2020 are selected, and multi-period DID is used for analysis to empirically test the impact of the development level of digital economy on the total factor energy efficiency of cities. The following conclusions are drawn: (1) Digital economy significantly improves urban total factor energy efficiency, and this conclusion is still valid after parallel trend test, counter-fact test and a series of robustness tests; (2) Digital economy has a more significant promoting effect on the total factor energy efficiency of eastern regions, southern regions, large cities and non-resource-based cities, while the influence of central and western regions, northern regions, small cities and resource-based cities is not significant; (3) Digital economy can improve urban total factor energy efficiency mainly through technological progress and environmental regulations.
Based on the above research conclusions and combined with the current national conditions of our country, we put forward the following policy recommendations:
First, it is necessary to continue to develop the digital economy, promote the construction of "digital China", and promote the digital economy to play its role in promoting energy efficiency. Specifically, different cities should comprehensively determine their urban positioning and industrial development goals according to their own geographical location, resource endowment conditions, and economic development level. On this basis, formulate policies and measures to encourage the development of the digital economy which focus on the establishment and improvement of the policy framework and guide more market forces to participate in it. Thus, we can establish a market-based digital economy development model, and promote the synchronous development of the digital industry and the economy and society as a whole, so that the digital economy can play its role in promoting energy efficiency.
Second, based on the advantages of pilot areas, network infrastructure construction should be carried out according to local conditions. In China's eastern regions, southern regions, larger cities, non-resource-based cities, we should continue to develop the digital economy to improve the prerequisite for energy efficiency. For China's central and western regions, northern regions, smaller cities, and resource-based cities, it is necessary to speed up the construction of network infrastructure and improve coverage, guide everyone to participate in and share digital life, and avoid the digital divide and regional disparity that may be caused by digital transformation.
Finally, the results of mechanism analysis show that the improvement of total factor energy efficiency in digital economy mainly comes from technological progress and environmental regulation. So first it is necessary to increase financial investment in science and technology, strengthen the training of innovative talents, and take network infrastructure as the starting point, promote the co-construction and sharing of innovation platforms, and enhance the city's innovation capacity. At the same time, we should make full use of Internet technology and constantly promote the development of emerging industries such as big data, cloud computing and artificial intelligence. Second build an information exchange platform and adjust the intensity of environmental regulations. Through the deep integration of digital technology construction process and information dissemination, timely jump out of the information depression, fully understand the environmental regulation policies of various regions, based on the actual local needs and formulate a reasonable environmental regulation system and environmental tax rate. It is necessary to fully understand the real feedback information of "high energy consumption, high pollution and high emission" enterprises on the regulatory situation. At the same time, the government needs to provide detailed guidelines and policy answers.
Although we study the impacts of digital economy on total factor energy efficiency, and analyze its heterogeneity and mechanism, there are still some limitations. First, we take the "broadband China" pilot policy as the proxy variable of the digital economy which measures the digital economy from the perspective of digital infrastructure. However, the connotation of digital economy is very rich, so the estimated coefficient can only partially explain the impact of digital economy on total factor energy efficiency. In the future, we can deeply study the connotation of digital economy. Second, due to the lack of data, the environmental regulation data at the municipal level cannot be well measured.
Author Contributions
Conceptualization, H.L. and X.Y.; methodology, X.Y.; software, X.Y.; validation, X.Y.; formal analysis, X.Y.; investigation, X.Y.; resources, X.Y.; data curation, X.Y.; writing—original draft preparation, X.Y.; writing—review and editing, H.L. and X.Y.; supervision, X.Y. All authors have read and agreed to the published version of the manuscript.
Funding
This research was funded by National Natural Science Foundation of China (NSFC) Project “Assessment of the Ability to Pay Real Estate Tax and Research on Tax System Design under the Condition that Housing Value is not commensurate with Residents’ Income” (71873049); National Natural Science Foundation of China Project "Research on the Impact of Real Estate Tax Reform on Residents' Behavior under the Open Background" (71673094).
Institutional Review Board Statement
Not applicable.
Informed Consent Statement
Not applicable.
Data Availability Statement
All data generated or analyzed during this study are included in this published article.
Acknowledgments
We would like to express our gratitude to everyone who helped us in writing this article. I sincerely thank Professor Fu Shuke of Wuhan Institute of Technology for his guidance and assistance in the topic selection. At the same time, I would like to thank Professor Liu Hua and colleagues of the School of Management of Huazhong University of Science and Technology for their help, so that I have more time to research and write this paper.
Conflicts of Interest
The authors declare no conflict of interest.
References
- Huang S, Chen L. The Impact of the Digital Economy on the Urban Total-Factor Energy Efficiency: Evidence from 275 Cities in China[J]. Sustainability, 2023, 15(4): 3195. [CrossRef]
- Wang H, Cheng Y. Impact of the digital economy on total factor energy efficiency: evidence from 268 Chinese cities[J]. Environmental Science and Pollution Research, 2023: 1-16. [CrossRef]
- Liu H, Zhang Z, Zhang T, et al. Revisiting China’s provincial energy efficiency and its influencing factors[J]. Energy, 2020, 208: 118361. [CrossRef]
- Tang L, He G. How to improve total factor energy efficiency? An empirical analysis of the Yangtze River economic belt of China[J]. Energy, 2021, 235: 121375. [CrossRef]
- Ren S, Hao Y, Xu L, et al. Digitalization and energy: How does internet development affect China's energy consumption?[J]. Energy Economics, 2021, 98: 105220. [CrossRef]
- Wu H, Xue Y, Hao Y, et al. How does internet development affect energy-saving and emission reduction? Evidence from China[J]. Energy Economics, 2021, 103: 105577. [CrossRef]
- Lin B, Zhou Y. Does the Internet development affect energy and carbon emission performance?[J]. Sustainable Production and Consumption, 2021, 28: 1-10. [CrossRef]
- Shen S, Li H, Li M. Transportation Infrastructure and Digital Economy—Evidence from Chinese Cities[J]. Sustainability, 2023, 15(22): 16024. [CrossRef]
- Song J. The Impact of Infrastructure, Digital Production, E-Commerce, and Virtual Economy on Digital Economy Construction in China[C]//2022 International Conference on Economics, Smart Finance and Contemporary Trade (ESFCT 2022). Atlantis Press, 2022: 1187-1195. [CrossRef]
- Xu X Y, Kanaado M B, Epadile M. The impact of technological innovation, research and development, and energy intensity on carbon emissions: an experience from BRICS and OECD countries[J]. International Journal of Sustainable Development & World Policy, 2022, 11(1): 1-17. [CrossRef]
- Zhou Q, Li T, Gong L. The effect of tax incentives on energy intensity: Evidence from China's VAT reform[J]. Energy Economics, 2022, 108: 105887. [CrossRef]
- Wurlod J D, Noailly J. The impact of green innovation on energy intensity: An empirical analysis for 14 industrial sectors in OECD countries[J]. Energy Economics, 2018, 71: 47-61. [CrossRef]
- Wang Q, Zhou P, Zhou D. Efficiency measurement with carbon dioxide emissions: the case of China[J]. Applied Energy, 2012, 90(1): 161-166. [CrossRef]
- Camioto F C, Mariano E B, Santana N B, et al. Renewable and sustainable energy efficiency: An analysis of Latin American countries[J]. Environmental Progress & Sustainable Energy, 2018, 37(6): 2116-2123. [CrossRef]
- Watanabe M, Tanaka K. Efficiency analysis of Chinese industry: A directional distance function approach[J]. Energy policy, 2007, 35(12): 6323-6331. [CrossRef]
- Bi G B, Song W, Zhou P, et al. Does environmental regulation affect energy efficiency in China's thermal power generation? Empirical evidence from a slacks-based DEA model[J]. Energy Policy, 2014, 66: 537-546. [CrossRef]
- Sun H, Edziah B K, Sun C, et al. Institutional quality and its spatial spillover effects on energy efficiency[J]. Socio-Economic Planning Sciences, 2022, 83: 101023. [CrossRef]
- Liu F, Sim J, Sun H, et al. Assessing the role of economic globalization on energy efficiency: Evidence from a global perspective[J]. China Economic Review, 2023, 77: 101897. [CrossRef]
- Aigner D, Lovell C A K, Schmidt P. Formulation and estimation of stochastic frontier production function models[J]. Journal of econometrics, 1977, 6(1): 21-37. [CrossRef]
- Banker R D, Charnes A, Cooper W W. Some models for estimating technical and scale inefficiencies in data envelopment analysis[J]. Management science, 1984, 30(9): 1078-1092. [CrossRef]
- Baležentis T, Li T, Streimikiene D, et al. Is the Lithuanian economy approaching the goals of sustainable energy and climate change mitigation? Evidence from DEA-based environmental performance index[J]. Journal of Cleaner Production, 2016, 116: 23-31. [CrossRef]
- Ohene-Asare K, Tetteh E N, Asuah E L. Total factor energy efficiency and economic development in Africa[J]. Energy Efficiency, 2020, 13(6): 1177-1194. [CrossRef]
- Lin J, Xu C. The impact of environmental regulation on total factor energy efficiency: A cross-region analysis in China[J]. Energies, 2017, 10(10): 1578. [CrossRef]
- Wang Q S, Su C W, Hua Y F, et al. Can fiscal decentralisation regulate the impact of industrial structure on energy efficiency? [J]. Economic research-Ekonomska istraživanja, 2021, 34(1): 1727-1751. [CrossRef]
- Wang H, Wang M. Effects of technological innovation on energy efficiency in China: Evidence from dynamic panel of 284 cities[J]. Science of the total environment, 2020, 709: 136172. [CrossRef]
- Shah W U H, Hao G, Yan H, et al. The impact of trade, financial development and government integrity on energy efficiency: An analysis from G7-Countries[J]. Energy, 2022, 255: 124507. [CrossRef]
- Cao W, Chen S, Huang Z. Does foreign direct investment impact energy intensity? Evidence from developing countries[J]. Mathematical Problems in Engineering, 2020, 2020: 1-11. [CrossRef]
- Ma X J, Li Y C, Fu Z, et al. The impact of digital economy on industrial structure upgrading from the perspective of spatial effects[C]//Stat. Inf. Forum. 2022, 37: 14-25.
- Lyu Y, Wang W, Wu Y, et al. How does digital economy affect green total factor productivity? Evidence from China[J]. Science of The Total Environment, 2023, 857: 159428. [CrossRef]
- Zhang J, Lyu Y, Li Y, et al. Digital economy: An innovation driving factor for low-carbon development[J]. Environmental Impact Assessment Review, 2022, 96: 106821. [CrossRef]
- Kopina A, Kopin D. Fiscal Federalism and Tax Autonomy: Digital Economy Challenges[J]. Financial Law Review, 2019 (14): 2. [CrossRef]
- Li X, Wu Q. The impact of digital economy on high-quality economic development: Research based on the consumption expansion[J]. Plos one, 2023, 18(12): e0292925. [CrossRef]
- Zhang L, Mu R, Zhan Y, et al. Digital economy, energy efficiency, and carbon emissions: Evidence from provincial panel data in China[J]. Science of The Total Environment, 2022, 852: 158403. [CrossRef]
- Zhang Y, Ran C. Effect of digital economy on air pollution in China? New evidence from the “National Big Data Comprehensive Pilot Area” policy[J]. Economic Analysis and Policy, 2023, 79: 986-1004. [CrossRef]
- Goldfarb A, Tucker C. Digital economics[J]. Journal of economic literature, 2019, 57(1): 3-43. [CrossRef]
- Shan S, Genç S Y, Kamran H W, et al. Role of green technology innovation and renewable energy in carbon neutrality: A sustainable investigation from Turkey[J]. Journal of Environmental Management, 2021, 294: 113004. [CrossRef]
- Beck T, Levine R, Levkov A. Big bad banks? The winners and losers from bank deregulation in the United States[J]. The journal of finance, 2010, 65(5): 1637-1667. [CrossRef]
- Hu J L, Wang S C. Total-factor energy efficiency of regions in China[J]. Energy policy, 2006, 34(17): 3206-3217. [CrossRef]
- Lu Y, Yu L. Trade liberalization and markup dispersion: evidence from China's WTO accession[J]. American Economic Journal: Applied Economics, 2015, 7(4): 221-253. [CrossRef]
- Baron R M, Kenny D A. The moderator–mediator variable distinction in social psychological research: Conceptual, strategic, and statistical considerations[J]. Journal of personality and social psychology, 1986, 51(6): 1173. [CrossRef]
Figure 1.
Parallel trend test.
Table 1.
Descriptions of variables.
| Variables | Definition | |
| Input | Energy | The total consumption of coal, oil, and natural gas (converted into standard coal) |
| Labor | employees at the end of the year | |
| Capital | Perpetual Inventory Method (PIM) is used to calculate the capital stock at 2000 comparable prices.A capital depreciation rate of 10.96% was selected | |
| output | Expect output | Real GDP of each city based on the year 2000 |
| Unexpected output | Emissions of sulfur dioxide, waste water and dust in each city | |
Table 2.
Descriptive Statistics.
| Variable | Obs | Mean | Std.Dev. | Min | Max |
| TFEE | 3976 | 100.207 | 4.6502 | 48.8448 | 165.503 |
| did | 3976 | 0.1622 | 0.3687 | 0 | 1 |
| pgdp | 3976 | 10.511 | 0.6807 | 8.1309 | 13.0557 |
| fin | 3976 | 2.3016 | 1.1597 | 0.56 | 21.3014 |
| fdi | 3976 | 0.1006 | 3.4779 | 0 | 203.595 |
| pop | 3976 | 5.8802 | 0.6943 | 2.8981 | 8.1397 |
| rd | 3976 | 0.0156 | 0.0156 | 0.0006 | 0.2068 |
| edu | 3976 | 0.1805 | 0.0424 | 0.0177 | 0.3774 |
| fic | 3976 | 0.4628 | 0.2281 | 0.0544 | 1.5413 |
Table 3.
Benchmark regression results.
| VARIABLES | (1) | (2) | (3) | (4) |
| did | 2.550*** | 1.095*** | 0.647*** | 0.741*** |
| (0.278) | (0.304) | (0.234) | (0.276) | |
| lnpgdp | 1.362*** | 0.062 | ||
| (0.288) | (0.546) | |||
| fin | 0.259*** | -0.142 | ||
| (0.100) | (0.157) | |||
| fdi | -0.0602*** | -0.0710*** | ||
| (0.002) | (0.002) | |||
| lnpop | 0.654*** | 0.96 | ||
| (0.142) | (1.301) | |||
| rd | -2.761 | -8.572 | ||
| (9.954) | (20.820) | |||
| edu | -5.443*** | -0.478 | ||
| (1.719) | (3.682) | |||
| fic | -1.443** | -0.617 | ||
| (0.695) | (1.037) | |||
| Constant | 99.79*** | 98.85*** | 83.20*** | 93.46*** |
| (0.061) | (0.188) | (3.245) | (10.110) | |
| year | NO | YES | YES | YES |
| city | NO | NO | NO | YES |
| Observations | 3,976 | 3,976 | 3,976 | 3,976 |
| R-squared | 0.0392 | 0.1314 | 0.1316 | 0.135 |
Table 4.
Robustness test.
| VARIABLES | (1) | (2) | (3) | (4) |
| Partial sample | winsorize | PSM-DID | Counterfactuals | |
| did | 0.540** | 0.443** | 0.705** | 0.151 |
| (0.251) | (0.215) | (0.272) | (0.312) | |
| lnpgdp | -0.073 | 0.123 | 0.244 | -0.0547 |
| (0.540) | (0.409) | (0.548) | (0.538) | |
| fin | -0.103 | -0.0748 | -0.129 | -0.151 |
| (0.146) | (0.136) | (0.157) | (0.158) | |
| fdi | -0.0719*** | -0.0452*** | -8.724** | -0.0724*** |
| (0.002) | (0.001) | (3.953) | (0.002) | |
| lnpop | 0.602 | 0.647 | 0.959 | 1.185 |
| (1.219) | (1.112) | (1.356) | (1.310) | |
| rd | -5.724 | -8.491 | -7.711 | -7.228 |
| (20.510) | (15.770) | (22.190) | (20.800) | |
| edu | -1.549 | 2.113 | -0.955 | -0.144 |
| (3.580) | (2.695) | (3.717) | (3.608) | |
| fic | -0.331 | -0.525 | -0.591 | -0.482 |
| (0.956) | (0.858) | (1.041) | (1.033) | |
| Constant | 96.80*** | 94.04*** | 91.91*** | 93.14*** |
| (9.684) | (8.105) | (10.400) | (10.140) | |
| year | YES | YES | YES | YES |
| city | YES | YES | YES | YES |
| Observations | 3,920 | 3,976 | 3,950 | 3,976 |
| R-squared | 0.15 | 0.186 | 0.134 | 0.133 |
Table 5.
Heterogeneity test.
| VARIABLES | (1) | (2) | (3) | (4) |
| East | Mid& West | North | South | |
| did | 1.475** | 0.384 | 0.711 | 0.807** |
| (0.585) | (0.240) | (0.430) | (0.338) | |
| lnpgdp | 1.157 | 0.377 | 2.258** | 0.276 |
| (1.043) | (0.595) | (0.930) | (0.957) | |
| fin | -0.073 | -0.155 | 0.0522 | -0.861*** |
| (0.204) | (0.295) | (0.159) | (0.210) | |
| fdi | -24.46** | -0.0719*** | -0.0652*** | -7.428** |
| (11.280) | (0.002) | (0.003) | (2.932) | |
| lnpop | -2.269 | 0.905 | 5.780** | 1.432 |
| (2.570) | (1.249) | (2.519) | (1.456) | |
| rd | 11.39 | -14.71 | -15.57 | 6.715 |
| (40.590) | (13.580) | (22.550) | (24.810) | |
| edu | 5.281 | -4.206 | 9.695* | -3.804 |
| (7.564) | (3.198) | (5.208) | (5.276) | |
| fic | 3.536 | -1.111 | -3.927* | 0.668 |
| (2.398) | (1.003) | (2.190) | (1.139) | |
| Constant | 98.09*** | 91.81*** | 43.68** | 89.66*** |
| (17.740) | (10.650) | (17.320) | (14.880) | |
| year | YES | YES | YES | YES |
| city | YES | YES | YES | YES |
| Observations | 1,680 | 2,296 | 1,820 | 2,156 |
| R-squared | 0.151 | 0.165 | 0.212 | 0.115 |
Table 6.
Heterogeneity test.
| VARIABLES | (1) | (2) | (3) | (4) | (5) |
| first | second | third | resource | non-resource | |
| did | 2.149** | -0.149 | 0.0635 | 0.23 | 1.067*** |
| (1.040) | (0.260) | (0.323) | (0.365) | (0.374) | |
| lnpgdp | 3.24 | -0.0319 | 0.307 | 0.736 | -0.348 |
| (2.506) | (0.845) | (0.547) | (0.796) | (0.790) | |
| fin | -1.335** | -0.247 | 0.00395 | 0.146 | -0.32 |
| (0.610) | (0.332) | (0.108) | (0.335) | (0.242) | |
| fdi | -47.98** | -5.297** | -0.0716*** | -6.39 | -0.0702*** |
| (21.540) | (2.110) | (0.003) | (8.045) | (0.003) | |
| lnpop | -3.474 | -0.0172 | 0.853 | -1.112 | 3.180** |
| (3.117) | (1.379) | (2.595) | (1.304) | (1.258) | |
| rd | -61.43** | 0.276 | 7.785 | 31.96 | -41.30*** |
| (23.240) | (35.760) | (12.000) | (32.700) | (14.390) | |
| edu | -5.753 | -1.32 | 0.0903 | -6.193 | 5.868 |
| (15.850) | (5.099) | (3.710) | (4.523) | (5.277) | |
| fic | 3.917 | 0.545 | -4.068*** | -2.263 | -0.00485 |
| (3.242) | (1.101) | (1.514) | (1.710) | (1.226) | |
| Constant | 92.39*** | 99.85*** | 92.70*** | 100.3*** | 83.04*** |
| (30.120) | (14.380) | (14.300) | (12.370) | (11.740) | |
| year | YES | YES | YES | YES | YES |
| city | YES | YES | YES | YES | YES |
| Observations | 686 | 2,114 | 1,176 | 1,596 | 2,380 |
| R-squared | 0.191 | 0.153 | 0.161 | 0.158 | 0.138 |
Table 7.
Mechanism analysis.
| VARIABLES | (1) | (2) | (3) | (4) | (5) | (6) |
| Technical Progress | Environmental Regulation | |||||
| TFEE | TP | TFEE | TFEE | ER | TFEE | |
| did | 0.741*** | 0.184*** | 0.546** | 0.741*** | -0.103** | 0.732*** |
| (0.276) | (0.038) | (0.270) | (0.276) | (0.052) | (0.275) | |
| M | 1.060** | -0.0846 | ||||
| (0.424) | (0.109) | |||||
| lnpgdp | 0.062 | -0.155*** | 0.226 | 0.062 | 0.144 | 0.0741 |
| (0.546) | (0.052) | (0.552) | (0.546) | (0.107) | (0.547) | |
| fin | -0.142 | -0.0124 | -0.129 | -0.142 | -0.0116 | -0.143 |
| (0.157) | (0.011) | (0.154) | (0.157) | (0.019) | (0.157) | |
| fdi | -0.0710*** | 0.00156*** | -0.0727*** | -0.0710*** | 0.00298*** | -0.0707*** |
| (0.002) | (0.000) | (0.002) | (0.002) | (0.000) | (0.002) | |
| lnpop | 0.96 | 0.492** | 0.438 | 0.96 | -0.205 | 0.943 |
| (1.301) | (0.240) | (1.187) | (1.301) | (0.276) | (1.297) | |
| rd | -8.572 | 7.384*** | -16.4 | -8.572 | -1.596 | -8.707 |
| (20.820) | (1.794) | (23.220) | (20.820) | (0.991) | (20.840) | |
| edu | -0.478 | 1.671*** | -2.249 | -0.478 | -1.122 | -0.572 |
| (3.682) | (0.347) | (3.593) | (3.682) | (0.760) | (3.691) | |
| fic | -0.617 | -0.328*** | -0.269 | -0.617 | -0.284 | -0.641 |
| (1.037) | (0.121) | (1.029) | (1.037) | (0.226) | (1.042) | |
| Constant | 93.46*** | -1.502 | 95.05*** | 93.46*** | 4.252** | 93.82*** |
| (10.110) | (1.462) | (9.617) | (10.110) | (2.007) | (10.050) | |
| year | YES | YES | YES | YES | YES | YES |
| city | YES | YES | YES | YES | YES | YES |
| Observations | 3,976 | 3,976 | 3,976 | 3,976 | 3,976 | 3,976 |
| R-squared | 0.135 | 0.596 | 0.137 | 0.135 | 0.138 | 0.135 |
Disclaimer/Publisher’s Note: The statements, opinions and data contained in all publications are solely those of the individual author(s) and contributor(s) and not of MDPI and/or the editor(s). MDPI and/or the editor(s) disclaim responsibility for any injury to people or property resulting from any ideas, methods, instructions or products referred to in the content. |
© 2024 by the authors. Licensee MDPI, Basel, Switzerland. This article is an open access article distributed under the terms and conditions of the Creative Commons Attribution (CC BY) license (http://creativecommons.org/licenses/by/4.0/).
Copyright: This open access article is published under a Creative Commons CC BY 4.0 license, which permit the free download, distribution, and reuse, provided that the author and preprint are cited in any reuse.
The Impact of the Digital Economy on the Urban Total-Factor Energy Efficiency: Evidence from 275 Cities in China
Senhua Huang
et al.
Sustainability,
2023
Digital Economy and 3E Efficiency Performance: Evidence from EU Countries
Shuangjie Li
et al.
Sustainability,
2023
Digital Economy, Financial Development, and Energy Poverty Based on Mediating Effects and a Spatial Autocorrelation Model
Junhong Qu
et al.
Sustainability,
2022


MDPI Initiatives
Important Links
© 2024 MDPI (Basel, Switzerland) unless otherwise stated