1. Introduction
Based on the Economic Censuses conducted by INEGI in 2019, the manufacturing sector in Mexico was responsible for generating 48.2% of the national total gross production, making it the most significant contributor. This sector comprises 579,828 economic units, which accounts for 12.1% of the country’s total. Microenterprises comprise most of these units, representing 93.7% of all economic units, while small, medium, and large companies account for 4.2%, 1.3%, and 0.8%, respectively. Mexico’s small and medium-sized business markets have 24,353 and 7,538 economic units, respectively. In the state of Querétaro, according to DENUE [
1], there are 1,086 small and medium-sized manufacturing companies, representing the study’s potential market. Additionally, the San Juan del Rio municipality has 157 companies operating within this.
Companies use various performance indicators to measure their operations. These include PPk and CPk for process ability, different types of control charts, Mean Time Between Failures (MTBF) and Mean Time to Repair (MTTR) for Total Productive Maintenance (TPM), and others. One important indicator is Overall Equipment Efficiency (OEE), which depends on three factors: Availability (D), Speed (R), and Quality (C). To calculate these indicators, it is necessary to collect production data across the entire supply chain, both internal and external.
Calculating performance indicators (KPIs), such as Overall Equipment Efficiency (OEE), is a common issue by manually collecting data from record sheets and performing calculations in Excel sheets. This method can lead to uncertainty regarding the accuracy of the information due to human errors. Additionally, many companies still do not have access to these valuable indicators, which are crucial for decision-making [
2].
It is crucial to promote the digitization of established Mexican companies. According to the International Data Corporation, 57% of Mexican companies are significantly involved with the Internet of Things. However, 41% have no plans for future digitization, indicating that the process is not advancing evenly across the country. Small and medium-sized enterprises lag the most behind [
3].
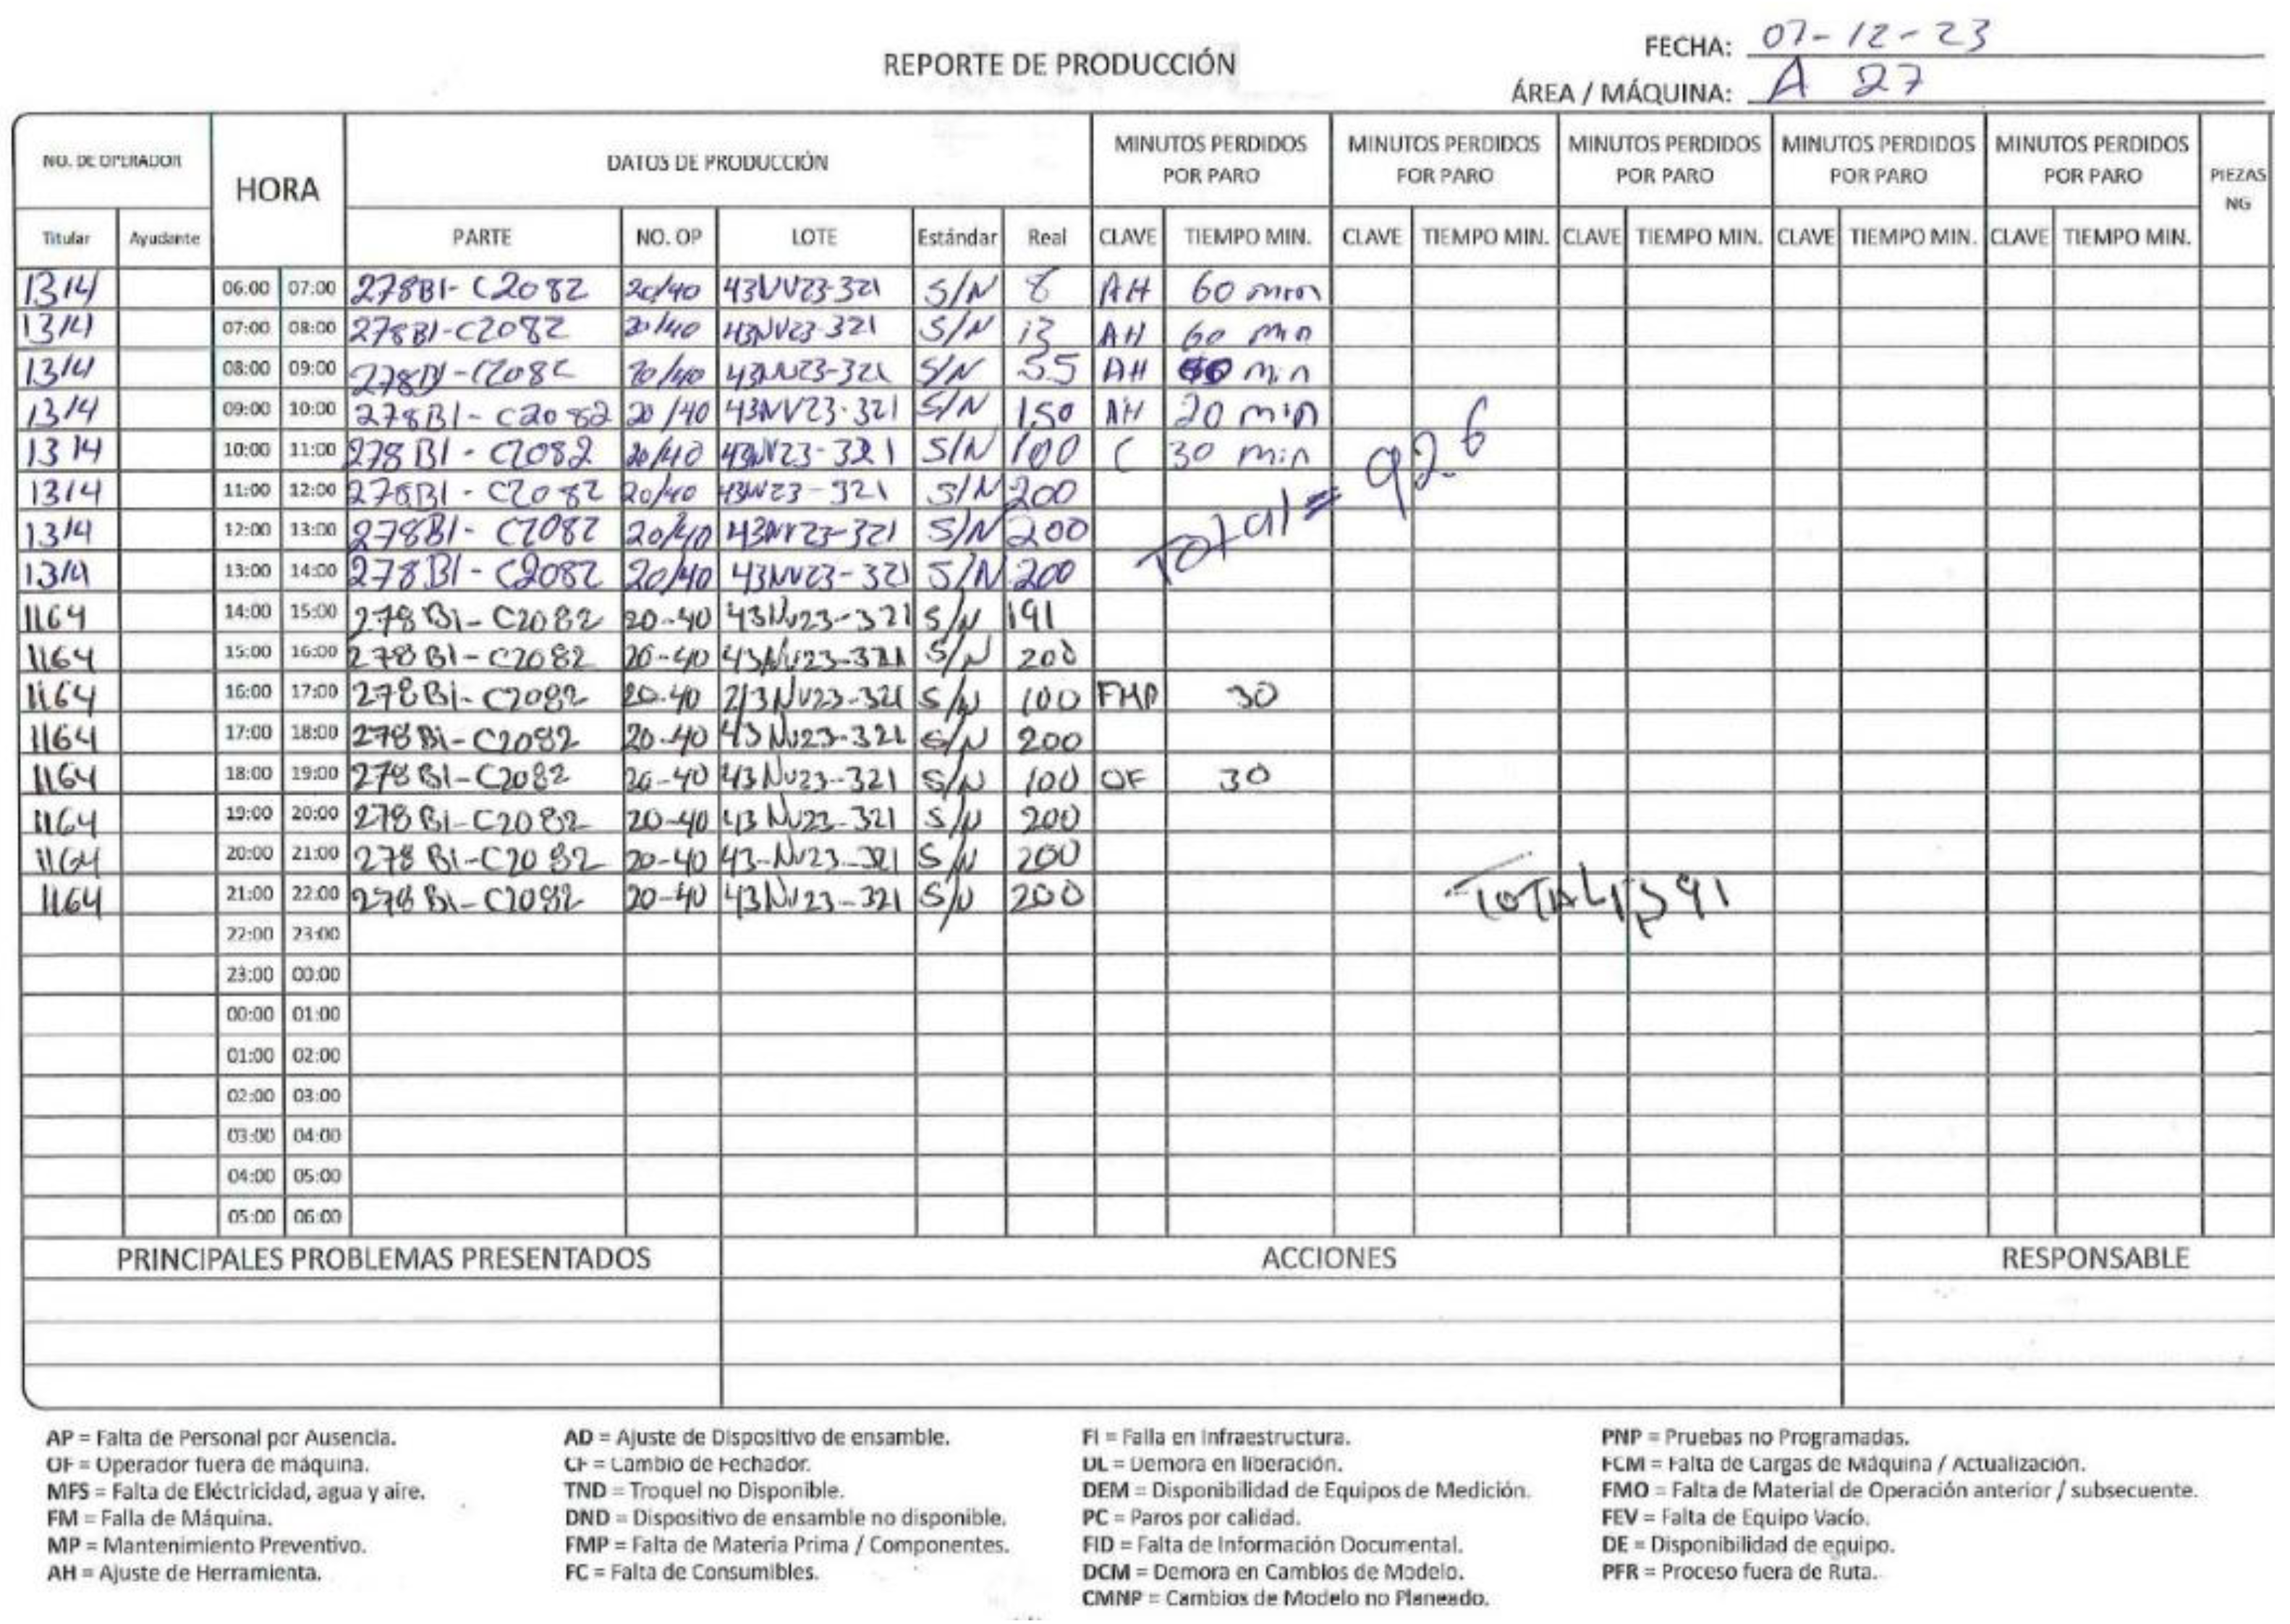
This project aims to create a real-time productivity monitoring system for a medium-sized manufacturing company specializing in die-cutting automotive parts. The company is based in the municipality of San Juan del Río, Querétaro. Production data is collected using record sheets (as shown in
Figure 1) and then digitized on desktop computers. The data is then processed in Excel sheets, which can take between 1 to 5 days to analyze depending on the availability of staff. This delay in analyzing the data has been identified as a problem that needs to be addressed by implementing a real-time monitoring system.
“There is a lack of reliable real-time productivity indicators for decision-making”.
Some of the potential causes found in the calculation process are:
Incomplete or Altered Data
Confusing and illegible writing
Lack of use of information technologies
Long data capture times
Long processing times
Standardization of reports
Late decision making
To design the proposal, we reviewed recent publications on Industry 4.0 and its related technologies, including Cloud Computing, Big Data, Industrial Internet of Things, Cybersecurity, and Artificial Intelligence. Additionally, we analyzed the tools used in these areas to ensure we comprehensively understand the project requirements.
According to the National Survey on Availability and Use of Information Technologies in 2021, 75.6% of the Mexican population, equivalent to 88.6 million people, used the Internet in Homes. This indicates that the number of internet users worldwide has reached 5.16 billion people, which accounts for 64.4% of the world’s population, according to [
4] statistics.
According to INEGI’s report [
5], 66.4% of homes in Mexico have internet access, totaling 24.3 million homes. Out of all the users, 96.8% prefer using a smartphone as their primary device to access the internet. These statistics clearly indicate the significance of cloud services in various social sectors, especially in the most fundamental areas like data storage services.
The major players in the cloud services industry are Amazon Web Services (AWS), Microsoft Azure (MA), and Google Cloud. IBM and Alibaba follow them, along with smaller "clouds" offered by companies like Adobe, Salesforce, Cloudflare, and Snowflake.
Figure 2 illustrates the range of services these companies provide [
6].
Most proposals for implementing Architecture in Industry 4.0 acknowledge at least three layers in the smart factory environment. These layers are the cyber-physical System (CPS), which monitors processes, creates virtual copies, and makes decentralized decisions; the Internet of Things (IoT), which enables the CPS to communicate with its environment in real-time; and the Internet of Services (IoS), which provides users with improved and faster services.
According to Mejía et al. [
3], Industry 4.0 comprises four main components: physical devices and workforce responsible for production functions, real-time communication networks, cloud resources for data storage and analysis, and applications that are the final products or services accessed by the consumer.
According to Shafique et al., the IoT architecture comprises three main components: hardware, middleware, and the presentation layer. The hardware component comprises the sensor nodes, their integrated communication, and interface circuits. The middleware component includes storage, analysis, and data management resources. Finally, the presentation layer comprises visualization tools compatible with various platforms to present the data to the end-user in an understandable form [
7].
In order for a real system to communicate with a digital system, the devices need to be interconnected using Internet of Things (IoT) or Industrial Internet of Things (IIoT) technologies. Data from various sources, such as sensors, are sent through wired or wireless to a communication interface, which may be through a PLC or any other microcontroller that communicates with the physical-digital world. A digital model of the cyber-physical system can be created by connecting different objects, which provides real-time process data [
8].
Implementing Industry 4.0 presents a challenge in standardizing communication and information management protocols. These protocols enable intelligent and connected production systems to predict and support production in real-time, leading to improved sustainability and organizational performance. In Slovakia’s manufacturing industry, the adoption of I4.0 technologies is recognized as a means to increase productivity, sustainability, and energy efficiency while also enhancing competitiveness [
9].
Artificial Intelligence (AI), for its part, uses tools such as Data Science, Data Mining, Machine Learning and Deep Learning. With these technologies, it is possible to develop applications for presenting key performance indicators and decision-making in real-time. The data may be stored in a public or private cloud database for processing and transformation into useful information. The fifth industrial revolution, Industry 5.0 (I5.0) and artificial intelligence (AI) offer the overwhelming potential to build an inclusive digital future by ensuring supply chain resilience and sustainability [
10].
Globally, there is a growing interest in adopting new Industry 4.0 technologies, and different countries have adopted diverse strategies to achieve this. For example, China invested
$100 million in studying IoT industrial standards and technologies in Shanghai as part of its twelfth five-year plan. Significant efforts are being made to merge cross-domain research activities spanning machine-to-machine (M2M) communication, wireless sensor network (WSN), and RFID into a unified IoT framework. Experts predict that by 2025, every object will have an Internet node, leading to a surge in the number of devices connected to the Internet. According to INEGI [
5], 500 billion devices will be connected to the Internet by 2030.
Mexico is working towards adopting Industry 4.0 technologies to advance towards the fourth industrial revolution. The Ministry of Economy has identified four fundamental pillars to work on: Development of Human Capital, Innovation, Creation of Clusters, and Technology Adoption. Siemens AG states that if Mexico continues to adopt these technologies and related policies and programs, it could become the world’s fifth most influential economy by 2025, increasing the income of the Mexican industry by approximately three and a half billion pesos. Additionally, studies and surveys suggest that production costs could be reduced by 30%. Some of the Mexican government’s initiatives in this area include México Conectado, the National Digital Strategy, the National Digital Literacy and Inclusion Program, and the Software and Innovation Industry Development Program [
3].
Investment in science and technology has a crucial role in advancing society. In the state of Querétaro, there are seven clusters working in various sectors, including Automotive, Aerospace, Energy, Logistics Innovation, Medical and Health, Information Technologies, and Plastics. These clusters have existed for over a decade and have been actively developing new technologies to improve their respective industries [
11].
The state of Querétaro is ranked second in the State Competitiveness Index, just below Mexico City. The state boasts 67 industrial parks and zones. In 2022, 55 investment projects were completed, creating 23,894 jobs, with an investment of 95,666 million pesos. From January to September 2023, 47 investment projects were finalized, generating 13,996 jobs and 26 billion pesos, mainly in the automotive and aeronautical industries. According to INEGI, in 2021, the state’s Gross Domestic Product (GDP) increased by 6.2%, with secondary and tertiary activities showing the highest growth rate of 9.1% and 4.6%, respectively [
12].
There are several research questions that can be posed regarding the implementation of a new system. For example, does the system implementation reduce delivery time? Does it enable a better understanding of the processes? Does it help to standardize the processes? Does it facilitate the measurement of different wastes? Does it allow for OEE calculation automation without errors? However, in our case, we will be focusing on measuring the system’s reliability.
The aim of the project is to create a system that can register and monitor production variables in real-time using Industry 4.0 technologies. The system will calculate productivity indicators to help make timely decisions. To achieve this goal, the following research hypothesis has been proposed:
Null hypothesis: The system’s reliability is at most 99%, and the alternative hypothesis is that it exceeds 99%.
Real-time access to productivity indicators through I4.0 technologies is valuable for facilitating work in various fields, especially production systems that utilize agile thinking. Agile methodologies are centered around Level Production (Heinjunka), Visual Management, Long-Term Thinking, and Standardized Processes. Measuring these indicators is crucial to implementing continuous improvement techniques. However, the lack of automated measurement systems makes it difficult to apply these methodologies effectively.
The application of lean manufacturing is based on calculating OEE, which depends on product quality, equipment availability, and performance [
13]. When implementing improvement strategies like Total Productive Maintenance (TPM), measurement techniques are necessary to evaluate process efficiency and effectiveness. This is where the need for the OEE indicator arises. The OEE helps prevent the underutilization of machines and production lines, providing a systematic method for measuring production objectives [
14]. It’s important to note that achieving an OEE between 85-95% is the goal for every organization to be considered a world-class company. The manufacturing industry is one of the economic sectors where Global Equipment Efficiency calculation has the most significant application.
Calculating the Overall Equipment Effectiveness (OEE) requires understanding the 6 major time losses that can occur in a production system, affecting this indicator. The total available machine time should take into account scheduled stops, such as preventive maintenance and breaks. Stoppages due to preparation and breakdowns that affect availability should also be considered. Performance is affected by minor stops and speed reduction. The start-up time should also be considered, which may lead to defective products due to machine adjustment (refer to
Figure 3 for more information).
According to Nakajima [
15], the OEE calculation requires three indicators: Availability (A), Performance (P) and Quality (Q), all expressed as percentages.
Availability (D): Refers to the time during which the machine is ready to produce, in relation to the planned production time (tpl). Availability reduces the planned time due to stops (start-up times, downtime, breakdowns, waiting). It is calculated using the following formula 2:
Taking into account that the productive time (tp) can be directly taken into account, it is easier to calculate the availability as follows:
Performance (R): It is the ratio of the total units produced (TUP) to the total units expected (Te). The total units expected are calculated by multiplying the operation time (to) by the nominal capacity (cn). Microstops and reduced machine speed can affect performance. The operation time is calculated by adding the productive time to the start-up time and the time of minor stops (refer to formula 3).
Quality (C): It is the proportion of products that meet the quality requirements with respect to the total production achieved, excluding bad and reworked parts (Formula 4).
Formula 5 is used to calculate the OEE once the aforementioned parameters have been estimated. The OEE is used to evaluate the performance of equipment or an entire production line.
Another important concept for testing the quality of a product is reliability, which is defined as the probability of a physical asset performing the desired/required functions (operating without failures) under established operating conditions for a specified period of time. It is calculated using the Weibull distribution (Equation 6).
Where:
MTBF = Mean Time Between Failures
MTTR = Mean Time To Repair
To calculate the Mean Time Between Failures (MTBF) and Mean Time To Repair (MTTR) of any equipment, it is necessary to conduct tests over a significant period of time. At least two failures must occur during the testing process to calculate the averages, as shown in
Figure 4. Otherwise, the reliability of the equipment would be considered 100%, and there would be no need to calculate MTBF and MTTR [
16].
2. Materials and Methods
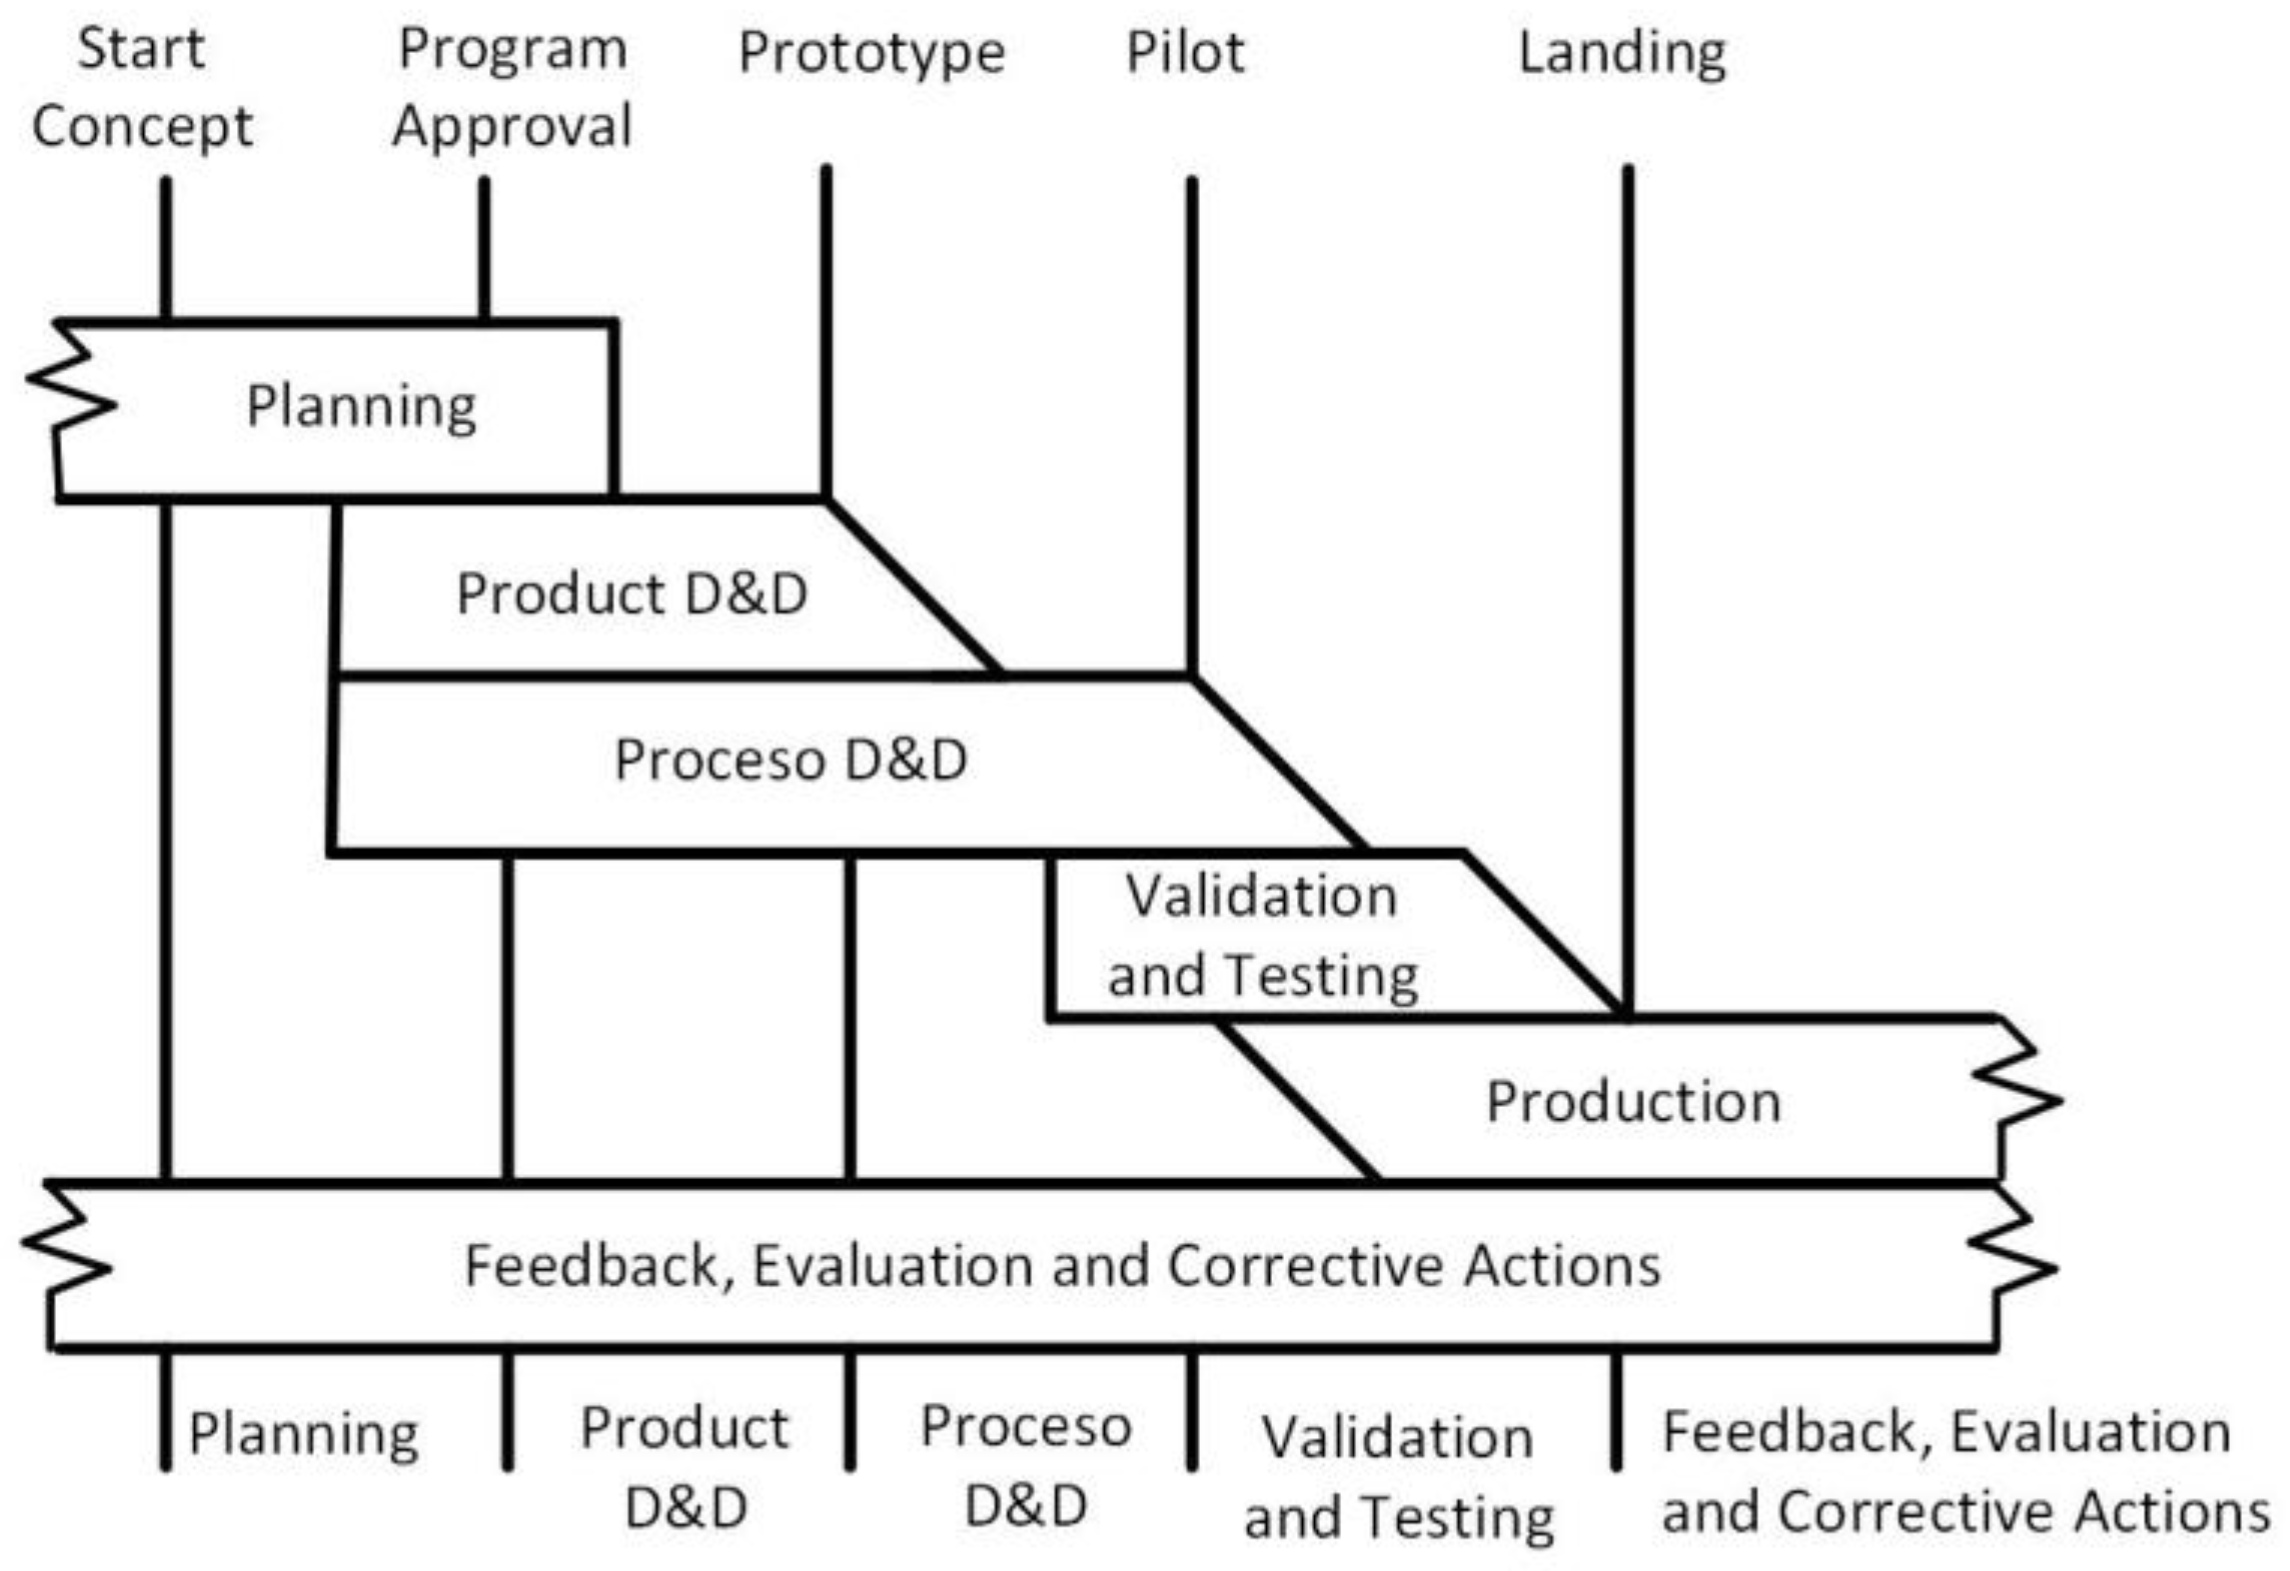
For the proposed solution, the Advanced Quality Planning (APQP) methodology used in the Automotive Industry was used, which considers four stages before mass production, namely: Conceptual Engineering, Product Engineering, Product, Process Engineering and Validation and Testing. It is based on advance planning of the Requirements, Needs and Expectations of clients, using specific analytical techniques according to the type of product. The methodology suggests working collaboratively and simultaneously through the different stages and achieving continuous improvement (
Figure 5). It is important to mention that this methodology coincides with several requirements and techniques used in Project Management established in the PMBOK of the Project Management Institute (PMI). The stages considered in the APQP that are used in the development of the project are described below [
17].
First stage. Conceptual Engineering
Design objectives were defined based on customer feedback, organizational strategy, benchmarking, product assumptions, and project management techniques such as the Business Case and the Project Charter. The defined objectives include quality and reliability targets, a preliminary list of materials, a preliminary process flow diagram, and a preliminary list of special product characteristics. Quality Function Deployment (QFD) is a widely used tool at this stage.
The Voice of the Client: To know the voice of the client, 3 techniques were used: Surveys, Interviews, and Review of cases in the literature. Each of these techniques is described below:
Surveys: A group of students from the Open Industrial Engineering program at the Instituto Tecnológico de San Juan del Río, who work in different companies, were surveyed to determine how many companies use Overall Equipment Effectiveness (OEE) as a measure of productivity. Initially, 30 students were sent the survey via Google Forms. Based on the responses, the probability of success (p) was determined to be 0.39, and the probability of failure (q) was 0.61. Formula 9 was then used to calculate the appropriate sample size, taking into account the number of manufacturing companies in the municipality of San Juan del Río (N = 157), an error margin of 0.1, and a confidence level of 90% (α = 0.1). The resulting sample size was 47 companies.
Supplementing the required surveys resulted in a new value for p, 43%, and q, 57%. This indicates that a higher percentage of companies still don’t use OEE as a productivity measure.
Interviews: A potential client was found from a medium-sized manufacturing company dedicated to die-cutting parts. A series of meetings were scheduled with the Engineering, Production, and Continuous Improvement departments to understand the company’s situation regarding measuring productivity. During these meetings, it was discovered that the calculation process is not standardized, there is no standardized classification of minor stoppages, records are not filled in real-time, results are delayed, and decisions are not made based on the indicators. It was recommended that the process be automated to ensure better efficiency.
Review of cases in the literature: Reports from professional residencies, theses, research articles, and data provided by companies in the region were considered to determine the level of OEE at which companies in the region operate. The aim of this review was to assess the OEE level of companies in the region. The results of this review are in
Table 1.
Table 1 shows different OEE values that vary depending on the operating conditions of each plant. In some cases, outdated technology requires more maintenance, while in others, there may be different ways of measuring that are not standardized. Calculation errors are also common due to a lack of knowledge of the methodology.
Organizational strategy: The proposed strategy is a collaborative effort between the ITSJR working group and the sponsoring company. Their shared interest is in digitalizing information and automating processes, creating a joint strategy called "Innovation Applied to Industry 4.0".
Benchmarking: There are various platforms available for developing OEE calculation applications. These platforms enable the collection, storage, analysis, visualization, and delivery of data in the form of Performance Indicators (KPIs) in real-time. For instance, PI System is a software from OSISoft that offers such capabilities [
8]. Other platforms include the Smart OEE System from ZEO, a Spanish company, PRODASIS SPC Consulting Group, and VersaCall System. These platforms collect data from different sources in the industrial plant and process it to present it to the final user [
21].
One major challenge small and medium-sized businesses face is the high cost of implementing such solutions.
Table 2 outlines the key features of the aforementioned solutions.
Table 3 presents a list of technologies commonly used in process automation as part of supply chain management. The table includes details about the application areas, types of technologies used, sensors, and devices. This information serves as a representative sample of the various technologies used [
22].
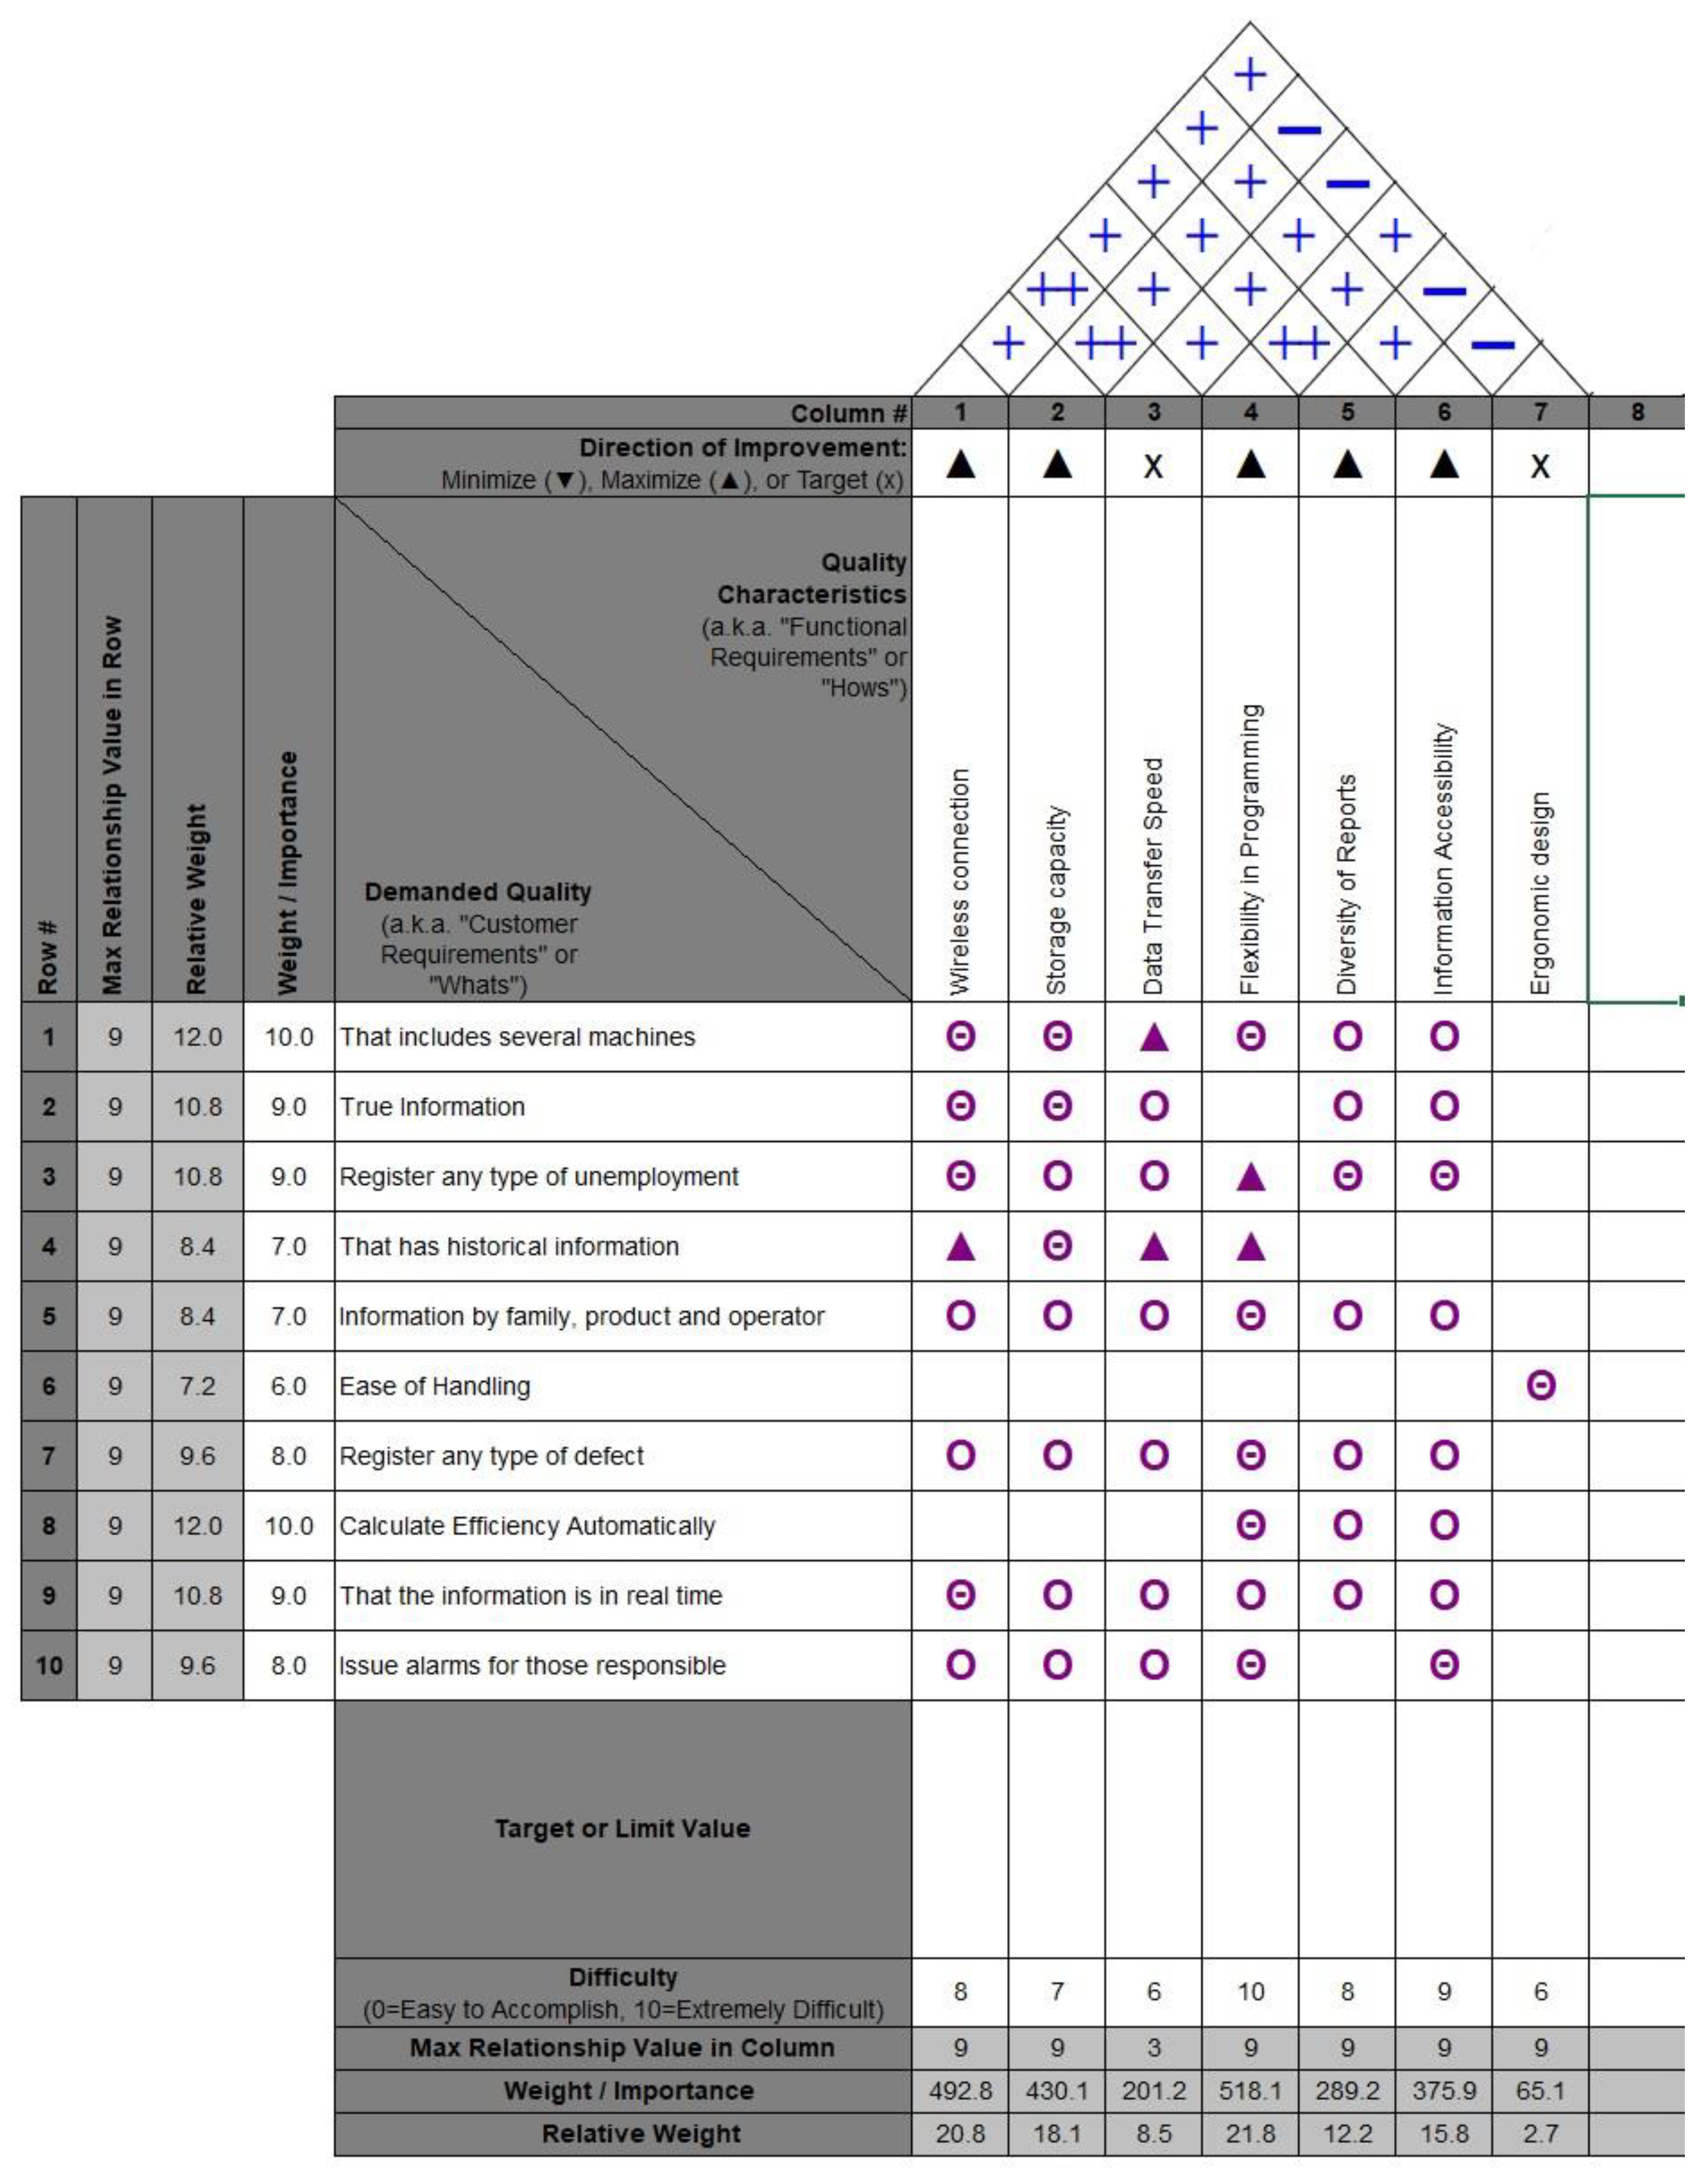
Quality Function Deployment (QFD):Figure 6 shows a matrix that relates the customer’s demands to the quality characteristics of a product. The matrix assigns a relative importance score between 0 to 10 to each of the client’s requirements. For example, if the requirement includes several machines, it is given the highest weightage. Additionally, the matrix assigns a score of 9 for a strong relationship between a customer requirement and a quality characteristic, 3 for a moderate relationship, and 1 for a weak relationship.
When evaluating the matrix, consider the degree of difficulty, where zero corresponds to easy and ten to extremely difficult. This method assigns weight to the product’s different quality characteristics.
The result of the quality Deployment Function is a list of the product’s special characteristics that appear in
Table 4.
Furthermore, information security and user administration were regarded as significant features.
Product assumptions: Free software that allows for an affordable cost will be used.
Design objectives: Design the data Sender and Reception cards and the database and control panels with free software to reduce product costs.
Quality and reliability objectives: The system must work continuously and without errors with at least 99% reliability.
A preliminary list of materials and a process flow diagram are prepared at this stage. However, due to space constraints, they are not included in this section. These tools are presented in greater detail in the following sections. This stage’s outcome is the product’s conceptual design, consisting of four components (
Figure 7).
1. Sender
2. Receiver
3. Local server
4. Query terminals
Hardware Selection: The OEE (Overall Equipment Effectiveness) indicator must be measured in real-time by continuously capturing availability, performance, and quality information. To achieve this, a micro processing unit (microcontroller) must interact with physical ports and manipulate census variables at the software level. This component will execute the main algorithm for calculating the indicator and managing the environmental variables.
The microcontroller is the calculation unit but cannot interact directly with the environment. To facilitate this interaction, peripherals that act as information translators, both for output and input, are implemented. When measuring the OEE, the microcontroller must interact directly with both the operator and the machine to capture each indicator. Therefore, the following aspects have been defined:
Determination of the state of the machine using push buttons and typing of codes that define a particular state of loss, which will be considered for the calculation of Availability.
An electrical signal is acquired from the machine to represent the production of a piece. The source can be an electronic or mechanical sensor or an AC/DC signal. This signal is used to accurately count the number of cycles completed and accumulated operating time, to obtain the Performance parameter.
A mechanical button with two possible states- On and Off- determines product quality. If the pieces produced meet quality standards, the button is on; otherwise, It Is off.
The real-time measurement section was reviewed, and the communication section was examined for the various frequencies available, such as 433 MHz, 720 MHz, 2.4 GHz, and 5 GHz. The appropriate communication protocol, speed, bandwidth, technology, and infrastructure to establish a suitable network were considered before choosing 2.4 GHz, which is standardized by the Institute of Electrical and Electronics Engineers (IEEE). There are chips available that have both a microcontroller and a wireless communication module, such as the Expressiff family with the ESP32 and ESP8266 and Raspberry Pi which comes with a module that can connect to 802.11 networks, opting for the ESP32 due to its processing features, memory, and libraries developed for a greater number of applications.
This system is designed to be used in an industrial environment that follows safety standards and has nominal working voltages. The devices mounted in control cabinets require protection and a proper architecture. To meet these requirements, the circuit must have the capacity to be powered with voltages between 24 VDC and 120 to 240 VAC. The signal input should also be isolated from the complete system to protect it against faults and discharges. To safeguard against electrical failures, the system is based on the architecture of a UPS device. A UPS provides backup electrical energy to connected devices in case of power outages.
Our system will use a fan to regulate the voltage to the required level for each component using DC-DC voltage converters. These converters generate heat, so it is essential to confine them in a cabinet and extract the heat using a simple fan.
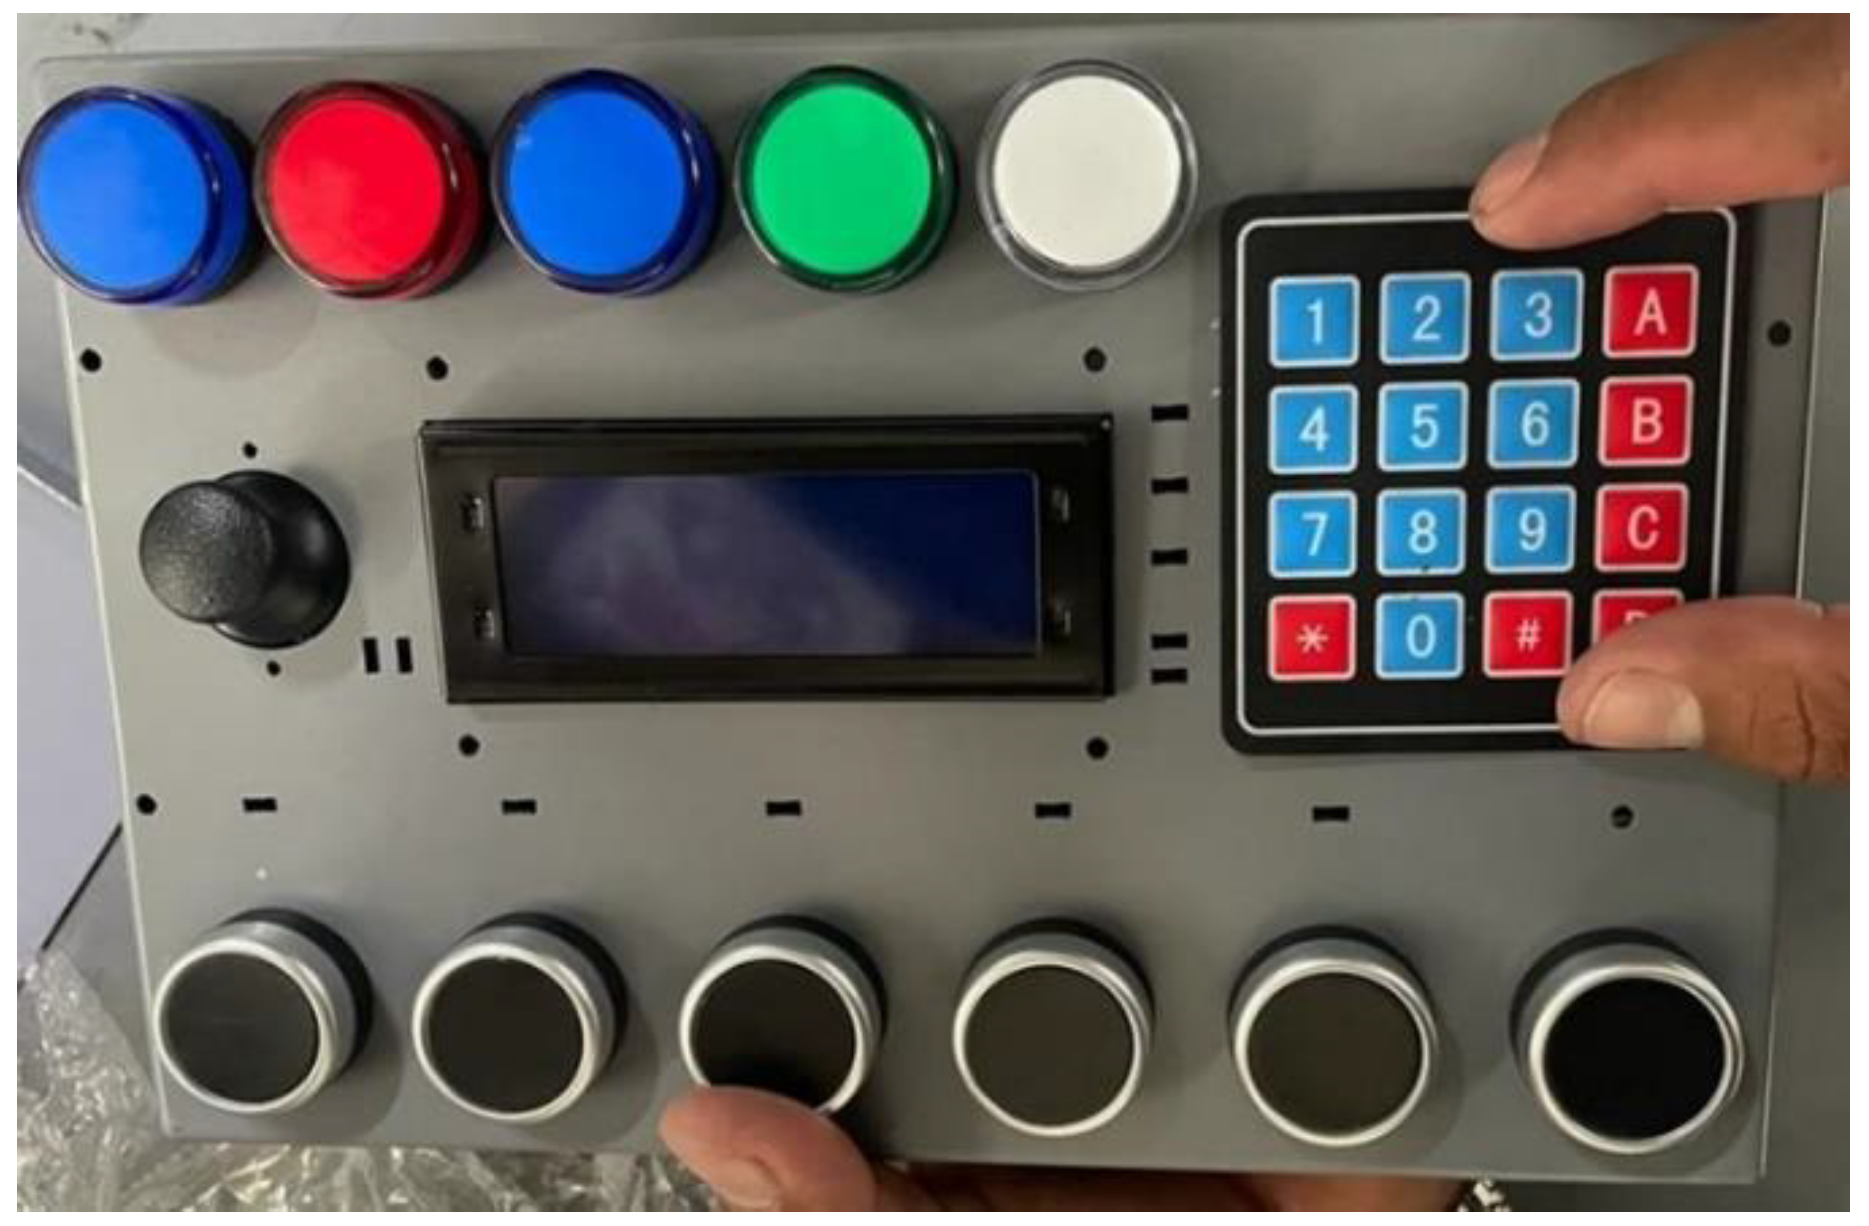
A set of sturdy 22 mm buttons are designed to swiftly capture information and an alphanumeric keyboard is provided to input pre-established codes, both of which are placed on the exterior. To display detailed information about digitization, there are 22mm LED light indicators and a screen that can be an LCD, OLED, TOUCHSCREEN, or any other type. In order to navigate through different information screens, the concept of using a pointer is introduced, which can be a rotary encoder, button crosshead or a joystick. A buzzer is also included as an audio component that emits a 2 kHz sound when activated and is easy to use.
The data will be stored on a server that has access to a database. Information will be downloaded from each machine wirelessly using WiFi. To facilitate communication, we will use protocols such as HTTP, ModBus, MySQL, TCP-IP, etc. In our case, we have chosen to use the HTTP protocol for GET requests.
The protocol in place will ensure the security of the information. Additionally, a local VPN will isolate the network infrastructure, creating a local area that does not require internet access. This will keep the data traffic completely private. To access the internet while maintaining data security between systems, a device named a receiver has been incorporated into the design. The receiver acts as a bridge between the storage server and the network with all the systems that monitor the indicators, making them emitters. All these systems are connected to a wireless network, and the receiver is connected to the server using a USB 2.0 cable. It manages the information flow for security reasons.
It is important to note that the electronic system has a multitude of components that it must control, which will be embedded in an electronic board. To manage peripherals such as buttons, keyboard, JoyStick pointer, fan, sound device, etc., a lower-power microcontroller will be used as a slave. This will free up processing power, allowing better management of tasks carried out by the ESP32. The ESP32 will perform the OEE calculation and transmit all the information about this indicator in real-time. The communication between these two microcontrollers will be through their UART (Universal Asynchronous Receiver-Transmitter) ports, which are serial ports used to send and receive information of any type, with the only characteristic being the transmission speed given in bauds per second.
Software Development: Open-source platforms like Visual Studio Code version 1.84.2 and Arduino IDE version 2.2.1 were utilized to develop the software. Both are development environments that enable editing, compiling, and debugging code. These platforms allow the implementation of algorithms on the ESP32 and ATMega 328 microcontrollers responsible for information management and the interface program between the receiver and storage server. Programming languages such as C++, Python, and JavaScript were employed for web development, and the SQL database manager was used to manage the database.
Second stage. Product Engineering
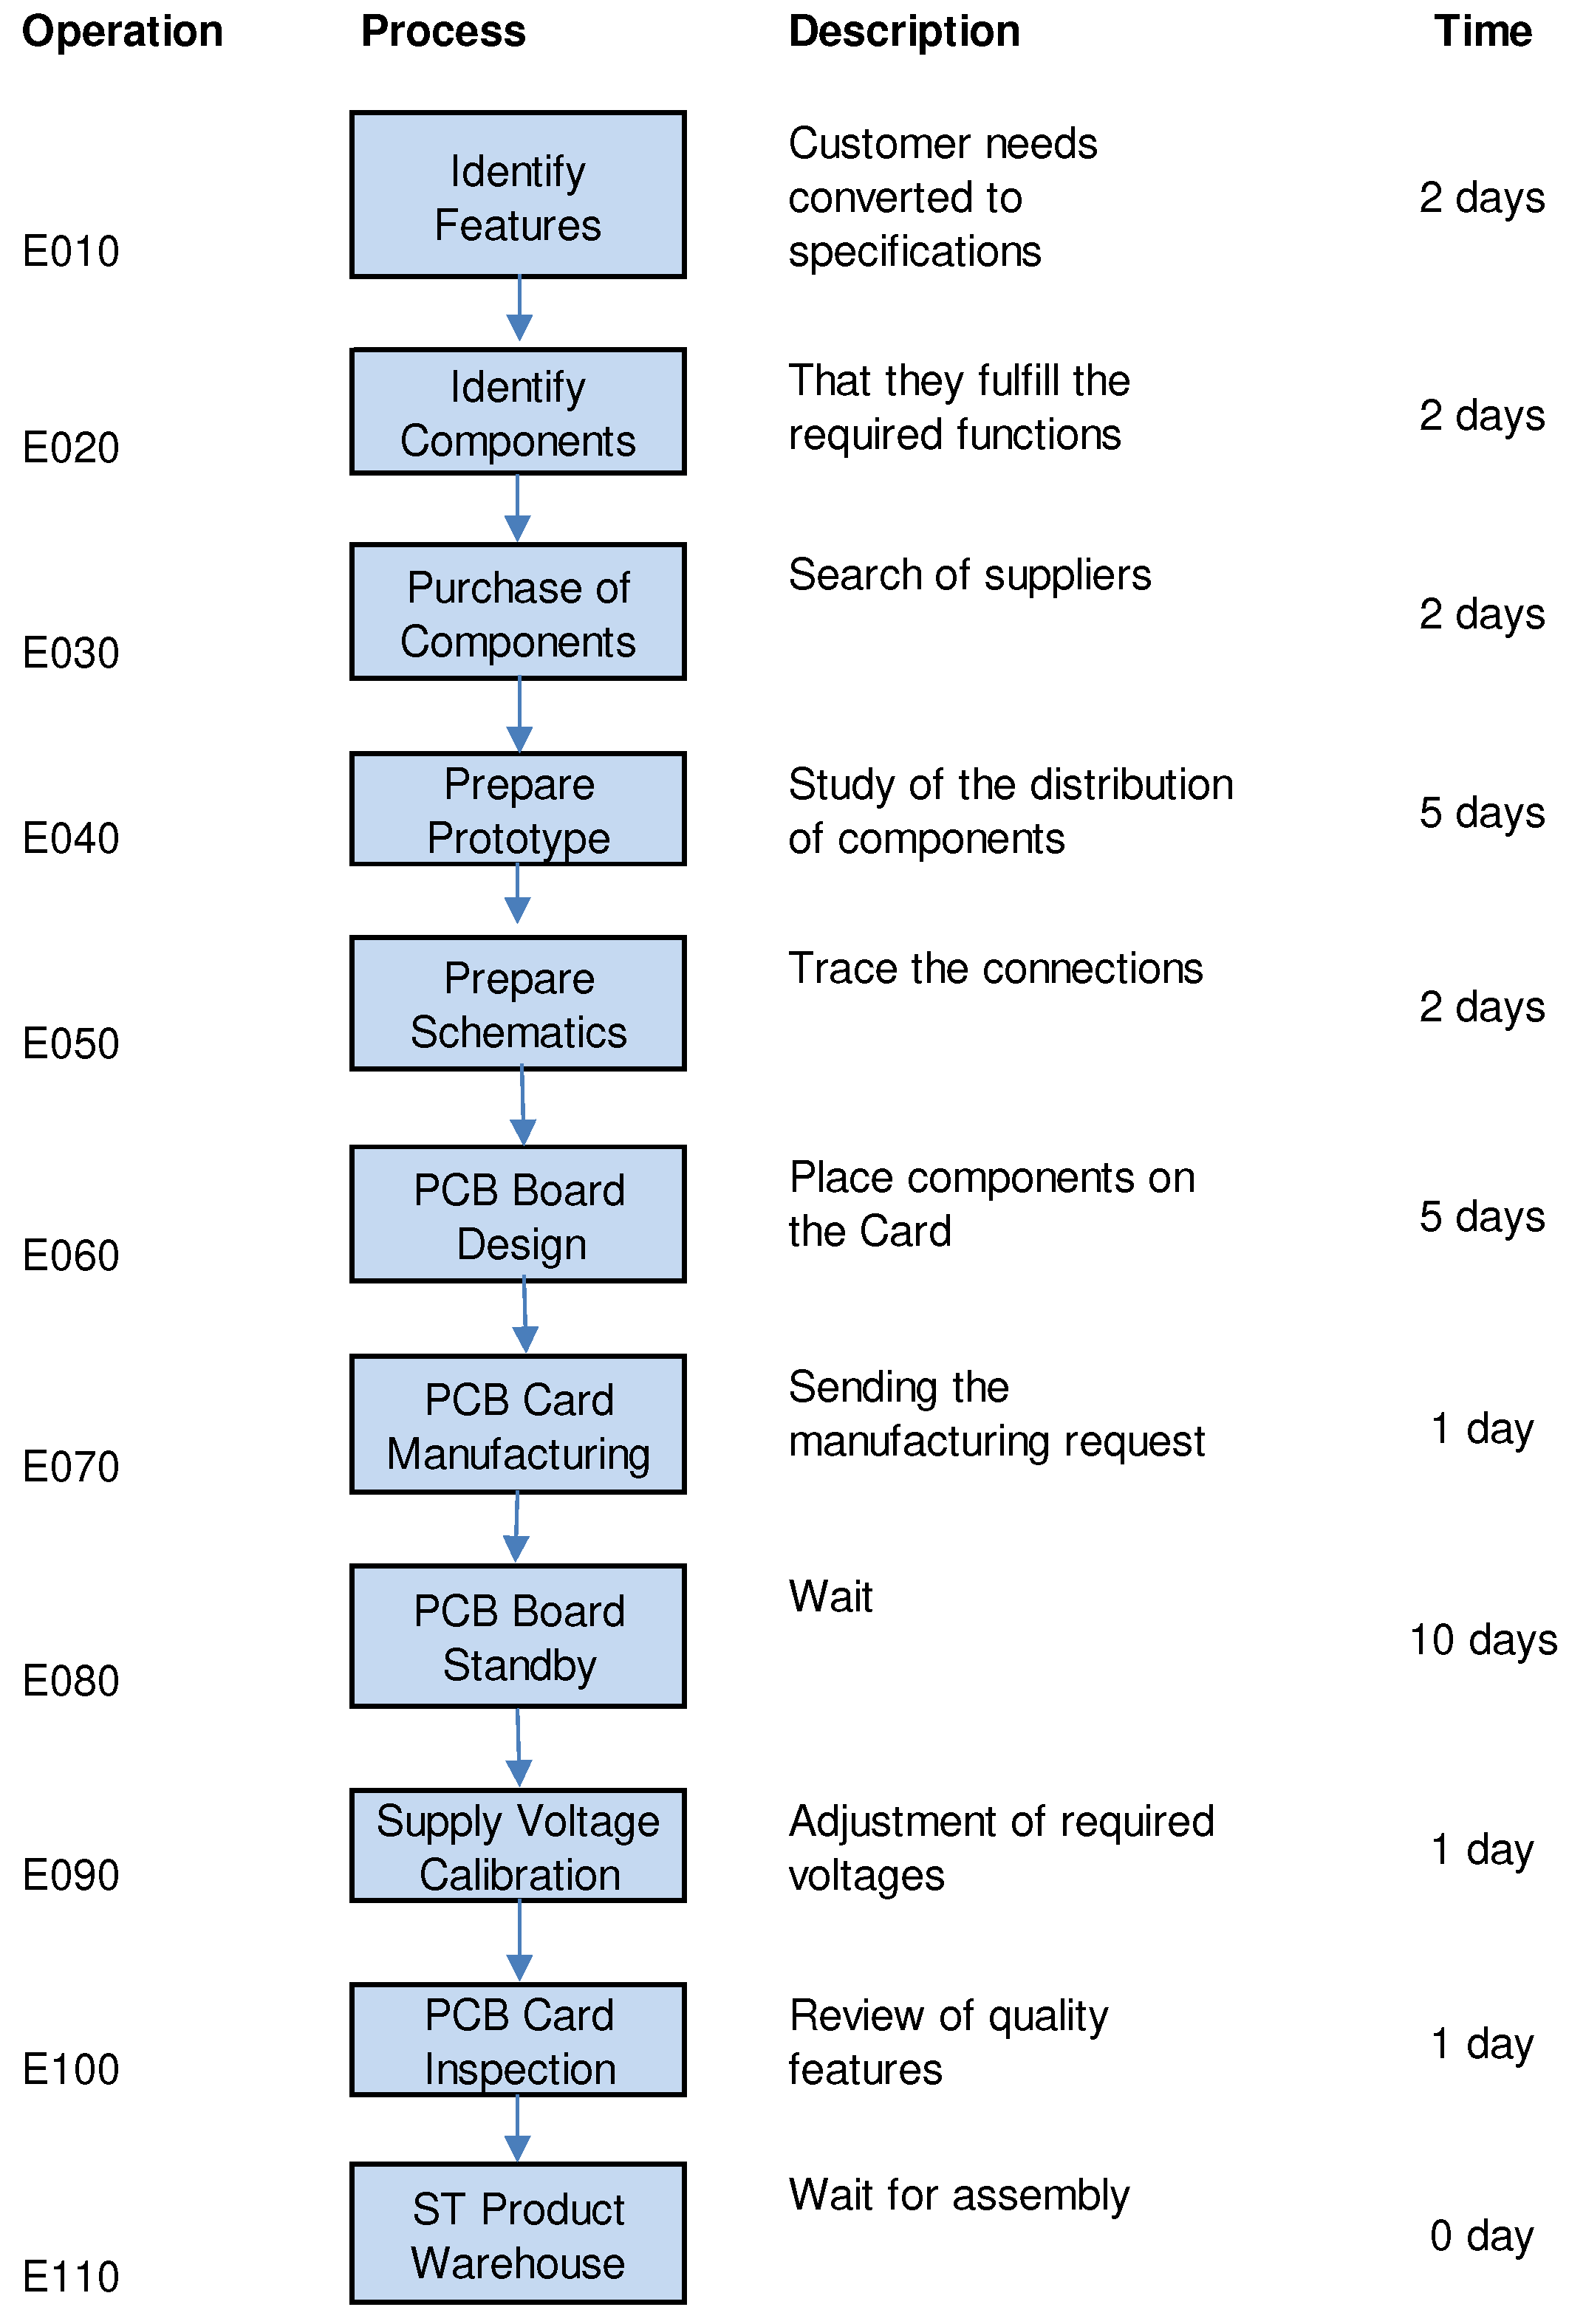
This stage involves several preparatory steps to build a prototype. It starts with creating a Process Flow Diagram (
Figure 7) and designing Programming Algorithms (
Figure 8 and
Figure 9). The Selection of Components (
Table 5) is done based on Conceptual Engineering. The prototype (
Figure 10) is built to understand the design’s nature. Techniques such as Analysis of Design Failure Modes and Effects (AMEFDs) and Design for Ease of Manufacturing and Assembly are used. Throughout this stage, the Drawings must contain Engineering specifications and materials. Finally, a Control Plan is concluded. To ensure the quality of the design, Design Reviews and Verifications must be carried out with the departments involved at every step of the process.
Diagrama de Flujo del Proceso: The process for designing and manufacturing the Emitter card is depicted in
Figure 7. After manufacturing the prototypes and testing their functions, the card is sent to an external supplier who integrates all the components into a system.
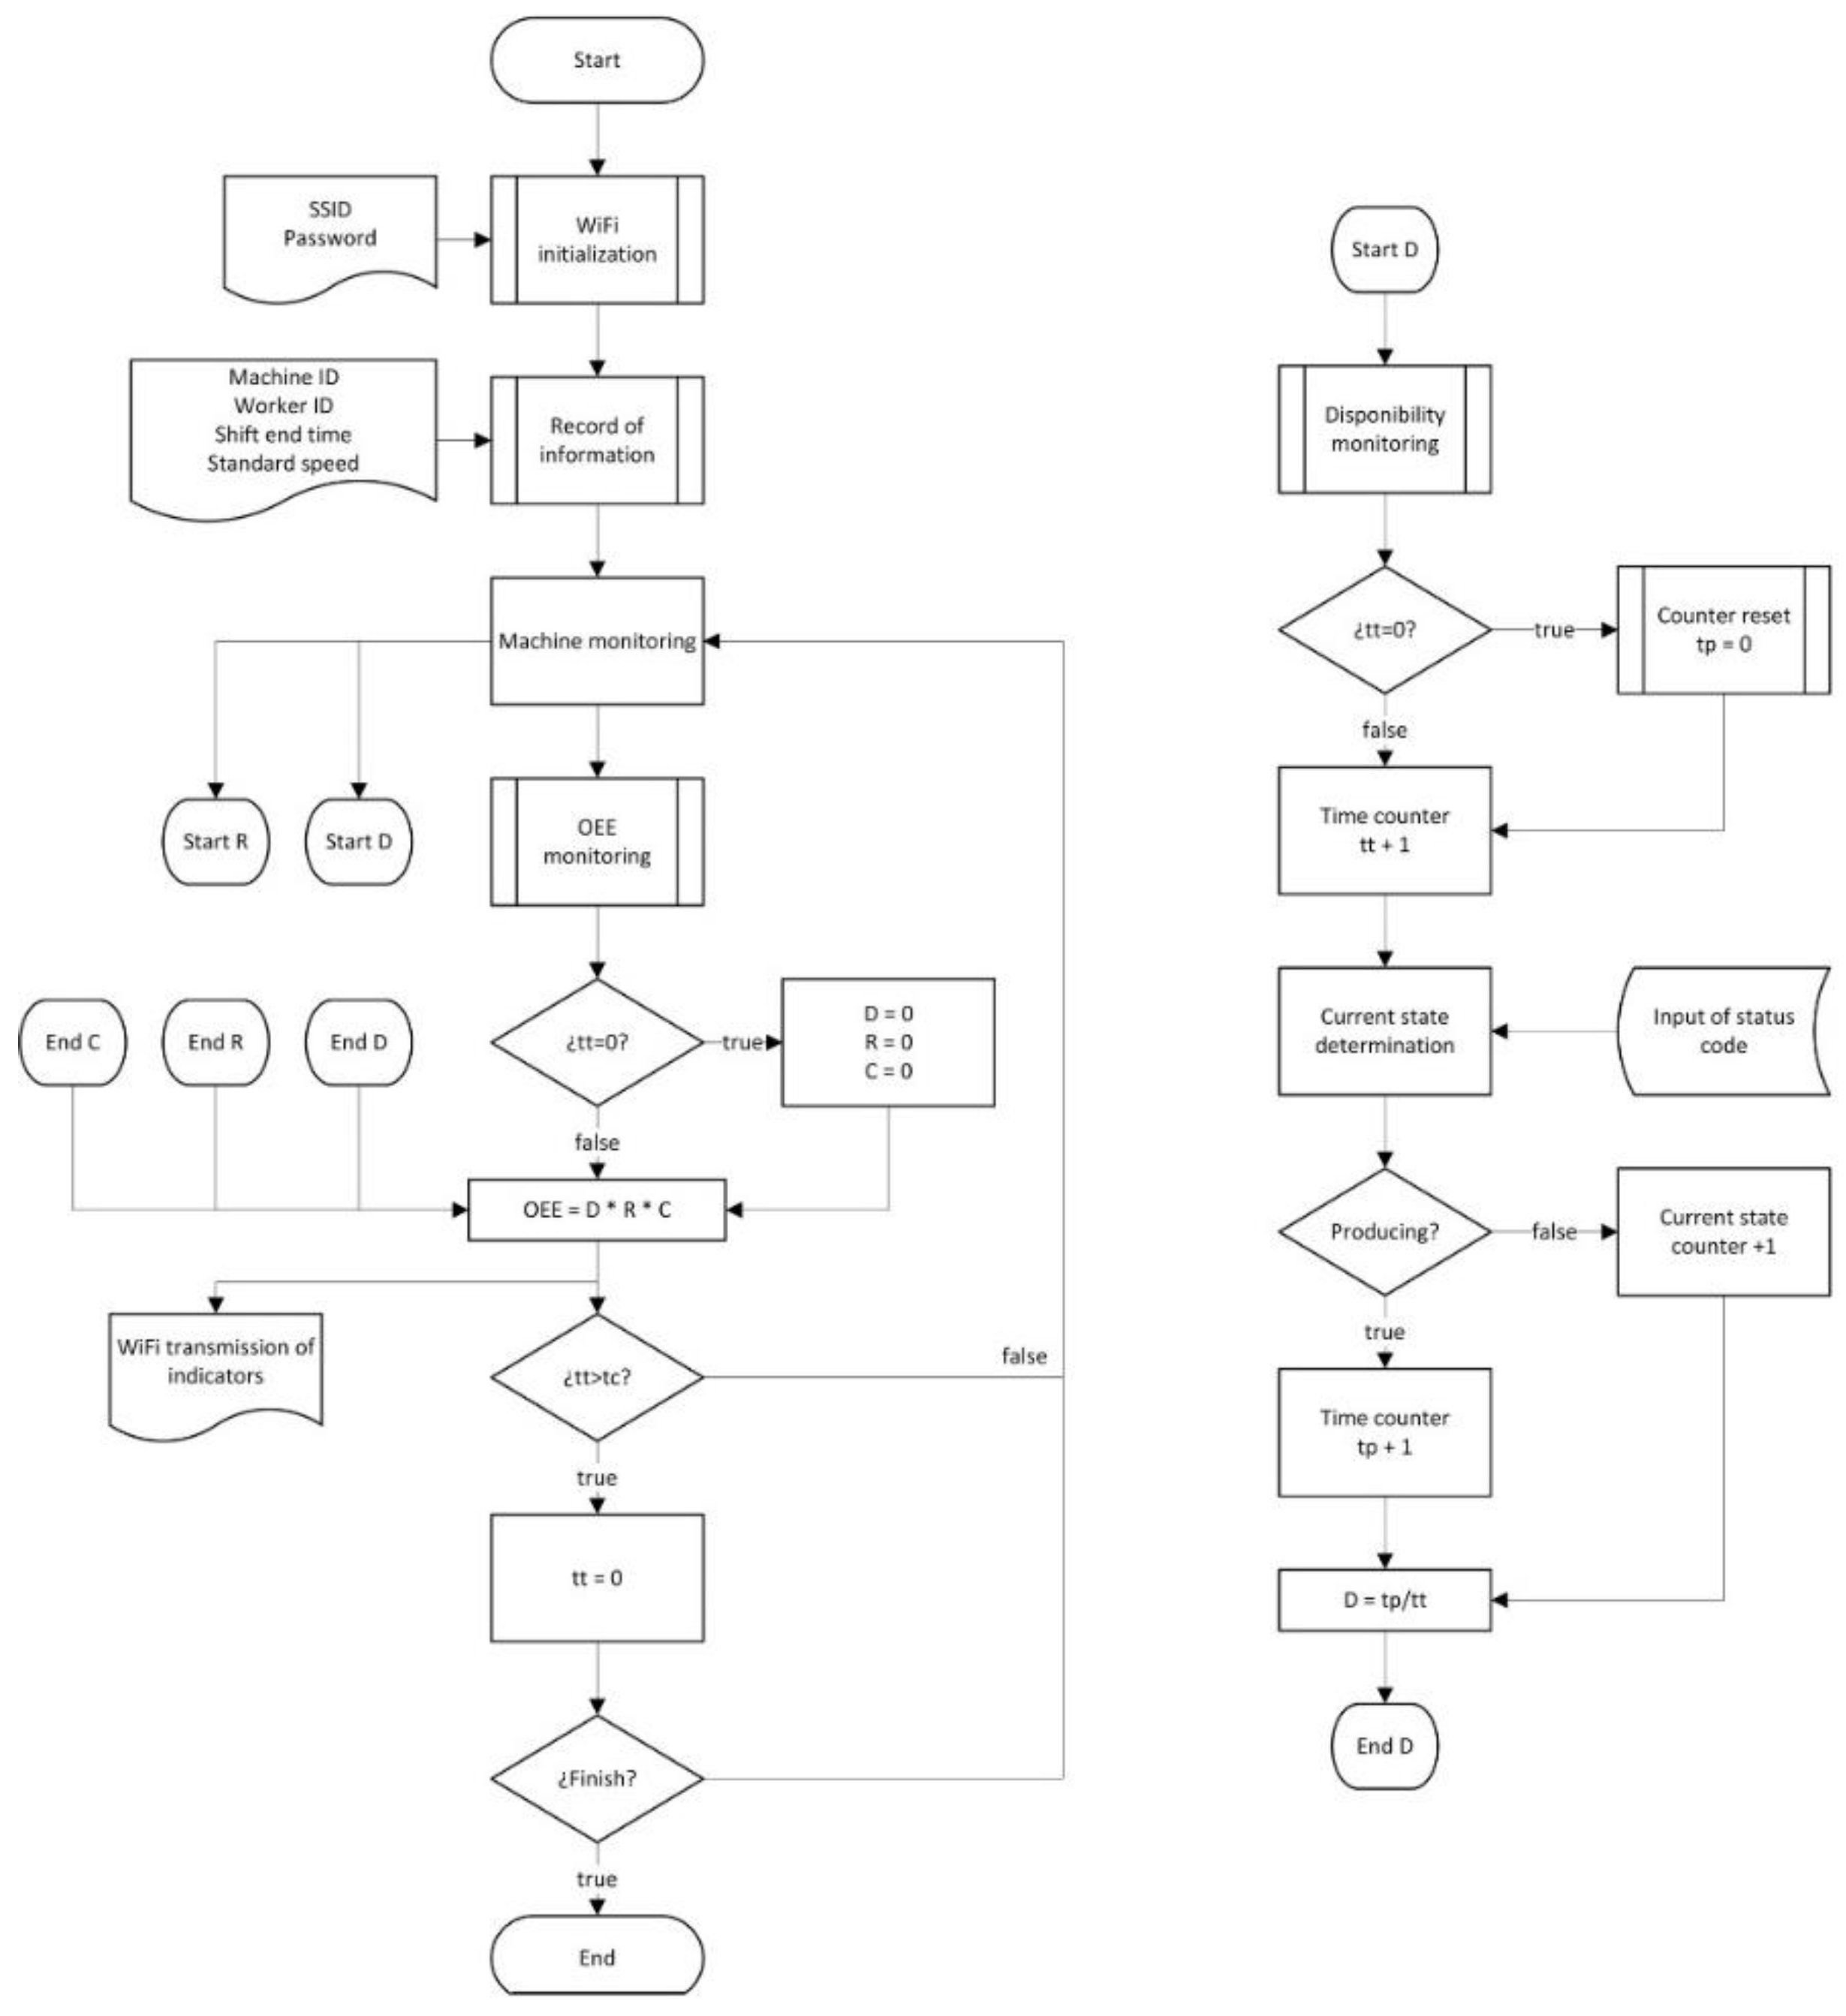
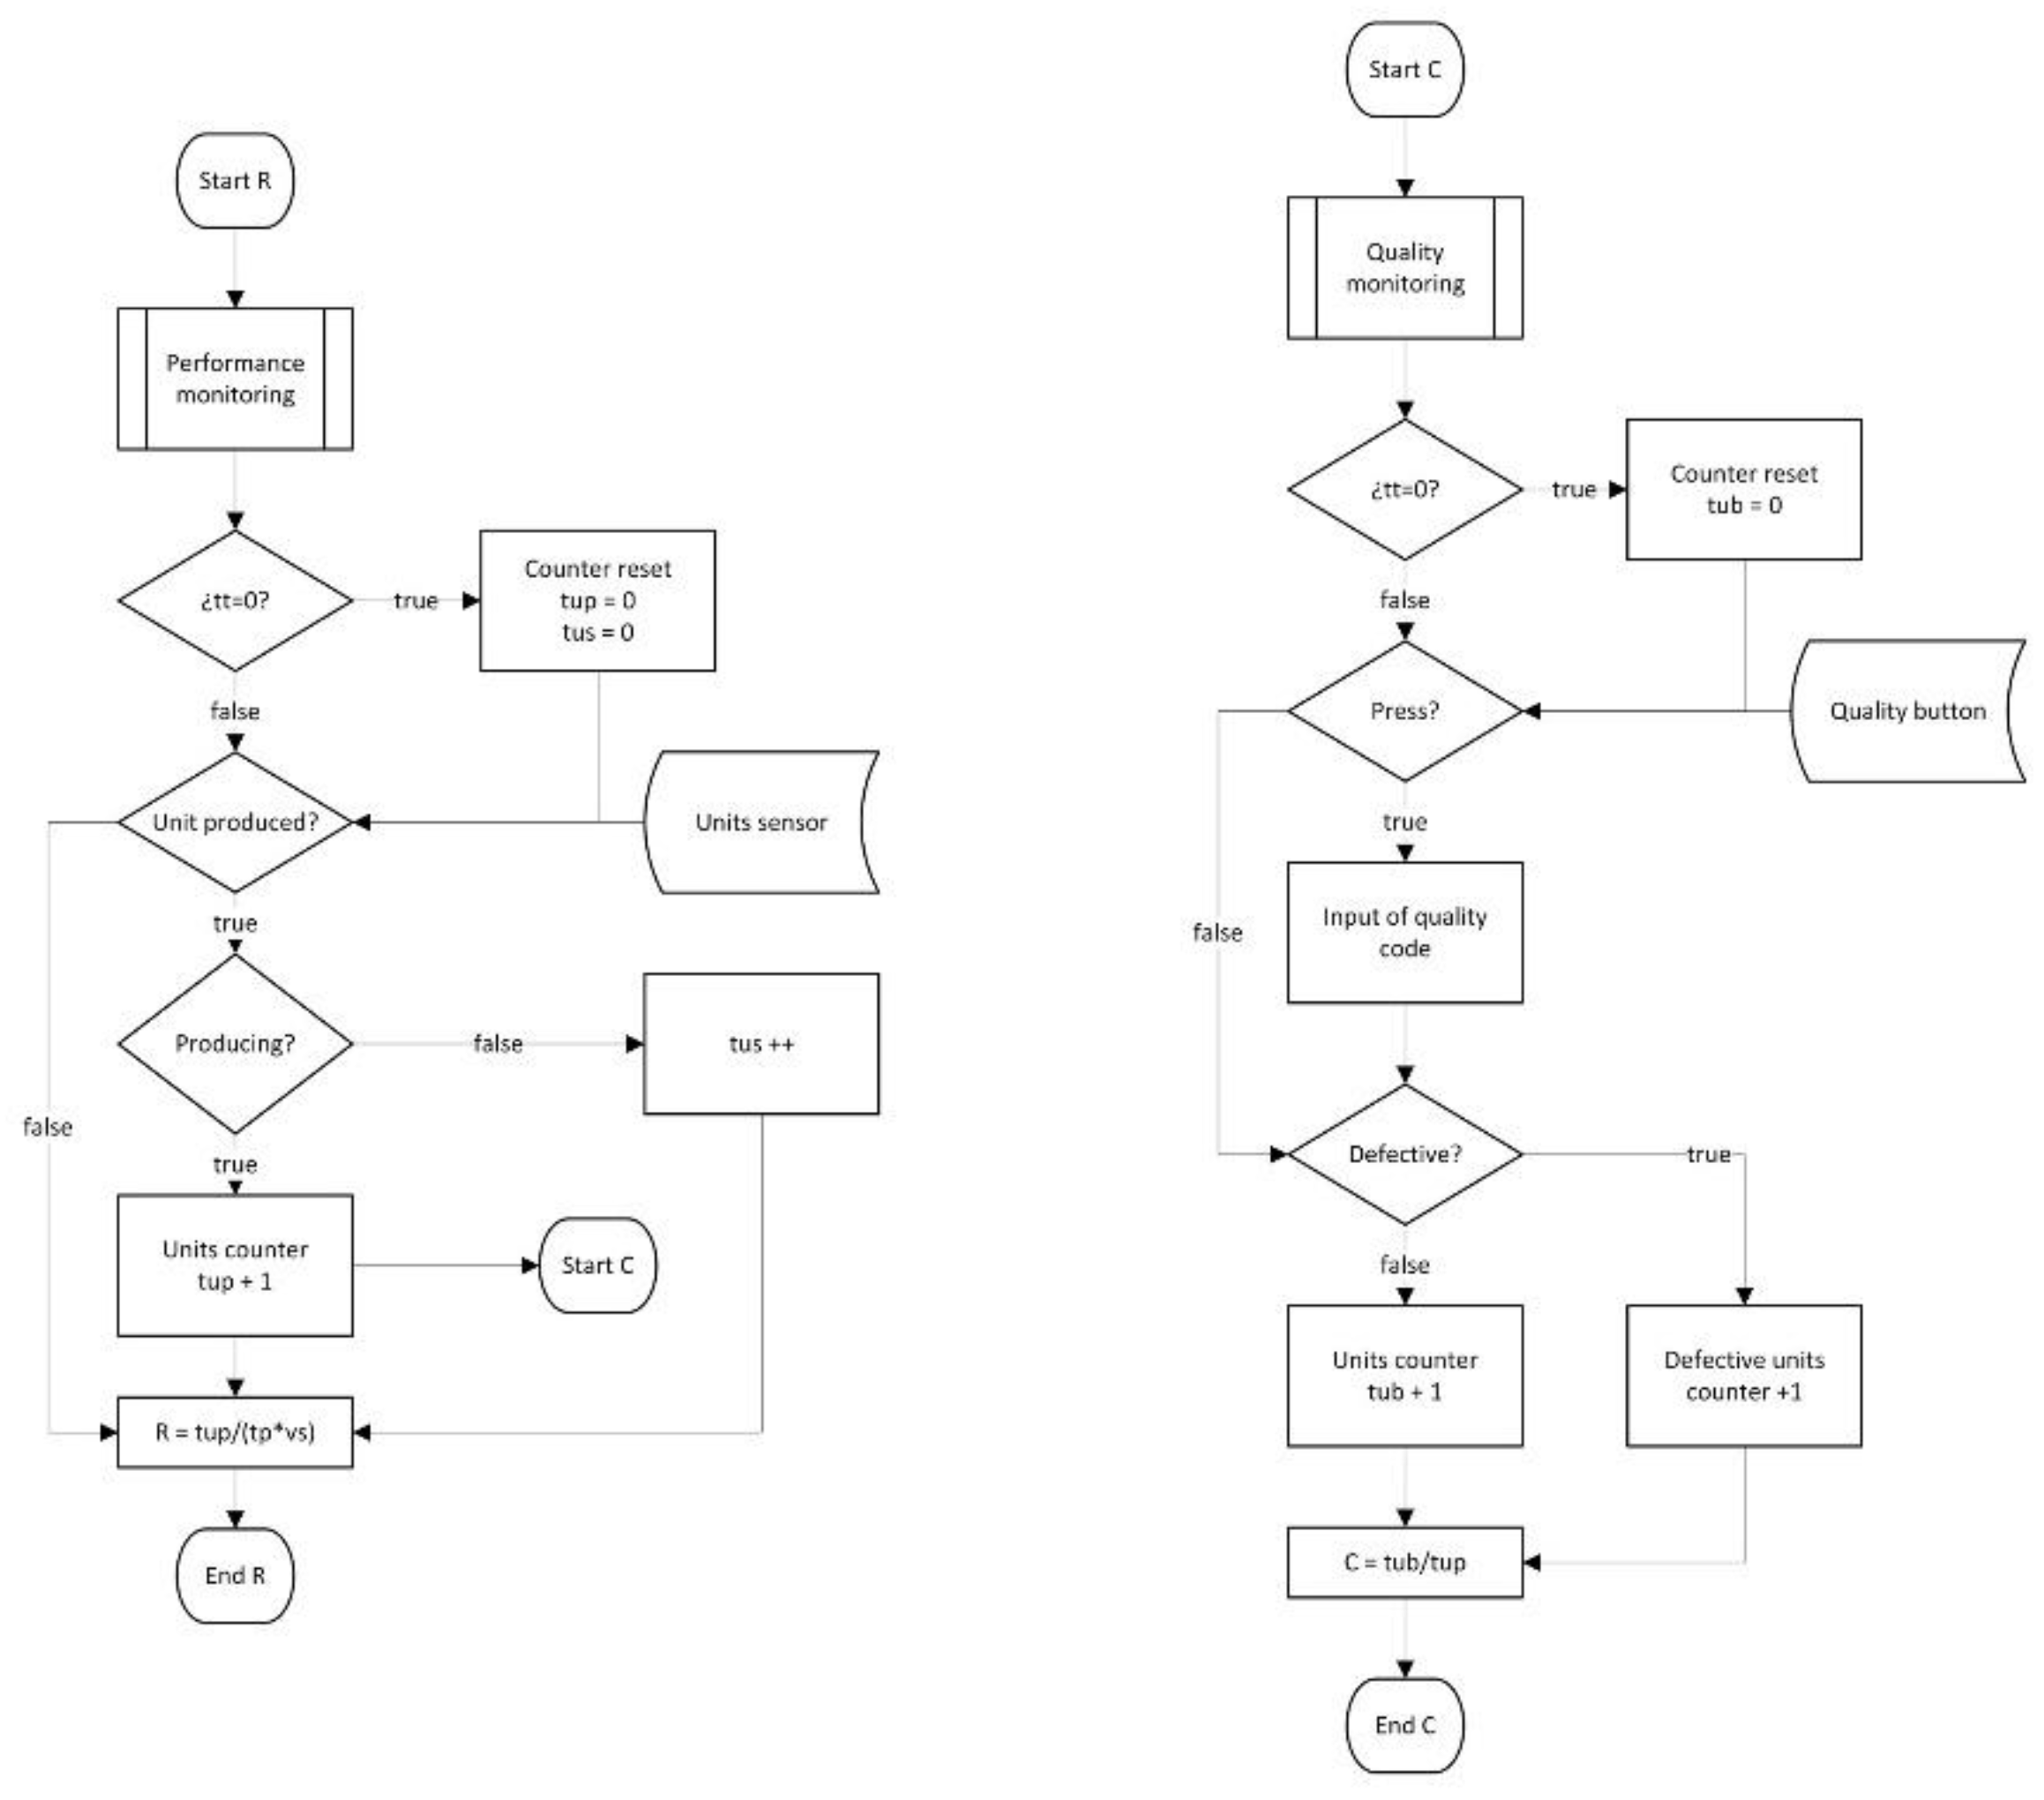
Algorithm Design: The algorithms used to calculate the Overall Equipment Effectiveness (OEE) are divided into different stages such as initialization, calculation of Availability, Performance, and Quality. There is also an algorithm for monitoring power supply and wireless connection.
Figure 8 shows the OEE initiation, monitoring diagram, and Availability calculation. On the other hand,
Figure 9 contains the diagrams for calculating Performance and Quality.
Component Selection: To comply with the specifications of the Conceptual Engineering, the different components were selected among the alternatives existing on the market.
Table 5 shows the selected key elements and the function they fulfill.
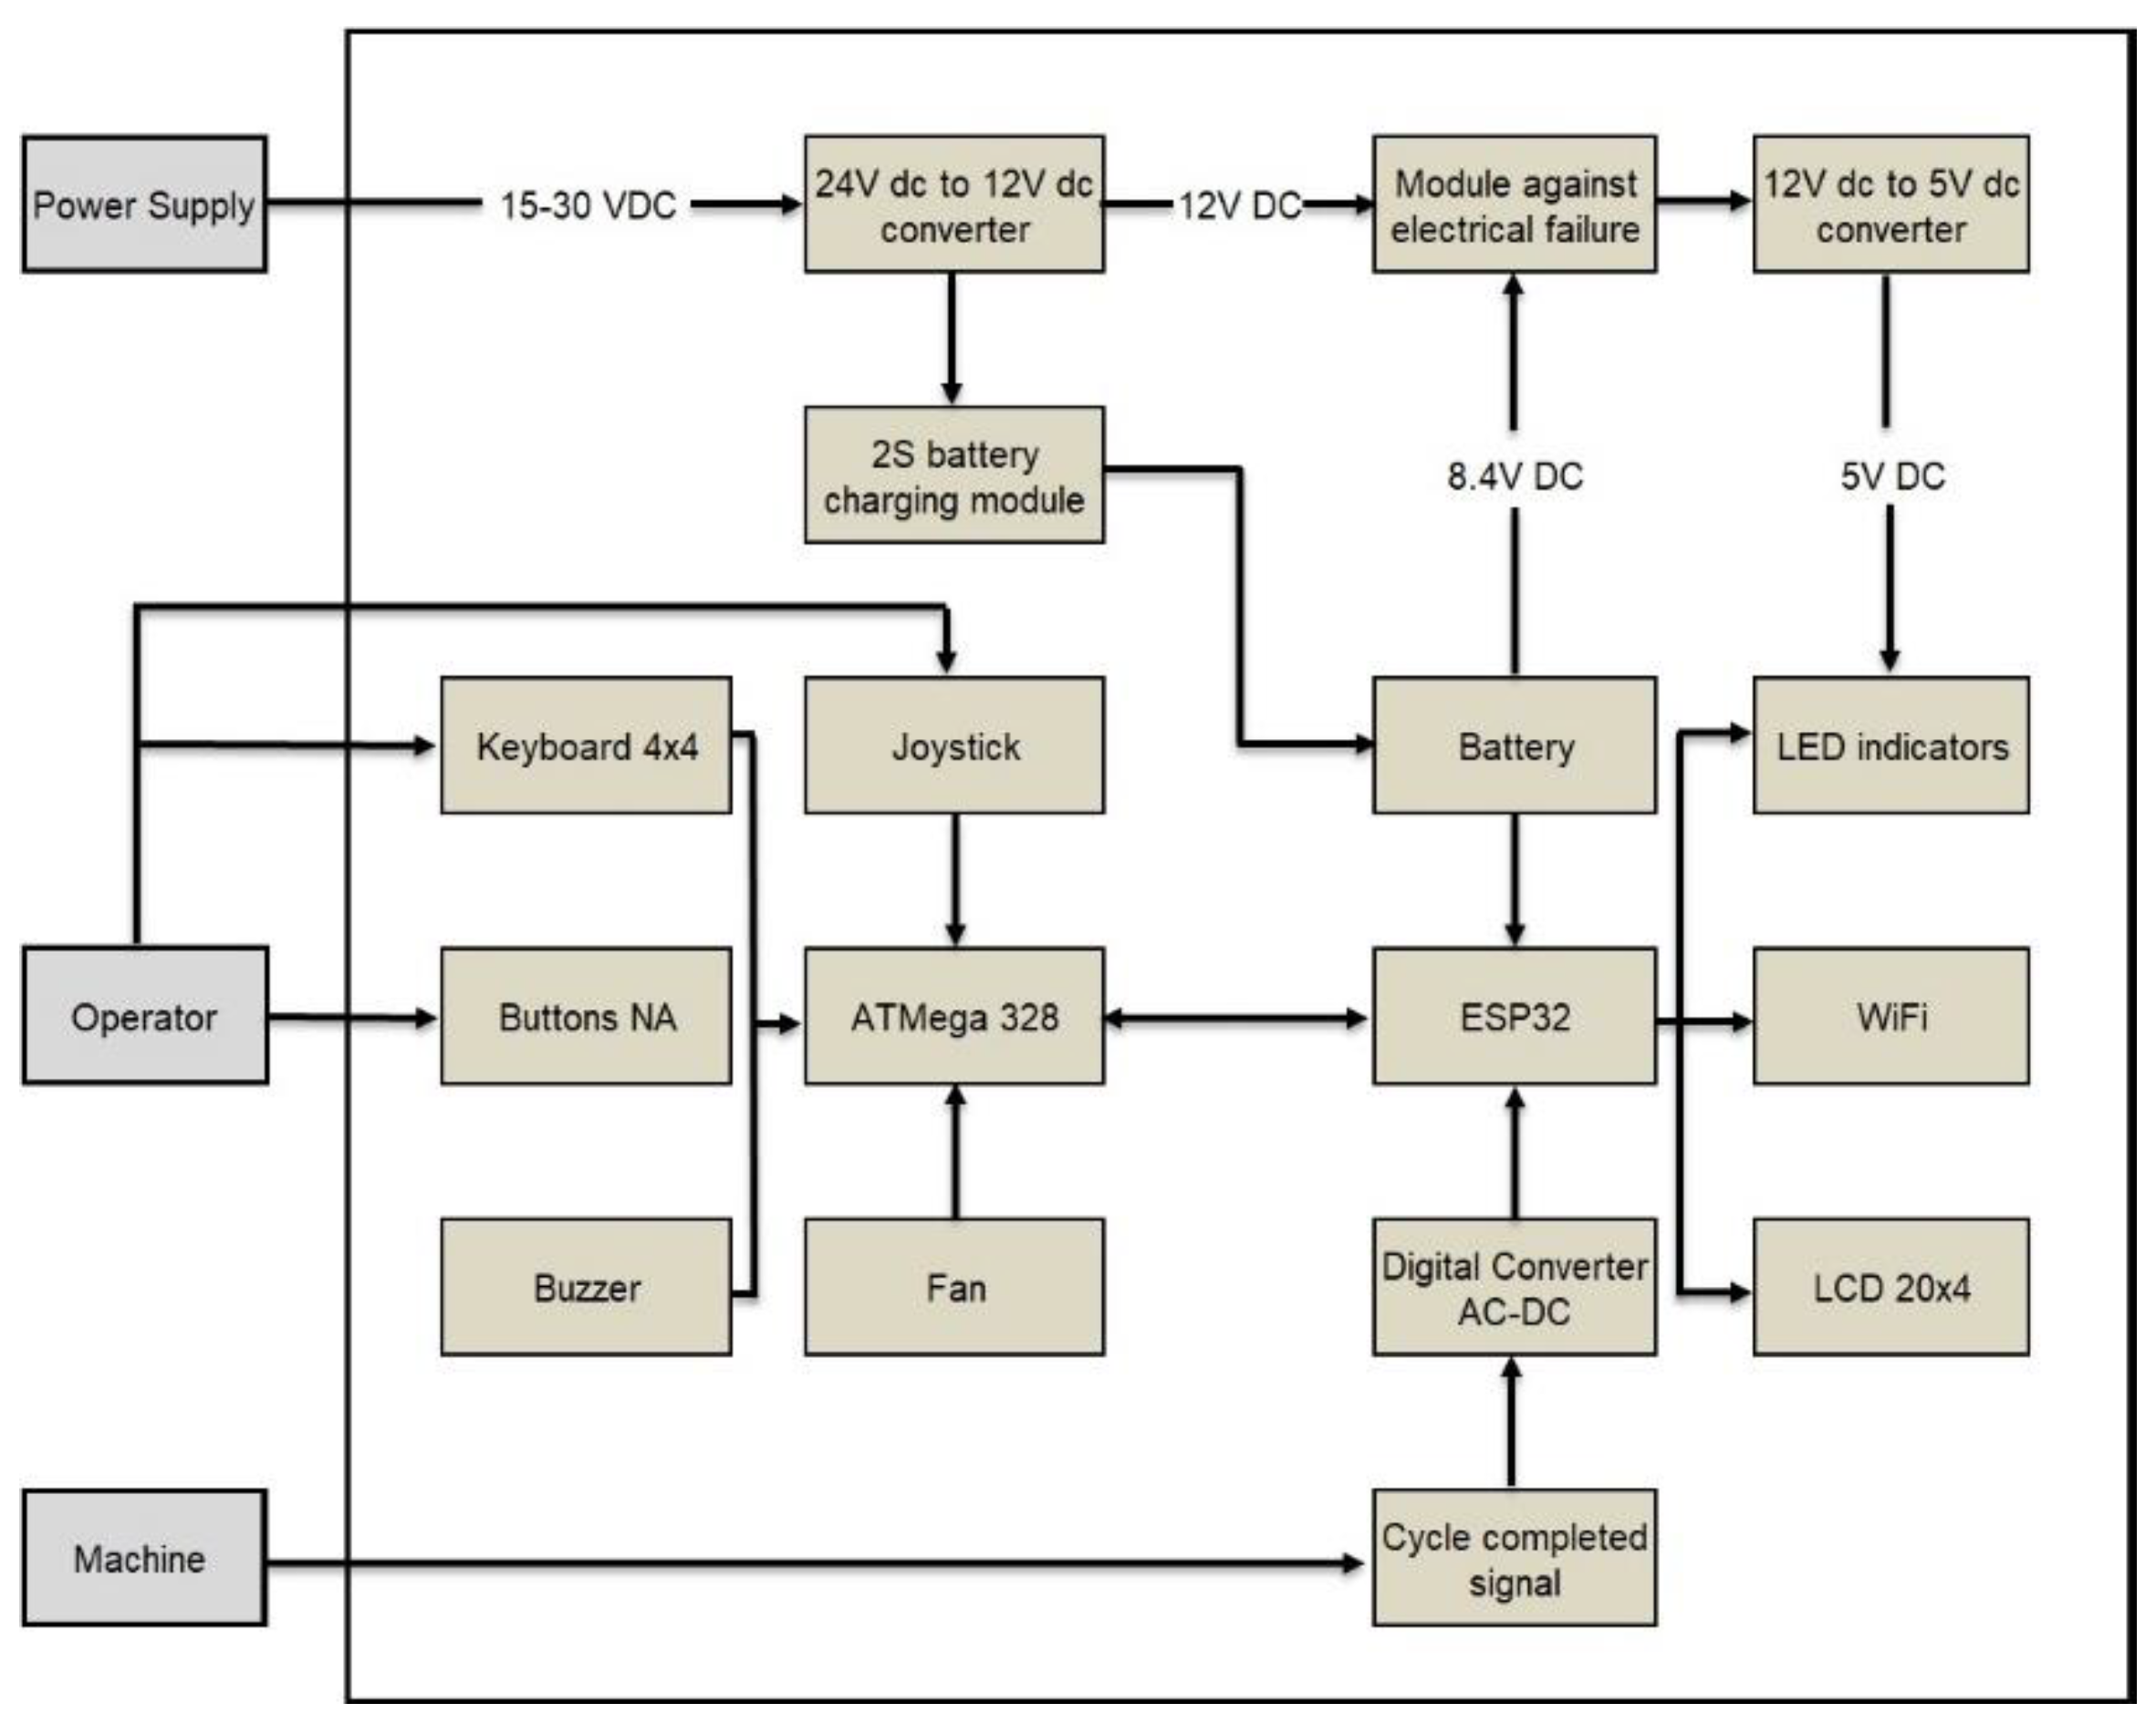
Block Diagram of the Electrical System: Once each component for a particular task was identified, a block diagram was created to correlate the functions of each component, as shown in the figure below:
Initial Prototype: Once the relationship between each component was established, the prototype was assembled using test boards (Protoboards). This was done to identify any design errors or necessary adaptations and to obtain electrical diagrams based on connectivity tests.
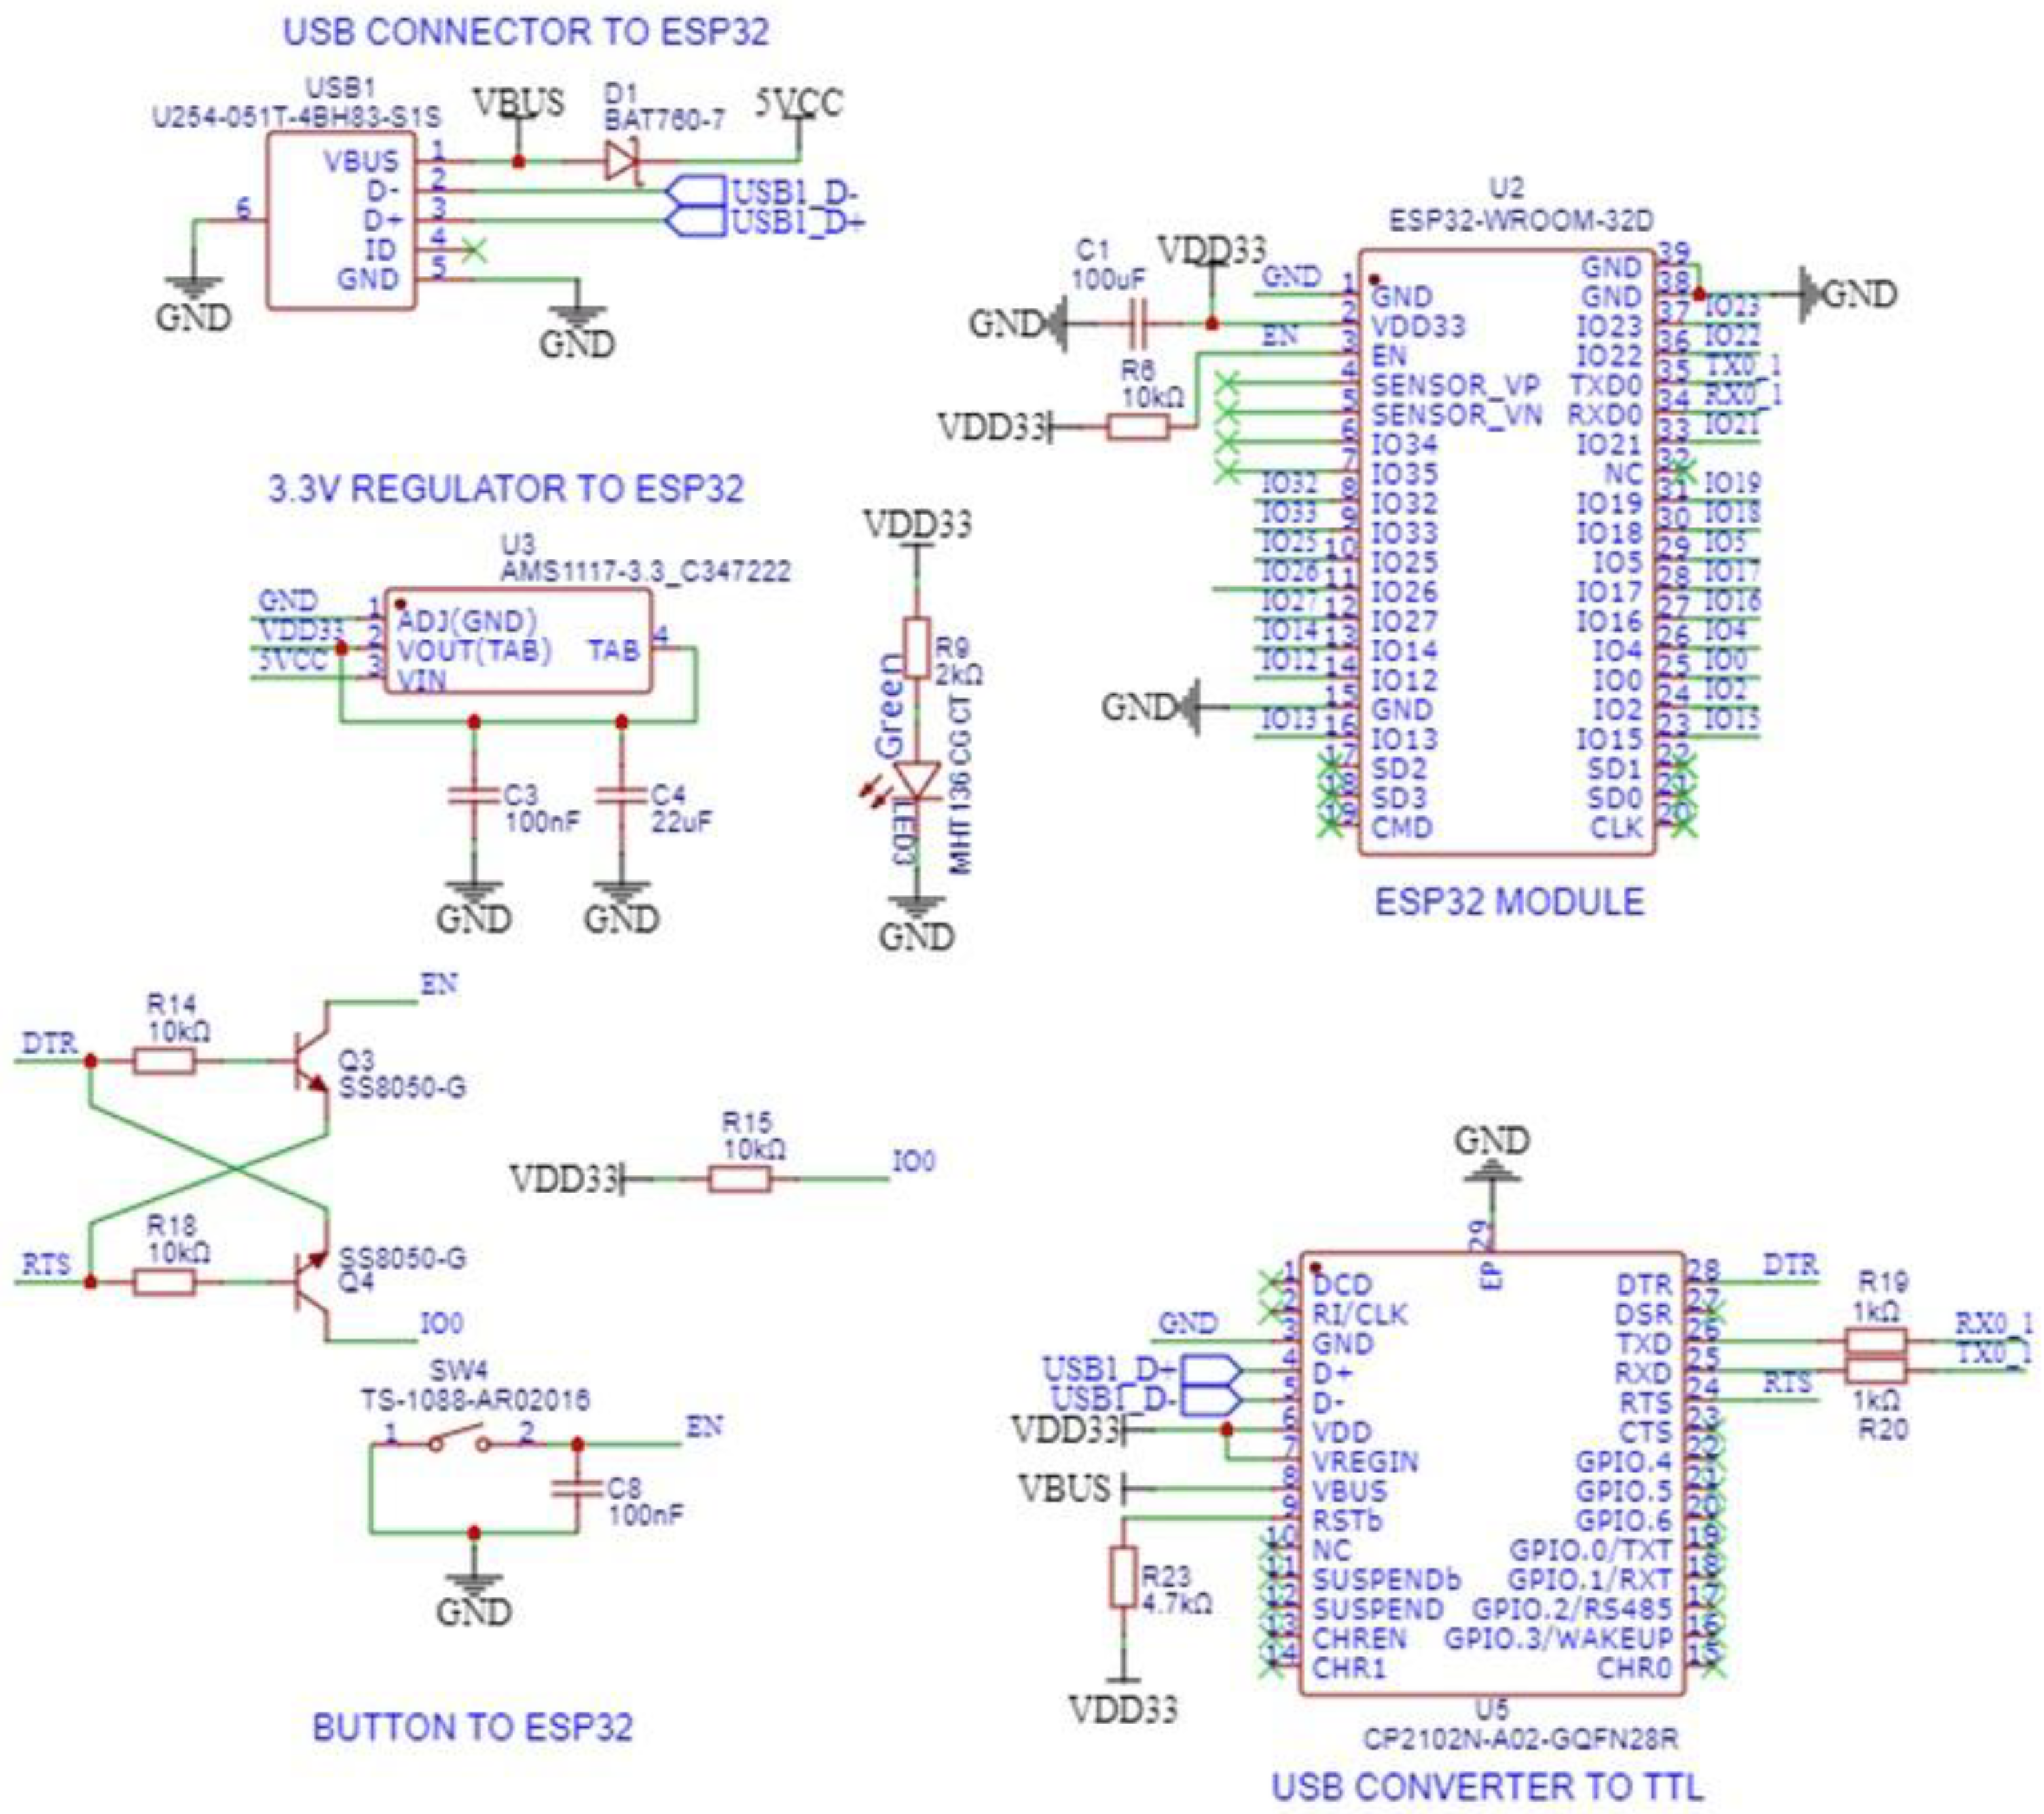
Electronic Circuit Design: After defining the ports and connections between the components, we proceeded to draw the schematics for printing the test PCB board. The Protoboard assembly uses a development board that is specifically focused on testing, and the system intends to have all the components embedded, except for the charging module and external components that will be mounted on the cabinet. All the remaining components must be integrated into a single plate. We followed the recommended circuit for the use of the ESP 32 microcontroller, as well as the reference circuit to be able to program and power it, based on the documentation on the Espressif page. We repeated the same process for the following components: ATMega 328P Microcontroller, Peripherals, Power Supply, Battery Bank, UPS Power Failure Control, Main Power Supply, and AC/DC signal converter.
Figure 12.
Circuito del Microcontrolador ESP 32.
Figure 12.
Circuito del Microcontrolador ESP 32.
Integrated Circuit Design: The routing process begins once the schematics have been created in EasyEDA software version 6.5.37. This involves physically drawing the board and placing each component with its respective electrical connection (using IPC electrical standards). The same process is carried out for designing the receiver board, resulting in the final integrated circuit on a single board (
Figure 13).
Analysis of Design Failure Modes and Effects (AMEFDs): The AMEF is a risk analysis tool that helps identify potential problems and their impacts in product or process design. Its aim is to prevent problems and their negative effects and facilitate strategies to mitigate them.
Table 6 and
Table 7 display the Design of AMEFs for the Issuer.
Table 6 evaluates the most critical failure modes, while
Table 7 outlines the actions taken to address them.
Third Stage. Process Engineering
During this stage, we receive the Emitter Card from our supplier, PCBLAB. We then conduct a reception inspection based on the Process Flow Diagram, the Analysis of Process Failure Modes and Effects (AMEFPs -
Table 8), and the Pre-release Control Plan (CP -
Table 9). Additionally, we focus on developing different programs necessary for device communication and product operation. These programs are based on the algorithms that were mentioned in the previous stage.
Table 8 shows the main failure modes for the emitter during the card reception and inspection stages before assembly. On the other hand,
Table 9 presents some actions taken to mitigate the possible failure modes.
Based on failure modes, the Pre-Launch Control Plan is presented, which includes process specifications and evaluation methods, among other things (
Table 10).
Program Development: The programs were developed using the Arduino platform and some of its libraries. Visual Studio Code was used as the code editor and Python was used as the programming language. The programs were based on the algorithms presented in
Figure 8 and
Figure 9, which are described below:
Receiver Source Code: This device is designed to connect to a PC via the USB protocol. In order to communicate with devices using serial interfaces like UART (Universal Asynchronous Receiver/Transmitter), a set of AT (Attention) commands needed to be established. These commands are commonly used in communication devices, modems, and GSM modules. You can find a list of these commands in
Table 11.
After establishing these commands, the next step was to design the instruction flow in the source code to ensure proper communication.
// Declaration of global variables, objects, and libraries to be used..
//DUAL CORE
//WIFI NETWORK
//NETWORK
//IP CONFIGURATION
//WEBSERVER
//WIFI COMMUNICATION
//GENERAL
//TRANSFER RX/TX
//IP FROM EACH STATION
//WIFI FUNCTION READ AND WRITE
//UART COMMUNICATION
//LCD DISPLAY
//REAL TIME CLOCK RTC
//GPIO’s
//LEDS
//GENERAL VARIABLES
Firstly, the SETUP program is created, which is only executed once when starting the program (
Appendix A1). This routine initializes the communication ports. After the Setup has been developed, the program will use dedicated functions for communication management and port management (
Appendix A2). Finally, we have the main program (
Appendix A3). The ESP32 microcontroller has two cores, which come in handy for running multiple processes at the same time, making the program faster and the code lighter for each core.
The communication software used to exchange data between the Receiver and the PC and store it in a database was developed using Python language (
Appendix A4). The Visual Studio Code text editor was used to create this source code. When executed, this code scans the USB ports and filters compatible devices using the inf? command. Once a compatible device is found, the code establishes communication with it and proceeds to synchronize the data efficiently. The code then manages the incoming data from each transmitter and stores it in the database.
Sender Source Code: The same methodology was followed as for the Receiver, considering that the Transmitter has two microcontrollers, the ATMega 328P, which is responsible for controlling peripherals (
Appendix A5a) and the ESP32, which is responsible for calculating indicators and wireless communication (
Appendix A5b). Communication between these two devices is also through AT commands (
Table 12).
The ESP32 Microcontroller, like the terminal, must have wireless communication sections, but it will also be in charge of presenting the data through an LCD screen, so the structure of the program is based on screens that, as the program progresses, initialization and configuration, it moves and generates the appropriate interface.
Data Base Desing: The database management system for our project involved using two tools - HeidiSQL and MySQL. HeidiSQL is a user-friendly SQL editor that provides an intuitive interface for managing the MySQL database. It simplifies database management and optimizes development efficiency. MySQL was used as the primary DBMS for the project.
The MySQL Database architecture efficiently manages dynamic and static data, providing a comprehensive platform for machine operation monitoring and analysis.
This system is composed of five tables. The first table is named "Dynamic Data" and it serves as the heart of real-time monitoring for the machines. This table stores essential information such as the current status of the machine, the duration spent in that state, and its activation (referred to as "
Table 13").
The second table, designated “Static Data,” holds unchanging information about each machine. This data includes the machine number, IP address, and assigned operator (
Table 14).
The third table, named "Indicators", is exclusively dedicated to tracking key performance parameters such as Overall Equipment Efficiency (OEE), Availability, Performance, and Quality. The fourth table, called "Times", focuses on collecting and storing various machine states provided by the company. Lastly, the fifth table specializes in monitoring the start and stop times of the machines.
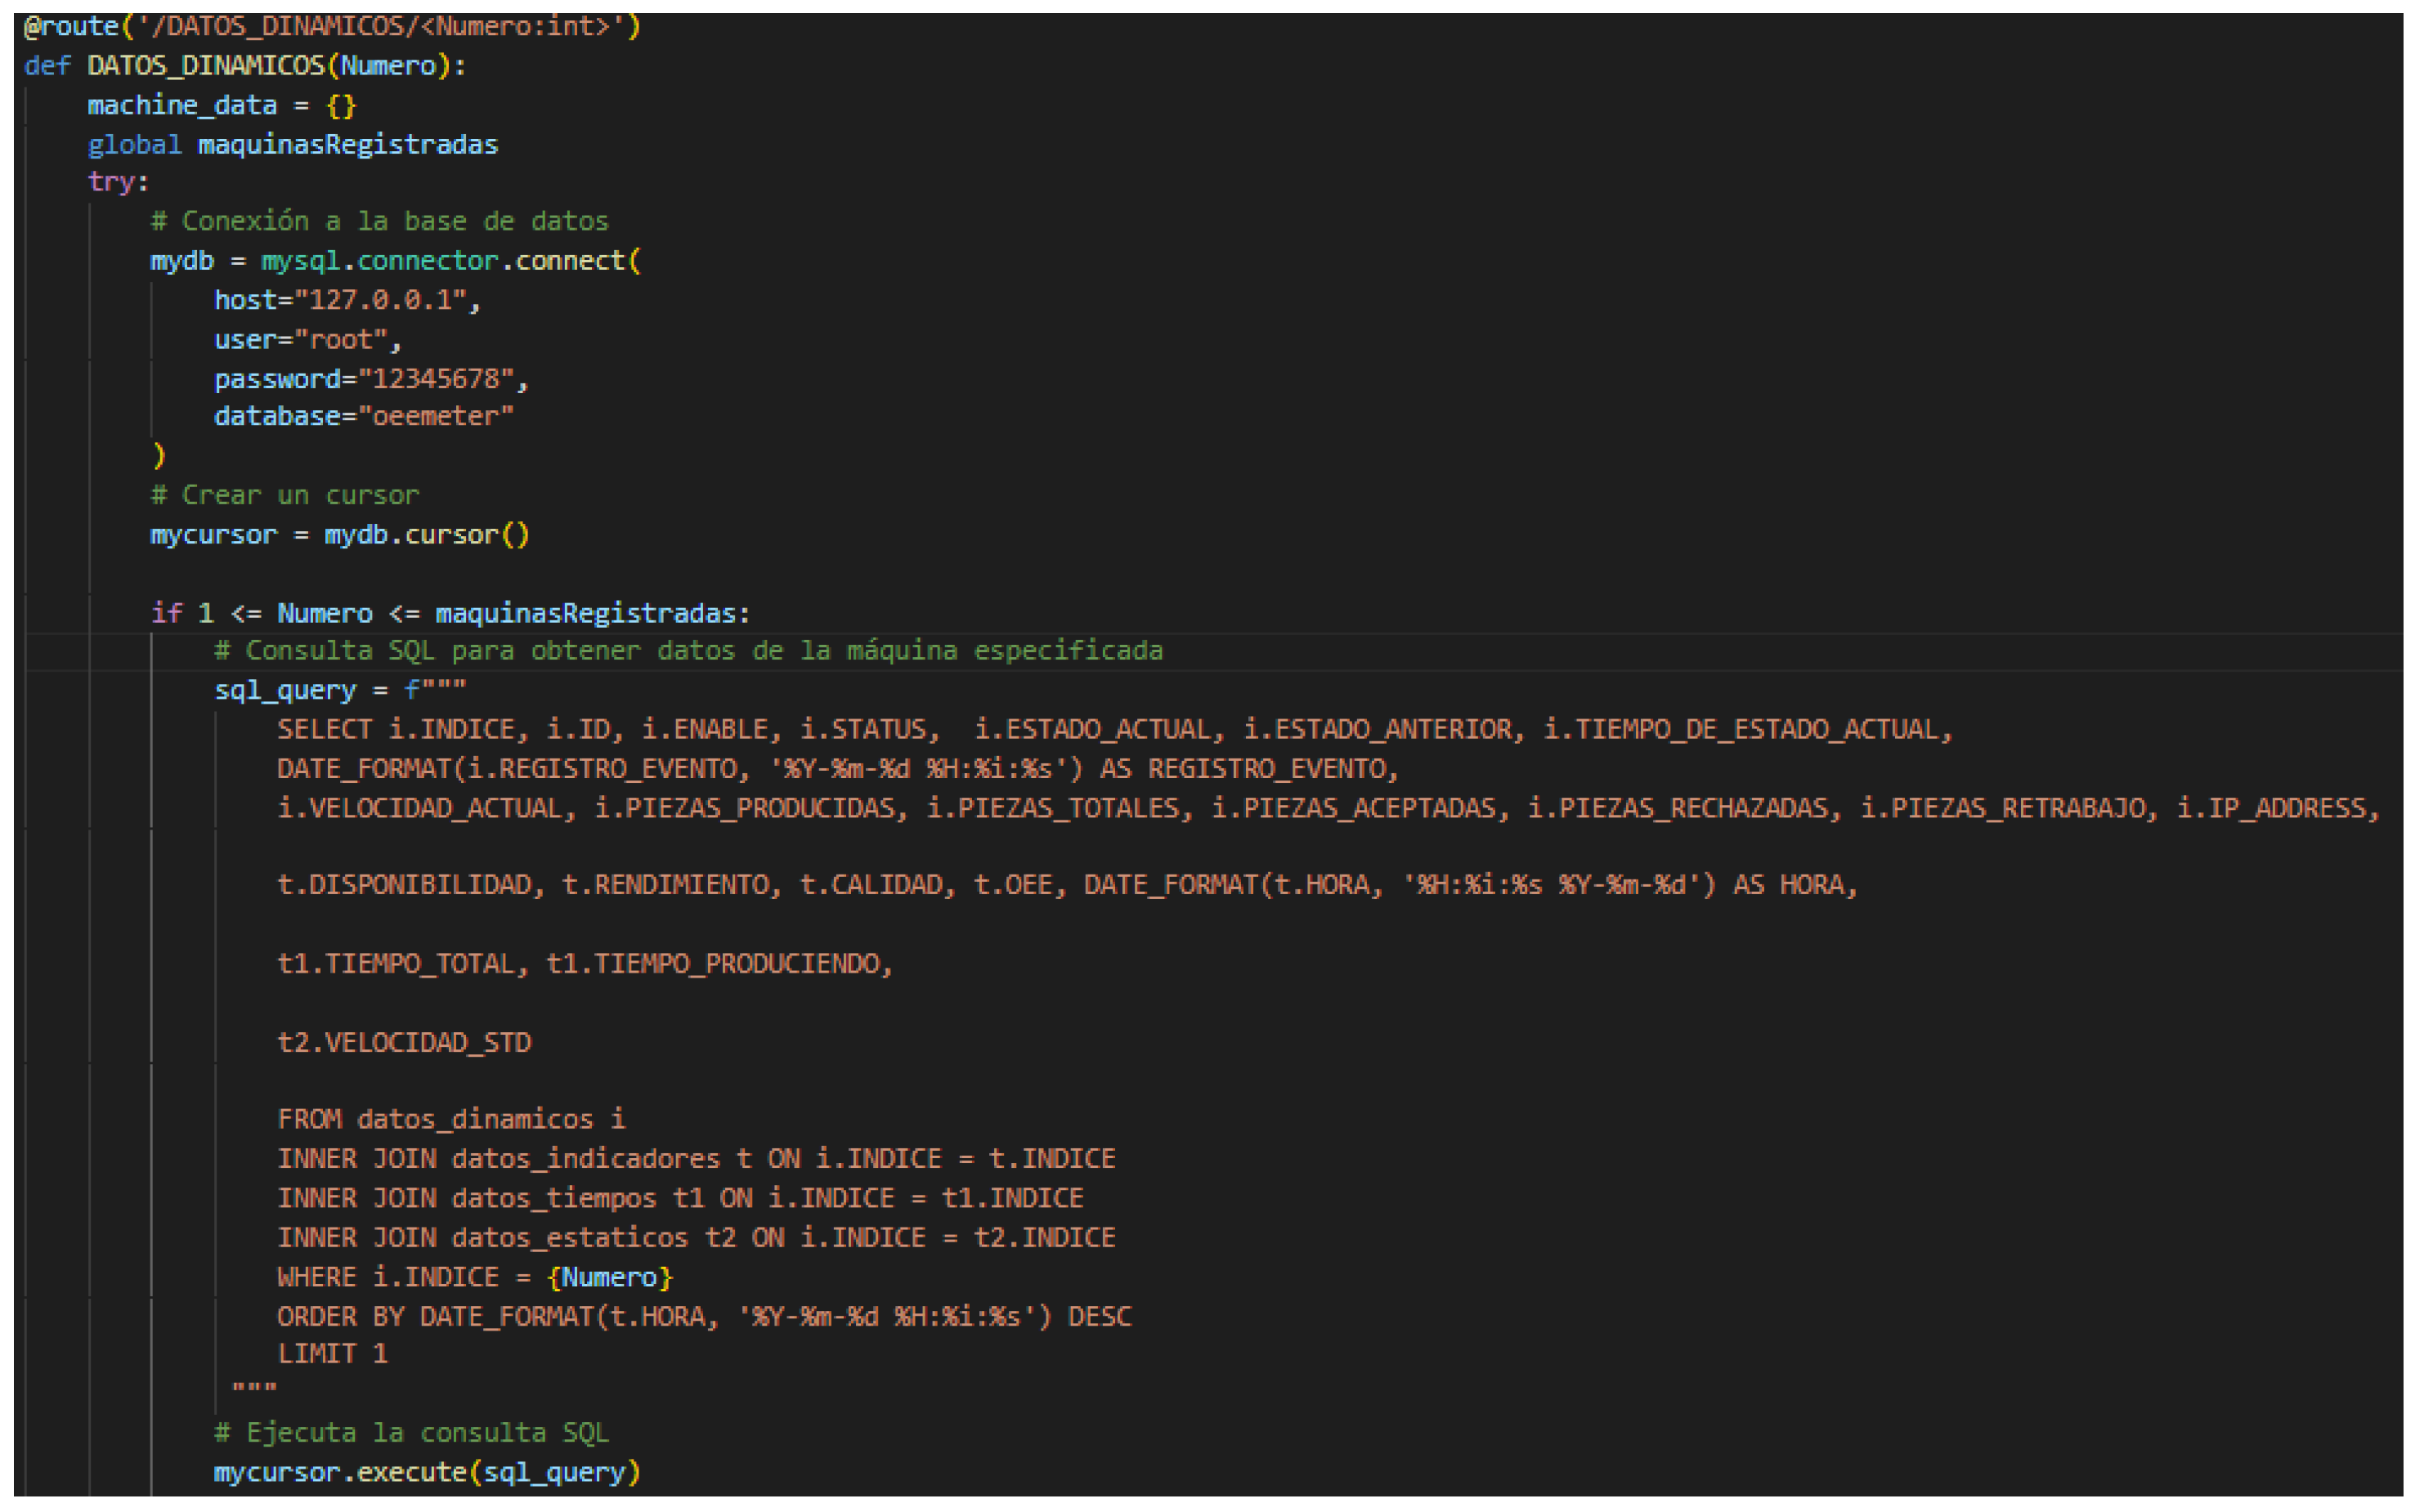
The Python language is used to manage the efficient transmission of data from the sender to the database and its subsequent extraction for the website’s interface. This bidirectional interaction between the data source, the database and the interface, enables flexibility in various operations such as inserting new data or updating existing information, responding to specific data storage needs.
Python code provides us with the ability to implement robust security protocols, which ensures safe transmission of data between the sender, database, and website. It safeguards the confidentiality and integrity of the information at all times. Additionally, this language enables the extraction of dynamic data hosted in the database and improves the response time of the web application (refer to
Figure 14).
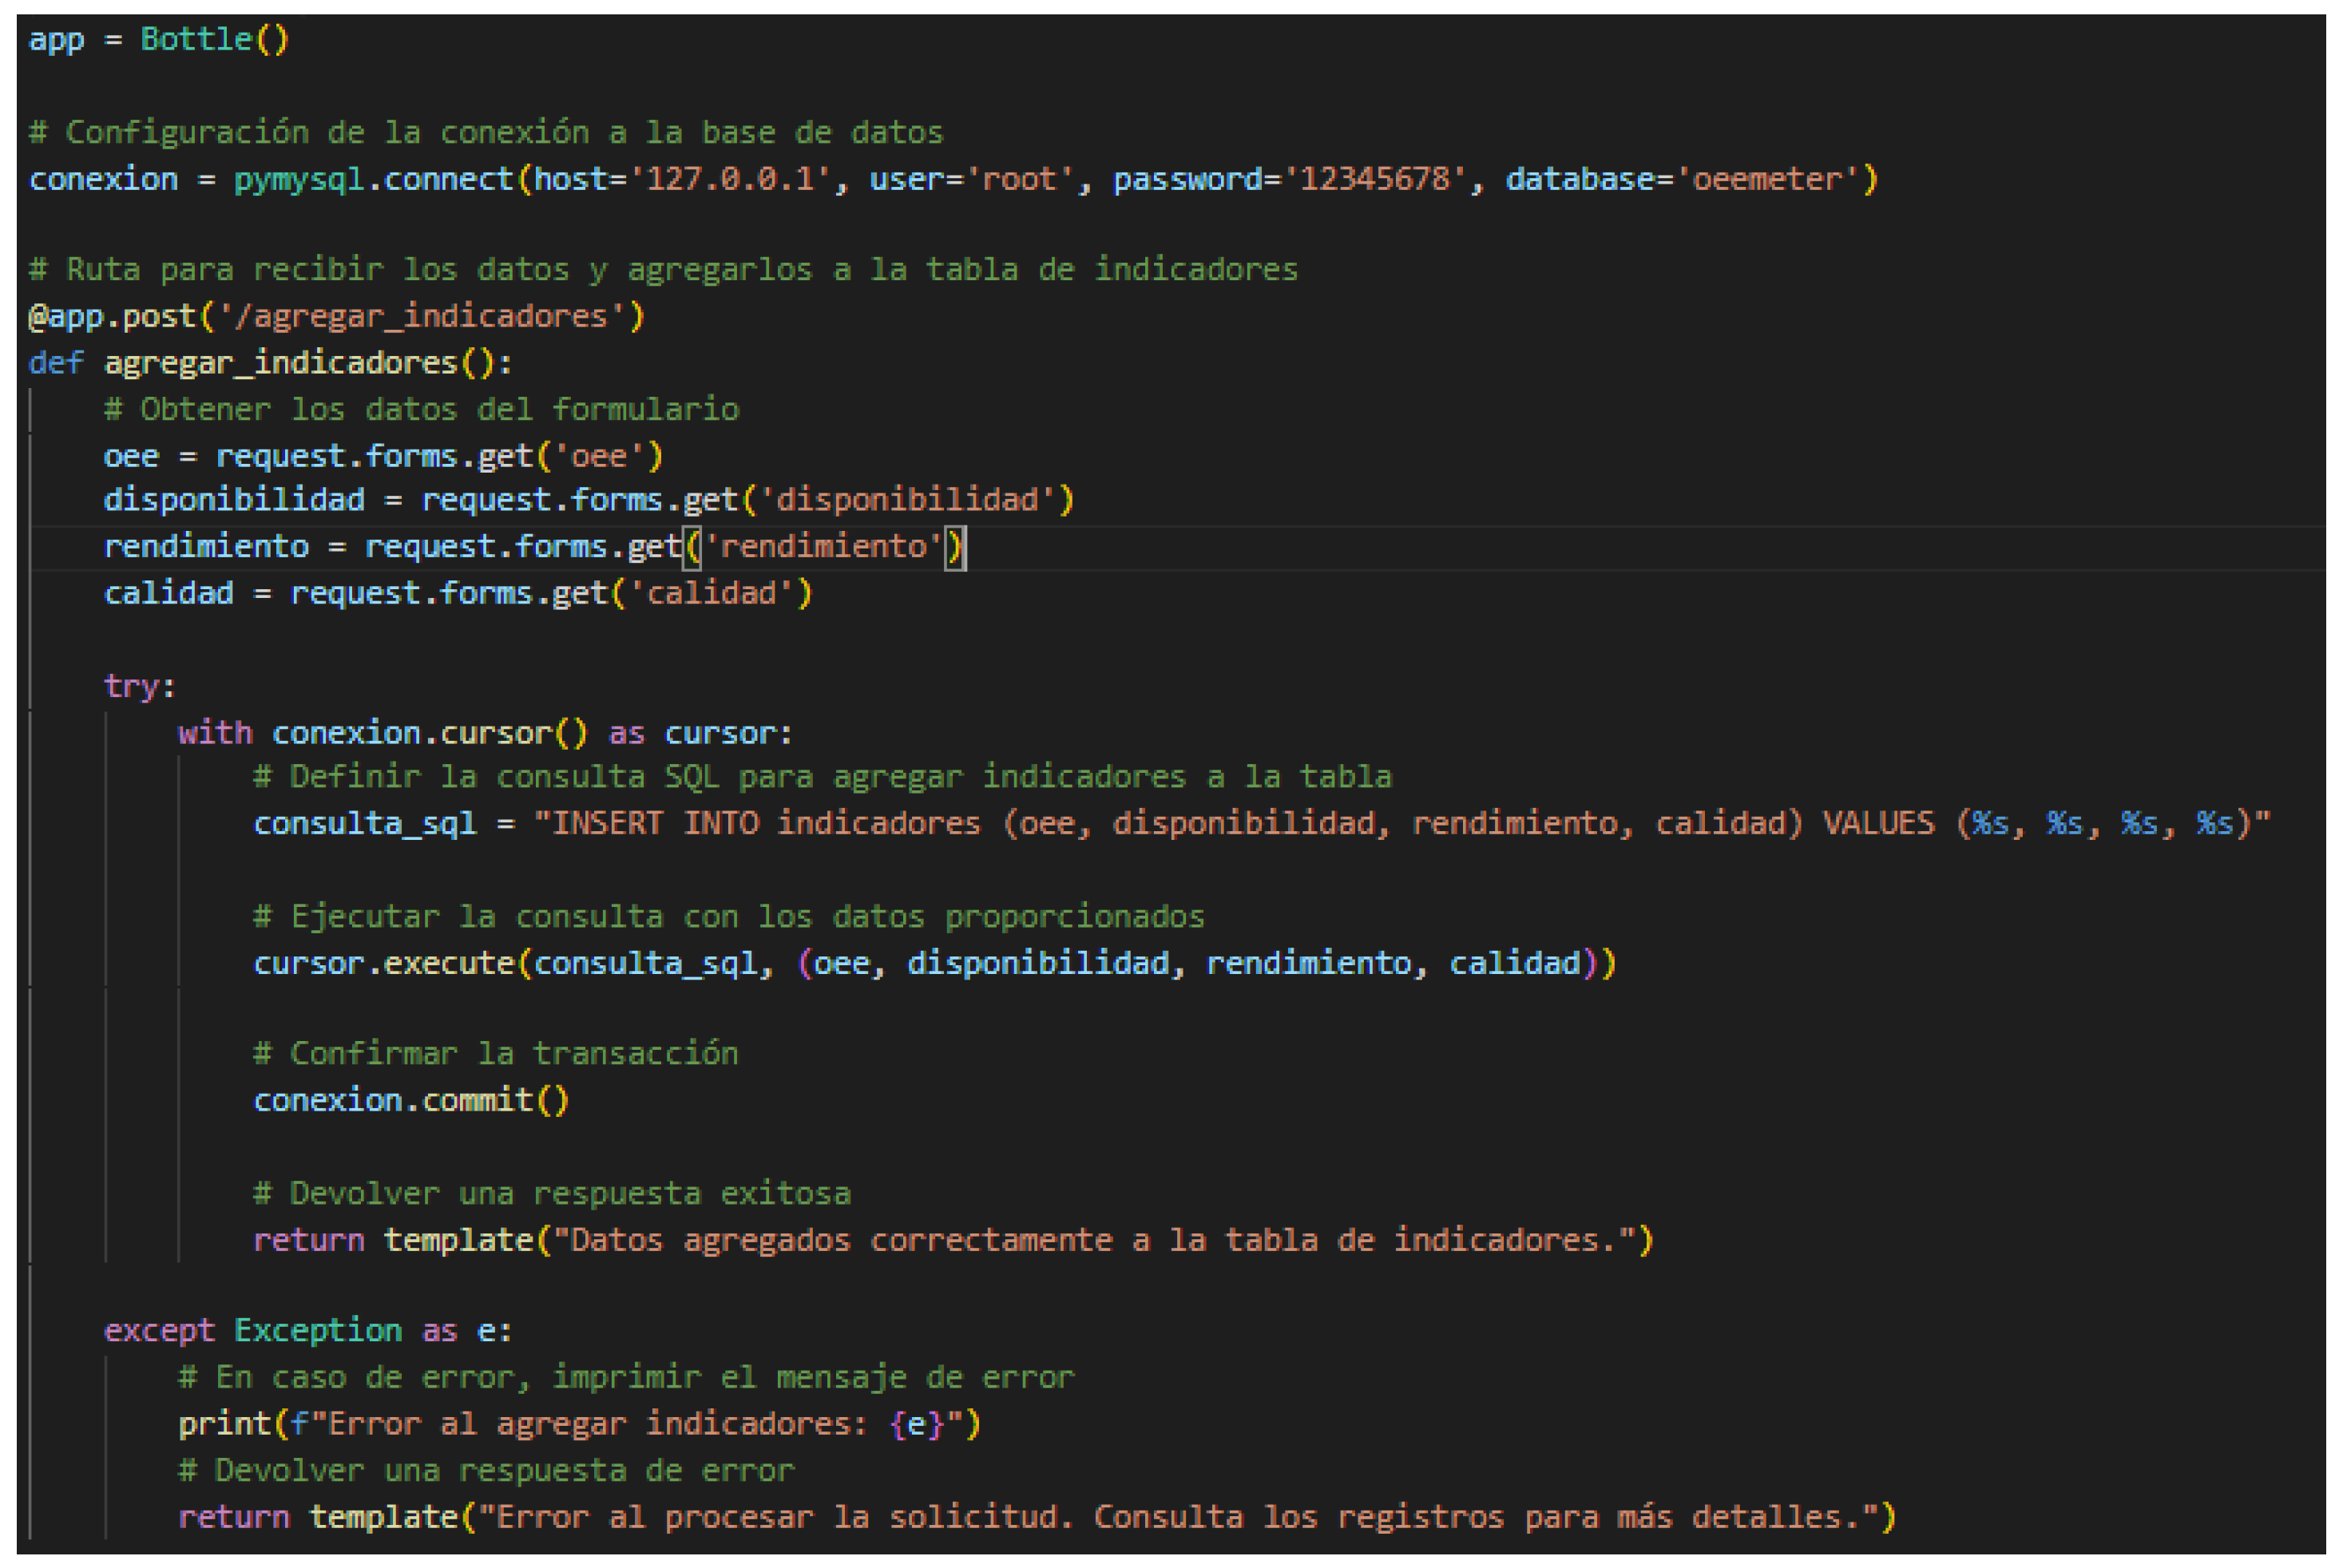
A form using HTML was designed to gather data from a website’s user interface. When the form is submitted by the user, a route is triggered on our Python server (Bottle) via a POST request. This route leverages pymysql to establish a connection with the MySQL database and then proceeds to insert the collected data from the form into the scoreboard. Finally, a response is sent back to the website as confirmation of the transaction, as shown in
Figure 15.
Fourth Stage. Product/Process Validation
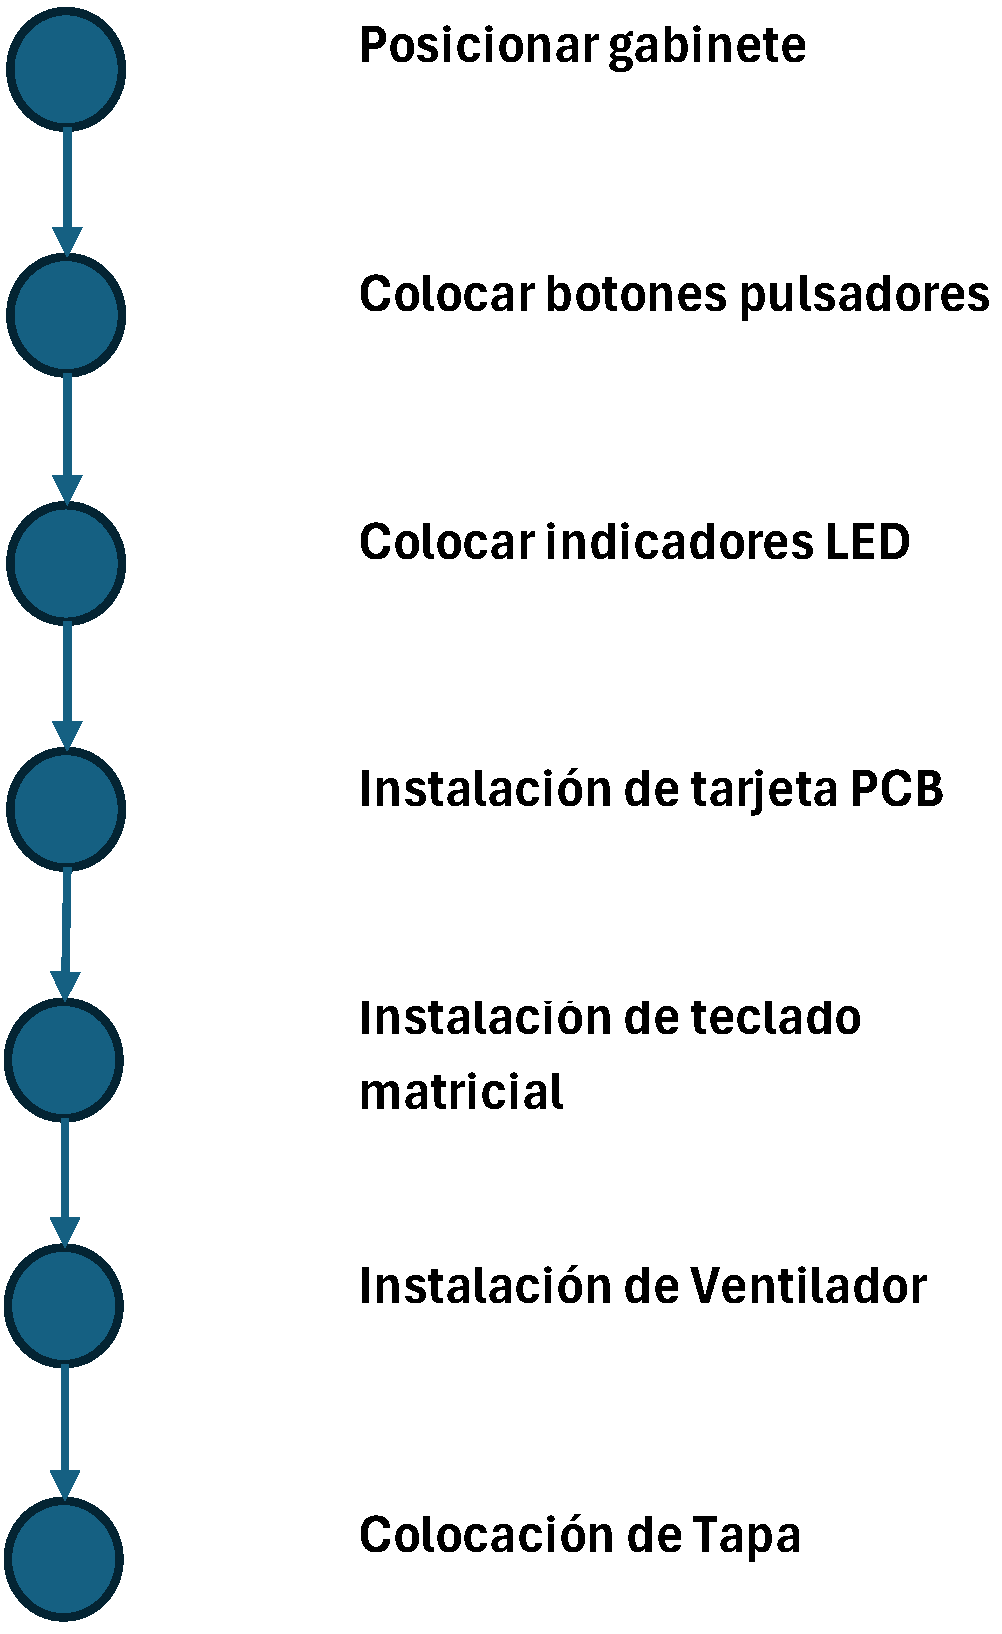
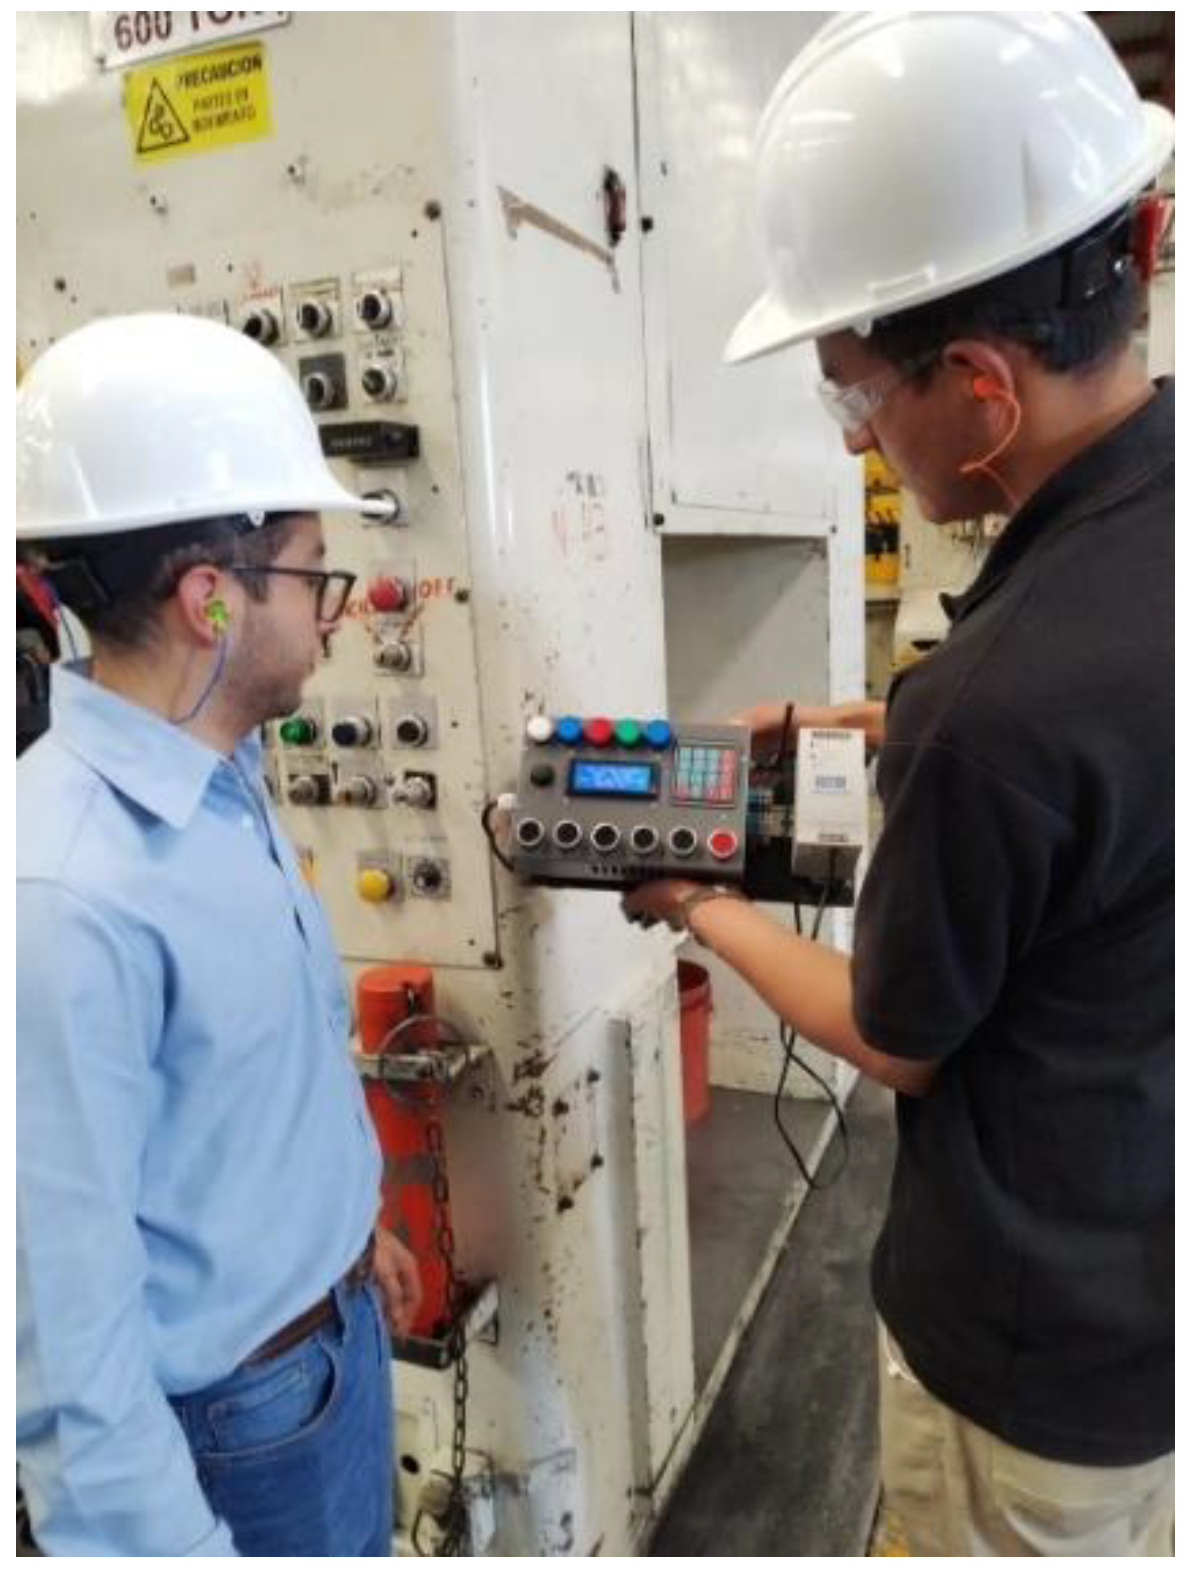
The manufacturing of this product is done through a process that allows for limited production of devices according to the client’s specific needs, rather than mass production. The Sender and Receiver cards, along with the peripherals, are sourced from external suppliers and only require inspection based on the control plan. As a result, the product validation process is carried out during the Issuer’s assembly. The Assembly Operations Diagram is displayed in
Figure 16, while the final assembly is shown in
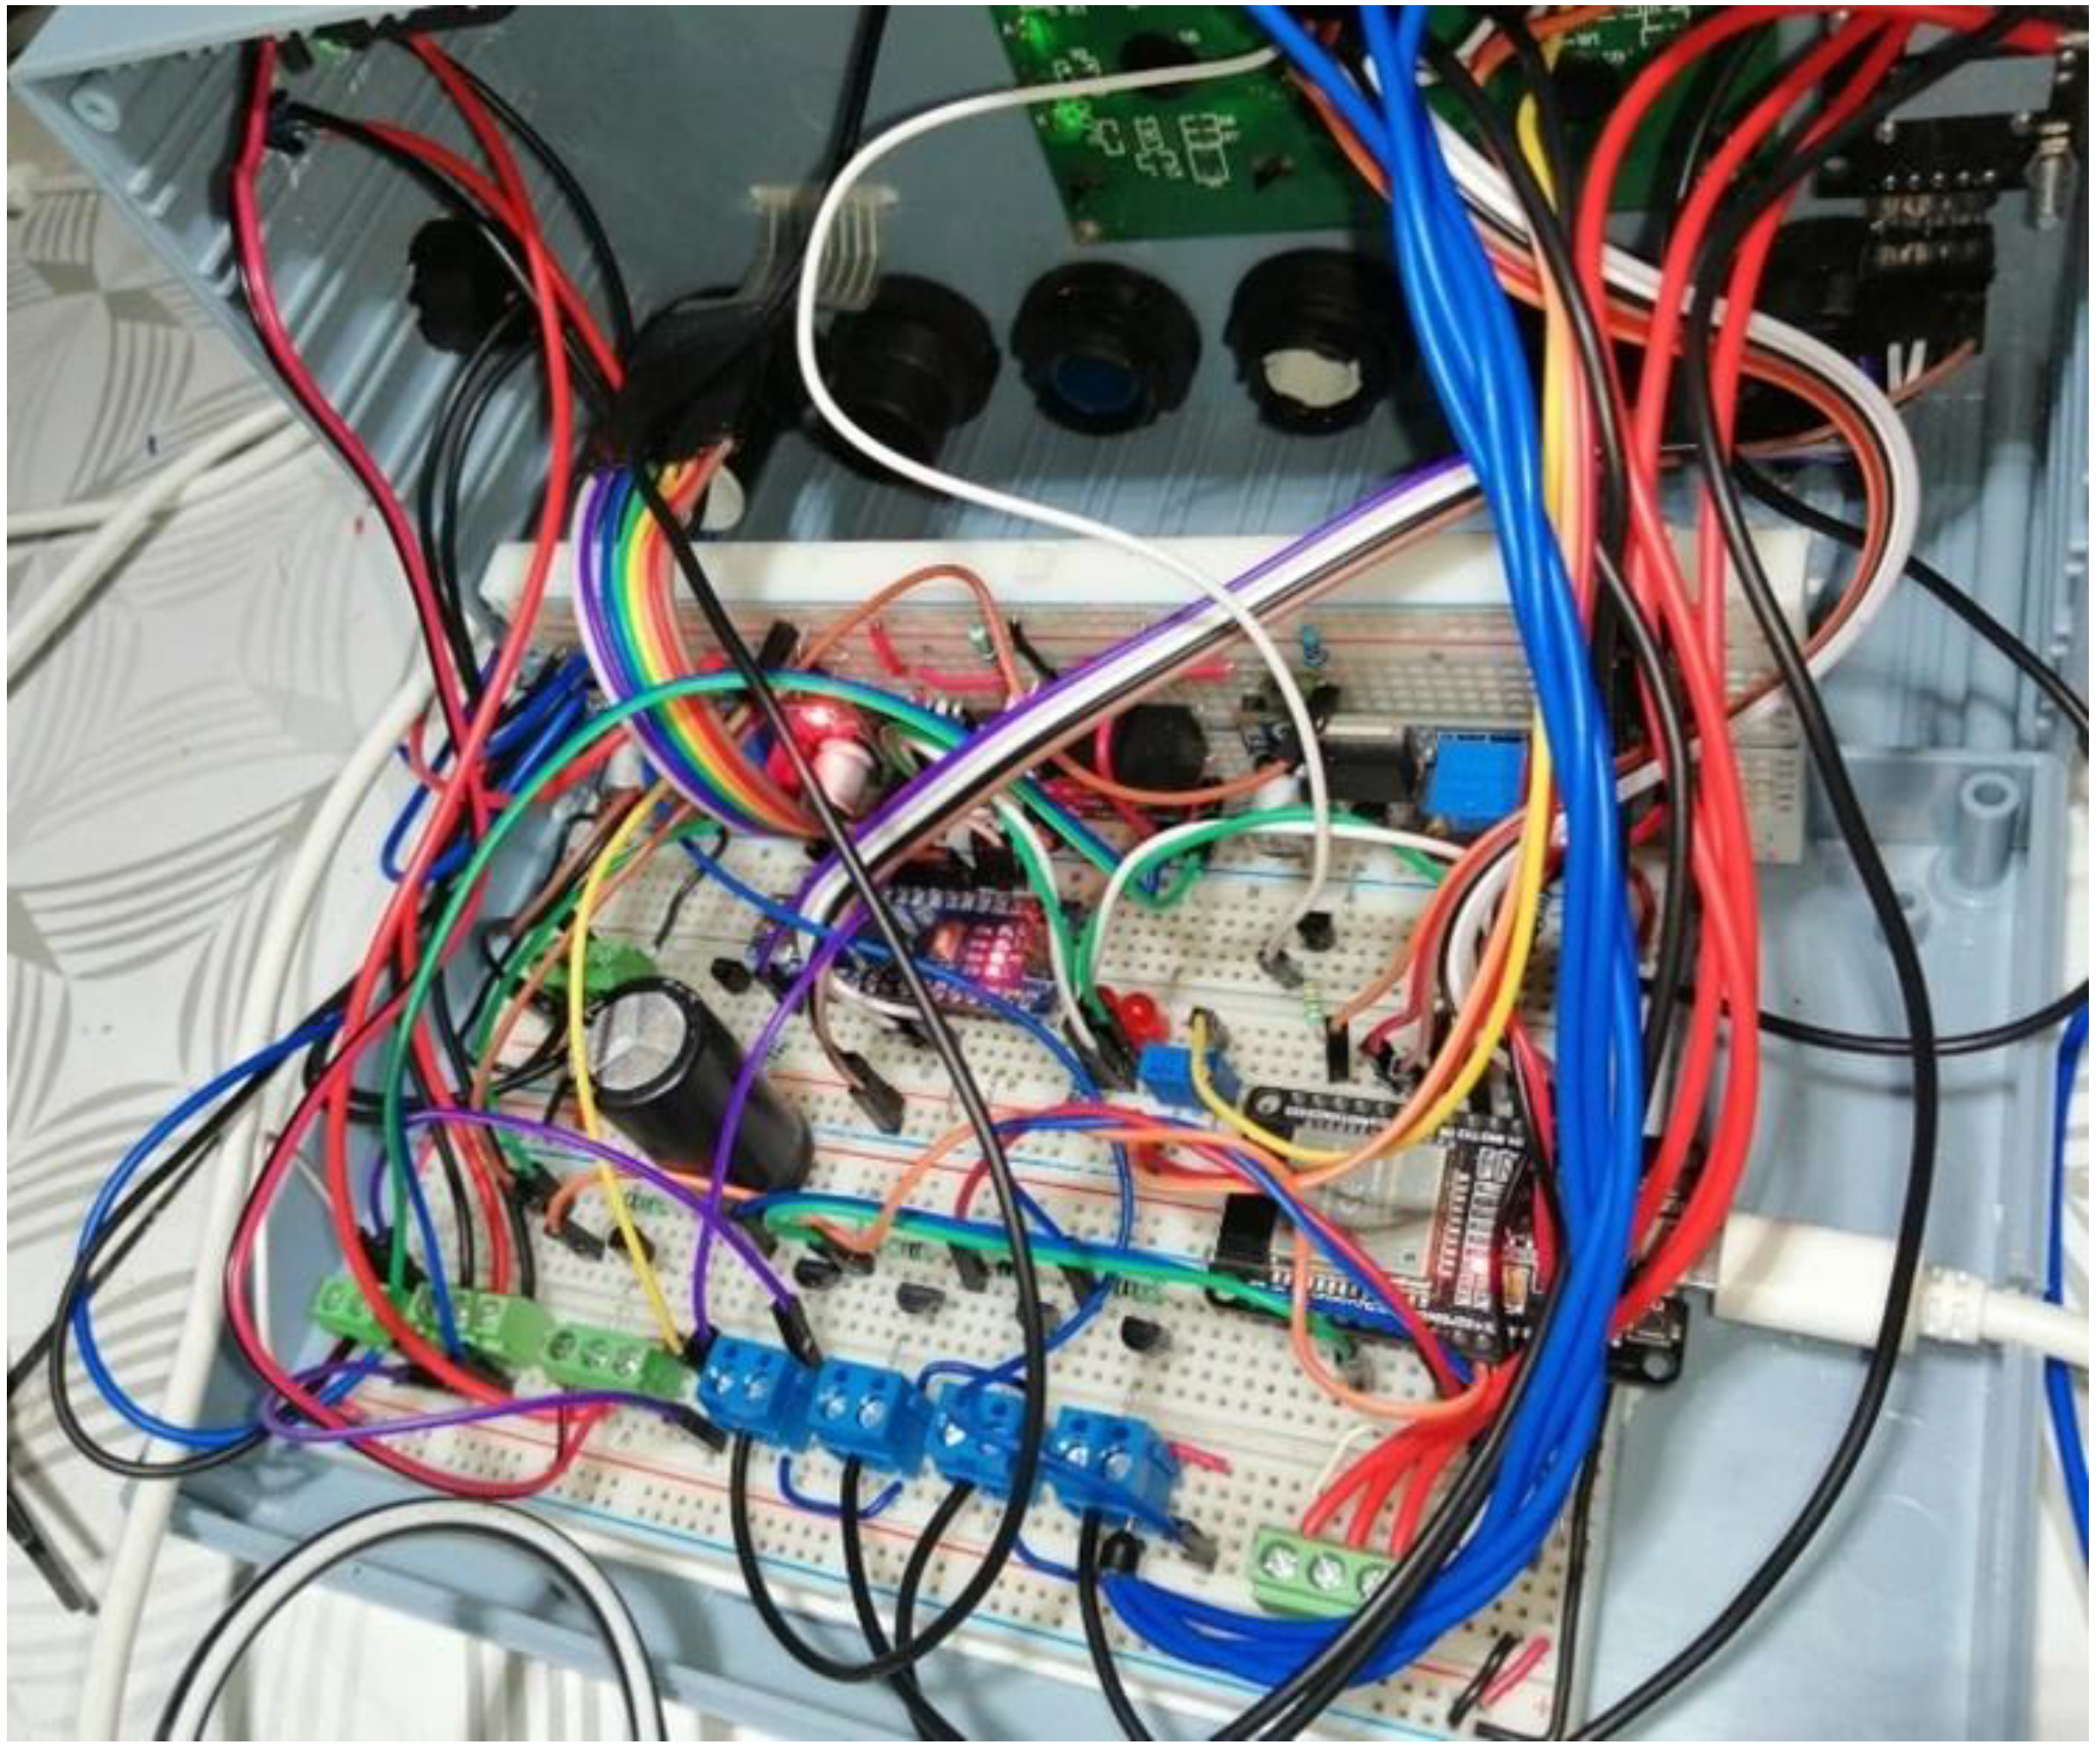
Figure 14. Quality tests, connectivity tests, and reliability calculations for the system are performed.
Production Run: Once all the parts of the Transmitter were ready, which include the Cabinet, Embedded Board, and Components, a sequence of assembly was defined. The operations diagram is shown in
Figure 16, and the final assembly is shown in
Figure 17.
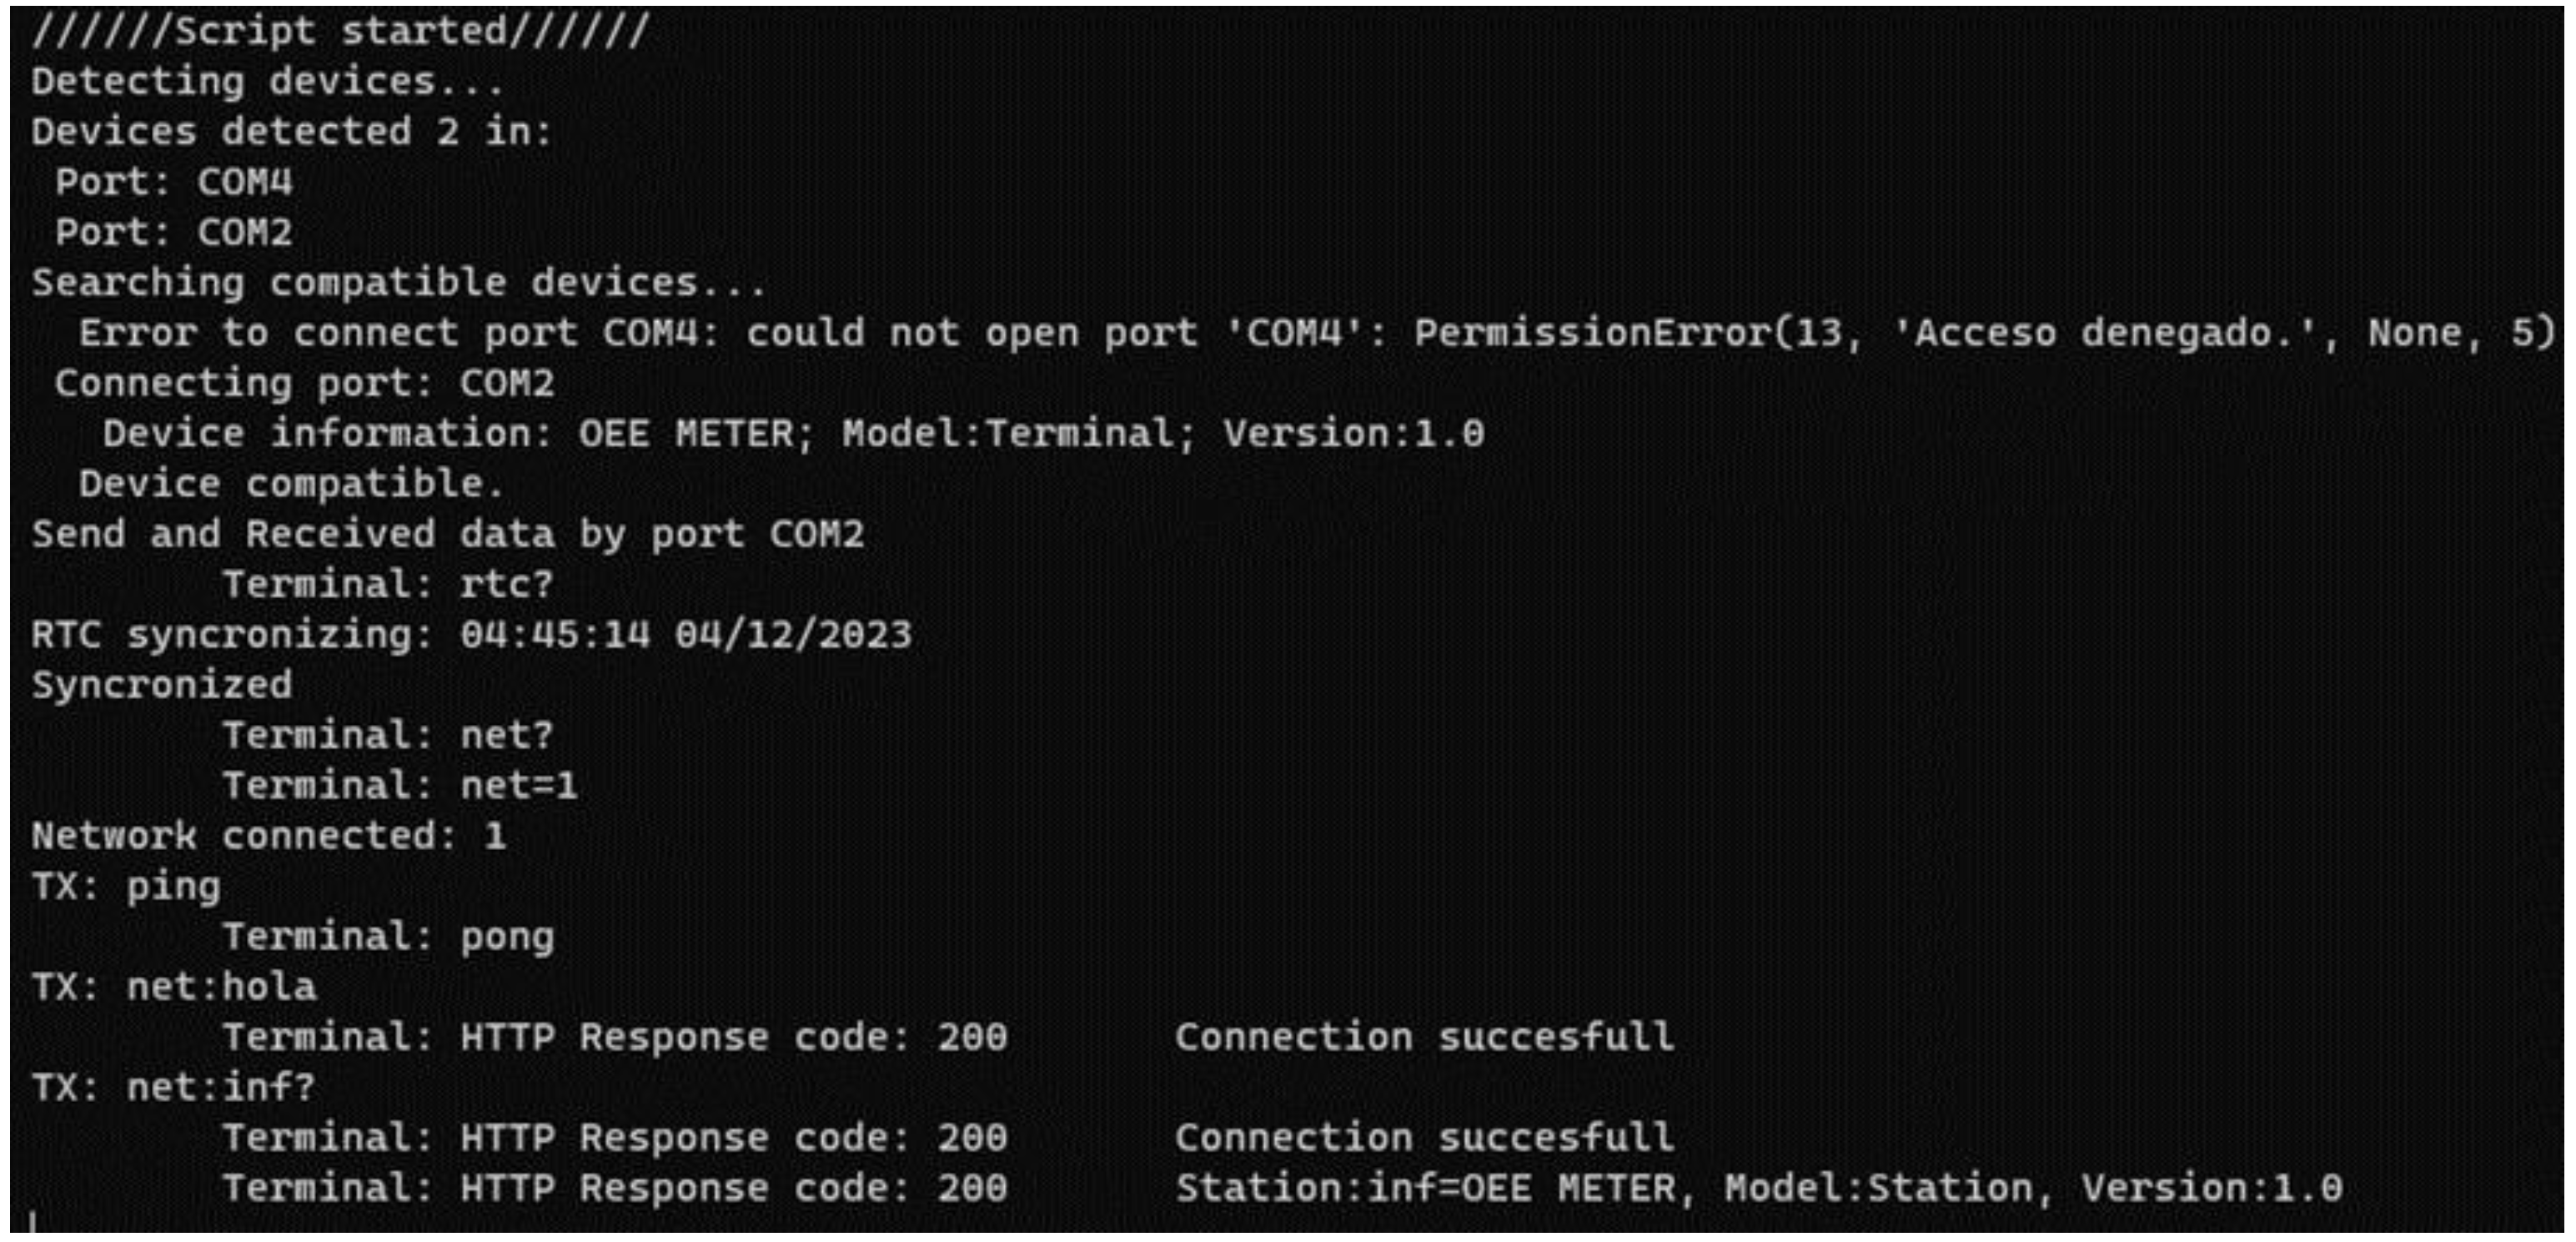
Connectivity Tests: The connectivity tests were carried out in the field. Firstly, the system was configured with the startup sequence and then connected to a Local Area Network via its IP address. Once connected, a tour was made through the different machines located at an average distance of 100 m. The test lasted for 30 minutes with the die-cutting machines in operation to detect any interference or vibration that could affect the system. During the test, the signal was received correctly on the receiver without any interference (see
Figure 18 and
Figure 19).
System Reliability Calculation: To measure the reliability of the system, tests were conducted during the week of January 15-19 of this year, with an average of 6.4 hours per day.
Table 15 shows some test conditions, while
Table 16 provides the testing period. The test results are summarized in
Table 17, where a total of 37705 information packets were requested and 60 requests were rejected with error code 5, indicating that the response time exceeded the limit. The accumulated downtime is 20.4 seconds.
With this data we can calculate the MTBF and MTTR as follows
Applying Equation 6, we have:
3. Results and Discussion
According to the Advanced Quality Planning methodology, we can highlight the following results:
Product specification: It is crucial to have the product specifications to determine the project’s scale and guide its direction. Defining the customer’s requirements in terms of specifications is important, as well as considering some other technical features that the product should have. Below are described the benefits that each of these characteristics provides:
Programming Flexibility: Open source software and editing platforms that do not require licensing, as well as access to any part of the code to make adjustments requested by the client.
Wireless connection: The system enables data transmission and access to information on-site through a local area network (LAN), without requiring an internet connection. It also features a reconnection code that ensures uninterrupted connectivity in case of any unforeseen events
Storage capacity: There are two options available for storing the information - either storing it on a local disk or hiring the services of a cloud provider, based on the customer’s preference and after analyzing the costs involved
Information Accessibility: As mentioned earlier, we can use a Local Area Network internally and switch to a Global Network for external queries
Diversity of Reports: The application has been designed to enable users to access the indicators related to Overall Equipment Effectiveness (OEE), such as Availability, Performance, and Quality. Additionally, users can also view various events recorded in the database, including preventive and corrective maintenance times, preparation times, and more.
Ergonomic design: For this case, an appropriate size was chosen for the operators, however, a strategy is still needed for the arrangement of workstations.
Users Management: The system has a database of users and their privileges based on their role within the organization.
Programming Algorithm: Programming algorithms were developed to meet the functionality requirements specified in the product features and different communication protocols. Flowcharts were developed for the initialization of the Transmitter, for the calculation of Availability, Performance, and Quality. With this input information, the calculation logic is determined for the Overall Efficiency of the Equipment. Additionally, algorithms were developed for monitoring the power supply and wireless connection that allow for two important functions, the activation of electrical power through batteries and automatic reconnection to the network.
Computer programs: One of the important outcomes is the computer programs developed for the various functions of the system. As mentioned earlier, the main programs can be summarized as follows: Receiver Initialization, Transmitter Initialization, Communication Management Functions and Port Handling, Main Program, Communication Program between Receiver and PC, Programming of ATMega 328p Microcontroller, Programming of ESP32 Microcontroller, as well as the functions derived from them (
Appendix A).
Measuring system: A productivity measurement system has been successfully developed based on the construction of prototypes, which allowed Process Diagrams to be elaborated, Failure Modes and Effects Analysis (FMEA) to be evaluated for both design and process, and Control Plans to be built (
Figure 14). It is important to mention that after designing the Transmitter and Receiver cards, they were sent to an external supplier to be manufactured as an embedded system that is finally assembled with the other components
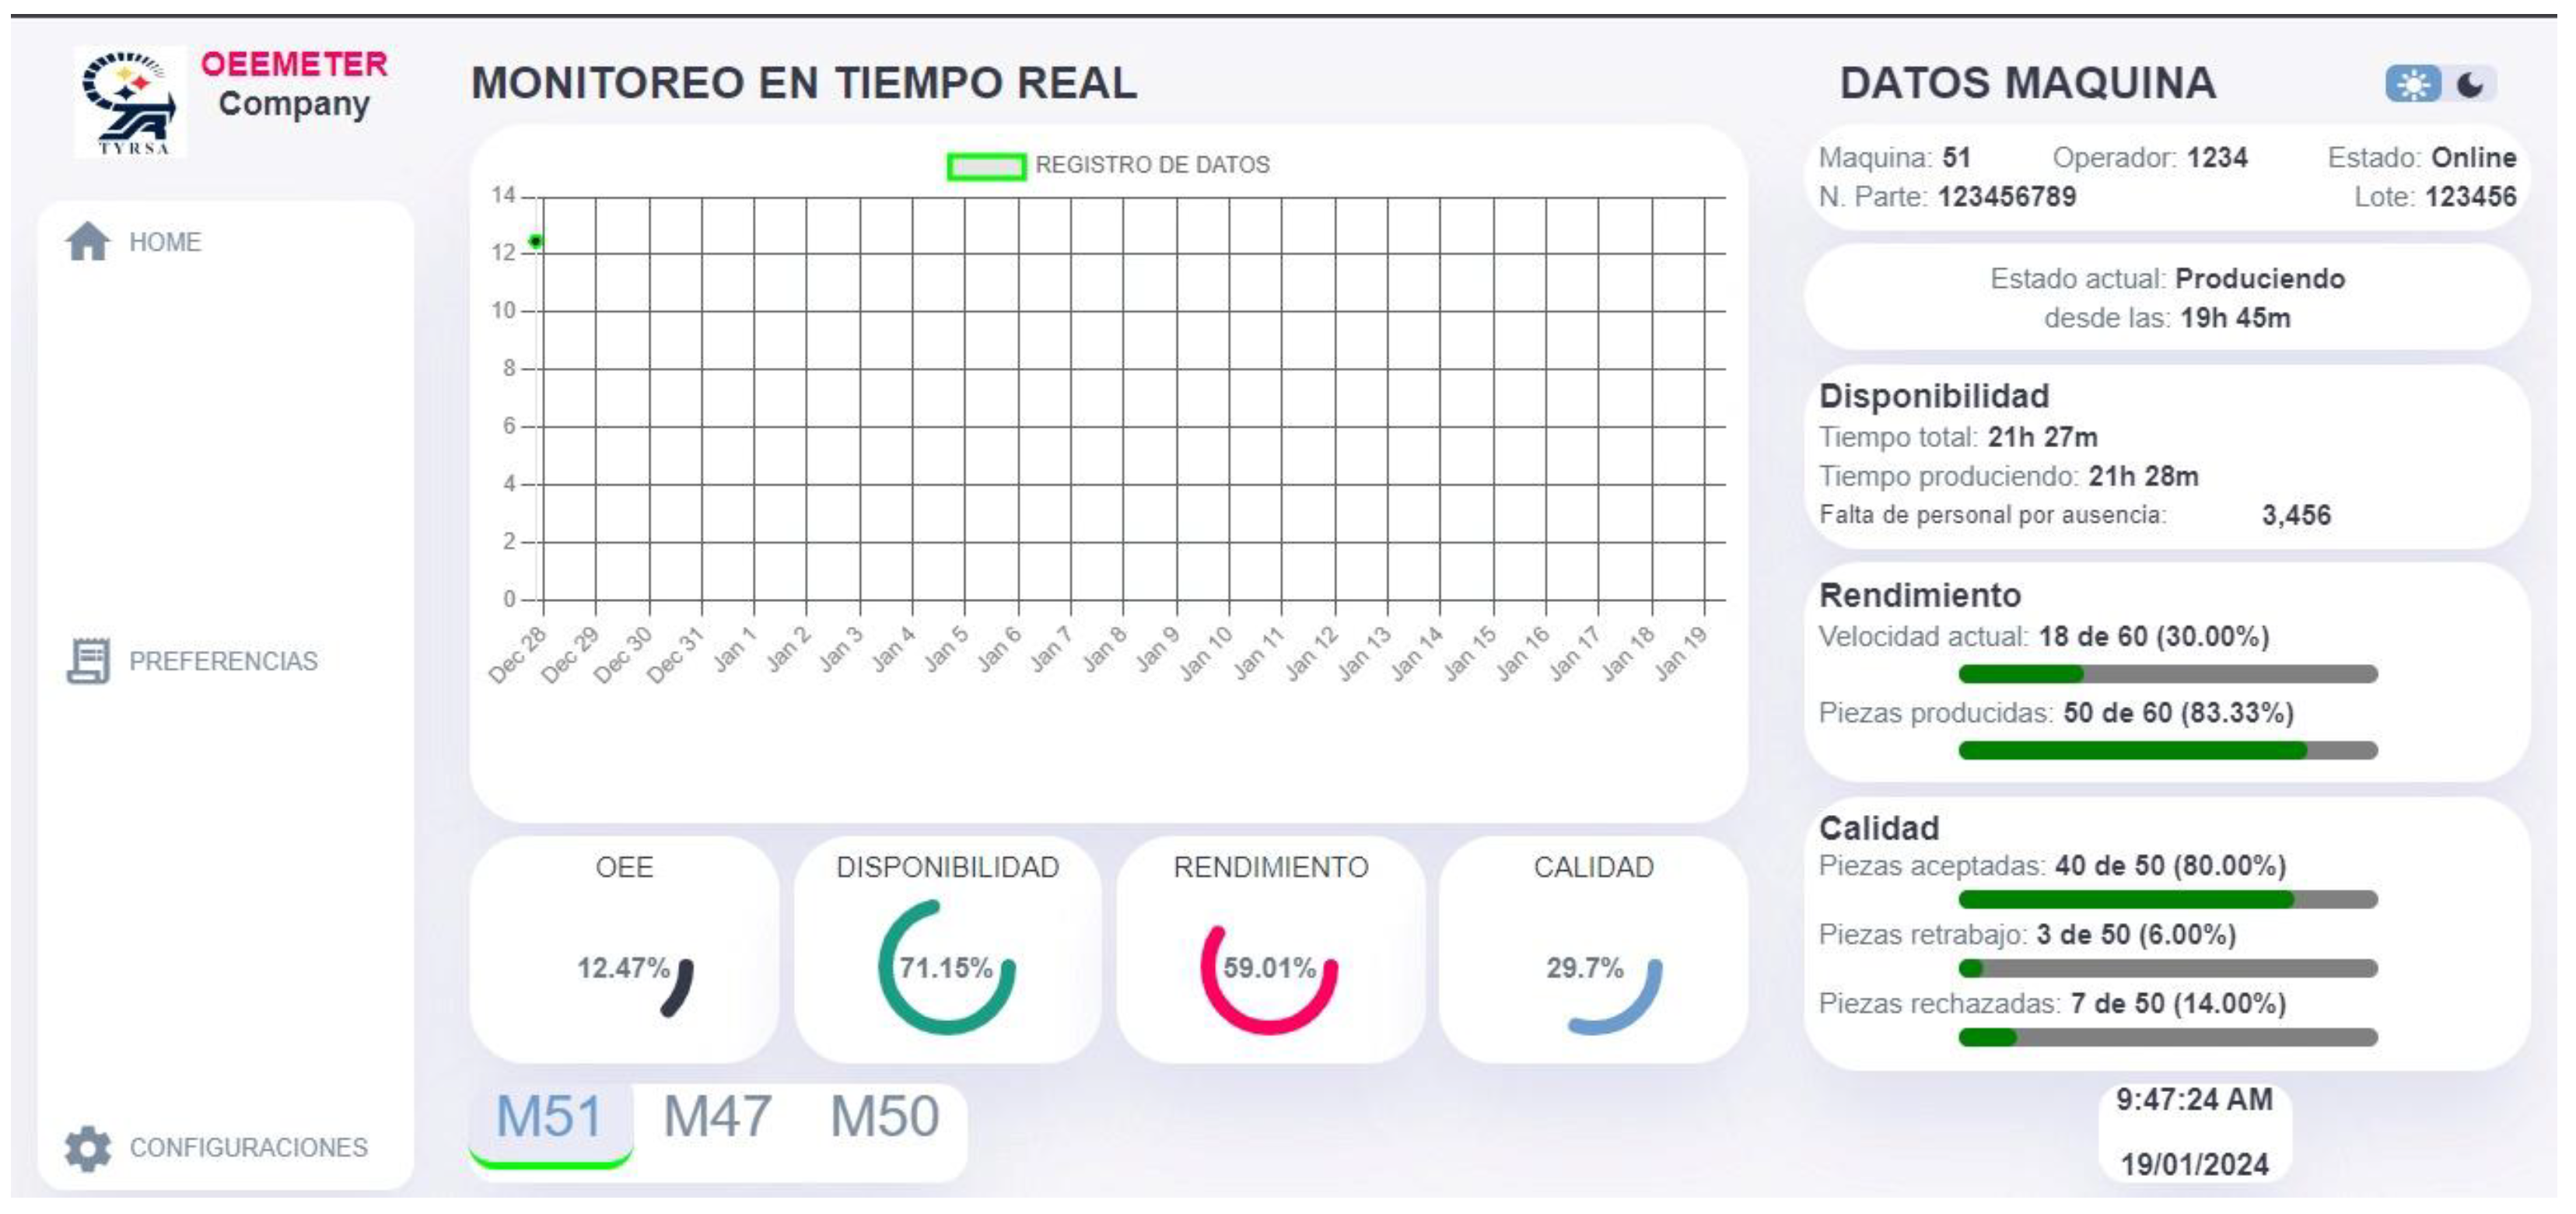
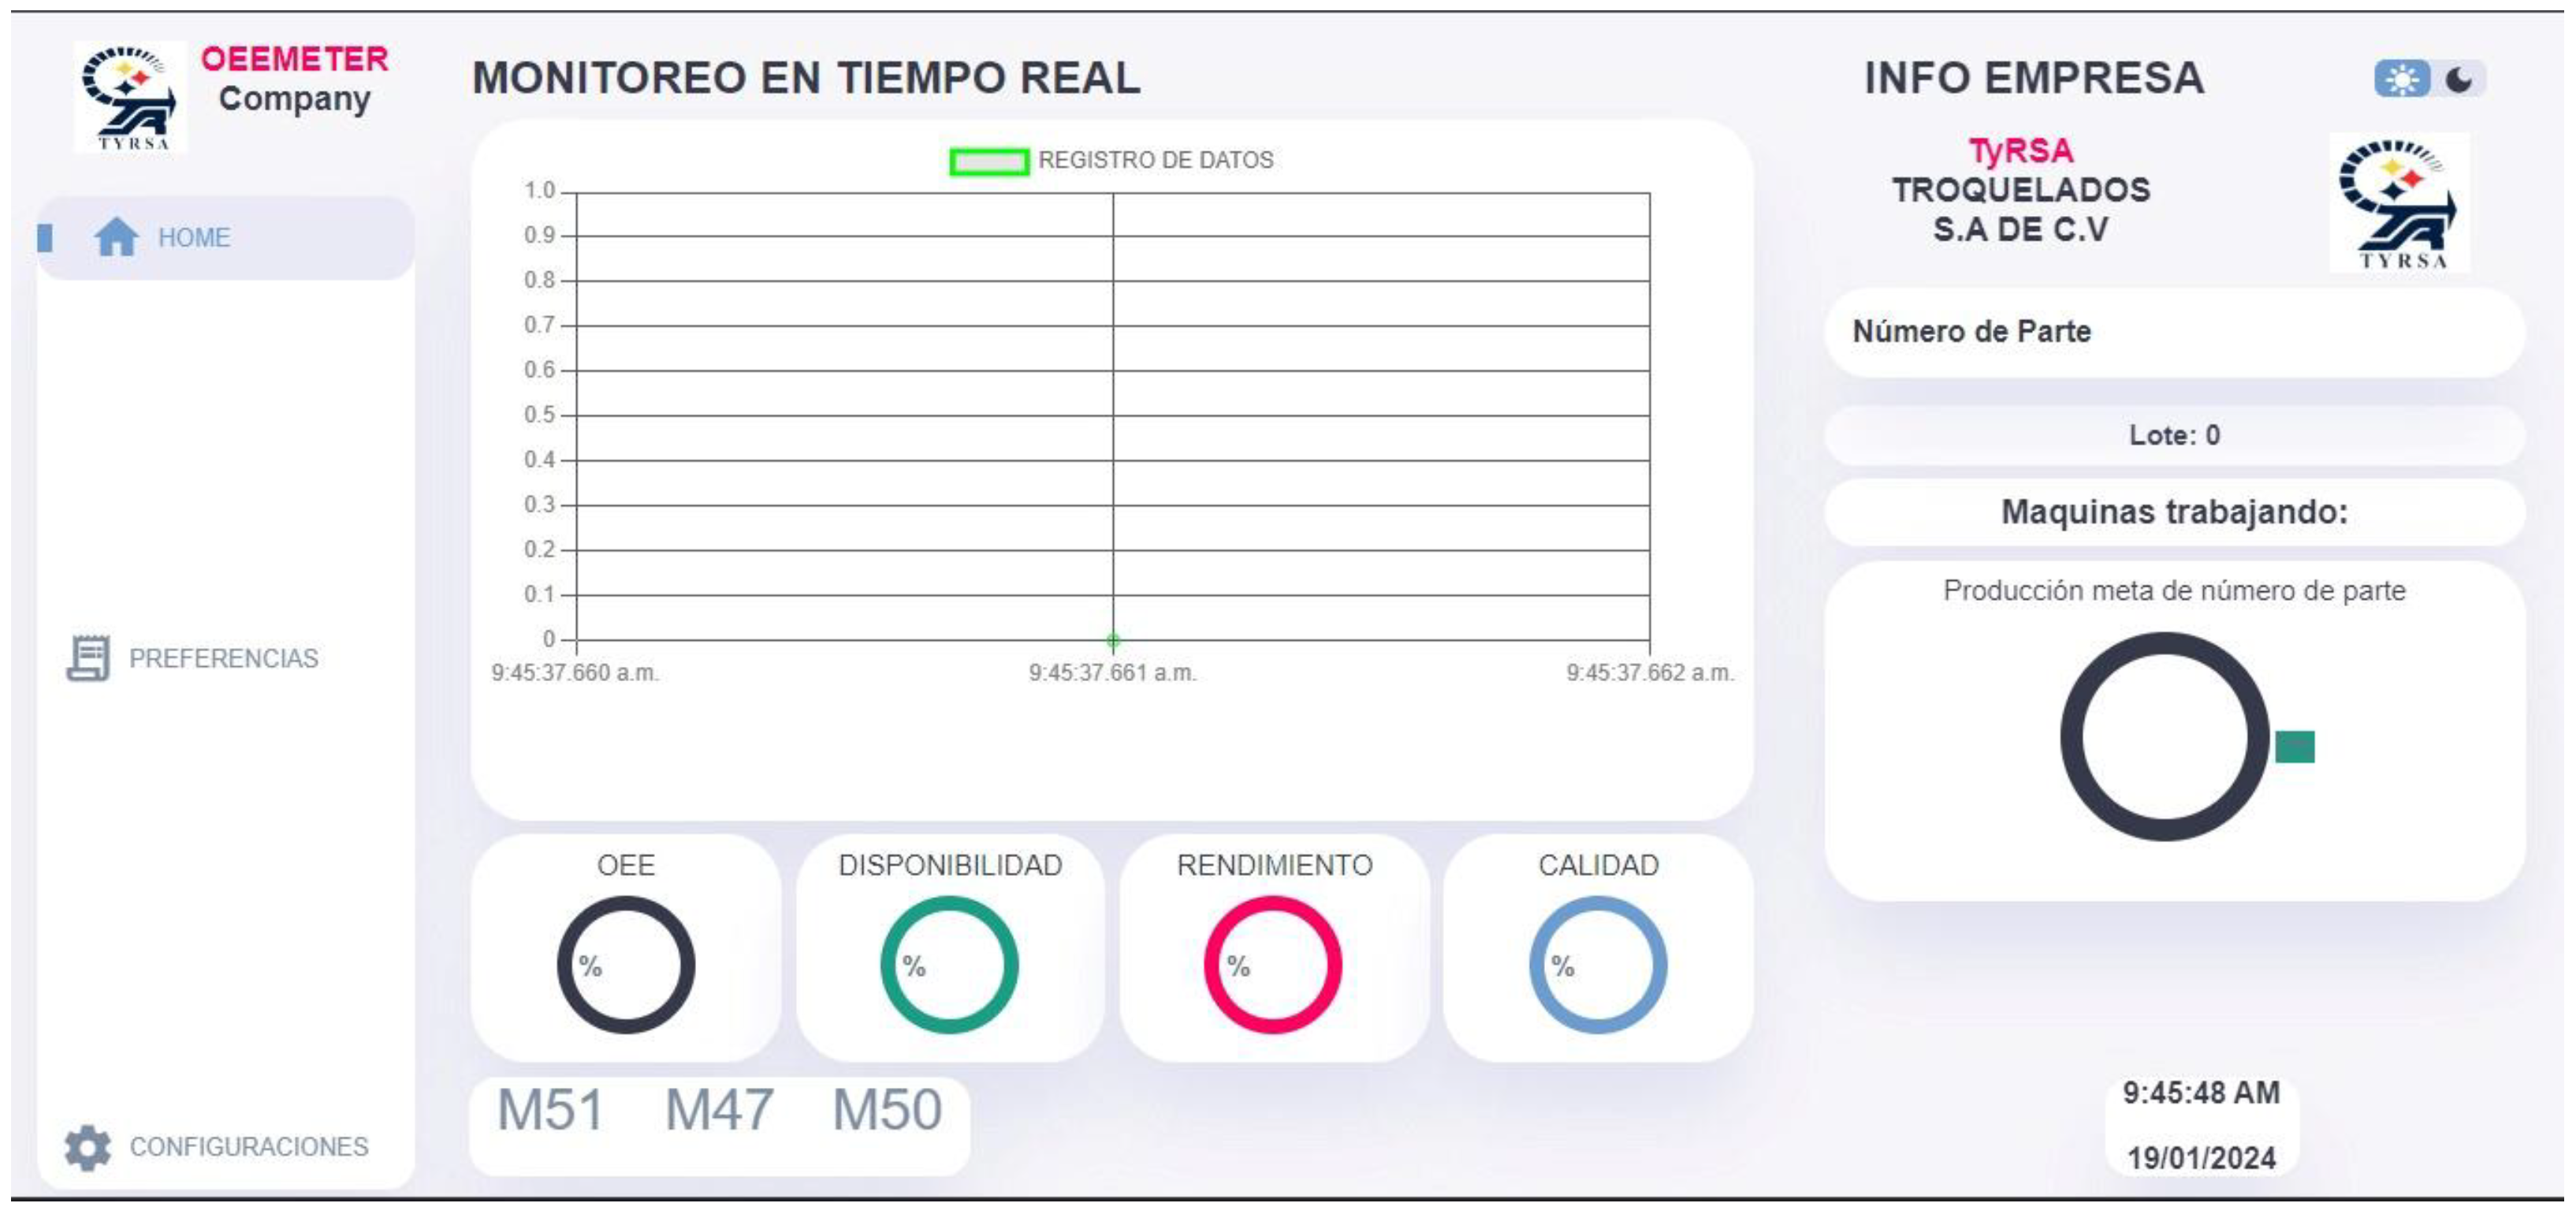
Display Screens: In this case, a main screen was developed for each machine, which allows navigating between the different machines that have been registered. Additionally, for each machine, it is possible to consult each of the indicators that make up the OEE by accessing the Availability, Performance, and Quality menus (
Figure 20). In
Figure 21, the screen showing the production target and the percentage of compliance is displayed, which serves as a visual aid for the operator.
During the reliability tests, only 60 delays were experienced among the 37705 test requests. These delays do not pose any risks for data loss since the information gets recorded in the database just 0.34 seconds after the request. In the future, the testing period will be extended to either confirm or adjust the reliability calculation
