Preprint
Article

G20 Tourism Carbon Footprint and COVID-19 Impact

Altmetrics

Downloads

139

Views

73

Comments

0

A peer-reviewed article of this preprint also exists.

Submitted:

02 February 2024

Posted:

02 February 2024

You are already at the latest version

Alerts
Abstract
The Glasgow Declaration called for scientifically based measurements of CO2 emissions in the tourism industry to achieve the goals of the Paris Agreement. Despite the economic and employment downturn caused by COVID-19, there are limited cases of environmental assessments related to tourism. This study estimates the carbon footprint of the tourism industry in major G20 countries before and after COVID-19. Understanding the characteristics of inbound tourism and domestic tourism is important as they impact different markets. GHG emissions from tourism mainly stem from transportation, but the type of travel and country differences also make souvenirs, accommodation, and food and beverages significant emission factors. The pandemic has greatly impacted the tourism industry. In 2020, GHG emissions from both domestic and inbound tourism significantly decreased, affecting the number of tourists. In some countries, measures against COVID-19 influenced these figures, and although signs of recovery were observed in 2021, the reduction rates varied by country. These emission reductions should be the goals pursued by the tourism industry in the post-COVID-19 era, requiring efforts to achieve sustainable tourism.
Keywords: 
Subject: Environmental and Earth Sciences  -   Environmental Science

1. Introduction

In 2015, at the 21st Conference of the Parties (COP21) to the United Nations Framework Convention on Climate Change, the Paris Agreement was agreed upon by 196 contracting countries [1]. This agreement set a goal to "keep the global average temperature well below 2°C above pre-industrial levels and to pursue efforts to limit the temperature increase to 1.5°C." However, according to the Emission Gap Report 2023 [2] published by the United Nations Environment Programme (UNEP), the policies aimed at achieving the Nationally Determined Contribution (NDC) targets of the G20 member countries are insufficient. To reach the targets by 2030, a reduction of 28% is necessary, and for the 1.5°C goal, a 42% reduction is required. The global average temperature is projected to rise by 2.5-2.9°C by around 2100, and a significant deviation from the 1.5°C target has been reported.
While the tourism industry is vital for economic growth and development, it is also faced with the need to address its environmental impacts and climate change [3]. At COP26, the "Glasgow Declaration" for climate action in the tourism sector was announced in Glasgow, Scotland, U.K. This declaration set a goal to halve CO2 emissions from the tourism industry by 2030 and achieve net-zero emissions by 2050 [4]. Signatories were required to develop a plan based on the commitments of the declaration within 12 months and implement specific measures to combat climate change. In particular, under the "Measure" section, the United Nations World Tourism Organization (UNWTO) has emphasized that for the tourism industry to contribute to the implementation of the Nationally Determined Contributions (NDCs) of the Paris Agreement, it is necessary to enhance the measurement and disclosure of GHG emissions from tourism and introduce goals based on scientific evidence [5]. At COP28 in December 2023, it was reported that 70% of the action plan submitters designed methods for measuring GHG emissions. However, the need for a consensus on the calculation methods and the scope of the investigation was highlighted [6]. According to the report, the scopes of the calculation varied from part to the entirety of tourism operations, but it was reported that emissions from Scope 3 activities, such as transportation, accommodations, and food services, accounted for over 75% of the total emissions [7].
According to the UNWTO, the tourism sector is one of the most affected by the COVID-19 pandemic [8]. The impact of COVID-19 on international tourist numbers was significant, with a 72% decrease in 2020, 69% in 2021, and 37% in 2022 compared to 2019, indicating a severe global impact [9]. The total loss in international tourism revenue from 2020 to 2022 is estimated at USD 2.6 trillion, largely due to the global lockdowns caused by the pandemic [10]. Furthermore, there are reports that out of the 144 million workers in the tourism sector worldwide, over 100 million were pushed to the brink of employment crisis. Thus, the pandemic has had substantial economic and employment impacts on the sector [11].
The UNWTO defines sustainable tourism as "tourism that takes full account of its current and future economic, social, and environmental impacts, addressing the needs of visitors, the industry, the environment, and host communities" [12]. This "sustainable" approach aims to balance the three aspects of economic development, social development, and environmental protection. It seeks to maintain economic activity while pursuing long-term growth, a principle that is also applied in the tourism sector [13].
Life Cycle Assessment (LCA) is a method that comprehensively evaluates the environmental impact of products and services. In the tourism industry, which involves various sectors, it is considered a method capable of identifying the industry's potential environmental impacts. According to Filimonau (2016) [14], current research trends have particularly examined the impact of tourism on climate change, utilizing two methods: Input–Output LCA and Process-Based LCA. Assessments using Input–Output LCA have been employed for evaluating the entire industry, such as regional tourism or national tourism industries. On the other hand, Process-Based LCA has been used for evaluating specific services, such as vacation travel or tourist accommodations (see Appendix A, Table A1).
Lenzen et al. (2018) [15] used a Multi-Regional Input–Output (MRIO) model to estimate the carbon footprint (CFP) of the global tourism industry, highlighting that the GHG emissions related to tourism have not been sufficiently quantified. They reported that the global CFP associated with tourism is increasing by 4% annually, rising from 3.9 GtCO2e to 4.5 GtCO2e between 2009 and 2013, accounting for about 8% of the world's GHG emissions. Transportation, shopping, and dining were identified as the main contributors. This methodology has been applied in case studies in various countries, including Australia [16], China [17,18], Iceland [19], Japan [20], New Zealand [21,22], Spain [23], the United Kingdom [24], and the United States [25]. Recent studies have also included evaluations considering the impact of COVID-19, with assessments conducted in countries like Japan [26] and Spain [27].
Tourism activities within a country are primarily supported by inbound tourism and domestic tourism, with each playing a unique role. Inbound tourism, involving foreign travelers visiting the country, brings significant economic benefits to the host nation [28]. The expenditure of foreign tourists on accommodations, transportation, food and beverages, and activities contributes to the local economy, creating employment and business opportunities, and stimulating the growth of local industries. Domestic tourism refers to the travel within the country by residents, driven by vacation periods or seasonal events, contributing to the national tourism industry and economy [29]. These forms of tourism are vital industries that generate economic benefits through cultural exchange, both domestically and internationally. Understanding the different market impacts and the preferences and demands of the different types of travelers is crucial for each travel form.
Although the measurement of emissions in the tourism industry is increasingly being reported internationally, a standardized method and scope of assessment have not yet been established. Input–Output LCA is mainly used for national-scale evaluations, but these typically focus on a single country or the entire world. Comparative and analytical studies on the differences in the tourism industry between countries are limited. The environmental impacts of COVID-19 vary by country, yet there are no instances of comparative assessments of these differences on a country-by-country basis. In this study, we targeted the G20 and applied a life cycle approach using the MRIO model to estimate the CFP of the tourism industry in each country before and after COVID-19.

2. Materials and Methods

2.1. System Boundaries

Figure 1 shows the system boundaries in this study. The assessment scope follows the traditional approach adopted in tourism evaluation, encompassing expenditures occurring before and after tourism activities. Pre-tourism expenditures include goods and services purchased in advance for use during travel. For example, this scope includes costs such as passport issuance and procurement of clothing for use during the trip. However, inbound tourism is not considered. This study focuses on tourism activities within a country, targeting consumption within the country. Similarly, post-travel expenditures, such as cleaning and photo printing, are included, but as the scope is within a country, inbound tourism is not considered.

2.2. Object of Evaluation

In this study, we calculated the CFP of the tourism industry for the G20 countries. We targeted 22 countries, as shown in Table 1, focusing on the years 2019 to 2021. The TSA shown in Table 1 represents the Tourism Satellite Account, and OECD refers to the data from the "OECD Tourism Trends and Policies [30]" published by the Organization for Economic Co-operation and Development (OECD). It is important to note that the years of creation for each country's TSA and OECD data vary, and the data publication typically lags by one to two years from the current year. The data used prioritized TSAs produced by each country, and where detailed data were unavailable, OECD data was used as the activity measure. It is crucial to note that the published years differ for each country. In this study, a comparison was made between two travel forms: inbound tourism and domestic tourism.
The scope of calculation in this study is based on the coverage of the assessment data by Kitamura et al. (2020) [20], encompassing six components: transport; souvenirs; accommodation; food and beverage; activities; and travel agencies, tour operators, and guides (see Table 2). The calculation items are based on the ISIC (International Standard Industrial Classification of All Economic Activities, Rev. 4 [31]), and the visualization of the current item status reflects the differences in data usage and TSA systems across countries. There is variation in the level of detail for these items by country, with some countries presenting them as aggregate values (see Appendix A, Table A2).

2.3. Input–Output Analysis

In this study, we utilized the MRIO Eora model. This methodology is based on Leontief (1970) [32] and is widely used in the field of Life Cycle Assessment (LCA) research. The formula used is as follows:
E n v i r o n m e n t a   l l o a d s = d I A 1 f k
where d is the direct environmental impact and (I−A)−1 is the Leontief inverse matrix.

2.4. Method for Calculation of CFP

In this study, the CFP was calculated using input–output analysis. The formula for this calculation is presented below.
CFP country, year = dc,y ( I - Ay) -1fc,y + DEc,y,i (i=1,…,n)
DEc,y = Fuel Purchases for Tourism Purposes ($) ÷ $/L (liter per Price) × 35 (The calorific value of 1L gasoline is 35MJ) × Carbon Intensity
In this study, we adopted the calculation model of Kitamura et al. (2020) [26]. Here, dc,y represents the direct GHG emissions related to each sector in the MRIO Eora model for each target country and year, and A denotes the input coefficient matrix. I is the identity matrix, (I-A)-1 is the Leontief inverse matrix, and fc,y is the tourism consumption amount for each country in the target year, which was obtained from the Tourism Satellite Account (TSA) or OECD data [30]. Moreover, DEc,y,i in equation (2) indicates the direct emissions from fuel combustion. For calculating direct emissions, the IEA End-Use Prices Data Explorer [33] was used to convert gasoline costs into liters, and IDEAv3.3 was used for the Carbon Intensity. These values represent the calorific content during fuel combustion. This equation extends the entire life cycle, calculating the environmental impacts from cradle to grave. Note that while all MRIO data is denominated in USD, the TSAs used for each country in this study are denominated in the local currency. To integrate this with the MRIO, the average annual exchange rates published by the World Bank [34] were used for USD conversion.
The TSA is a statistical data tool for estimating the direct economic and employment effects in the tourism industry that was developed by UNWTO, OECD, Eurostat, and the United Nations Statistics Division. The UNWTO has provided the international standard "TSA Recommended Methodological Framework 2008" (TSA: RMF08) [35]. The definition of a tourist in the TSA is "A visitor is a traveler taking a trip to a main destination outside his/her usual environment for less than a year and for any main purpose (business, leisure or other personal purpose) other than to be employed by a resident entity in the country or place visited (IRTS 2008)." This includes data for medium- and long-term trips, including business travel, which are reported to be important data for future measurements of emissions in the tourism industry. The year of TSA production varies by country, and the data publication typically lags by one to two years from the current year.
In this study, we conducted separate analyses for domestic tourism and inbound tourism. The definitions of each are as follows.
Domestic tourism refers to tourism activities occurring within a country. It consists of activities of travelers residing in the target country, either as part of domestic travel or as part of travel abroad.
Inbound tourism refers to tourism activities conducted by non-resident travelers in a non-resident country. This includes foreign tourists' actions using tourist sites, accommodations, and local services at the destination. Travel from the place of origin to the destination is not included, and the focus is on consumption at the destination.

3. Results

This section presents the analysis results for domestic tourism and inbound tourism, which were divided into two periods: before and after COVID-19. Additionally, the TSA conducted detailed analyses in some countries.

3.1. Pre-COVID-19

3.1.1. All Tourism (Domestic + Inbound)

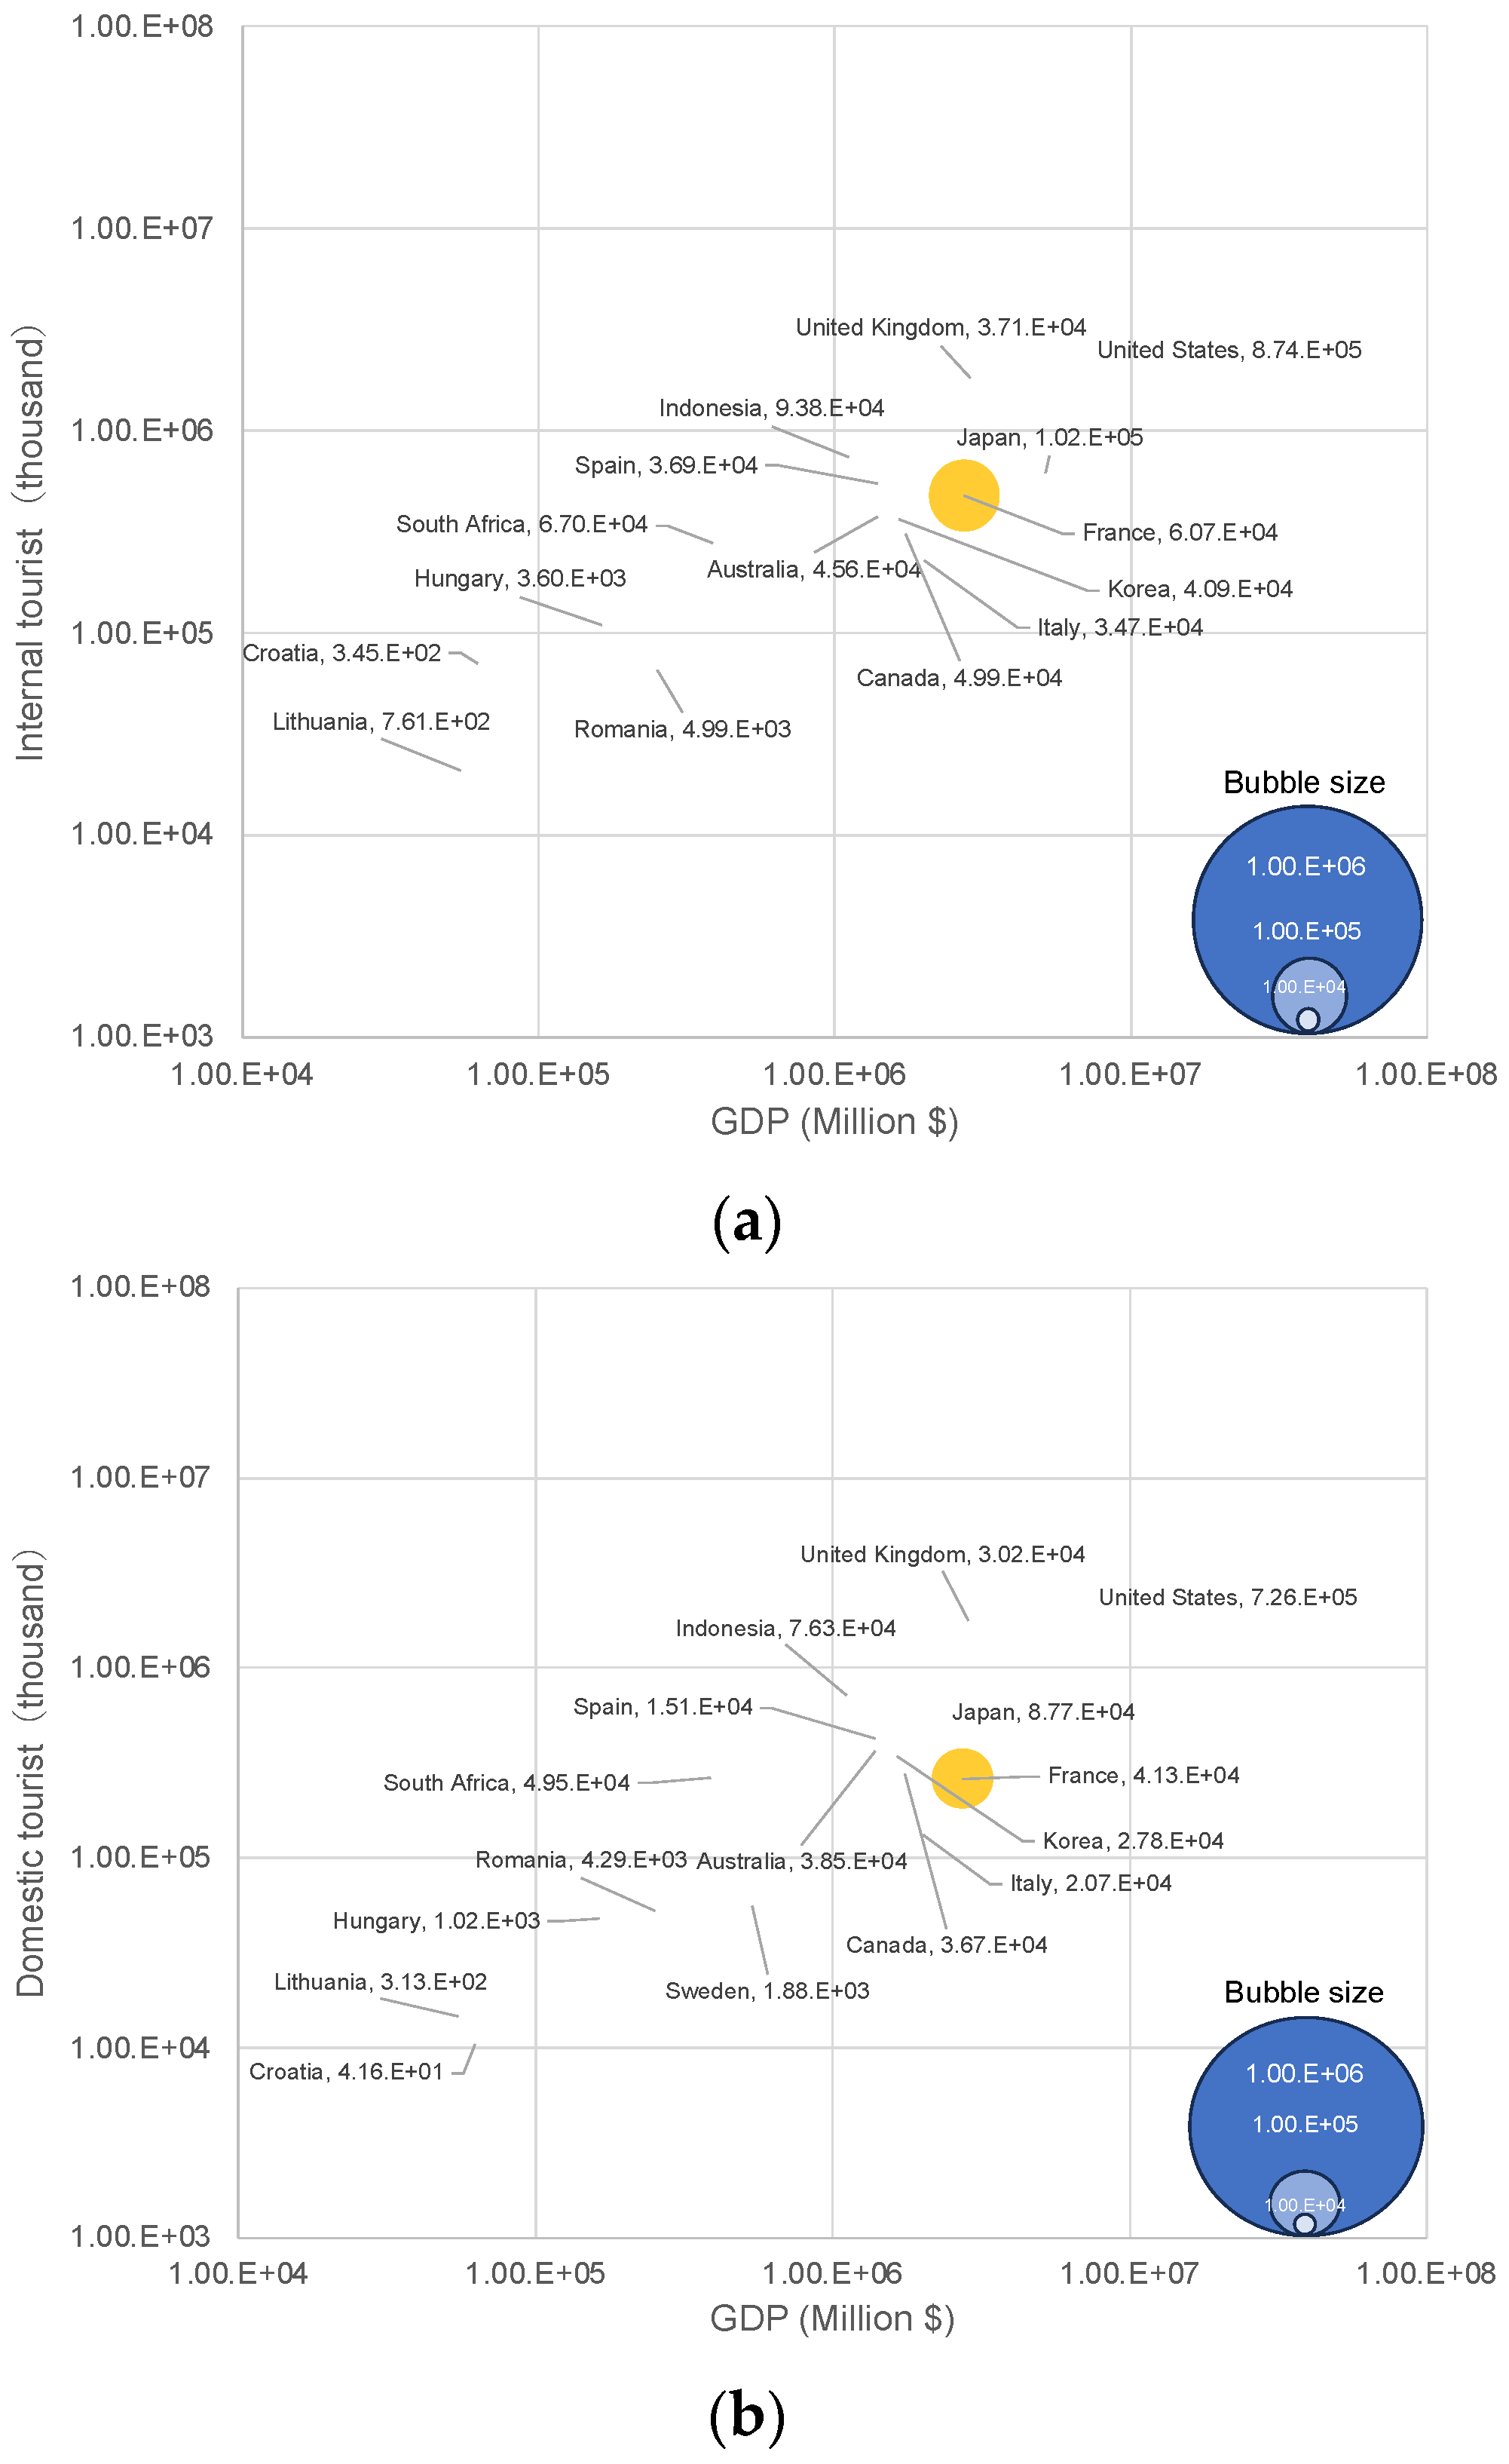
Figure 2(a) shows the relationship between the GDP, the number of tourists, and GHG emissions in both domestic tourism and inbound tourism combined. There is a tendency for countries with higher tourist numbers and GDP values to have higher GHG emissions from tourism. Notably, the United States had the highest GHG emissions, approximately 870,000 kt-CO2e, accounting for about 53% of the total. While the GHG emissions were also substantial in EU countries, some, like the United Kingdom, had lower emissions relative to their GDP and tourist numbers. On the other hand, the GHG emissions from tourism in developing countries were significantly lower, about three orders of magnitude smaller than in the United States. South Africa, despite having a lower GDP than the G7 countries, showed a tendency for higher GHG emissions.

3.1.2. Domestic Tourism

Figure 2(b) shows the relationship between GDP, the number of tourists, and GHG emissions in domestic tourism. It was found that the GHG emissions from domestic tourism account for about 80% of the total, significantly influencing the overall trend. The United States recorded the highest GHG emissions in this category, approximately 720,000 kt-CO2e, accounting for about 63% of the total. This is followed by Germany with approximately 98,000 kt-CO2e and Japan with 87,000 kt-CO2e, with the G7 countries accounting for a major portion of the emissions. The total emissions from the G7 countries comprised about 80% of the combined emissions from domestic and inbound tourism. On the other hand, the countries with the lowest emissions were Croatia with about 41 kt-CO2e, which is significantly lower than the United States by four orders of magnitude. The United States differs greatly from Croatia, with approximately 82 times the GDP and 56 times the number of domestic tourists.
Countries like South Africa and Indonesia, despite having fewer tourists than the G7, tend to have higher GHG emissions. In terms of emissions per domestic tourist, the United States had the highest emissions with about 0.3 t-CO2e/tourist, followed by South Africa with 0.2 t-CO2e/tourist. On the other hand, the United Kingdom, despite having a high number of tourists, tended to have lower GHG emissions. The emission per domestic tourist was about 0.02 t-CO2e/tourist, which is on par with countries like Lithuania and Hungary.

3.1.3. Inbound Tourism

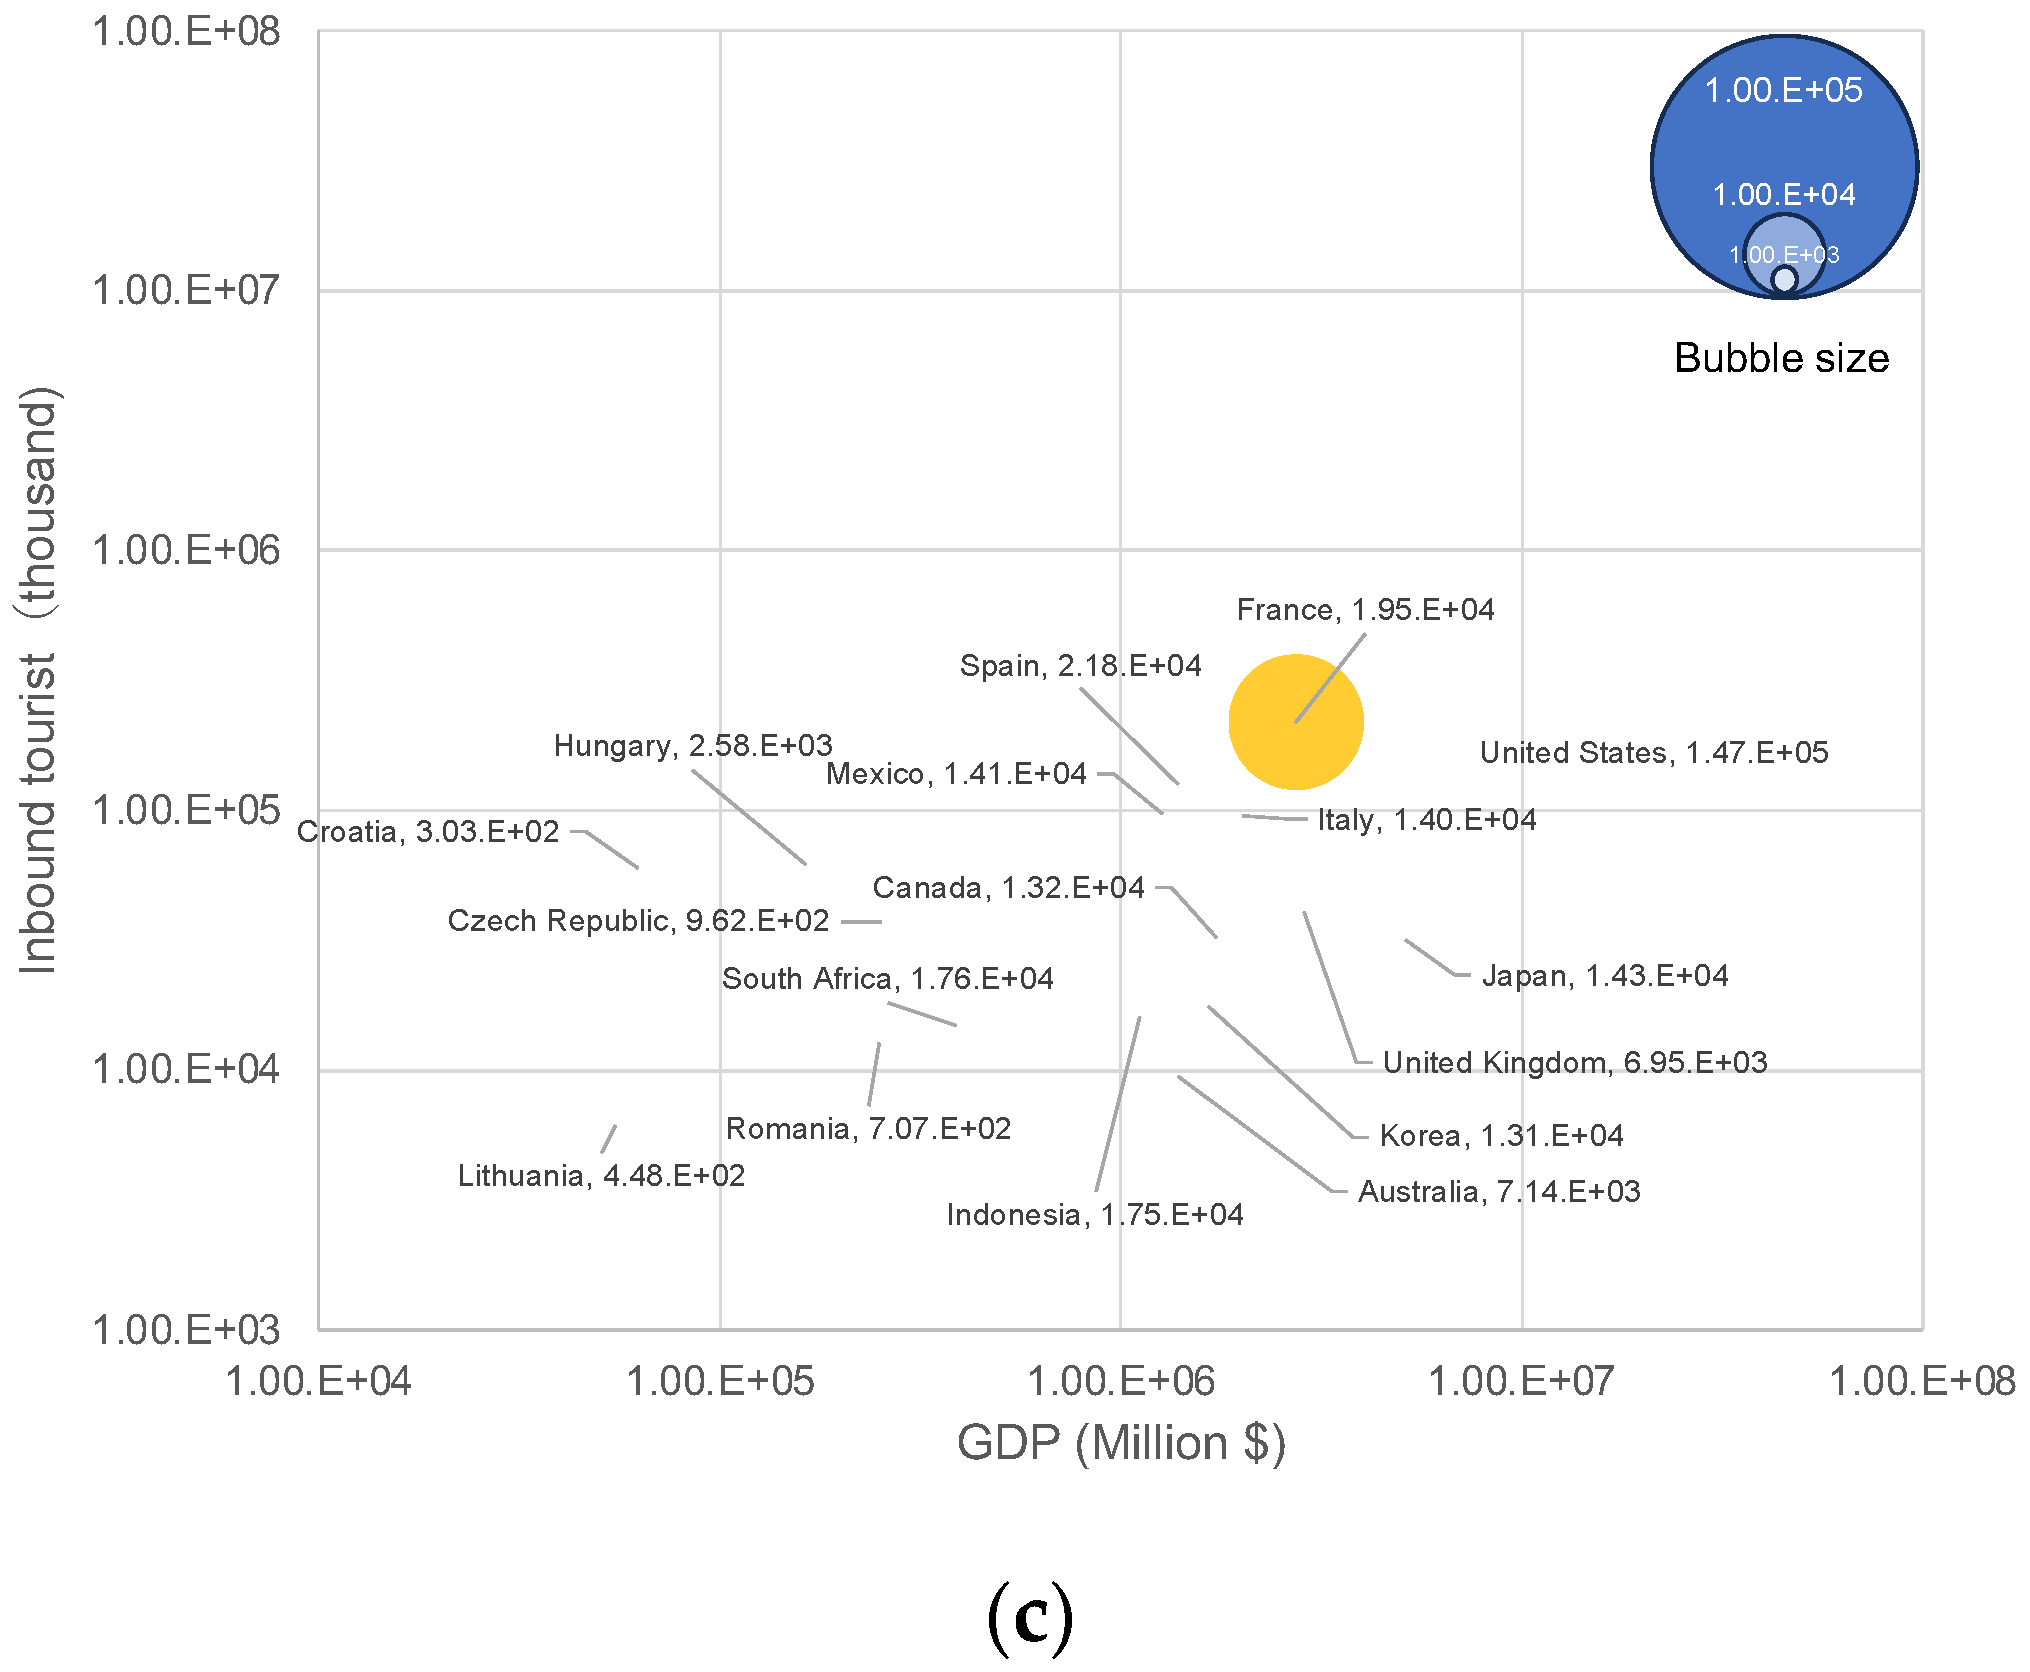
Figure 2(c) shows the relationship between GDP, the number of tourists, and GHG emissions in inbound tourism. The United States again had the highest GHG emissions in this category, approximately 147,000 kt-CO2e, accounting for about 47% of the total. This is similar to the trend observed in domestic tourism, indicating that the United States is a global leader in tourism-related emissions. In the EU, countries like Spain (approximately 22,000 kt-CO2e) and France (about 19,000 kt-CO2e) had notable emissions, contributing significantly to the GHG emissions from inbound tourism. In particular, in Spain, Portugal, Hungary, and Croatia, over 70% of their GHG emissions are attributed to inbound tourism, indicating the substantial impact of foreign tourists on their emissions.
Inbound tourists are fewer in number and show a different trend compared to domestic tourists. In particular, South Africa and Indonesia, despite having fewer tourists than the G7 countries, tended to have very high GHG emissions (approximately 18,000 kt-CO2e), ranking fourth and fifth in emissions from inbound tourism, respectively. This is supported by the very high emissions per tourist, which were about 1.2 t-CO2e/tourist in South Africa and about 1.1 t-CO2e/tourist in Indonesia, suggesting that tourism in these countries has a particularly large environmental impact. On the other hand, Spain and France were among the countries with the highest number of inbound tourists, and it is believed that this number is impacting their GHG emissions.

3.1.4. Domestic Tourism

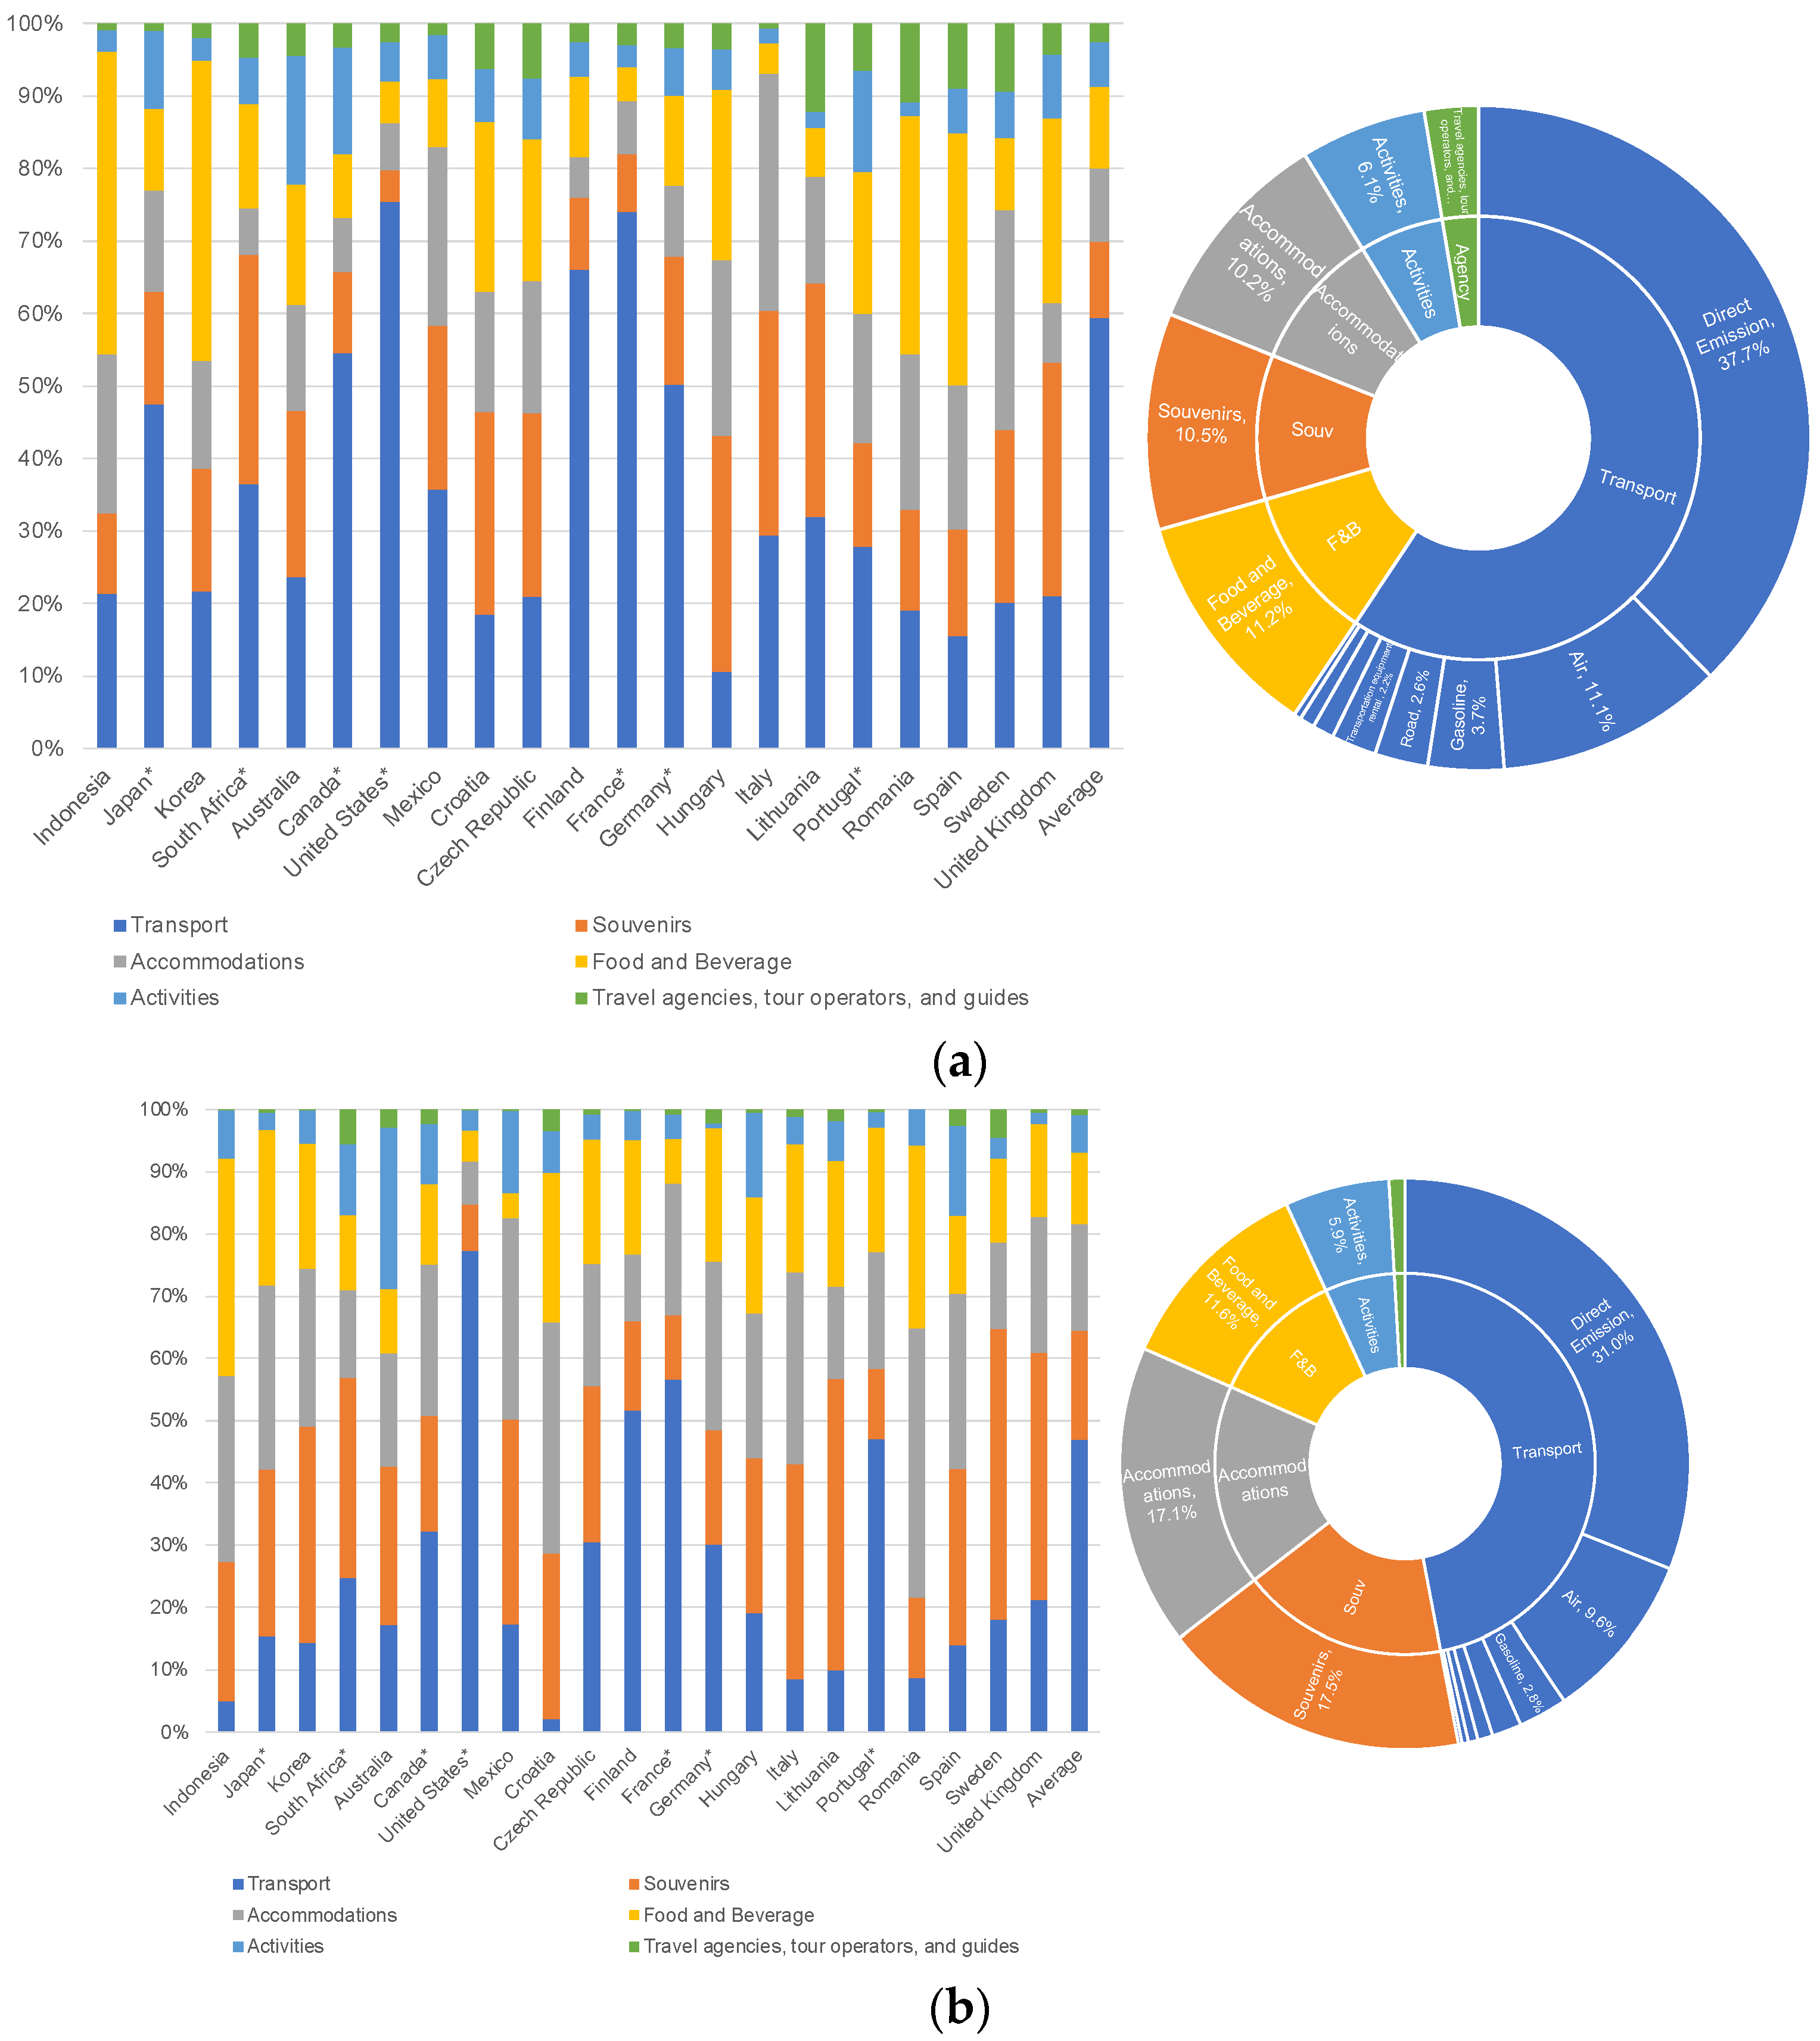
Figure 3(a) shows the proportion of emissions by life cycle from domestic tourism for each country. In the breakdown of the life-cycle-specific CFP in 21 countries, transportation accounted for about 60% (including 36.7% from direct emissions due to gasoline combustion, 10.8% from aircrafts, 3.6% from gasoline, etc.), while souvenirs, accommodations, and food and beverages each contributed about 10%. The contributions from activities and travel agencies, tour operators, and guides were small. Transportation, especially direct emissions from gasoline combustion in passenger cars, was a major contributor, accounting for more than half of the emissions.
Countries where transportation accounts for more than half of the emissions included Canada, the United States, Finland, France, and Germany. In some EU countries, the impact of transportation was lower, and souvenirs, accommodations, and food and beverages had larger contributions. The highest contributions from souvenirs were seen in Croatia, the Czech Republic, Hungary, Lithuania, and the United Kingdom, i.e., mostly in the EU. For accommodations, Italy and Sweden stood out, while for food and beverages, it was Indonesia, South Korea, Romania, and Spain.
Indonesia and South Africa tended to have fewer tourists but higher GHG emissions. The main source of emissions in Indonesia was from food and beverages, accounting for about 42%. In Indonesia, land expansion for food production and high food waste and loss have been reported [38]. Within this context, the largest source of GHG emissions in the agriculture sector is rice cultivation, accounting for 39%. In South Africa, the impact of transportation was the highest. Land transportation contributed significantly to this. The transportation sector is the fastest-growing source of GHG emissions in South Africa, accounting for about 10.8% of total emissions. Within this sector, road transportation is responsible for 91.2% [39]. There is a call for a transition to environmentally friendly transportation systems, with initiatives like promoting the use of electric vehicles, strengthening public transport, and improving energy efficiency and emission management. These efforts aim to contribute to climate change mitigation, raise awareness for sustainable mobility, and transition to a more climate-resilient transportation system.
The United Kingdom has the characteristic of having lower GHG emissions relative to its number of tourists. Transportation in the U.K. contributed approximately 40% less than the average of all countries. The GHG emissions associated with domestic travel in the U.K. have been decreasing since 1990, with a reported reduction of about 5% in 2019 compared to 1990. The decrease in emissions can be attributed to factors such as improved fuel efficiency, changes in transport policies, and a shift to low-emission vehicles. In 2018, there was a 20% increase compared to the previous year in the registration of ultra-low emission vehicles (ULEVs), totaling 64,000 new registrations [40]. Additionally, the reduction in diesel fuel taxes encouraged a transition to vehicles with lower CO2 emissions. These factors, combined, have contributed to the reduction in GHG emissions associated with domestic travel in the U.K., marking a progression towards sustainable practices across the entire transportation sector.

3.1.5. Inbound Tourism

Figure 3(b) shows the proportion of emissions by life cycle from inbound tourism for each country. In the breakdown of the life-cycle-specific CFP in 21 countries, transportation accounted for about 50% (including 31% from direct emissions due to gasoline combustion, 9.6% from aircrafts, 2.8% from gasoline, etc.), souvenirs and accommodations accounted for about 17% each, and food and beverages about 11%, with smaller contributions from activities, travel agencies, tour operators, and guides. Although the emissions from transportation in inbound tourism were high, they were about 10% lower compared to domestic tourism, while the impacts from accommodations and souvenirs were, respectively, about 7% and 8% higher.
In particular, within the G7, when considering Japan and the United Kingdom as examples, the major emission contributors in the life cycle of inbound tourism were accommodations and souvenirs (30% and 27% for Japan, and 22% and 40% for the United Kingdom, respectively). The longer average length of stay, with Japan at 8.8 nights [41] and the U.K. at 7.1 nights [42], contributed to the higher emissions from accommodations.
Countries where contributions from souvenirs were the highest included South Korea, South Africa, Mexico, Hungary, Italy, Lithuania, Sweden, and the United Kingdom. For accommodations, the leading countries were Japan, Croatia, and Romania, while Indonesia was noted for food and beverages, and Australia for activities.
Spain and France had a high number of inbound tourists, and consequently, they exhibited high GHG emissions. In Spain, over 50% of the impact was due to souvenirs and accommodations. In France, the transportation sector had a high contribution, about 10% more than the average [43]. The majority of GHG emissions from transportation in France came from road transport. Within the transportation sector, road transport accounted for 93.8% and was responsible for most of the sector's increase in emissions. In particular, emissions from heavy goods vehicles, utility vehicles, and personal vehicles are increasing. Although there are goals and incentives to support the transition to electric and plug-in hybrid vehicles, a significant increase is needed to achieve the widespread adoption of electric vehicles and the establishment of charging infrastructure targets.
Lenzen et al. (2018) [15] calculated emissions for inbound, domestic, and outbound tourism. They reported the composition of GHG emissions as transportation 49.1%, souvenirs 12%, accommodations 6.4%, food and beverages 5.1%, and services 7.9%. "Services" in their study correspond to "Activities" in this study. Kitamura et al. (2020) [20] included the same three travel forms in their study of Japan's tourism industry, reporting emissions as transportation 56.3%, souvenirs 23.2%, accommodations 9.8%, food and beverages 7.5%, and activities 3%. The impact of transportation was reported to be significant even compared to the global average. When focusing solely on Japan, the proportion of transportation and souvenirs was lower, indicating differences. The consumption of goods and the provision of experiential services vary by country, leading to differences at the national level.
The total emissions from tourism were primarily due to domestic tourism, and the number of domestic tourists and GHG emissions were higher than those of inbound tourism. However, for inbound tourism, the GHG emissions per tourist tended to be higher than for domestic tourists. In particular, in the United States and Indonesia, the emissions per inbound tourist were about 10 times higher than those per domestic tourist. This trend indicates that while domestic tourism has a significant impact on GHG emissions, tourists from abroad tend to have relatively higher emissions. It has become evident that in both domestic and inbound tourism, the majority of GHG emissions come from transportation, especially direct emissions from gasoline combustion. Additionally, in some countries, souvenirs, accommodations, and food and beverages significantly contribute to GHG emissions.

3.2. After COVID-19

3.2.1. Domestic Tourism

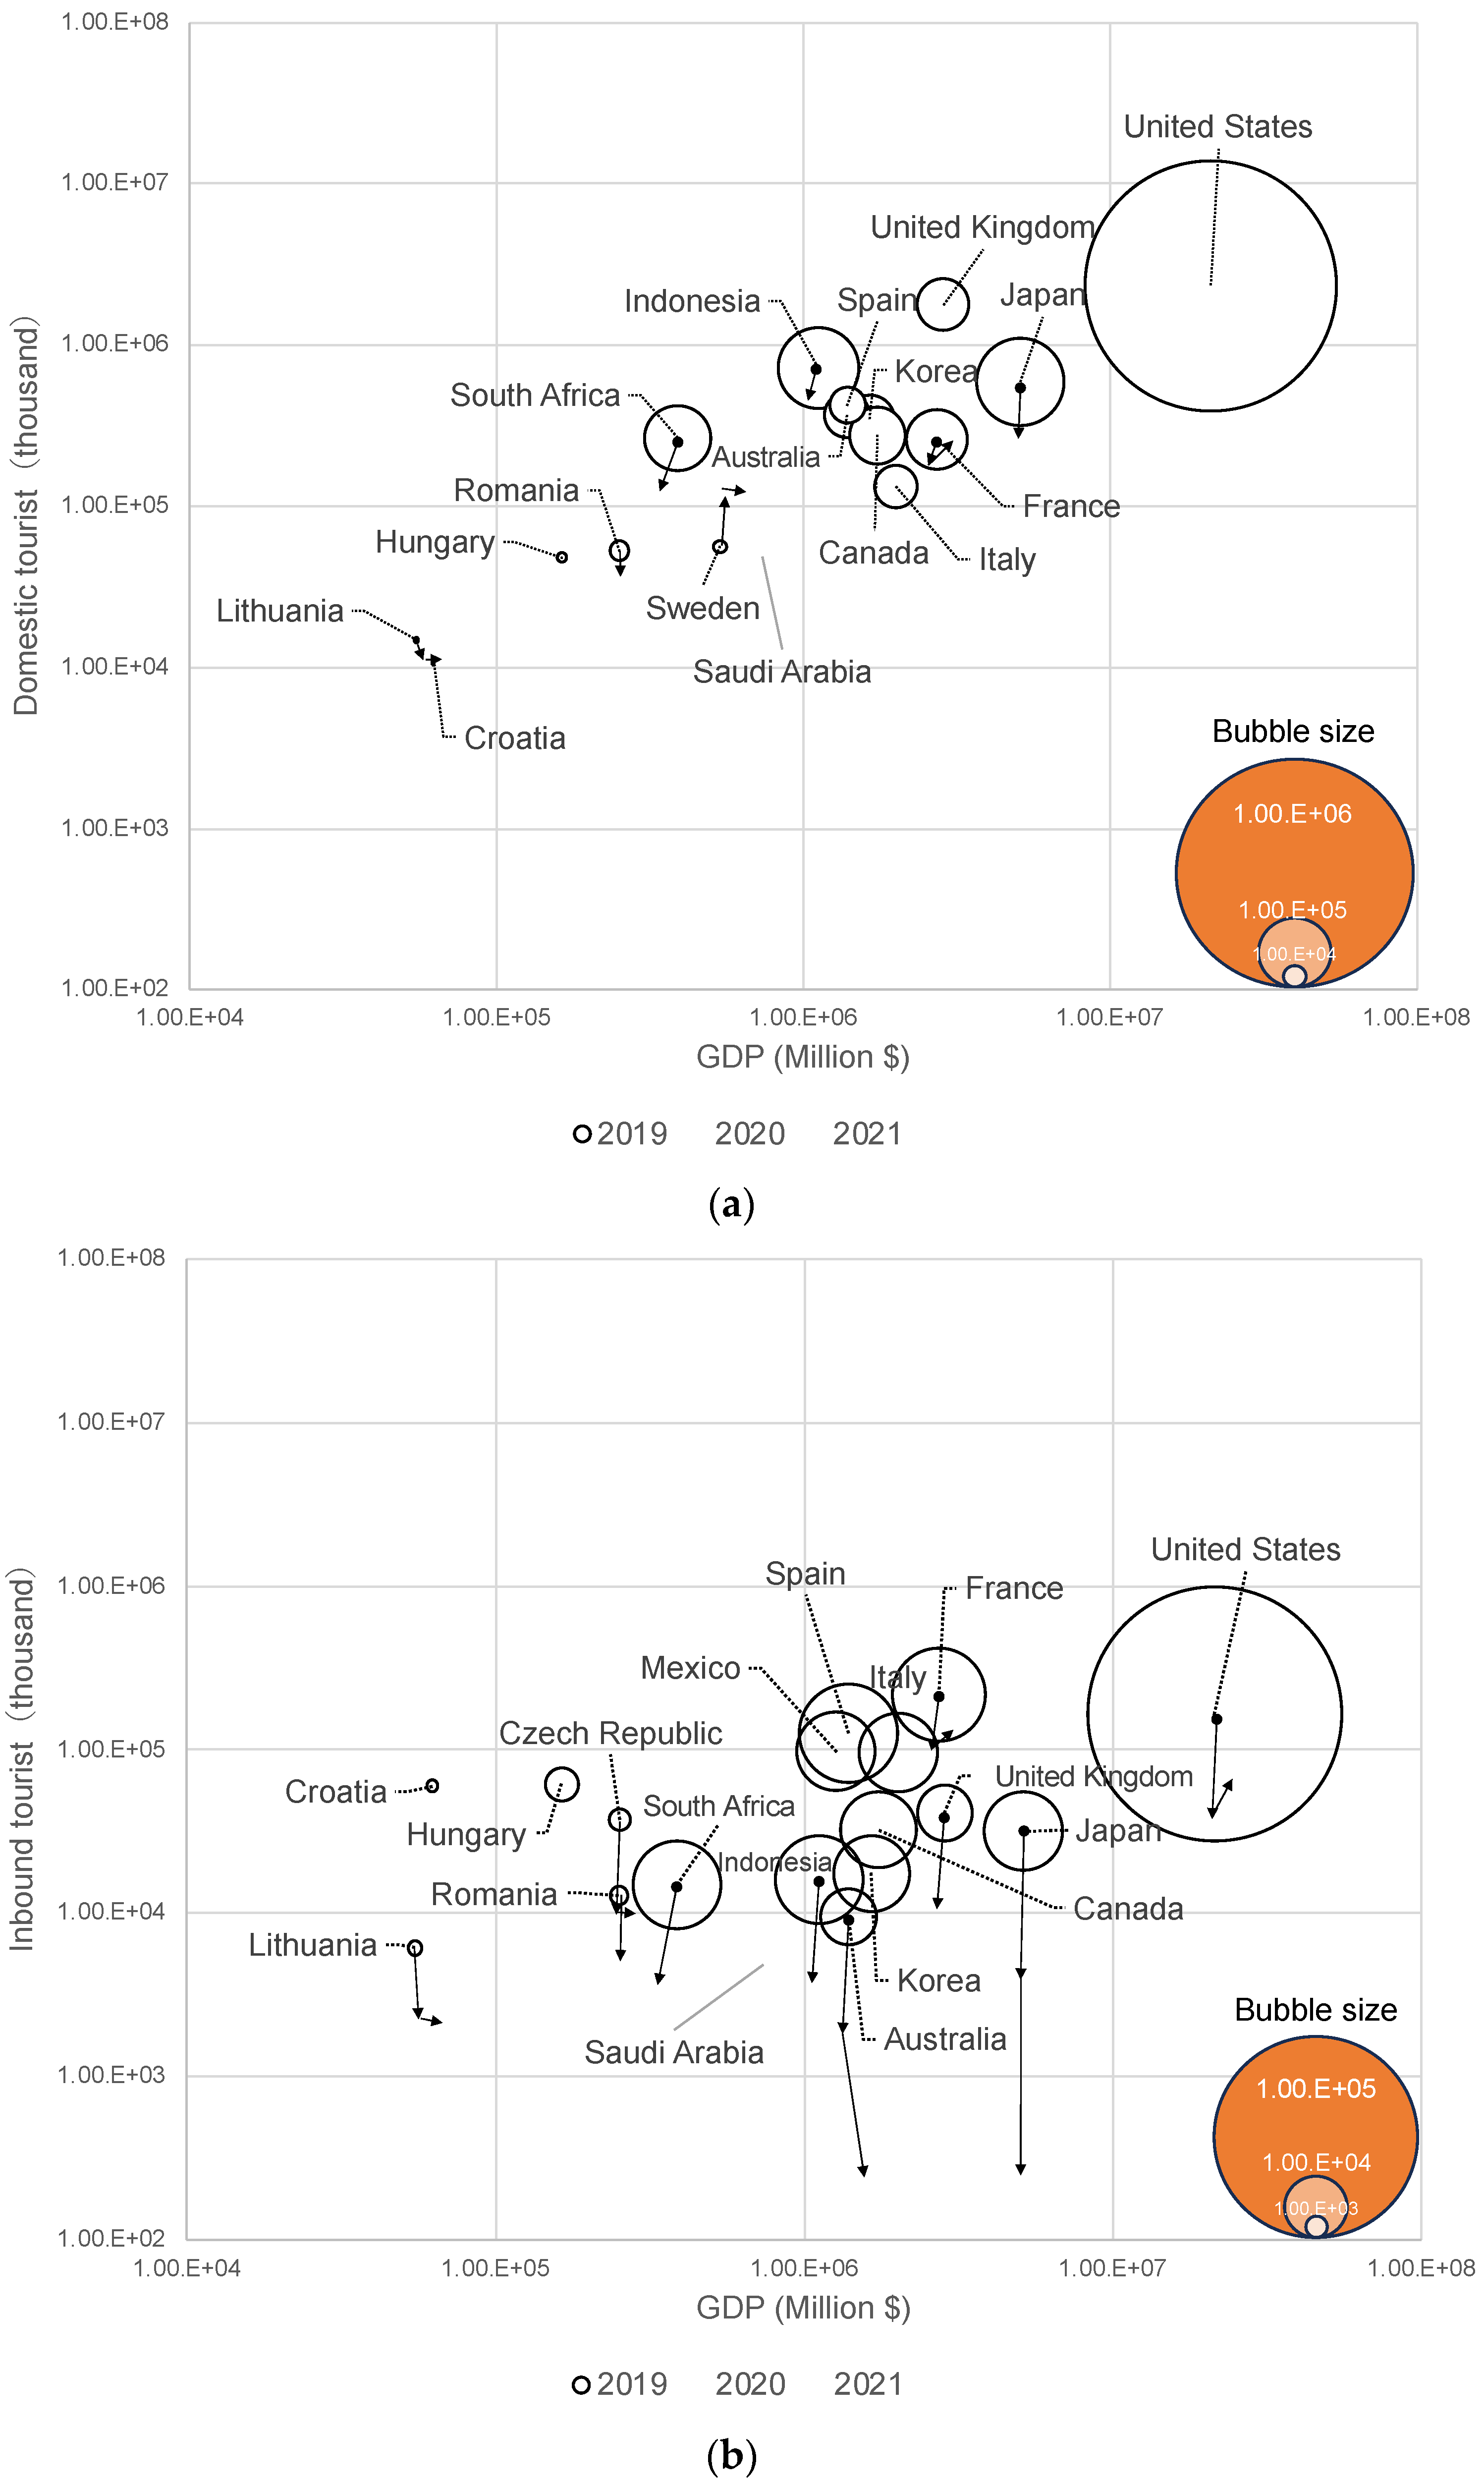
Figure 4(a) shows the relationship between GDP, the number of tourists, and GHG emissions in domestic tourism for the years 2019 to 2021. The y-axis represents the number of tourists, the x-axis represents the GDP of each country (in Million USD), and the size of the bubbles indicates the GHG emissions (in kt-CO2e). The numbers in the figure indicate the GHG emissions. Tourist numbers are referenced from the UNWTO and OECD data, but there are countries where information could not be obtained (see Appendix A, Table A3).
In 2020, compared to 2019, the GHG emissions from domestic tourism decreased by an average of about 38%. The United Kingdom saw a reduction of about 60%, and Indonesia about 58%, making them the countries with the most significant decreases. In contrast, Australia had a reduction of 11.7% and Finland 13.5%, comparatively lower decreases. In the EU countries, the change in emissions varied by country, with significant decreases in some countries, while others remained relatively stable.
The number of tourists decreased by about 18% on average in 2020 compared to 2019. In the U.K., domestic travel restrictions implemented on March 21, 2020, contributed to this decrease. Indonesia imposed similar restrictions around the same time. Finland, after temporary restrictions, saw the domestic tourism demand approach 2019 levels during the summer but declined again after September due to stricter measures [44,45]. Despite Australia imposing domestic travel restrictions at the end of March, the decrease in domestic tourists was about 35%, which is relatively low. This is attributed to state-level measures, such as in Western Australia, where there were fewer travel restrictions and state borders were closed, leading to Western Australians holidaying within their state, resulting in minimal disruption to the tourism industry [46]. Additionally, in 2020, there was a significant increase in caravan and camper registrations in states like New South Wales in Australia, indicating a rise in demand for new forms of travel during restrictions [47].
In 2021, the GHG emissions from tourism were about 14% lower than in 2019, with many countries showing a recovery trend. Australia and Spain saw only about a 2% decrease, returning to pre-COVID-19 levels, while Japan continued to decrease by about 50% in 2020 and about 55% in 2021. Lithuania saw an increase beyond the 2019 emissions levels.
The average decrease in tourist numbers in 2021 was 5% compared to 2019. In Japan, domestic travel restrictions were implemented due to emergency declarations and focused measures over these two years. Sweden reported a near doubling of tourist numbers in 2020 and 2021 compared to 2019 and was the only country not to see a decrease during the pandemic. Sweden did not implement travel restrictions from 2020 to 2021, keeping policies at a recommended level [48]. Compared to many other countries, Sweden's response to COVID-19 was not as stringent, avoiding lockdowns, keeping bars and restaurants open, encouraging remote work, and minimizing travel [49].
Appendix A, Table A4 compiles the annual data based on the average monthly data from the Oxford COVID-19 Government Response Tracker (OxCGRT) on restrictions on internal movement. The level of measures for internal movement varied by country, but starting from April 2020, most countries implemented recommendations or measures for travel restrictions across regions/cities. In particular, in Australia, the U.S.A., and Mexico, travel restrictions were in place starting in April and lasting throughout the year. On the other hand, some EU countries, except the U.K. and Spain, had less stringent measures, with recommendations or no measures for travel restrictions.

3.2.2. Inbound Tourism

Figure 4(b) shows the relationship between GDP, the number of tourists, and GHG emissions in inbound tourism. In 2020, compared to 2019, the GHG emissions from inbound tourism decreased by about 72%, a more significant reduction than in domestic tourism. The countries with the largest decrease in GHG emissions were Australia (about 97%) and the United States (about 84%), while France had the lowest reduction rate at about 43%. Some EU countries like Lithuania and Sweden saw a moderate decrease of about 54%.
The average reduction rate in the number of tourists was about 69% in 2020 compared to 2019. In Australia, the early implementation of border closure measures starting in February 2020 was a factor. The Australian government imposed extensive international travel restrictions from mid-March 2020, including cruise ship docking restrictions, entry restrictions, and mandatory quarantines. These restrictions impacted individuals and businesses across various sectors, including international tourism, travel, aviation, and education [50]. The United States did not impose a full lockdown in 2020 but set entry restrictions for tourists from specific European countries, China, and Iran. Starting in March 2020, 27 states and Washington D.C. enacted travel restrictions during the pandemic [51].
In 2021, the GHG emissions from inbound tourism were about 57% lower than in 2019. The average reduction in tourist numbers was 68% in 2020 compared to 2019. However, Japan saw further decreases, with about 77% in 2020 and about 90% in 2021. Japan implemented measures such as banning entry from certain regions from February 1, 2020, and imposed stricter measures from December 28, 2020, to December 31, 2021, banning entry from all regions.
The average reduction rate in tourist numbers was 67% in both 2020 and 2021 compared to 2019. Japan and Australia continued to see a further decline in tourist numbers. Compared to 2019, numbers for Japan decreased by 87% in 2020 and 99% in 2021, while those for Australia decreased by 81% in 2020 and 97% in 2021. Both Japan and Australia continued border closure measures for about two years from March 20, 2020, to October 31, 2021. This strict response was unique to Japan and Australia, while other countries imposed partial entry bans or relaxed regulations.
Appendix A, Table A5 compiles the annual data based on the average monthly data from the Oxford COVID-19 Government Response Tracker (OxCGRT) [48] on international travel controls. Unlike domestic movement restrictions, border control measures were implemented early in various countries. In particular, strict measures were taken in Australia, with most countries imposing entry bans from certain regions beginning in April 2020. In 2021, Japan implemented stricter border control measures than the previous year, while Australia continued its policies.

3.2.3. Domestic Tourism

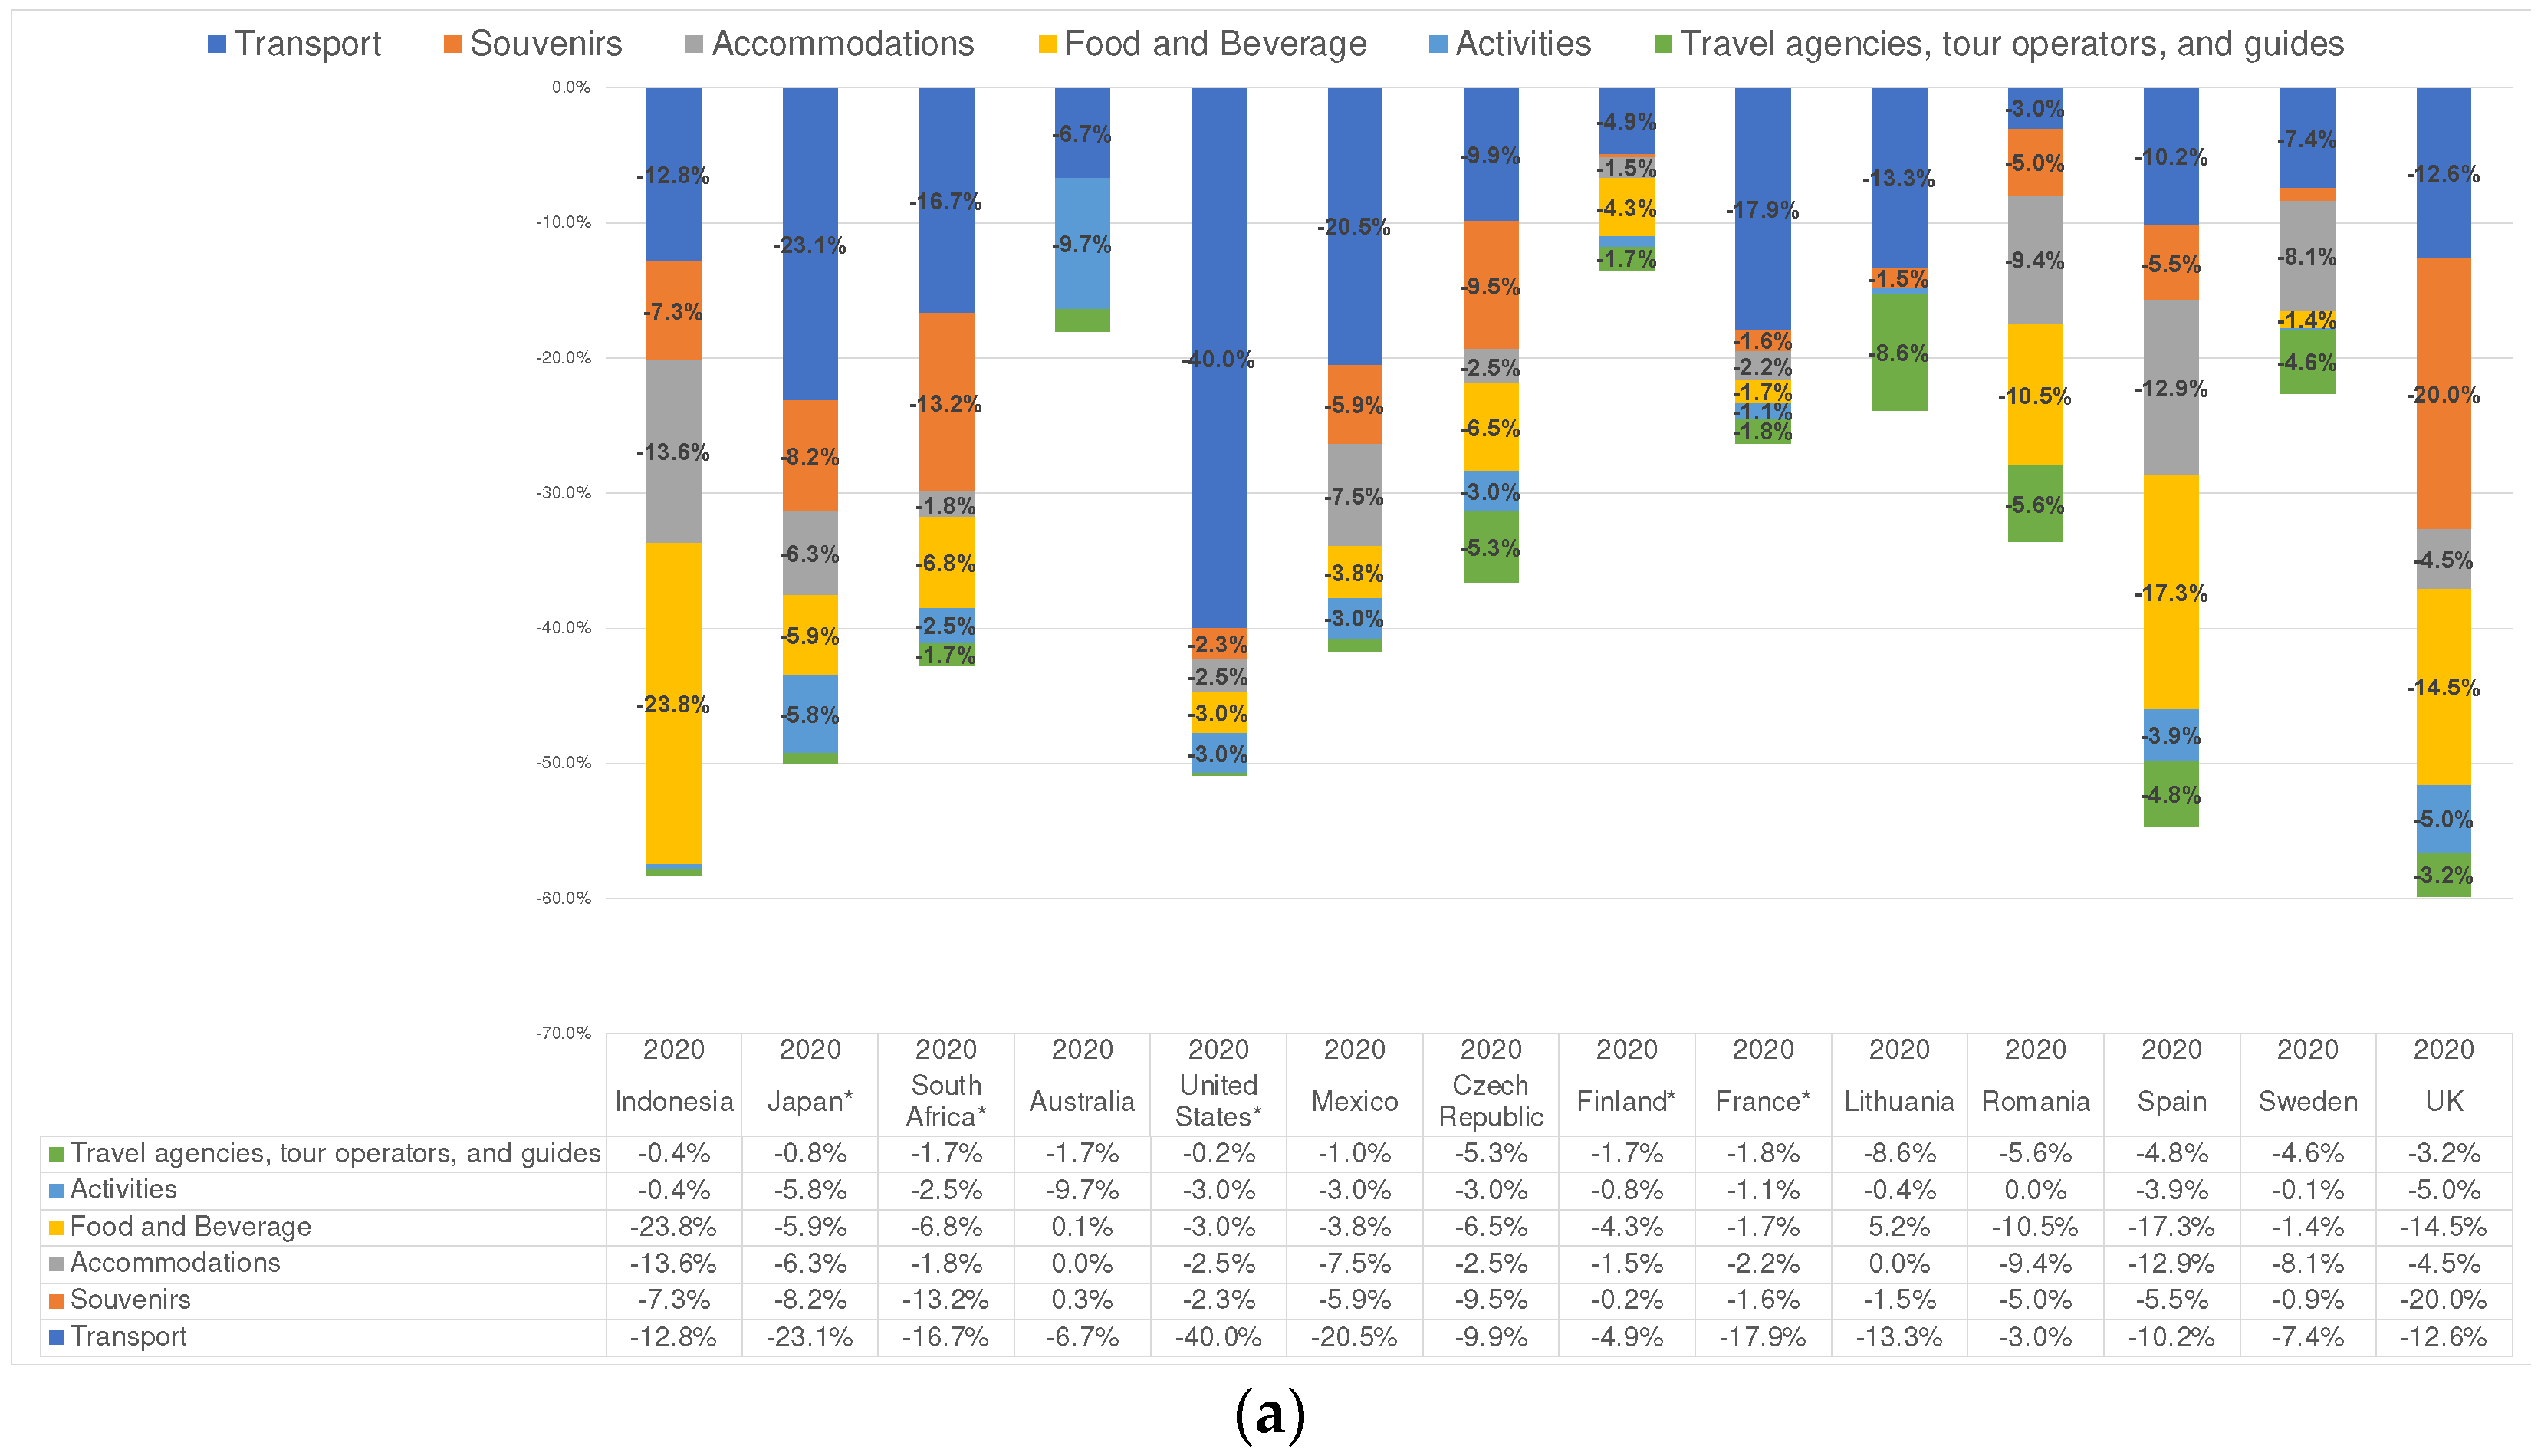
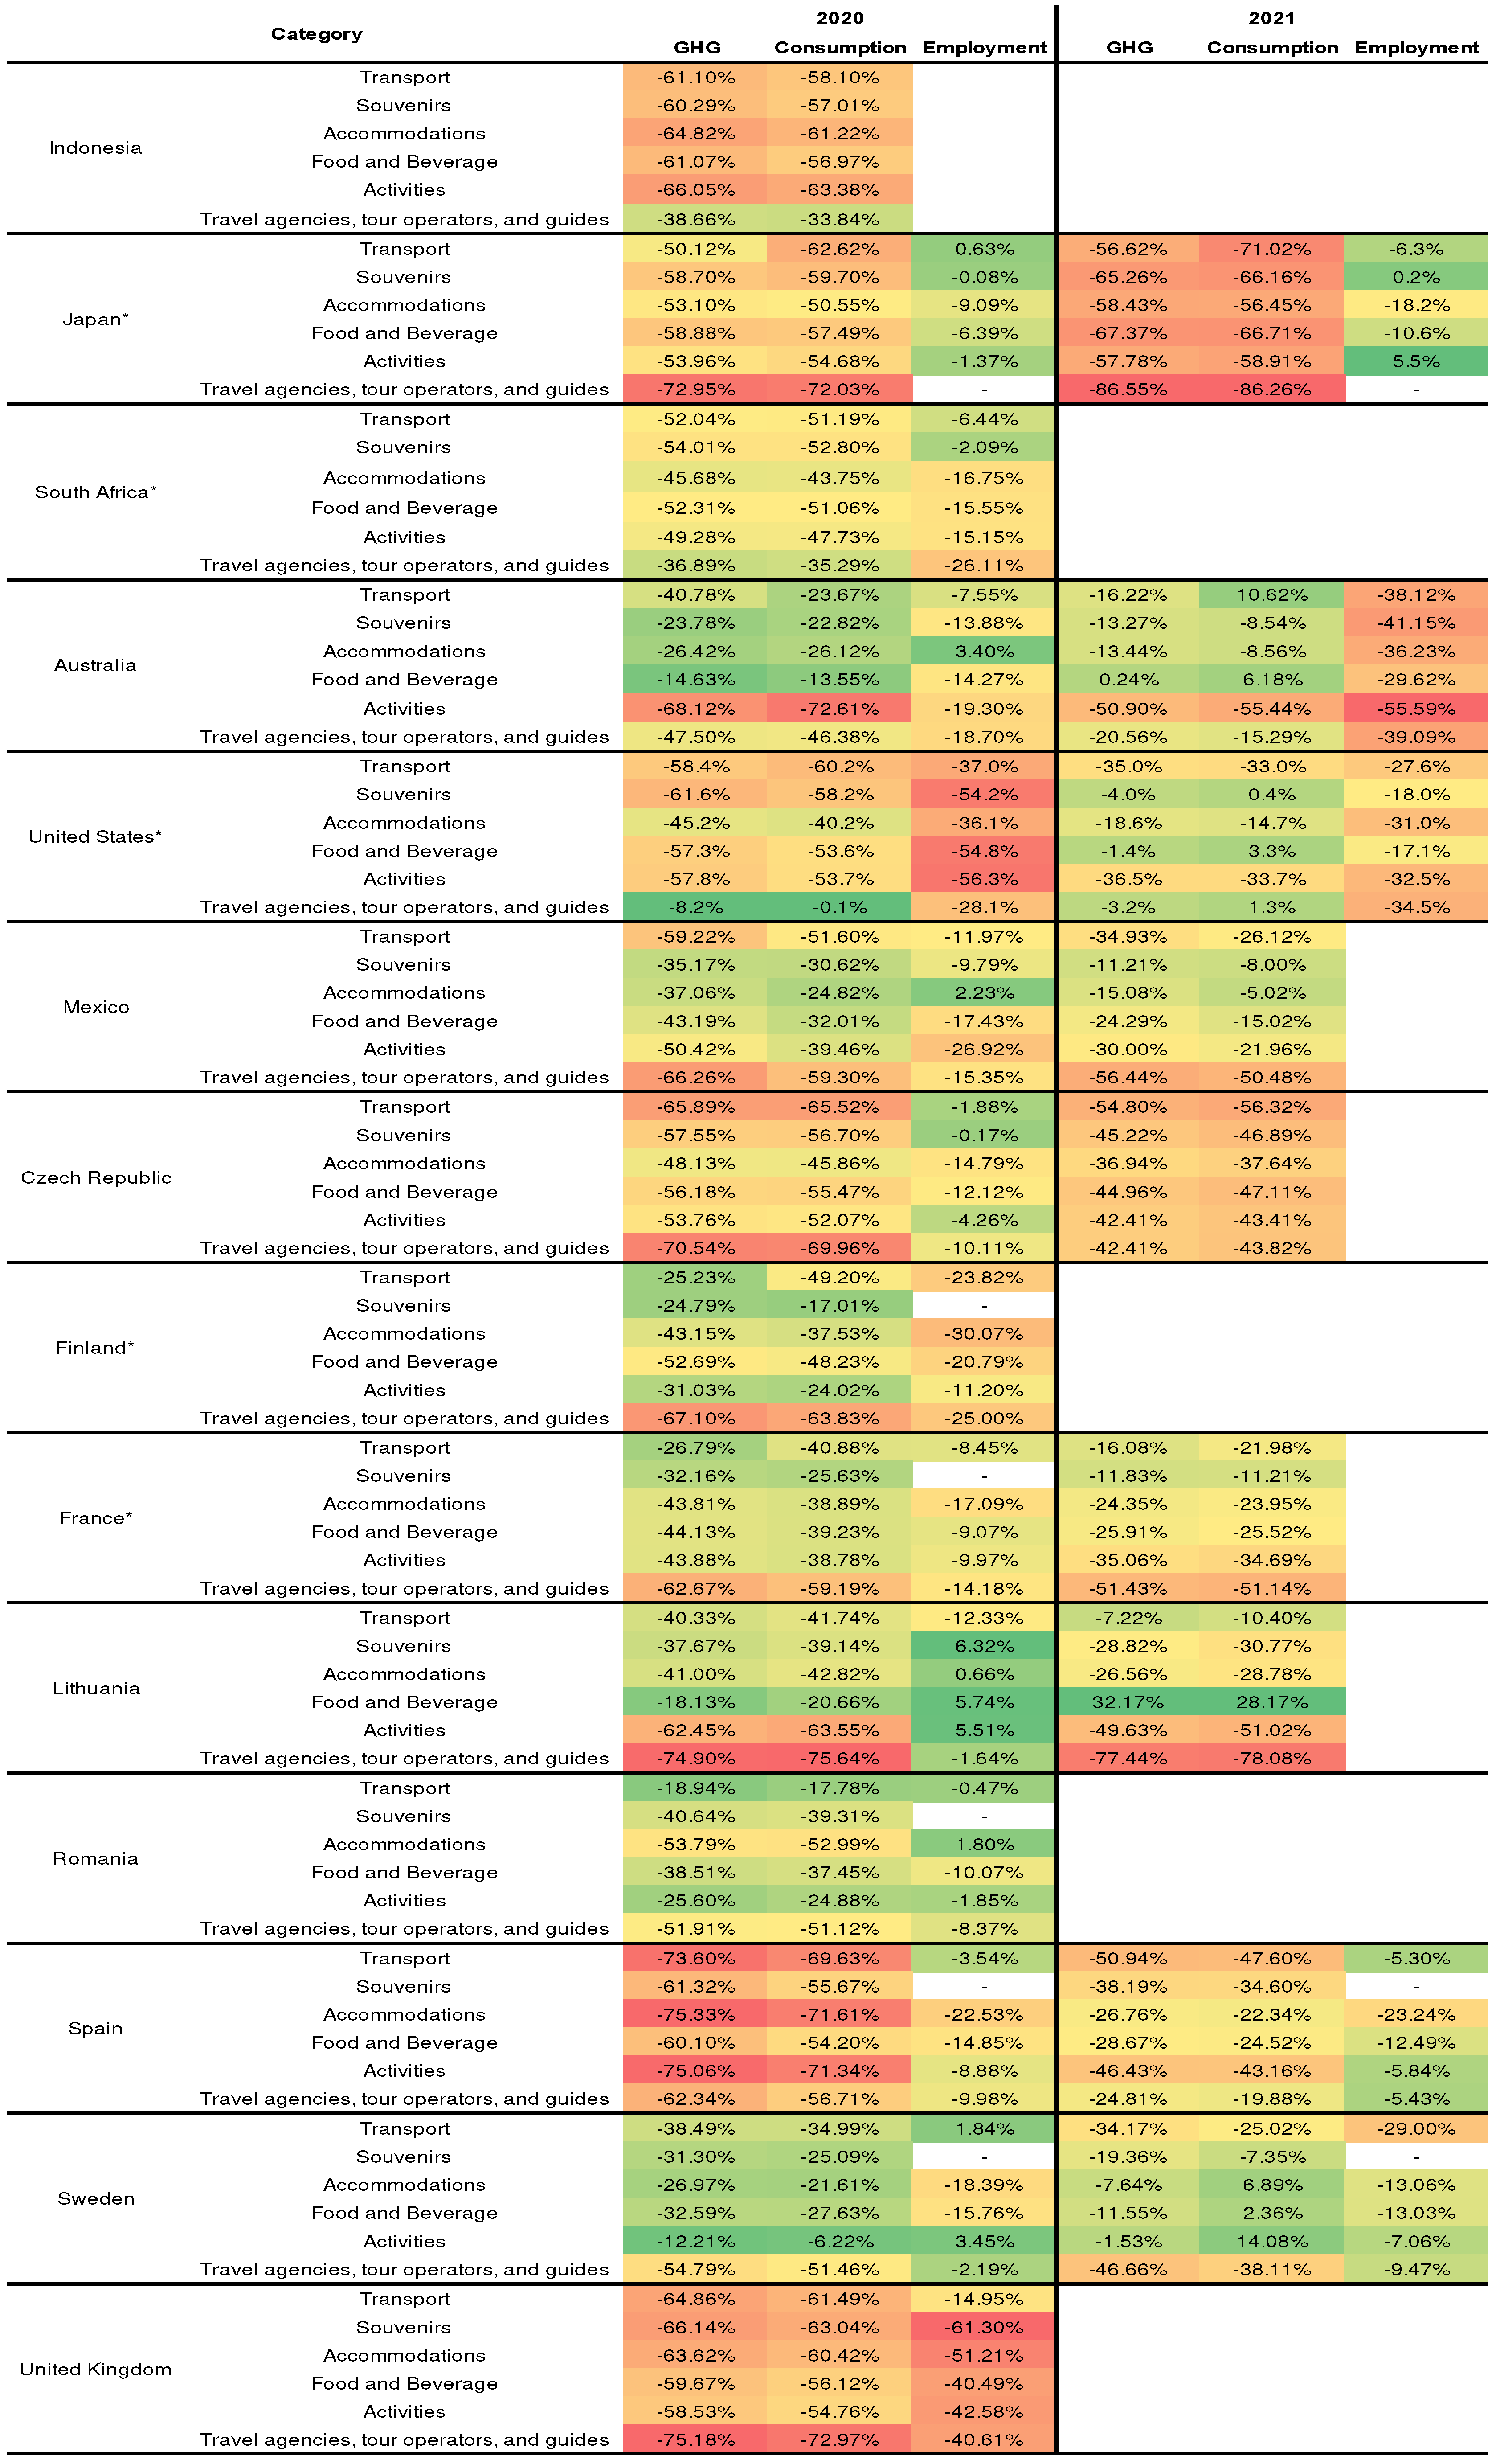
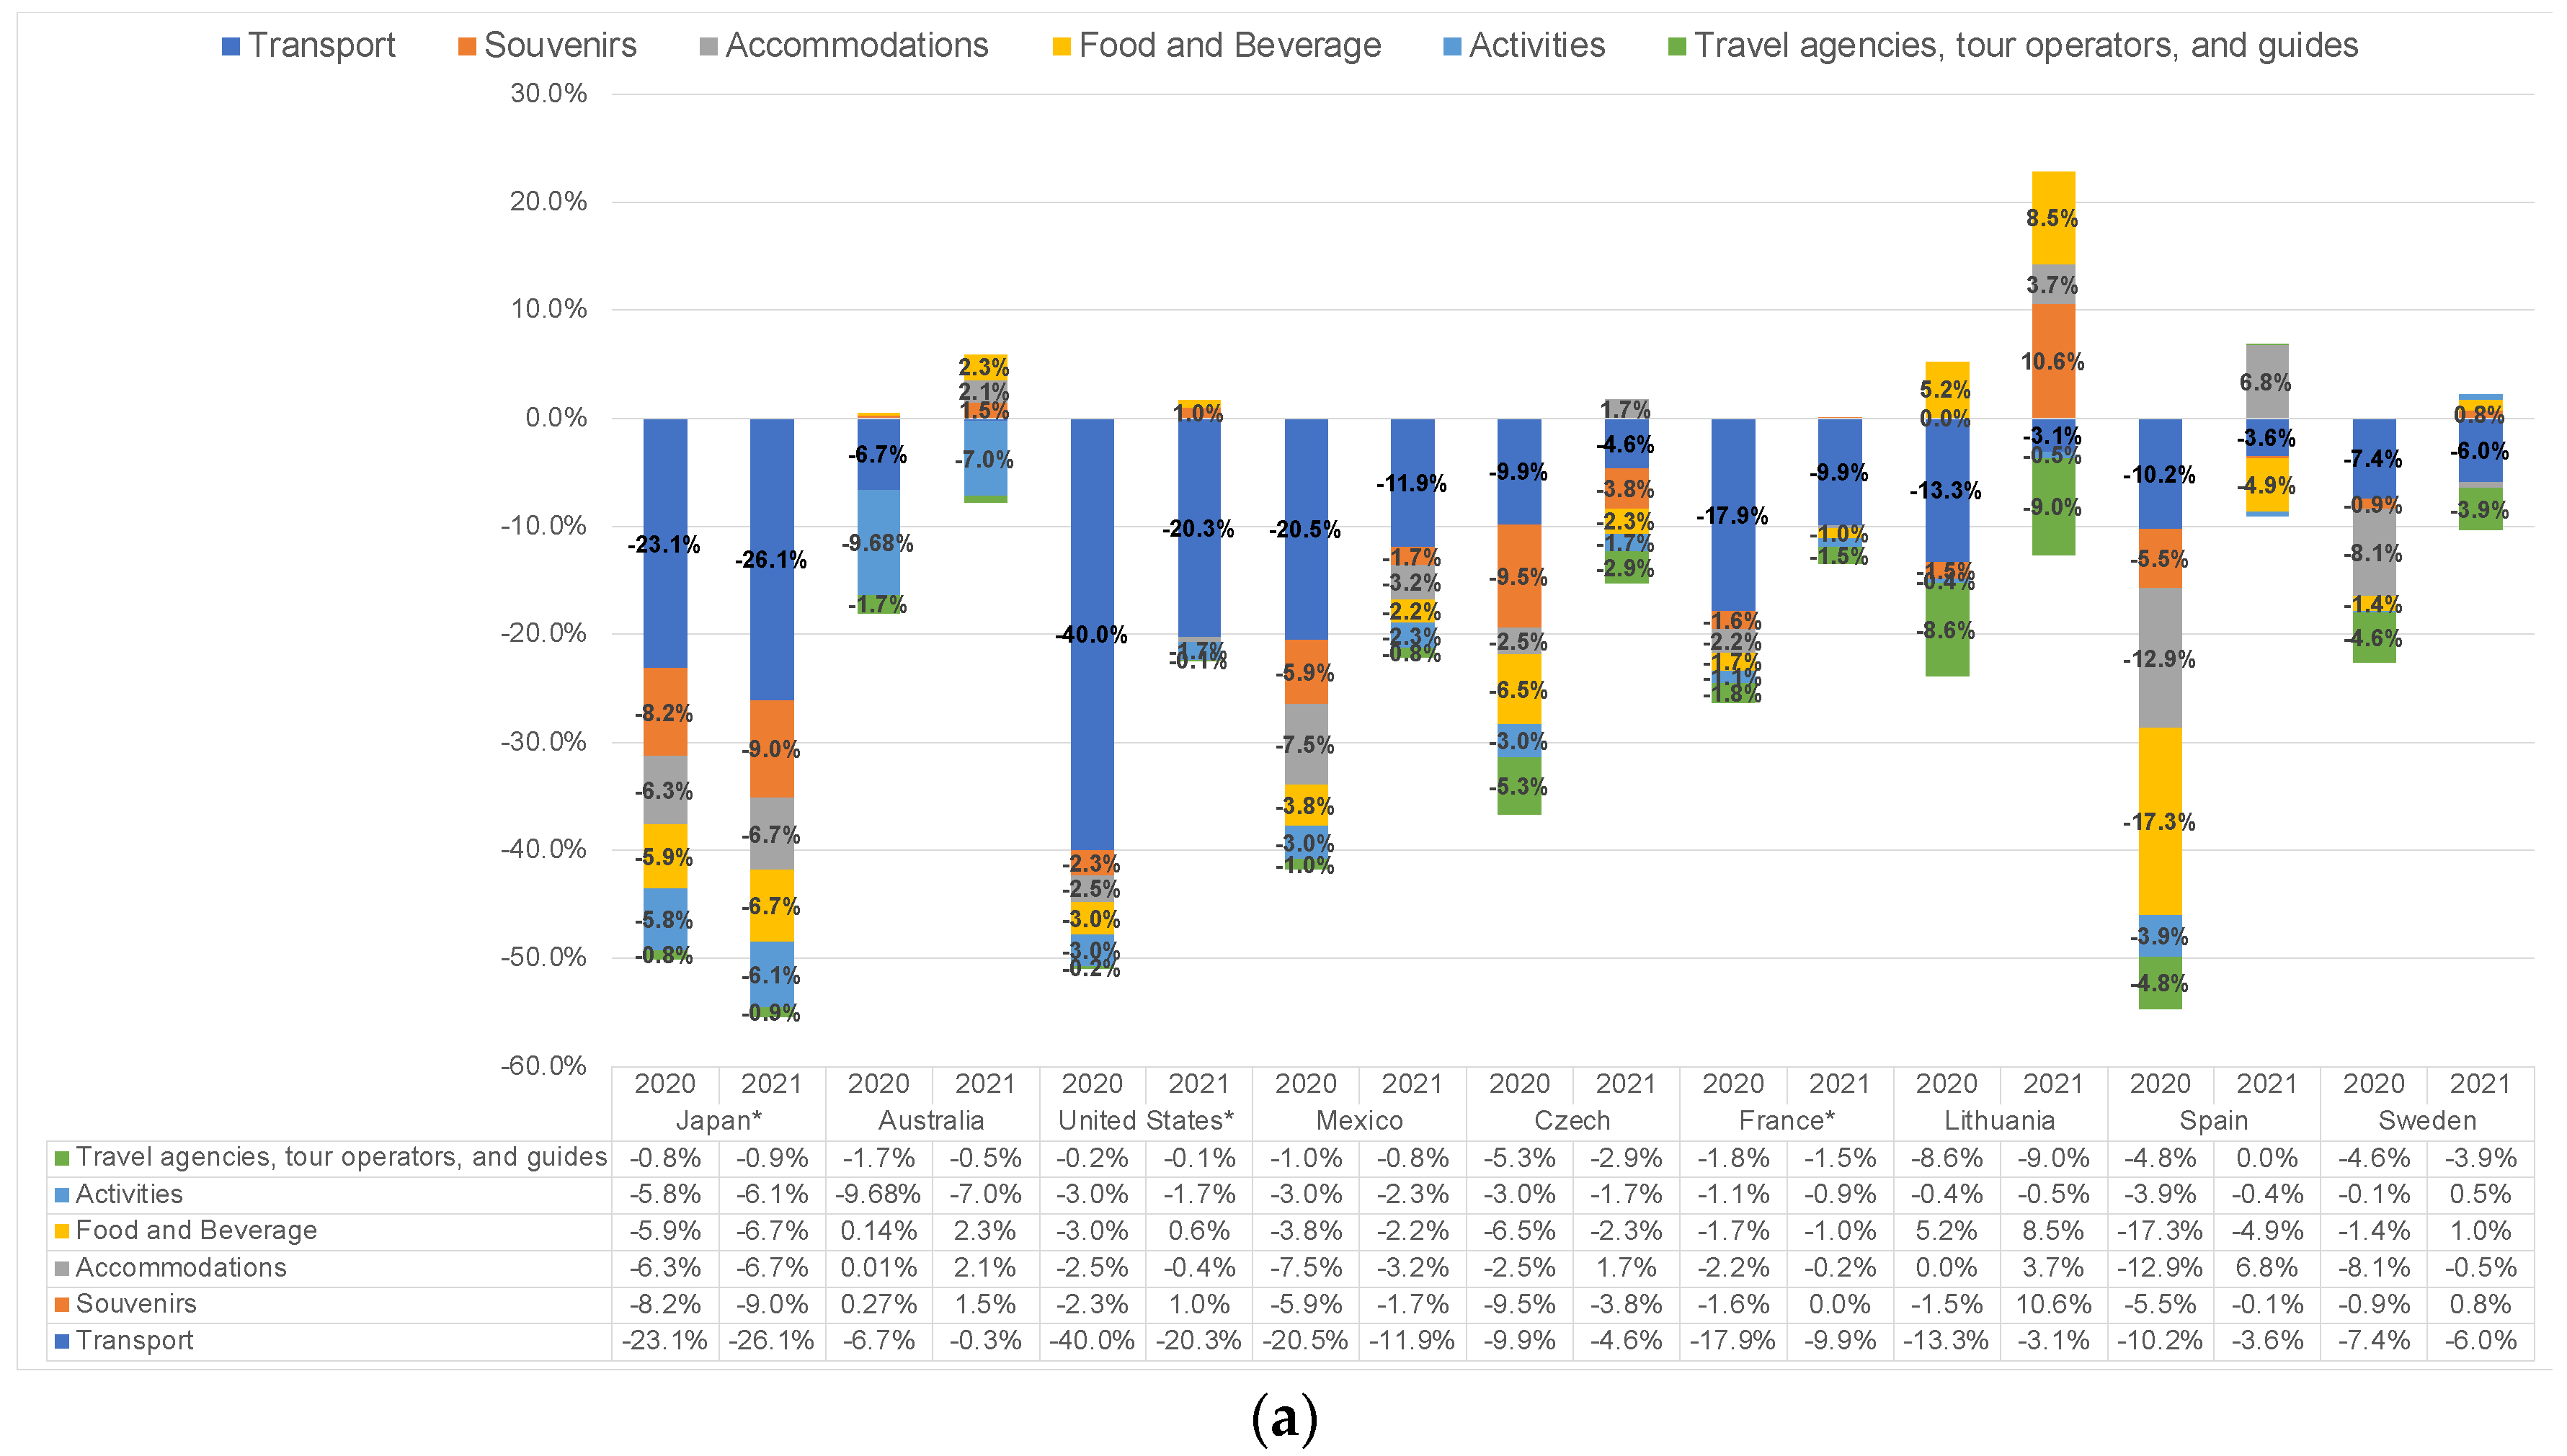
Figure 5(a) shows the changes in the CFP for each country from domestic tourism for 2020 and 2021, using 2019 as a baseline. In 2020, a decrease in GHG emissions from tourism was observed around the world. On average, the GHG emissions decreased by about 38%, with the transport sector showing a 14% reduction, while other categories had a decrease of only a few percentage points. The highest reductions in the transport sector were in Japan, the United States, Mexico, the Czech Republic, France, and Lithuania. Sweden saw the greatest reduction in accommodations, Spain in food and beverages, and Australia in activities. Australia was the only country where souvenirs, accommodations, and food and beverages increased by about 0.4%.
In 2021, most countries, except Japan, showed recovery trends in all categories. The United States, the Czech Republic, Lithuania, and Spain had increased GHG emissions in some categories. The United States saw about a 2% recovery in souvenirs and food and beverages, while accommodations in the Czech Republic increased by about 2% and in Spain by 7%. Lithuania was the only country to exceed its 2019 GHG emissions by about 10%, particularly with about a 23% recovery in souvenirs, accommodations, and food and beverages. In 2021, there were 3.1 million domestic tourist stays recorded, a 26.7% increase compared to 2020, exceeding the pre-pandemic levels by 9.3% [52].

3.2.4. Inbound Tourism

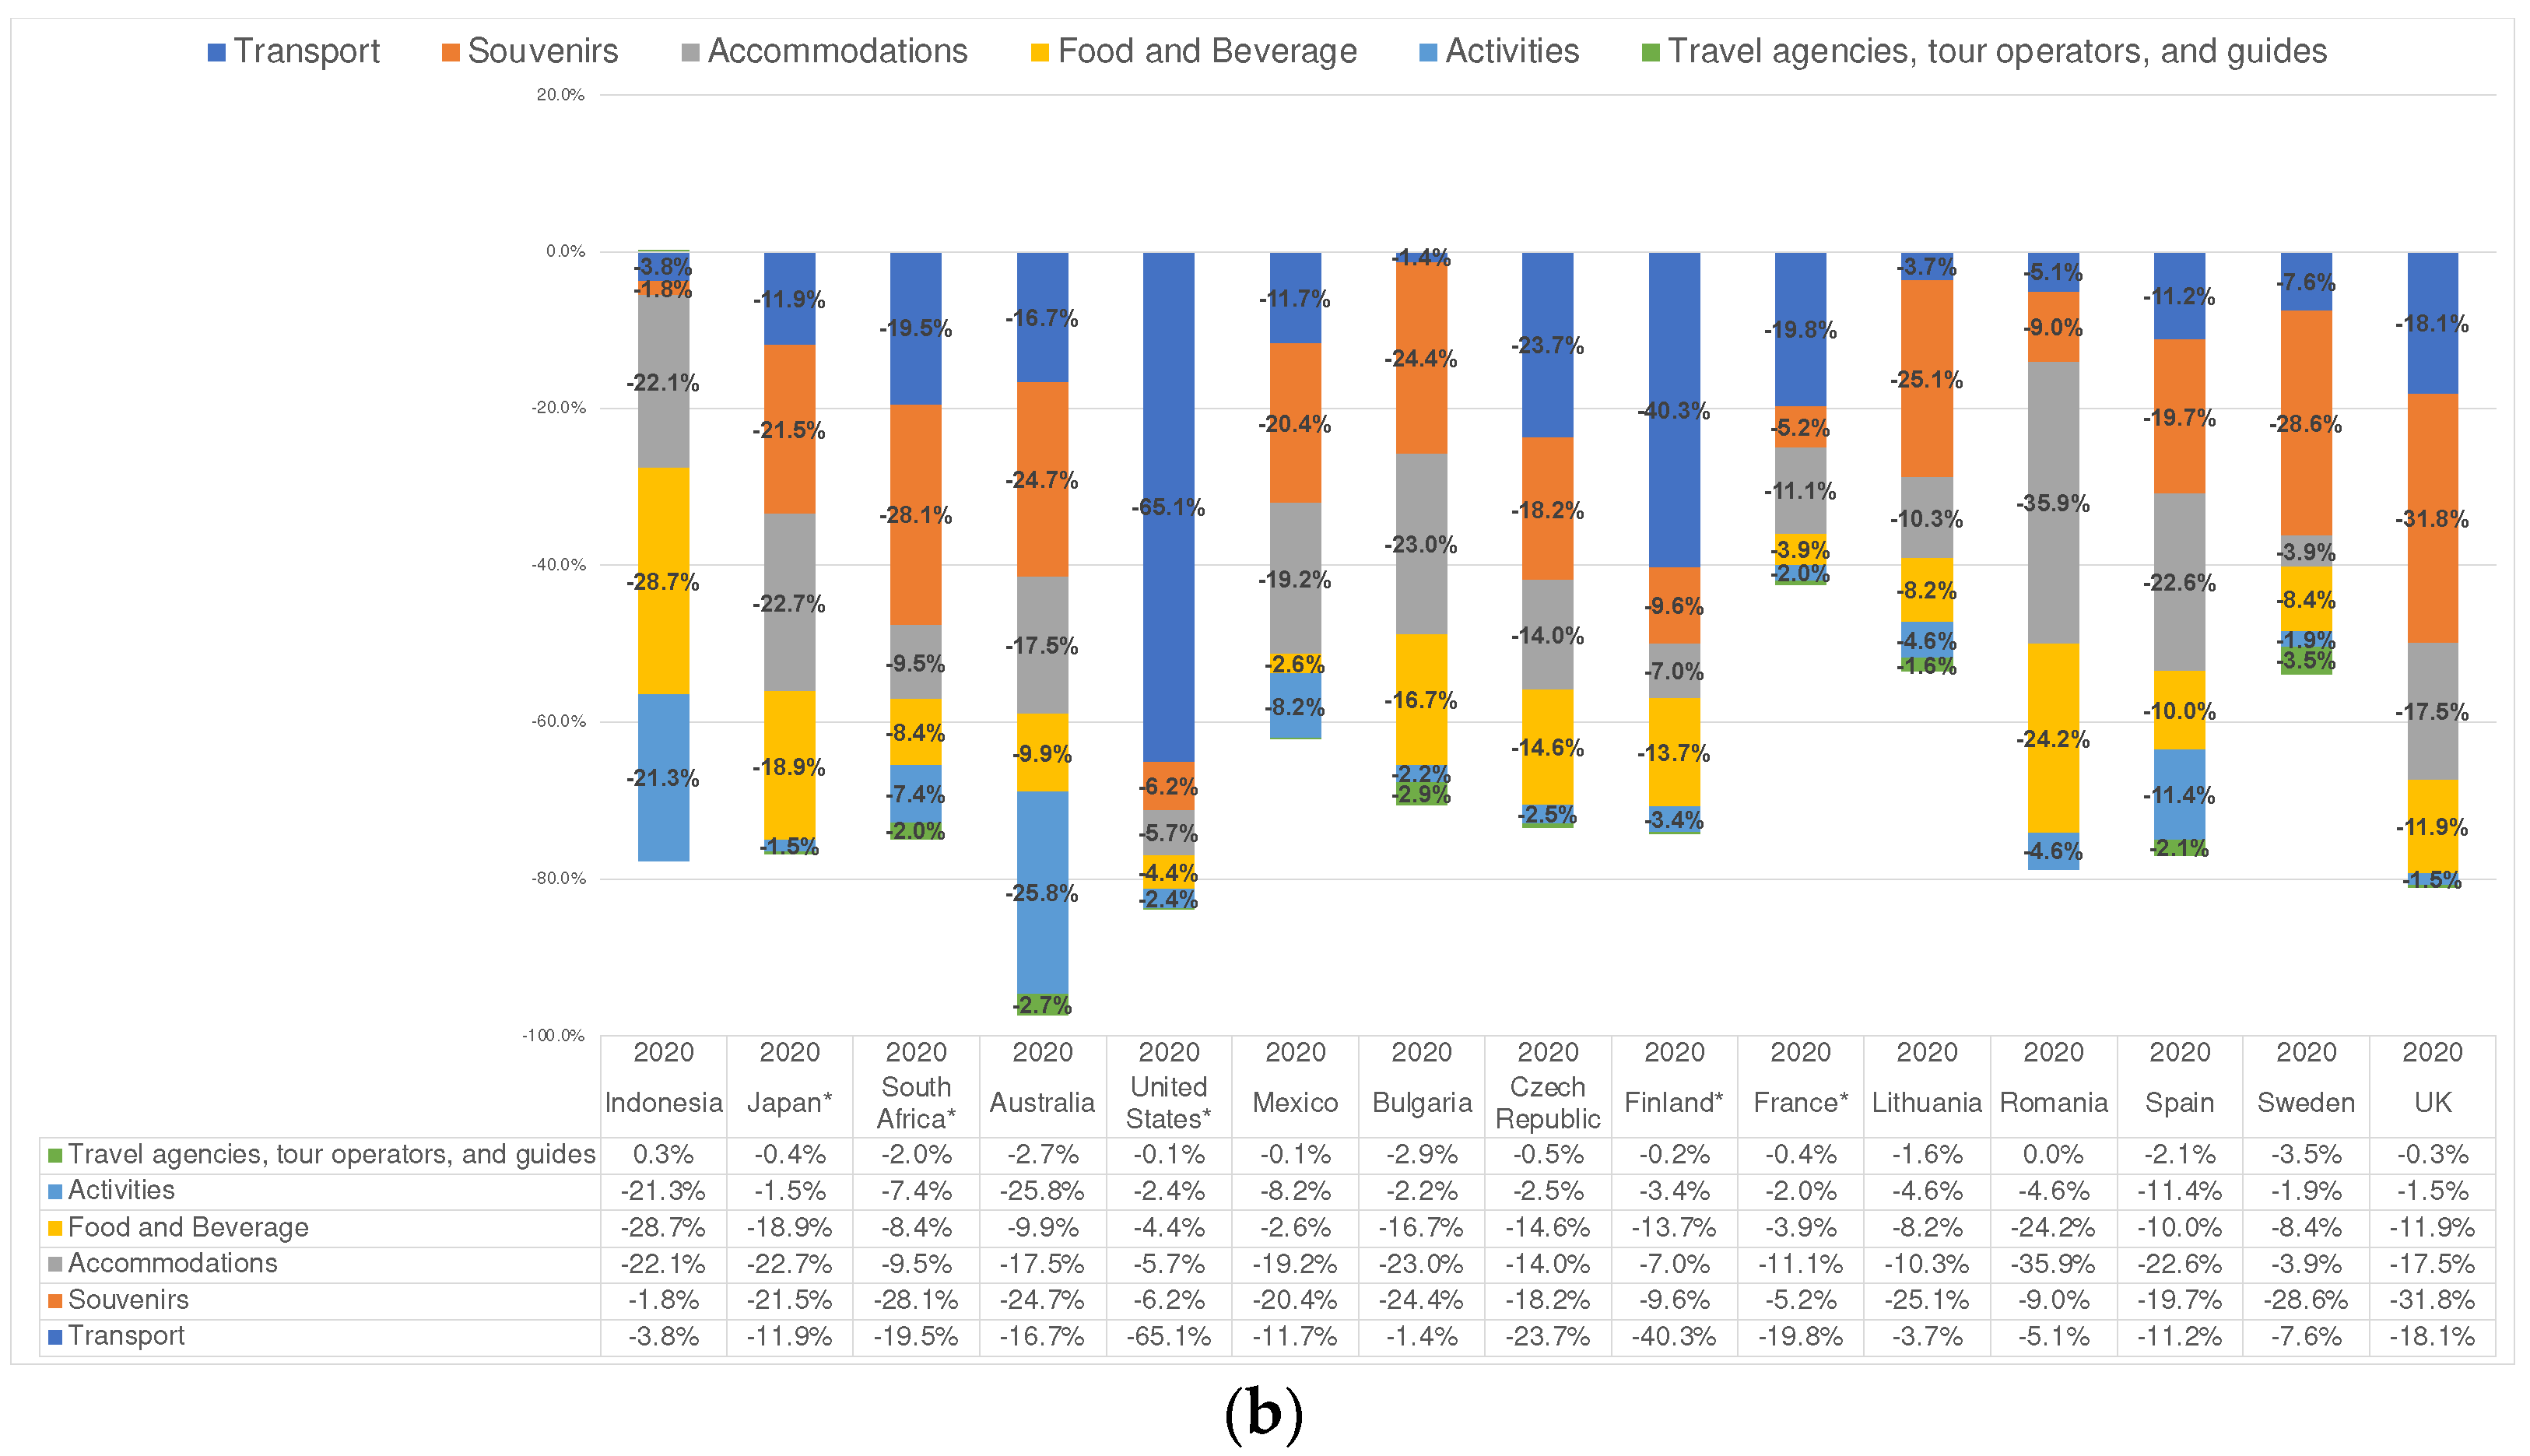
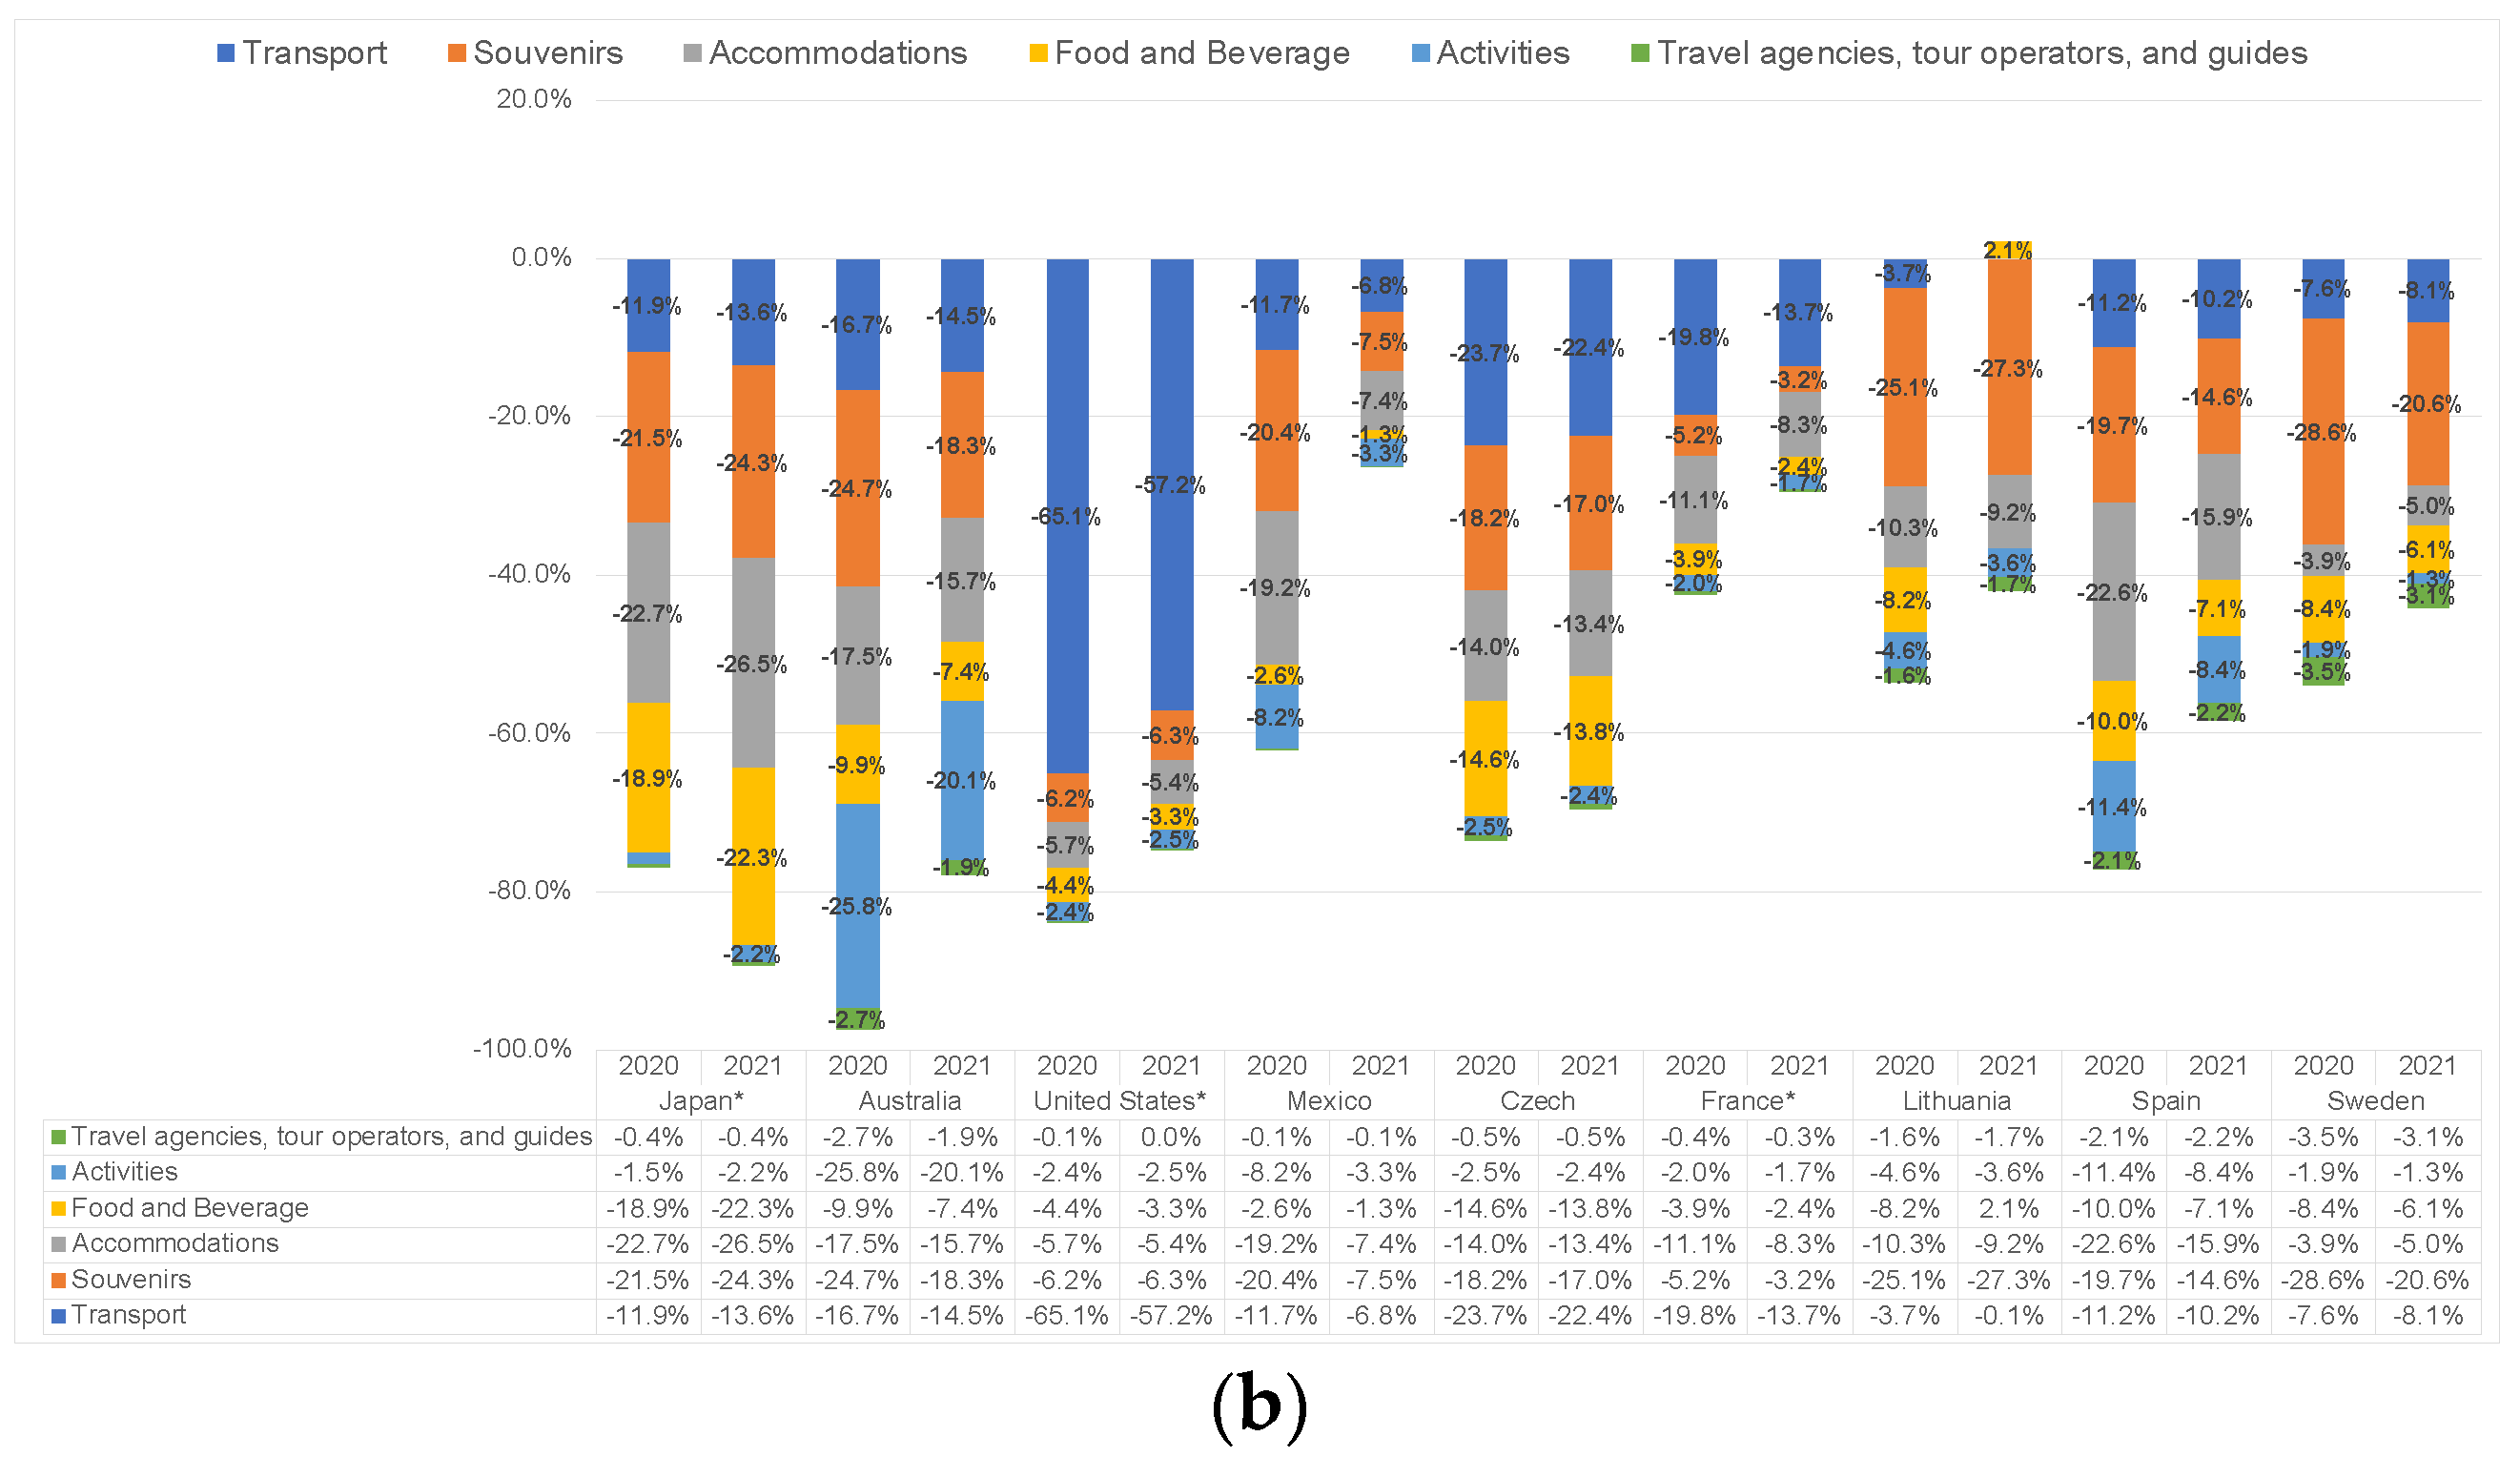
Figure 5(b) shows the changes in the carbon footprint (CFP) for each country from inbound tourism for 2020 and 2021, using 2019 as a baseline. In 2020, a decrease in GHG emissions from tourism was confirmed in all countries. The average reduction was about 71%, with transport at about 17%, souvenirs at around 18%, accommodations at approximately 16%, food and beverages at around 12%, and a few percent decrease in other categories. This affected the various categories more than in domestic tourism. The highest reductions in transport were in the United States, the Czech Republic, and France. The largest decreases were in souvenirs for Mexico and Sweden, accommodations for Japan and Spain, and activities for Australia. Australia had the highest decrease at about 97%, with activities contributing around 26% and souvenirs about 25% to the overall reduction.
In 2021, there was a recovery in all categories in all countries except Japan, which continued to show a decrease in all categories. Mexico showed the strongest recovery trend, particularly in accommodations and souvenirs. Mexico's overnight visitors in 2021 numbered about 1.3 times those in 2020. The top market, the United States (accounting for 32% of the market), almost returned to pre-COVID-19 levels but was still 29.2% below 2019's tourist numbers [52]. Additionally, Lithuania was the only country to see an approximate 2% increase in GHG emissions from food and beverages.

3.3. Tourism in Japan and the United States

3.3.1. Japan
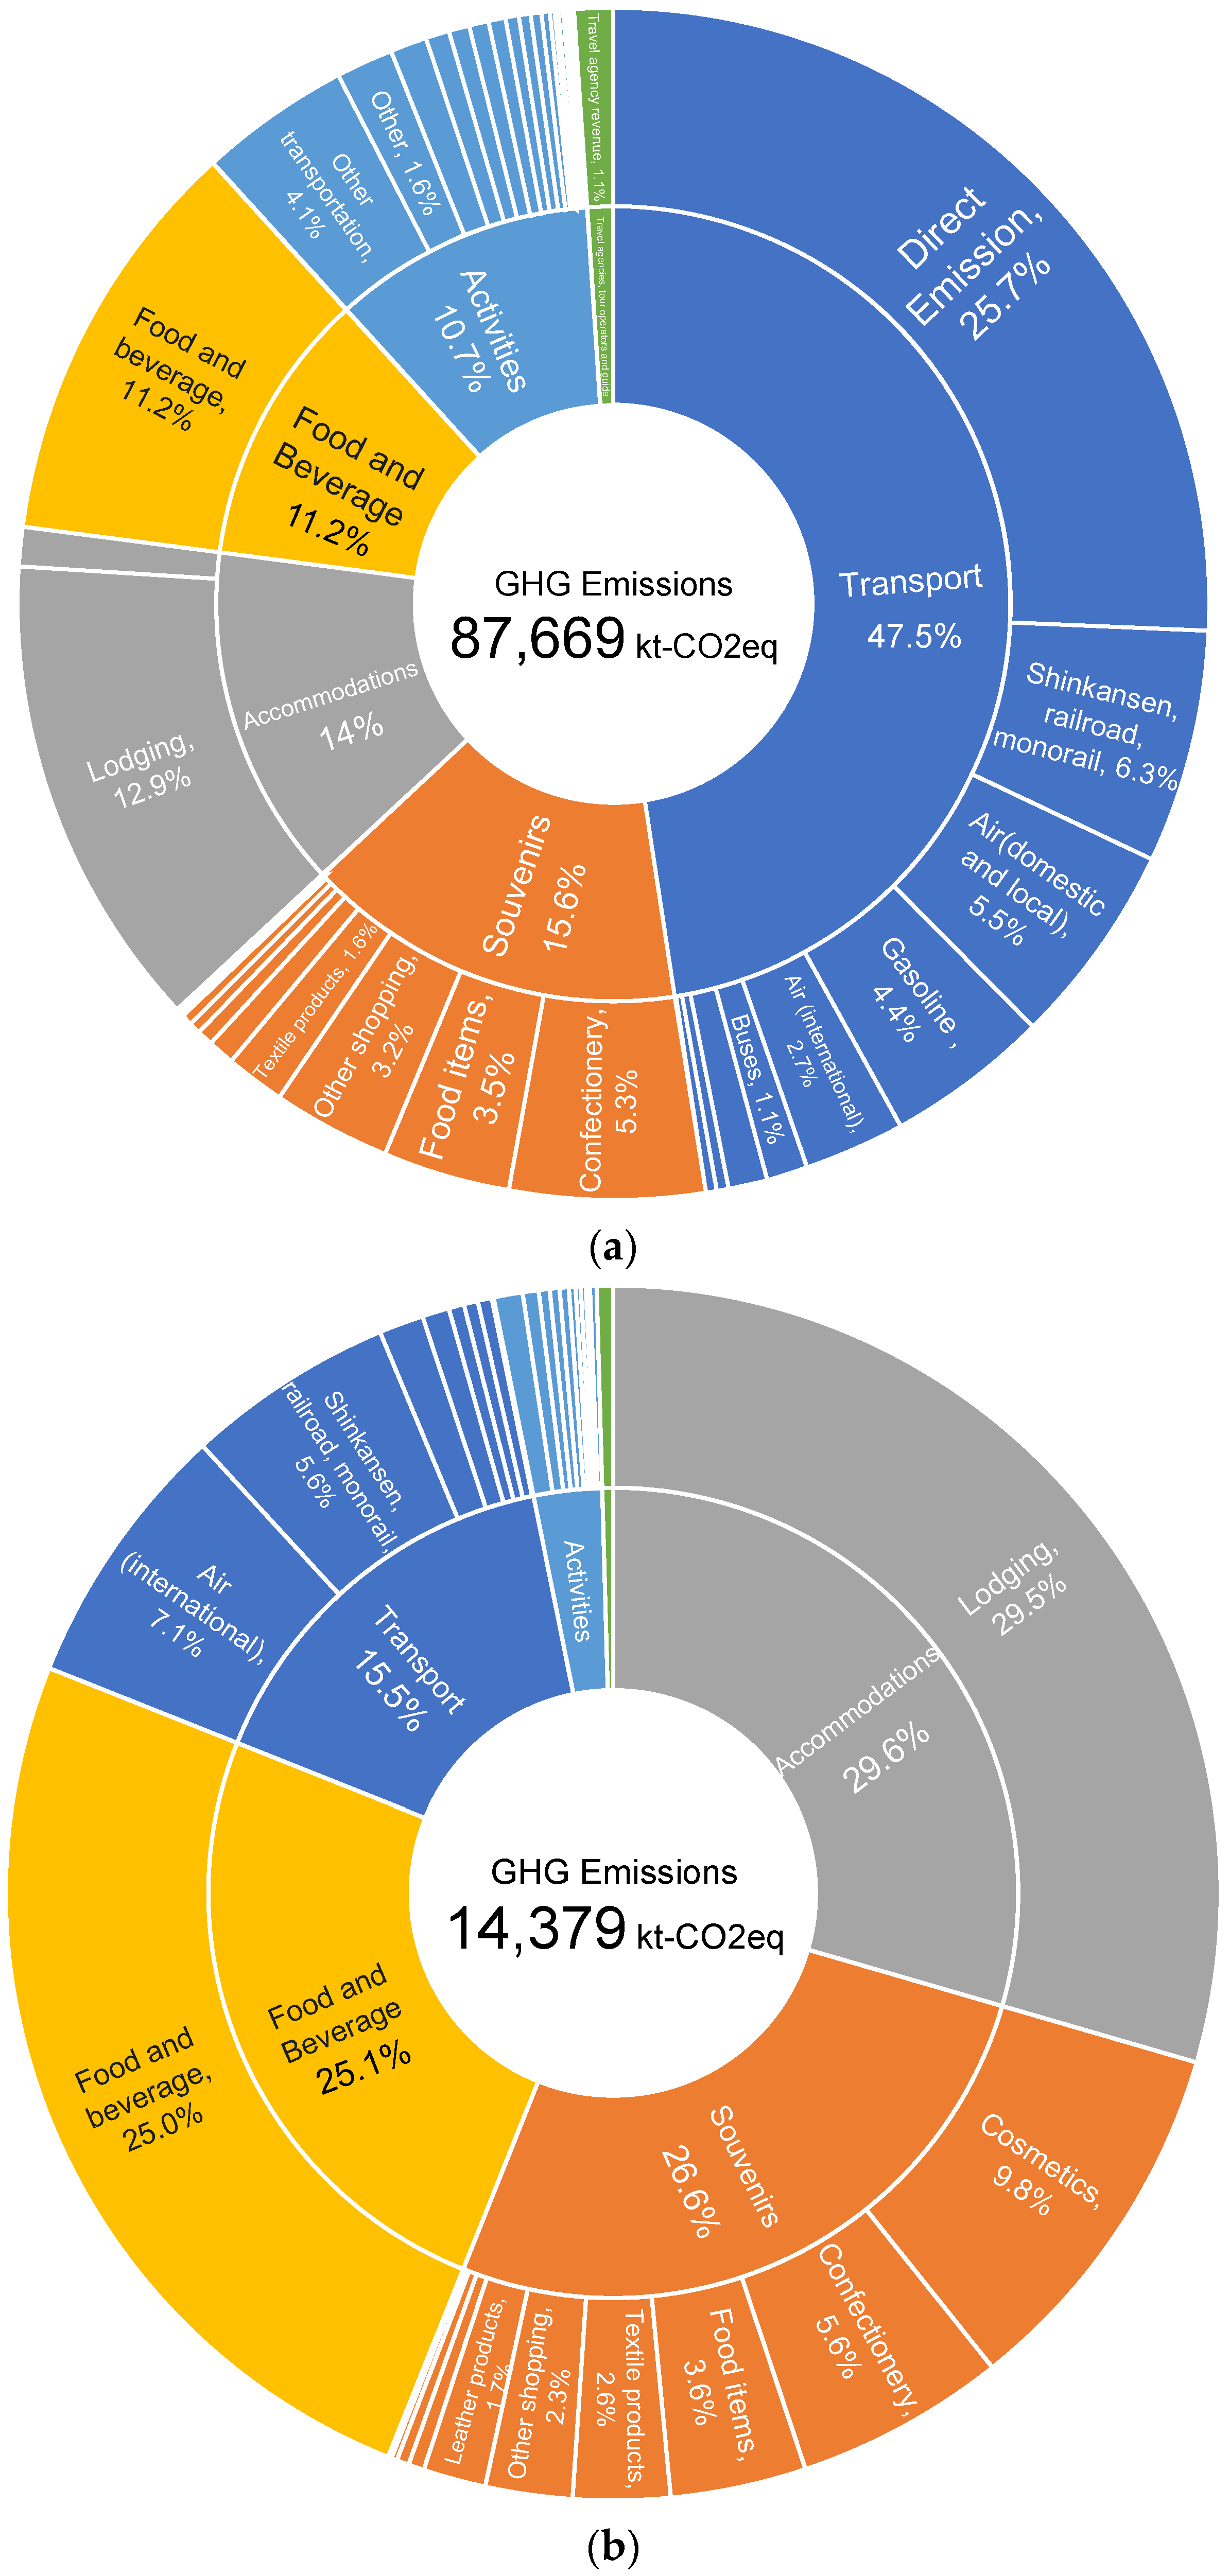
Figure 6 shows the GHG emissions and contribution rates of products and services of domestic tourism and inbound tourism in Japan for the year 2019.
The GHG emission from domestic tourism was 87,699 kt-CO2e. The contributions of each category were as follows: transportation, 47.5%; souvenirs, 15.6%; accommodations, 14%; food and beverages, 11.2%; activities, 10.7%; and travel agencies, 1.1%. The impact of transportation was the highest, particularly the direct emissions from gasoline combustion in passenger cars.
The GHG emission from inbound tourism was 14,379 kt-CO2e. The contributions of each category were as follows: accommodations, 29.6%; souvenirs, 26.6%; food and beverages, 25.1%; activities, 2.7%; and travel agencies, 0.4%. This is a different trend from domestic tourism, with accommodations, souvenirs, and food and beverage accounting for 80% of the total impact.
Figure 6. GHG emissions from Japan's tourism industry and contribution by category. (a) domestic tourism; (b) inbound tourism. Appendix A, Table A6 shows the CFP calculation results for each product and service item.
Preprints 98018 g006
Table 3 shows the top five GHG emission contributors in domestic tourism and inbound tourism.
In domestic tourism, gasoline (direct emissions), lodgings, food and beverages, "Shinkansen, Railroad, Monorail," and air travel (domestic and local) account for 60% of the total emissions. In particular, the GHG emissions related to transportation had a significant contribution.
In inbound tourism, lodgings, food and beverages, cosmetics, air travel (international), and confectionery made up 80% of the total emissions. In particular, the GHG emissions related to souvenirs had a significant contribution.
Table 3. Top five contributors to the tourism carbon footprint in Japan.
Domestic tourism Inbound tourism
1 Gasoline (direct emissions) Lodgings
2 Lodgings Food and beverages
3 Food and beverages Cosmetics
4 Shinkansen, railroad, monorail Air travel (international)
5 Air travel (domestic and local) Confectionery
Table 4 shows the five categories with the greatest reductions in GHG emissions in domestic tourism and inbound tourism in 2020 and 2021, compared to 2019. Japan is the only country where the GHG emissions continued to decrease in 2021.
In domestic tourism in 2020, the largest decreases were in sports games (87%), passport application fees (84%), stage/music viewing (78%), travel insurance/credit card enrollment fee (76%), and buses (74%). In 2021, the highest reductions were in air travel (international) (93%), exhibition/convention participation (91%), travel agency revenue (86%), travel insurance/credit card enrollment (85%), and buses (83%). The decrease in 2020 was mainly in event-related emissions, while in 2021, it was in transportation-related emissions.
In inbound tourism for 2020, the largest decreases were in theme parks/amusement parks (87%), cosmetics, pharmaceuticals, photographic films, etc. (85%), travel agency revenue (84%), other transportation expenses (83%), and electrical products (82%). In 2021, following the previous year, there was a large reduction in the leisure/amusement and cosmetics sectors.
Table 4. Top 5 categories with largest tourism carbon footprint reductions in Japan.
Domestic tourism Inbound tourism
2020 2021 2020 2021
1 Sports games -87% Air travel (international) -93% Theme parks/
amusement parks
-87% Theme parks/
amusement parks
-94%
2 Passport application -84% Exhibition/convention
participation
-91% Cosmetics -85% Cosmetics -93%
3 Stage/music viewing -78% Travel agency revenue -86% Travel agency
revenue
-84% Electrical products -92%
4 Travel insurance/credit card enrollment -76% Travel insurance/credit
card enrollment
-85% Other transportation expenses -83% Confectionery -91%
5 Buses -74% Buses -83% Electrical products -82% Car rental/
car sharing
-91%
Table 5 shows the sustainability assessment (environmental, economic, and social evaluation) for Japan in 2020 and 2021, compared to 2019, in terms of changes in GHG emissions, tourism consumption, and employment numbers.
Japan had the smallest decrease in employment numbers. The decline was particularly noted in the lodging sector. In April 2020, an employment adjustment subsidy was introduced for the lodging industry, aiming to retain employees. However, due to the challenging work environment even before COVID-19, employee anxiety increased, leading to a rise in resignations from the latter half of 2020 to the first half of 2021 [53]. This resulted in a 9% decrease in employment in 2020 and an 18% decrease in 2021. In the transportation sector, airlines such as ANA and JAL announced the suspension of hiring new graduates in 2021. A notable decrease in employees was also observed in road passenger transportation. According to the Ministry of Land, Infrastructure, Transport, and Tourism [54], the number of private taxis decreased by about 8.5%, and both private and public charter buses decreased in number by about 10% and 20%, respectively, in 2021 compared to 2019. The entertainment industry saw a 5% increase (compared to 2019) in 2021, which was confirmed by the Ministry of Health, Labour and Welfare's "2020 Employment Trends Survey" [55]. Although cinemas and theaters were closed, the increase in demand for online streaming and gaming led to a rise in employment in the entertainment sector. It should be noted that employment in travel agency services is included only in the souvenirs category in the results. In Japan's Tourism Satellite Account employment data, these are categorized under "other industries," which may include retail and agency services. According to the Japan Association of Travel Agents Tourism Statistics 2023 [56], first-class travel agents like JTB and HIS saw a gradual decrease of 1% in 2020 and 3% in 2021 compared to 2019.
Table 5. Changes in GHG emissions, tourism consumption, and employment in Japan.
Preprints 98018 i001

3.3.2. United States

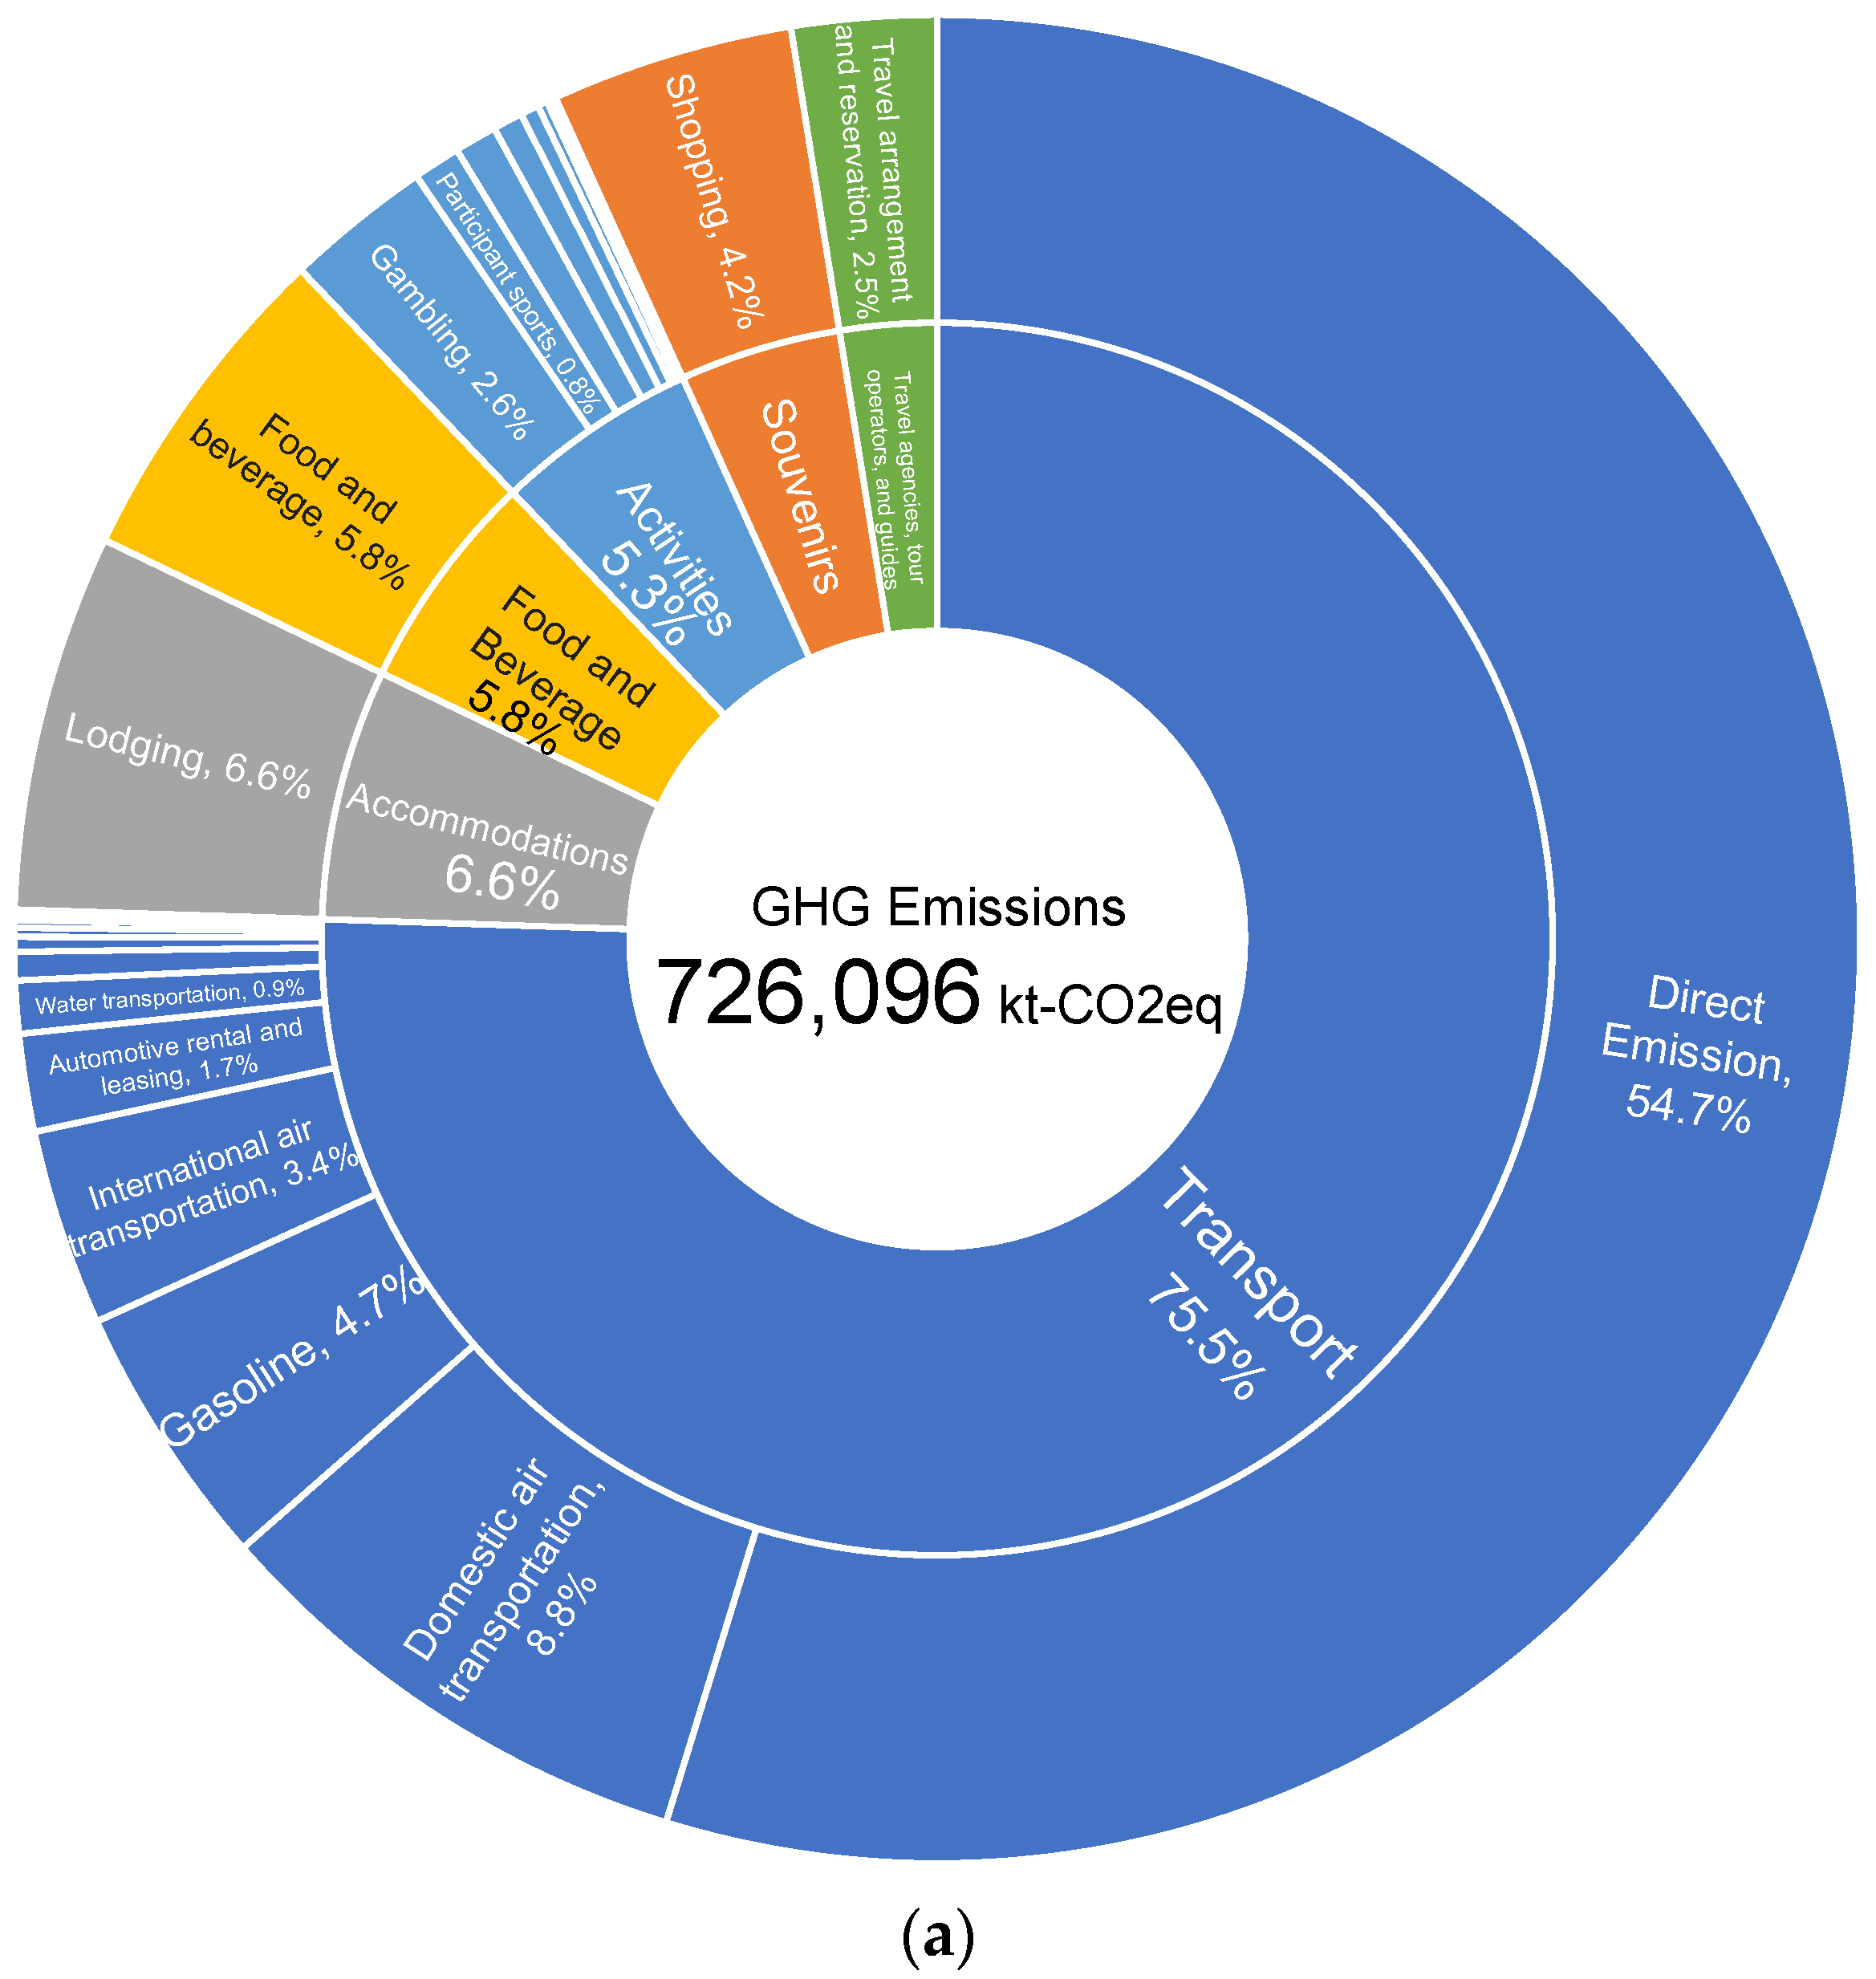
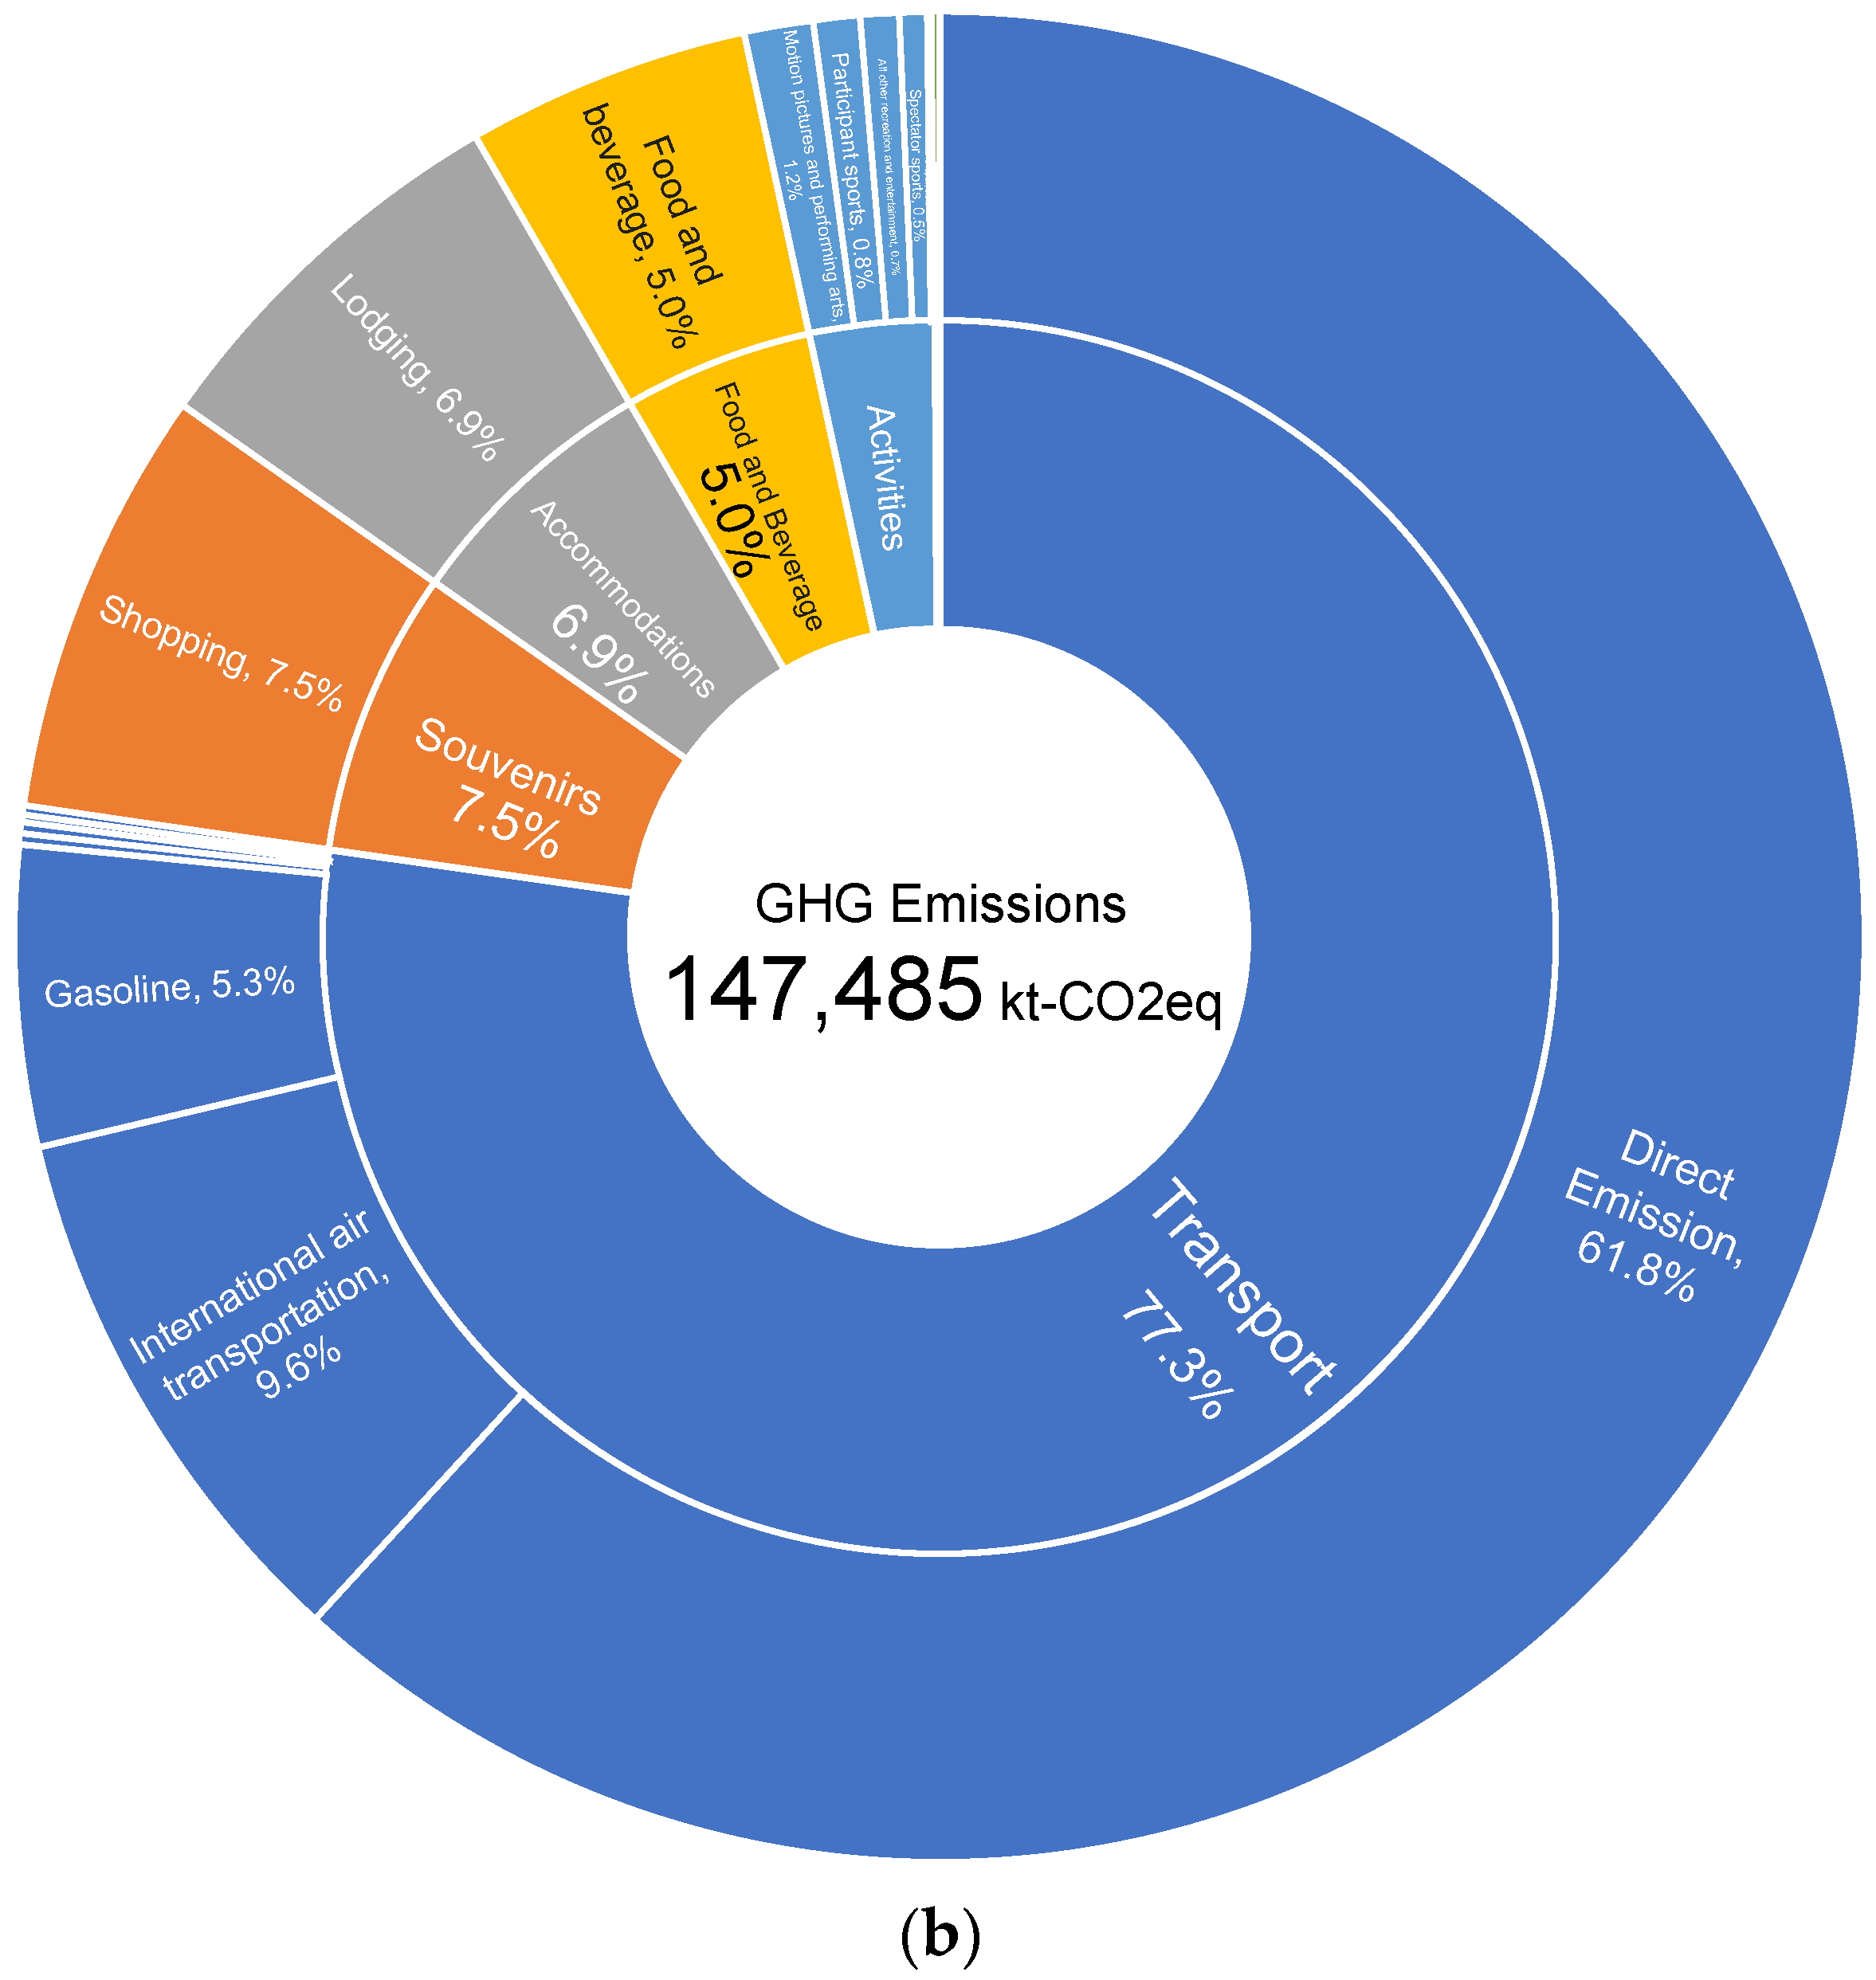
Figure 7 shows the GHG emissions and the contribution rates of products and services of domestic tourism and inbound tourism in the United States for the year 2019.
The GHG emission from domestic tourism was 729,096 kt-CO2e. The contributions for each category were as follows: transportation, 75.5%; accommodations, 6.6%; food and beverages, 5.8%; activities, 3.2%; and travel agencies, 0.1%. The impact of transportation was the highest, particularly the direct emissions from gasoline combustion in passenger cars.
The GHG emission from inbound tourism was 147,485 kt-CO2e. The contributions for each category were as follows: transportation, 77.3%; souvenirs, 7.5%; accommodations, 6.9%; food and beverages, 5%; activities, 5.3%; souvenirs, 4.2%; and travel agencies, 0.1%.
The emissions in both inbound and domestic tourism were primarily influenced by transportation, especially direct emissions from gasoline combustion in cars, aircrafts, and gasoline purchases. Following transportation, the greatest impact from domestic tourism came from accommodations and food and beverages, while from inbound tourism, it was from souvenirs and accommodations, showing different trends in the categories based on the travel form.
Figure 7. GHG emissions from U.S.A.’s tourism industry and contribution by category. (a) domestic tourism; (b) inbound tourism. Appendix A, Table A7 shows the CFP calculation results for each product and service item.
Preprints 98018 g007aPreprints 98018 g007b
Table 6 shows the top five GHG emission contributors from domestic and inbound tourism.
In domestic tourism, the major contributors were direct emissions, domestic passenger air transportation services, traveler accommodations, food and beverage services, and gasoline.
In inbound tourism, the significant contributors were direct emissions, international passenger air transportation services, shopping, traveler accommodations, and food and beverage services.
While Japan showed different trends between domestic tourism and inbound tourism, the United States featured similar emission patterns in both travel forms.
Table 6. Top five contributors to the carbon footprint in the U.S.A.
Domestic tourism Inbound tourism
1 Direct emissions Direct emissions
2 Domestic air transportation International air transportation
3 Accommodations Shopping
4 Food and beverages Accommodations
5 Gasoline Food and beverages
Table 7 shows the top five categories with the largest GHG emission reductions in domestic and inbound tourism in 2020 and 2021 compared to 2019.
Domestic tourism included travel by U.S. residents abroad at 78%, local bus and other transportation services at 77%, and passenger rail transportation services at 77%, In 2021, there was a recovery trend, but the decline in transportation-related services was more noticeable.
Inbound tourism decreased by 97% in all other recreation and entertainment activities, 94% in local bus and other transportation services, and 94% in domestic passenger air transportation The recovery rate was lower than that of domestic tourism, with a noticeable decline in entertainment-related services.
Table 7. Top 5 categories with largest carbon footprint reductions in the U.S.A.
Domestic tourism Inbound tourism
2020 2021 2020 2021
1 Local bus and other transportation -77% Water transportation -71% All other recreation and entertainment activities -97% All other recreation and entertainment activities -99%
2 Rail transportation -77% Rail transportation -60% Local bus and
other transportation
-94% Water transportation -87%
3 Gambling -73% Gambling -58% Domestic air
transportation
-94% Shopping -84%
4 International air
transportation
-71% International air
transportation
-48% Gambling -93% Local bus and
other transportation
-83%
5 Water transportation -67% Domestic
transportation
-35% Taxicab services -90% Motion pictures and performing arts -82%
Table 8 shows the sustainability assessment (environmental, economic, and social evaluation) for the United States in 2020 and 2021, compared to 2019, in terms of changes in GHG emissions, tourism consumption, and employment numbers.
In 2020, the United States, compared to other countries, saw a decrease in employment numbers corresponding to the reduction in consumption. Looking at the results for 2021, the changes in employment numbers and consumption in the United States were similar. In particular, changes in souvenirs, food and beverages, and activities were similar. The decrease in employment in activities, especially in casinos, was very significant, as reported in the following case. According to the U.S. Bureau of Labor Statistics, Nevada had the highest unemployment rate among all the states in 2020 [57]. Nevada, a popular tourist destination known for its casinos in Las Vegas, faced a forced closure of all casinos from March 18 to June 4, 2020, by the Governor's order, resulting in the immediate dismissal of most casino hotel employees. Additionally, bars, cinemas, gyms, and restaurants were also closed, only offering takeout or delivery services, which directly contributed to the high unemployment rate.
Table 8. Change in GHG emissions, tourist consumption, and employment in the U.S.A.
Preprints 98018 i002

4. Discussion

4.1. Comparison with Previous Studies

According to Lenzen et al. (2018) [15], the majority of the tourism industry's carbon footprint is emitted by high-income countries, accounting for about 8% of the world's total GHG emissions as of 2013. In this study, it was noted that the GHG emissions from the tourism industry in some major countries accounted for 12.5% in 2019, an increase of approximately 4% (Table 9).
However, due to the impact of COVID-19, the proportion of GHG emissions from the tourism industry decreased to 6.2% in 2020, a reduction of about 5% compared to 2019, and fell below the average of the 2013 statistics. The decrease was also pronounced in some major countries, confirming the industry's vulnerability to external factors.
Table 9. Changes in tourism emission contributions.
Lenzen This study
year 2013 2019 2020 2021
Object 160 countries 20 countries 15 countries 9 countries
Emission contribution rate (%) 8% 12.5% 6.2% 8.9%
Table 10 compares the results of this study with the existing research. Osorio et al. (2023) [27] reported that the GHG emission from internal tourism in Spain was 47,825 kt-CO2e in 2019 and 17,970 kt-CO2e in 2020. In contrast, this study found that the GHG emissions from Spain's Internal tourism for the same period were 36,942 kt-CO2e and 11,857 kt-CO2e, respectively, indicating a decrease of 63%.
The difference in results can be attributed to Osorio et al.'s methodology, which used the MRIO's Exiobase input–output tables to determine the calculation items and applied environmental impact coefficients. The variation in calculation methods and the data used likely influenced the outcomes. The approach by Osorio et al. might lead to differences in emissions for similar items, which could explain the discrepancy in results.
Table 10. CFP comparison with previous literature.
2019 2020 Rate of decrease
Osorio et al.
(kt-CO2e)
47,825 17,970 -63%
This study
(kt-CO2e)
36,942 11,857 -68%
Kitamura et al. (2020) [26] estimated the losses and reductions in tourism consumption, GHG emissions, and employment numbers in Japan's tourism sector as a measure of sustainable tourism. They predicted a worst-case scenario of a 65.1% decrease in tourism consumption, a 64.2% reduction in GHG emissions, and a 64.2% decrease in employment. The results of this study showed that Japan experienced a decrease of about 58% in tourism consumption, approximately 54% in GHG emissions, and 0.5% in employment. Although the decreases in tourism consumption and GHG emissions were not as severe as the worst-case scenario, they were still considerably high. The decrease in employment numbers was less dramatic, largely due to government policies.
As shown in previous studies and this research, the main environmental impact in the tourism industry is from transportation. The International Air Transport Association (IATA) has committed to achieving net-zero emissions by 2050 through improvements in aircraft technology, energy infrastructure, operations, finance, and policy [58]. This includes the use of Sustainable Aviation Fuel (SAF). To achieve a substantial emission reduction by 2050, SAF needs to make up 80-90% of aviation fuel. Japan Airlines (JAL)'s plan to replace 1% of all fuel loaded at Los Angeles International Airport with SAF starting in 2025 is expected to reduce over 47,000 tons of emissions annually [59]. France, as part of its efforts to reduce emissions, implemented a policy in late May 2023 that bans short-distance domestic flights [60]. This policy entails a complete ban on air travel to destinations that can be reached by train in two and a half hours or less. As a result of this action, it is expected that domestic travel within France will gradually decrease in the future. Besides transportation, souvenirs, accommodations, and food and beverages are also significant categories contributing to the environmental burden. Measures to encourage green purchasing and ethical consumption among tourists are needed for souvenirs and food and beverages. Providers also need to offer products using sustainable packaging. For accommodations, promoting eco-hotels to travelers and certification efforts by providers are necessary, as both consumer and provider behavior changes contribute to reducing the environmental impacts.
Recent advancements in digitalization have led to the development of virtual tourism as a new form of tourism. Virtual tourism refers to exploring and experiencing tourist sites and cultural heritage remotely using digital technology [61]. This technology offers an immersive and interactive experience, simulating the feeling of being at the tourist spot or specific location. It contributes to building a more sustainable economic model [62] and is thought to reduce transportation emissions by shortening travel distances. However, the economy and environment are closely intertwined, and concerns about a decrease in tourists due to the introduction of virtual tourism have been raised. M. De-la-Cruz-Diaz et al. (2022) [63] discussed virtual tourism and its carbon footprint, stating that careful consideration is needed for its implementation. The tourism industry is crucial for economic growth, and countries dependent on tourism may suffer significant losses from virtual tourism. There are also concerns about the loss of some elements of traditional travel and the reduction in the experience and excitement of visiting new places. Virtual tourism should be recognized as a new way for people with limited budgets to enjoy cultural experiences, promoting behavioral changes in travelers and reducing emissions while balancing economic and environmental considerations. Contreras-Taica, A. et al. (2022) [64] discussed virtual education and its carbon footprint, noting that virtual education brings many environmental benefits, such as significantly reducing carbon footprint emissions. Although the use of transportation is reduced due to remote education, energy consumption increases, leading to a rebound effect. Therefore, while virtual tourism can reduce transportation emissions, a comparative analysis of energy use in tool utilization is necessary.
The methods and scopes for calculating the carbon footprint (CFP) in the tourism industry remain unclear. "Climate Action in the Tourism Sector – An overview of methodologies and tools to measure greenhouse gas emissions [38]" focuses on the calculation status for each sector of the tourism industry. Currently, in the accommodation sector, the Hotel Carbon Measurement Initiative (HCMI) [65] has been published and is available for free use. Although various accommodation calculation tools exist, HCMI, which covers Scopes 1, 2, and some of Scope 3, is considered the optimal tool in compliance with the GHG Protocol and could become a benchmark for the future. In Japan, the Carbon Footprint Communication Program (CFP Program) was introduced in 2014, and Product Category Rules (PCRs) for travel goods were accredited. The life cycle flow consists of "outbound travel," "meals," "entertainment (optional calculation)," "accommodation," and "return travel," which is also the calculation scope applied in this study. However, in the PCRs, the product purchasing process is not considered, which may lead to an underestimation. According to Filimonau (2016) [14], the tourism industry can primarily be divided into three major categories: transportation, accommodations, and activities. Each of these categories has multiple subcategories, showing a complex structure. While these categories stand alone as products and services, there are also composite forms, such as package tours, combining multiple products and services. The complexity of providing tourism products and services is acknowledged, pointing out that comprehensive environmental impact assessment projects and tool introductions are still limited. To conduct a reliable environmental impact assessment, it is necessary to accurately identify these elements.

4.2. Limitation

This study utilized Input–Output Life Cycle Assessments (LCAs) to estimate emissions at a macro-level based on consumption amounts in various countries. However, Input–Output LCA, being a method dependent on monetary values, presents challenges in the detailed analysis of products and services, consideration of environmental impacts, and resource efficiency. Therefore, adopting Process-Based LCA, which allows for a more micro-level analysis, is an alternative methodology, although it is time-consuming to consider the entire supply chain. Consequently, estimates were made based on Input–Output LCAs in this study. According to Filimonau (2016) [14], an integrated approach that considers the advantages of both methods is necessary to assess the tourism industry, and a combination of different methodologies is essential for evaluating tourism within each industry.
In this study, the aim was to calculate across the entire life cycle, from cradle to grave, by separately estimating direct emissions from gasoline usage and summing the emissions. However, this was not applied to all countries, but only to those with a gasoline item in their Tourism Satellite Account (TSA). For countries missing this data, estimation could be made based on physical quantities or the proportion of domestic production values, but for this study, the results were shown based on the items in the TSA.
Furthermore, the Tourism Satellite Accounts used in this study combined TSAs issued by each country and the OECD database. However, each has issues, such as differing degrees of data granularity for different countries. Currently, macro-level analyses are predominant, and improvement in the accuracy of TSAs is required for more detailed analysis.
Finally, the MRIO Eora data, which is used for the calculations of countries around the world, is standardized in USD. However, the TSAs in each country are primarily denominated in the local currency, necessitating conversion. This study used the average exchange rates published by the World Bank, but it is important to note that these are annual averages, and it is difficult to account for actual currency fluctuations.

5. Conclusions

In this study, we analyzed the GHG emissions of the tourism industry in key countries before and after COVID-19, separating it into domestic and inbound tourism, and understanding their distinct characteristics. The GHG emissions from tourism tend to be higher in countries with higher numbers of tourists and GDP, with the United States having the most significant impact. Overall, domestic tourism is the primary contributor to total emissions, emphasizing the importance of sustainability in the entire tourism industry and future environmental impacts.
Transportation contributed the most to the life cycle emissions, particularly direct emissions from gasoline combustion in passenger cars. Besides transportation, souvenirs, accommodations, and food and beverages also contribute to emissions, with countries like South Africa and Indonesia showing higher emissions compared to others, largely influenced by souvenirs and food and beverages. Different countries have varied emission sources, and clarifying the focus areas allows each country to focus on the appropriate ones for sustainable tourism, enabling more effective initiatives.
The COVID-19 pandemic has had complex effects on the tourism industry. Both domestic and inbound tourism experienced a decrease in tourist numbers, leading to a significant reduction in tourism-related GHG emissions. In particular, in inbound tourism, the GHG emissions decreased by 72%, a crucial indicator of the environmental impact from tourism. Japan and Australia, compared to many other countries, adopted strict measures, delaying the recovery of the tourism industry, and are continuing to reduce GHG emissions. In particular, in Japan, domestic and international tourist numbers decreased significantly due to emergency declarations and focused prevention measures. Meanwhile, Australia implemented strict border measures early in international tourism, leading to a reduction in GHG emissions. Amid the ongoing crisis, the tourism industry faces new opportunities. Changes in demand and restrictions call for new travel styles and environmental considerations, potentially contributing to improved environmental sustainability in tourism. Evaluating whether these new travel styles contribute to sustainable tourism requires further research, including environmental, economic, and social perspectives and CFP assessments.

Author Contributions

Conceptualization, A.T. and N.I.; methodology, Y.K. and N.I.; writing—original draft preparation, A.T.; supervision, N.I. and R.F. All authors have read and agreed to the published version of the manuscript.

Funding

This research received no external funding.

Conflicts of Interest

The authors declare no conflicts of interest.

Appendix A

Table A1. Existing case study and paper. The following table was added by the author based on V.Filimonau et al. 2016 [14] and Kitamuraet al. 2020 [20].
Study Object of Analysis Primary environmental Impacts Assessed Geographical Scope
Process-based LCA (Pre COVID-19)
Castellani and Sala (2012) [66] Holiday travel, Including accommodation A range of impacts Italy
Filimonau et al. (2011a) [67] Climate change UK
Filimonau et al. (2014) [68] UK and France
El Hanandeh (2013) [69] Religious travel, Including accommodation Saudi Arabia
Pereira et al. (2015) [70] Holiday travel, Excluding accommodation Brazil
Filimonau et al. (2013) [71] Holiday package UK and Portugal
Kuo et al. (2005) [72] Tourist catering A range of impacts Taiwan
Michailidou et al. (2015) [73] Tourist accommodation Greece
König et al. (2007) [74] Portugal
Sára et al. (2004) [75] Italy
De Camillis et al. (2008) [76]
Cerutti et al. (2014) [77]
Filimonau et al. (2011b) [78] Climate change UK
Rosselló-Batle et al. (2010) [79] Spain
Li et al. (2010) [80] China
Process-based LCA (After COVID-19)
Yi Yang et al. (2024) [81] Transportation, accommodation, catering, and recreational activities Climate change China
Rui Cao et al. (2023) [82] Transportation, accommodation, activities, and catering Climate change China
Study Object of Analysis Primary environmental Impacts Assessed Geographical Scope
Input-output LCA (Pre COVID-19)
Scheepens et al. (2015) [83] Sector of regional tourism Climate change The Netherlands
Berners-Lee et al. (2011) [84] Large tourism business UK
Patterson and McDonald (2004) [85] National tourism industry New Zealand
Cadarso et al. (2015) [86] Spain
Zhong et al. (2015) [87] China
Qin et al. (2015) [88] Tourist destination
Manfred Lenzen (2018) [15] Global tourism 160 countries
Kitamura et al. (2020) [20] National tourism industry Japan
Kitamura et al. (2020) [89] MICE Japan
Rosenblum et al. (2000) [90] National hotel industry A range of impacts USA
Input-output LCA (After COVID-19)
Kitamura et al. (2020) [26] National tourism industry Climate change Japan
Pilar Osorio et al. (2023) [27] Spain
Table A2. Evaluation coverage.
GBR SWE ESP ROU PRT* LTU ITA HUN DEU* FRA* FIN CZE HRV MEX USA* CAN* AUS ZAF* KOR JPN* IDN
Rail
Road
Water
PTS
Ter
Air
Gas
DE
SGOP
Lodging
F&B
Cultural
S&R
Others
Travel agencies
Rail: Railroad Passenger Transportation, Road : Road Passenger Transportation, Water : Water Passenger Transportation, PTS : Passenger Transportation Support, Ter : Transportation equipment rental, Air : Air passenger, Gas : Gasoline, DE : Direct emissions in gasoline, SGOP : Sightseeing Goods, Other Products, Lodging : Lodging (Lodging and Real estate), F&B : Food and beverage provisioning services, Cultural : Cultural services (Museums, Art galleries, etc.), S&R : Sports and Recreation services (Amusement-related), Travel agencies, tour operators, and guides: Passenger agency services and other reservation services.
Table A3. Number of tourists from 2019 to 2021.
Inbound(Thousand) Domestic(Thousand)
2019 2020 2021 2019 2020 2021
Indonesia 16,107 4,053 722,159 518,589 603,020
Japan 31,882 4,116 246 587,103 293,408 268,208
Korea 17,503 344,750
South Africa 14,797 3,887 265,000 125,040
Saudi Arabia 4,882 48,399
Australia 9,466 1,828 246 365,797 236,706 242,543
Canada 32,430 275,418
United States 165,478 44,792 66,594 2,326,623 1,581,116 2,020,000
Mexico 97,406 51,128 55,301
Bulgaria 12,552 4,973 6,833 4,485
Croatia 60,021 10,445
Czech Republic 37,202 10,267 10,014
Finland
France 217,877 117,109 141,297 260,522 212,071 251,666
Germany
Hungary 61,397 47,923
Italy 95,399 132,858
Lithuania 6,150 2,284 2,096 14,785 11,389 11,593
Portugal
Romania 12,815 5,023 52,925 37,632
Spain 126,170 36,410 51,631 423,572 250,469 341,053
Sweden 56,171 128,792 122,669
United Kingdom 40,857 11,101 6,384 1,776,080
" - " refers to the part of the data acquisition that could not be done.
Table A4. Restrictions on internal movement.
Preprints 98018 i003
Restrictions
Level
Restrictions contents
0 No action
1 Recommended not to move across regions/cities
2 Introduced restrictions on domestic movement
Table A5. International travel controls.
Preprints 98018 i004
Restrictions
Level
Restrictions contents
0 No action
1 Screening upon entry into the country
2 Segregation of entrants from some or all areas
3 Ban on entry from some areas
4 Ban on entry from all regions or total closure of borders
Figure A1. Percentage reduction in emissions by life cycle (compared to 2019). (a) domestic tourism, (b) inbound tourism.
Preprints 98018 g0a1aPreprints 98018 g0a1b
Table A6. GHG emissions by category in Japan.
Domestic tourism Inbound tourism
Item kt-CO2e % kt-CO2e %
Air travel (domestic and local) 4.81.E+03 5.5% 5.39.E+01 0.4%
Air travel (international) 2.40.E+03 2.7% 1.03.E+03 7.1%
Shinkansen, railroad, monorail 5.55.E+03 6.3% 7.99.E+02 5.6%
Buses 9.91.E+02 1.1% 5.85.E+01 0.4%
Taxi/Hire car 2.94.E+02 0.3% 1.04.E+02 0.7%
Ship (domestic, local) 2.54.E+02 0.3% 5.46.E+00 0.0%
Vessel (ocean-going) 4.31.E+00 0.0% 2.15.E+00 0.0%
Car Rental/Car Sharing 8.97.E+02 1.0% 1.70.E+02 1.2%
Gasoline 3.89.E+03 4.4% 0.00.E+00 0.0%
Direct emission 2.26.E+04 25.7% 5.39.E+01 0.4%
Confectionery 4.64.E+03 5.3% 8.06.E+02 5.6%
Agricultural 6.27.E+02 0.7% 4.71.E+01 0.3%
Fisheries 2.81.E+02 0.3% 0.00.E+00 0.0%
Food items 3.04.E+03 3.5% 5.21.E+02 3.6%
Textile products 1.42.E+03 1.6% 3.71.E+02 2.6%
Leather products 3.86.E+02 0.4% 2.40.E+02 1.7%
Cosmetics 2.61.E+02 0.3% 1.40.E+03 9.8%
Ceramics and glass 4.86.E+01 0.1% 0.00.E+00 0.0%
Publication 6.51.E+01 0.1% 1.33.E+01 0.1%
Electrical products 8.08.E+01 0.1% 6.04.E+01 0.4%
Jewelry and precious metals 0.00.E+00 0.0% 2.19.E+01 0.2%
Other shopping 2.79.E+03 3.2% 3.32.E+02 2.3%
Lodging 1.13.E+04 12.9% 4.24.E+03 29.5%
Attributable rent of vacation home 9.35.E+02 1.1% 0.00.E+00 0.0%
Food and beverage 9.80.E+03 11.2% 3.59.E+03 25.0%
Other transportation 3.59.E+03 4.1% 1.91.E+01 0.1%
Hot springs, bathing facilities, esthetic clinics, relaxation 5.78.E+02 0.7% 2.53.E+01 0.2%
Theme parks/amusement parks 8.69.E+02 1.0% 1.10.E+02 0.8%
Art galleries, museums, archives, zoos and botanical gardens, aquariums, etc. 2.87.E+02 0.3% 6.08.E+01 0.4%
Ski lift 9.85.E+01 0.1% 3.49.E+01 0.2%
Sports facility usage 4.67.E+02 0.5% 6.35.E+00 0.0%
Sports games 8.47.E+01 0.1% 4.23.E+01 0.3%
Stage/music viewing 4.23.E+02 0.5% 1.97.E+01 0.1%
Exhibition/convention participation 1.02.E+02 0.1% 6.35.E+00 0.0%
Rental 3.02.E+02 0.3% 6.35.E+00 0.0%
Massage and medical 0.00.E+00 0.0% 1.59.E+01 0.1%
Other entertainment and other service 2.52.E+02 0.3% 3.73.E+01 0.3%
Travel insurance/credit card enrollment 1.89.E+02 0.2% 0.00.E+00 0.0%
Passport application 1.09.E+02 0.1% 0.00.E+00 0.0%
Visa application 0.00.E+00 0.0% 0.00.E+00 0.0%
Beauty salon/barber shop 4.78.E+02 0.5% 0.00.E+00 0.0%
Photo printing/developing 7.97.E+01 0.1% 0.00.E+00 0.0%
Clothes cleaning 1.05.E+02 0.1% 0.00.E+00 0.0%
Other 1.36.E+03 1.6% 6.35.E+00 0.0%
Travel agency revenue 9.27.E+02 1.1% 6.32.E+01 0.4%
Table A7. GHG emissions by category in the United States.
Domestic Inbound
Item kt-CO2e % kt-CO2e 0.0%
Domestic air transportation 6.39.E+04 8.8% 1.04.E+01 9.6%
International air transportation 2.50.E+04 3.4% 1.41.E+04 0.0%
Rail transportation 7.08.E+02 0.1% 0.00.E+00 0.1%
Water transportation 6.69.E+03 0.9% 1.79.E+02 0.0%
Bus 5.14.E+02 0.1% 0.00.E+00 0.0%
Charter bus 9.60.E+02 0.1% 3.34.E-01 0.2%
Local bus and other transportation 3.57.E+03 0.5% 2.67.E+02 0.1%
Taxicab 1.90.E+03 0.3% 1.32.E+02 0.0%
Scenic and sightseeing transportation 1.13.E+03 0.2% 2.99.E-01 0.2%
Automotive rental and leasing 1.24.E+04 1.7% 2.80.E+02 0.1%
Other vehicle rental and leasing 1.15.E+02 0.0% 1.03.E+02 5.3%
Gasoline 3.38.E+04 4.7% 7.76.E+03 61.8%
Direct emission 3.97.E+05 54.7% 9.11.E+04 7.5%
Shopping 3.08.E+04 4.2% 1.10.E+04 0.0%
All other commodities 0.00.E+00 0.0% 0.00.E+00 6.9%
Accommodations 4.79.E+04 6.6% 1.02.E+04 5.0%
Food and beverage 4.20.E+04 5.8% 7.34.E+03 0.0%
Automotive repair 3.83.E+03 0.5% 5.74.E-01 0.0%
Parking 6.81.E+02 0.1% 6.76.E+01 0.0%
Highway tolls 5.31.E+02 0.1% 0.00.E+00 1.2%
Motion pictures and performing arts 5.42.E+03 0.7% 1.77.E+03 0.5%
Spectator sports 1.23.E+03 0.2% 7.26.E+02 0.8%
Participant sports 6.00.E+03 0.8% 1.22.E+03 0.0%
Gambling 1.86.E+04 2.6% 2.06.E+01 0.7%
All other recreation and entertainment 2.33.E+03 0.3% 9.84.E+02 0.1%
Travel arrangement and reservation 1.84.E+04 2.5% 2.10.E+02 0.0%
Table A8. Change in GHG emissions, tourist consumption, and employment.
Preprints 98018 i005

References

  1. United Nations Framework Convention on Climate Change (UNFCCC). The Paris Agreement. Available at: https://unfccc.int/process-and-meetings/the-paris-agreement (accessed on 21 August 2023).
  2. United Nations Environment Programme (UNEP). Emissions Gap Report 2023. Available at: https://www.unep.org/resources/emissions-gap-report-2023 (accessed on 27 December 2023).
  3. United Nations World Tourism Organization (UNWTO). Climate Action: Transforming Tourism for Climate Action. Available online: https://www.unwto.org/sustainable-development/climate-action  (accessed on 27 December 2023).
  4. United Nations World Tourism Organization (UNWTO). Tourism Unites Behind the Glasgow Declaration on Climate Action at COP26. Available at: https://www.unwto.org/news/tourism-unites-behind-the-glasgow-declaration-on-climate-action-at-cop26 (accessed on 21 August 2023).
  5. United Nations World Tourism Organization (UNWTO). One Planet Vision for a Responsible Recovery of the Tourism Sector. Available at: https://webunwto.s3.eu-west-1.amazonaws.com/s3fs-public/2020-12/en-brochure-one-planet-vision-responsible-recovery.pdf (accessed on 21 August 2023).
  6. United Nations World Tourism Organization (UNWTO). Tourism at COP28: Delivering on the Climate Action Commitments of the Glasgow Declaration. Available at: https://www.unwto.org/news/tourism-at-cop28-delivering-on-the-climate-action-commitments-of-the-glasgow-declaration (accessed on 21 August 2023).
  7. United Nations World Tourism Organization (UNWTO). Glasgow Declaration Implementation Report 2023 – Advancing Climate Action. Available at: https://www.e-unwto.org/doi/epdf/10.18111/9789284425242 (accessed on 26 January 2024).
  8. United Nations World Tourism Organization (UNWTO). International Tourism and COVID-19. Available at: https://www.unwto.org/tourism-data/international-tourism-and-covid-19 (accessed on 11 October 2023).
  9. United Nations World Tourism Organization (UNWTO). Impact Assessment of the COVID-19 Outbreak on International Tourism. Available at: https://www.unwto.org/impact-assessment-of-the-covid-19-outbreak-on-international-tourism (accessed on 11 October 2023).
  10. World Tourism Organization (UNWTO). (2023). International Tourism Highlights – 2023 Edition. Available online: https://static.poder360.com.br/2023/09/relatorio-Organizacao-Mundial-Turismo-ONU-2022.pdf (accessed on 23 August 2023).
  11. United Nations World Tourism Organization (UNWTO). Tourism and COVID-19: Unprecedented Economic Impacts. Available at: https://www.unwto.org/tourism-and-covid-19-unprecedented-economic-impacts (accessed on 23 August 2023).
  12. United Nations World Tourism Organization (UNWTO). Sustainable Tourism for Development Guidebook - Enhancing capacities for Sustainable Tourism for development in developing countries. Available at: https://www.e-unwto.org/doi/epdf/10.18111/9789284415496.
  13. UNWTO Asia Pacific. Why Tourism Definition. Available at: https://unwto-ap.org/why/tourism-definition/ (accessed on 21 August 2023).
  14. Filimonau, V. Life Cycle Assessment (LCA) and Life Cycle Analysis in Tourism; Springer International Publishing: Cham, Switzerland, 2016. [Google Scholar]
  15. Lenzen, M.; Sun, Y.; Faturay, F.; Ting, Y.; Geschke, A.; Malik, A. The carbon footprint of global tourism. Nat. Climate Chang. 2018, 8, 522–528. [Google Scholar] [CrossRef]
  16. Dwyer, L.; Forsyth, P.; Spurr, R.; Hoque, S. Estimating the Carbon Footprint of Australian Tourism. J. Sustain. Tour. 2010, 18, 355–376. [Google Scholar] [CrossRef]
  17. Luo, F.; Moyle, B.D.; Moyle, C.J.; Zhong, Y.; Shi, S. Drivers of Carbon Emissions in China’s Tourism Industry. J. Sustain. Tour. 2020, 28, 747–770. [Google Scholar] [CrossRef]
  18. Meng, W.; Xu, L.; Hu, B.; Zhou, J.; Wang, Z. Quantifying Direct and Indirect Carbon Dioxide Emissions of the Chinese Tourism Industry. J. Clean. Prod. 2016, 126, 586–594. [Google Scholar] [CrossRef]
  19. Sharp, H.; Grundius, J.; Heinonen, J. Carbon Footprint of Inbound Tourism to Iceland: A Consumption-Based Life-Cycle Assessment including Direct and Indirect Emissions. Sustainability 2016, 8, 1147. [Google Scholar] [CrossRef]
  20. Kitamura, Y.; Ichisugi, Y.; Karkour, S.; Itsubo, N. Carbon Footprint Evaluation Based on Tourist Consumption toward Sustainable Tourism in Japan. Sustainability 2020, 12, 2219. [Google Scholar] [CrossRef]
  21. Patterson, M.G.; McDonald, G. How Clean and Green Is New Zealand Tourism? Lifecycle and Future Environmental Impacts; Manaaki Whenua Press: Lincoln, New Zealand, 2004. [Google Scholar]
  22. Sun, Y.-Y.; Higham, J. Overcoming Information Asymmetry in Tourism Carbon Management: The Application of a New Reporting Architecture to Aotearoa New Zealand. Tourism Management 2021, 83, 104231. [Google Scholar] [CrossRef]
  23. Cadarso, M.-Á.; Gómez, N.; López, L.-A.; Tobarra, M.-Á.; Zafrilla, J.-E. Quantifying Spanish Tourism's Carbon Footprint: The Contributions of Residents and Visitors: A Longitudinal Study. Journal of Sustainable Tourism 2015, 23, 922–946. [Google Scholar] [CrossRef]
  24. Berners-Lee, M.; Howard, D.C.; Moss, J.; Kaivanto, K.; Scott, W.A. Greenhouse Gas Footprinting for Small Businesses—The Use of Input–Output Data. Science of The Total Environment 2011, 409, 883–891. [Google Scholar] [CrossRef]
  25. Rosenblum, J.; Horvath, A.; Hendrickson, C. Environmental Implications of Service Industries. Environmental Science & Technology 2000, 34, 4669–4676. [Google Scholar]
  26. Kitamura, Y.; Karkour, S.; Ichisugi, Y.; Itsubo, N. Evaluation of the Economic, Environmental, and Social Impacts of the COVID-19 Pandemic on the Japanese Tourism Industry. Sustainability 2020, 12, 10302. [Google Scholar] [CrossRef]
  27. Osorio, P.; Cadarso, M.-Á.; Tobarra, M.-Á.; García-Alaminos, Á. Carbon Footprint of Tourism in Spain: COVID-19 Impact and a Look Forward to Recovery. Structural Change and Economic Dynamics 2023, 65, 303–318. [Google Scholar] [CrossRef] [PubMed]
  28. Kochar, D. The Economic Benefits of Inbound Tourism: Boosting Local Economies. Journal of Tourism & Hospitality 2022, 11, 521. Available online: https://www.longdom.org/open-access/the-economic-benefits-of-inbound-tourism-boosting-local-economies-99108.html.
  29. Abbasi, I. What Is Domestic Tourism? Available online: https://iqbalfreetips.com/2023/03/what-is-domestic-tourism.html (accessed on 11 October 2023).
  30. Organisation for Economic Co-operation and Development (OECD). OECD Tourism Trends and Policies 2022. Available online: https://www.oecd-ilibrary.org/industry-and-services/oecd-tourism-trends-and-policies_20767773 (accessed on 11 October 2023).
  31. United Nations. International Standard Industrial Classification of All Economic Activities (ISIC), Rev.4. August 2008. Available online: https://www.un-ilibrary.org/content/books/9789211561760 (accessed on 11 October 2023).
  32. Leontief, W.W. Input–Output Economics, 2nd ed.; Oxford University Press: New York, NY, USA, 1986. [Google Scholar]
  33. International Energy Agency (IEA). End-Use Prices Data Explorer. Last updated 28 Apr 2023. Available online: https://www.iea.org/data-and-statistics/data-tools/end-use-prices-data-explorer (accessed on 22 August 2023).
  34. World Bank. World Development Indicators: Exchange Rates and Prices. Available at: https://wdi.worldbank.org/table/4.16 (accessed on 22 August 2023).
  35. Organisation for Economic Co-operation and Development (OECD). Tourism Satellite Account. Available at: https://www.oecd.org/cfe/tourism/TSA_EN.pdf (accessed on 11 October 2023).
  36. World Bank. GDP (current US$). Available online: https://wdi.worldbank.org/table/4.16 (accessed on 22 August 2023).
  37. United Nations World Tourism Organization (UNWTO). Key Tourism Statistics. Available at: https://www.unwto.org/tourism-statistics/key-tourism-statistics (accessed on 11 October 2023).
  38. Institute of Southeast Asian Studies (ISEAS). Towards More Sustainable Agro-Food Systems in Indonesia. Available at: https://www.iseas.edu.sg/wp-content/uploads/2023/01/ISEAS_Perspective_2023_15.pdf (accessed on 11 October 2023).
  39. International Institute for Sustainable Development (IISD). South Africa Launches Green Transport Strategy. SDG Knowledge Hub. 2019, July 2. Available at: https://sdg.iisd.org/news/south-africa-launches-green-transport-strategy/ (accessed on 11 October 2023).
  40. Office for National Statistics (ONS). Road Transport and Air Emissions. 2019, September 16. Available at: https://www.ons.gov.uk/economy/environmentalaccounts/articles/roadtransportandairemissions/2019-09-16 (accessed on 11 October 2023).
  41. Ministry of Finance. (2022). Current Status and Future Prospects of Tourism in Japan. Available online: https://www.mof.go.jp/public_relations/finance/202110/202110j.pdf (accessed on 24 October 2023).
  42. VisitBritain. Inbound Visits and Spend - Annual UK. Available at: https://www.visitbritain.org/research-insights/inbound-visits-and-spend-annual-uk (accessed on 24 October 2023).
  43. Ministry for the Ecological Transition, France. GHG Emissions from Transportation in Climate Change Observations - December 2022 Edition. Available at: https://www.statistiques.developpement-durable.gouv.fr/edition-numerique/chiffres-cles-du-climat-decembre-2022/en/11-ghg-emissions-from-transportation (accessed on 24 October 2023).
  44. Tengvall-Unadike, Unni. Finland’s COVID-19 Policy Actions: Balancing Between Legal Boundaries, Human Rights and Controlling Viral Spread. Master's Thesis, University of Eastern Finland, Faculty of Health Sciences, School of Medicine, Public Health and Clinical Nutrition, June 22, 2021. Available online: http://urn.fi/urn:nbn:fi:uef-20211039 (accessed on 11 November 2023).
  45. Finnish Government. Evaluation: Coronavirus Pandemic Reduced Tourist Spending by Over 40% in Finland in 2020. 2021, February 22. Available at: https://valtioneuvosto.fi/en/-/1410877/evaluation-coronavirus-pandemic-reduced-tourist-spending-by-over-40-in-finland-in-2020 (accessed on 11 November 2023).
  46. Bruno, A.; Davis, K.; Staib, A. The Recovery in the Australian Tourism Industry. Reserve Bank of Australia Bulletin 2022, December. Available at: https://www.rba.gov.au/publications/bulletin/2022/dec/the-recovery-in-the-australian-tourism-industry.html (accessed on 11 November 2023).
  47. Caravan Industry Association of Australia. 2020 Caravan and Campervan Data Report. December 2020. Available at: https://caravanstats.com.au/wp-content/uploads/2020/12/2020-Caravan-and-Campervan-Data-Report.pdf (accessed on 11 November 2023).
  48. Hale, T., Angrist, N., Goldszmidt, R., Kira, B., Petherick, A., Phillips, T., Webster, S., Cameron-Blake, E., Hallas, L., Majumdar, S., & Tatlow, H. (2021). A global panel database of pandemic policies (Oxford COVID-19 Government Response Tracker). Nature Human Behaviour. [CrossRef]
  49. Ludvigsson, J.F. The first eight months of Sweden’s COVID-19 strategy and the key actions and actors that were involved. Acta Paediatrica 2020, 109, 2459–2471. [Google Scholar] [CrossRef] [PubMed]
  50. Australian National Audit Office (ANAO). Auditor-General Report 2021-22_12. September 2022. Available at: https://www.anao.gov.au/sites/default/files/2022-09/Auditor-General_Report_2021-22_12.pdf (accessed on 5 January 2024).
  51. Ballotpedia. Travel Restrictions Issued by States in Response to the Coronavirus (COVID-19) Pandemic, 2020-2022. Available at: https://ballotpedia.org/Travel_restrictions_issued_by_states_in_response_to_the_coronavirus_(COVID-19)_pandemic,_2020-2022 (accessed on 5 January 2024).
  52. Organisation for Economic Co-operation and Development (OECD). OECD Tourism Trends and Policies. Available at: https://www.oecd-ilibrary.org/industry-and-services/oecd-tourism-trends-and-policies_20767773 (accessed on 11 November 2023).
  53. Bank of Japan. Current State and Challenges of the Tourism Industry. September 2023. Available online: https://www.boj.or.jp/finsys/c_aft/data/aft230928a1.pdf (accessed on 15 November 2023).
  54. Ministry of Land, Infrastructure, Transport and Tourism, Japan. Automobiles in Numbers. Available online: https://www.mlit.go.jp/jidosha/jidosha_fr1_000084.html (accessed on 15 November 2023).
  55. Ministry of Health, Labour and Welfare, Japan. 2021 Employment Trend Survey. Available online: https://www.mhlw.go.jp/toukei/itiran/roudou/koyou/doukou/22-2/index.html (accessed on 15 November 2023).
  56. Japan Association of Travel Agents (JATA). The Numbers Tell the Story of the Travel Industry 2023. Available online: https://www.jata-net.or.jp/wp/wp-content/uploads/administrator/2023_sujryoko.pdf (accessed on 15 November 2023).
  57. Bureau of Labor Statistics (BLS). State Unemployment Rates by Rank. Available at: https://www.bls.gov/lau/lastrk20.html (accessed on 15 November 2023).
  58. International Air Transport Association (IATA). Executive Summary - Net Zero Roadmaps. Available at: https://www.iata.org/contentassets/8d19e716636a47c184e7221c77563c93/executive-summary---net-zero-roadmaps.pdf (accessed on 15 November 2023).
  59. JAPAN AIRLINES (JAL). JAL and Shell Aviation sign purchase agreement to replace fuel uplifted in Los Angeles with SAF. Available online: https://press.jal.co.jp/ja/release/202306/007455.html (accessed on 15 November 2023).
  60. Euronews. It's Official: France Bans Short-Haul Domestic Flights in Favour of Train Travel. 2022, December 2; updated 2023, May 23. Available at: https://www.euronews.com/green/2022/12/02/is-france-banning-private-jets-everything-we-know-from-a-week-of-green-transport-proposals (accessed on 20 October 2023).
  61. MakeUseOf. What Is VR Tourism and Benefits? Available at: https://www.makeuseof.com/what-is-vr-tourism-and-benefits/ (accessed on 20 October 2023).
  62. World Economic Forum. How Virtual Reality is Taking Tourism to New Heights During the Pandemic. 2021, May. Available at: https://www.weforum.org/agenda/2021/05/covid-19-travel-tourism-virtual-reality/ (accessed on 20 October 2023).
  63. De-la-Cruz-Diaz, M.; Alvarez-Risco, A.; Jaramillo-Arévalo, M.; Lenti-Dulong, M.F.; Calle-Nole, M.; Anderson-Seminario, M.d.l.M.; Del-Aguila-Arcentales, S. Virtual Tourism, Carbon Footprint, and Circularity. In Environmental Footprints and Eco-Design of Products and Processes; pp. 245–263.
  64. Contreras-Taica, A.; Alvarez-Risco, A.; Arias-Meza, M.; Campos-Dávalos, N.; Calle-Nole, M.; Almanza-Cruz, C.; Anderson-Seminario, M.d.l.M.; Del-Aguila-Arcentales, S. Virtual Education: Carbon Footprint and Circularity. In Environmental Footprints and Eco-Design of Products and Processes; pp. 265–285.
  65. Sustainable Hospitality Alliance. Hotel Carbon Measurement Initiative (HCMI). Available at: https://sustainablehospitalityalliance.org/resource/hotel-carbon-measurement-initiative/ (accessed on 15 November 2023).
  66. Castellani, V.; Sala, S. Ecological Footprint and Life Cycle Assessment in the sustainability assessment of tourism activities. Ecol. Indic. 2012, 16, 135–147. [Google Scholar] [CrossRef]
  67. Filimonau, V.; Dickinson, J.; Robbins, D.; Reddy, M.V. A critical review of methods for tourism climate change appraisal: Life cycle assessment as a new approach. J. Sustain. Tour. 2011, 19, 301–324. [Google Scholar] [CrossRef]
  68. Filimonau, V.; Dickinson, J.; Robbins, D. The carbon impact of short-haul tourism: A case study of UK travel to Southern France using life cycle analysis. J. Clean. Prod. 2014, 64, 628–638. [Google Scholar] [CrossRef]
  69. El Hanandeh, A. Quantifying the carbon footprint of religious tourism: The case of Hajj. J. Clean. Prod. 2013, 52, 53–60. [Google Scholar] [CrossRef]
  70. Pereira, R.P.T.; Glaydston, M.B.; Filimonau, V. The carbon implications of local visitor travel in Brazil: A case of the Rio de Janeiro and São Paolo itinerary. J. Clean. Prod. 2017, 141, 256–266. [Google Scholar] [CrossRef]
  71. Filimonau, V.; Dickinson, J.; Robbins, D.; Reddy, M.V. The role of ‘indirect’ greenhouse gas emissions in tourism: Assessing the hidden carbon impacts from a holiday package tour. Transp. Res. Part A 2013, 54, 78–91. [Google Scholar] [CrossRef]
  72. Kuo, N.W.; Hsiao, T.Y.; Lan, C.F. Tourism management and industrial ecology: A case study of food service in Taiwan. Tour. Manag. 2005, 26, 503–508. [Google Scholar] [CrossRef]
  73. Michailidou, A.V.; Vlachokostas, C.; Maleka, D.; Feleke, E.; Moussiopoulos, N. Life cycle impact approach to promote sustainable tourism: A case study from Greek hotels. In Proceedings of the 14th International Conference on Environmental Science and Technology, Rhodes, Greece, 3–5 September 2015. [Google Scholar]
  74. König, H.; Schmidberger, E.; de Cristofaro, L. Life cycle assessment of a tourism resort with renewable materials and traditional techniques. In Proceedings of the ‘Portugal SB07, Sustainable Construction, Materials and Practice—Challenge of the Industry for the New Millennium’ Conference, Lisbon, Portugal, 12–14 September 2007. [Google Scholar]
  75. Sára, B.; Raggi, A.; Petti, L.; Scimìa, E. Implementation of LCA to services: Case studies in the hospitality industry. In Proceedings of the 6th International Conference on EcoBalance, Tsukuba, Japan, 25–27 October 2004. [Google Scholar]
  76. De Camillis, C.; Petti, L.; Raggi, A. LCA: A key-tool for Sustainable Tourism? In Proceedings of the 8th International Conference on EcoBalance, Tokyo, Japan, 10–12 December 2008.
  77. Cerutti, A.K.; Beccaro, G.L.; Bruun, S.; Donno, D.; Bonvegna, L.; Bounous, G. Assessment methods for sustainable tourism declarations: The case of holiday farms. J. Clean. Prod. 2016, 111, 511–519. [Google Scholar] [CrossRef]
  78. Filimonau, V.; Dickinson, J.E.; Robbins, D.; Huijbregts, M.A.J. Reviewing the carbon footprint analysis of hotels: Life Cycle Energy Analysis (LCEA) as a holistic method for carbon impact appraisal of tourist accommodation. J. Clean. Prod. 2011, 19, 1917–1930. [Google Scholar] [CrossRef]
  79. Rosselló-Batle, B.; Moiá, A.; Cladera, A.; Martínez, V. Energy use, CO2 emissions and waste throughout the life cycle of a sample of hotels in the Balearic Islands’. Energy Build. 2010, 42, 547–558. [Google Scholar] [CrossRef]
  80. Li, P.; Huang, J.H.; Mo, Y.F.; Yang, G.H. Carbon footprint calculation and analysis of accommodation services in four-star hotels of Kunming. Tour. Trib. 2010, 25, 27–34. [Google Scholar]
  81. Yang, Y.; Guo, X. Characteristics and drivers of changes in the carbon footprint of urban tourism in the post-COVID-19 era: A case study of Xi’an. Journal of Cleaner Production 2024, 434, 140015. [Google Scholar] [CrossRef]
  82. Cao, Rui; Mo, Yanhua; Ma, Jiangming. Carbon Footprint Analysis of Tourism Life Cycle: The Case of Guilin from 2011 to 2022. Sustainability (Switzerland) 2023, 15(9), 7124. [Google Scholar] [CrossRef]
  83. Scheepens, A.E.; Vogtländer, J.G.; Brezet, J.C. Two life cycle assessment (LCA) based methods to analyse and design complex (regional) circular economy systems. Case: Making water tourism more sustainable. J. Clean. Prod. 2016, 114, 257–268. [Google Scholar]
  84. Berners-Lee, M.; Howard, D.C.; Moss, J.; Kaivanto, K.; Scott, W.A. Greenhouse gas footprinting for small businesses—The use of input–output data. Sci. Total Environ. 2011, 409, 883–891. [Google Scholar] [CrossRef] [PubMed]
  85. Patterson, M.G.; McDonald, G. How Clean and Green is New Zealand Tourism? Lifecycle and Future Environmental Impacts; Manaaki Whenua Press: Lincoln, New Zealand, 2004. [Google Scholar]
  86. Cadarso, M.-Á.; Gómez, N.; López, L.-A.; Tobarra, M.-Á.; Zafrilla, J.-E. Quantifying Spanish tourism’s carbon footprint: The contributions of residents and visitors: A longitudinal study. J. Sustain. Tour. 2015, 23, 922–946. [Google Scholar] [CrossRef]
  87. Zhong, Y.; Shi, S.; Li, S.; Luo, F. Empirical research on construction of a measurement framework for tourism carbon emission in China. Chin. J. Popul. Resour. Environ. 2015, 13, 240–249. [Google Scholar] [CrossRef]
  88. Qin, Y.; Li, X.; Rong, P. Urban tourism carbon accounting based on improved EIO-LCA model: A case study of Kaifeng City in Henan Province. Prog. Geogr. 2015, 34, 132–140. [Google Scholar]
  89. Kitamura, Y.; Karkour, S.; Ichisugi, Y.; Itsubo, N. Carbon Footprint Evaluation of the Business Event Sector in Japan. Sustainability 2020, 12, 5001. [Google Scholar] [CrossRef]
  90. Rosenblum, J.; Horvath, A.; Hendrickson, C. Environmental implications of service industries. Environ. Sci. Technol. 2000, 34, 4669–4676. [Google Scholar] [CrossRef]
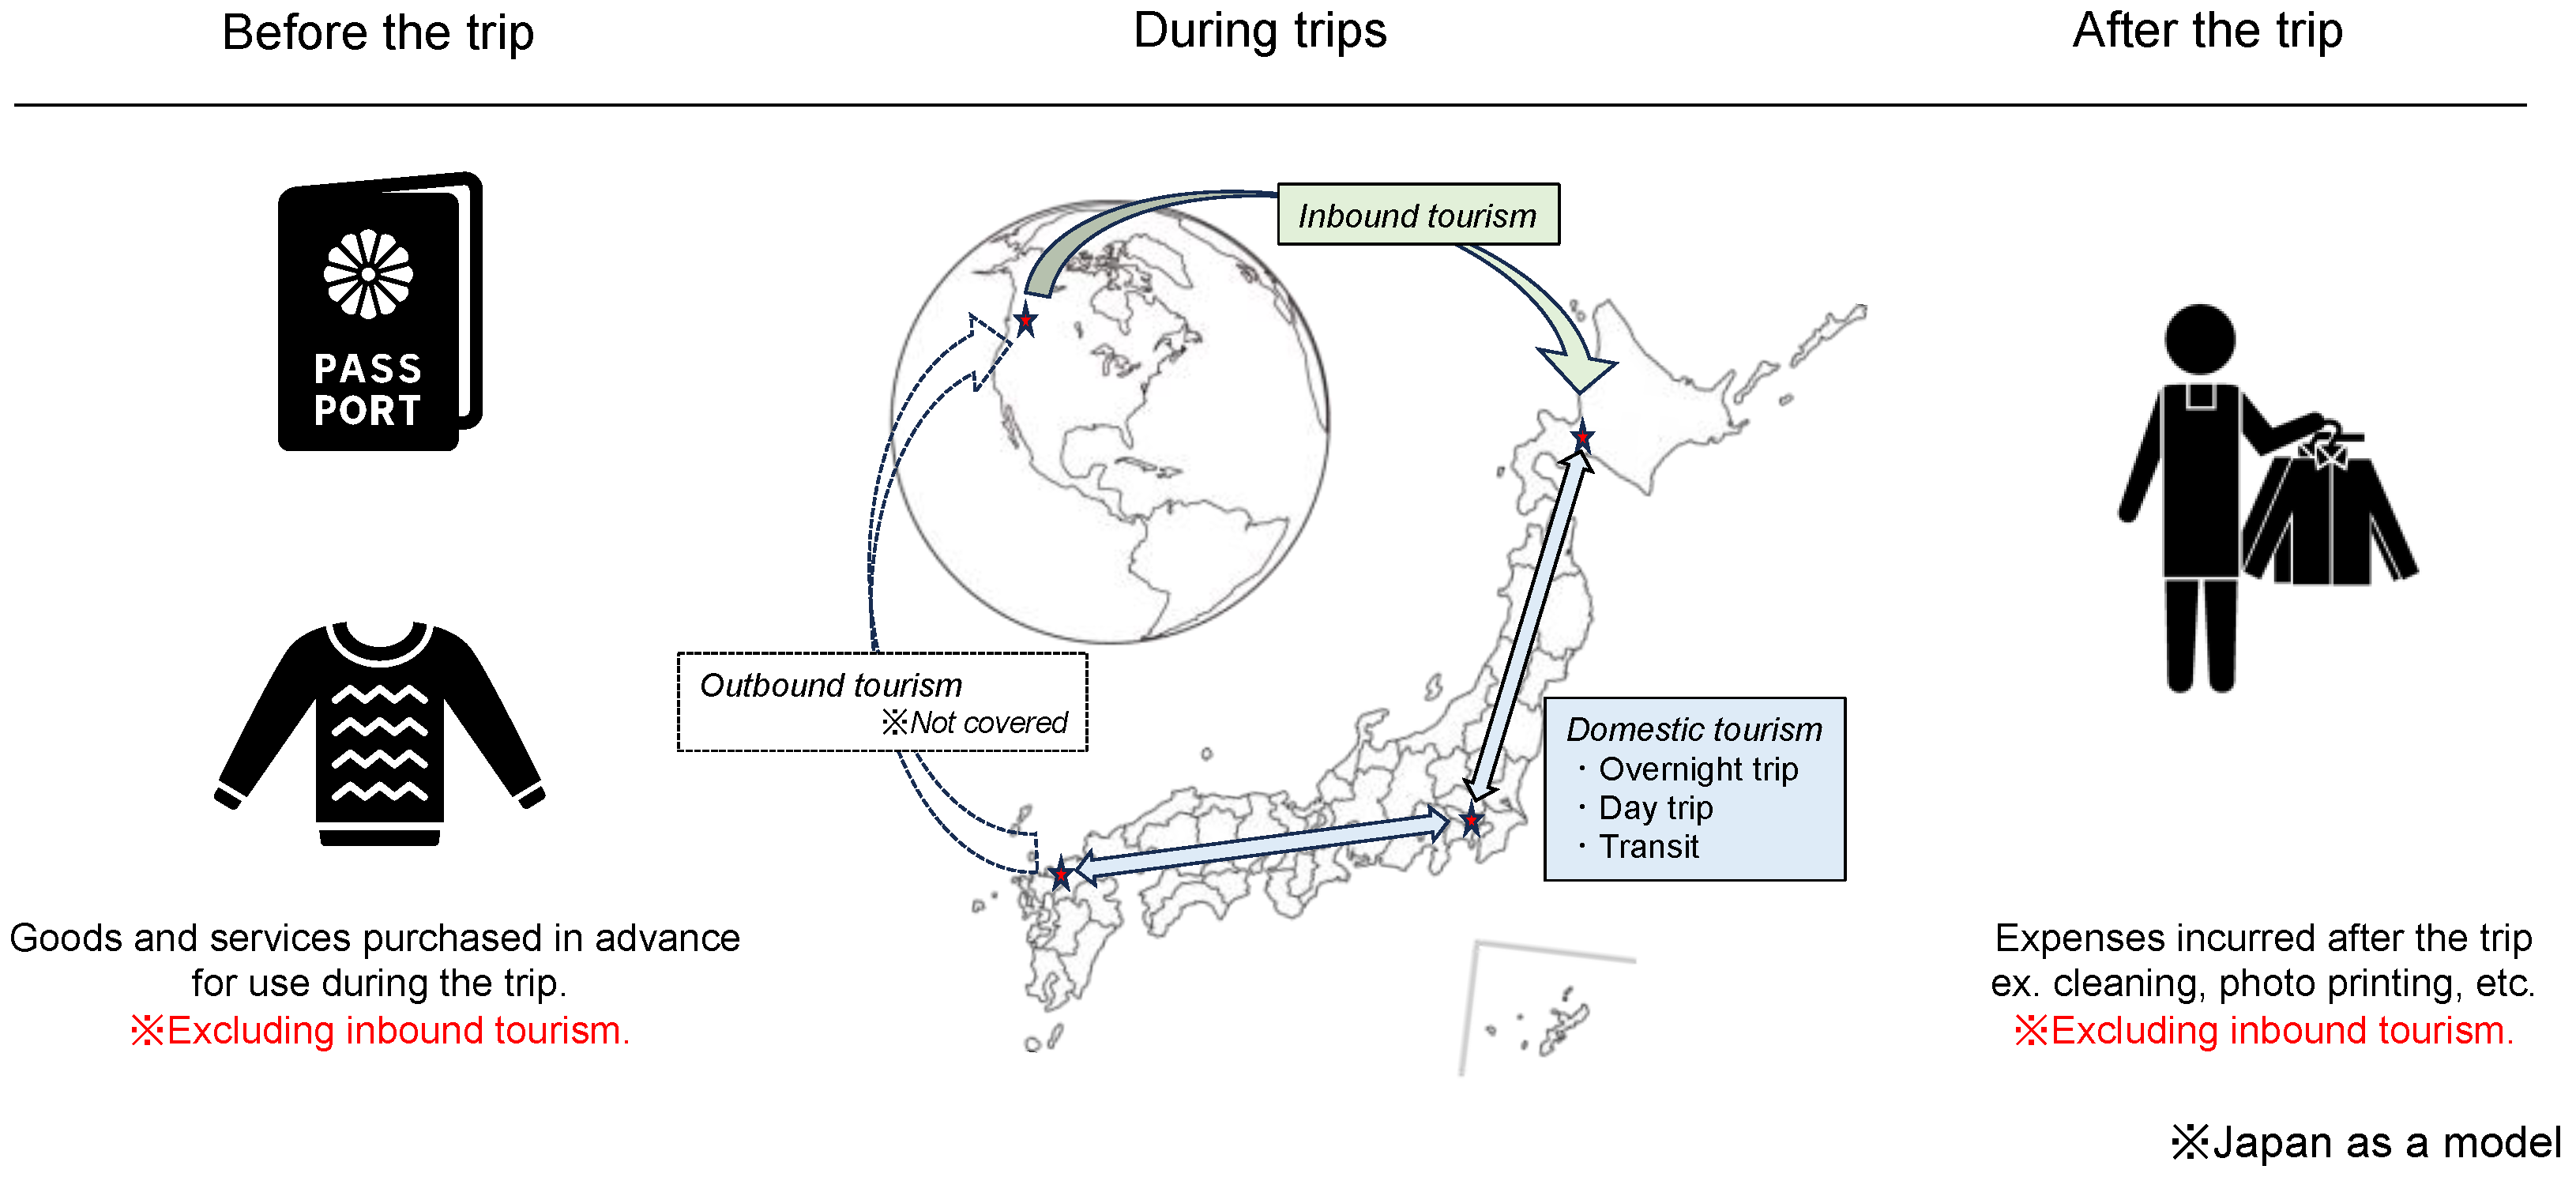
Figure 1. System boundaries.
Preprints 98018 g001
Figure 2. Relationship between the number of tourists, GDP, and GHG emissions. (a) All tourism; (b) domestic tourism; (c) inbound tourism. X-axis: GDP [36]; y-axis: tourists [37]; bubble: GHG emissions (kt-CO2e). The number of tourists is shown in Table A3 of Appendix A.
Preprints 98018 g002aPreprints 98018 g002b
Figure 3. Percentage of emissions by life cycle in each country and average percentage of emissions by life cycle. (a) Domestic tourism; (b) inbound tourism.
Preprints 98018 g003
Figure 4. Percentage of emissions by life cycle in each country. (a) domestic tourism; (b) inbound tourism. X-axis: GDP; y-axis: number of tourists; bubble: GHG emissions (kt-CO2e). The number of tourists is shown in Table A3 of Appendix A.
Preprints 98018 g004
Figure 5. Percentage reduction in emissions by life cycle (compared to 2019). (a) domestic tourism; (b) inbound tourism. The results for the year 2020 alone are shown in Appendix A, Figure A1.
Preprints 98018 g005aPreprints 98018 g005b
Table 1. Evaluation countries, data used, and data year.
Country TSA OECD 2019 2020 2021
Asia Indonesia -
Japan*
Korea - -
Africa South Africa* -
Middle East Saudi Arabia - -
Oceania Australia
North America Canada - -
United States*
Latin America Mexico
EU Croatia - -
Czech Republic
Finland* -
France*
Germany* - -
Hungary - -
Italy - -
Lithuania
Portugal* - -
Romania -
Spain
Sweden
United Kingdom -
The asterisk (*) indicates consideration of direct emissions from gasoline combustion.
Table 2. Scope of evaluation.
Category Scope
Transport Railroad passenger transportation business
Road passenger tansportation services
Water passenger transportation services
Passenger transportation support services
Transportation equipment rental services
Air passenger transport
Gasoline
Direct emissions from gasoline
Souvenirs Sightseeing goods, other products
Accommodation Lodging (lodging and real estate)
Food and Beverage Food and beverage provisioning services
Activities Cultural services (museums, art galleries, etc.)
Sports and recreation services (amusement-related)
Others
Travel agencies, tour operators, and guides Passenger agency services and other reservation services
Disclaimer/Publisher’s Note: The statements, opinions and data contained in all publications are solely those of the individual author(s) and contributor(s) and not of MDPI and/or the editor(s). MDPI and/or the editor(s) disclaim responsibility for any injury to people or property resulting from any ideas, methods, instructions or products referred to in the content.
Copyright: This open access article is published under a Creative Commons CC BY 4.0 license, which permit the free download, distribution, and reuse, provided that the author and preprint are cited in any reuse.
Prerpints.org logo

Preprints.org is a free preprint server supported by MDPI in Basel, Switzerland.

Subscribe

© 2024 MDPI (Basel, Switzerland) unless otherwise stated