Submitted:
02 February 2024
Posted:
02 February 2024
You are already at the latest version
Abstract
Keywords:
1. Introduction
2. Materials and Methods
2.1. Materials
2.2. Extraction of Casein
2.3. Membrane Synthesis
2.4. Attenuated Total Reflectance-Fourier Transform Infrared Spectroscopy (ATR-FTIR)
2.5. X-Ray Diffraction (XRD)
2.6. Thermogravimetric Analysis (TGA)
2.7. Dynamic Mechanical Analysis (DMA)
2.8. Mechanical Properties
2.9. Scanning Electron Microscopy (SEM)
2.10. Water Vapor Transmission Rate Measurements-Water Diffusion Coefficient Calculation
2.11. Oxygen Transmission Rate Measurements-Oxygen Permeability Calculation
3. Results
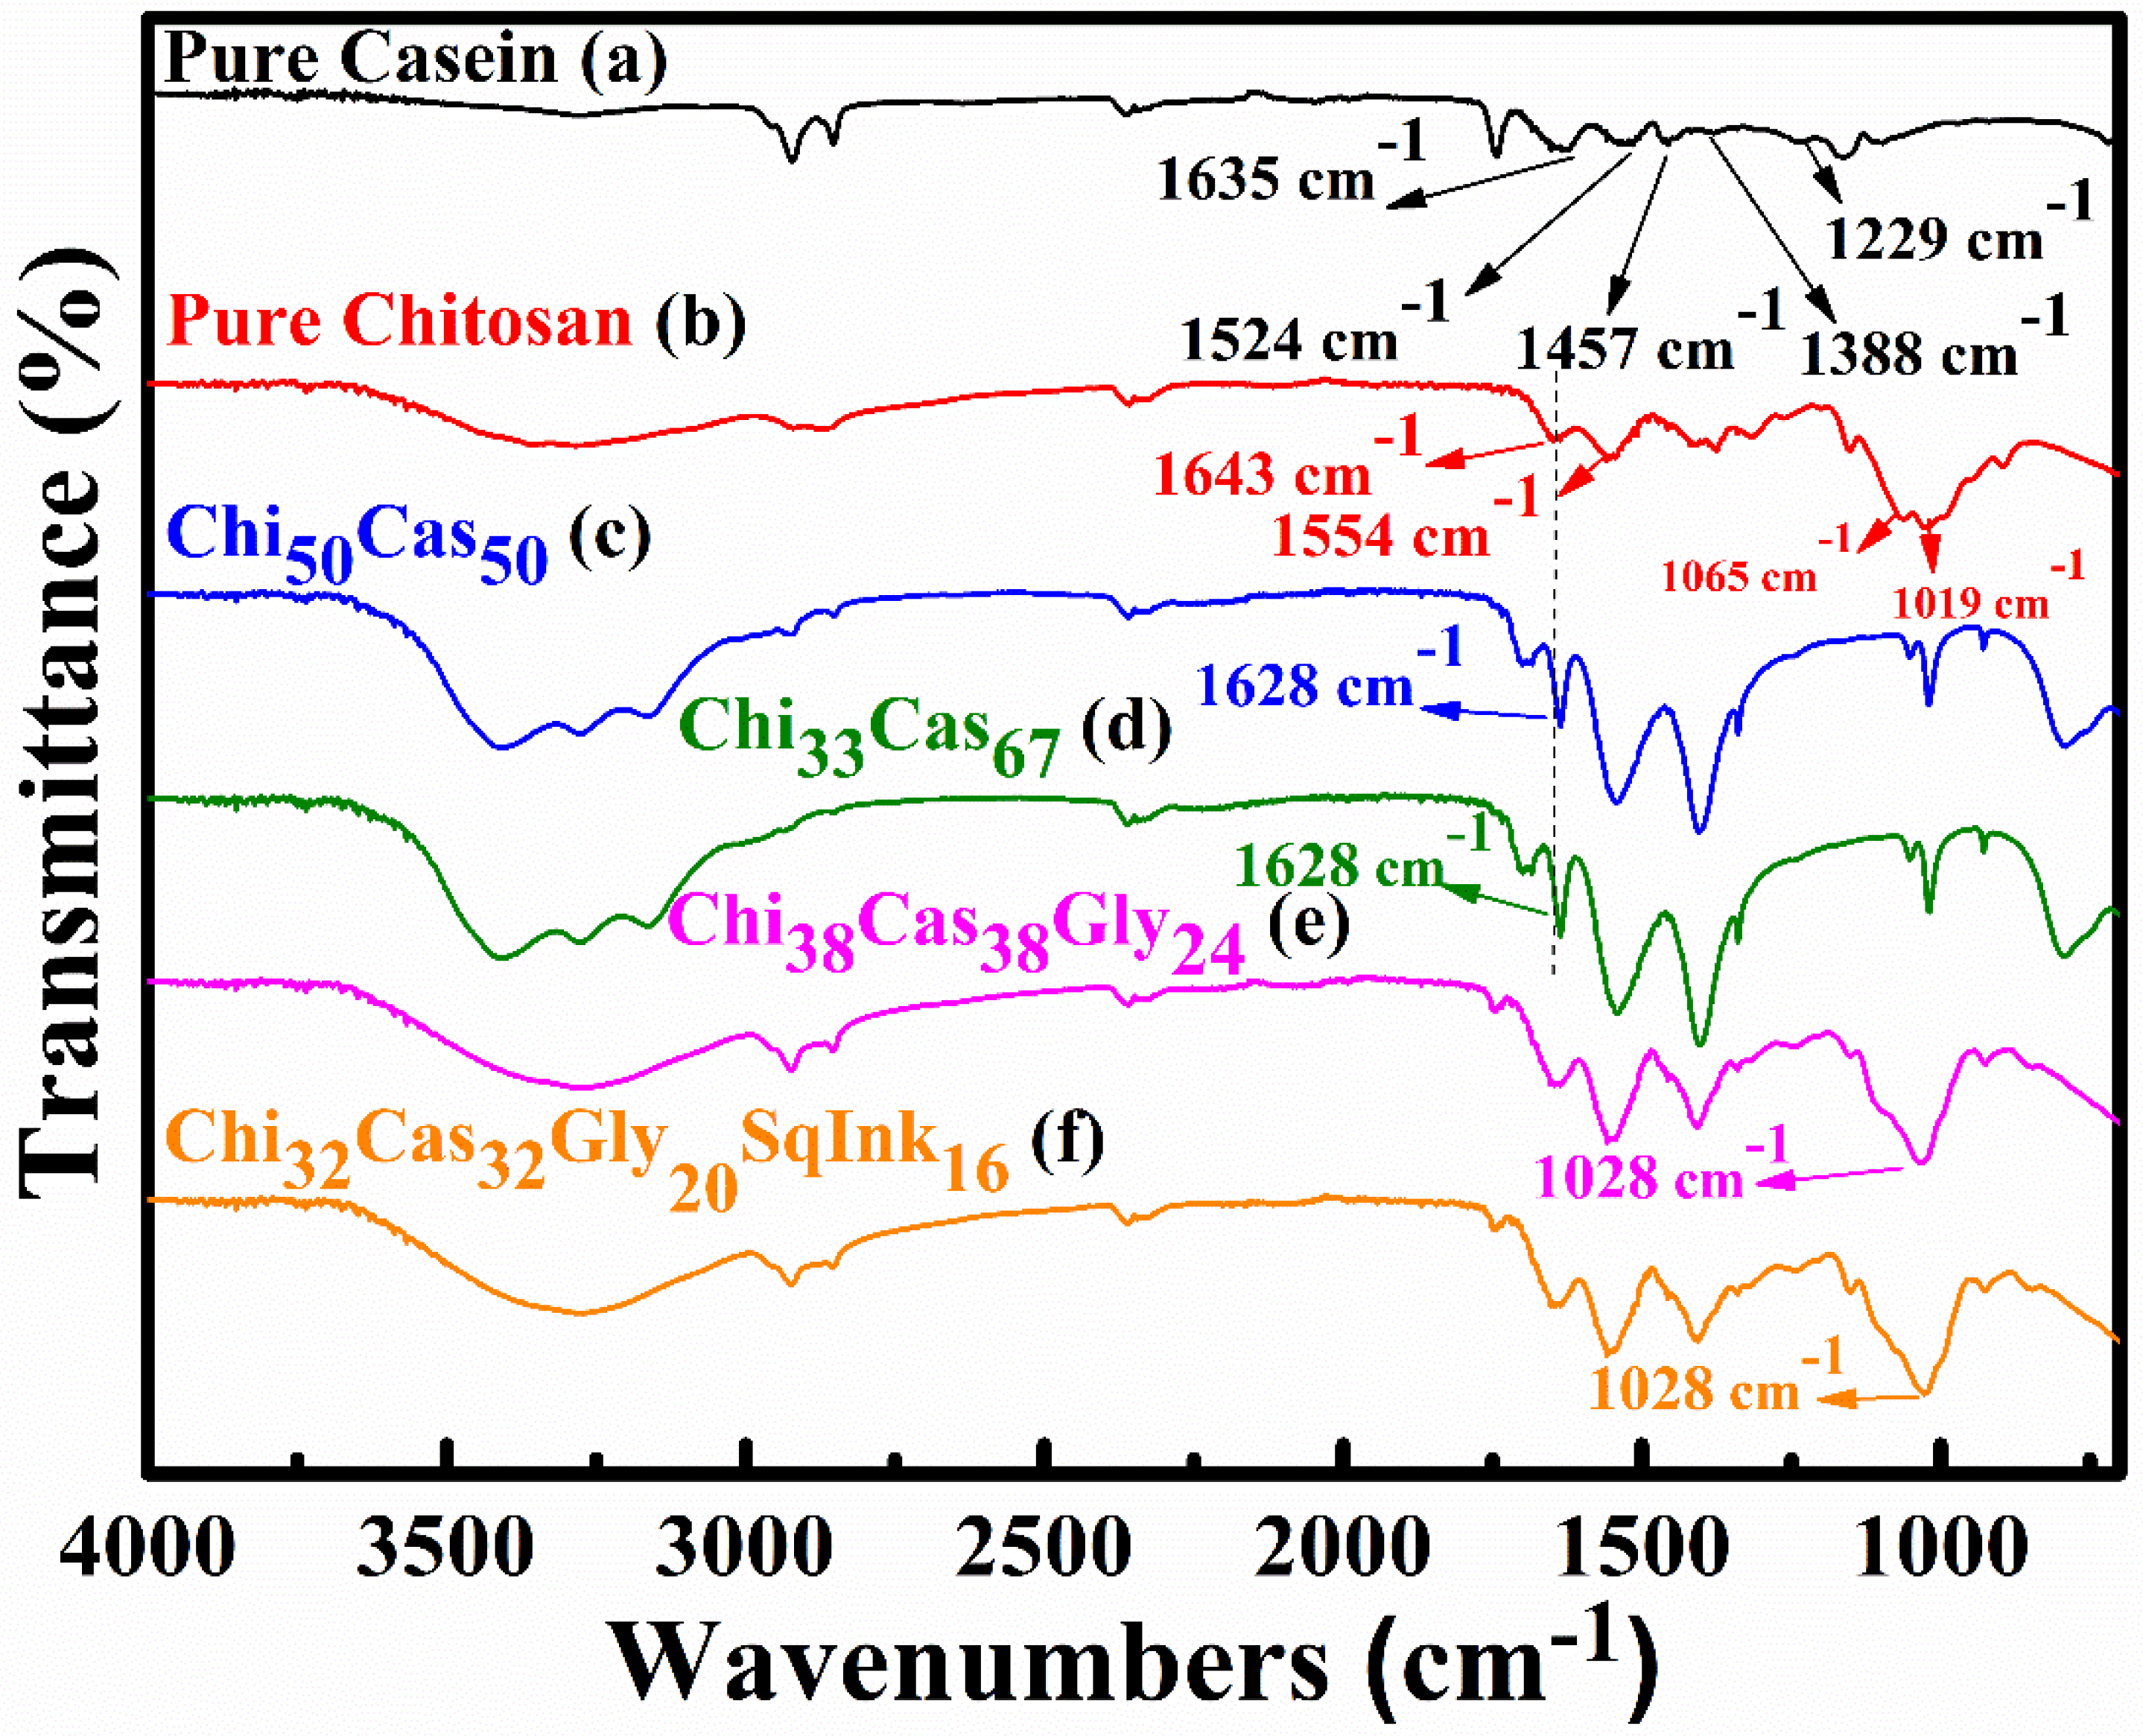
3.1. ATR-FTIR
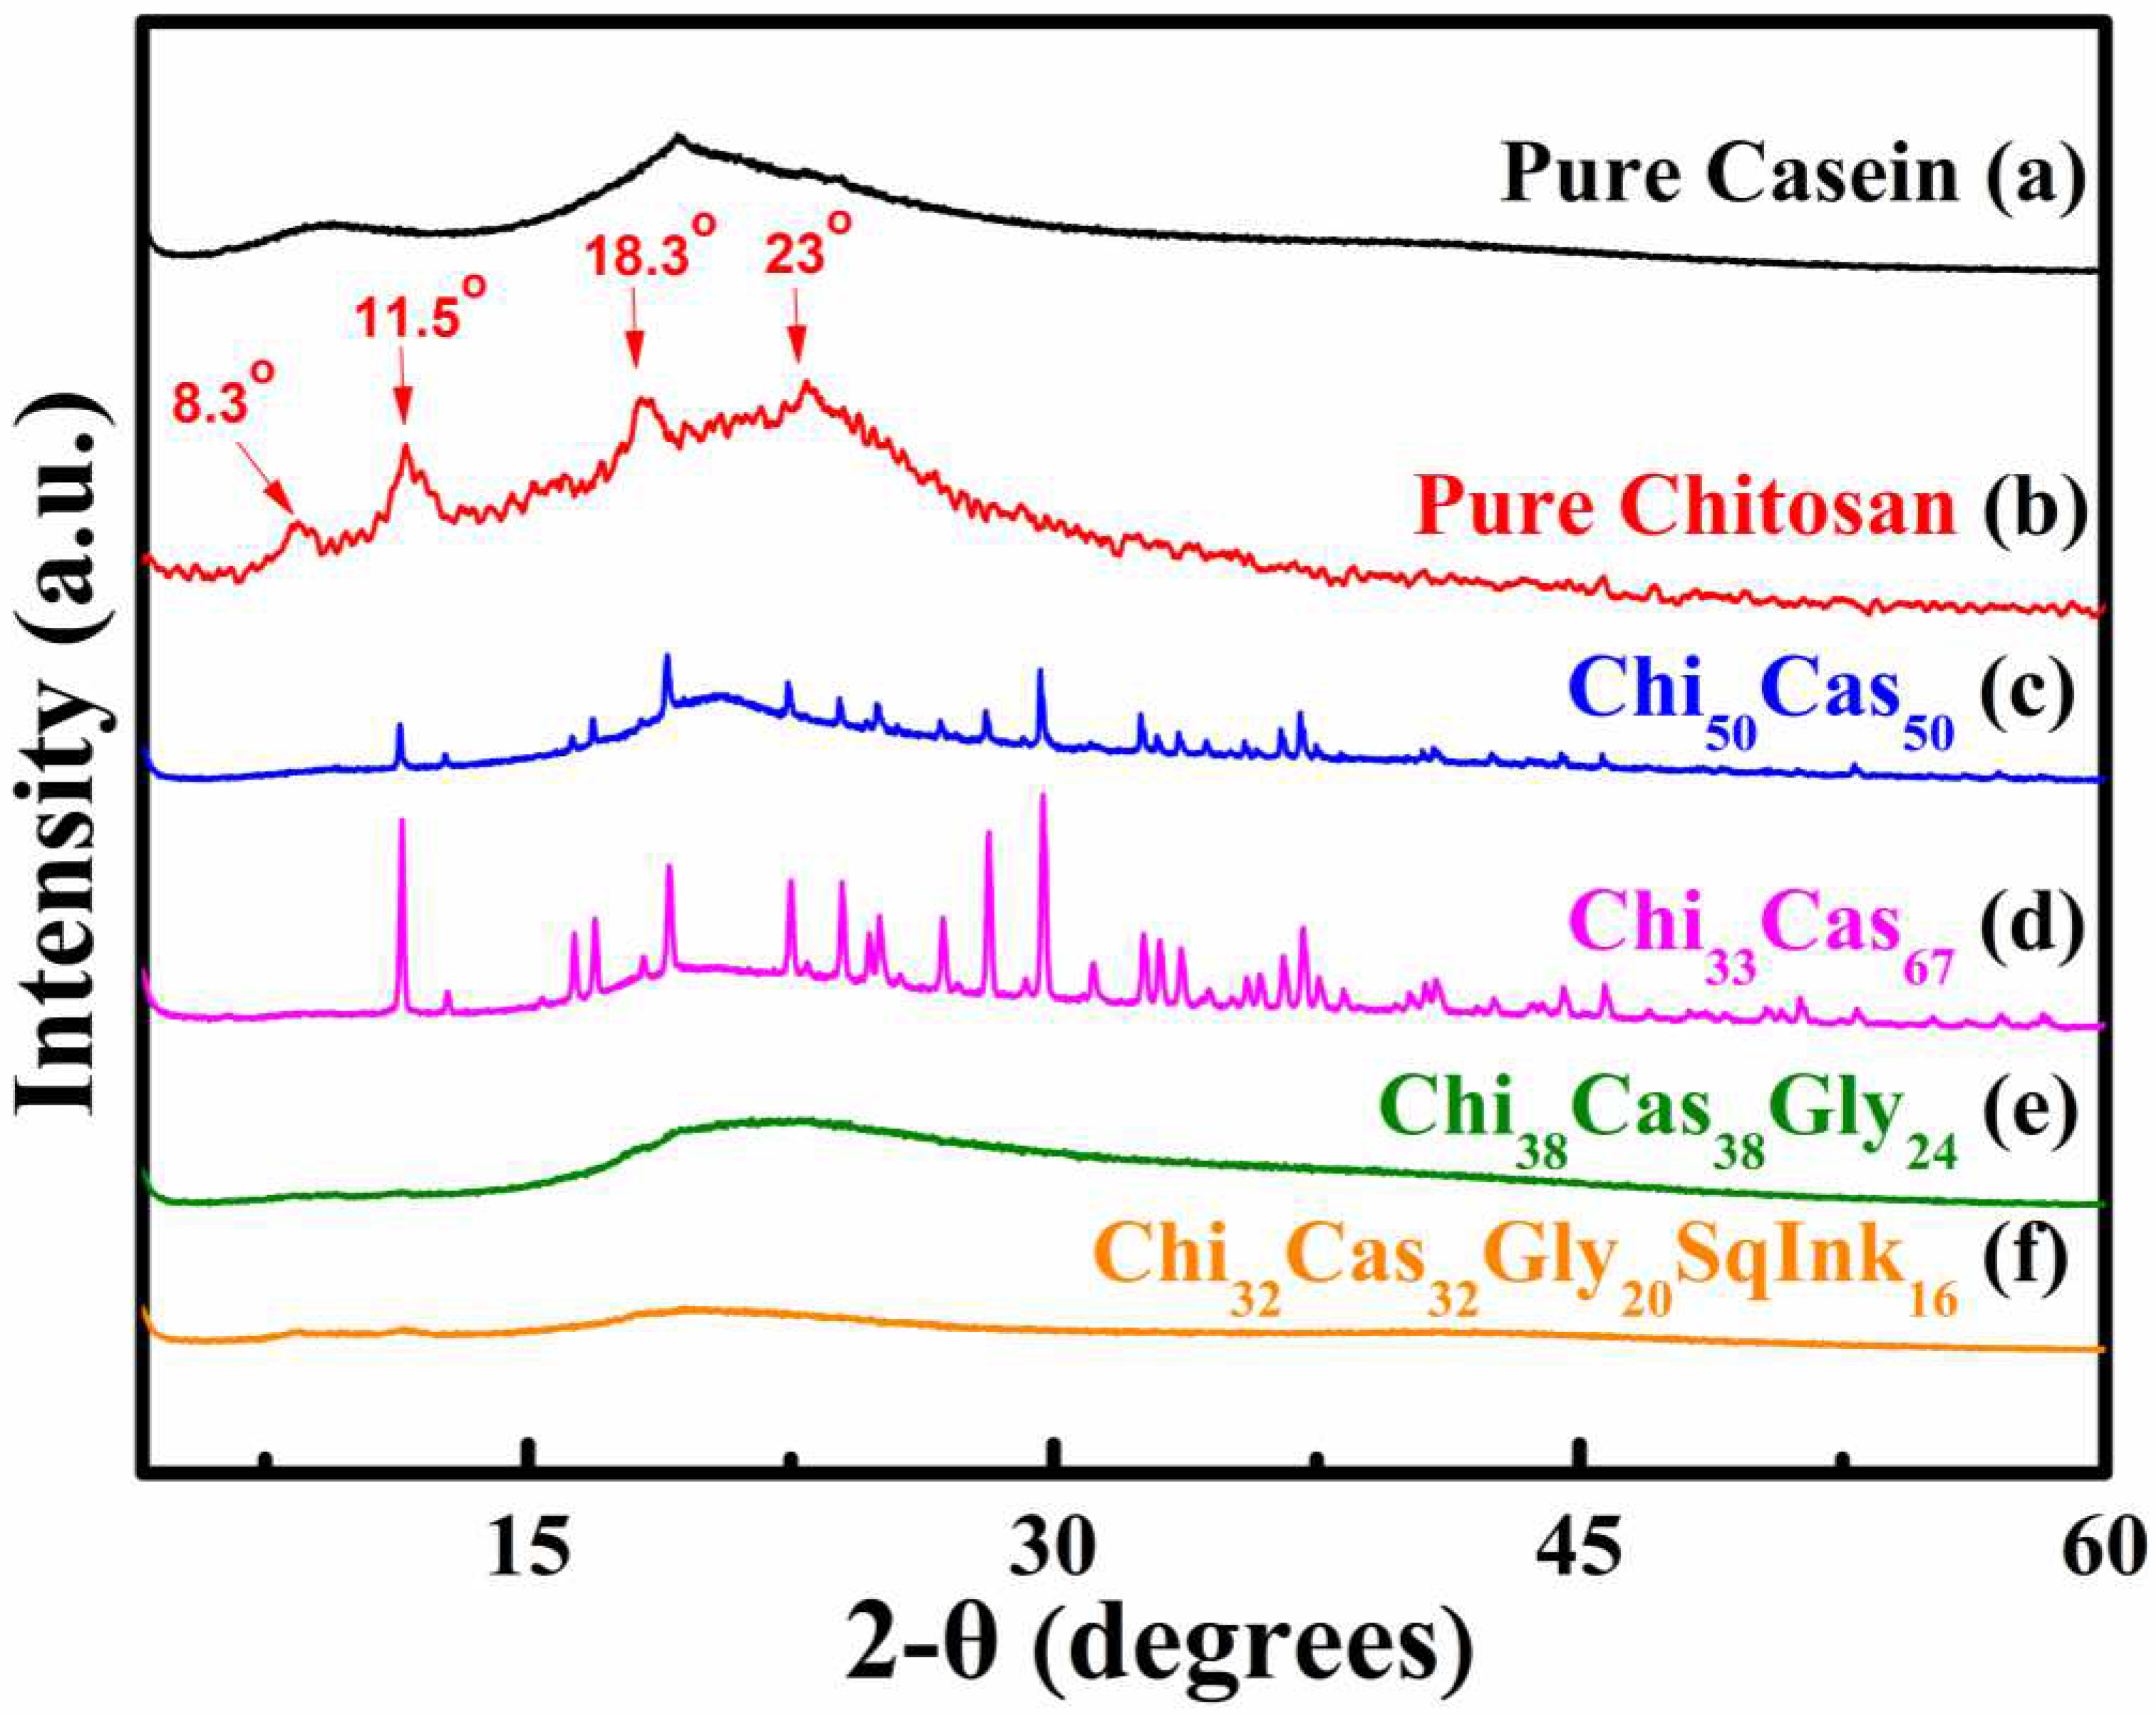
3.2. XRD Analysis
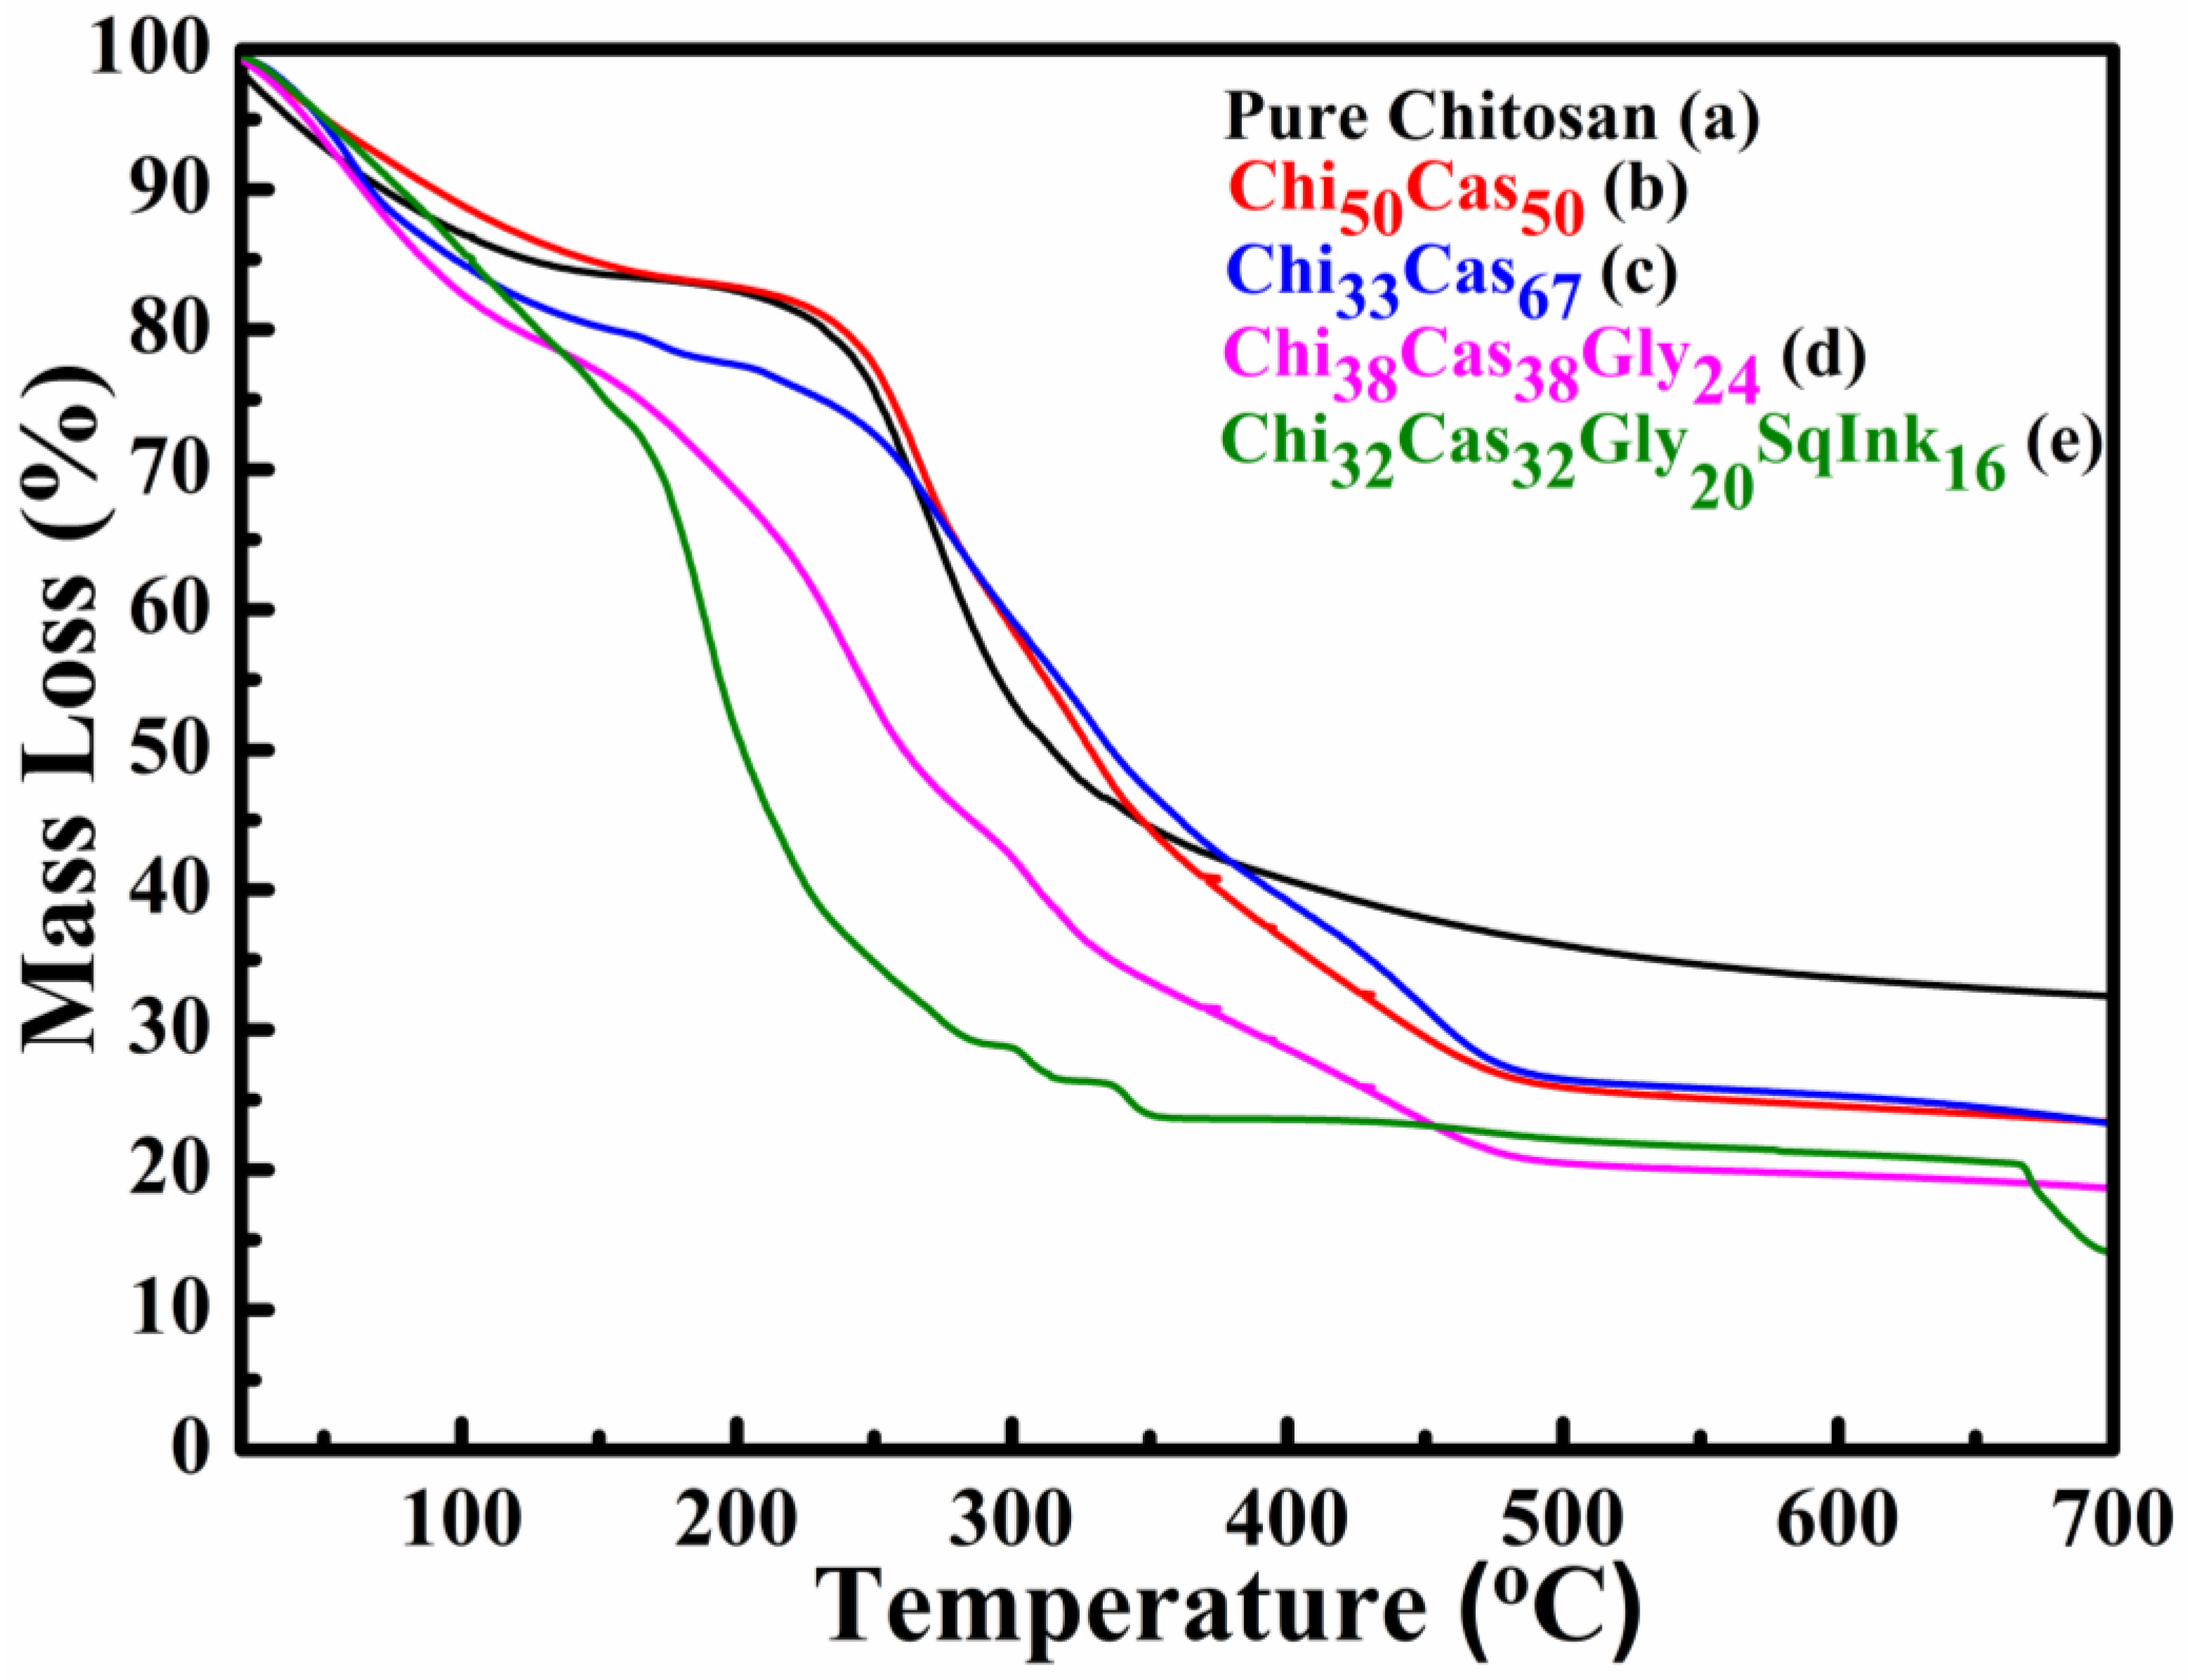
3.3. TGA
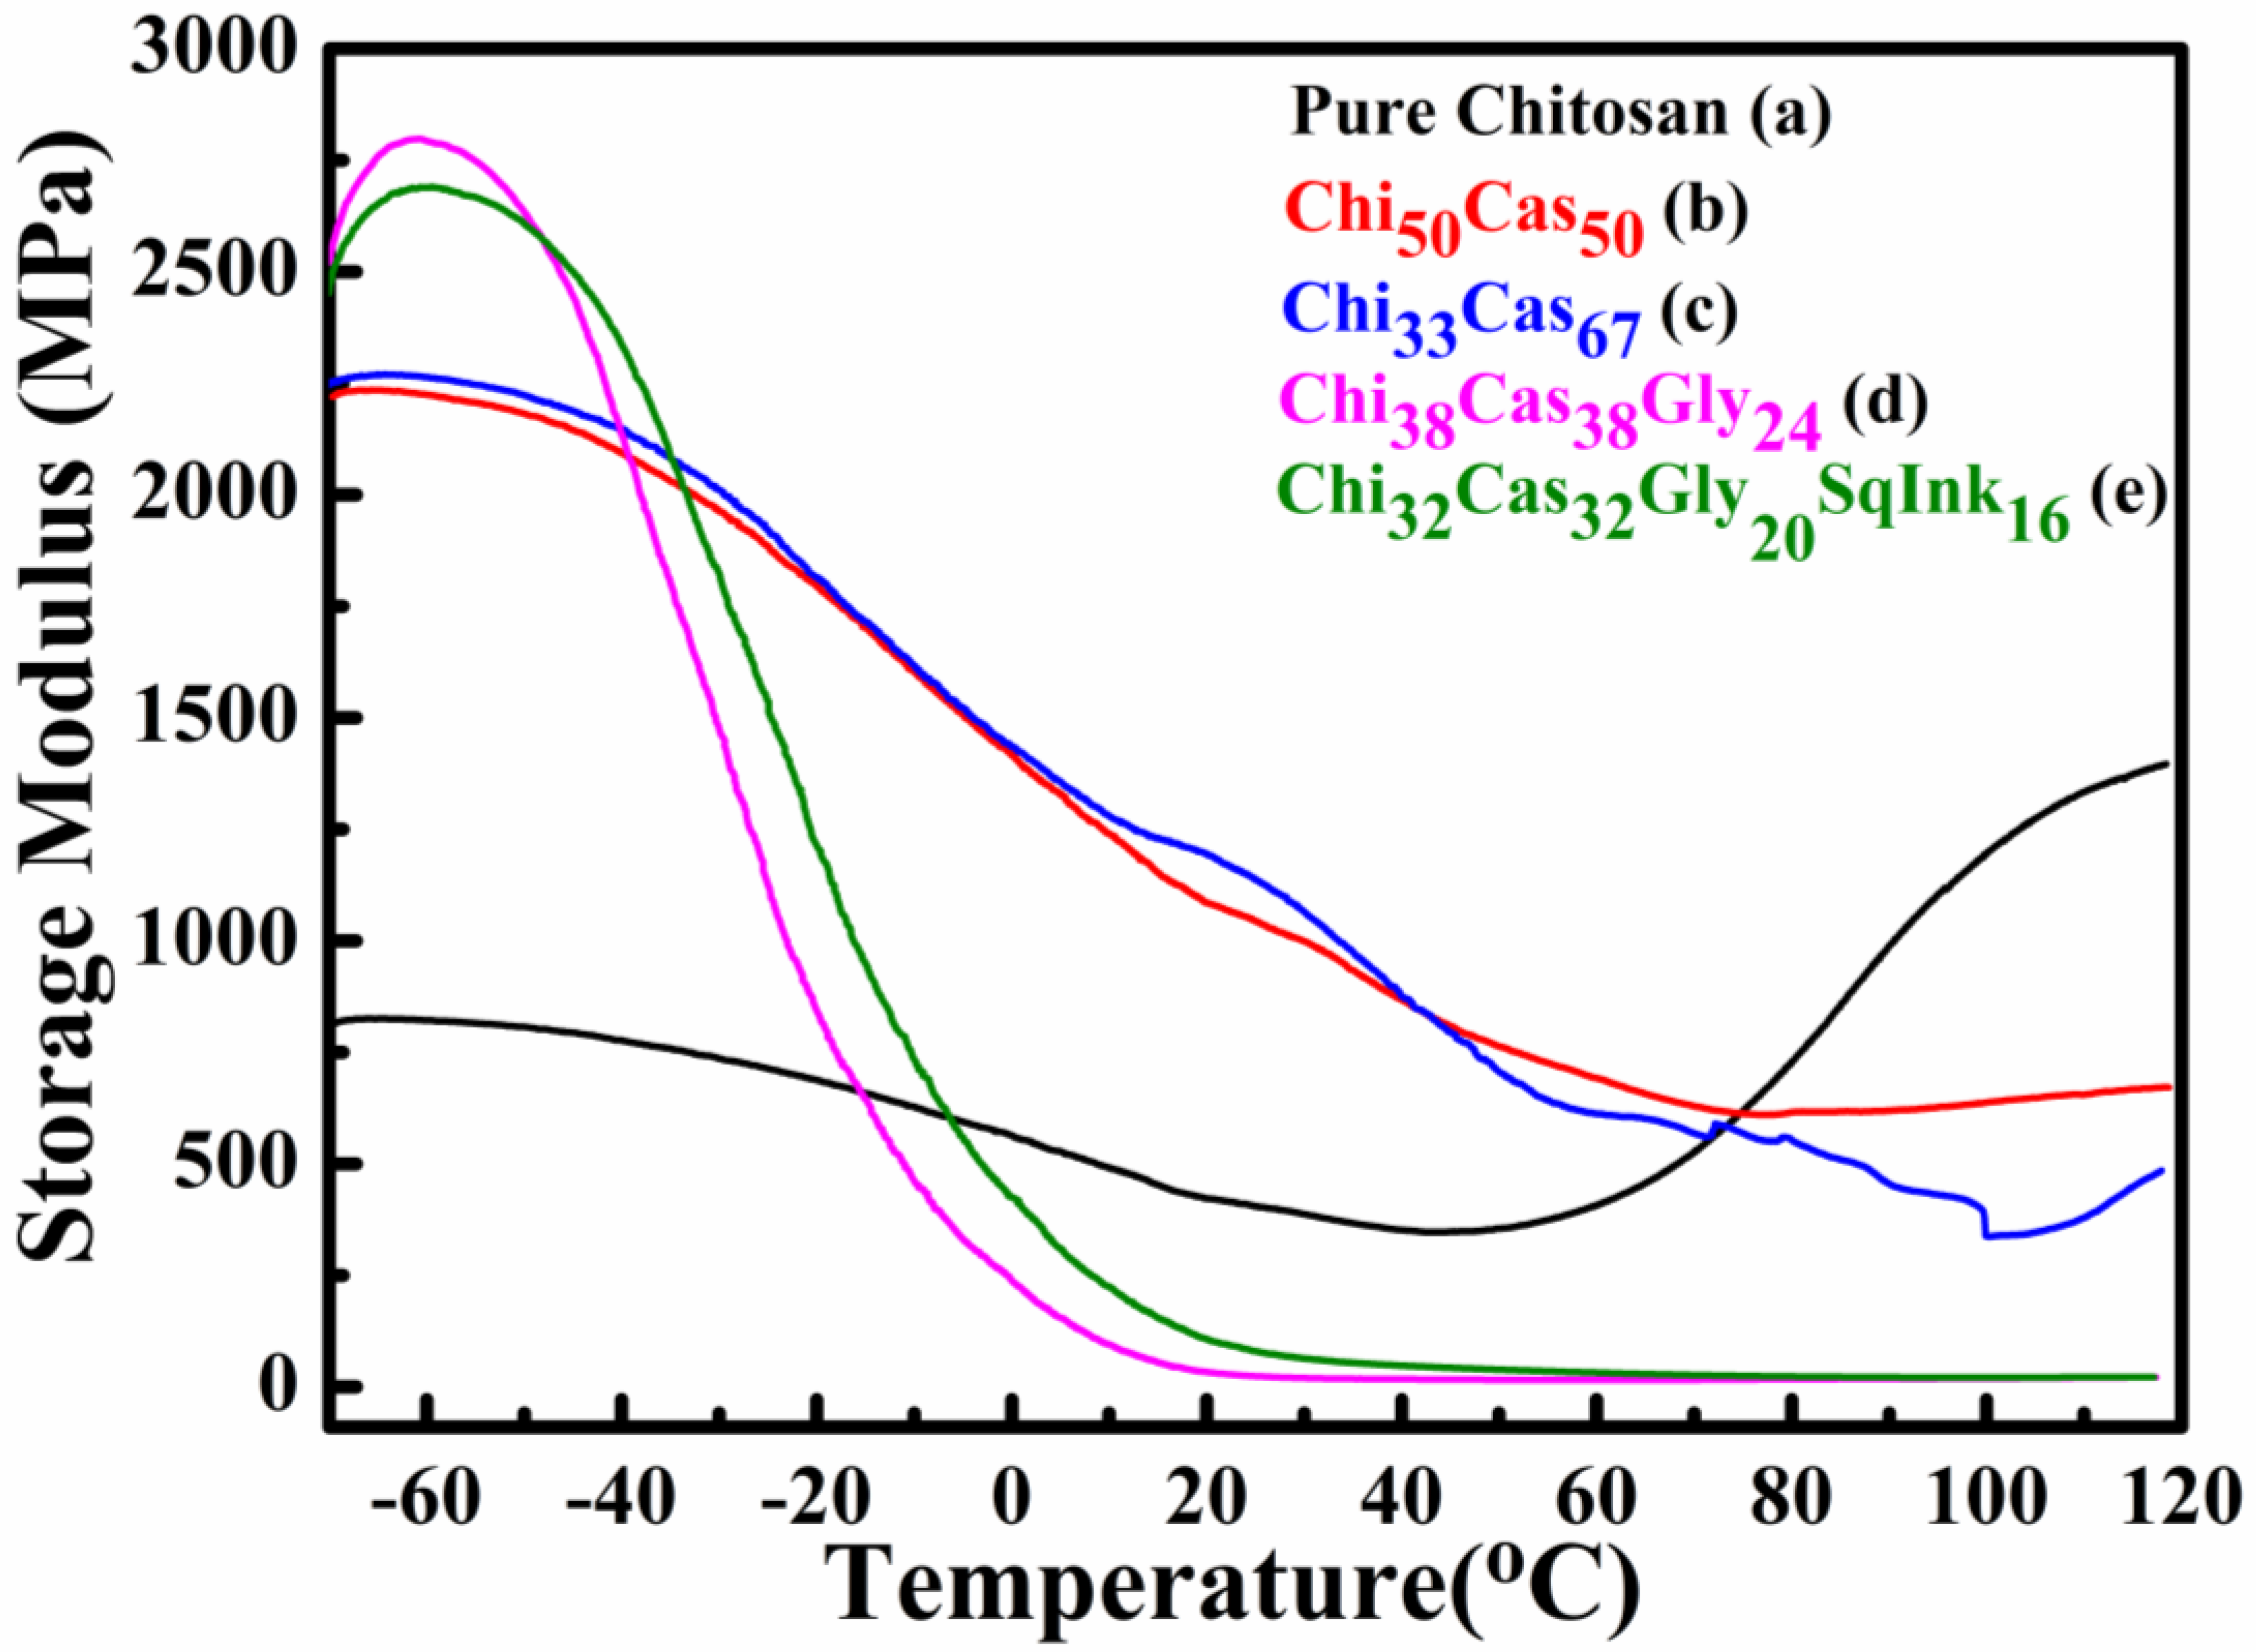
3.4. DMA
3.5. Tensile Properties
3.6. SEM Measurements
3.7. WVTR-Water Diffusion Coefficient Calculation
3.8. OTR-Oxygen Permeability Calculation
4. Conclusions
Author Contributions
Funding
Data Availability Statement
Acknowledgments
Conflicts of Interest
References
- Kummu, M.; de Moel, H.; Porkka, M.; Siebert, S.; Varis, O.; Ward, P.J. Lost food, wasted resources: Global food supply chain losses and their impacts on freshwater, cropland, and fertiliser use. Science of The Total Environment 2012, 438, 477–489. [Google Scholar] [CrossRef] [PubMed]
- Ravindran, R.; Jaiswal, A.K. Exploitation of Food Industry Waste for High-Value Products. Trends in Biotechnology 2016, 34, 58–69. [Google Scholar] [CrossRef]
- Rosenboom, J.-G.; Langer, R.; Traverso, G. Bioplastics for a circular economy. Nature Reviews Materials 2022, 7, 117–137. [Google Scholar] [CrossRef] [PubMed]
- Rabnawaz, M.; Wyman, I.; Auras, R.; Cheng, S. A roadmap towards green packaging: the current status and future outlook for polyesters in the packaging industry. Green Chemistry 2017, 19, 4737–4753. [Google Scholar] [CrossRef]
- Luzi, F.; Torre, L.; Kenny, J.M.; Puglia, D. Bio- and Fossil-Based Polymeric Blends and Nanocomposites for Packaging: Structure⁻Property Relationship. Materials (Basel, Switzerland) 2019, 12. [Google Scholar] [CrossRef]
- Guillard, V.; Gaucel, S.; Fornaciari, C.; Angellier-Coussy, H.; Buche, P.; Gontard, N. The Next Generation of Sustainable Food Packaging to Preserve Our Environment in a Circular Economy Context. 2018, 5. [CrossRef]
- Aguirre-Joya, J.A.; De Leon-Zapata, M.A.; Alvarez-Perez, O.B.; Torres-León, C.; Nieto-Oropeza, D.E.; Ventura-Sobrevilla, J.M.; Aguilar, M.A.; Ruelas-Chacón, X.; Rojas, R.; Ramos-Aguiñaga, M.E.; et al. Chapter 1 - Basic and Applied Concepts of Edible Packaging for Foods. In Food Packaging and Preservation, Grumezescu, A.M., Holban, A.M., Eds.; Academic Press: 2018; pp. 1-61.
- Hamed, I.; Jakobsen, A.N.; Lerfall, J. Sustainable edible packaging systems based on active compounds from food processing byproducts: A review. 2022, 21, 198-226. [CrossRef]
- Trajkovska Petkoska, A.; Daniloski, D.; D'Cunha, N.M.; Naumovski, N.; Broach, A.T. Edible packaging: Sustainable solutions and novel trends in food packaging. Food Research International 2021, 140, 109981. [Google Scholar] [CrossRef]
- Sar, T.; Harirchi, S.; Ramezani, M.; Bulkan, G.; Akbas, M.Y.; Pandey, A.; Taherzadeh, M.J. Potential utilization of dairy industries by-products and wastes through microbial processes: A critical review. Science of The Total Environment 2022, 810, 152253. [Google Scholar] [CrossRef]
- Gheorghita, R.; Gutt, G.; Amariei, S.J.C. The Use of Edible Films Based on Sodium Alginate in Meat Product Packaging: An Eco-Friendly Alternative to Conventional Plastic Materials. 2020.
- Mellinas, C.; Valdés, A.; Ramos, M.; Burgos, N.; Garrigós, M.d.C.; Jiménez, A. Active edible films: Current state and future trends. 2016, 133. [CrossRef]
- Restrepo, A.E.; Rojas, J.D.; García, O.R.; Sánchez, L.T.; Pinzón, M.I.; Villa, C.C. Mechanical, barrier, and color properties of banana starch edible films incorporated with nanoemulsions of lemongrass ( Cymbopogon citratus) and rosemary ( Rosmarinus officinalis) essential oils. Food science and technology international = Ciencia y tecnologia de los alimentos internacional 2018, 24, 705–712. [Google Scholar] [CrossRef]
- Gobbetti, M.; Minervini, F.; Rizzello, C.G. Angiotensin I-converting-enzyme-inhibitory and antimicrobial bioactive peptides. 2004, 57, 173-188. [CrossRef]
- Korhonen, H.; Marnila, P.; Gill, H.S. Bovine milk antibodies for health. The British journal of nutrition 2000, 84 Suppl 1, S135–146. [Google Scholar] [CrossRef]
- Ryder, K.; Ali, M.A.; Carne, A.; Billakanti, J. The potential use of dairy by-products for the production of nonfood biomaterials. Critical Reviews in Environmental Science and Technology 2017, 47, 621–642. [Google Scholar] [CrossRef]
- Mazorra-Manzano, M.A.; Robles-Porchas, G.R.; González-Velázquez, D.A.; Torres-Llanez, M.J.; Martínez-Porchas, M.; García-Sifuentes, C.O.; González-Córdova, A.F.; Vallejo-Córdoba, B. Cheese Whey Fermentation by Its Native Microbiota: Proteolysis and Bioactive Peptides Release with ACE-Inhibitory Activity. 2020, 6, 19.
- Campos, C.A.; Gerschenson, L.N.; Flores, S.K. Development of Edible Films and Coatings with Antimicrobial Activity. Food and Bioprocess Technology 2011, 4, 849–875. [Google Scholar] [CrossRef]
- Bonnaillie, L.M.; Zhang, H.; Akkurt, S.; Yam, K.L.; Tomasula, P.M. Casein Films: The Effects of Formulation, Environmental Conditions and the Addition of Citric Pectin on the Structure and Mechanical Properties. 2014, 6, 2018-2036.
- Khan, M.R.; Volpe, S.; Valentino, M.; Miele, N.A.; Cavella, S.; Torrieri, E. Active Casein Coatings and Films for Perishable Foods: Structural Properties and Shelf-Life Extension. 2021, 11, 899.
- Babaei-Ghazvini, A.; Acharya, B.; Korber, D.R. Antimicrobial Biodegradable Food Packaging Based on Chitosan and Metal/Metal-Oxide Bio-Nanocomposites: A Review. Polymers (Basel) 2021, 13. [Google Scholar] [CrossRef]
- Chaudhary, V.; Kajla, P.; Kumari, P.; Bangar, S.P.; Rusu, A.; Trif, M.; Lorenzo, J.M. Milk protein-based active edible packaging for food applications: An eco-friendly approach. 2022, 9. [CrossRef]
- Nadarajah, S.K.; Vijayaraj, R.; Mani, J. Therapeutic Significance of Loligo vulgaris (Lamarck, 1798) ink Extract: A Biomedical Approach. Pharmacognosy research 2017, 9, S105–s109. [Google Scholar] [CrossRef]
- Giannakas, A.E.; Salmas, C.E.; Moschovas, D.; Zaharioudakis, K.; Georgopoulos, S.; Asimakopoulos, G.; Aktypis, A.; Proestos, C.; Karakassides, A.; Avgeropoulos, A.; et al. The Increase of Soft Cheese Shelf-Life Packaged with Edible Films Based on Novel Hybrid Nanostructures. 2022, 8, 539.
- Celli, G.B.; Ravanfar, R.; Kaliappan, S.; Kapoor, R.; Abbaspourrad, A. Annatto-entrapped casein-chitosan complexes improve whey color quality after acid coagulation of milk. Food Chemistry 2018, 255, 268–274. [Google Scholar] [CrossRef] [PubMed]
- Chakrapani, V.; Ayaz Ahmed, K.B.; Kumar, V.V.; Ganapathy, V.; Anthony, S.P.; Anbazhagan, V. A facile route to synthesize casein capped copper nanoparticles: an effective antibacterial agent and selective colorimetric sensor for mercury and tryptophan. RSC Advances 2014, 4, 33215–33221. [Google Scholar] [CrossRef]
- Gebhardt, R.; Takeda, N.; Kulozik, U.; Doster, W. Structure and Stabilizing Interactions of Casein Micelles Probed by High-Pressure Light Scattering and FTIR. The Journal of Physical Chemistry B 2011, 115, 2349–2359. [Google Scholar] [CrossRef] [PubMed]
- Karydis-Messinis, A.; Moschovas, D.; Markou, M.; Gkantzou, E.; Vasileiadis, A.; Tsirka, K.; Gioti, C.; Vasilopoulos, K.C.; Bagli, E.; Murphy, C.; et al. Development, physicochemical characterization and in vitro evaluation of chitosan-fish gelatin-glycerol hydrogel membranes for wound treatment applications. Carbohydrate Polymer Technologies and Applications 2023, 6, 100338. [Google Scholar] [CrossRef]
- Ma, Y.; Xin, L.; Tan, H.; Fan, M.; Li, J.; Jia, Y.; Ling, Z.; Chen, Y.; Hu, X. Chitosan membrane dressings toughened by glycerol to load antibacterial drugs for wound healing. Materials Science and Engineering: C 2017, 81, 522–531. [Google Scholar] [CrossRef] [PubMed]
- Fernández, C.; Ausar, S.F.; Badini, R.G.; Castagna, L.F.; Bianco, I.D.; Beltramo, D.M. An FTIR spectroscopy study of the interaction between αs-casein-bound phosphoryl groups and chitosan. International Dairy Journal 2003, 13, 897–901. [Google Scholar] [CrossRef]
- Astbury, W.T.; Lomax, R. X-Ray Photographs of Crystalline Pepsin. Nature 1934, 133, 795–795. [Google Scholar] [CrossRef]
- Clark, G.L.; Schaad, J.A. X-ray Diffraction Studies of Tendon and Intestinal Wall Collagen. 1936, 27, 339-356. [CrossRef]
- Arvanitoyannis, I.S.; Nakayama, A.; Aiba, S.-i. Chitosan and gelatin based edible films: state diagrams, mechanical and permeation properties. Carbohydrate Polymers 1998, 37, 371–382. [Google Scholar] [CrossRef]
- Karydis-Messinis, A.; Moschovas, D.; Markou, M.; Tsirka, K.; Gioti, C.; Bagli, E.; Murphy, C.; Giannakas, A.E.; Paipetis, A.; Karakassides, M.A.; et al. Hydrogel Membranes from Chitosan-Fish Gelatin-Glycerol for Biomedical Applications: Chondroitin Sulfate Incorporation Effect in Membrane Properties. 2023, 9, 844.
- Bengoechea, C.; Arrachid, A.; Guerrero, A.; Hill, S.E.; Mitchell, J.R. Relationship between the glass transition temperature and the melt flow behavior for gluten, casein and soya. Journal of Cereal Science 2007, 45, 275–284. [Google Scholar] [CrossRef]
| Sample code | Chitosan (w/v %) |
Casein (w/v %) |
Glycerol (w/v %) |
Squid Ink (w/v %) |
|---|---|---|---|---|
|
Chi32Cas32Gly20SqInk16 (%wt:32/32/20/16) |
2 | 2 | 1.26 | 1 |
|
Chi38Cas38Gly24 (%wt:38/38/24) |
2 | 2 | 1.26 | - |
|
Chi33Cas67 (%wt:33/67) |
2 | 4 | - | - |
|
Ch50Cas50 (%wt:50/50) |
2 | 2 | - | - |
|
Pure Chitosan (%wt:100) |
2 | - | - | - |
|
Pure Casein (powder) |
- | 100 | - | - |
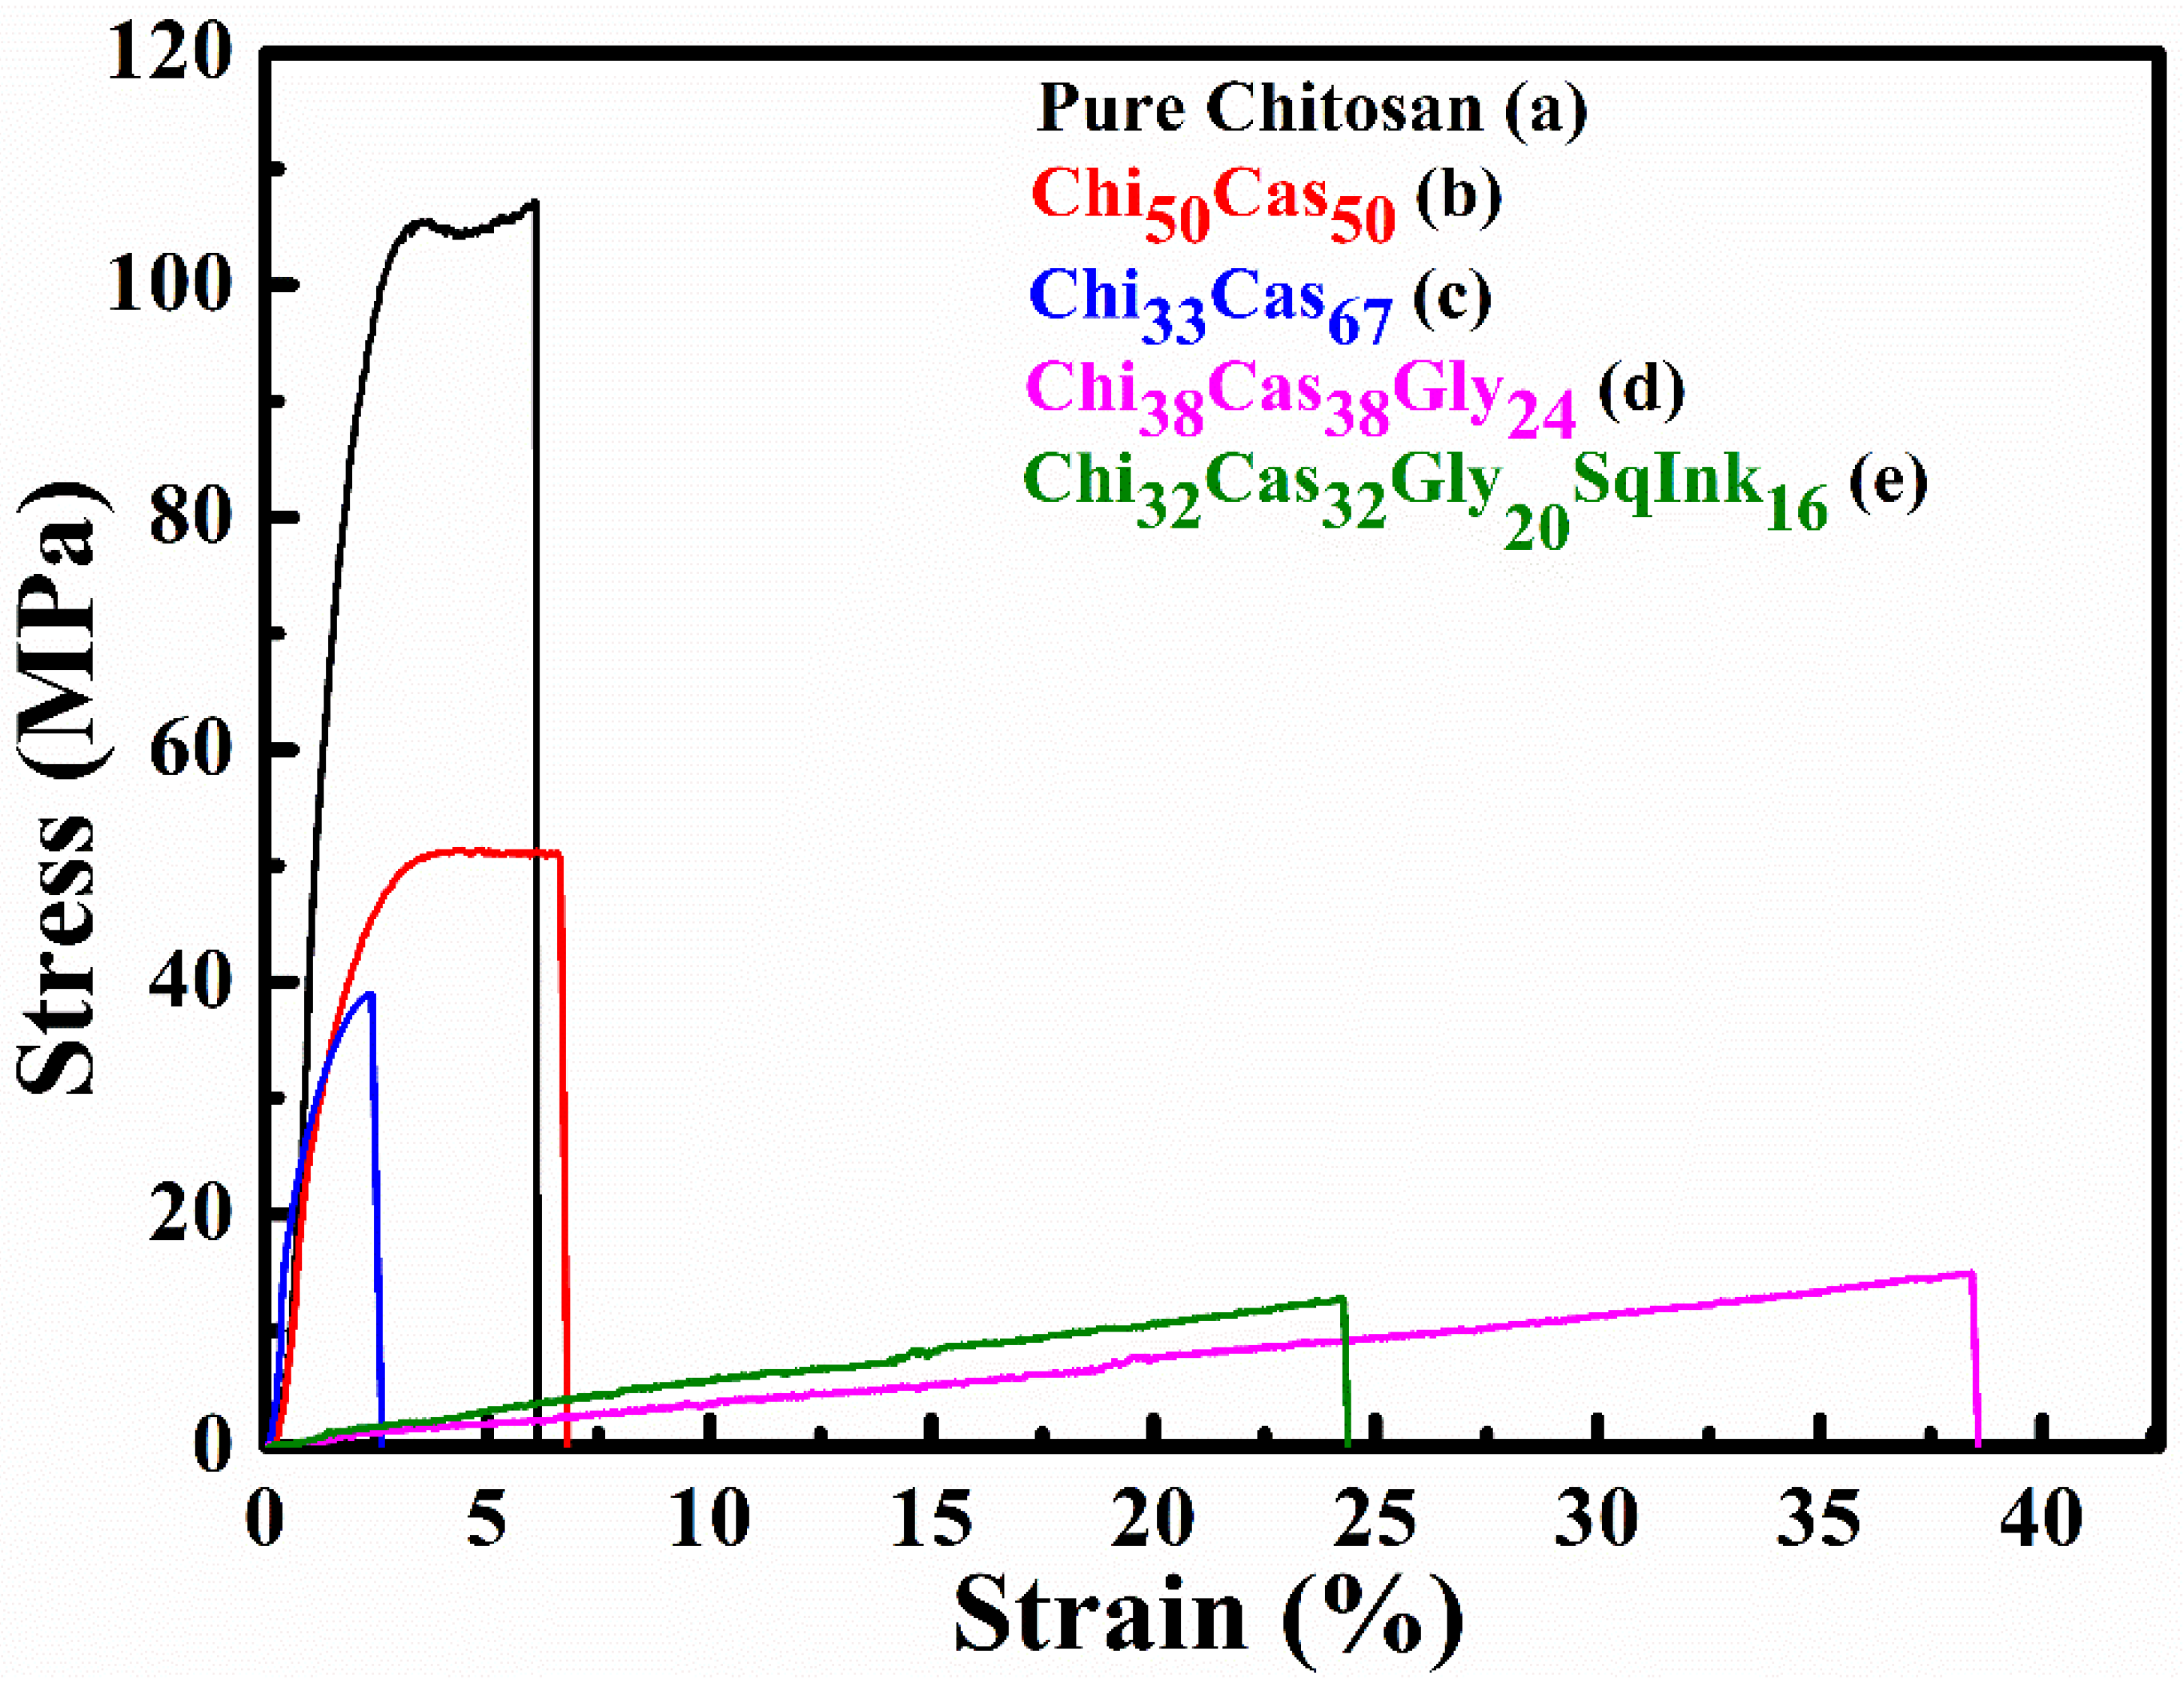
| Specimen | Stress (MPa) | Strain (%) | % change in stress* | % change in strain* |
|---|---|---|---|---|
|
Pure Chitosan Reference system |
102.82 ± 6.97 | 6.77 ± 3.01 | Reference system | |
| Chi50Cas50 | 51.60 ± 2.00 | 7.66 ± 1.70 | -49.82 | +13.15 |
| Chi33Cas67 | 36.84 ± 2.02 | 2.61 ± 0.07 | -64.17 | -61.45 |
| Chi38Cas38Gly24 | 15.36 ± 0.63 | 38.42 ± 0.22 | -85.06 | +467.50 |
| Chi32Cas32Gly20SqInk16 | 12.18 ± 1.85 | 23.74 ± 3.56 | -88.15 | +250.66 |
| Samples | WVTR [gr/(cm2*s)] | Dwv (cm2/s) |
|---|---|---|
| Pure Chitosan | 7.69367E-07(6.48778E-08) | 1.10E-04(1.98E-05) |
| Ch50Cas50 | 9.55637E-07(4.27094E-07) | 3.33E-04(0.79E-04) |
| Chi33Cas67 | 7.79506E-07(5.03817E-07) | 5.16E-04(1.04E-04) |
| Chi38Cas38Gly24 | 1.92141E-06(3.3557E-07) | 8.20E-04(1.69E-04) |
| Chi32Cas32Gly20SqInk16 | 1.53178E-06(3.217612E-07) | 8.51E-04(8.76E-05) |
Disclaimer/Publisher’s Note: The statements, opinions and data contained in all publications are solely those of the individual author(s) and contributor(s) and not of MDPI and/or the editor(s). MDPI and/or the editor(s) disclaim responsibility for any injury to people or property resulting from any ideas, methods, instructions or products referred to in the content. |
© 2024 by the authors. Licensee MDPI, Basel, Switzerland. This article is an open access article distributed under the terms and conditions of the Creative Commons Attribution (CC BY) license (http://creativecommons.org/licenses/by/4.0/).


