1. Introduction
Speed of hypersonic vehicles is usually higher than Mach 6, which brings benefits such as exceptional speed, stealth, and maneuverability. To achieve hypersonic flight, efficient thrusters are essential. That is why scramjets are extensively employed, as they provide a higher specific thrust compared to any other air-breathing propulsion system in such circumstances [
1]. Availability of scramjet has already been verified by the success of X-43A and X-51 [
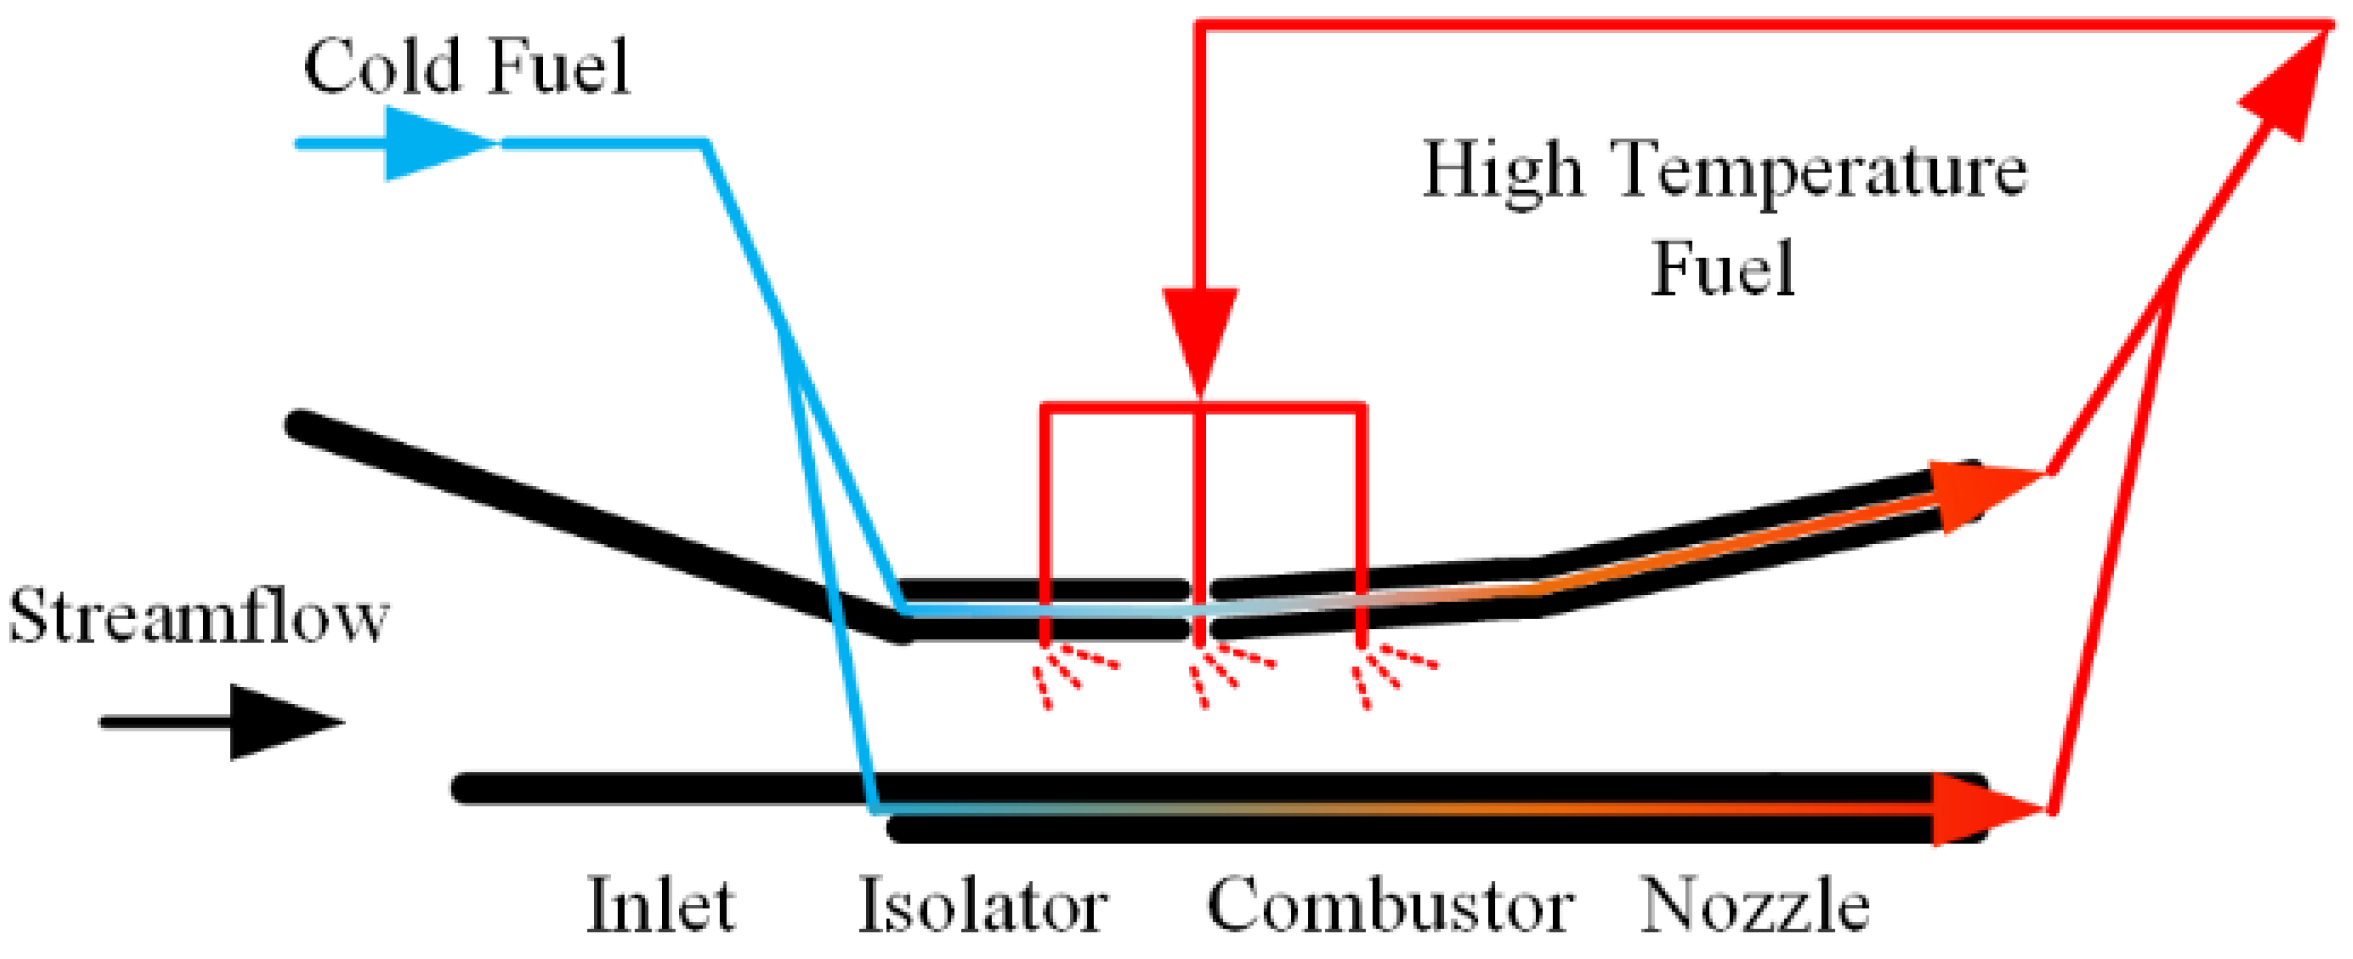
2]. Among those two verifications, the X-51 flight test proves feasibility of hydrocarbon fueled scramjet, which is quite successful. Nevertheless, scramjets encounter extreme operational conditions. Combination of high speed, high intensity combustion, and friction leads to elevated temperatures and pressures, which imposing substantial heat load for body of scramjet. To ensure it from potential damage, effective cooling methods are employed for scramjet. Commonly used technique is regenerative active cooling, in which fuel is adopted as coolant [
3]. During the regenerative active cooling process, fuel is injected into cooling channel inside combustor wall of scramjet to dissipate heat before entering combustor. Both liquid hydrogen and liquid hydrocarbon fuels are frequently utilized for regenerative active cooling of scramjet. However, when flight Mach number of scramjet is above 5, liquid hydrocarbon fuel is often preferred due to its convenience of storage [
4]. Furthermore, liquid hydrocarbon fuel can absorb a significant amount of heat compared with liquid hydrogen though endothermic cracking pyrolysis, which effectively reduces the temperature of the engine wall [
5]. The X-43A, a groundbreaking achievement, utilizes a liquid hydrocarbon fuel scramjet and achieves an impressive flight Mach number of 9.6 [
6]. Additionally, the successful flight test of X-51 further confirmed the viability of regenerative cooling using hydrocarbon fuel as a coolant [
7].
Figure 1. Fuel Flow Path in Regenerative Cooling Channel.
Lot of researches have been conducted on the steady flow and heat transfer characteristics of hydrocarbon fuel within the cooling channel, which includes investigation of cross-sectional geometry of the cooling channel [
8], working pressure [
9,
10], heating mode [
11,
12] and convective heat transfer correlation [
13]. Meanwhile scramjet operations involving aircraft acceleration, deceleration, lift, and dive, the inlet mass flow, heat flux and working pressure, which may arouse sudden changes in thermal boundary conditions, such as heat flux, inlet fuel mass flow and working pressure. However, research on transient flow and heat transfer in these scenarios is often limited to studies of instability phenomena within experimental flows. For example, Zhu et al. [
14] identified the transition instability phenomenon in the flow and heat transfer experiment of n-decane under supercritical pressure. The study primarily investigated the impact of inlet temperature, pressure, and mass flow rate on the intensity of oscillations and explored methods to mitigate these oscillations. These studies did not specifically analyze the influence of these factors on the transient flow and heat transfer characteristics of n-decane from the perspective of variable conditions. Consequently, detailed analysis of underlying mechanisms involved in the transient flow and heat transfer process is required.
The cooling channel serves as a heat exchanger between the fuel and the combustion processes [
15]. Significance of the convective heat transfer coefficient, numerous scholars have dedicated extensive research to this area. Cheng et al. [
16] determined the convective heat transfer coefficient by calculating the average fuel temperature across a cross-section. However, this method can result in significant errors as it does not consider the impact of the thermo-physical properties of hydrocarbon fuels near the pseudo-critical temperature. Liu et al. [
17] focused on the impact of dynamic viscosity on the convective heat transfer coefficient, but the findings are limited to turbulent flow and do not account for fluid heat conduction. Subsequent research conducted by Deng et al. [
18], Huang et al. [
19], and Fu et al. [
20] expanded on previous work [
17] by calculating the convective heat transfer coefficient in segments, considering the ratio of the average temperature across a cross-section within the critical temperature region. Furthermore, the consideration of thermo-physical properties of hydrocarbon fuels in convective heat transfer calculations has been explored. However, when utilizing the piecewise convective heat transfer correlations, there is an inherent discontinuity in the overall heat transfer coefficient, derived from experimental data. Zhang et al. [
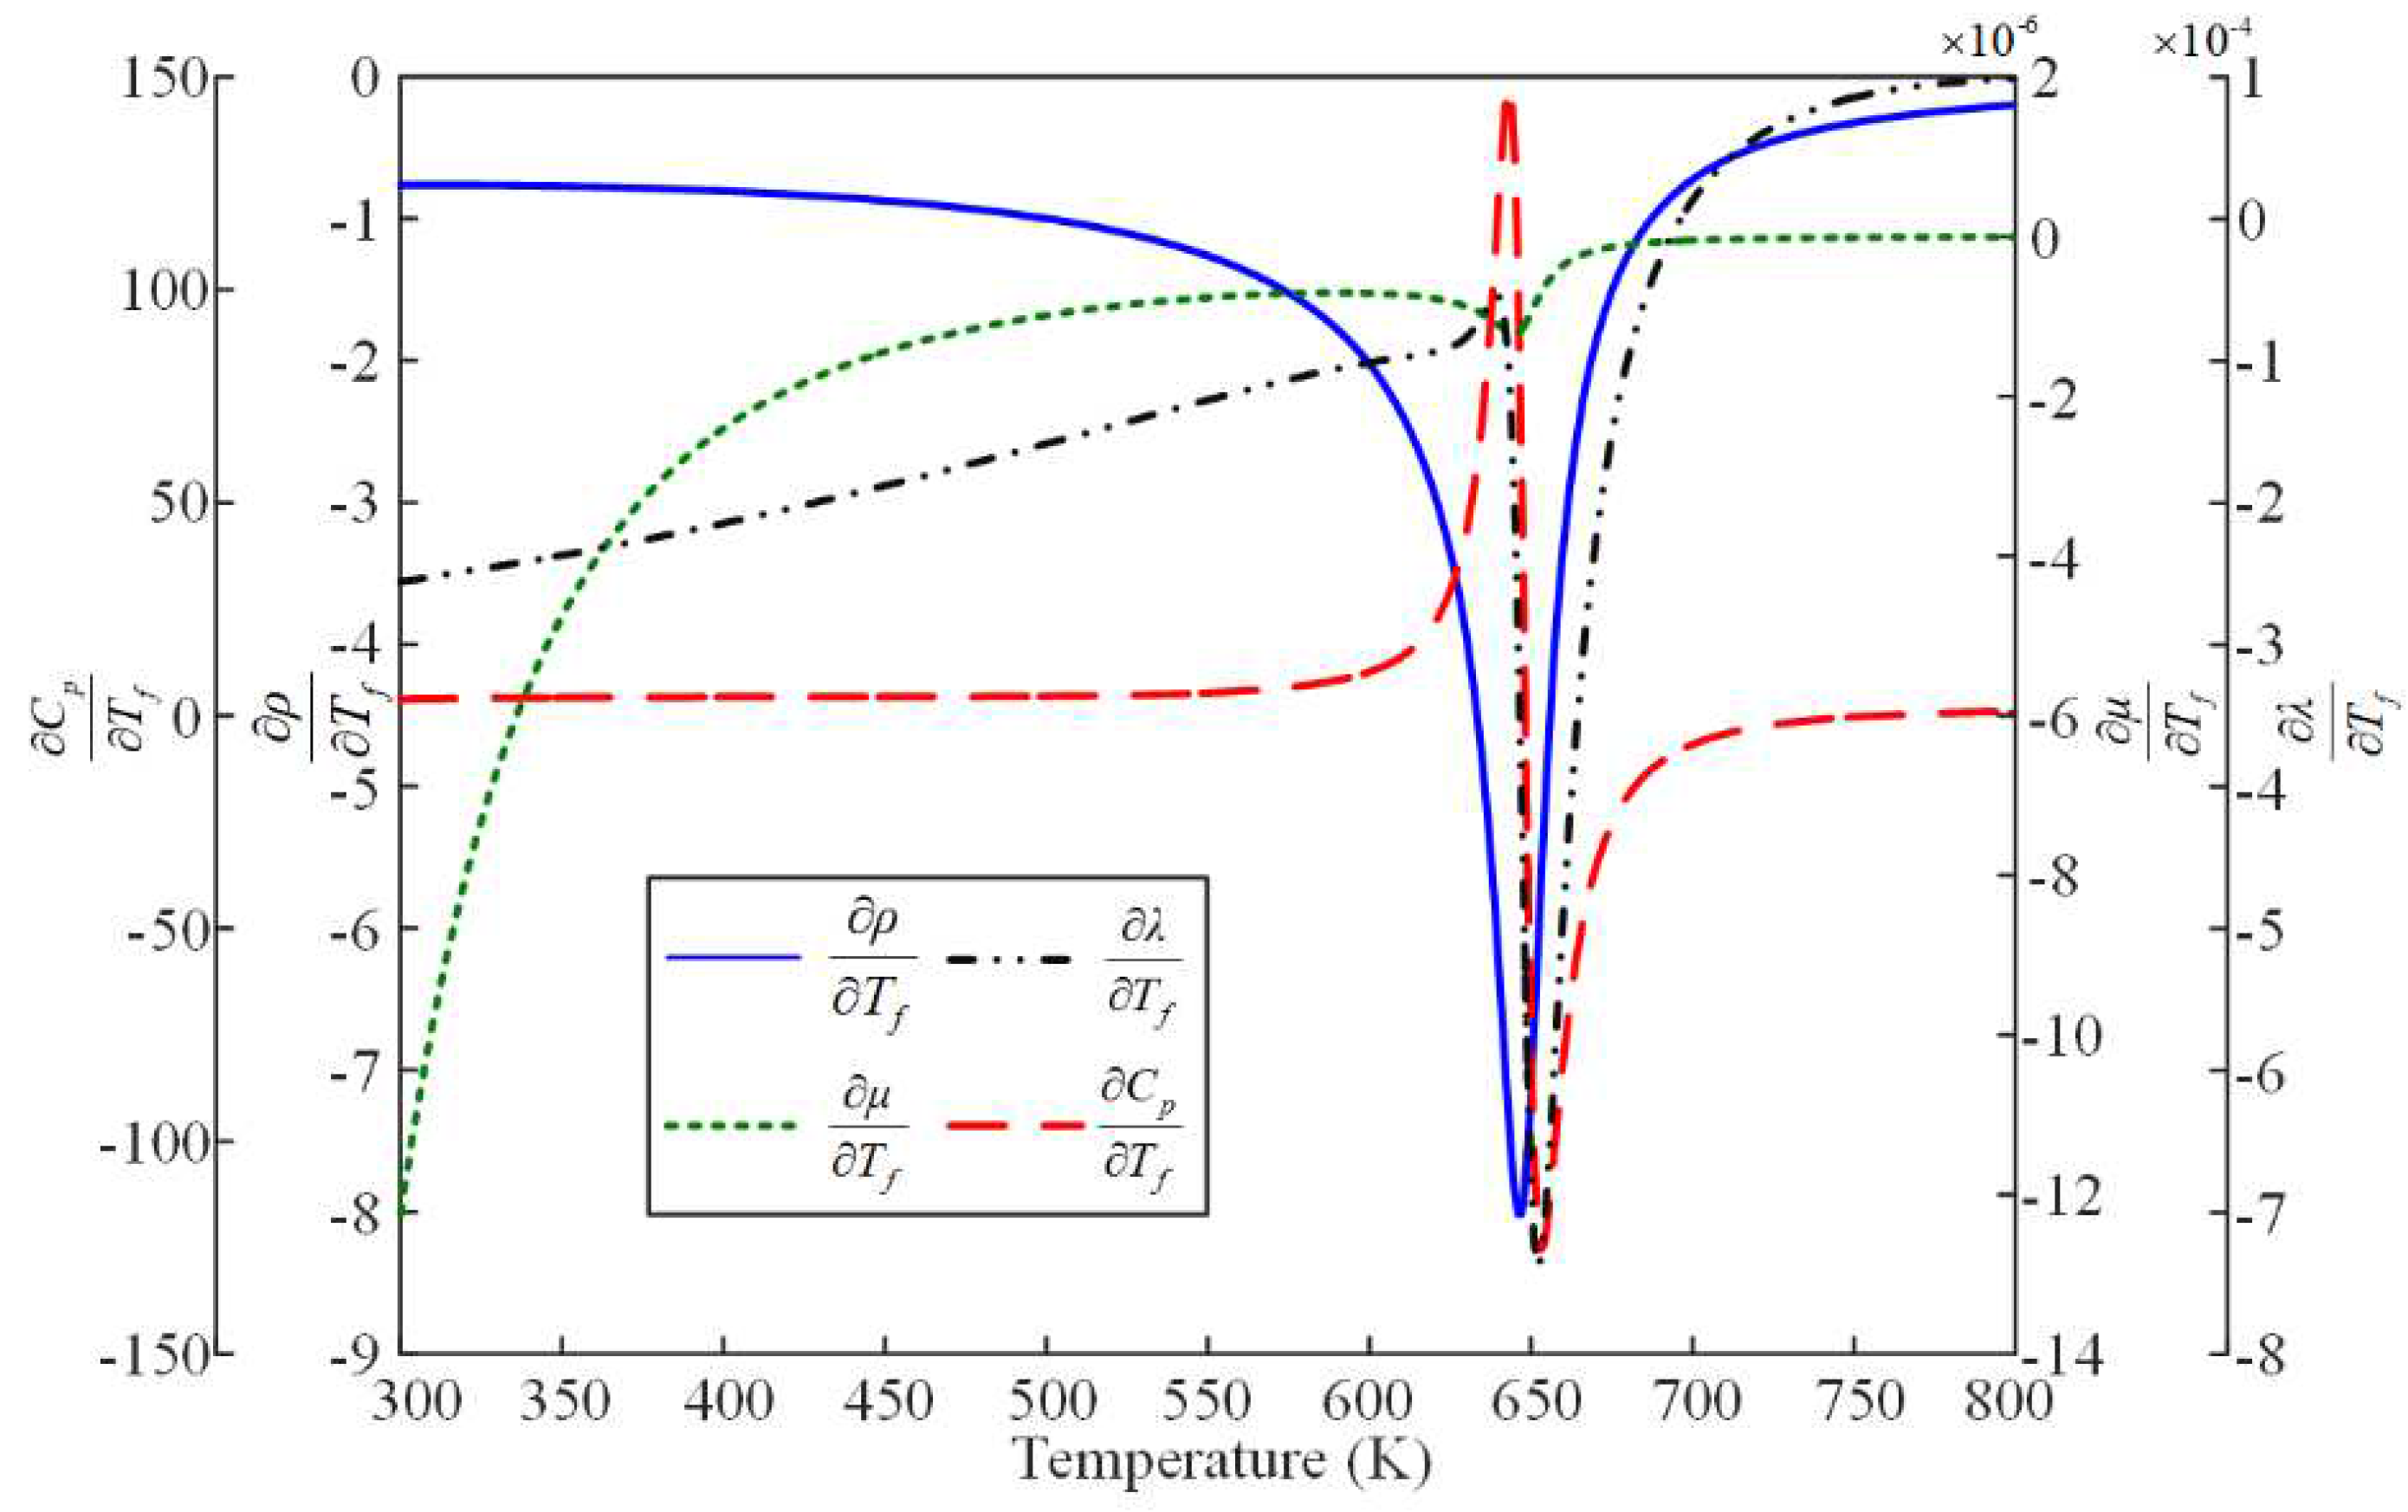
21] addressed this by fitting three separate convective heat transfer correlations based on experimental data for laminar flow, transition flow and the turbulent flow regions, respectively. However, even with these improvements, there still remains a discontinuity issue when using three different calculation methods. As a result, the existed calculation methods for convective heat transfer coefficient are only suitable for specific operating conditions, and their application to transient flows poses challenges. Furthermore, with the fuel temperature increasing, thermal physical properties of hydrocarbon fuel experiences heavily change in pseudo-critical region, especially specific constant pressure heat capacity and thermal conductivity coefficient, which is inevitable. As a result, dynamic characteristics of flow and heat transfer process for uncracked hydrocarbon fuel has important significance, which is highly worthy to be studied.
In this study, the modified overall heat transfer coefficient [
22] is utilized to characterize the transient flow and heat transfer characteristics of hydrocarbon fuels in the cooling channel. A two-dimensional model is established to simulate transient flow and heat transfer of hydrocarbon fuel. Using the developed model, dynamic characteristics of flow and heat transfer for n-decane under different working conditions are studied. Furthermore, overall heat transfer coefficient is analyzed to gain insights into the underlying heat transfer mechanisms.
2. Numerical model and calculation scheme
Calculation model employed is this study is a two-dimensional axisymmetric model, as depicted in
Figure 3. The cooling channel has a circular cross-section with an inner diameter of 1 mm and a length of 1000 mm. The tube is subjected to uniform heat flux. To ensure fully developed flow of the fluid, an adiabatic section with a length of 100 mm is positioned at the inlet. Additionally, to minimize the influence of the outlet and achieve through mixing of the fluid, another adiabatic section with a length of 100 mm is incorporated.
2.1. Governing equation
In the fluid domain, the continuity equation, momentum equation and energy equation under the Cartesian system are as follows:
When hydrocarbon fuels absorb a specific amount of heat, endothermic pyrolysis reactions occur. The mass, substance and quantity of each species involved in these reactions adhere to the conservation law. The component conservation equation can be expressed as follows:
The chemical reaction rate ωi of the species i can be given by the Arrhenius formula:
To ensure both accuracy and computational efficiency, the study adopts the 18 species 24 model proposed by Jiao et al [
23] to describe the molecular reaction kinetics principle of n-decane. The PISO algorithm is utilized to solve the velocity-pressure coupling in the momentum equation. In the solid domain, the heat transferred to the wall is converted into an internal heat source, and the energy equation is as follows:
By establishing a coupling condition at the interface between the solid domain and the fluid domain, the following equations (Eq.5, Eq.6) can be derived:
To accurately capture the turbulent flow near the adjacent wall, the SST k – ω turbulence model [
24] is chosen. This model considers the Reynolds time-averaged equation and Boussinesq hypothesis [
25]. The expressions for the SST k – ω turbulence model are given by Eq.10 and Eq.11:
2.2. Thermo-physical property calculation model
To accurately capture the variations in the thermo-physical properties of n-decane under supercritical pressure, the density is calculated using the Peng-Robinson cubic equation of state [
26]. The equation is as follows:
To determine the dynamic viscosity and thermal conductivity of n-decane under high pressure, Chung's method [
27] is utilized. The expression for dynamic viscosity and thermal conductivity are as follows:
The high-temperature alloy steel GH3128, with a density of 8810 kg/m3, is chosen for the study. The constant pressure specific heat capacity and thermal conductivity of GH3128 are determined using polynomial piecewise linear interpolation. The coefficients for the interpolation are provided in
Table 1.
The measurement of the radial fuel temperature distribution in the cooling channel is challenging due to limitations in measurement methods. Consequently, the convective heat transfer coefficient is typically used as a proxy for the overall heat transfer coefficient. However, existing calculation methods for the overall heat transfer coefficient do not adequately consider the flow state of hydrocarbon fuel and the presence of thermal stratification in the cooling channel.
To address this issue, a modification of the overall heat transfer coefficient has been proposed in our previous work [
22]. This modification aims to accurately characterize the transient flow and heat transfer characteristics of hydrocarbon fuels. By incorporating factors such as flow state and thermal stratification, the modified overall heat transfer coefficient provides a more accurate representation of the heat transfer process. The specific details and methodology of this modification can be found in the referenced previous work. For the convenient, the overall heat transfer coefficient calculation equations are given as follows:
To capture the transient flow and heat transfer dynamic of hydrocarbon fuel in the cooling channel, the average fuel and wall temperature are monitored at the outlet of the heating section. The cross-sectional average wall temperature in the cooling channel can be calculated as follows:
The cross-sectional average fuel temperature can be calculated using the cross-sectional average specific enthalpy. The method for calculating the cross-sectional average specific enthalpy is as follows:
To calculate the cross-sectional average fuel temperature, the standard physical property library data is utilized. Enthalpy, being a state parameter, can be obtained from the standard physical property library corresponding to the given temperature.
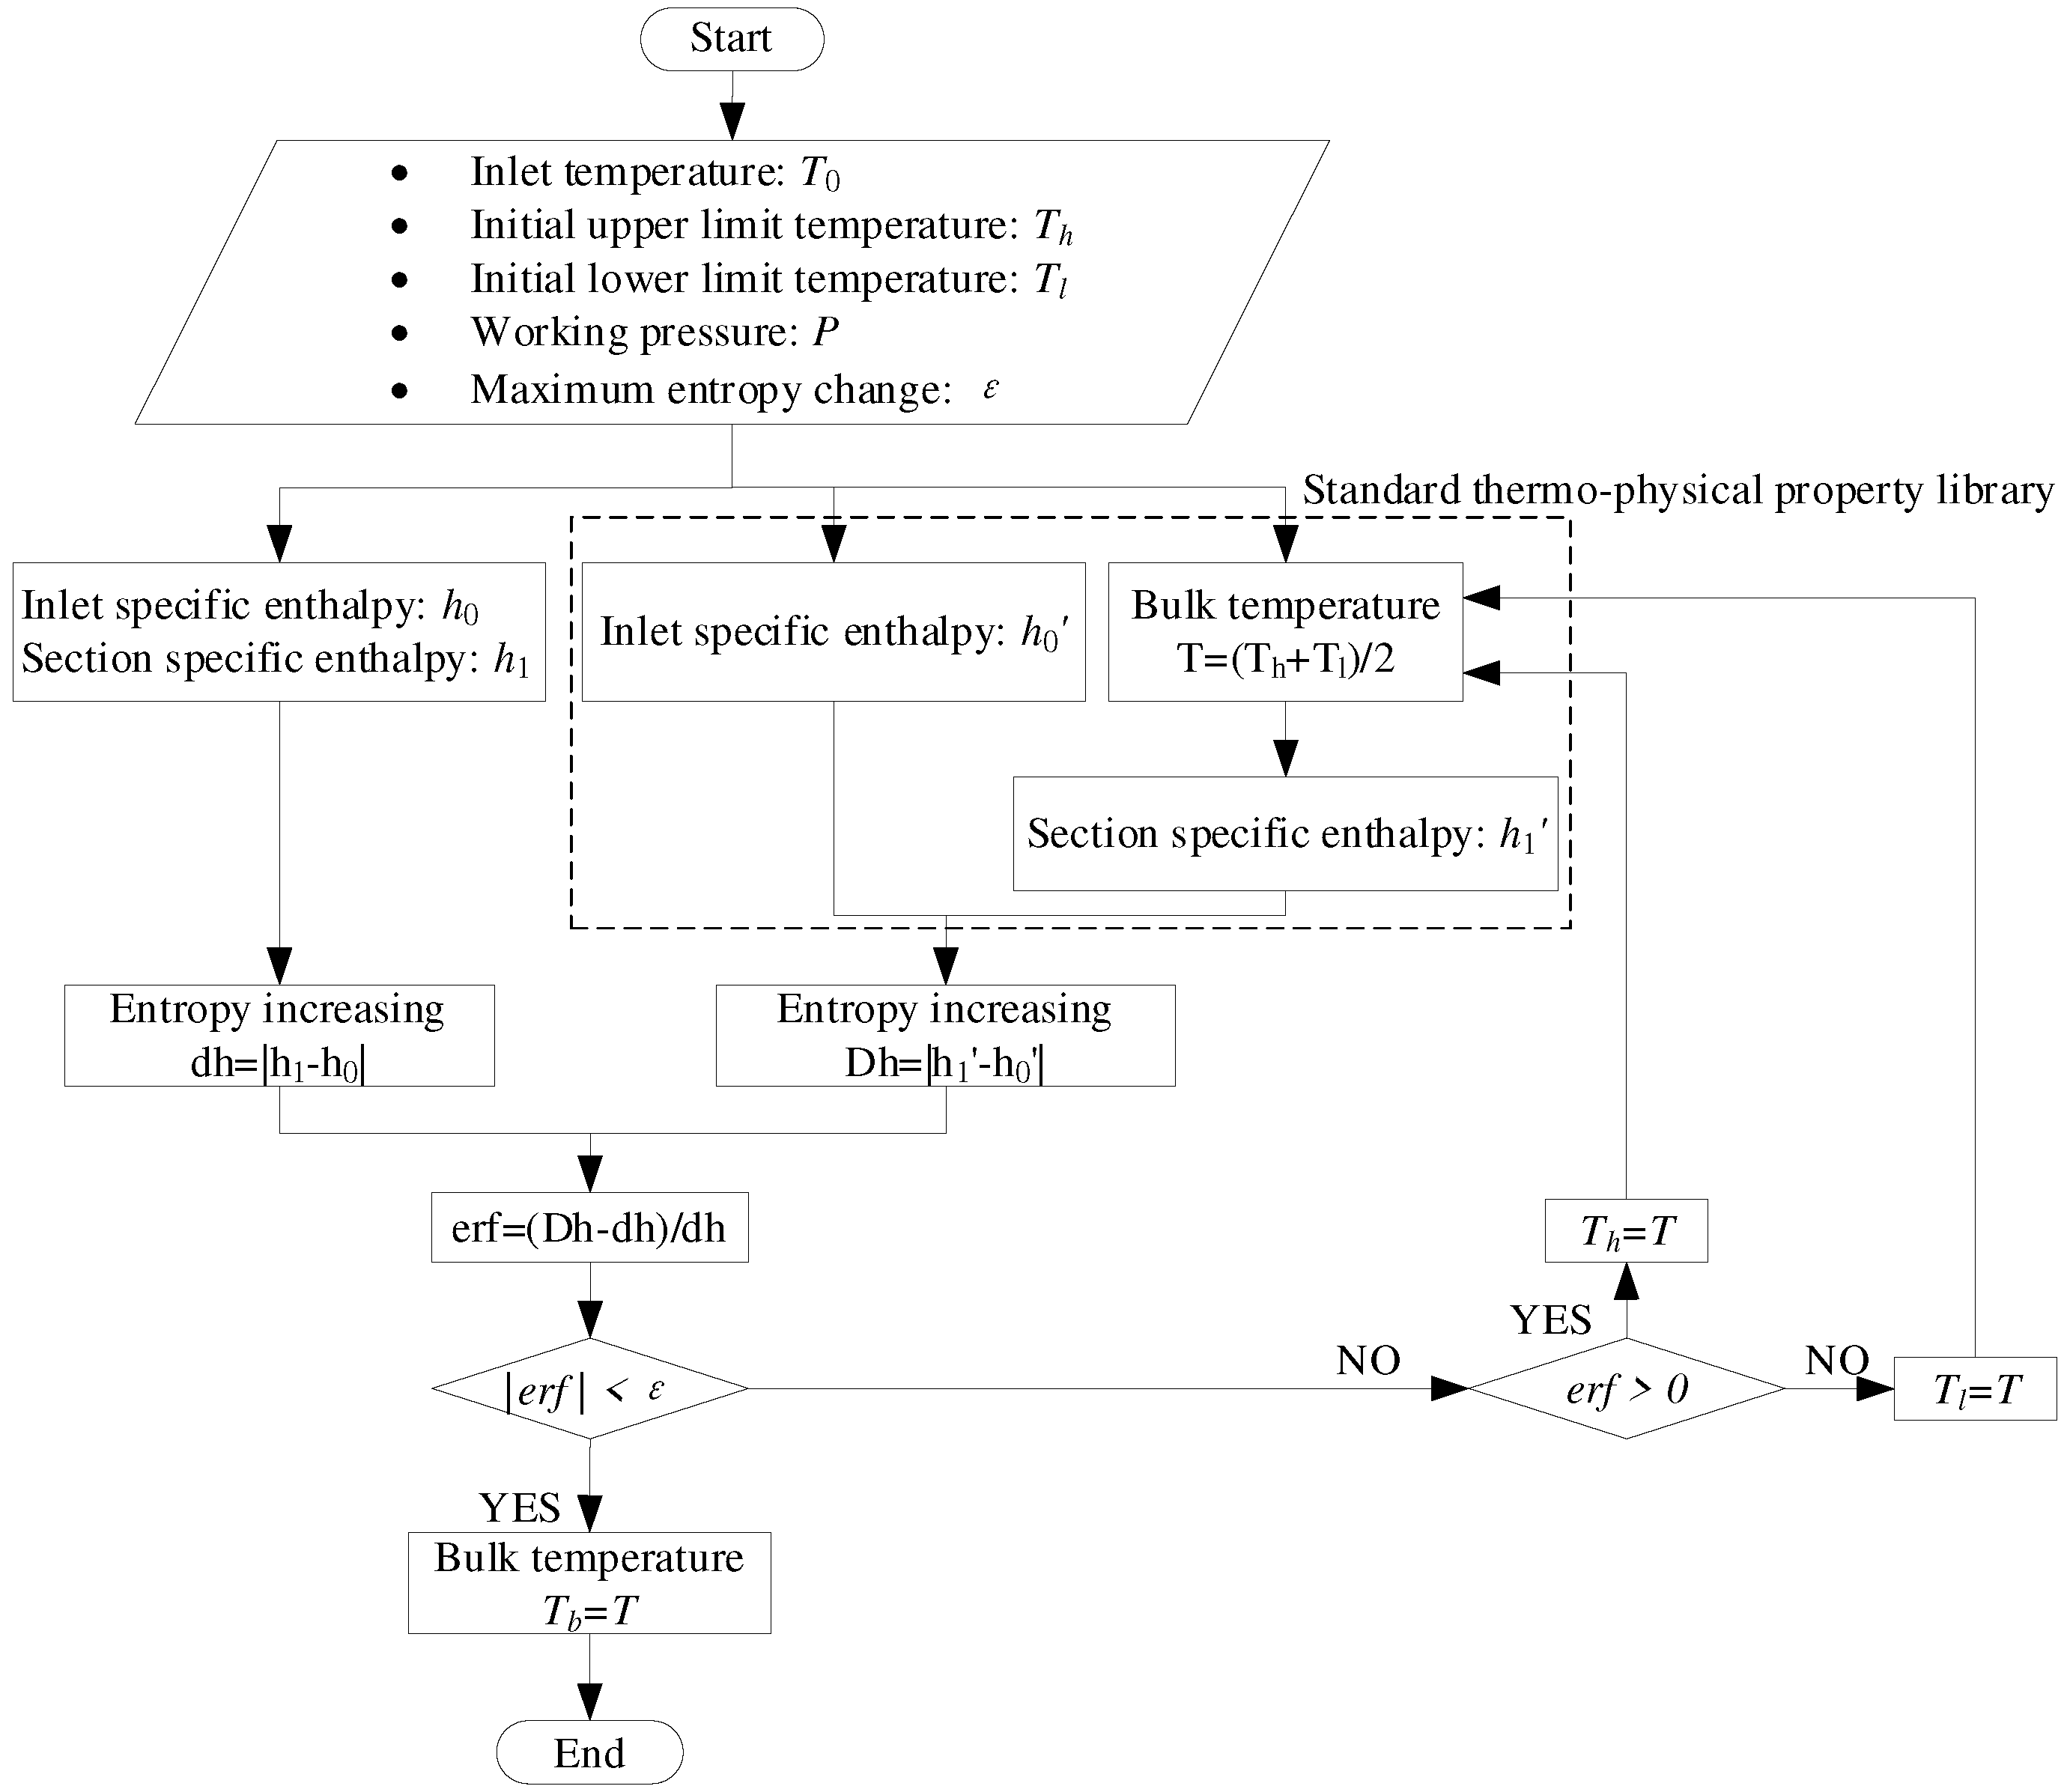
In the numerical calculation, the enthalpy change can be computed using Eq.21. To obtain the enthalpy change from the standard physical property library, a dichotomy method can be employed. By iteratively narrowing down the range of temperatures, the temperature corresponding to the desired enthalpy change can be determined.
While the numerical calculation and the enthalpy values from the standard physical property library may differ, the enthalpy changes obtained from both methods are consistent when subjected to the same temperature difference. Therefore, the temperature obtained from the standard physical property library can be considered as the temperature corresponding to the specific enthalpy of the current section, facilitating the calculation of the cross-sectional average fuel temperature. The calculation method is adopted from our previous work [
22], which is shown in
Figure 4.
To evaluate the transient flow and heat transfer dynamic characteristics of hydrocarbon fuel in the cooling channel, numerical studies under different dynamic working conditions are discussed. Three different dynamic conditions are: inlet mass flow, heat flux and working pressure. The change rate of inlet mass flow and heat flux are defined as follows:
In the initial boundary conditions of the study, the stable conditions are considered. The heat flux values corresponding to these stable conditions are provided in
Table 2. These values are given for a mass flow rate of 1 g/s, two different back pressures of 5 MPa and 3 MPa, and four outlet fuel temperatures of 373.15 K, 473.15 K, 573.15 K and 673.15 K. The heat flux values provided in
Table 2 represent the amount of heat transfer per unit area at the boundary of the cooling channel. They serve as reference values for the stable conditions and are used as initial conditions for the numerical simulations in the study. By setting these initial boundary conditions, the study aims to analyze the transient flow and heat transfer characteristics of hydrocarbon fuel in the cooling channel under different dynamic working conditions, allowing for a comprehensive understanding of the heat transfer process.
2.3. Calculation model validation
Grid independence verification is an important step in numerical simulations to ensure that the results are not significantly affected by the grid resolution. In this study, a grid independence analysis was conducted before experimental verification. A 10-layer grid was employed in the solid domain, while in the fluid domain, the grid near the wall was refined to ensure that the thickness of the first layer is less than 1 and the y+ value of the first three layers is less than 5. The time step for the calculation was set to 0.001 s.
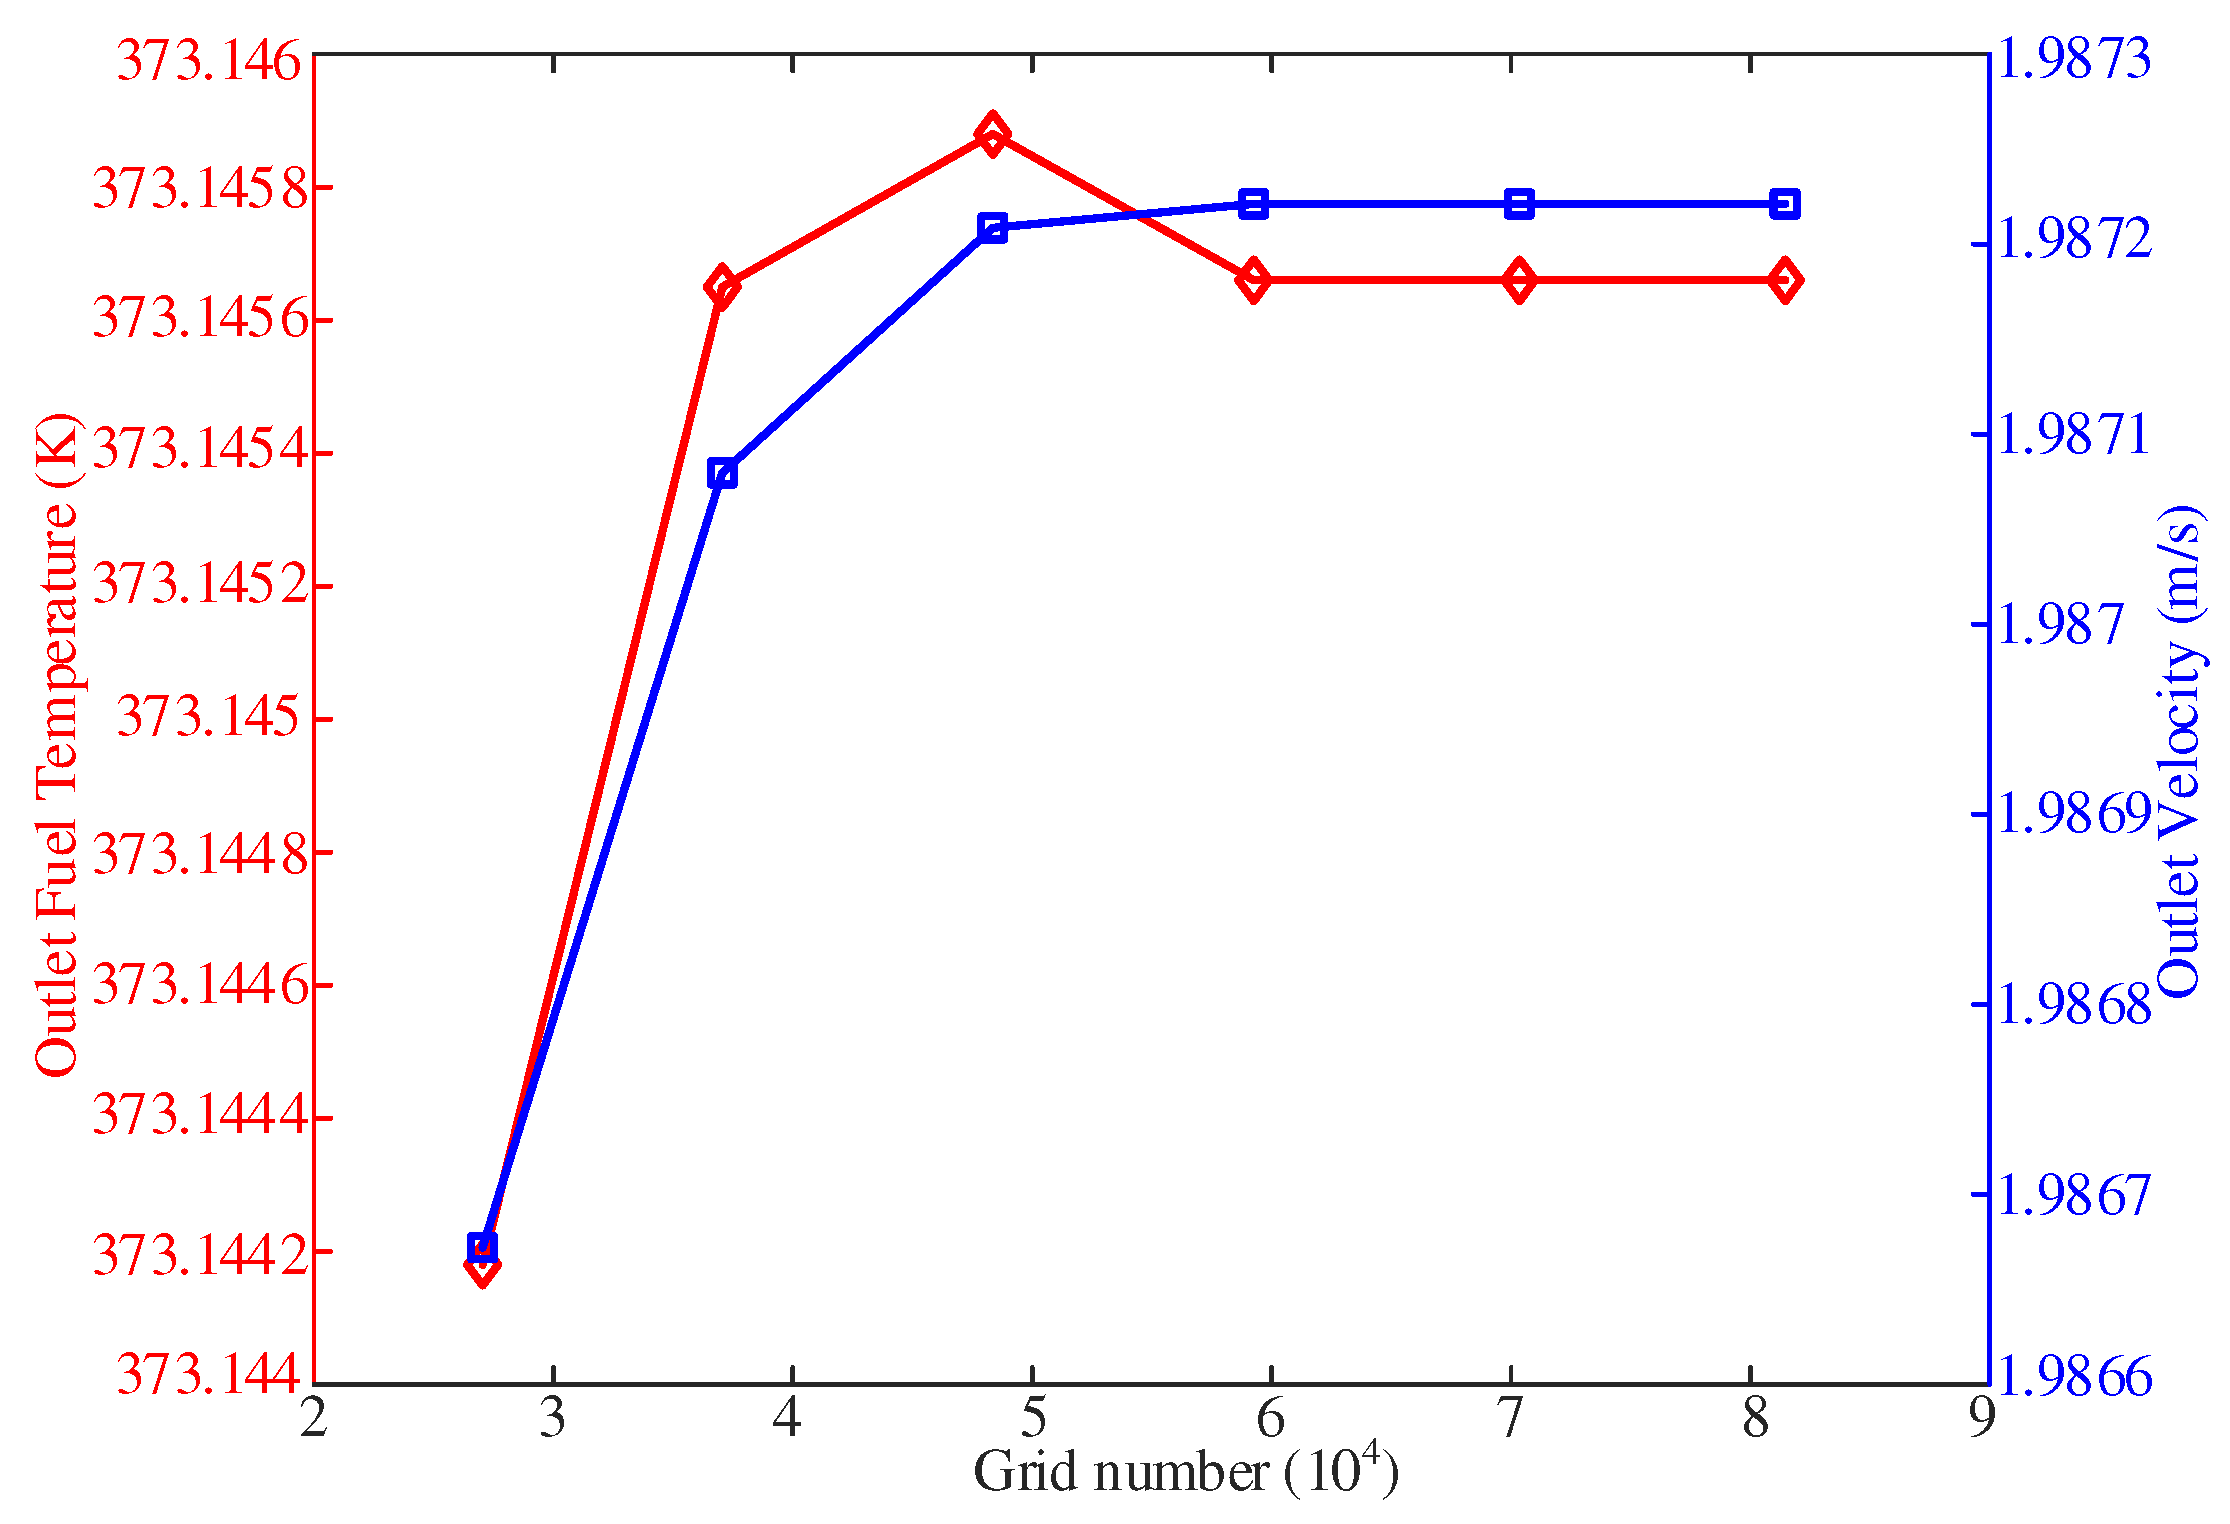
The grid independence analysis was performed by varying the number of grids and observing the effect on the outlet fuel temperature and cross-sectional average velocity.
Figure 5 illustrates the distribution of these parameters under six different grid numbers. The result shows that when the number of grids reached 70,000, there was no significant change in the fuel temperature and velocity at the outlet regardless of further increasing or decreasing of the number of grids. This indicates that the results have reached a grid-independent stare. Based on these findings, it can be concluded that the numerical simulations are sufficiently accurate and reliable, and the chosen grid size of 70,000 grids is appropriate for the subsequent analysis and experimental verification.
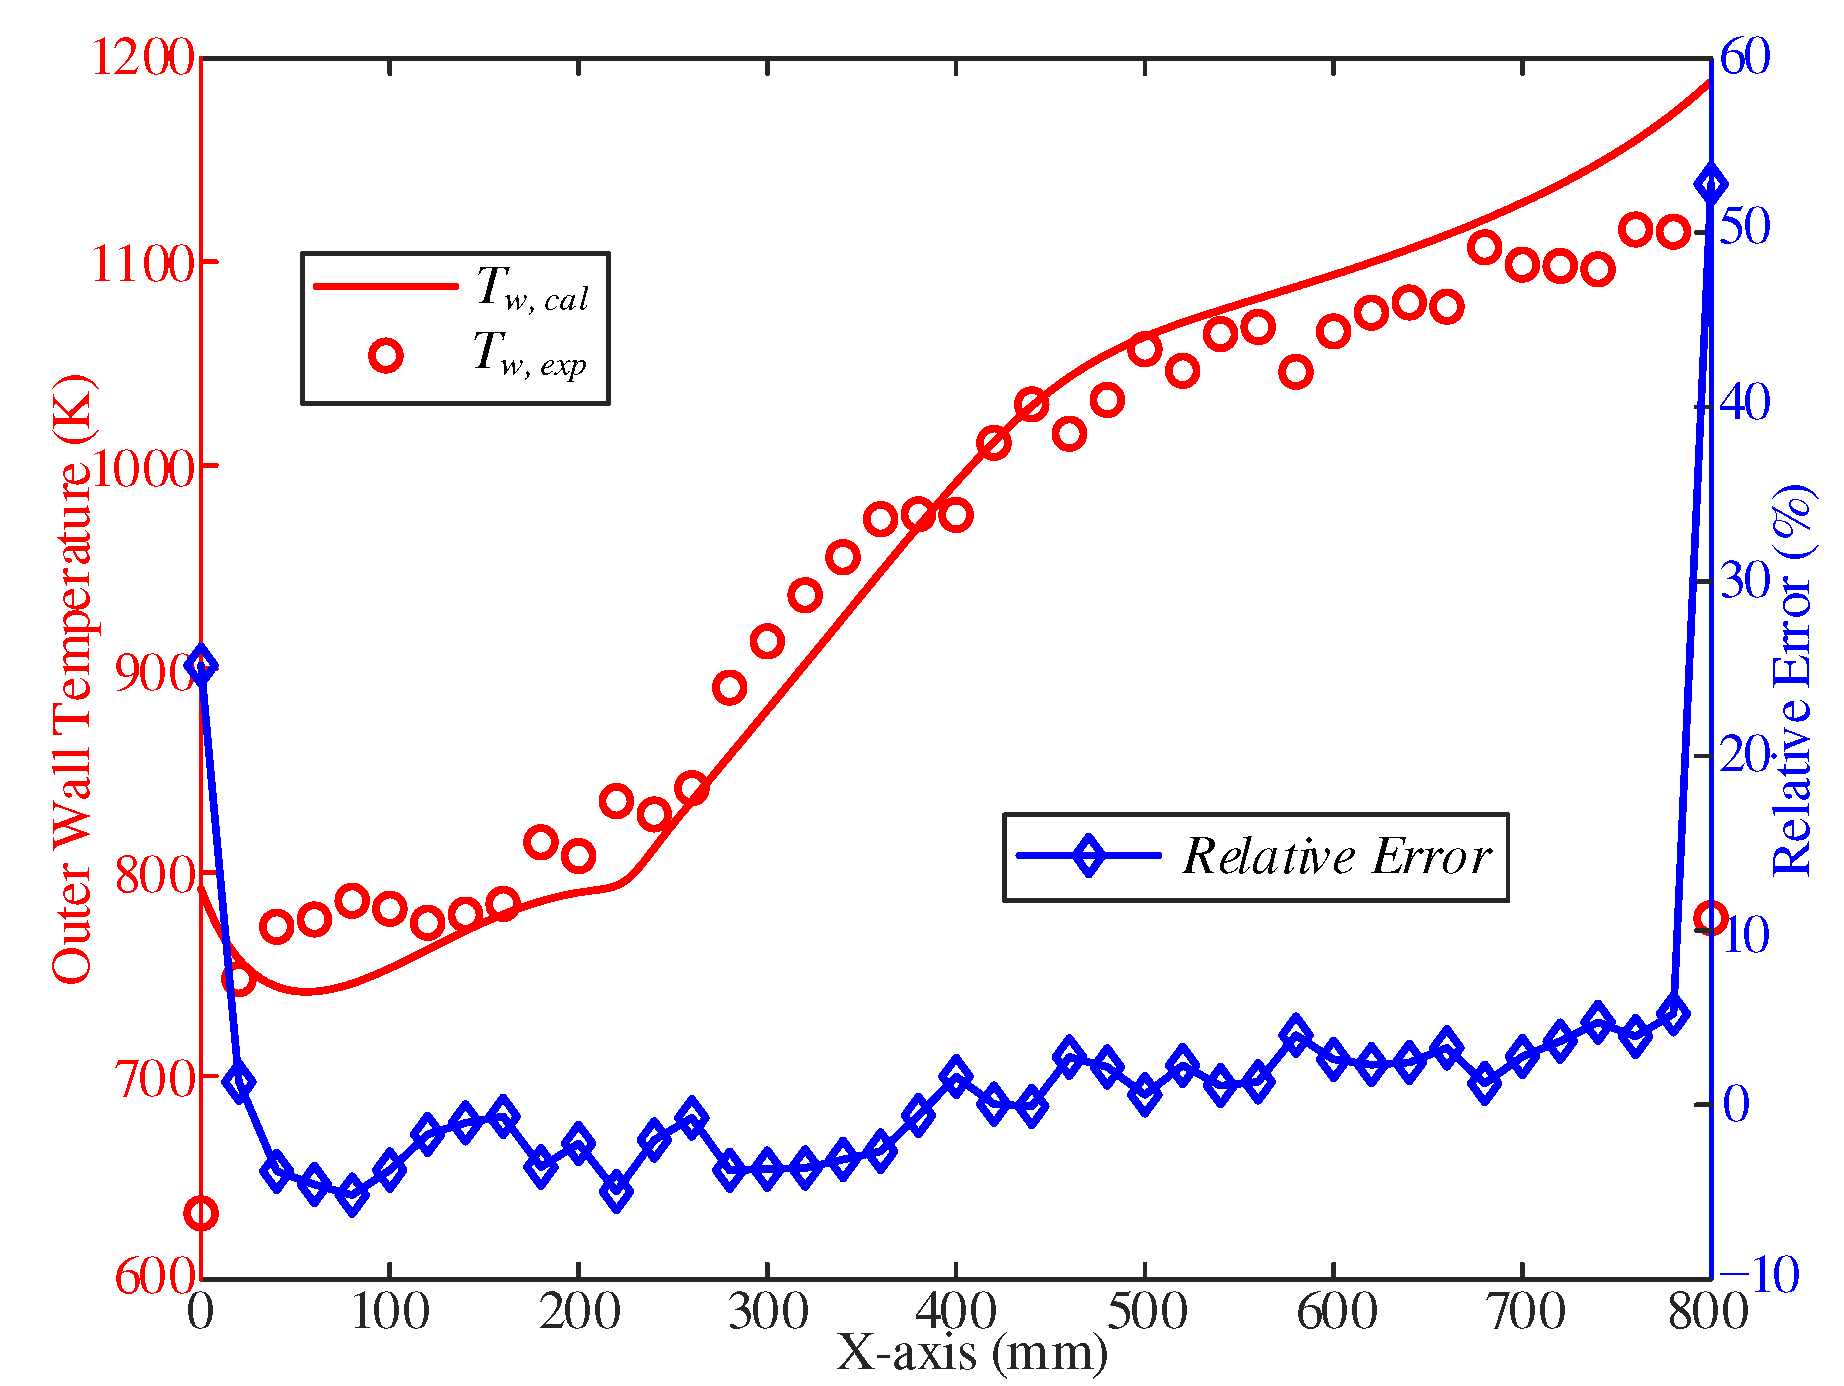
To validate the accuracy of the flow and heat transfer calculation model, a common approach is to compare the calculated outer wall temperature with the corresponding experimental measurement. The relative deviation between the calculated value (Tw,cal) and the experimental value (Tw,exp) can be calculated using the following equation:
This equation measures the percentage difference between the calculated and experimental values, providing an indication of the agreement between the two. A lower relative deviation indicates a closer match between the calculated and experimental results, indicating a better accuracy of the calculation model.
In the experimental setup, an electric heating tube is employed to simulate the heat transfer conditions in the combustion chamber of the cooling channel. The experimental system, as depicted in
Figure 6, consists of various components, including the cooling channel itself. The cooling channel is characterized by a cylindrical shape with specific dimensions, such as an inner diameter of 1 mm, an outer diameter of 3 mm, and a length of 800 mm. Throughout the experiment, certain parameters are carefully controlled. The inlet mass flow is set at 0.487 g/s, ensuring a consistent flow rate of n-decane. The wall heat flux, which represents the amount of heat transferred to the cooling channel wall per unit area, is maintained at 715,000 W/m2. Additionally, the tube back pressure is kept constant at 3 MPa, providing a consistent pressure environment for the experiment. The accuracy of the experimental equipment plays a crucial role in obtaining reliable data.
Table 3 accompany the setup provides information on the accuracy of various instruments and devices used during the experiment, ensuring precise measurements and reliable results.
Measurement errors play a significant role in data processing and analysis. These errors can arise from both direct and indirect measurements, with different factors contributing to their overall magnitude. The measurement error is expressed as follows:
For direct measurements, the errors are primarily influenced by the accuracy of the sensor and data acquisition system. On the other hand, indirect measurements, such as calculating heat flux, involve additional sources of error, including sensor accuracy, data acquisition system accuracy, and the calculation method itself. To quantify the measurement errors,
Table 4 provides an overview of the error expressions associated with different types of measurements. The table presents the specific error expressions for each measurement type, taking into account the relevant factors that contribute to the overall measurement uncertainty. These error expressions enable a comprehensive understanding of the measurement errors and their potential impact on the experimental results.
Based on the analysis and comparison between the calculated and experimental values, it can be concluded that the flow and heat transfer calculation model used in the study has been validated. The calculated results accurately predict the changing trend of the outer wall temperature, and there is a good fit between calculated and experimental values with an overall relative error of less than 5% (
Figure 7). It is worth noting that there is a relatively larger error observed at the inlet and outlet of the cooling channel. This discrepancy may be attributed to the presence of heating electrodes that act as fins, resulting in greater heat dissipation from the outer wall temperature. Despite this localized error, the overall performance of the flow and heat transfer calculation model is considered satisfactory.
3. Results and discussions
3.1. Influence of inlet fuel mass flow
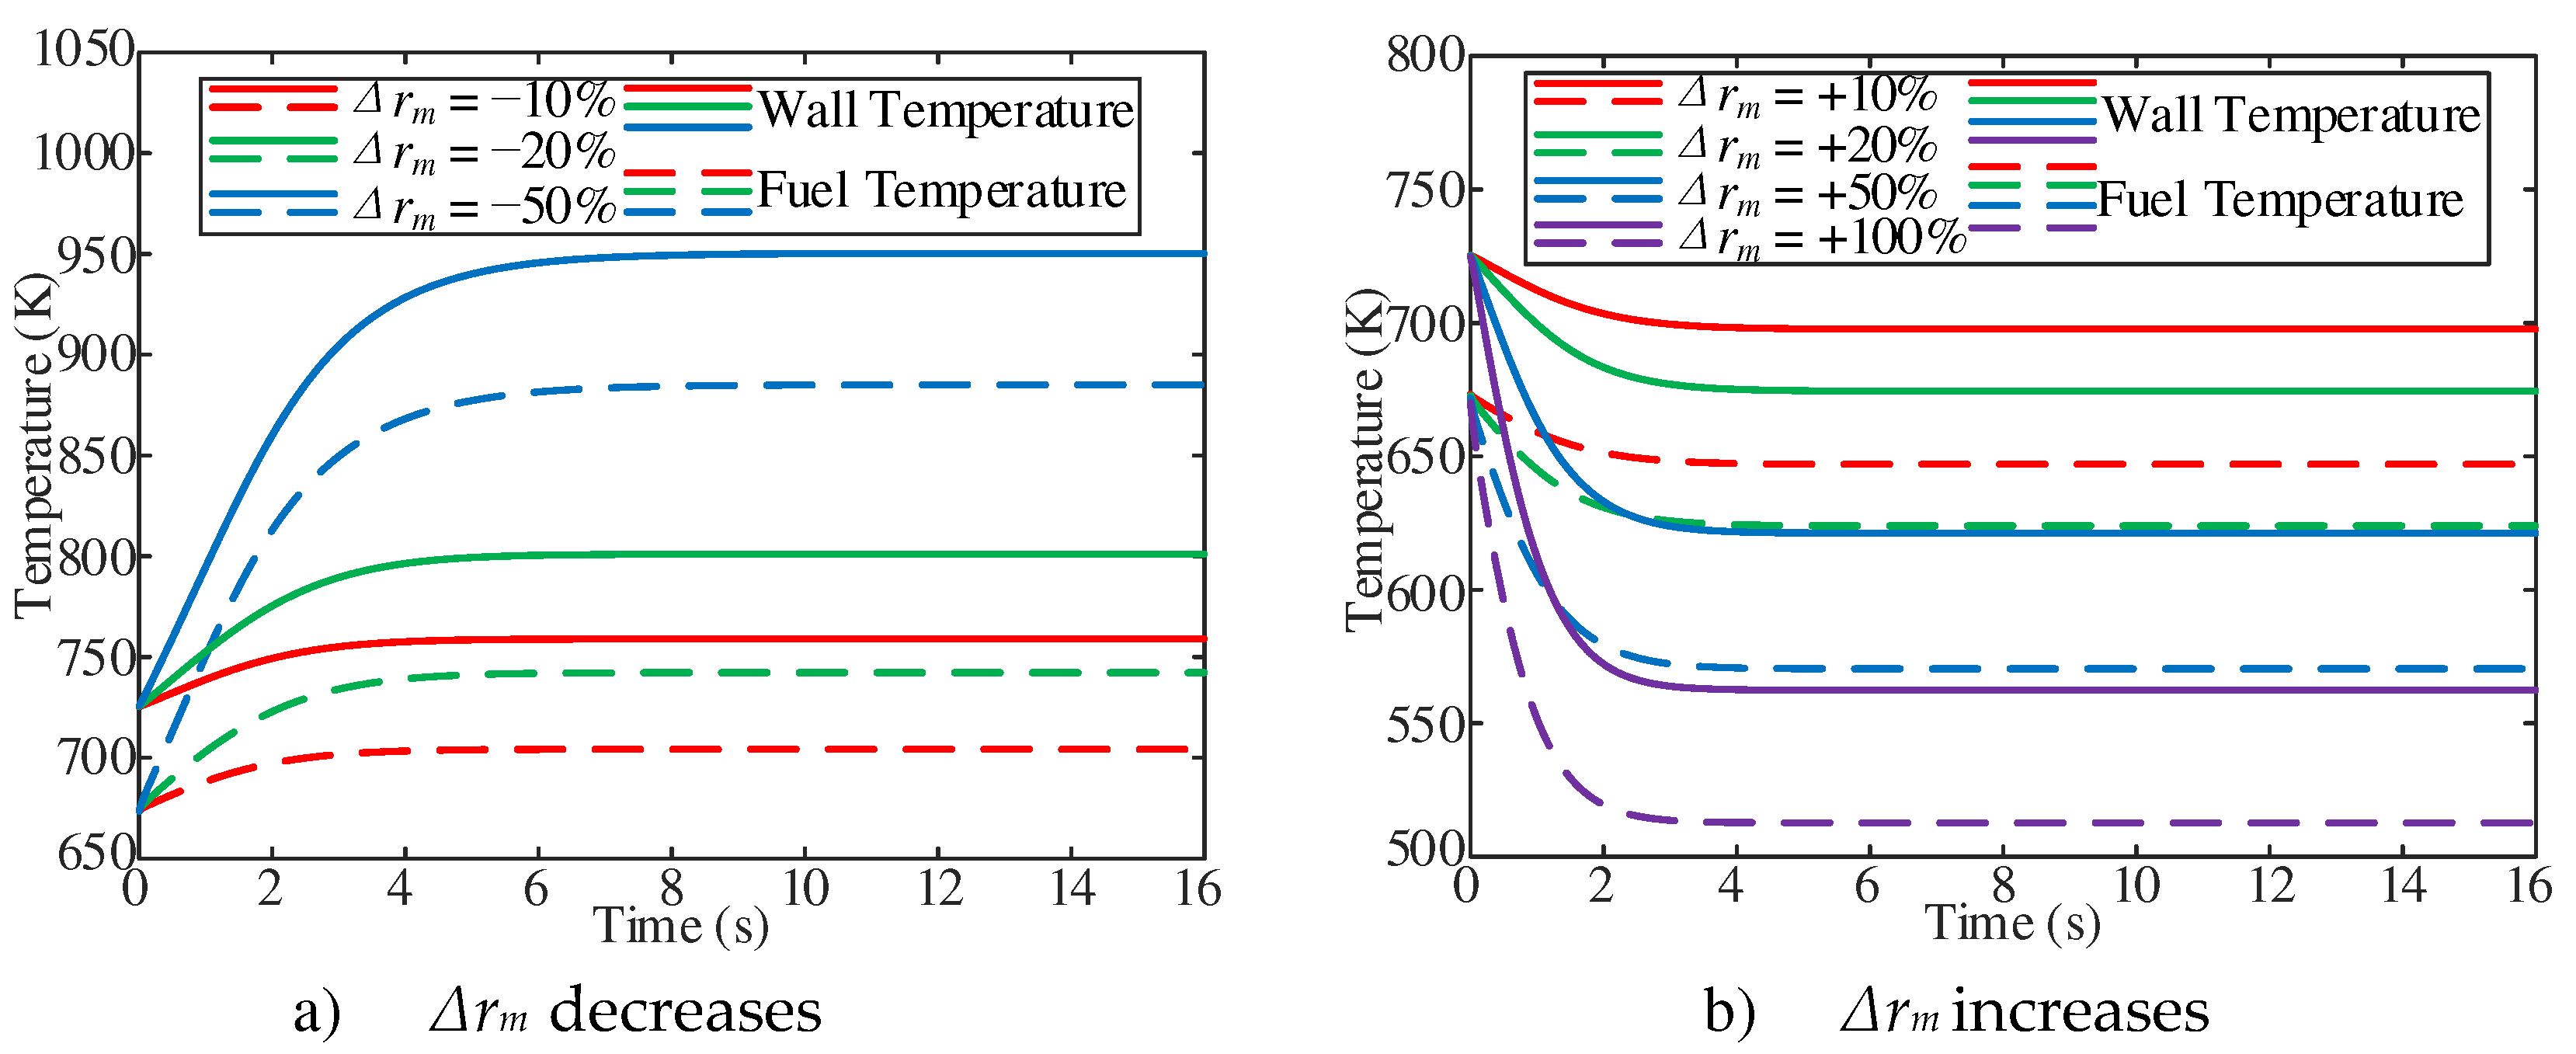
The dynamic characteristics of fuel temperature at the outlet of the heating section have been studied with the inlet mass flow changes. Calculation case conditions are an outlet pressure of 5 MPa, a mass flow rate of 1 g/s, Tfoi of 673.15 K, and inlet mass flow changes in the range of ±10%, ±20%, ±50%, +100%. As shown in
Figure 8a, the cross-sectional average fuel and wall temperature at the outlet of the heating section gradually increase with the decrease of the inlet mass flow in the initial stage of response, and then approach to the stable value. With the decrease of inlet mass flow, the stable fuel temperature and wall temperature gradually increase. In addition, with the increase of inlet mass flow, the stable fuel temperature gradually decreases (
Figure 8b).
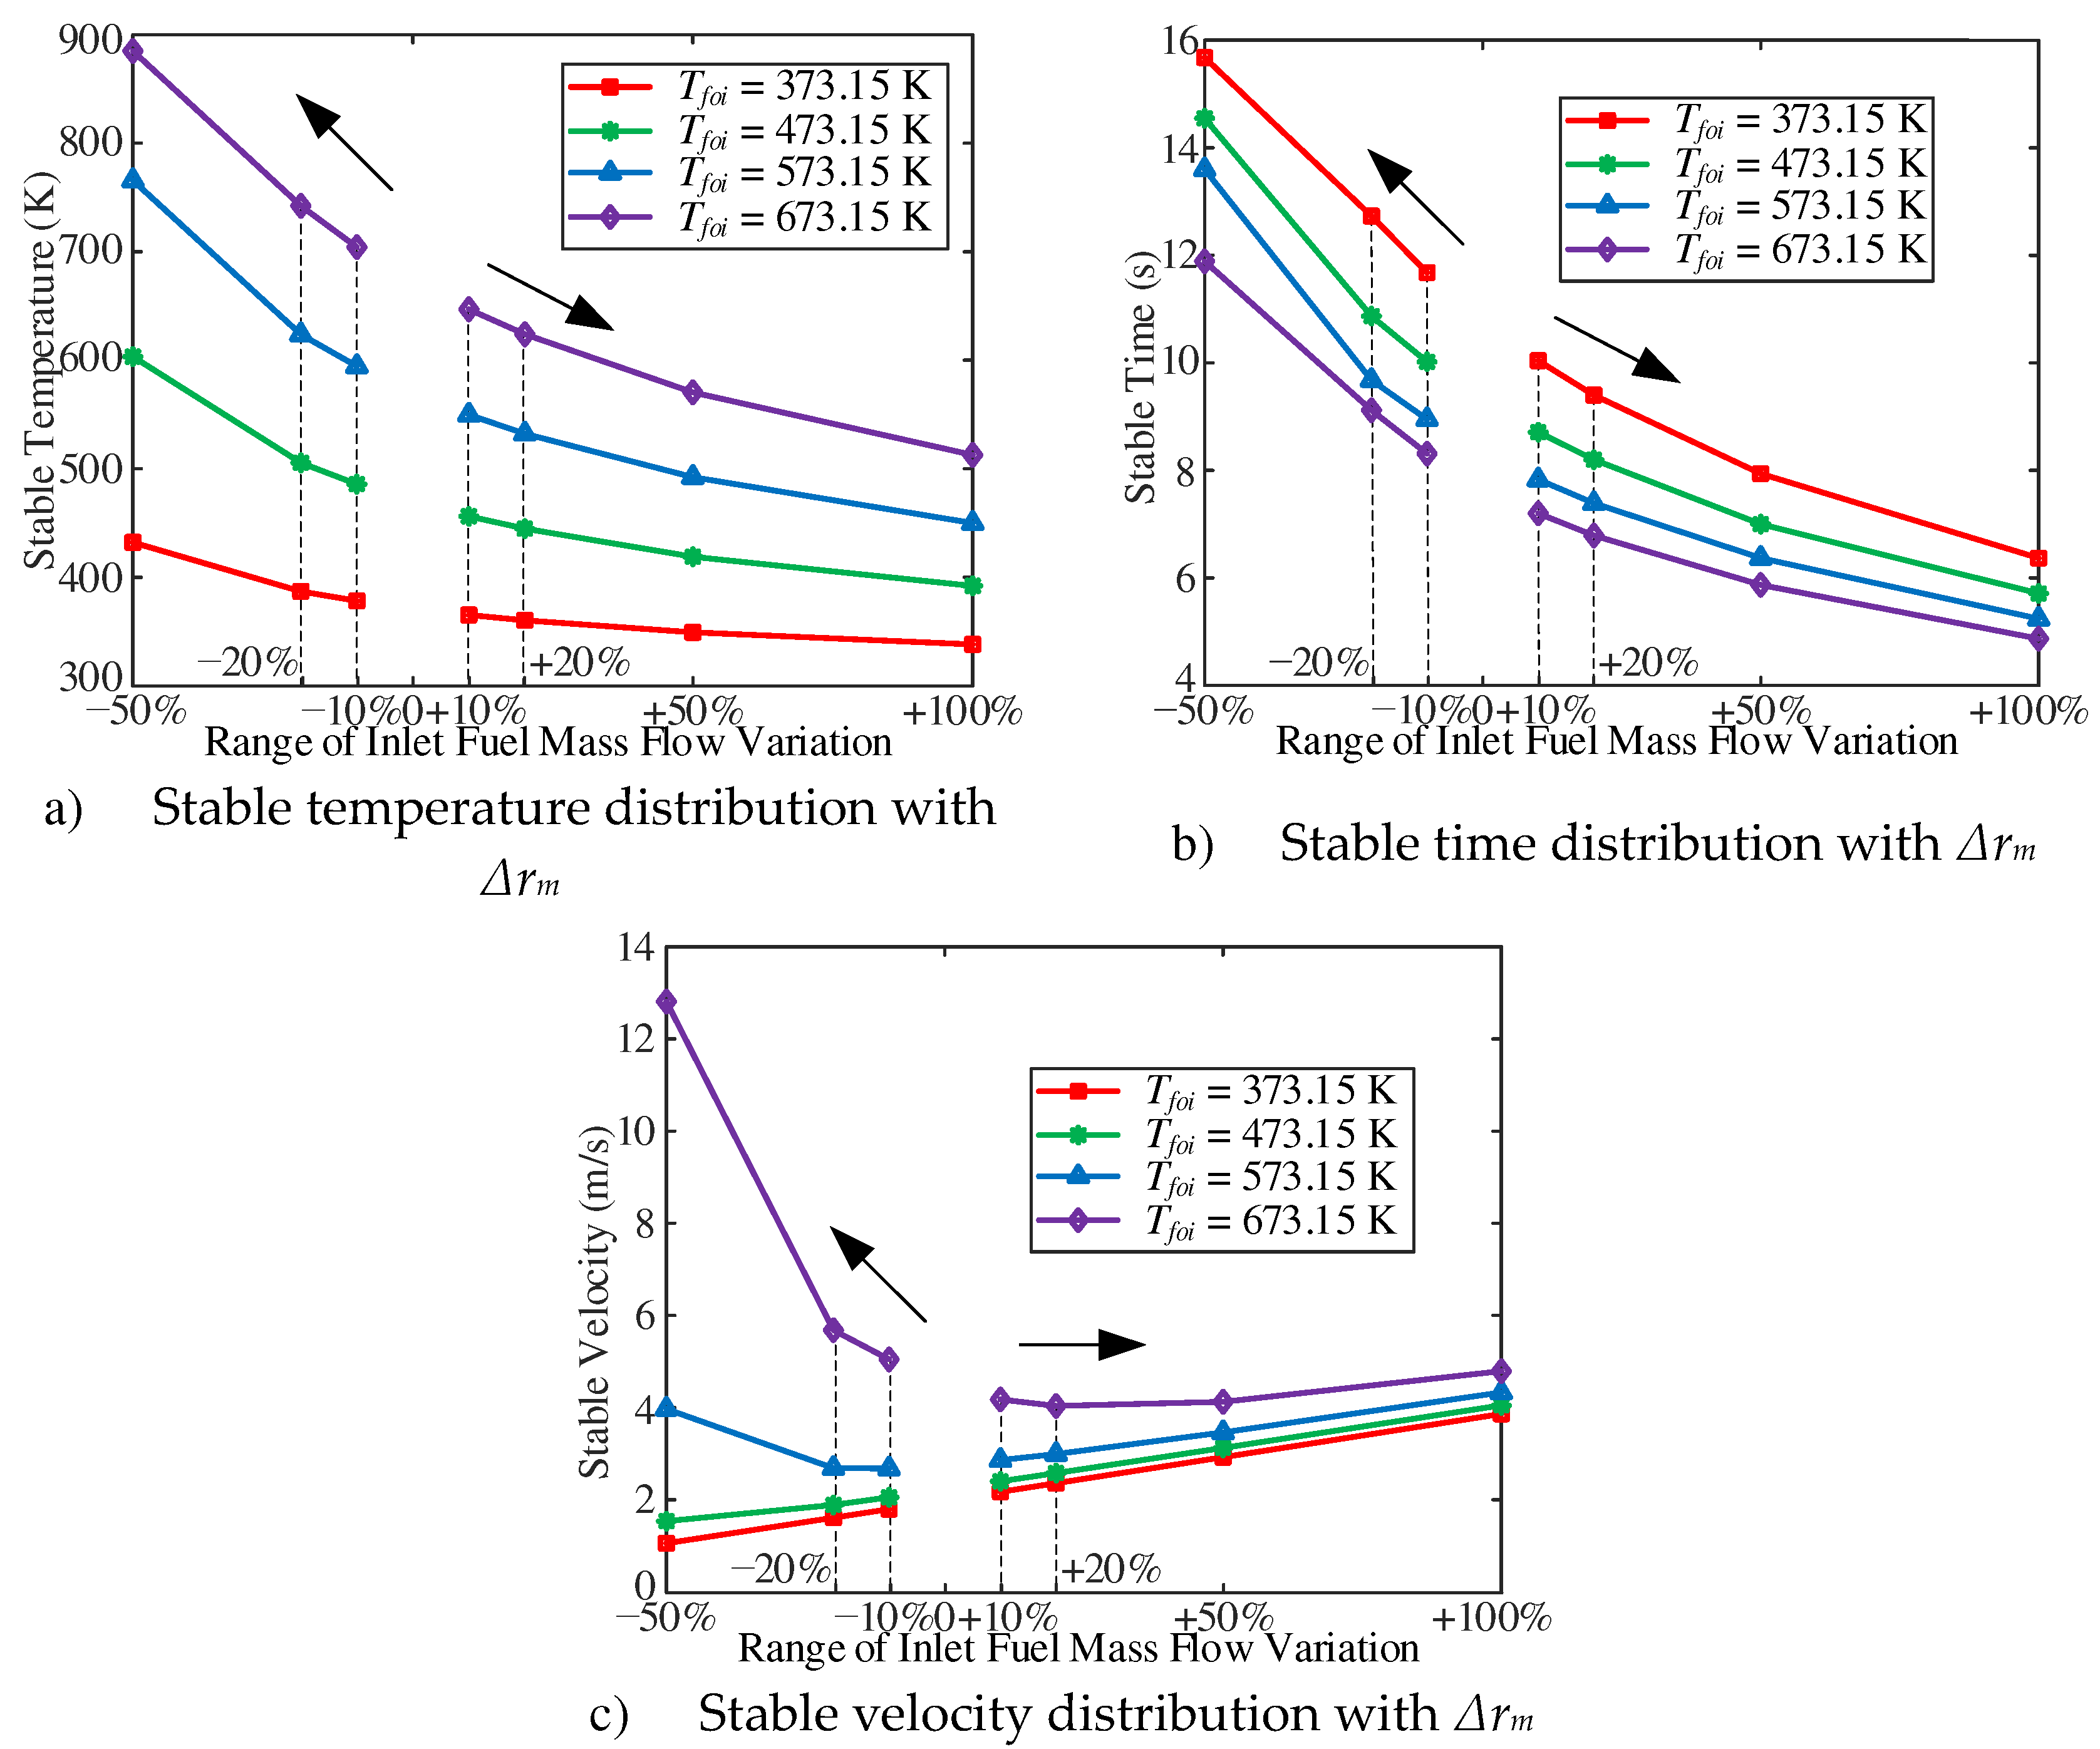
The stable fuel temperature and the stable time are shown in
Figure 9. With the decrease of inlet mass flow, the higher the stable fuel temperature is, the longer the stable time is. Similarly, with the increase of inlet mass flow, the lower the stable fuel temperature and the shorter the stable time. As shown in
Figure 9c, with the same range of inlet mass flow variation, the higher the outlet fuel temperature of the initial working condition, the shorter the stable time. As shown in
Figure 9c, with two T
foi of 373.15 K and 473.15 K, as the inlet mass flow decreases, the steady velocity decreases; With two T
foi of 573.15 K and 673.15 K, as the inlet mass flow decreases, the steady velocity does not decrease but increases. After analysis and discussion, on the one hand, the decrease of inlet mass flow can lead to the decrease of inlet velocity with the constant of inlet temperature. On the other hand, according to the existing steady flow and heat transfer characteristics, there is a thermal acceleration effect in the forced convective heat transfer of n-decane. With two T
foi of 573.15 K and 673.15 K, as the inlet mass flow decreases, the fuel will pass through the pseudo-critical temperature zone. Near the pseudo-critical temperature, the thermos-physical properties of n-decane will change dramatically. As a result, the increase of velocity caused by the decrease of n-decane density is much larger than that caused by the decrease of inlet mass flow.
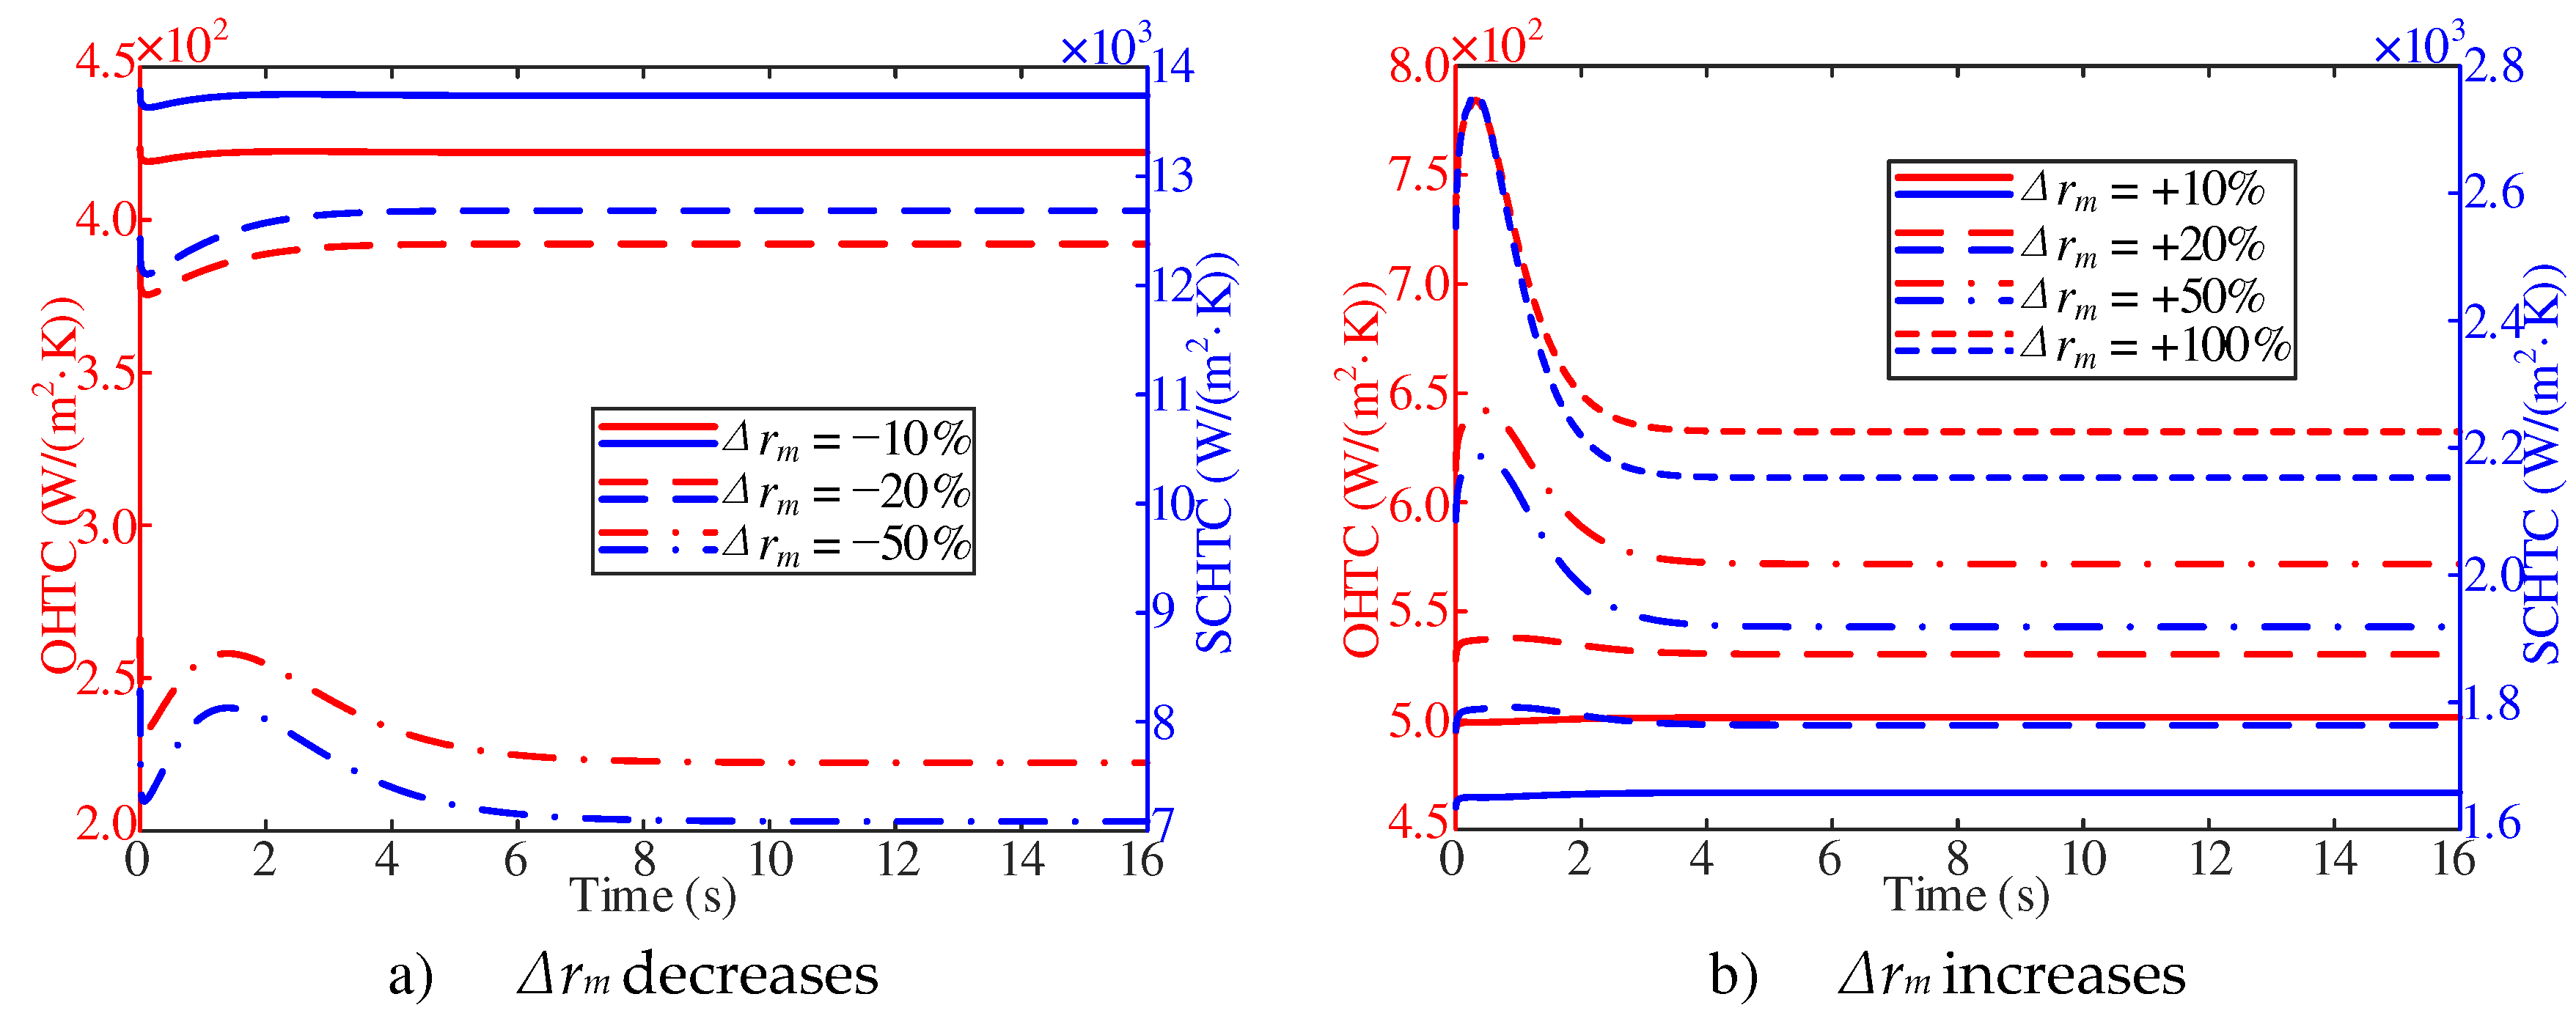
As shown in
Figure 10a, with two
Δrm of −10% and −20%, the overall heat transfer coefficient decreases first and then increases with the decrease of inlet mass flow at the initial stage of response. With Δrm of −50%, the overall heat transfer coefficient decreases first, then increases and then decreases with the decrease of the inlet mass flow at the initial stage of the response, and then approaches the stable value. With the decrease of the inlet mass flow, the stable value of the overall heat transfer coefficient gradually decreases. As shown in
Figure 10b, the overall heat transfer coefficient increases first and then decreases at the beginning of the response. In addition, the trend becomes more obvious with the increase of the inlet mass flow. With the increase of inlet mass flow, the stable value of overall heat transfer coefficient increases gradually.
In this study, a multivariate analysis was conducted to analyze the main physical quantities that affect the overall heat transfer coefficient decreases. It was found that the overall heat transfer coefficient is primarily influenced by the surface convective heat transfer coefficient (
Figure 10). The variation trend of the surface convective heat transfer coefficient can be explained by considering the variation trend of the adjacent wall temperature difference and the derivative of the adjacent fuel temperature.
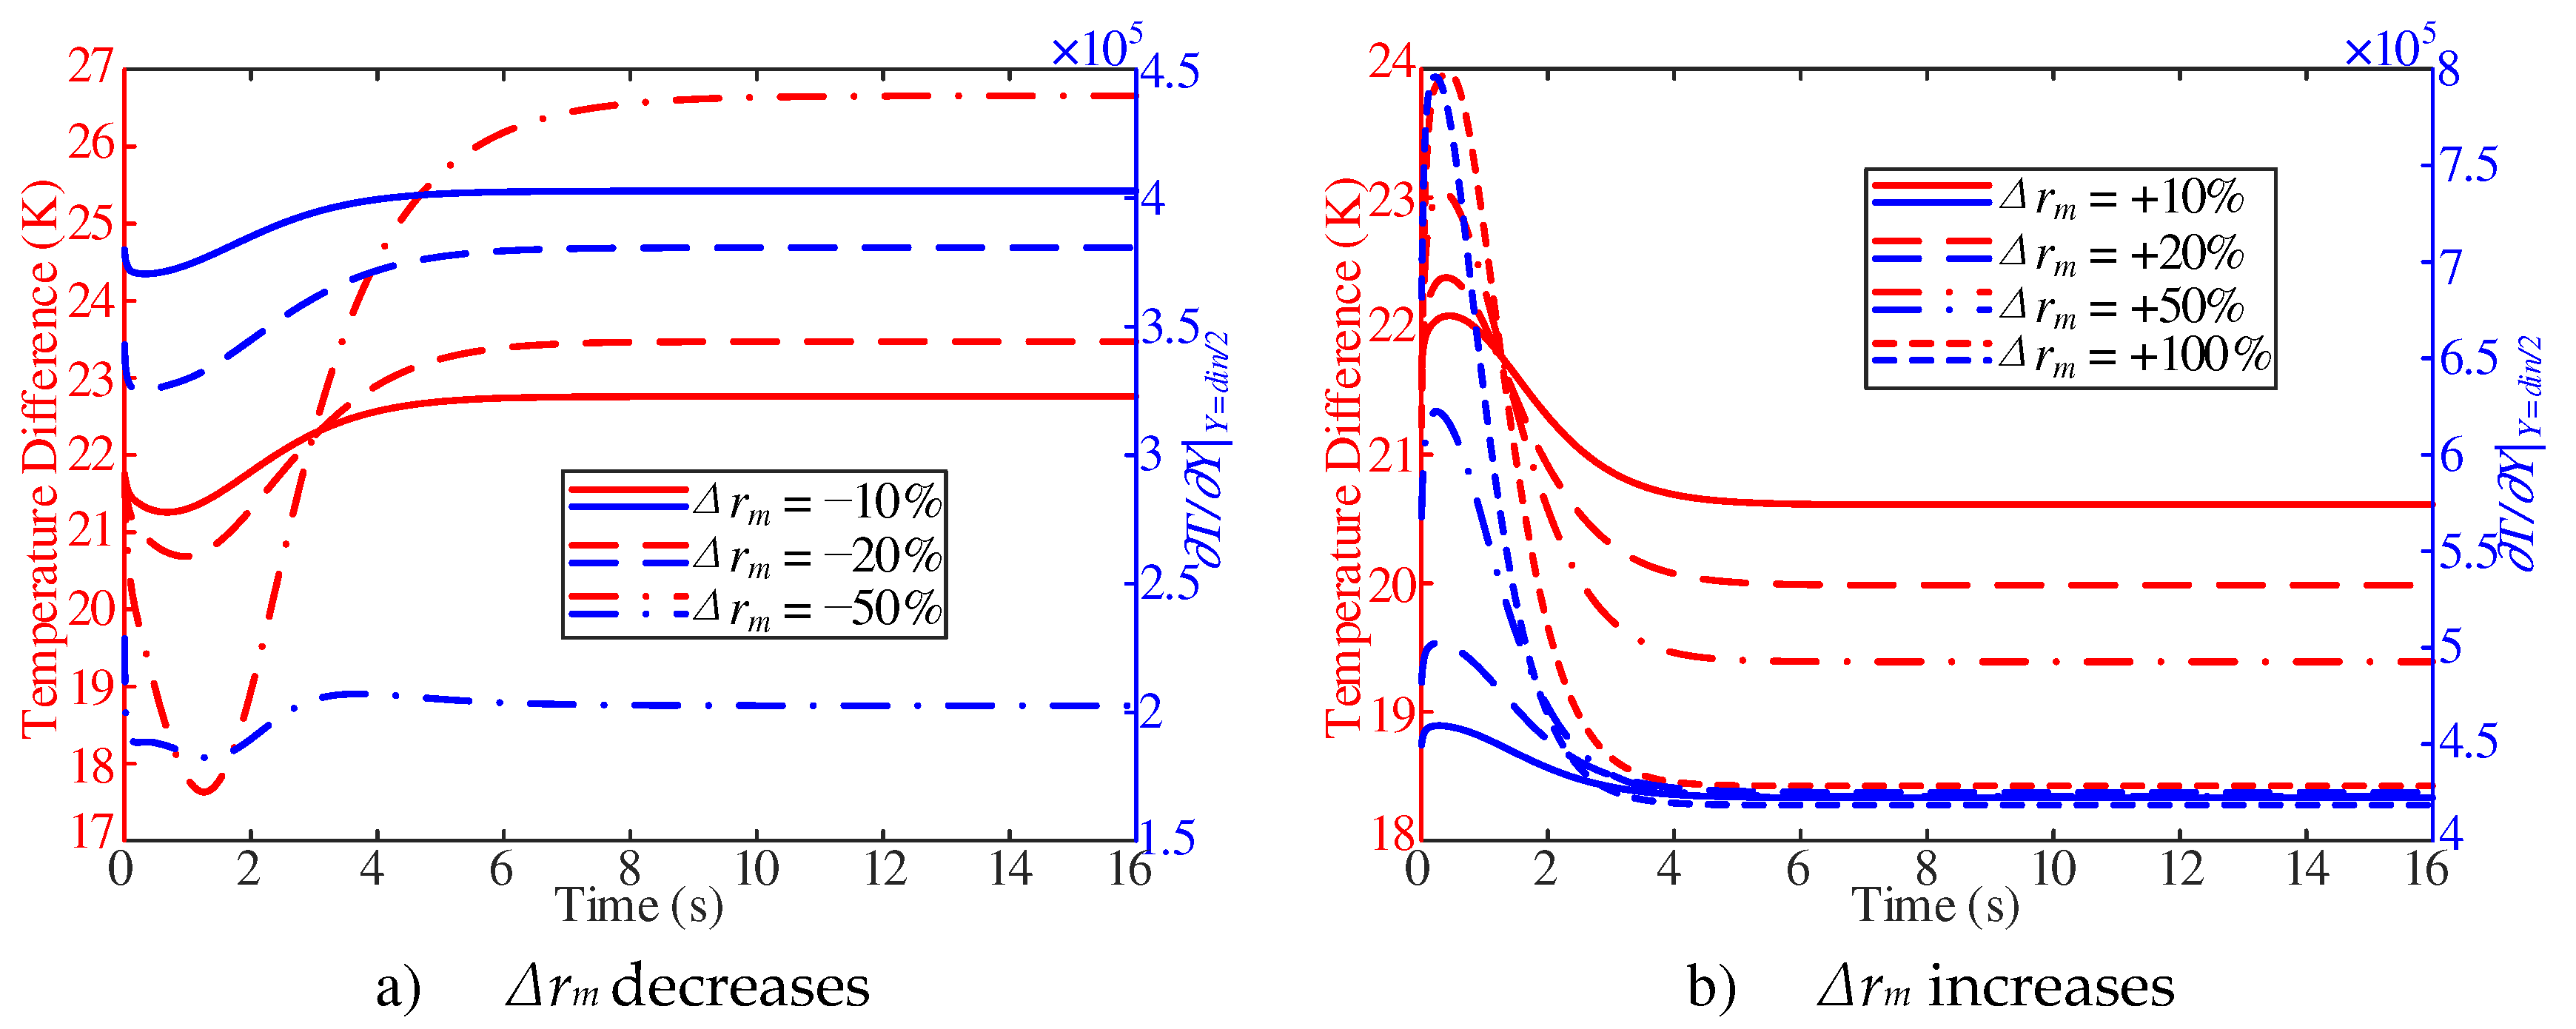
As shown in
Figure 11a, the difference between the inner wall temperature and the adjacent wall fuel temperature decreases first and then increases at the beginning of the response, and then approaches the stable value. In addition, with the decrease of inlet mass flow, the temperature difference decreases first and then increases, and then the stable value increases. On the contrary, with the increase of inlet mass flow, the temperature difference increases first and then decreases, and the stable value is smaller (
Figure 11b).
Combined with
Figure 10a and
Figure 11a, with two
Δrm of −10% and −20%, the surface convective heat transfer coefficient show a trend of decrease first and then increase at the initial stage of response. Such a trend is attribute to the decrease of the derivative of the adjacent wall fuel temperature, which was larger than the decrease of the adjacent wall temperature difference. However, with
Δrm of −50%, the surface convective heat transfer coefficient shows a downward trend in the 2~6 s. Such a trend is attribute to the increase of the adjacent wall temperature difference, which was larger than the decrease of the partial derivative of the adjacent wall fuel temperature.
Combined with
Figure 10b and
Figure 11b, the surface convective heat transfer coefficient shows a trend of increase first and then decrease at the beginning of the response. Such a trend is attribute to the increase of partial derivative of the adjacent wall fuel temperature, which is larger than the increase of adjacent wall temperature difference. With two
Δrm of +50% and +100%, the surface convective heat transfer coefficient shows a trend of decrease with the decrease of the partial derivative of the adjacent wall fuel temperature during 1~4 s. The effect is larger than the increase effect caused by the decrease of the adjacent wall temperature difference.
3.2. Influence of heat flux
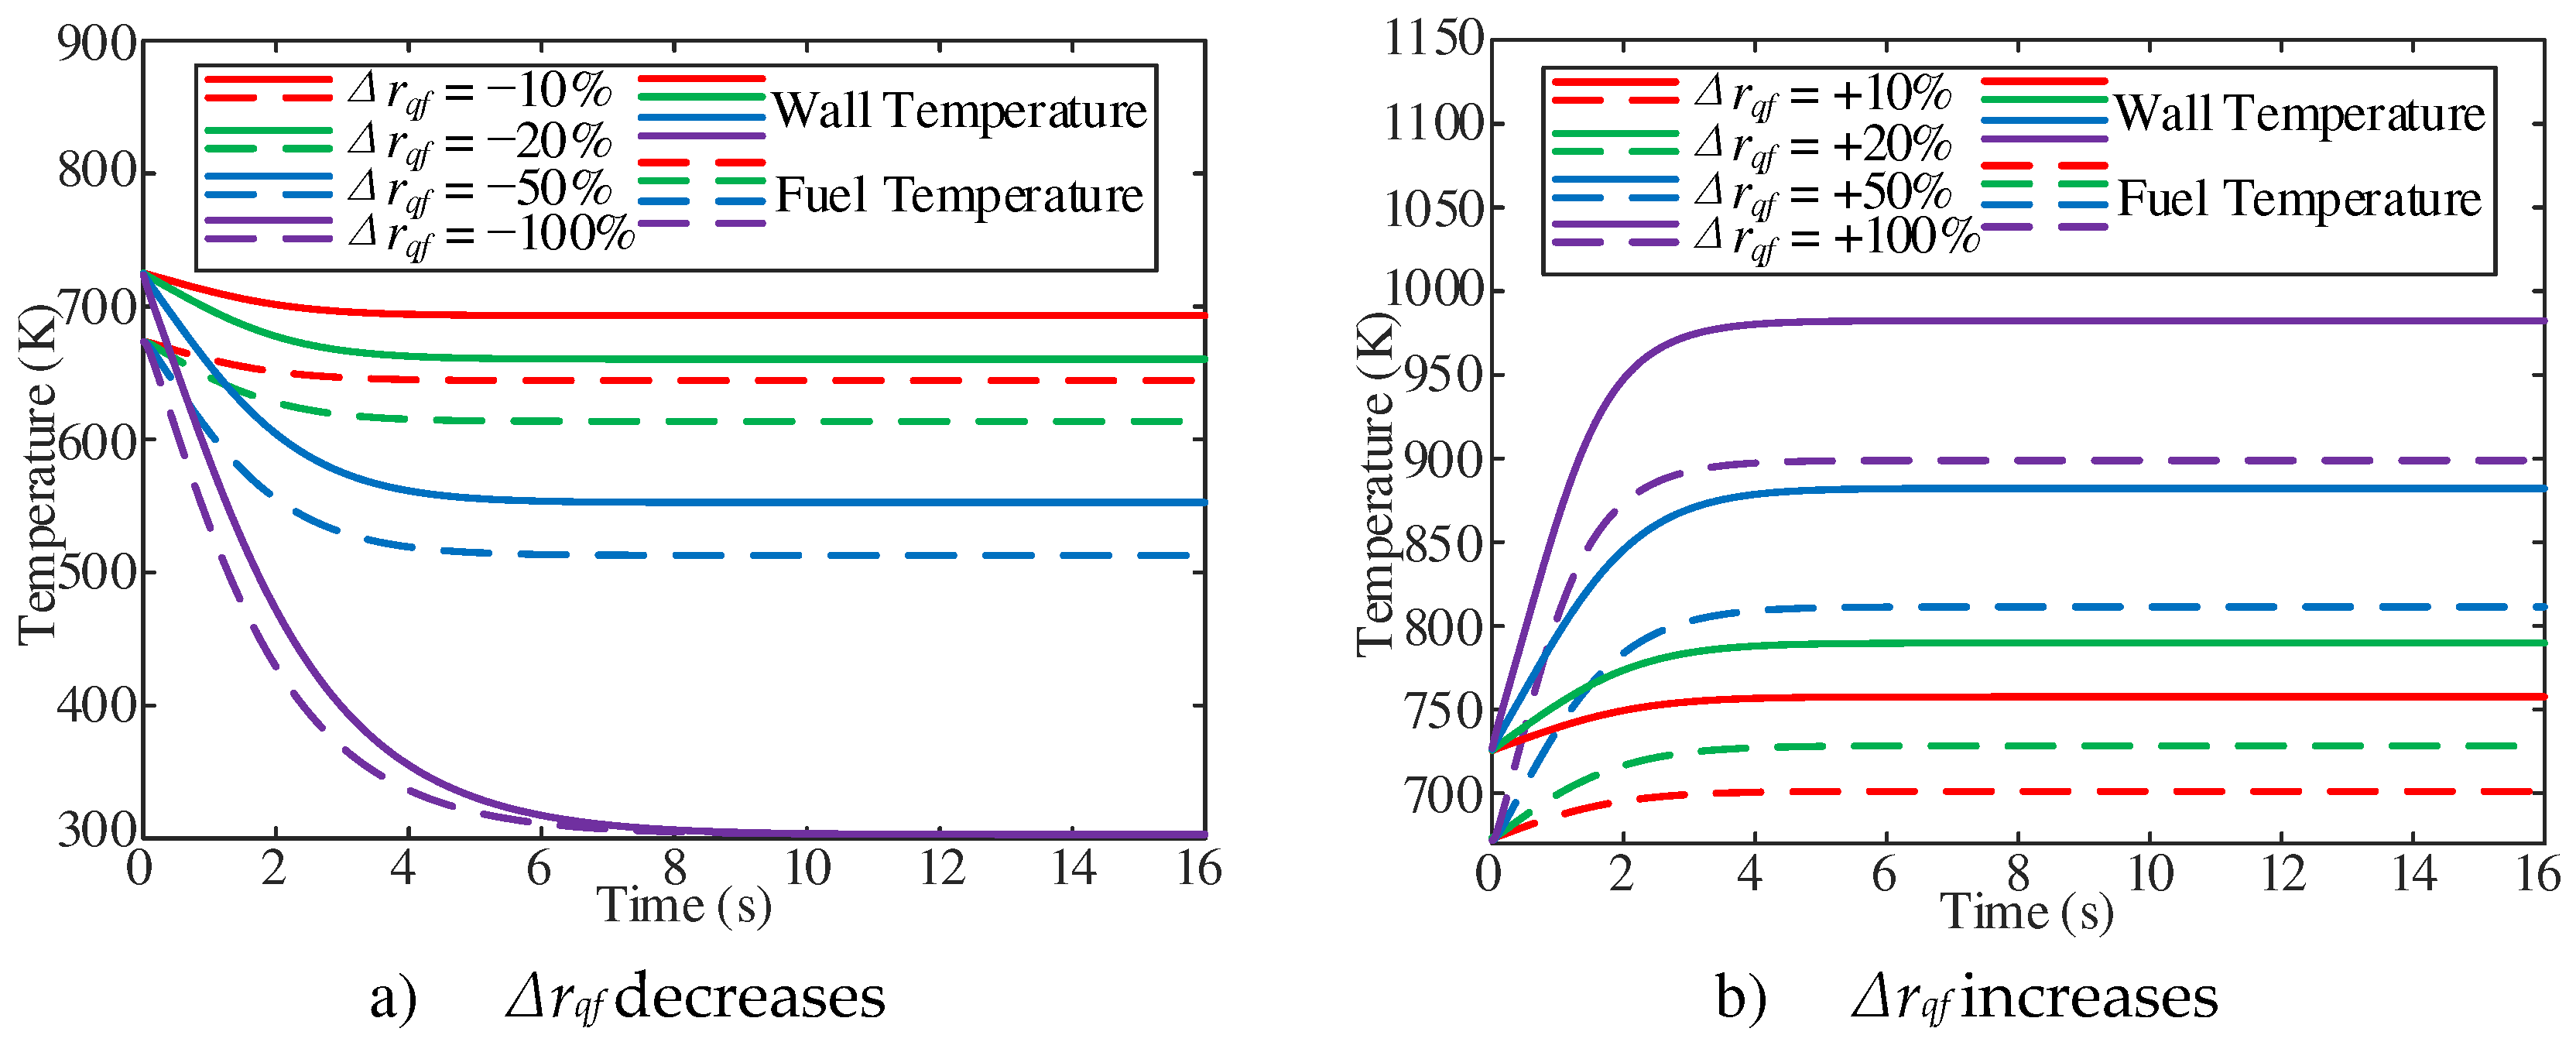
The dynamic characteristics of the fuel at the outlet of the heating section with the change of heat flux have been studied. The case conditions are with an outlet pressure of 5 MPa, a mass flow rate of 1 g/s, Tfoi of 673.15 K, and heat flux changes in the range of ±10%, ±20%, ±50%, ±100%. As shown in
Figure 12a, the cross-sectional average fuel and wall temperature at the outlet of the heating section gradually decrease with the decrease of heat flux in the initial stage of response, and then approach to the stable value. With the decrease of heat flux, the stable fuel temperature and wall temperature gradually decrease. In addition, with the increase of inlet mass flow, the stable fuel temperature gradually increases (
Figure 12b).
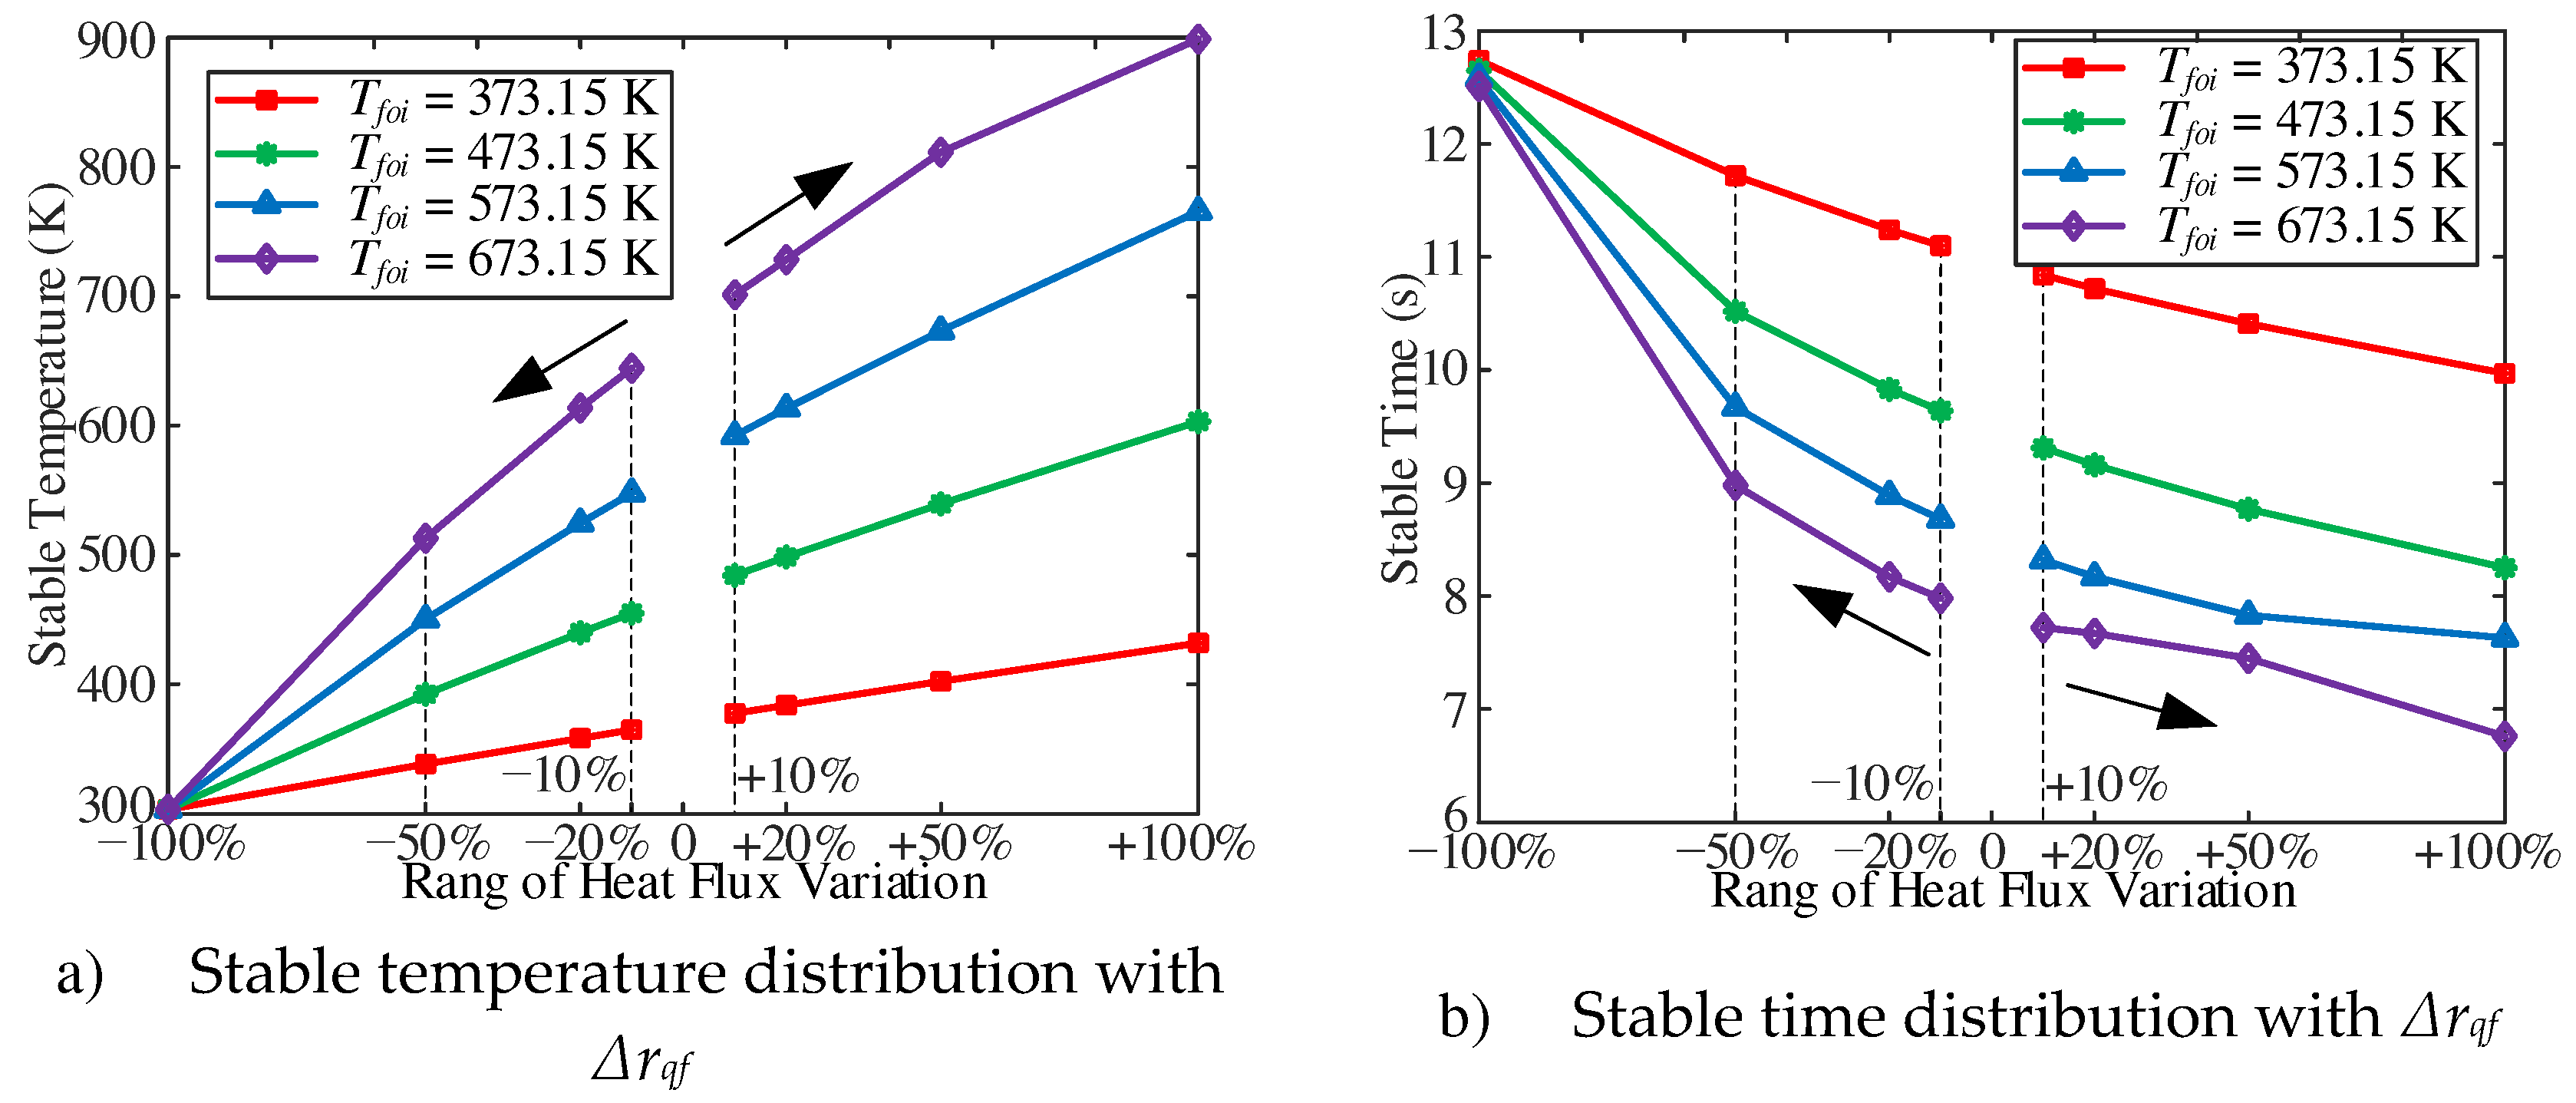
The stable fuel temperature and the stable time are shown in
Figure 13. With the decrease of heat flux, the lower the fuel temperature is, the longer the stable time is. Similarly, with the increase of inlet mass flow, the higher the stable fuel temperature, the shorter the stable time. As shown in
Figure 13b, with the same Δrqf, the higher the Tfoi, the shorter the stable time. In addition, with a Δrqf of −100%, that is, when the tube is no more heated, the stable time for fuel temperature to decrease to room temperature in the four cases is almost the same, which is about 12.5 s.
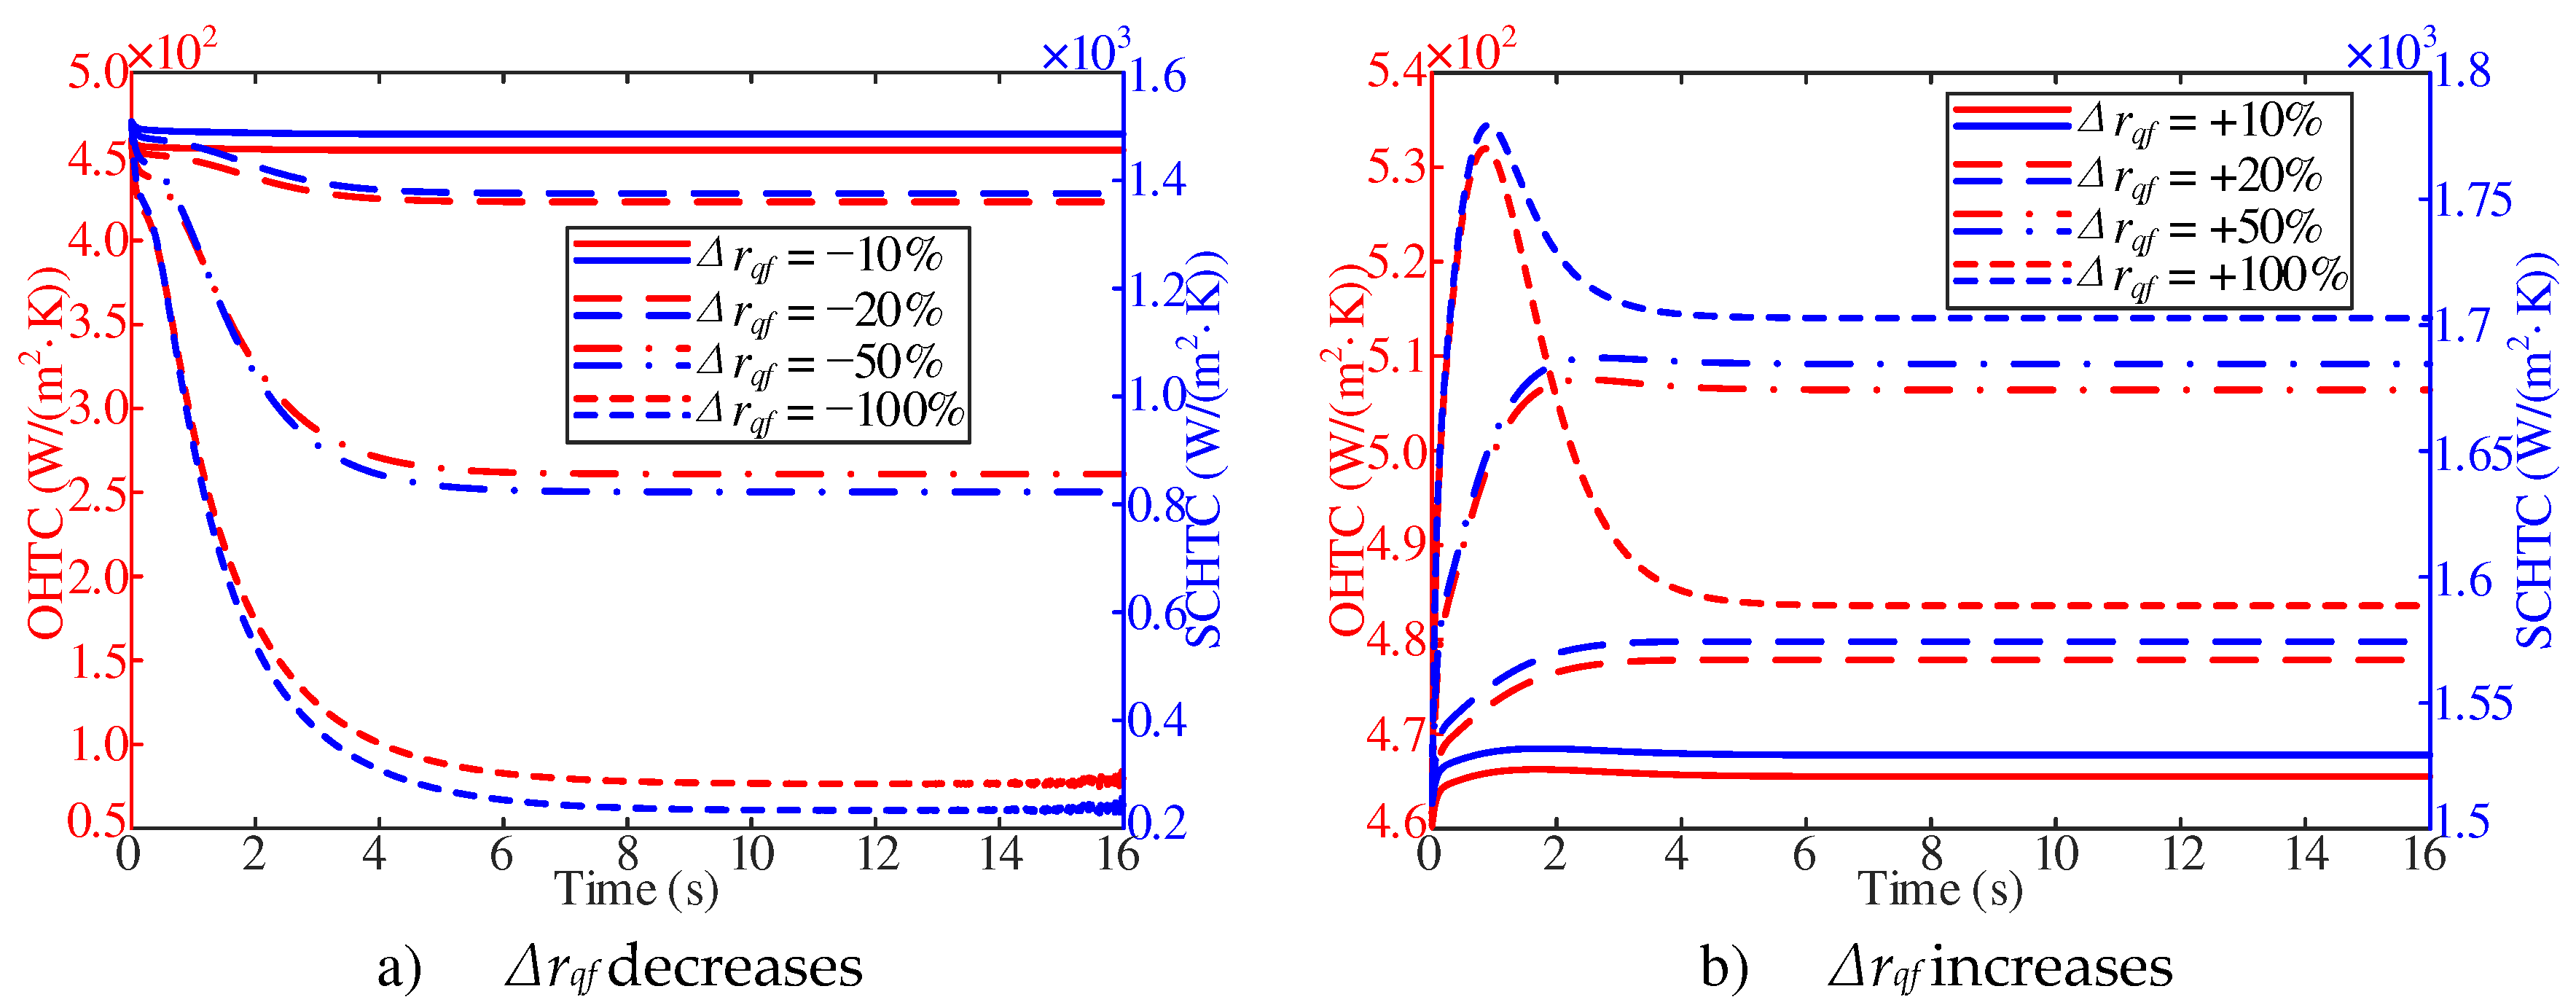
As shown in
Figure 14a, the overall heat transfer coefficient gradually decreases with the decrease of heat flux at the initial stage of response. With the decrease of heat flux, the stable value of the overall heat transfer coefficient decreases gradually. As shown in
Figure 14b, with a
Δrqf of +100%, the change of the overall heat transfer coefficient is no longer a first-order response, but increases first and then decreases with the increase of heat flux at the beginning of the response. In addition, with the increase of heat flux, the stable value of the overall heat transfer coefficient gradually increases. However, with a
Δrqf of +100%, the overall heat transfer coefficient is smaller than the one with a
Δrqf of +50%.
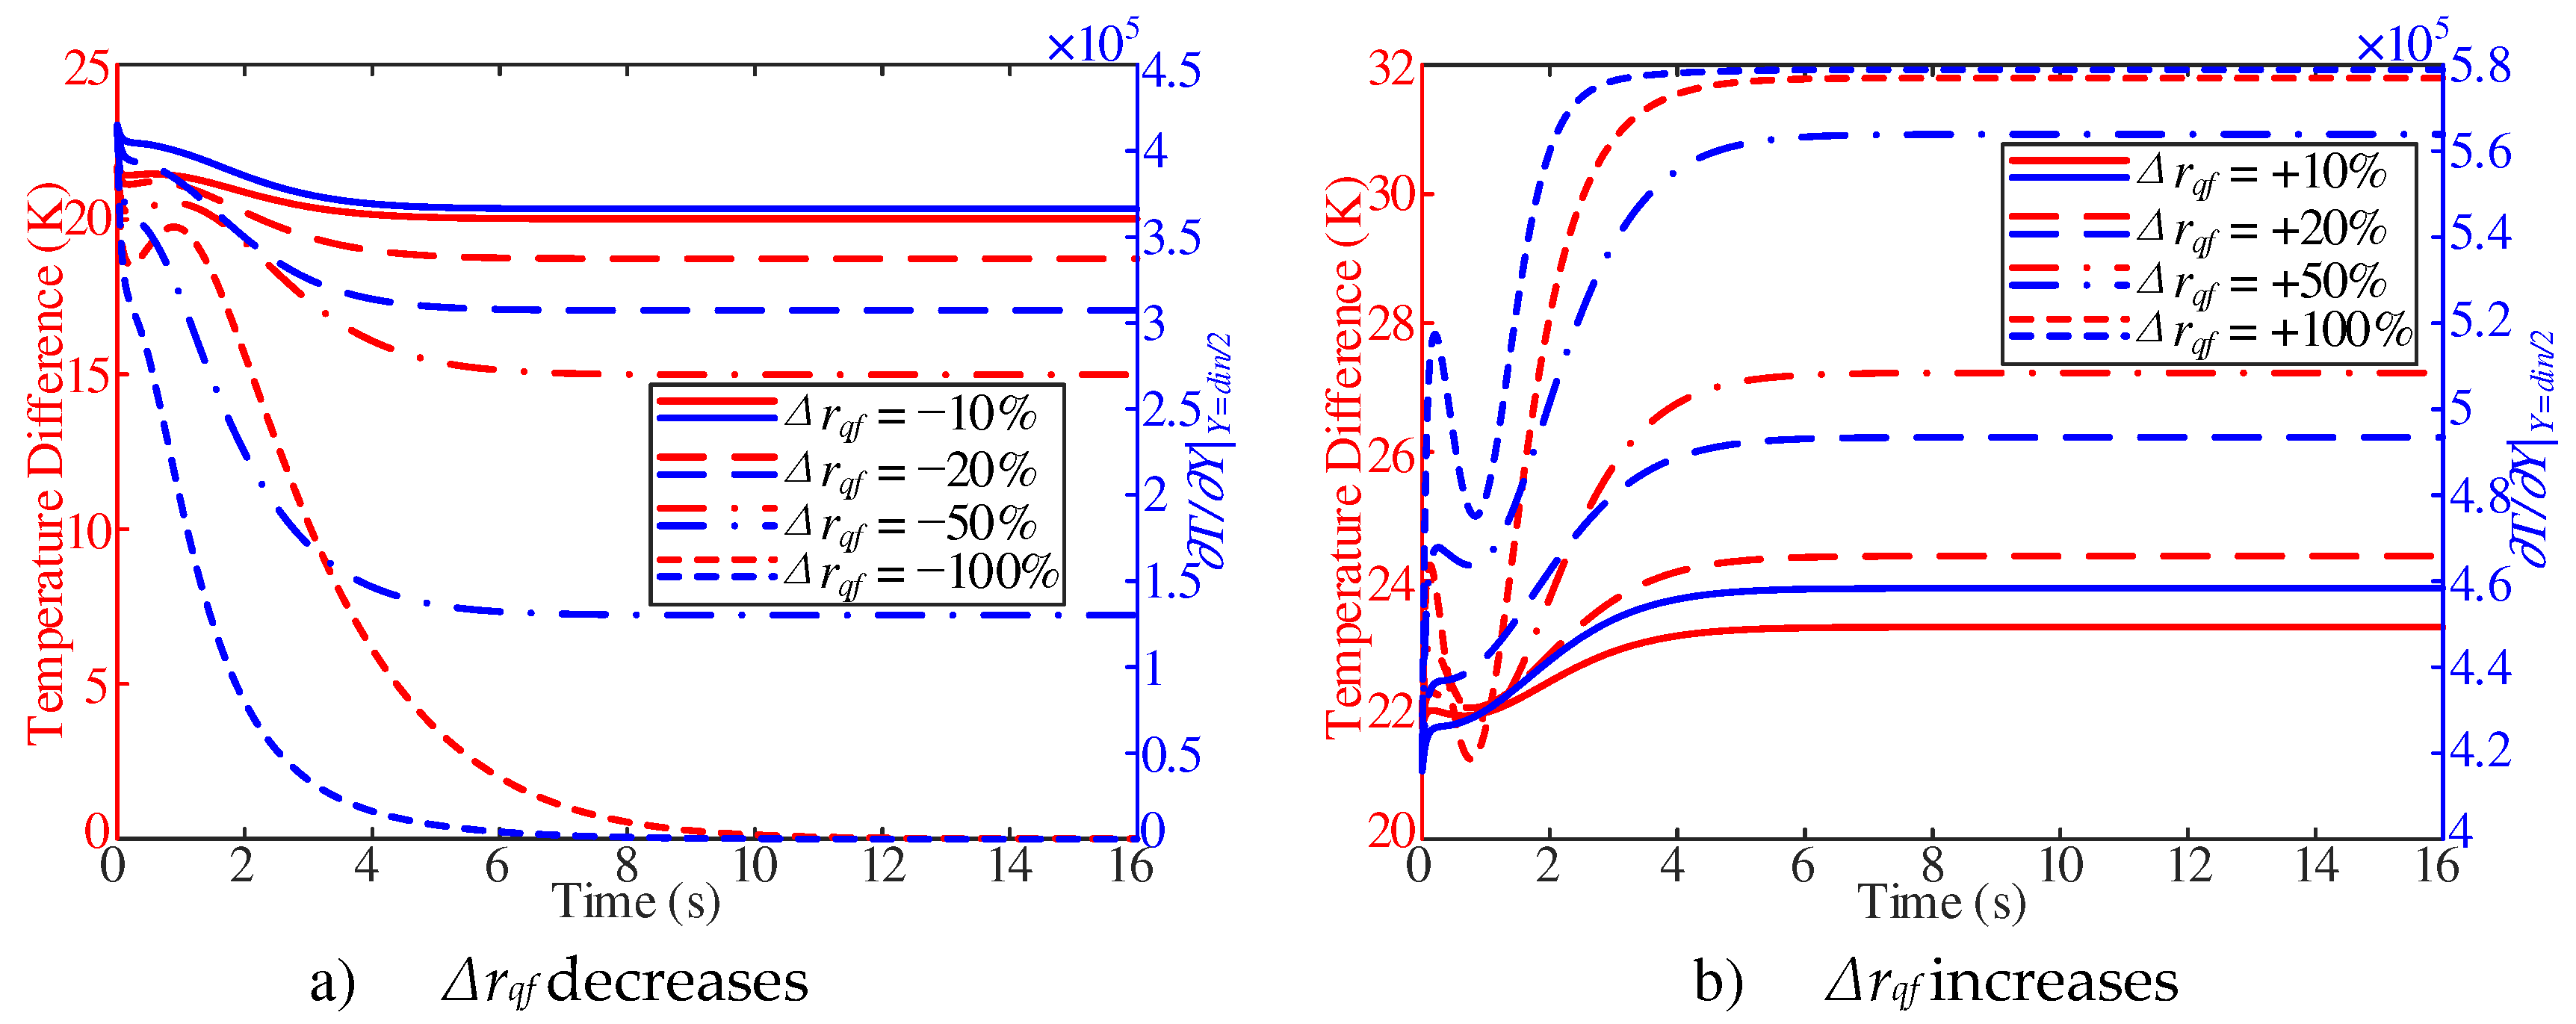
As shown in
Figure 15a, the difference between the inner wall temperature and the adjacent wall fuel temperature shows a trend of decrease first, then increase and after decrease at the beginning of the response. With the decrease of heat flux, the temperature difference shows a trend of decrease first, then increase and after decrease. On the contrary, with the increase of heat flux, the temperature difference increases first and then decreases and then increases, and the stable value increases (
Figure 15b).
Combined with
Figure 14a and
Figure 15a, the surface convective heat transfer coefficient shows a trend of decrease in the initial response. Such a trend is attribute to the decrease of the partial derivative of the adjacent wall fuel temperature, which is larger than the decrease of adjacent wall temperature difference. Combined with
Figure 14b and
Figure 15b, the surface convective heat transfer coefficient shows a trend of increase in the initial response. Such a trend is attribute to the increase of partial derivative of the adjacent wall fuel temperature, which is larger than the increase of adjacent wall temperature difference. However, with a
Δrqf of +50%, the surface convective heat transfer coefficient shows a trend of decrease in the first 1~4 s. Such a trend is attribute to the increase of adjacent wall temperature difference, which is larger than the increase of partial derivative of the adjacent wall fuel temperature.
3.3. Influence of working pressure
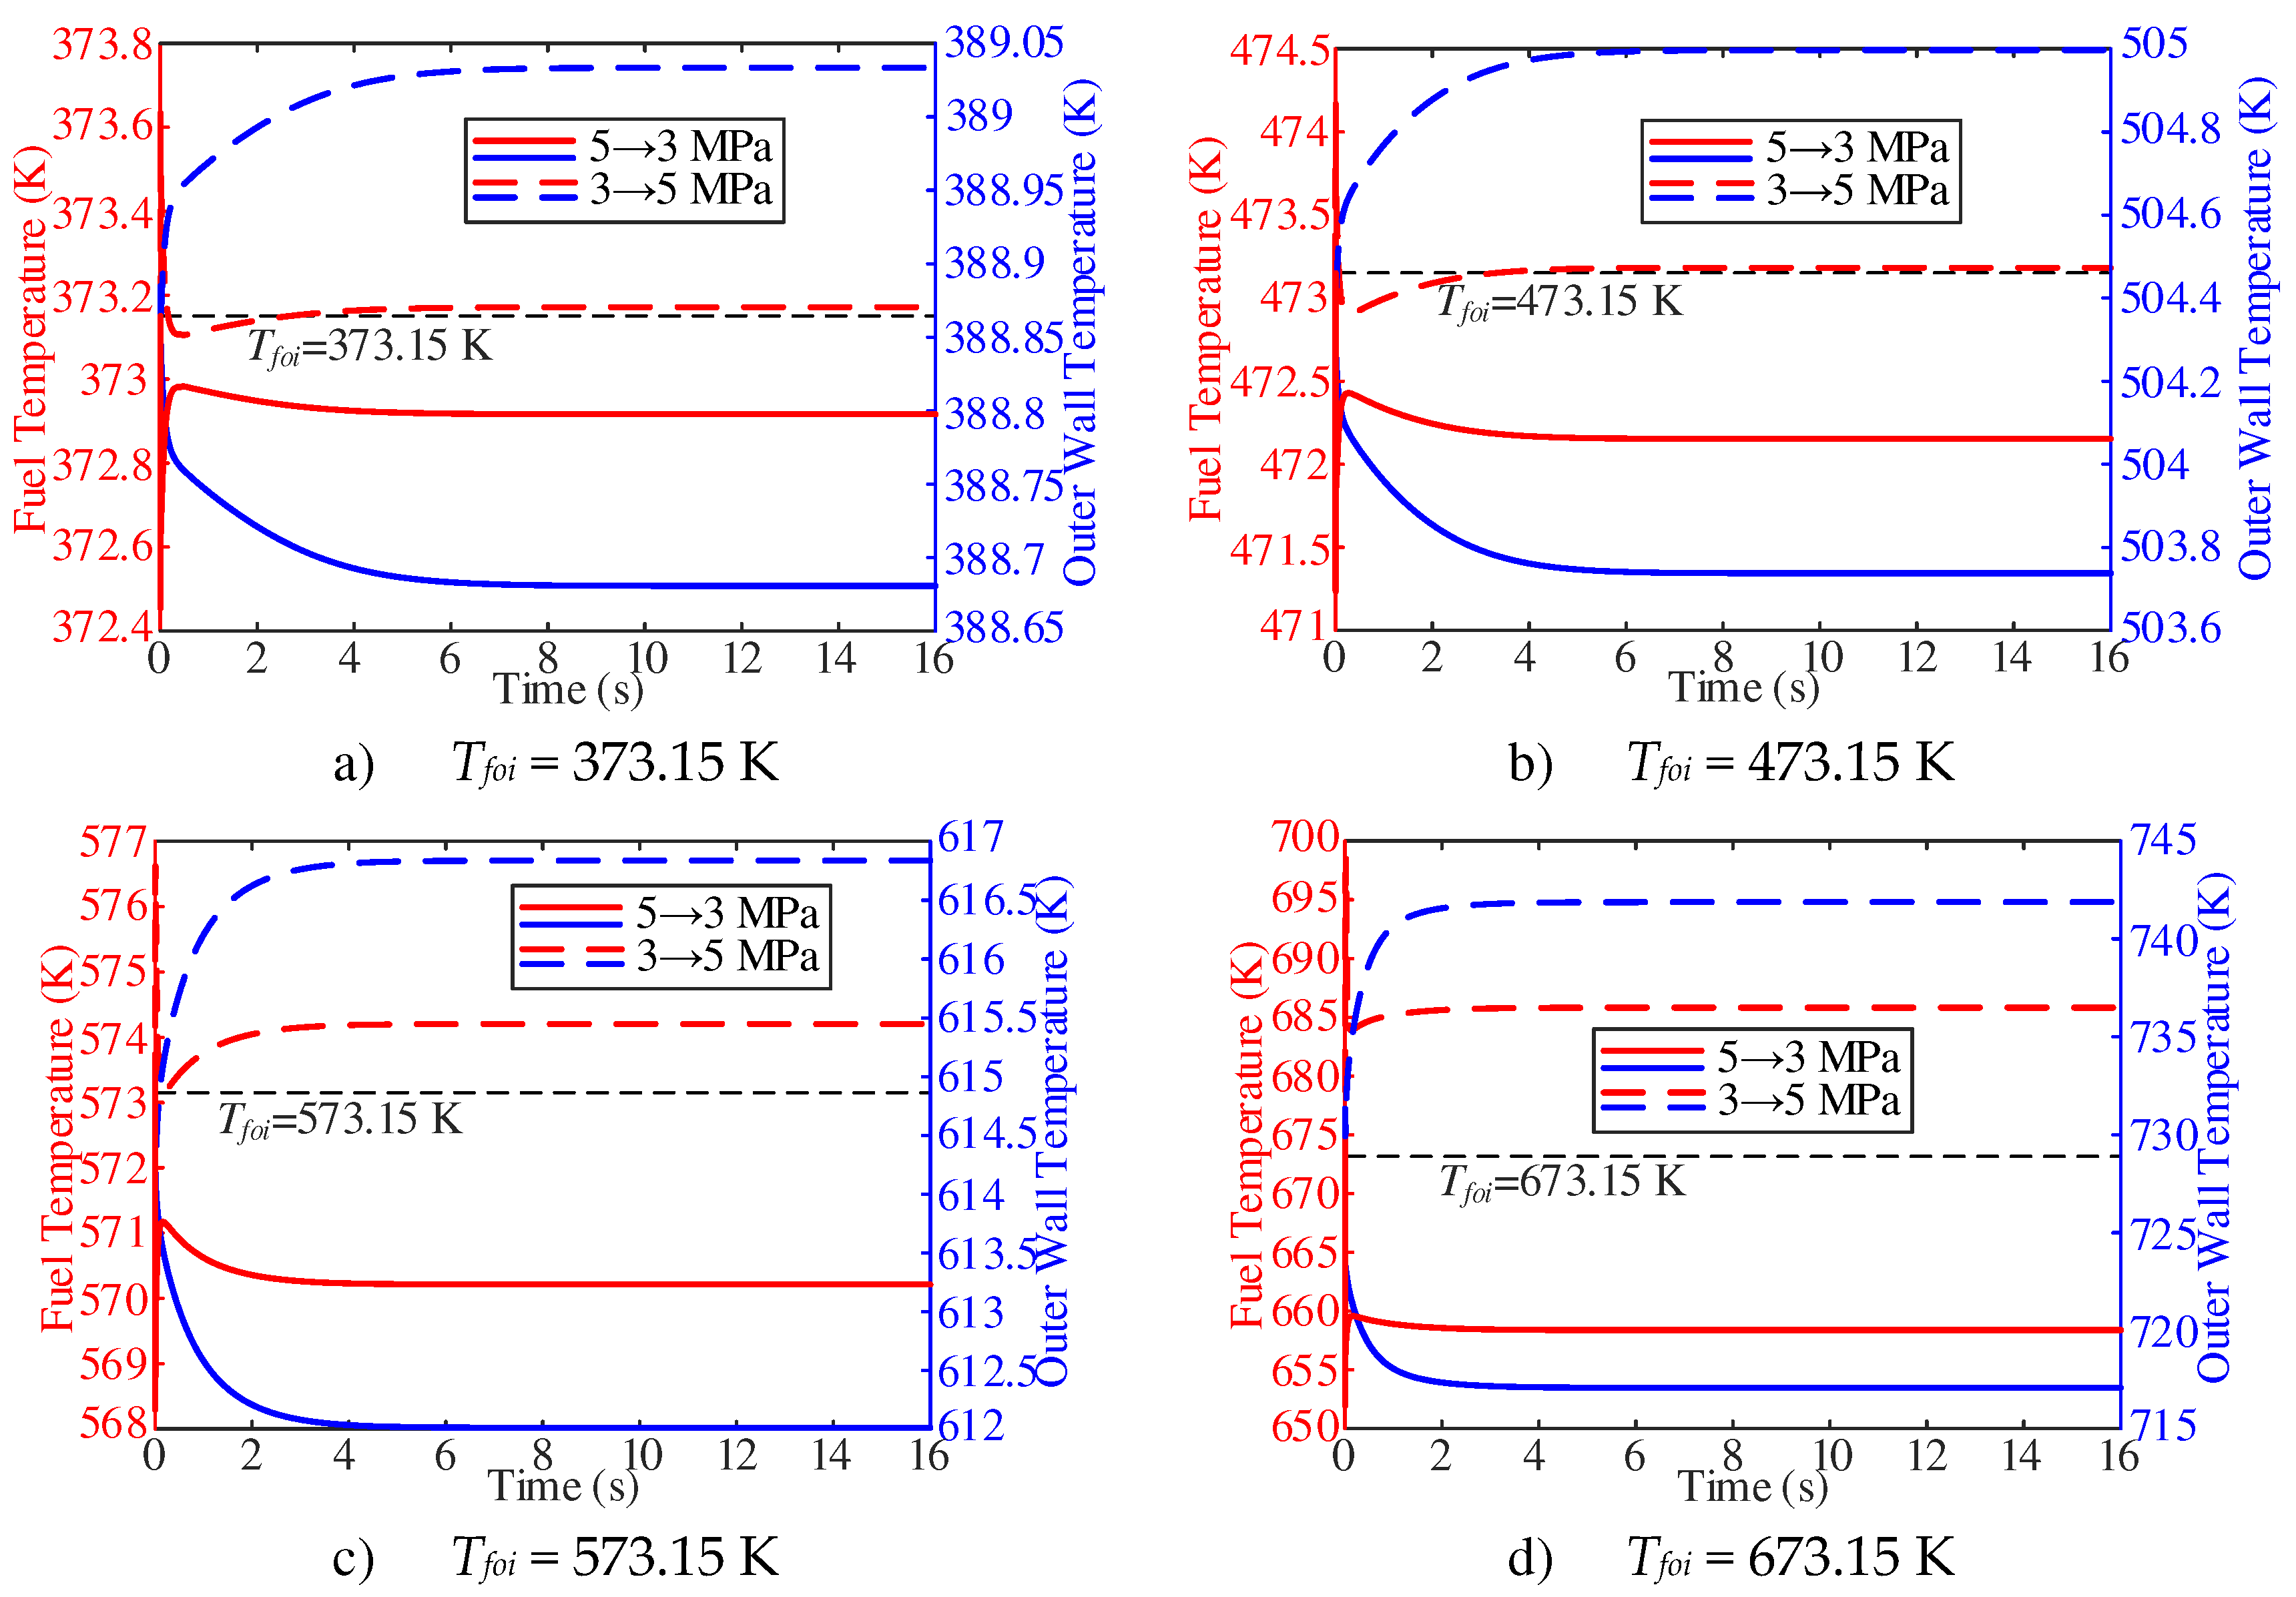
In this section, the fuel temperature dynamic characteristics of different Tfoi at the outlet of the heating section were studied when the working pressure was reduced from 5 MPa to 3 MPa and increased from 3 MPa to 5 MPa, respectively. As shown in
Figure 16, the fuel temperature is more sensitive with the change of working pressure than the wall temperature. With the decrease of working pressure, the fuel temperature first decreases sharply, then increases and then decreases slowly, while the wall temperature shows a decreasing trend. With the increase of working pressure, the fuel temperature first increases sharply, then decreases and then increases slowly, while the wall temperature shows an increasing trend. In addition, with the decrease of working pressure, the stable temperature increases compared with the initial time. With a Tfoi of 673.15 K, the stable temperature nearly increases 12 K compared with the initial time.
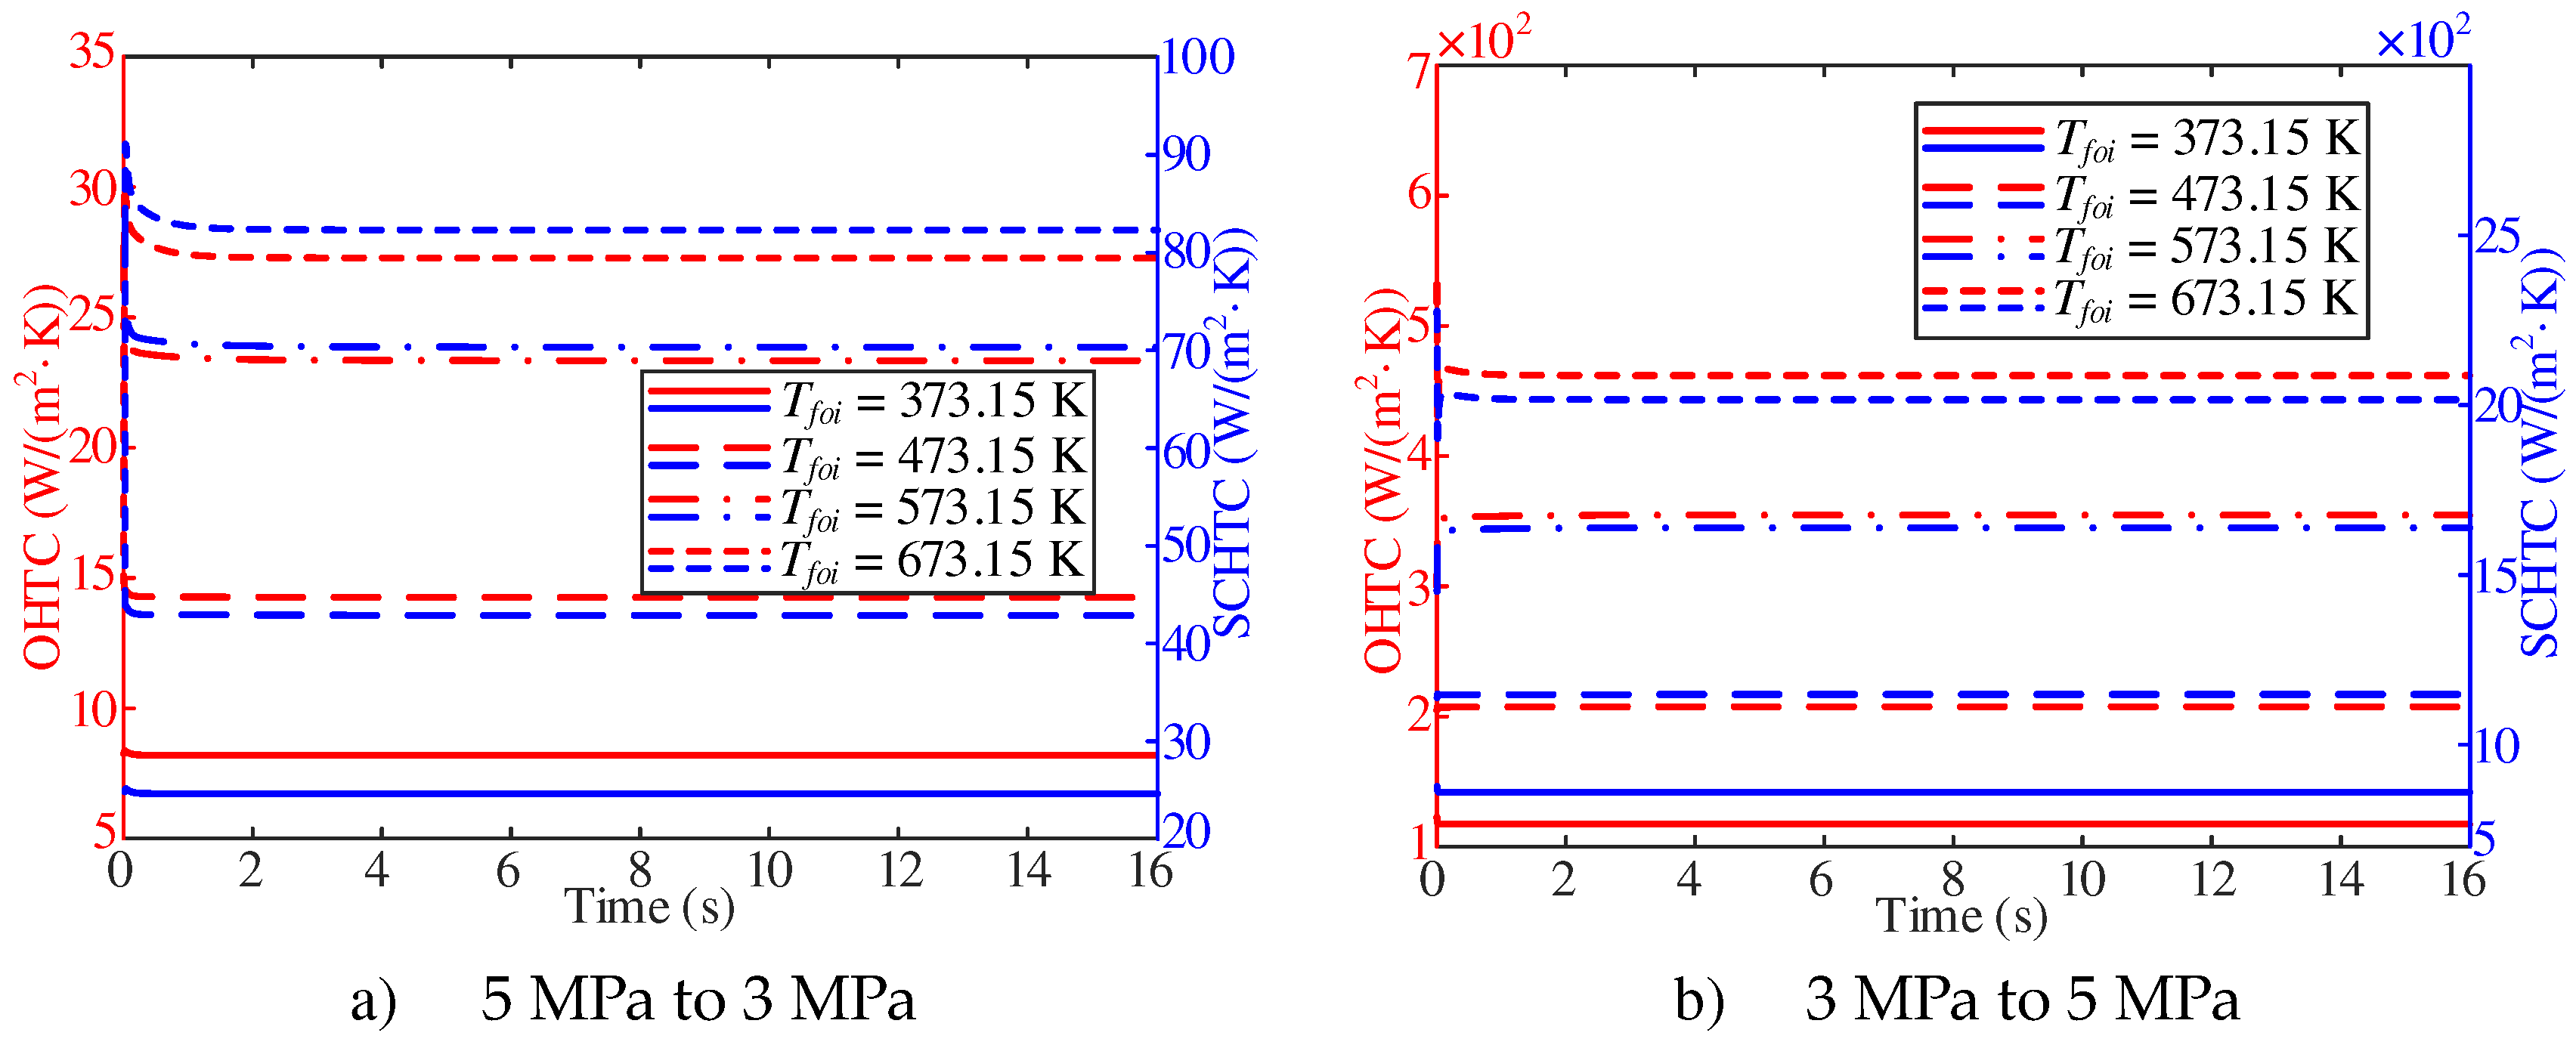
As shown in
Figure 17, the trend of the overall heat transfer coefficient changes little, and only fluctuates at the initial stage of response. With the decrease of pressure from 5 MPa to 3 MPa, the overall heat transfer coefficient increases with the increase of Tfoi. With
Tfoi of 373.15 K, 473.15 K and 573.15 K, the overall heat transfer coefficient shows a decreasing trend. In addition, with the increase of Tfoi, the decrease is more obvious. With T
foi of 673.15 K, the overall heat transfer coefficient shows a trend of increasing sharply and then decreasing sharply, and then approaching the stable value. With the increase of pressure from 3 MPa to 5 MPa, the stable value of the overall heat transfer coefficient increases with the increase of
Tfoi. With
Tfoi of 373.15 K and 473.15 K, the increase of pressure has little effect on the overall heat transfer coefficient. With
Tfoi of 573.15 K, the overall heat transfer coefficient shows an upward trend at the beginning of the response, and then approaches the stable value. With
Tfoi of 673.15 K, the overall heat transfer coefficient shows a trend of decreasing sharply first, then increasing sharply and then decreasing slowly.
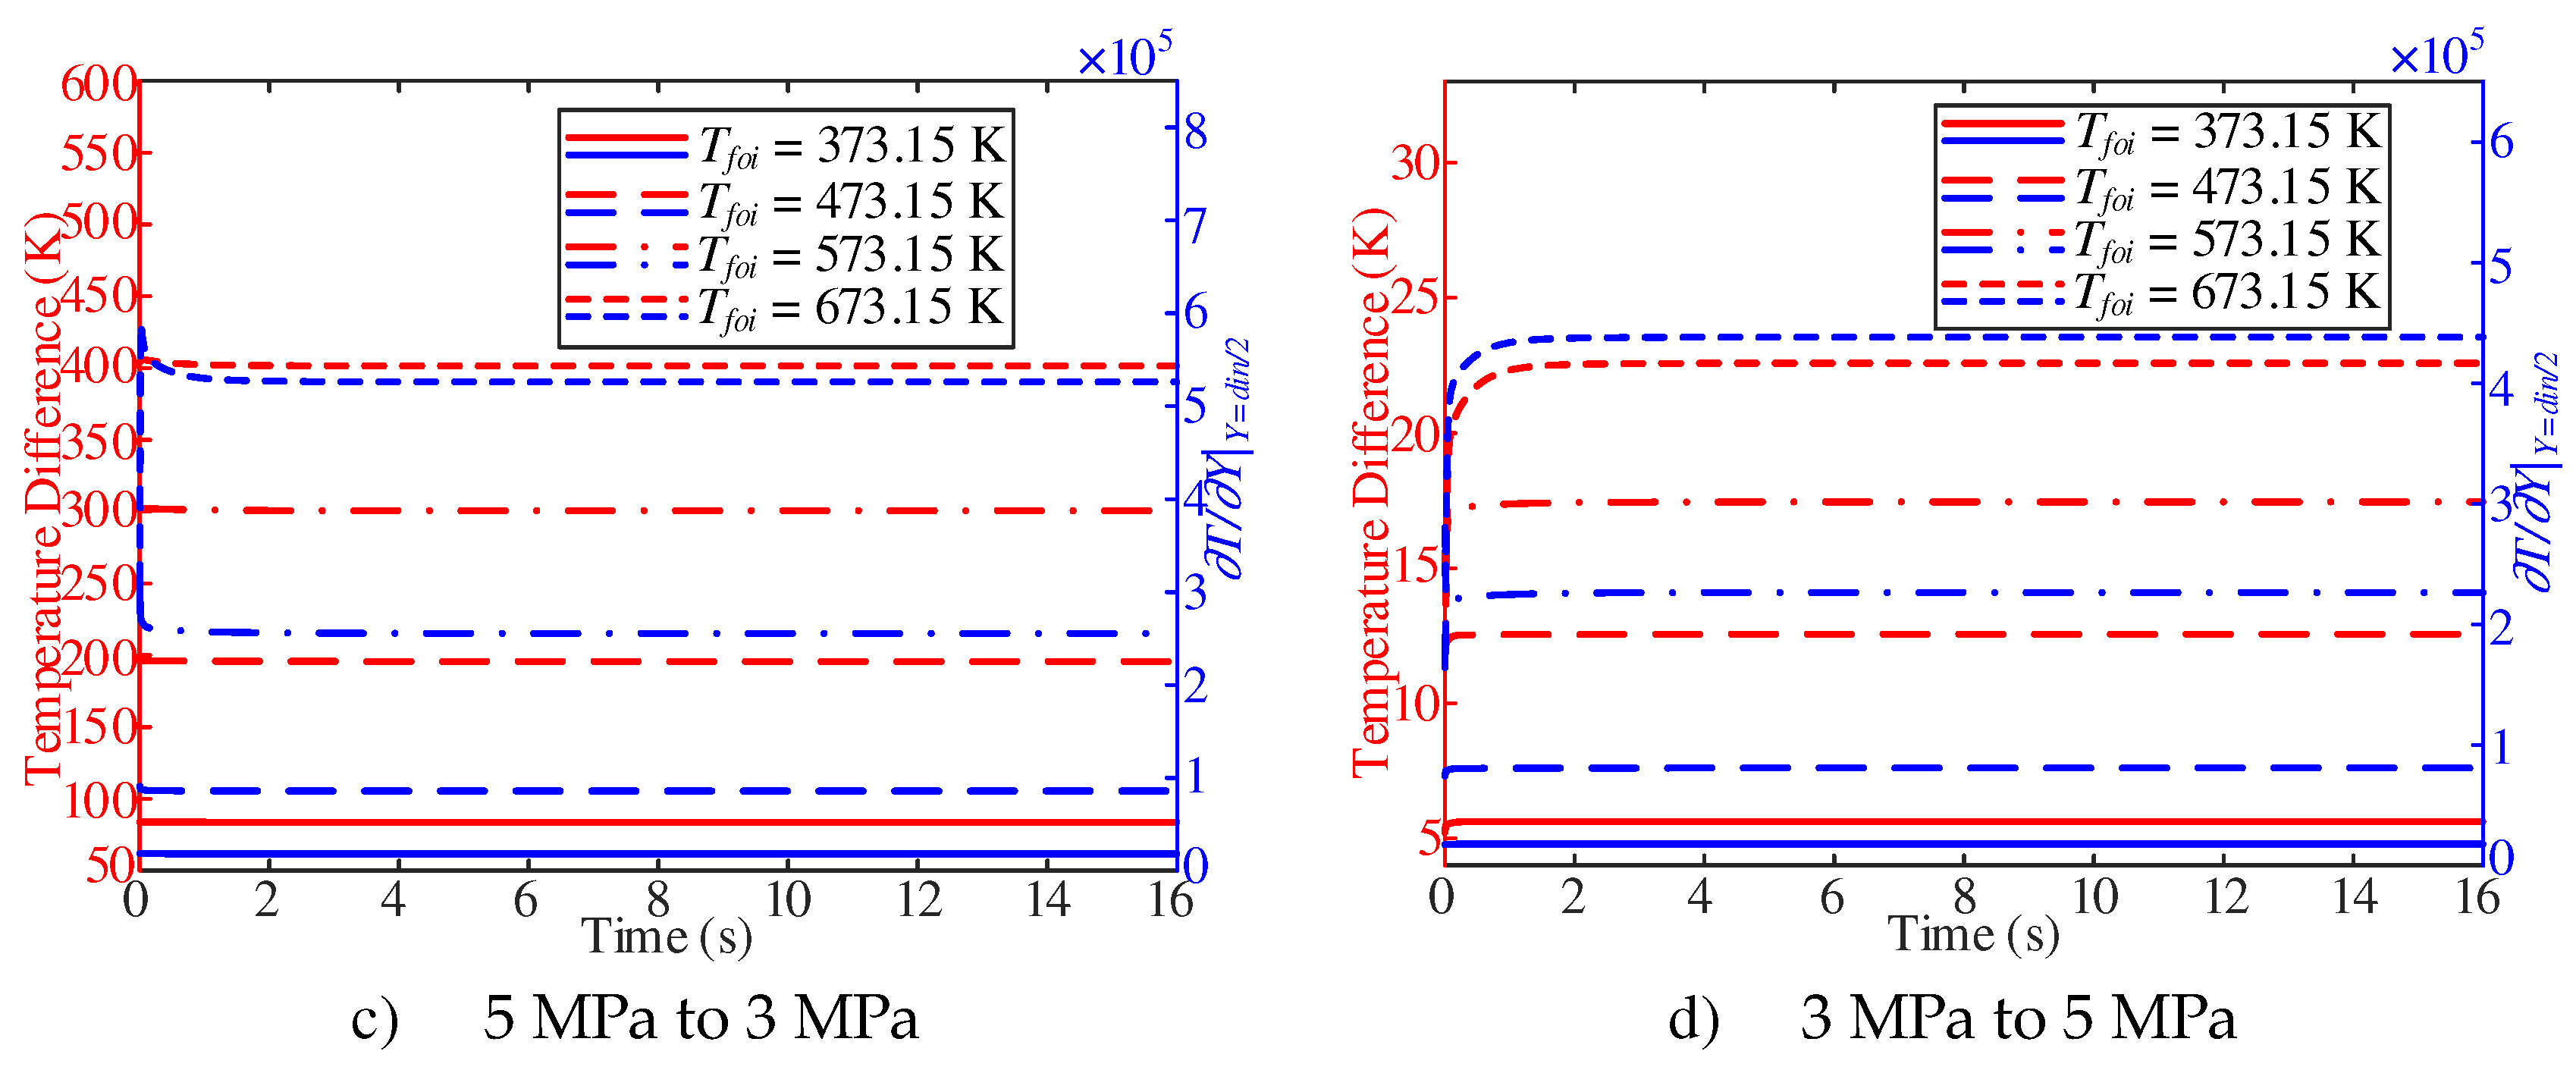
The difference between the inner wall temperature and the adjacent wall fuel temperature is shown in
Figure 18. With a pressure of 3 MPa, the temperature difference increases with the increase of
Tfoi. However, the temperature difference does not change significantly with the decrease of pressure during the whole response time. In addition, with
Tfoi of 473.15 K, the partial derivative of the adjacent wall fuel temperature shows a slow downward trend; with
Tfoi of 573.15 K, the trend is more obvious. With
Tfoi of 673.15 K, the partial derivative of the adjacent wall fuel temperature first increases sharply and then decreases slowly. With a pressure of 5 MPa, the temperature difference shows an increasing trend, and with the increase of Tfoi, the trend is more obvious. With
Tfoi of 373.15 K, the partial derivative of the adjacent wall fuel temperature does not change significantly with the increase of pressure, and then with the increase of Tfoi, the partial derivative of the adjacent wall fuel temperature shows an increasing trend.
Combined with
Figure 17 and
Figure 18, with the decrease of pressure, the obvious change of the surface convective heat transfer coefficient is caused by the partial derivative of the near-wall fuel temperature; when the pressure increases,
Tfoi 373.15 K, the surface convective heat transfer coefficient increases with the decrease of temperature difference. However, with the increase of Tfoi, the surface convective heat transfer coefficient shows an increasing trend in the initial response. Such a trend is attribute to the increase of partial derivative of the adjacent wall fuel temperature, which is larger than the increase of adjacent wall temperature difference.
4. Conclusions
To evaluate the transient flow and heat transfer characteristics of hydrocarbon fuel in the cooling channel, the modified overall heat transfer coefficient was used to characterize the dynamic process, and a two-dimensional calculation model was established. Subsequently, the transient flow and heat transfer characteristics of hydrocarbon fuels represented by n-decane were studied from the perspectives of variable inlet mass flow, variable heat flux and variable working pressure. The conclusions are as follows:
- (1)
The modified overall heat transfer coefficient can be used to characterize the transient flow and heat transfer characteristics of hydrocarbon fuels. The overall heat transfer coefficient is mainly affected by the surface convective heat transfer coefficient.
- (2)
In the process of variable inlet mass flow, the stable time for fuel temperature increases with the decrease of inlet mass flow. In addition, near the quasi-critical temperature zone, with the decrease of the inlet mass flow, the outlet velocity does not decrease but increases.
- (3)
In the process of variable heat flux, the stable time for fuel temperature increases with the decrease of heat flux. In addition, without heating, the stable time for the outlet fuel temperature to decrease to room temperature at different Tfoi is almost the same (about 12.5 s).
- (4)
In the process of variable working pressure, fuel temperature is more sensitive with the change of working pressure than wall temperature. In addition, with the change of pressure, the trend of the overall heat transfer coefficient has a little change, and only fluctuates at the initial stage of response.
Author Contributions
Conceptualization: G. L., and H. L..Methodology: H. L.. Validation: G. L., Q. X., and Y. F.. Formal analysis: G. L., and H. L. Data Curation Management: Q. X.. Writing - Original Draft: G. L., and Y. F.. Writing - Review & Editing: G. L., Q. X., H. L., and Y. F.. All authors have read and agreed to the published version of the manuscript.
Funding
This research was funded by GuangDong Basic and Applied Basic Research Foundation (2022A1515110605), Postgraduate Education Innovation Project of Guangdong Ocean University (202257) , Zhanjiang Marine Youth Talent Innovation Project (2021E05013) and Guangdong Provincial Colleges and Universities Engineering Technology Center(2023GCZX004).
Acknowledgments
The authors thank the reviewers for their valuable advice on this study. Furthermore, the best gratitude and wishes are dedicated to the staff and editors of Applied Sciences for handling the paper.
Conflicts of Interest
The authors declare no conflicts of interest. The funders had no role in the design of the study; in the collection, analyses, or interpretation of data; in the writing of the manuscript; or in the decision to publish the results.
Abbreviations
| Nomenclature: |
| A |
preexponential factor, s−1
|
|
bulk temperature, K |
| c |
specific heat capacity, J/(kg·K) |
t |
time, s |
| C |
diffusion term |
u |
species diffusion rate, m/s |
| d |
diameter, mm |
U |
velocity vector, m/s |
| e |
specific internal energy, J/kg |
V |
critical volume, cm3/mol |
| E |
activation energy, kJ/mol |
X |
X-axis, mm |
| h |
surface convective heat transfer coefficient, W/(m2·K) |
Y |
Y-axis, mmspecies mass fraction |
| I |
turbulent intensity, % |
|
|
| i |
number of fluid radial stratification |
Greek symbols |
|
| k |
turbulent kinetic energy, m2/s2overall heat coefficient, W/(m2·K) |
α, β, β*, δ |
parameters in k – ω model |
| l |
micro-channel length, m |
δ |
relative error, % |
| m |
inlet fuel mass flow, g/s |
Δr |
rate of change, % |
| Mw |
molar mass, kg/mol |
|
internal heat source, W/m3
|
| n |
number of solid domain |
λ |
thermal conductivity, W/(m·K) |
| Nu |
Nusselt number |
ω |
specific dissipation rate, 1/schemical reaction rate, mol/(m3·s) |
| OHTC |
overall heat coefficient, W/(m2·K) |
μ |
dynamic viscosity at high pressure, μP |
| p |
pressure, Pa |
μ* |
dynamic viscosity at low pressure, μP |
| P |
production term |
∇ |
Hamiltonian |
| Pr |
Prandtl number |
ρ |
density, kg/m3
|
| q |
heat flux |
τ |
stress, Pa |
| Re |
Reynolds number |
|
|
| Ru |
universal gas constant, J/(mol·K) |
Subscripts |
|
| S |
source term |
adj |
adjacent |
| SCHTC |
surface convective heat transfer coefficient, W/(m2·K) |
c |
critical |
| T |
temperature, K |
cal |
calculated |
| che |
chemical |
k |
turbulent kinetic energy |
| E |
energy |
l |
laminar |
| eff |
effective |
M |
momentum |
| exp |
experimental |
m |
mass flow |
| f |
fluid |
out |
outer |
| foi |
initial time outlet fluid |
p |
pressure |
| i |
number of fluid radial stratificationspecies i
|
qf |
heat flux |
| in |
inner |
t |
turbulent |
| j |
number of fluid axis stratification |
w |
wall |
References
- H. Taguchi, H. Kobayashi, T. Kojima, et al., Research on hypersonic aircraft using pre-cooled turbojet engines, Acta Astronautica 73 (2012) 164-172.
- M. Davis, J. White, Flight-test-determined aerodynamic force and moment characteristics of the X-43A at Mach 7.0, AIAA Paper (2006-8028; 06). 20 November.
- S. Zhang, X. Li, J. Zuo, et al., Research progress on active thermal protection for hypersonic vehicles, Progress in Aerospace Sciences 119 (2020), 100646.
- W. Landsberg, T. Vanyai, T. Mcintyre, et al., Experimental scramjet combustion models of hydrocarbon mixtures at Mach 8 flight conditions, AIAA Journal 58 (12) (2020) 5117-5122.
- X. Li, Y. Zhang, S. Zhang, et al., Effects of pyrolysis on heat transfer enhancement for hydrocarbon fuel flow in unilateral heated channels with dimples, Applied Thermal Engineering 218 (2022), 119301.
- L. Marshall, C. Bahm, G. Corpening, et al., Overview with results and lessons learned of the X-43A Mach 10 flight, AIAA Paper (2005–3336;). 05. 20 May.
- J. Hank, J. Murphy, R. Mutzman, The X-51A scramjet engine flight demonstration program, AIAA Paper (2008–2540;). April 2008.
- Y.u. Feng, J. Cao, X. Li, et al., Flow and heat transfer characteristics of supercritical hydrocarbon fuel in mini channels with dimples, Journal of Heat Transfer, 139 (12) (2017) 122401.
- Y. Wang, X. Hua, H. Meng, Numerical studies of supercritical turbulent convective heat transfer of cryogenic-propellant methane, Journal of Thermophysics and Heat Transfer 24 (3) (2010) 490-500.
- Y. Jiang, S. Zhang, Y.u. Feng, et al., A control method for flow rate distribution of cracked hydrocarbon fuel in parallel channels, Applied Thermal Engineering 105 (7) (2016) 531-536.
- Y.u. Feng, S. Zhang, K. Wu, et al., Numerical investigation of distribution of reaction rate during convective heat transfer with endothermic chemical reaction, International Communications in Heat and Mass Transfer 83 (4) (2017) 1-7.
- F. Sun, Y. Li, B. Sunden, et al., The behavior of turbulent heat transfer deterioration in supercritical hydrocarbon fuel flow considering thermal resistance distribution, International Journal of Thermal Sciences 141 (2019) 19-32.
- Y. Fu, T. Zhi, G. Xu, et al., Experimental study of flow distribution for aviation kerosene in parallel helical tubes under supercritical pressure, Applied Thermal Engineering 90 (12) (2015) 102-109.
- Y. Zhu, R. Zhao, Y. Wang, et al., Investigation of flow and heat transfer instabilities and oscillation inhibition of n-decane at supercritical pressure in vertical pipe, Applied Thermal Engineering 161 (7) (2019) 114143.
- H. Li, J. Qin, Y. Jiang, et al., Experimental study on the thermodynamic characteristics of the high temperature hydrocarbon fuel in the cooling channel of the hypersonic vehicle, Acta astronautica 155 (2) (2019) 63-79.
- X. Cheng, S. Feng, Q. Bi, Surface coke deposition influences on flow and heat transfer of hydrocarbon fuel in circular tubes with twisted-tape inserts, International Communications in Heat and Mass Transfer 122 (2021) 105125.
- Z. Liu, Q. Bi, Y. Cuo, Z. Yang, Convective heat transfer and pressure drop characteristics of near-critical-pressure hydrocarbon fuel in a minichannel, Applied Thermal Engineering 51 (2013) 1047-1054.
- H. Deng, K. Zhu, G. Xu, et al., Heat transfer characteristics of RP-3 kerosene at supercritical pressure in a vertical circular tube, Journal of Enhanced Heat Transfer 19 (5) (2012) 409-421.
- D. Huang, B. Ruan, X. Wu, et al., Experimental study on heat transfer of aviation kerosene in a vertical upward tube at supercritical pressures, Chinse Journal of Chemical Engineering 23 (2) (2015) 425-434.
- Y. Fu, Experimental study on heat transfer characteristics to supercritical hydrocarbon fuel in a horizontal micro-tube, ASME Turbo Expo 2014: Turbine Technical Conference and Exposition (2014) 16-20.
- L. Zhang, R. Zhang, S. Xiao, et al., Experimental investigation on heat transfer correlations of n-decane under supercritical pressure, International Journal of Heat and Mass Transfer 64 (9) (2013) 393-400.
- H. Li, G. Lin, Q. Xu, et al., Overall heat transfer coefficient evaluation method for uncracked hydrocarbon fuel in a regeneratively-cooled heat exchanger of a scramjet, Applied Sciences 12 (13) (2022) 6590.
- S. Jiao, S. Li, H. Pu, et al., Investigation of pressure effect on thermal cracking of n-decane at supercritical pressures, Energy Fuels 32 (3) (2018) 4040-4048.
- Y.u. Feng, S. Liu, J. Qin, et al., Numerical study on the influence of turbulence on the pyrolysis of hydrocarbon fuel in mini-channel, International Journal of Heat and Mass Transfer 119 (2018) 769-776.
- T. Gatski, C. Rumsey, Linear and nonlinear eddy viscosity models, Cambridge University Press, London, 2002.
- S. K. Kim, H. S. Choi, Y. Kim, Thermo-physical modeling based on a generalized cubic equation of state for kerosene/LOx rocket combustion, Combustion and Flame 159 (3) (2012) 1351-1365.
- E. Bruce Poling, J.M. Prausnitz, O.J. Paul, The properties of gases and liquids, McGraw-Hill, New York, 2001.
Figure 1.
Thermal Properties Variation Ratio with Temperature of n-Decane at 3MPa.
Figure 1.
Thermal Properties Variation Ratio with Temperature of n-Decane at 3MPa.
Figure 2.
Thermal Properties Variation Ratio with Temperature of n-Decane at 3MPa.
Figure 2.
Thermal Properties Variation Ratio with Temperature of n-Decane at 3MPa.
Figure 3.
Two-Dimensional Structure Diagram.
Figure 3.
Two-Dimensional Structure Diagram.
Figure 4.
Iterative Solution Process for Temperature.
Figure 4.
Iterative Solution Process for Temperature.
Figure 5.
Grid independence verification.
Figure 5.
Grid independence verification.
Figure 6.
Experimental Platform for n-Decane Heating.
Figure 6.
Experimental Platform for n-Decane Heating.
Figure 7.
Comparison of Calculated and Experimental Wall Temperature.
Figure 7.
Comparison of Calculated and Experimental Wall Temperature.
Figure 8.
Dynamic process of fuel and wall temperature at X = 900 mm.
Figure 8.
Dynamic process of fuel and wall temperature at X = 900 mm.
Figure 9.
Stable parameters distribution with Δrm.
Figure 9.
Stable parameters distribution with Δrm.
Figure 10.
Dynamic process of OHTC and SCHTC at X = 900 mm.
Figure 10.
Dynamic process of OHTC and SCHTC at X = 900 mm.
Figure 11.
Dynamic process of adjacent temperature difference.
Figure 11.
Dynamic process of adjacent temperature difference.
Figure 12.
Dynamic process of fuel and wall temperature.
Figure 12.
Dynamic process of fuel and wall temperature.
Figure 13.
Stable parameters distribution with Δrqf.
Figure 13.
Stable parameters distribution with Δrqf.
Figure 14.
Change of OHTC and SCHTC at X = 900 mm with Δrqf changes.
Figure 14.
Change of OHTC and SCHTC at X = 900 mm with Δrqf changes.
Figure 15.
Change of temperature difference and the partial derivative of fuel temperature at X = 900 mm with Δrqf changes.
Figure 15.
Change of temperature difference and the partial derivative of fuel temperature at X = 900 mm with Δrqf changes.
Figure 16.
Dynamic process of fuel and wall temperature at X = 900 mm.
Figure 16.
Dynamic process of fuel and wall temperature at X = 900 mm.
Figure 17.
Change of OHTC and SCHTC at X = 900 mm with working pressure changes.
Figure 17.
Change of OHTC and SCHTC at X = 900 mm with working pressure changes.
Figure 18.
Dynamic process of inner wall temperature and the adjacent wall fuel temperature difference and the partial derivative of fuel temperature.
Figure 18.
Dynamic process of inner wall temperature and the adjacent wall fuel temperature difference and the partial derivative of fuel temperature.
Table 1.
Constant pressure specific heat and thermal conductivity of GH3128 change with temperature.
Table 1.
Constant pressure specific heat and thermal conductivity of GH3128 change with temperature.
|
T (K) |
273.15 |
473.15 |
573.15 |
673.15 |
773.15 |
873.15 |
973.15 |
1073.15 |
|
cpw (J/(kg·K)) |
113.91 |
120.21 |
127.47 |
137.36 |
142.20 |
152.84 |
154.48 |
159.54 |
|
λw (W/(m·K)) |
11.30 |
12.56 |
14.24 |
15.49 |
16.75 |
18.42 |
19.68 |
21.35 |
Table 2.
Required heat flux for different outlet fuel temperatures.
Table 2.
Required heat flux for different outlet fuel temperatures.
| Working pressure (MPa) |
Outlet fuel temperature (K) |
Required heat flux (W/m2) |
| 5 |
373.15 |
20855 |
| 473.15 |
55735 |
| 573.15 |
96793 |
| 673.15 |
145355 |
| 3 |
373.15 |
20895 |
| 473.15 |
55930 |
| 573.15 |
97695 |
| 673.15 |
152760 |
Table 3.
Type and Parameter of Equipment.
Table 3.
Type and Parameter of Equipment.
| Equipment |
Type |
Accuracy |
| Pump |
SP1020 Type High Pressure Double Plunger Pump |
≤ ±1% |
| Heating Power |
DC Power |
0.5% |
| Temperature Sensor |
K Type Thermocouple |
0.4% |
| Pressure Difference Sensor |
ROSEMOUNT 3051CD Type Differential Pressure Transmitter |
0.25% |
| Mass Flow Meter |
Micro Motion Elite Type Coriolis CMF010 Mass Flow Meter |
0.1% |
| Data Acquisition System |
NI cRIO-9205 |
≤ ± 0.1‰ |
| |
Temperature: NI 9205 |
≤ ± 0.12‰ |
| |
Pressure, Pressure Difference: NI 9264 |
≤ ± 0.15‰ |
Table 4.
Measurement Error Expressions.
Table 4.
Measurement Error Expressions.
| Measurement |
Measurement Error Expression |
Error Value |
| Mass flow |
|
±1.01% |
| Temperature |
|
±0.2% |
| Pressure |
|
±0.125% |
| Heat Flux |
|
±0.32% |
|
Disclaimer/Publisher’s Note: The statements, opinions and data contained in all publications are solely those of the individual author(s) and contributor(s) and not of MDPI and/or the editor(s). MDPI and/or the editor(s) disclaim responsibility for any injury to people or property resulting from any ideas, methods, instructions or products referred to in the content. |
© 2024 by the authors. Licensee MDPI, Basel, Switzerland. This article is an open access article distributed under the terms and conditions of the Creative Commons Attribution (CC BY) license (http://creativecommons.org/licenses/by/4.0/).
