Preprint
Article

Theoretical and Numerical Investigation of Mechanical Properties of Auxetic S-structure under Transverse Load

Altmetrics

Downloads

239

Views

140

Comments

0

This version is not peer-reviewed

Submitted:

20 June 2024

Posted:

21 June 2024

You are already at the latest version

Alerts
Abstract
A significantly reduced stress concentration effect and a stable deformation behavior are exhibited by the arc-like S-shaped auxetic structure. Analytical works beyond the bar and hinge method to capture structural effects, such as bending, shearing, etc., in the S-structure are scarce in the literature. The deformation pattern of the S-structure is dominated by bending and shearing within the linear elastic region. In this work, Timoshenko beam theory is used to derive closed-form expressions for overall elastic modulus and Poisson’s ratio. This agrees well with the results of finite element simulations. An adjusted R-square value of over 0.99 and almost 0.82 is obtained for elastic modulus and Poisson’s ratio, respectively. From parametric studies, it’s established that under quasi-static transverse load, strut thickness and the angle `α’ are the most important parameters for controlling elastic modulus, specific energy absorption, negative Poisson’s ratio (NPR) effect, and relative density of the entire auxetic structure. Also, it’s found that energy absorption and elastic modulus increase together. Interestingly, the elastic modulus of the structure under transverse load lies in the range from 3 MPa to 250 MPa, which means this structure is compliant enough and can be used in cushioning, packaging, soft robotics applications, etc.
Keywords: 
Subject: Engineering  -   Mechanical Engineering

1. Introduction

Auxetics are meta-materials that are engineered to exhibit a negative Poisson’s ratio effect. These materials show higher stiffness and energy absorption capacity [1,2,3], indentation and impact resistance [4], light-weighting [5], vibration isolation and damping applications [3], etc. In contrast to conventional materials, in the case of auxetics, if it is compressed transversely, it also contracts in the lateral direction. The same behavior is observed under impact load, where material moves toward the impact zone, and as a result, more mass resists the motion of the impactor, resulting in larger impact energy absorption characteristics of auxetics compared to its conventional counterparts. However, auxetics don’t offer much advantage under larger strain rates, as shown in the literature [6]. Auxetics can be used in bicycle handlebar grip [7], aircraft brackets and structures, static and dynamic aircraft and spacecraft engine components, thermal devices, etc., as discussed in the literature [8]. These can also be used in lightweight applications, energy absorption applications, etc., as discussed in the literature [2]. Furthermore, the potential application of auxetics in medical devices has been extensively discussed in the literature [9,10]. However, the industrial use of auxetics is very limited, and products or components using these advanced materials are quite rare. For this, further analysis of these materials is required.
The mechanical response of auxetic meta-materials under both static and dynamic load are explored analytically, numerically, and experimentally by various researchers in the literature [11,12,13]. The overall mechanical properties of auxetics are majorly dependent on the structural architecture, just like the material’s mechanical behavior depends largely on its micro-structures. Various new geometries of auxetics have been designed and explored in the literature [14,15,16]. Hierarchical auxetics are explored in the literature [17,18]. The problem with classical re-entrant structures is that they are deformed by shrinking very rapidly, which can be detrimental. This problem can be solved by modified re-entrant structures, which are more rigid than the classical counterpart, as discussed in [19]. In this literature, the in-plane elastic modulus and Poisson’s ratio are investigated analytically and numerically, which, in turn, is validated by experimental results. Other novel auxetic structures are explored by various researchers, such as, in the literature [20], a novel design of auxetic structures with enhanced energy absorption capacity is explored using mathematical, numerical, and experimental methods under quasi-static and dynamic loading conditions. Furthermore, a comparative study is conducted in the literature [21] on various geometries of auxetics and potentially auxetic meta-materials using the finite element method. Again, various hybrid novel meta-materials are explored in works such as [22,23]. A novel, efficient design method (similar to TPMS design) for shell-based Mechanical Metamaterials is explored in the literature [1,24]. Further, a novel auxetic metamaterial with defined Poisson’s ratio was developed theoretically and tested numerically and experimentally in the literature [25]. The numerical and mathematical analysis of the tubular anti-tetrachiral structure under dynamic load has been conducted and presented in the literature [26,27,28,29,30]. Again, experimental studies on crushing behavior and plateau stress of hexagonal honeycomb under quasi-static and dynamic loading conditions are discussed in the literature [31]. However, the utilization of auxetics in static components requires appropriate static analysis. This has been conducted using various methods, such as the utilization of continuum mechanics, Tension-field theory, homogenization, and utilization of Euler-Bernoulli or Timoshenko beams, along with Castigliano’s second theorem as reported in the literature [32,33,34,35,36]. The analysis using Timoshenko beams, along with Castigliano’s second theorem, is quite rare in the literature and is explored in this work. This work is particularly focused on predicting elastic modulus and Poisson’s ratio within the linear elastic region. Also, a detailed parametric analysis of the auxetic S-structure is conducted under transverse loading conditions.
The literature [37] introduced a new arc-like structure, called the S-structure, that shows reduced stress-concentration effects and a stable deformation mechanism (does not shrink very rapidly). However, the mathematical model used before was based on the bar and hinge method, by which structural effects, such as bending, shearing, etc., are not captured. This is an important setback, as the structure itself is deformed predominantly due to bending and shearing. More accurate analyses are required to enable the practical application of this arc-like auxetic structure.
The present work is particularly focused on the linear elastic region of S-structure. A closed-form analytical expressions of overall elastic modulus and Poisson’s ratio under quasi-static load in the transverse direction are rigorously derived. The analysis using Timoshenko beams, along with Castigliano’s second theorem, is scarce in the literature and is explored in this work. A representative unit cell elements (RUCE) of this structure are considered a collection of Timoshenko beams to capture structural effects such as deformation of the structure under bending and shear stress. These effects are not considered in the classic bar and hinge method used in previous works. The analytical results agree well with the numerical results in the present work. Furthermore, a detailed parametric study of this structure is conducted under the transverse loading condition. The detailed analytical and numerical investigation of structural effects and an extensive parametric study in S-shaped auxetics under transverse quasi-static load is scarce in the literature, and due to its significant stress concentration reduction effects, it is worth exploring, which forms a scope of the present work.

2. Materials and Methods

2.1. Material and Geometric Parameters

In this work, the arc-like S-structure is explored under quasi-static transverse load. A significantly reduced stress concentration effect and a more stable deformation mode are exhibited by this structure when compared to the conventional re-entrant structure. In this section, different variations of S-structure are discussed. Various geometrical parameters of a unit cell of the S-structure are depicted below in Figure 1. Values of different geometrical parameters of 11 different S-structures are shown in Table 1.
AlSi10Mg is chosen as the parent material of the auxetics. Material parameters for AlSi10Mg were obtained from the literature [38]. In this section, the values of various elastic properties are shown in Table 2. The Johnson-Cook plasticity model is used for the analysis, and the corresponding values of parameters are reported in the literature [38]. These are utilized in the numerical analysis of the S-structure.
All the numerical analyses are performed using Abaqus. In all these cases, the strain rate is around 1.613 × 10 5 s 1 , which is much less, and therefore, associated inertia effects can be ignored. Therefore, static analysis can be used to predict the mechanical response of the structure accurately.
Various geometrical parameters of a unit cell of the S-structure are depicted below in Figure 1.

2.2. Analytical Investigation

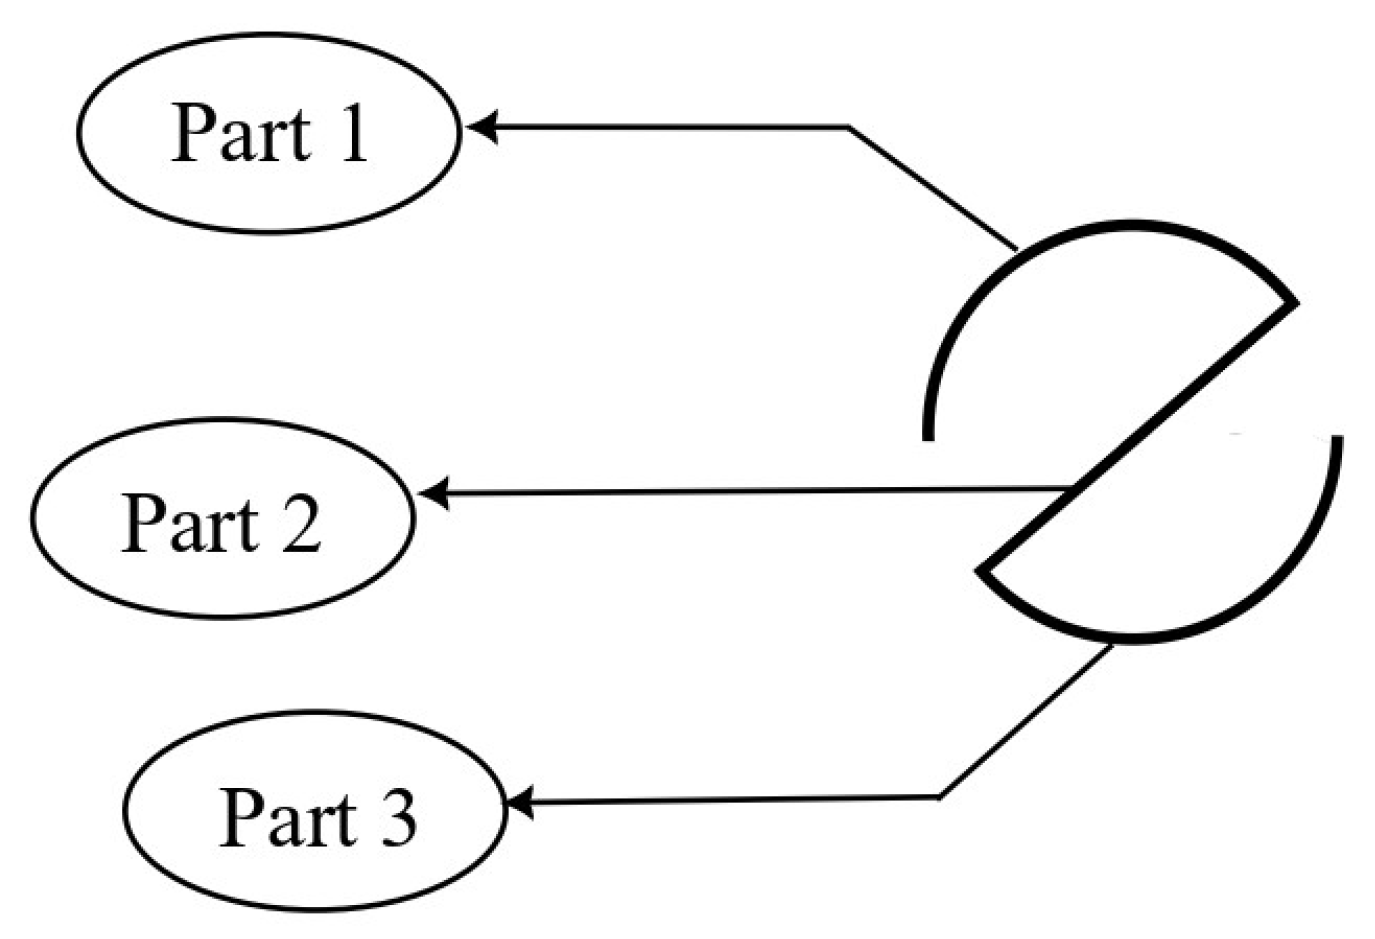
In the present work, the representative unit cell element (RUCE) is considered to be a collection of Timoshenko beams. The entire RUCE is separated into three parts, two of which are identical. It can be visualized in Figure A2.
Again, it may seem as if there is an unbalanced moment at a single RUCE level, which is true. However, the deformation is still stable as one RUCE with an unbalanced moment in a clockwise direction is directly connected with four RUCEs with a counterclockwise unbalanced moment, and they cancel each other out. Each of the neighboring RUCEs is assumed to apply an equal amount of balancing moment on a RUCE.
The detailed derivation for all equations is presented in Appendix A. Here, we only discuss the important expressions.

2.2.1. Total Deflection of RUCE

The parts showing bending-dominated deformation are two arc-like parts and a vertically inclined part, and in their calculation, deformation due to shearing and bending are accounted for. The straight struts with which these S-shaped parts are connected with each other deform axially. The total deformation is considered as, ( δ t o t a l ) R U C E = δ b + δ a + δ s . Here, δ b is deformation due to bending, δ a is deformation due to axial compression of straight struts, and δ s is the deformation due to shearing, and ( δ t o t a l ) R U C E is total deformation of the RUCE.

2.2.2. RUCE to Entire System

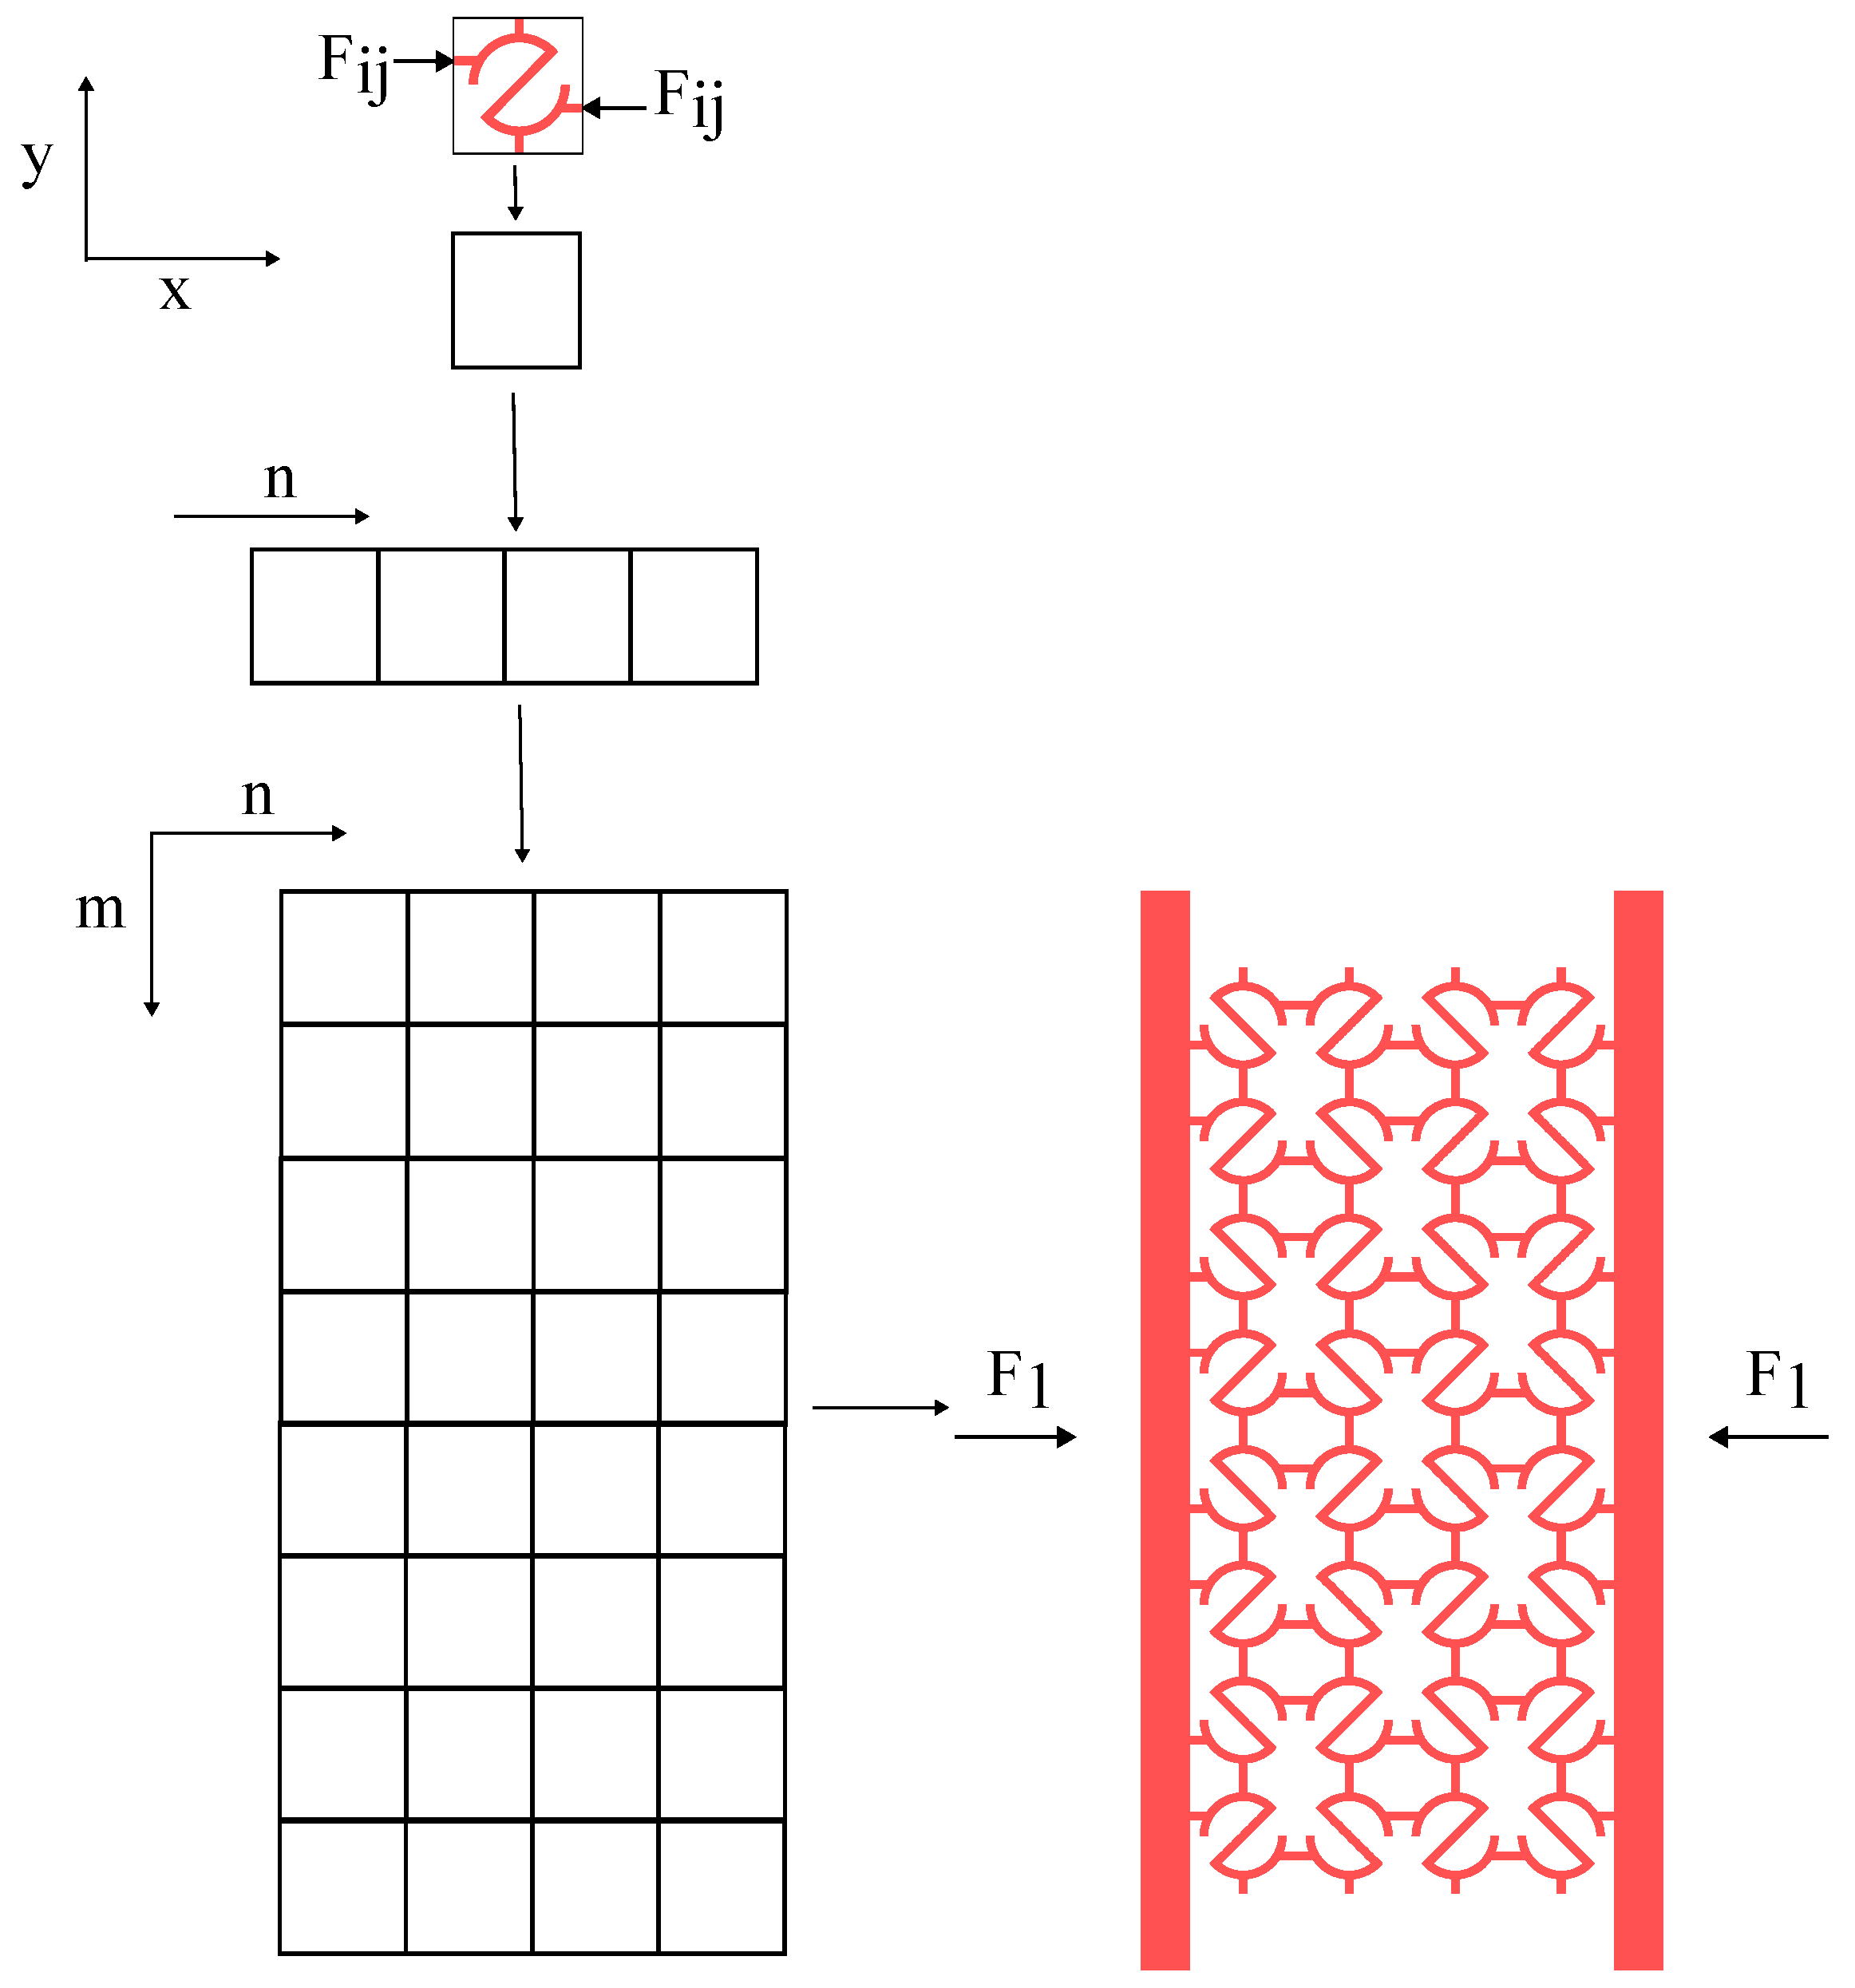
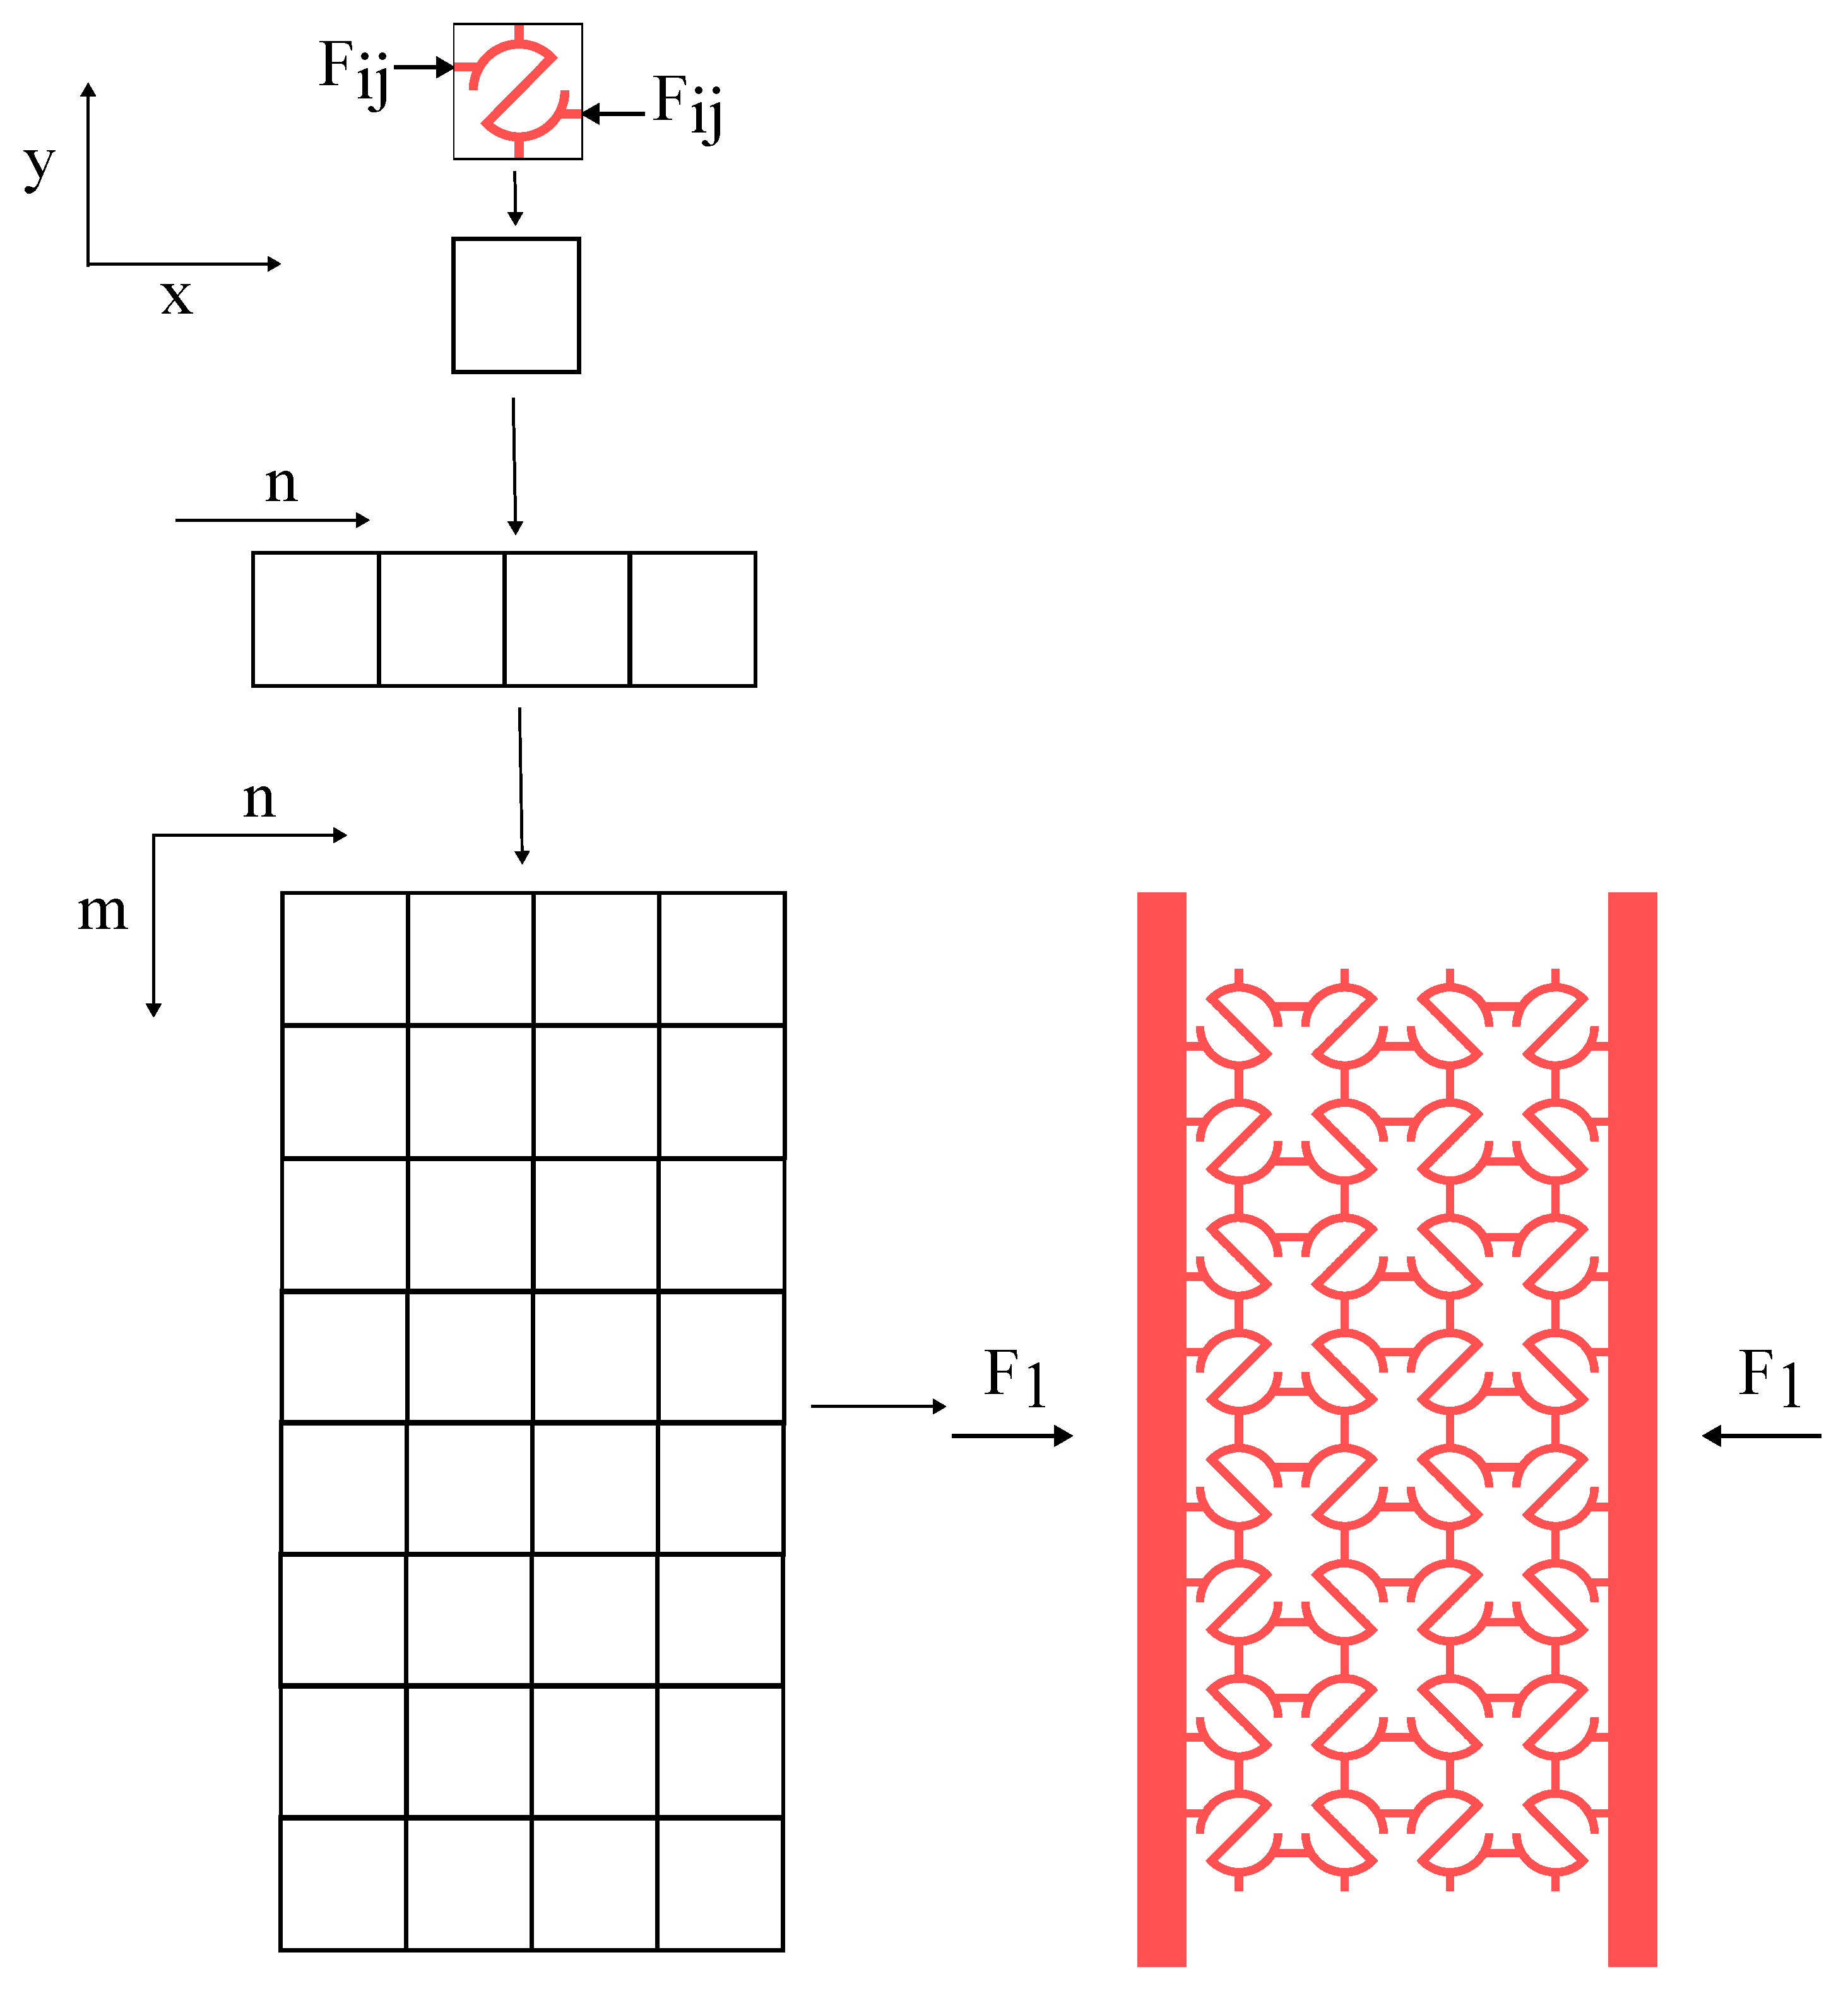
For getting the total deformation of the entire structure, the following scheme is used: first, a single row is considered a series combination of RUCEs, and then the entire structure is considered a parallel combination of such rows. This can be visualized from the Figure 2.
From this, the transverse elastic modulus is obtained as,
E l o n g = 2 m R E s L 0 b ( s i n γ + t 1 R ) 1 c 1 .
Here,
c 1 = 2 R 3 I [ { ( α + γ ) 2 + ( s i n 2 α + s i n 2 γ ) 4 + s i n 2 γ 2 + γ c o s 2 γ 4 + 1 3 c o s 2 α } + t 2 10 R 2 ( 1 + ν s ) { ( α + γ ) + ( s i n 2 α s i n 2 γ ) 2 + 2 c o s 2 α } + ( t 1 t 2 ) 12 R 3 ]
and I = b t 3 12 .
x and y directions are as shown in Figure 2. The total horizontal and vertical deflections of a RUCE are represented as Δ h and Δ v .
( ϵ x ) i j = ( Δ h ) i j 2 ( R s i n γ + t 1 ) .
and
( ϵ y ) i j = ( Δ v ) i j 2 ( R + t 1 ) .
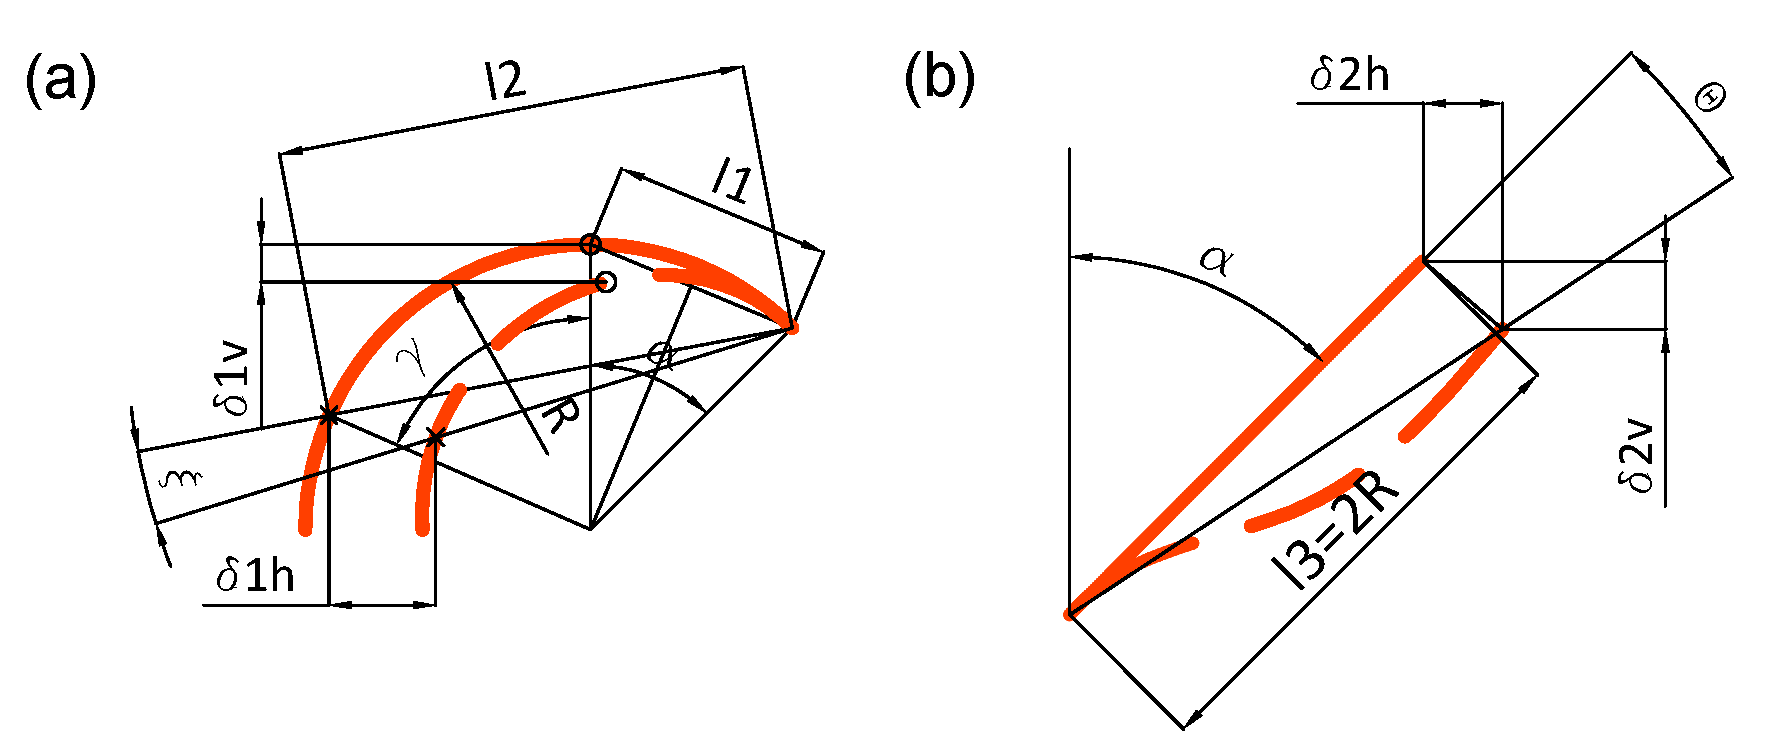
B = n ( 2 R s i n γ + 2 t 1 ) < W (notice), L = m ( 2 R + 2 t 1 ) ; where, L i j = 2 R + 2 t 1 and B i j = 2 R s i n γ + 2 t 1 . Again, l 1 = 2 R s i n α 2 , l 2 = 2 R s i n ( α + γ 2 ) and l 3 = 2 R .

2.2.3. Poisson’s Ratio Calculation

Finally, the Poisson’s Ratio for one RUCE is given as,
( ν y x ) i j = ( ϵ y ) i j ( ϵ x ) i j .
The equivalent Poisson’s ratio under transverse load can also be presented as,
ν e q y x = d 1 ( ν y x ) i j + d 2 .
Where ν y x is dependent on Δ h . Therefore, the Poisson’s ratio-displacement curve is also obtained from analytical work, but the elastic region is considered the main focus of this study. Detailed derivations are given in Appendix A.

2.3. Numerical Investigation

In this section, first, a mesh convergence study and an overview of various results are given, and in the latter part, a general description of force-displacement and Poisson’s ratio-displacement curves, along with deformation patterns, are discussed. Most importantly, in this section, numerical simulation results for different variations of S-structure are discussed in detail.
The force-deflection curves are shown in Figure 3 for various approximate global (element) sizes (represented by l), respectively, under transverse load. The Poisson’s ratio (PR)-deflection curve is presented in Figure 3, and a comparative understanding of NPR value at its first peak is obtained for various element sizes. From Figure 4, a comparative understanding of error in force at displacement = 4 m m results and Poisson’s ratio results for S1 structure under quasi-static load for various approximate global sizes can be obtained. From this, it can be concluded that approximate global size = 0.25 mm leads to a very accurate result; it takes a reasonable amount of time, and a reasonable amount of steps are calculated during simulation. The accuracy is calculated by taking results for l=0.2 mm as a reference. All of these results are presented in Table 3.

2.3.1. Finite Element Analysis of all S-structures:

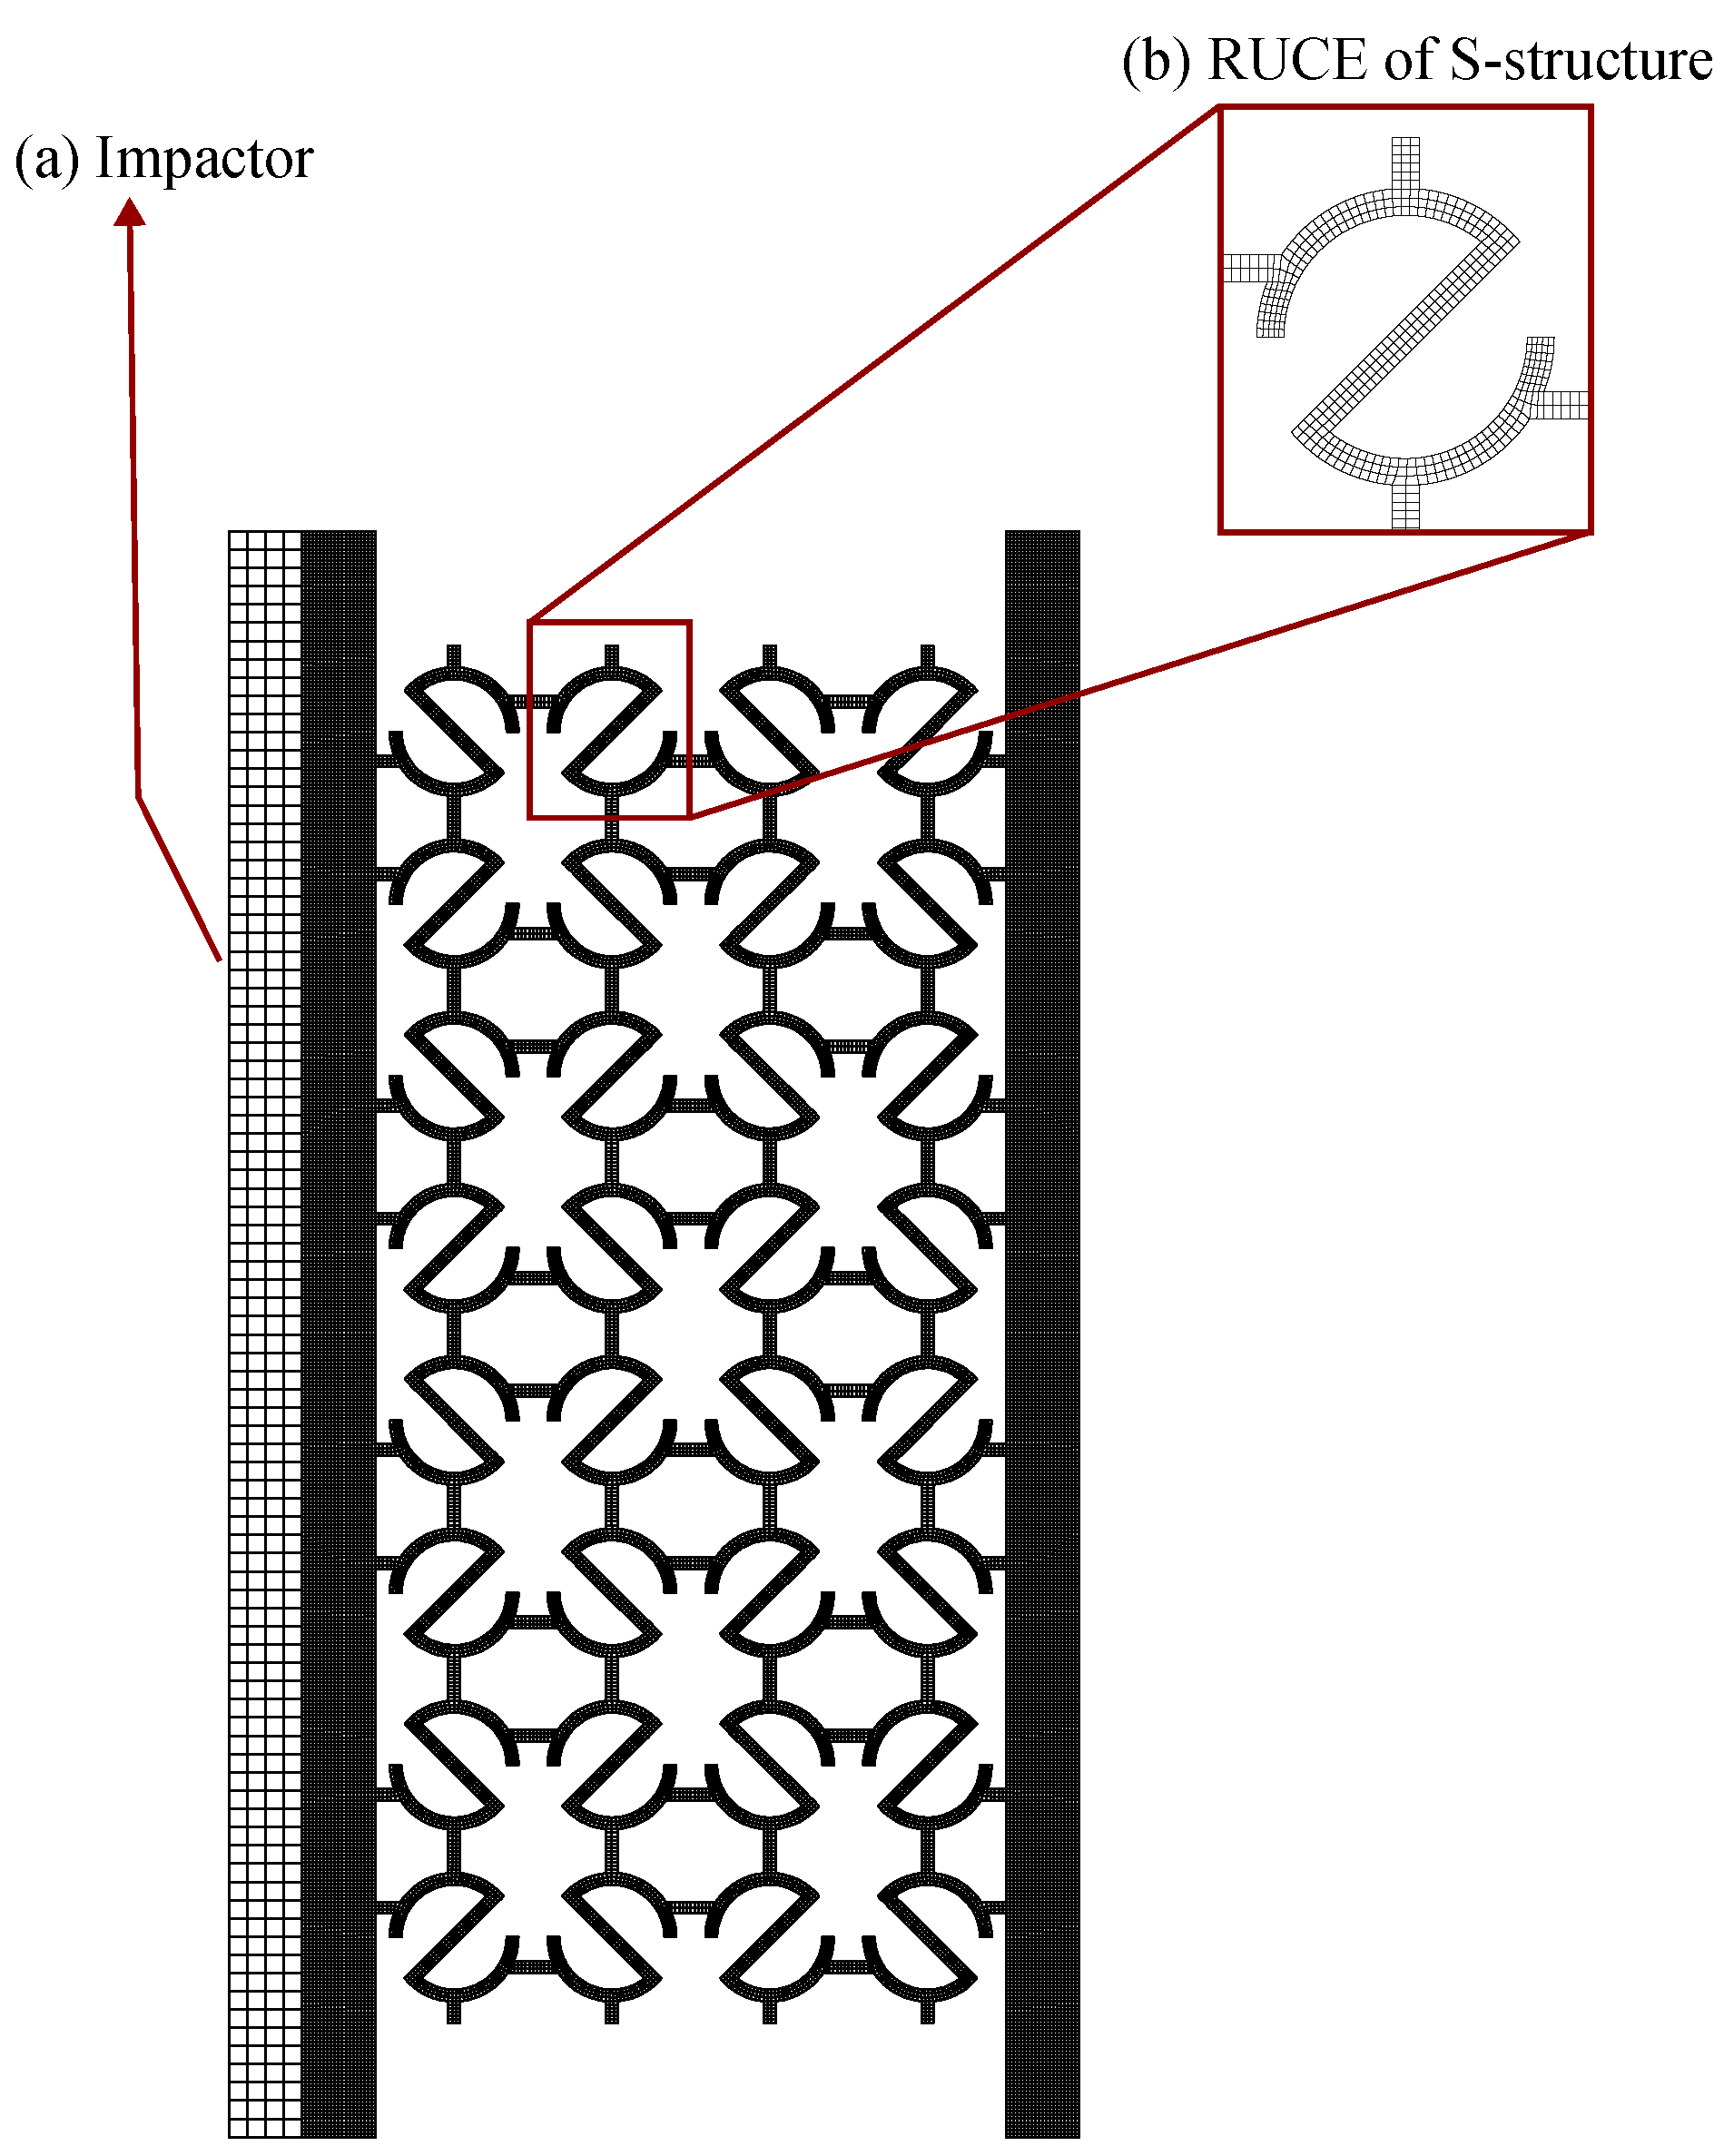
For static analysis under transverse load, static (general) analysis on Abaqus is conducted. Material data is obtained from Table 2. A friction coefficient of 0.1 between two interacting surfaces is used, which is similar to the literature [38]. For the static step, the time interval is taken as 40000 s. The right surface of the S-structure is encastered ( U x = U y = U z = U R x = U R y = U R z = 0 ), and the whole structure has U z = 0 , U R x = 0 , U R y = 0 as the boundary condition, where `U’ represents linear displacement and the subscript represents the axis along which it takes place; on the other hand, `UR’ represents angular displacement and the subscript represents the axis about which it occurs. It should be noted that the x and y axes are oriented the way described in Figure 2, and the z-axis is oriented perpendicular to the xy-plane and towards the reader. Further, the impactor is given the boundary condition U x = 30 , U y = U z = U R x = U R y = U R z = 0 . Surfaces A, B, C, and D of the S-structure, as shown in Figure 1, are given the boundary condition, U y = U z = 0 , U R x = U R y = 0 . In meshing, `approximate global size=0.25’ is chosen from the `Seed part,’ and from `assign mesh controls,’ `Hex’ is chosen as the element shape, `sweep’ as the technique, and `medial axis’ as the algorithm. `C3D8R’ elements (an 8-node linear brick, reduced integration, hourglass controlled element) are chosen for the numerical investigation (as shown in Figure 5 (a)). Using these inputs, results like the force-displacement curve and Poisson’s Ratio-displacement curves are obtained for all 11 variations of S-structure with geometric parameter values as mentioned in Table 1. Also, other dimensions that are used in numerical and other calculations have been mentioned in Table 4. Furthermore, the Elastic modulus, Energy absorbed, and the first peak of Negative Poisson’s ratio value during the deformation process are obtained from these curves. It should be noted that Poisson’s ratio is calculated as the ratio of strain experienced by the mid-surface perpendicular to the loading direction and strain experienced by the S-structure along the loading direction. The values of these outputs are given in Table 5. For the impactor plate, `C3D8R’ elements are used as shown in Figure 5 (b), and in mesh control, `Hex’ is selected as the element shape and `structured’ as the technique. For the impactors for S1-S9 structures (width in the z-direction, b=5 mm), the mesh size is kept at 2.5 mm. For the S10 structure (b=2.5 mm) and for the S11 structure (b=3.75 mm), the mesh size of the impactor is kept at 1.25 mm. To maintain a similar level of mesh fineness even for the S-structure with the least width in the z-direction (2.5 mm), we must use a mesh size of at least 0.1984 mm ( A × 5 ( 0.5 ) 3 = A × 2.5 ( s ) 3 , so s = 0.19845 ) where a mesh size of 0.15 mm is used for S10 and S11 structures, and hence it is acceptable.
The force ( F n u m ) on the S-structure was measured as the sum of force at all the nodes on the right surface of the impactor (which interacts with the left surface of the S-structure) at the end of the linear elastic stage. Let’s say the area of the right surface of the impactor is A; then the stress is σ = F n u m / A . This is the stress on the right surface of the impactor and is caused by the strain in the S-structure. This strain is measured as ϵ l = d / W 1 , where `d’ is the average displacement of all the nodes at the right surface of the impactor at the end of the linear elastic stage and is equal to the average displacement of all nodes at the left surface of the S-structure at that stage. ` W 1 is the length of the S-structure as shown in Figure 1. Elastic modulus is calculated as E = σ / ϵ l .
Again, the transverse strain is given by ϵ t = d t / L m i n , where the transverse displacement of the mid-surface of the S-structure is d t , and the width of the structure at mid-plane is L m i n . So, the Poisson’s ratio is given as P R = ϵ t / ϵ l .
The energy absorbed by each S-structure is obtained from the area under the force-displacement curve using the trapezoidal numerical integration method, and relative density is calculated as R D = ρ / ρ s = V s / V , where V s is the volume of the S-structure and V is the volume of a solid block replacing the S-structure with the same overall dimensions ( W × b × L 1 ).

3. Results and Discussion

3.1. Comparison of Numerical and Analytical Studies

In this section, the value of elastic modulus obtained from the analytical study and numerical study are compared, and the maximum negative Poisson’s ratio obtained from analytical and numerical studies are compared. This is done using the `Curve Fitter’ application in MATLAB. A linear fit is expected between elastic modulus/PR obtained from analytical and numerical studies. Analytical values are taken along the abscissa axis, and numerical values are taken along the ordinate axis. The closest fit among the `LAR (Least Absolute Residual)’ method and the bi-square method is used to obtain the best-fit line and for validation.
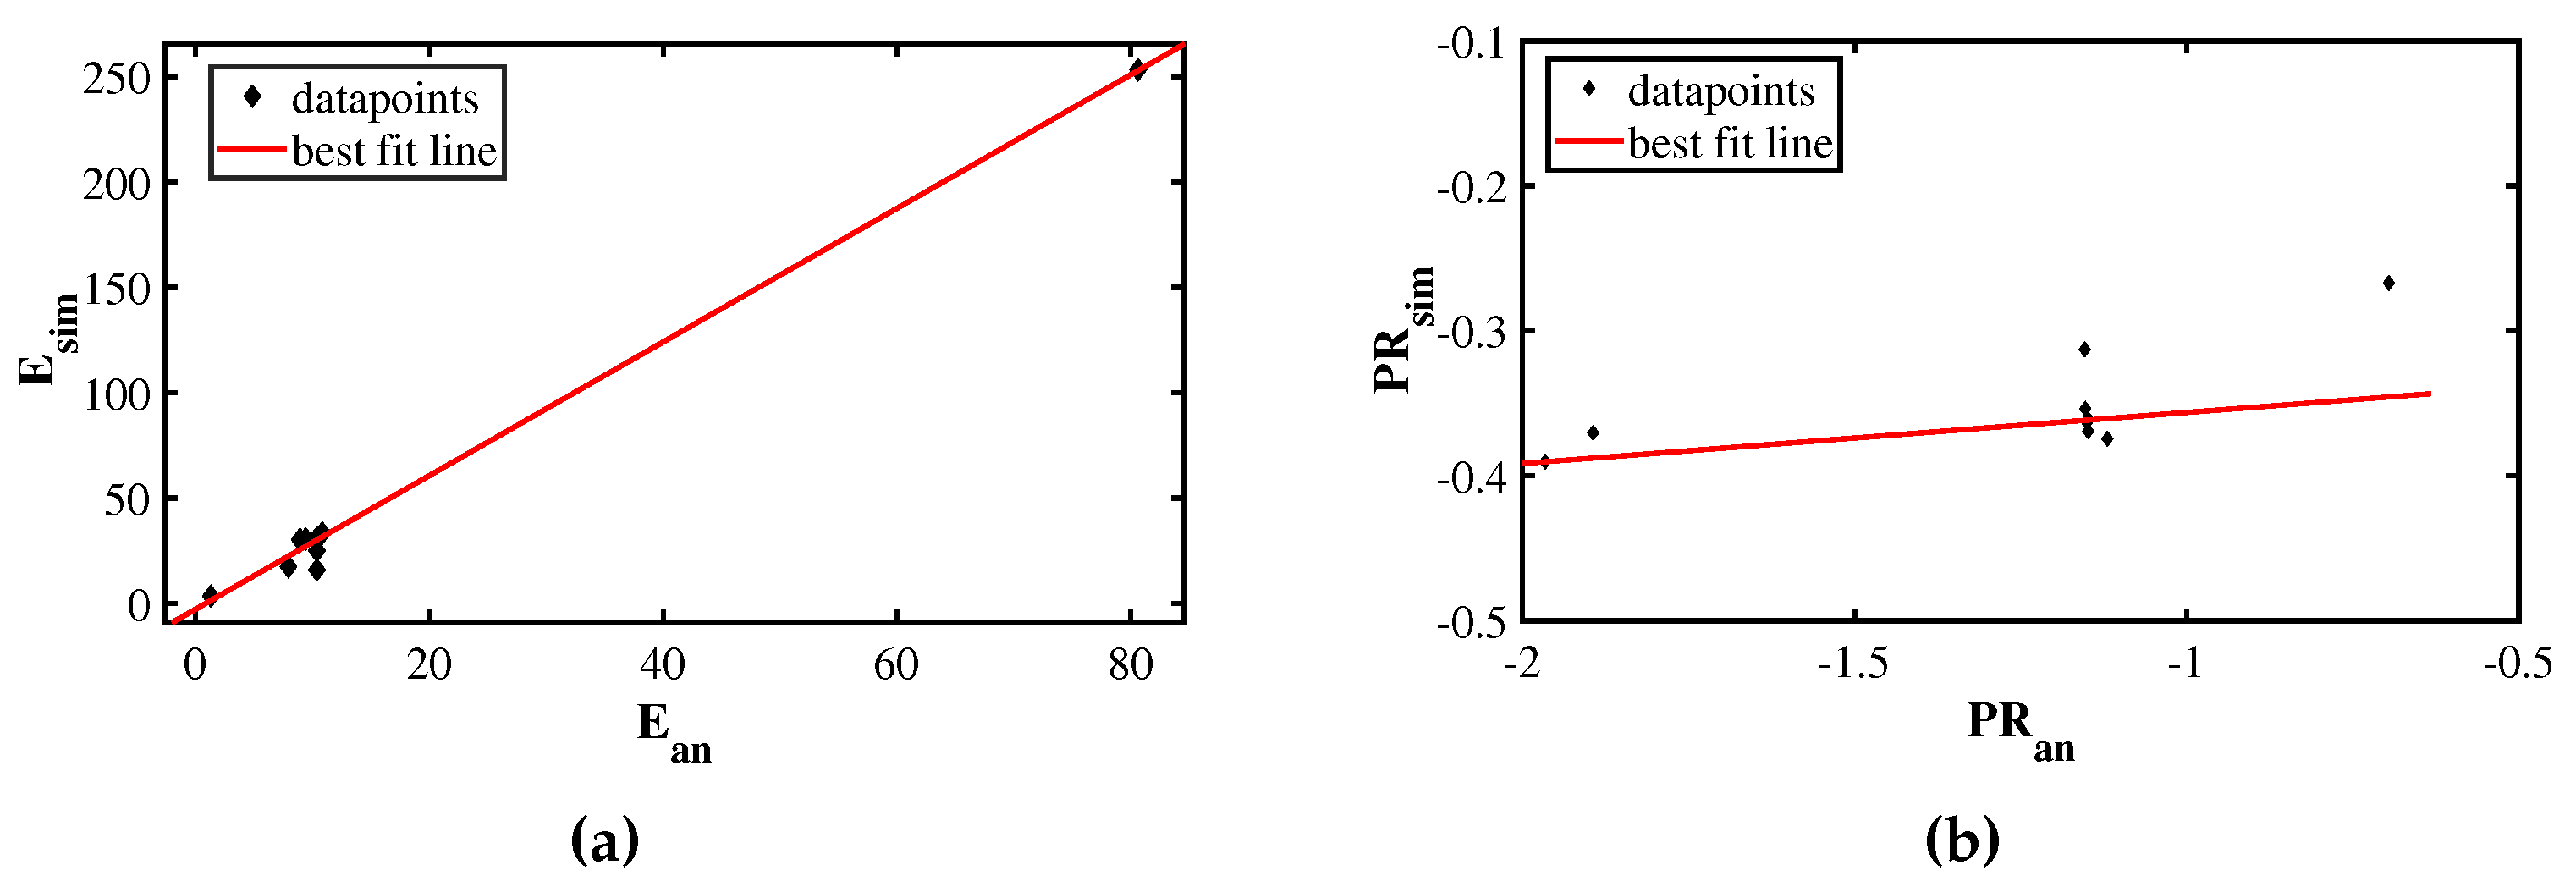
Figure 6 (a) is the comparison between the elastic modulus of different variations of S-structures obtained from the analytical and numerical investigation using the bi-square method. It is obtained that E n u m e r i c a l = p 1 E a n a l y t i c a l + p 2 , where, p 1 = 3.169 , p 2 = 2.642 . The R-square value is 0.9943, the adjusted R-square value is 0.9937, and RMSE=5.535. In the case of transverse load, within the elastic region, the effect of bending is the most dominant one. So, this mode of deformation is neglected for elastic modulus calculation. As a result, the analysis is accurate only in a qualitative way, but for quantitative analysis, the process becomes semi-analytical.
Figure 6 (b) is the comparison between the Poisson’s Ratio of different variations of S-structures obtained from the analytical and numerical investigation using Least Absolute Error (LAR) method. It is obtained that P R n u m e r i c a l = p 1 P R a n a l y t i c a l + p 2 , where, p 1 = 0.03525 , p 2 = 0.321 . It is assumed in the analytical expression that P R a n a l y t i c a l = ( ν x y ) i j , where the numerical expression is basically ν e q , so it is similar to the equation A49, when c 1 = p 1 and c 2 = p 2 . The R-square value is 0.8406, the adjusted R-square value is 0.8207, and RMSE=0.01526. Qualitatively, the analytical model agrees well with the numerical simulation results. The rotation of each unit cell is not considered in the analysis, the effect and constraints of which become important as the value of ` γ ’ decreases. Therefore, for the validation of analytical results using the numerical results, the S-structure with γ = 50 ° is neglected, as it will produce high error and lower correlation, as expected.
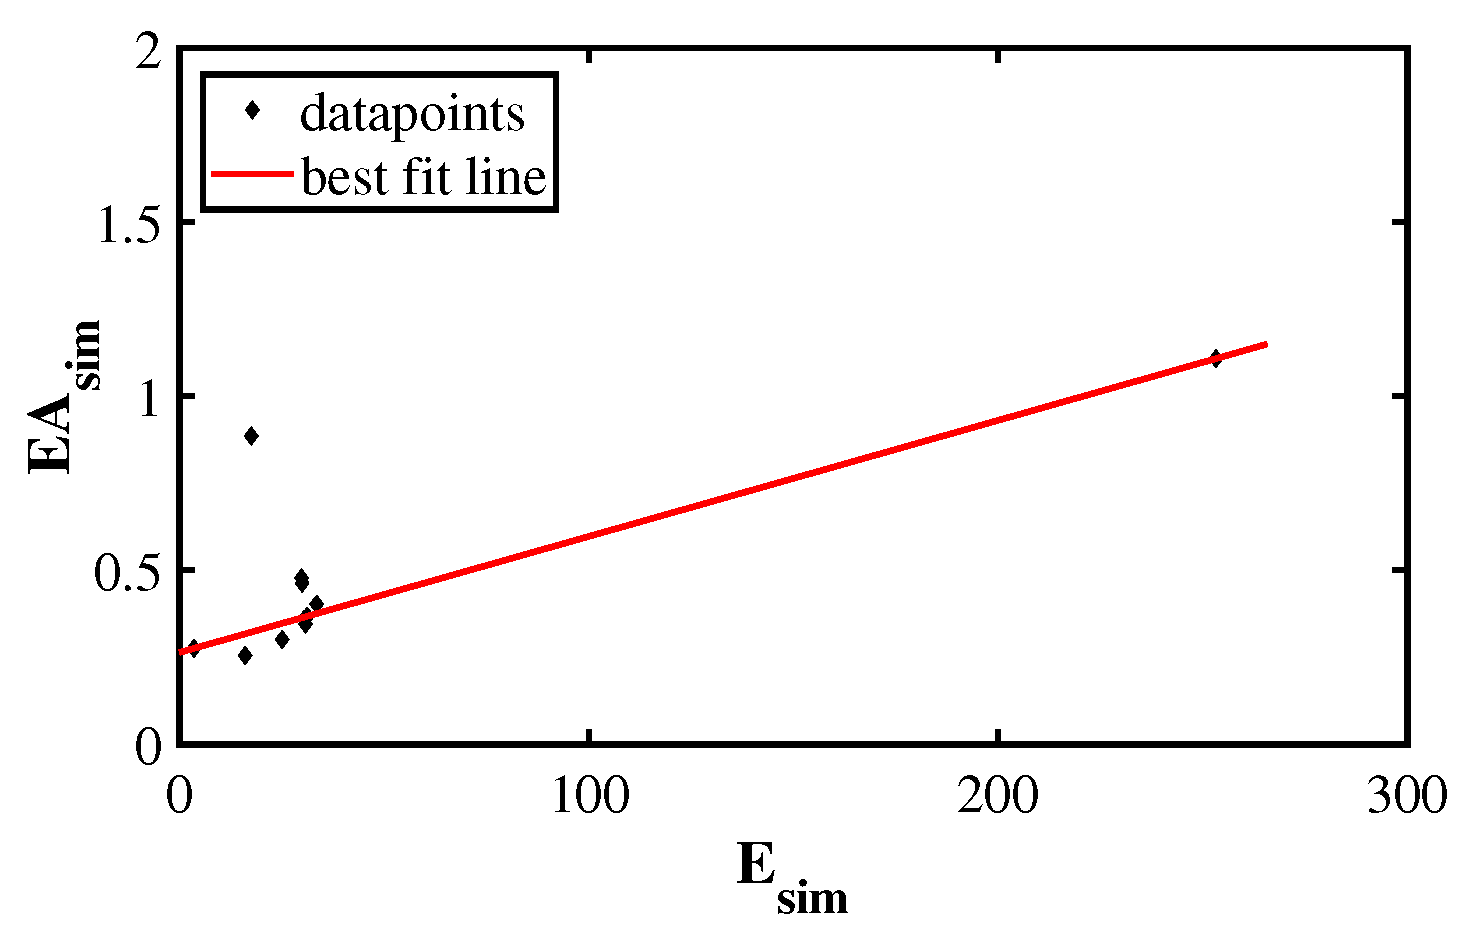
It must also be noted that when energy absorbed in the linear elastic region ( E A s i m ) according to simulation results is plotted along the y-axis and elastic modulus ( E s i m ) obtained from simulation results is plotted along the x-axis, as shown in Figure 7, a linear relationship given by E A s i m = p 1 E s i m + p 2 is obtained, where, p 1 = 0.003333 , p 2 = 0.2639 . In this case, R-square = 0.8905, adjusted R-square = 0.8784, and RMSE =0.09452. This validation was made using the LAR method.

3.2. Parametric Studies

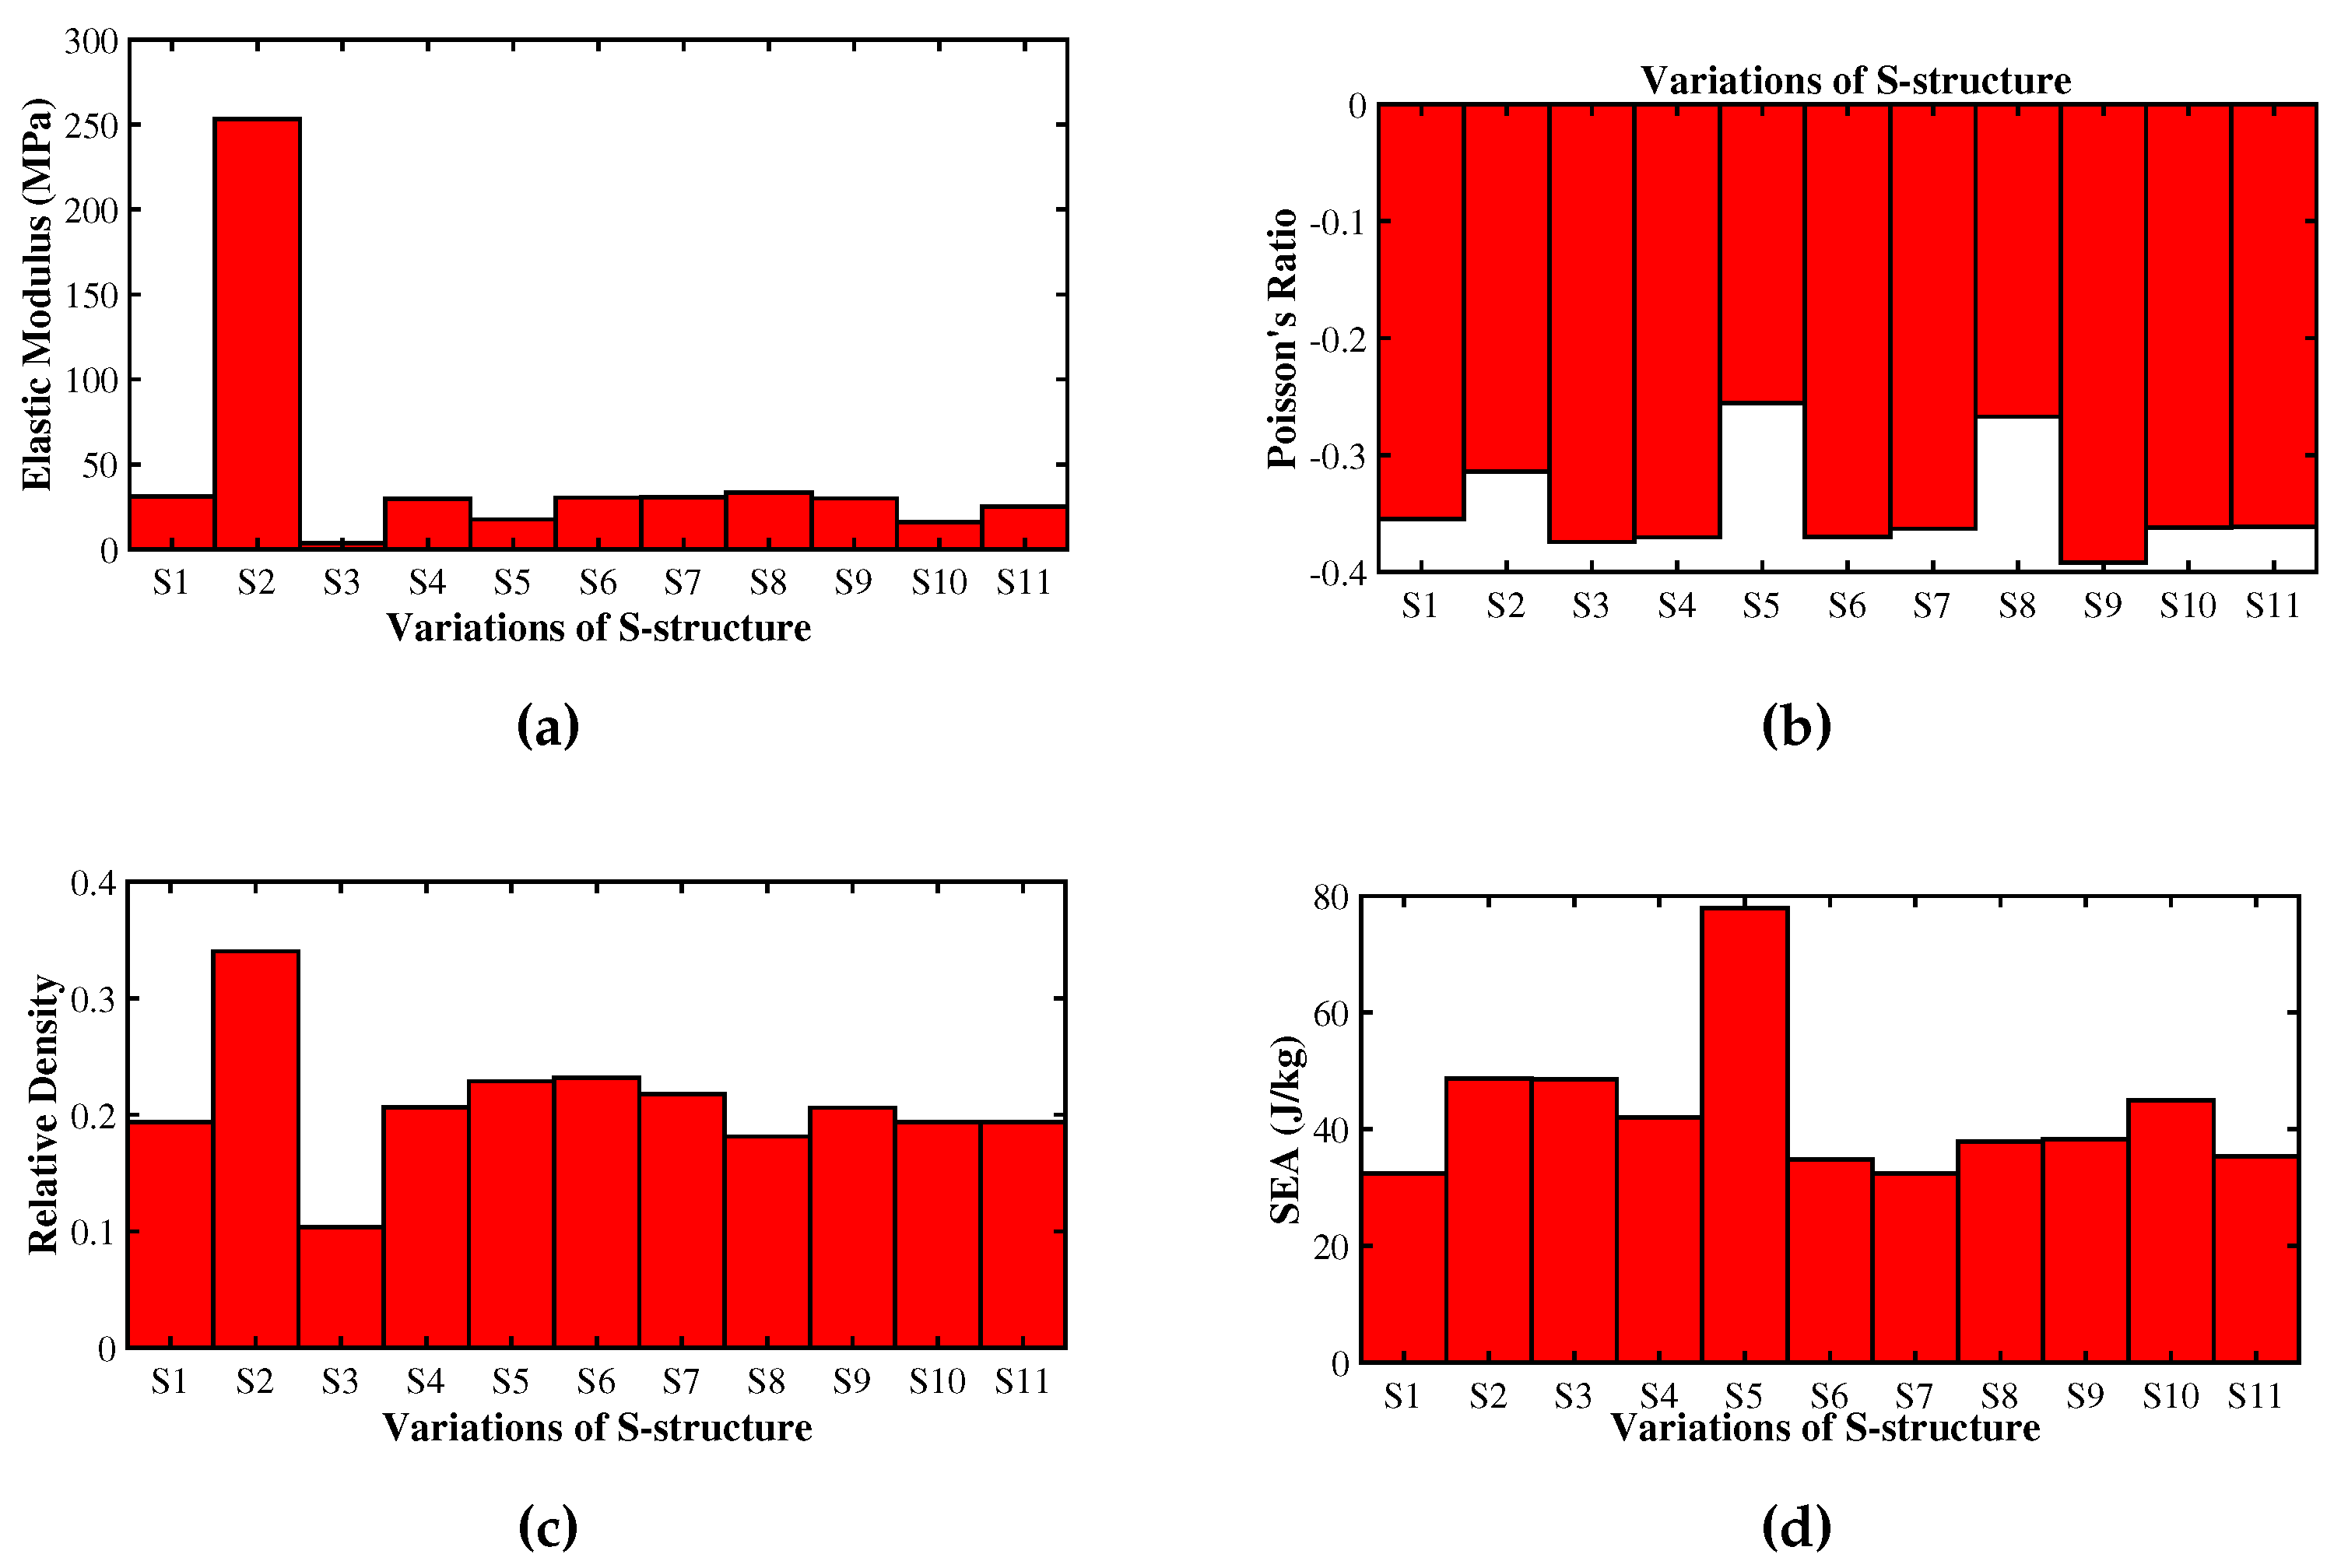
In this section, the effect of various geometrical parameters on the overall mechanical properties of the S-structure and its relative density is discussed using the results of the numerical study. The variation of elastic modulus, Poisson’s ratio, relative density, and specific energy absorption (SEA) for various S-structures under quasi-static transverse load is presented in Figure 8.
  • SEA, elastic modulus, and relative density have increased with a greater thickness of struts (t); however, the NPR effect is decreased.
  • Highest SEA and NPR effect is obtained for S-structure with γ = 62.5 °. With a decrease in γ , elastic modulus is decreased, and relative density is increased.
  • Elastic modulus and NPR effect are almost unaffected by the parameter t1 (connecting strut length); however, with the increase in t1, relative density and SEA have decreased.
  • Elastic modulus and energy absorption capacity are decreased with increasing value of α ; however, NPR effect and relative density are increased.
  • Elastic modulus is increased as the out-of-plane thickness (b) is increased; however, the NPR effect is reduced with an increase in b. SEA capacity is the least for b = 3.75 mm, and the relative density remains unchanged.
  • SEA for transverse loading condition is maximum for S-structure with α = 10 °. The next highest value of SEA is obtained for t = 1.6 mm. On the other hand, t = 1.6 m m offers the highest elastic modulus among all S-structures, which is expected as increase in strut thickness implies introduction of more mass. The lowest value of SEA and elastic modulus is obtained for the S-structure with t = 0.4 mm. So, strut thickness and α have the most effect on energy absorption capacity and strength of the S-structure, as can be seen in Figure 8.
  • On the other hand, the highest NPR effect is obtained for α = 60 °, and the highest relative density is obtained for the S-structure with strut thickness, t = 1.6 mm.

4. Conclusions

Analytical, finite element simulations, parametric, and crash-worthiness studies are conducted on the overall mechanical properties of S-shaped auxetic under quasi-static transverse load. The closed-form analytical expressions for overall elastic modulus and negative Poisson’s ratio are obtained by assuming the unit cells (RUCE) as a collection of Timoshenko beams, and the analytical expression for relative density is obtained by simplifying the geometry of the unit cell. The results are in good agreement with the numerical results.
In this study, we have obtained semi-analytical expressions to achieve quantitative accuracy for overall elastic modulus and Poisson’s ratio after comparing results from analytical expression and that from finite element simulations. The simulation results are considered more accurate, as sufficiently fine mesh is employed for the analysis. However, in Poisson’s ratio calculations, the analytical model does not consider the effect and constraints associated with the rotation of RUCEs and the touching of various parts of the unit cell. This becomes more prominent with a decrease in the value of γ as the unbalanced moment at the unit cell level increases. Therefore, for the Poisson’s ratio, the γ = 50 ° is not considered while validating the mathematical results with numerical results, as it will understandably produce high error and low correlation.
Further, a linear relation between the energy absorbed by the S-shaped auxetic and the overall elastic modulus is obtained within the linear elastic region from the finite element analysis. It is of the form E A s i m = p 1 × E s i m + p 2 , where p 1 and p 2 are arbitrary constants. Therefore, energy absorption is generally increased for S-shaped auxetic as the overall elastic modulus increases. This relationship can be explained by the fact that the meta-material exhibits a linear elastic region for very small strains, just like its parent material. For a solid material, the absorbed energy within the linear elastic region is of the form E A = 1 2 E ϵ 2 , and there exists a linear relation between the absorbed energy and elastic modulus. This is possibly also the case for the meta-material, where there exists a linear relation between the absorbed energy and the elastic modulus of the meta-material.
Different trends obtained from the parametric study based on the finite element analysis results are also supported by the trends obtained from analytical expressions. However, the limitations of the analytical results in this aspect arise from not considering the aforementioned effects and the effect of out-of-plane dimensions and deformations. The methods to include these effects will be explored in future works. However, the overall accuracy of the analytical model is impressive, and inverse design, optimization, etc., for the S-shaped auxetic under transverse loading conditions, can become less time-consuming and will be discussed in future works as well. These analytical closed-form expressions are accurate within the linear elastic region, while beyond linear elasticity, the finite element analysis method becomes crucial for analysis.
The parameters `t,’ ` α ,’ and ` γ ’ are the most important geometrical parameters for controlling elastic modulus, NPR effect, relative density, energy absorption capacity (measured by specific energy absorption or SEA by the meta-material), and crashworthiness parameters, whereas `t1’ is the least important geometric parameter of the S-shaped auxetic under quasi-static transverse load. Relative density and elastic modulus are most affected by the choice of t; SEA is mostly controlled by γ , whereas NPR effect and SEA are most affected by the choice of ` α .’ Similar trends are observed from the analytical closed-form expressions.
A range of elastic modulus from 3.5-253.2 MPa, a range of Poisson’s ratio from -0.255 to -0.392, and that of SEA capacity from 32.37 to 77.95 J/kg are obtained in the parametric studies within the linear elastic limit.
By controlling the geometric parameters, elastic modulus ranging approximately from 3 MPa to 250 MPa is achieved, implying that the S-shaped auxetic can be used especially for packaging, cushioning, and soft robotics applications under quasi-static transverse load.

Funding

This research did not receive any specific grant from funding agencies in the public, commercial, or not-for-profit sectors.

Institutional Review Board Statement

Not applicable

Informed Consent Statement

Not applicable

Data Availability Statement

The authors declare that the data supporting the findings of this study are available within the paper. No other source is used for obtaining any data set.

Conflicts of Interest

The authors declare no conflict of interest.

Abbreviations

The following abbreviations are used in this manuscript:
RUCE Representative Unit Cell Element
FBD Free Body Diagram
TB Timoshenko Beams
NPR Negative Poisson’s Ratio

Appendix A. Analytical Investigation

Appendix A.1. Brief Description
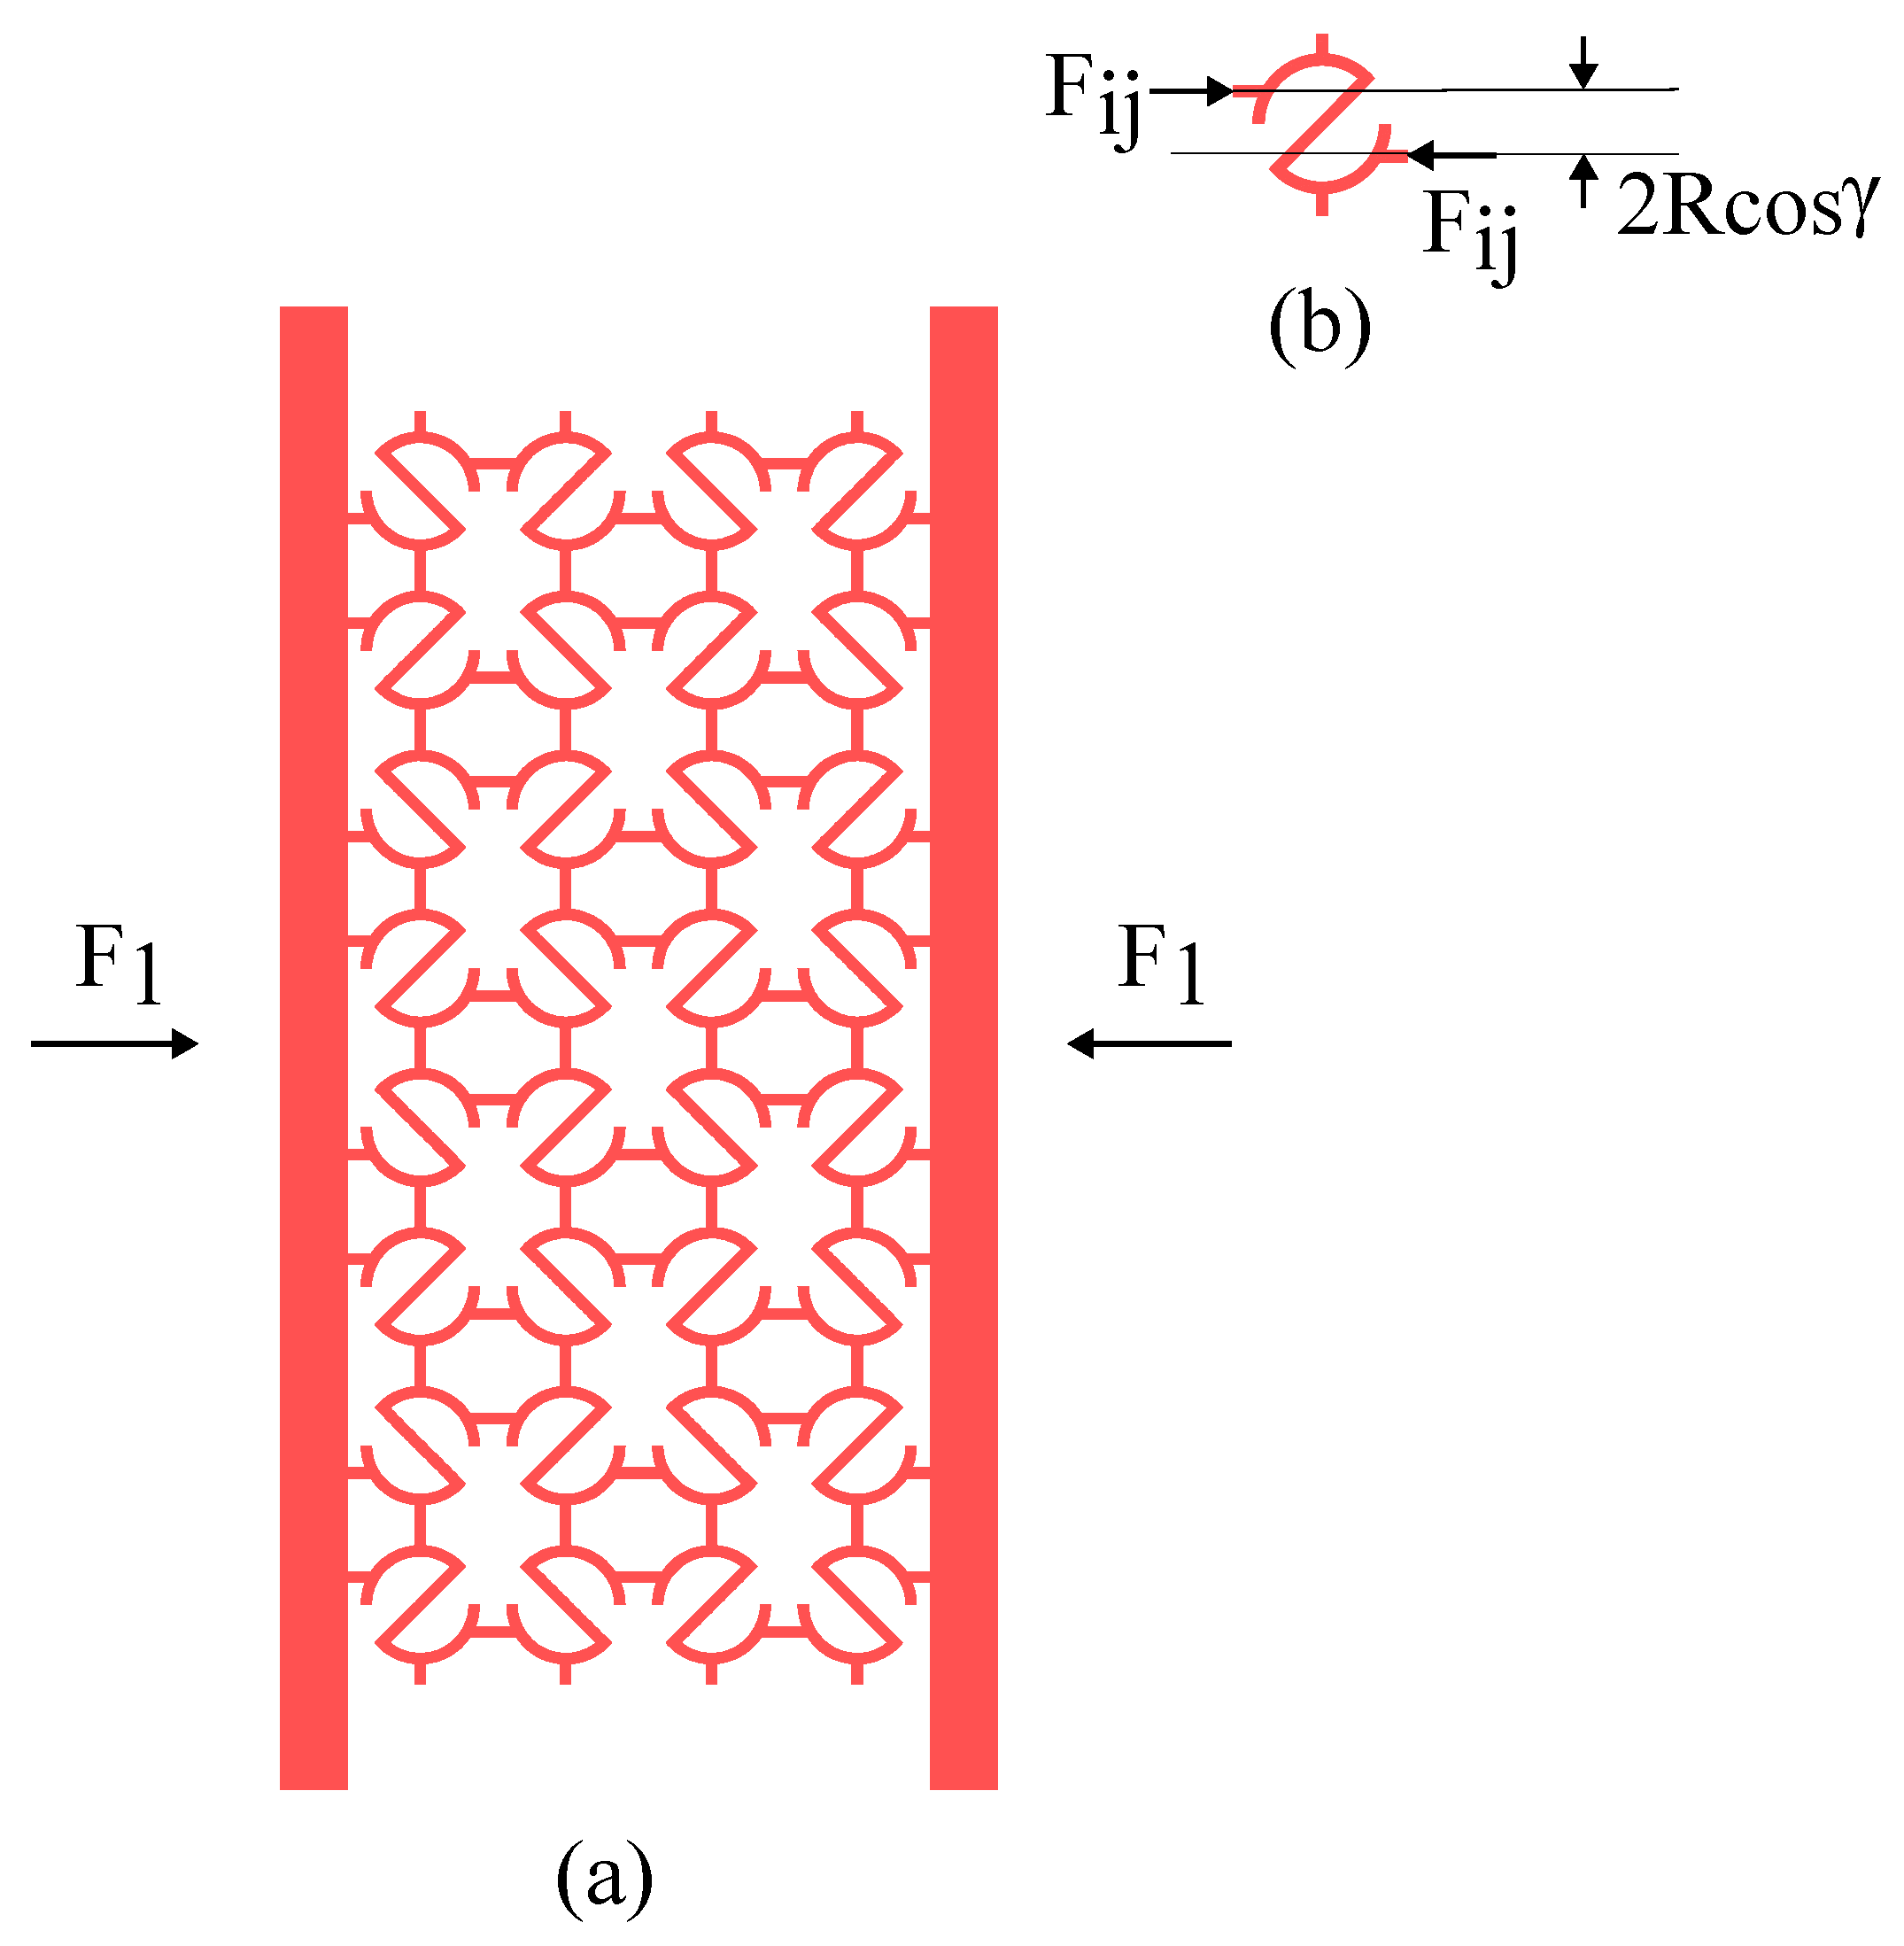
In Figure A1, we can see the loading condition of the complete S-structure and of one Representative Unit Cell Element (RUCE). In this analytical study, parts of the S-structure are assumed to be Timoshenko beams (TB). Various parts of the S-shaped portion of a RUCE are shown in Figure A2 and represented by elastic lines. These are the parts of the RUCE that are considered TB. There are two struts at the left and right that connect S-shaped parts, as can be seen in Figure A1(a) and Figure A1(b). Parts 1 and 3 deform in a similar way, so both the parts are represented by one free-body diagram (FBD), and part 2 deforms differently, so one FBD represents this part, as can be seen from Figure A3 and Figure A4. It may seem as if there is an unbalanced moment, but this is balanced due to its connection to adjacent RUCEs, which have an unbalanced moment of opposite signs, and they contribute equally to balance the unbalanced moment generated in a RUCE.
Figure A1. (a)Loading condition of S-structure and (b) one RUCE of S-structure under transverse loading
Preprints 109914 g0a1
Figure A2. Various parts of the S-shaped portion of the RUCE
Preprints 109914 g0a2
Figure A3. (a) FBD of parts 1 and 3 and (b) shear force and (c) bending moment on a section of it
Preprints 109914 g0a3

Appendix A.1.1. Shear Force and Bending MOMENT distribution
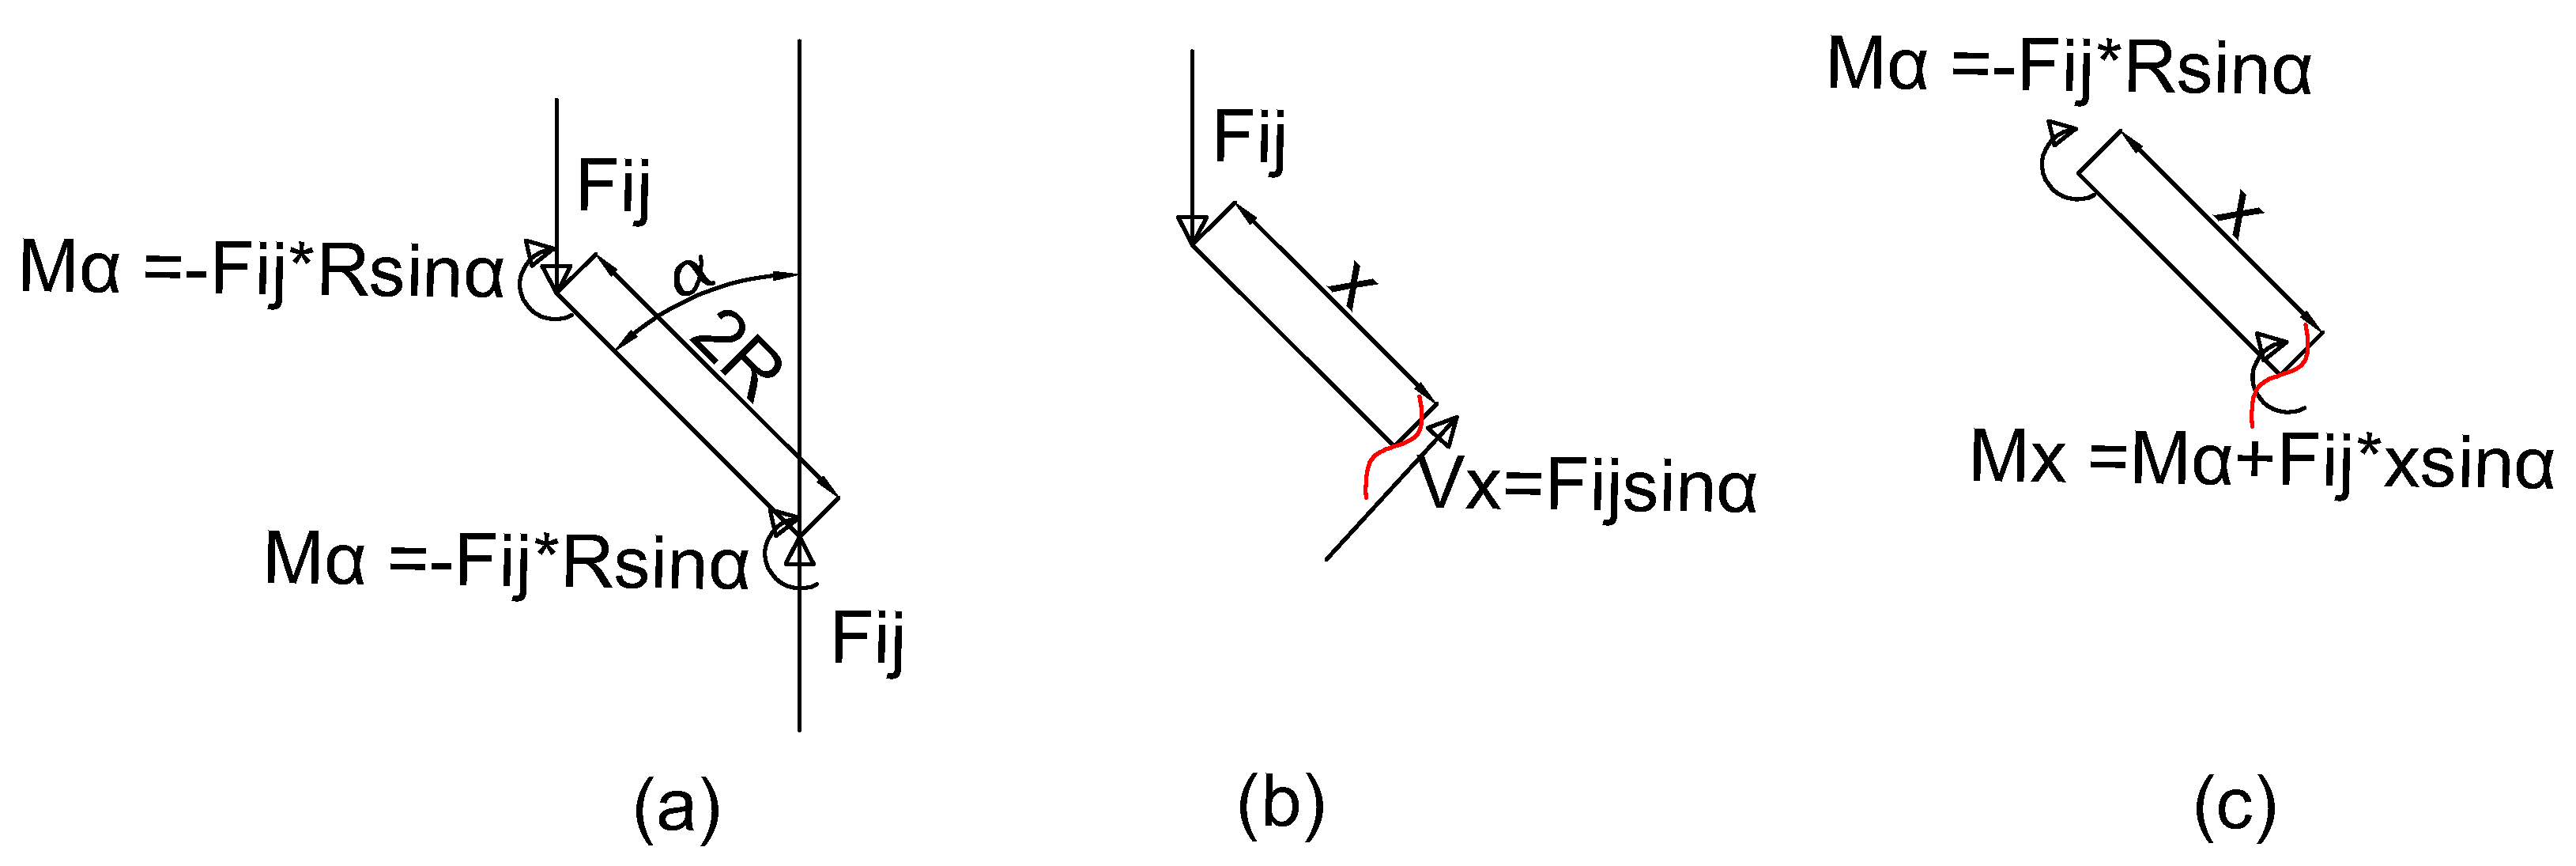
Parts 1 and 3:
For parts 1 and 3, the free-body diagram is represented by the leftmost figure of Figure A3. The shear force at various locations of the part is represented by the middle one, and the bending moment at various locations of the parts is represented in the rightmost figure. At the fixed end of parts 1 and 3, the supporting moment is M 1 = F i j R c o s α , and the supporting load is F i j . At the junction of struts (that connect two RUCEs) and arc-like parts, a balancing moment of F i j R c o s γ 2 is applied.
Shear force distribution:
Let’s say the line along part 2 represents θ = 0 , and θ is positive in the clockwise direction. Now, for θ [ 0 , α ] , shear force, V θ = F i j s i n ( α θ ) ; and for θ ( α , α + γ ] , shear force, V θ = F i j s i n ( θ α ) . For θ ( α + γ , α + π / 2 ] , V θ = 0 , it is assumed that the horizontal displacement of all the RUCEs in a column is the same.
Bending moment distribution:
For θ [ 0 , α ] , bending moment, M θ =- F i j R c o s ( α θ ) , and for θ ( α , α + γ ] , bending moment, M θ =[ F i j R c o s ( γ ) 2 { 1 + < θ α γ > 0 } + F i j R c o s ( θ α ) ].For θ ( α + γ , α + π / 2 ] , M θ =0.
Part 2:
The sub-figures in Figure A4 are arranged for part 2 of the RUCE like those in Figure A3 for parts 1 and 3. At the junction of the inclined part and the arc-like parts, the support moment, M 2 = M 1 = F i j R c o s α , and the supporting load is F i j .
Shear force distribution:
Shear force, at any x=x, V x = F i j c o s α , where `x’ is the distance along the length of part 2.
Bending moment distribution:
For x=x, bending moment, M x = F i j x s i n α M 2 , where M 2 = F i j R c o s α .
Figure A4. (a) FBD of part 2 and (b) bending moment and (c) shear force on a section of it
Preprints 109914 g0a4

Appendix A.1.2. Analytical Investigation of Elastic Modulus
The total vertical deflection is given as δ h = 2 δ 1 h + δ 2 h + δ a . Again, the deflection of any part is the summation of deflection due to shearing. Due to bending, e.g., δ 1 h = δ 1 s h + δ 1 b h , where δ 1 s h is the vertical deflection due to shear and δ 1 b h is due to bending.
Parts 1 and 3:
Shear stress distribution on a section at any angle θ [ 0 , α ) is obtained as,
τ = F i j 1 2 ( t 2 + y ) b ( t 2 y ) s i n ( α θ ) I b ,
and after simplifying it, it is obtained that,
τ = F i j 2 I ( t 2 4 y 2 ) s i n ( α θ ) .
Again, shear stress distribution on a section at any angle θ [ α , α + γ ) is obtained as,
τ = F i j 1 2 ( t 2 + y ) b ( t 2 y ) s i n ( θ α ) I b ,
and again, after simplifying it, it is obtained that,
τ = F i j 2 I ( t 2 4 y 2 ) s i n ( θ α ) .
Now, strain energy due to shear for part 1,
U 1 s = 0 α + γ t 2 t 2 τ 2 2 G b R d θ d y = F i j 2 b R G I 2 t 5 480 { ( α + γ ) + ( s i n 2 α s i n 2 γ 2 } .
So, using Castigliano’s second theorem,
δ 1 s h = U 1 s F i j = F i j R ( 1 + ν s ) E s I t 2 10 { ( α + γ ) + ( s i n 2 α s i n 2 γ 2 } .
Again, strain energy due to bending for part 1 is given by,
U 1 b = 0 α + γ M θ 2 R d θ 2 E s I = F i j 2 R 3 2 E s I [ ( α + γ ) 2 ) + s i n 2 α + s i n 2 γ 4 + s i n γ c o s γ + γ c o s 2 γ 4 ] .
So, using Castigliano’s second theorem,
δ 1 b h = F i j R 3 E s I [ ( α + γ ) 2 ) + s i n 2 α + s i n 2 γ 4 + s i n γ c o s γ + γ c o s 2 γ 4 ] .
Now,
δ 1 h = δ 1 s h + δ 1 b h .
Part 2:
Shear stress distribution on part 2 at any given x=x is given by,
τ = F i j 2 I ( t 2 4 y 2 ) c o s α .
Strain energy due to shear on part 2 is,
U 2 s = t 2 t 2 0 2 R τ 2 2 G b d y d x = F i j 2 R t 2 5 E s I c o s 2 α ( 1 + ν s ) .
So, using Castigliano’s second theorem,
δ 2 s h = U 2 s F i j = 2 F i j R t 2 ( 1 + ν s ) c o s 2 α 5 E s I .
On the other hand, the strain energy due to bending in part 2 is,
U 2 b = 0 2 R M x 2 d x 2 E s I = F i j 2 R 3 c o s 2 α 3 E s I .
So, using Castigliano’s second theorem,
δ 2 b h = U 2 b F i j = 2 F i j R 3 c o s 2 α 3 E s I .
Now,
δ 2 h = δ 2 s h + δ 2 v h .
left and right struts:
The left and right struts deform axially in a similar manner, so the axial deflection of the left strut is,
δ t a = F i j t 1 b t E s .
Total axial deflection of the left and right struts, δ a = δ l a + δ r a = 2 δ l a , where δ r a is the axial deflection of the right strut, δ l a is the axial deflection of the left strut, and δ l a = δ r a .
Total Deflection of RUCE:
Total horizontal deflection of a RUCE in i t h row and j t h column in the structure is,
( Δ h ) i j = 2 δ 1 h + δ 2 h + δ t a = 2 F i j R 3 E s I [ { ( α + γ ) 2 + s i n γ c o s γ + γ c o s 2 γ 4 + 1 3 c o s 2 α } + t 2 10 R 2 ( 1 + ν s ) { ( α + γ ) ( s i n 2 α s i n 2 γ 2 + 2 c o s 2 α } + 1 12 t 1 R ( t R ) 2 ] .
RUCE to Entire System:
Figure A5. Assembly of RUCEs to obtain entire system
Preprints 109914 g0a5
The method of assembly is given in Figure A5. First, RUCEs in one column are combined, and then multiple columns are assembled to get the entire system.
So,
( Δ h ) i = j = 1 n ( Δ h ) i j .
Now, it is known that the force on all the RUCEs in a single column is the same, or along the column same force is experienced by all RUCEs, i.e., F j F i j . So,
( Δ h ) i = n ( Δ h ) i j = 2 F i j R 3 E s I [ { ( α + γ ) 2 + s i n γ c o s γ + γ c o s 2 γ 4 + 1 3 c o s 2 α } + t 2 10 R 2 ( 1 + ν s ) { ( α + γ ) ( s i n 2 α s i n 2 γ 2 + 2 c o s 2 α } + 1 12 t 1 R ( t R ) 2 ] ,
as there are m RUCEs in a column. For simplification, it is assumed that,
c 1 = 2 R 3 I [ { ( α + γ ) 2 + s i n γ c o s γ + γ c o s 2 γ 4 + 1 3 c o s 2 α } + t 2 10 R 2 ( 1 + ν s ) { ( α + γ ) ( s i n 2 α s i n 2 γ 2 + 2 c o s 2 α } + 1 12 t 1 R ( t R ) 2 ] .
So,
( Δ h ) i = n F i c 1 / E s .
It is known that all the columns deform equally, and this is equal to the total deflection of the entire structure, i.e., Δ h = ( Δ h ) i . To achieve static equilibrium, the following must be true-
F 1 = i = 1 m F j = m F j = m E s n c 1 Δ h .
Again, σ = F 1 L 0 b and ϵ = Δ v 2 n ( R s i n γ + t 1 ) . So, effective transverse elastic modulus, E l o n g = σ ϵ . It should be noted that all cross sections are rectangular with I = b t 3 12 . Putting all of these in the equation, it is obtained that,
E l o n g = 2 m R E s L 0 b ( s i n γ + t 1 R ) 1 c 1 .
Vertical Deflection of RUCE:
Figure A6. Deformed (a)part 1 or 3 and (b) part 2 of RUCE: continuous line represents undeformed situation and dashed line represents deformed situation
Preprints 109914 g0a6
The total horizontal deflection of a RUCE,
Δ h = δ 2 h + 2 δ 1 h .
and the total vertical deflection of a RUCE,
Δ v = δ 2 v + 2 δ 1 v .
It can be said from Figure A6 that,
l 1 = 2 R s i n ( α 2 ) ,
and
l 2 = 2 R s i n ( α + γ 2 ) ,
and
l 3 = 2 R .
So,
δ 1 v = l 1 [ s i n ( α ) s i n ( α ζ ) ] .
Again,
δ 1 h = l 2 [ c o s ( γ α 2 ) c o s ( γ α 2 + ζ ) ] .
From here, the value of ζ is obtained as,
ζ = c o s 1 [ c o s ( γ α 2 ) δ 1 h l 2 ] γ α 2 .
Similarly, l 3 = 2 R . Now, from Figure A6(b), it can be said that,
δ 2 v = l 3 [ c o s ( α ) c o s ( α + θ ) ] .
Further,
δ 2 h = l 3 [ c o s ( π 2 α θ ) c o s ( π 2 α ) ] = l 3 [ s i n ( α + θ ) s i n ( α ) ] .
From here, θ can be evaluated.
θ = s i n 1 [ s i n α + δ 2 h l 3 ] α .
So, from equation A25, it is obtained that,
Δ v = 2 R [ c o s α c o s ( α + θ ) ] + 2 R s i n α 2 [ s i n α s i n ( α ζ ) ] .
A.1.3. Poisson’s Ratio Calculation:
( ϵ x ) i j = ( Δ h ) i j 2 ( R s i n γ + t 1 ) ,
and
( ϵ y ) i j = ( Δ v ) i j 2 ( R + t 1 ) ,
where x is along the horizontal direction, and y is along the vertical direction, as mentioned in Figure 2. Finally, Poisson’s Ratio for one RUCE is obtained as,
( ν y x ) i j = ( ϵ y ) i j ( ϵ x ) i j .
W = n ( 2 R s i n γ + 2 t 1 ) (notice), L = m ( 2 R + 2 t 1 ) ; where, L i j = 2 R + 2 t 1 and W i j = 2 R s i n γ + 2 t 1 .
Now, the vertical deflection of the mid-plane of the S-structure is considered in the expression of the Poisson’s ratio. Hence, for a column,
( ϵ x ) i W 2 = ( ϵ ¯ x ) i j W j n 2 ,
where ( ϵ ¯ x ) i j is strain in x direction averaged over n 2 RUCEs; or,
( ϵ y ) i ( ν y x ) i W 2 = ( ϵ y ) i j ( ν ¯ y x ) i j n W j 2 .
As we know, W = n W i j , and we assume that ( ϵ y ) i = ( ϵ ¯ y ) i j , where ( ϵ ¯ y ) i j is the average strain of the unit cells in the ` i t h ’ row in the y-direction. upon putting these values in the expression, it is obtained that,
( ν y x ) i = ( ν ¯ y x ) i j .
It must be noted that
( ν ¯ y x ) i j = ( ϵ ¯ y ) i j ( ϵ ¯ x ) i j .
Further, it is assumed that
( ν ¯ y x ) i j = c 1 ( ν y x ) i j + c 2 ,
and the total contraction of the mid-plane is obtained as,
( ϵ ¯ y ) L = i = 1 m ( ϵ y ) i L i .
Or,
( ν e q ) y x ( ϵ ¯ x ) L = i = 1 m ( ν y x ) i ( ϵ x ) i L i ,
where ( ν e q ) y x , ( ϵ ¯ x ) and ( ϵ ¯ y ) are Poisson’s ratio, strain along x direction and strain along y-direction of the mid-plane of the overall structure. It is known that all the columns deflect by the same distance or all columns have the same strain in the x-direction, i.e.,
( ϵ ¯ x ) = ( ϵ x ) i .
Now,
( ν e q ) y x = i = 1 m ( ν ¯ y x ) i j L i L .
Or,
( ν e q ) y x = ( ν ¯ y x ) i j i = 1 m L i L ,
as ( ν ¯ y x ) i j is the same for every column. Now,
i = 1 m L i = L .
So,
( ν e q ) y x = ( ν ¯ y x ) i j = c 1 ( ν y x ) i j + c 2 .
Where ( ν e q ) y x is dependent on Δ h .

References

  1. Guo, M.F.; Yang, H.; Ma, L. 3D lightweight double arrow-head plate-lattice auxetic structures with enhanced stiffness and energy absorption performance. Composite Structures 2022, 290, 115484. [Google Scholar] [CrossRef]
  2. Schaedler, T.A.; Carter, W.B. Architected cellular materials. Annual Review of Materials Research 2016, 46, 187–210. [Google Scholar] [CrossRef]
  3. Francisco, M.B.; Pereira, J.L.J.; Oliver, G.A.; Roque da Silva, L.R.; Cunha Jr, S.S.; Gomes, G.F. A review on the energy absorption response and structural applications of auxetic structures. Mechanics of Advanced Materials and Structures 2022, 29, 5823–5842. [Google Scholar] [CrossRef]
  4. Li, T.; Liu, F.; Wang, L. Enhancing indentation and impact resistance in auxetic composite materials. Composites Part B: Engineering 2020, 198, 108229. [Google Scholar] [CrossRef]
  5. Huang, C.; Chen, L. Negative Poisson’s ratio in modern functional materials. Advanced Materials 2016, 28, 8079–8096. [Google Scholar] [CrossRef] [PubMed]
  6. Lim, T.; Alderson, A.; Alderson, K. Experimental studies on the impact properties of auxetic materials. physica status solidi (b) 2014, 251, 307–313. [Google Scholar] [CrossRef]
  7. Novak, N.; Plesec, V.; Harih, G.; Cupar, A.; Kaljun, J.; Vesenjak, M. Development, fabrication and mechanical characterisation of auxetic bicycle handlebar grip. Scientific reports 2023, 13, 8158. [Google Scholar] [CrossRef] [PubMed]
  8. Blakey-Milner, B.; Gradl, P.; Snedden, G.; Brooks, M.; Pitot, J.; Lopez, E.; Leary, M.; Berto, F.; Du Plessis, A. Metal additive manufacturing in aerospace: A review. Materials & Design 2021, 209, 110008. [Google Scholar]
  9. Shirzad, M.; Zolfagharian, A.; Bodaghi, M.; Nam, S.Y. Auxetic metamaterials for bone-implanted medical devices: recent advances and new perspectives. European Journal of Mechanics-A/Solids 2022, 104905. [Google Scholar] [CrossRef]
  10. Lvov, V.A.; Senatov, F.S.; Veveris, A.A.; Skrybykina, V.A.; Díaz Lantada, A. Auxetic metamaterials for biomedical devices: Current Situation, main challenges, and research trends. Materials 2022, 15, 1439. [Google Scholar] [CrossRef]
  11. Zhang, X.; Yang, D. Mechanical properties of auxetic cellular material consisting of re-entrant hexagonal honeycombs. Materials 2016, 9, 900. [Google Scholar] [CrossRef] [PubMed]
  12. Ghavidelnia, N.; Bodaghi, M.; Hedayati, R. Idealized 3D auxetic mechanical metamaterial: an analytical, numerical, and experimental study. Materials 2021, 14, 993. [Google Scholar] [CrossRef] [PubMed]
  13. Xue, Y.; Gao, P.; Zhou, L.; Han, F. An enhanced three-dimensional auxetic lattice structure with improved property. Materials 2020, 13, 1008. [Google Scholar] [CrossRef] [PubMed]
  14. Liu, R.; Yao, G.; Xu, Z.; Yu, Z.; Zhang, Z.; Han, C.; Li, H.; Jiang, S. Study on quasi-static mechanical properties of novel reentrant structures with multiple energy dissipation. Thin-Walled Structures 2022, 177, 109442. [Google Scholar] [CrossRef]
  15. Qi, C.; Jiang, F.; Remennikov, A.; Pei, L.Z.; Liu, J.; Wang, J.S.; Liao, X.W.; Yang, S. Quasi-static crushing behavior of novel re-entrant circular auxetic honeycombs. Composites Part B: Engineering 2020, 197, 108117. [Google Scholar] [CrossRef]
  16. Ben-Yelun, I.; Gómez-Carano, G.; San Millán, F.J.; Sanz, M.Á.; Montáns, F.J.; Saucedo-Mora, L. GAM: General Auxetic Metamaterial with Tunable 3D Auxetic Behavior Using the Same Unit Cell Boundary Connectivity. Materials 2023, 16, 3473. [Google Scholar] [CrossRef]
  17. Zhang, W.; Yin, H.; Wu, Y.; Jin, Q.; Wu, L.; Wen, G.; Liu, J.; Wu, X. A Novel Auxetic 3D Lattice Structure for Enhancing Energy Absorption. Composite Structures 2023, 117620. [Google Scholar] [CrossRef]
  18. Mazur, E.; Shishkovsky, I. Additively manufactured hierarchical auxetic mechanical metamaterials. Materials 2022, 15, 5600. [Google Scholar] [CrossRef] [PubMed]
  19. Tatlıer, M.S.; Öztürk, M.; Baran, T. Linear and non-linear in-plane behaviour of a modified re-entrant core cell. Engineering Structures 2021, 234, 111984. [Google Scholar] [CrossRef]
  20. Zhang, X.; Hao, H.; Tian, R.; Xue, Q.; Guan, H.; Yang, X. Quasi-static compression and dynamic crushing behaviors of novel hybrid re-entrant auxetic metamaterials with enhanced energy-absorption. Composite Structures 2022, 288, 115399. [Google Scholar] [CrossRef]
  21. Elipe, J.C.Á.; Lantada, A.D. Comparative study of auxetic geometries by means of computer-aided design and engineering. Smart materials and structures 2012, 21, 105004. [Google Scholar] [CrossRef]
  22. Zhang, W.; Zhao, S.; Scarpa, F.; Wang, J.; Sun, R. In-plane mechanical behavior of novel auxetic hybrid metamaterials. Thin-Walled Structures 2021, 159, 107191. [Google Scholar] [CrossRef]
  23. Meena, K.; Singamneni, S. Novel hybrid auxetic structures for improved in-plane mechanical properties via additive manufacturing. Mechanics of Materials 2021, 158, 103890. [Google Scholar] [CrossRef]
  24. Wang, Y.; Zeng, Q.; Wang, J.; Li, Y.; Fang, D. Inverse design of shell-based mechanical metamaterial with customized loading curves based on machine learning and genetic algorithm. Computer Methods in Applied Mechanics and Engineering 2022, 401. [Google Scholar] [CrossRef]
  25. Cui, J.; Zhang, L.; Gain, A.K. A novel auxetic unit cell for 3D metamaterials of designated negative Poisson’s ratio. International Journal of Mechanical Sciences 2023, 260, 108614. [Google Scholar] [CrossRef]
  26. Zhang, C.; Lu, F.; Lin, B.; Ling, X.; Zhu, Y. Analysis on the collapse stress of auxetic tubular anti-tetrachiral structures. European Journal of Mechanics-A/Solids 2023, 105167. [Google Scholar] [CrossRef]
  27. Wang, H.; Lu, Z.; Yang, Z.; Li, X. A novel re-entrant auxetic honeycomb with enhanced in-plane impact resistance. Composite Structures 2019, 208, 758–770. [Google Scholar] [CrossRef]
  28. Chen, Z.; Liu, L.; Gao, S.; Wu, W.; Xiao, D.; Li, Y. Dynamic response of sandwich beam with star-shaped reentrant honeycomb core subjected to local impulsive loading. Thin-Walled Structures 2021, 161, 107420. [Google Scholar] [CrossRef]
  29. Usta, F.; Türkmen, H.S.; Scarpa, F. Low-velocity impact resistance of composite sandwich panels with various types of auxetic and non-auxetic core structures. Thin-Walled Structures 2021, 163, 107738. [Google Scholar] [CrossRef]
  30. An, M.R.; Wang, L.; Liu, H.T.; Ren, F.G. In-plane crushing response of a novel bidirectional re-entrant honeycomb with two plateau stress regions. Thin-Walled Structures 2022, 170, 108530. [Google Scholar] [CrossRef]
  31. Xu, S.; Beynon, J.H.; Ruan, D.; Lu, G. Experimental study of the out-of-plane dynamic compression of hexagonal honeycombs. Composite Structures 2012, 94, 2326–2336. [Google Scholar] [CrossRef]
  32. Venkata, S.P.; Balbi, V.; Destrade, M.; Accoto, D.; Zurlo, G. Programmable wrinkling for functionally-graded auxetic circular membranes. Extreme Mechanics Letters 2023, 63, 102045. [Google Scholar] [CrossRef]
  33. Mukherjee, S.; Adhikari, S. A general analytical framework for the mechanics of heterogeneous hexagonal lattices. Thin-Walled Structures 2021, 167, 108188. [Google Scholar] [CrossRef]
  34. Mukhopadhyay, T.; Adhikari, S. Effective in-plane elastic properties of auxetic honeycombs with spatial irregularity. Mechanics of Materials 2016, 95, 204–222. [Google Scholar] [CrossRef]
  35. Liu, W.; Li, H.; Zhang, J.; Bai, Y. In-plane mechanics of a novel cellular structure for multiple morphing applications. Composite Structures 2019, 207, 598–611. [Google Scholar] [CrossRef]
  36. Guo, M.F.; Yang, H.; Zhou, Y.M.; Ma, L. Mechanical properties of 3D hybrid double arrow-head structure with tunable Poisson’s ratio. Aerospace Science and Technology 2021, 119, 107177. [Google Scholar] [CrossRef]
  37. Meena, K.; Singamneni, S. A new auxetic structure with significantly reduced stress concentration effects. Materials & Design 2019, 173, 107779. [Google Scholar]
  38. Nirmal, R.; Patnaik, B.; Jayaganthan, R. FEM simulation of high speed impact behaviour of additively manufactured AlSi10Mg alloy. Journal of Dynamic Behavior of Materials 2021, 1–16. [Google Scholar] [CrossRef]
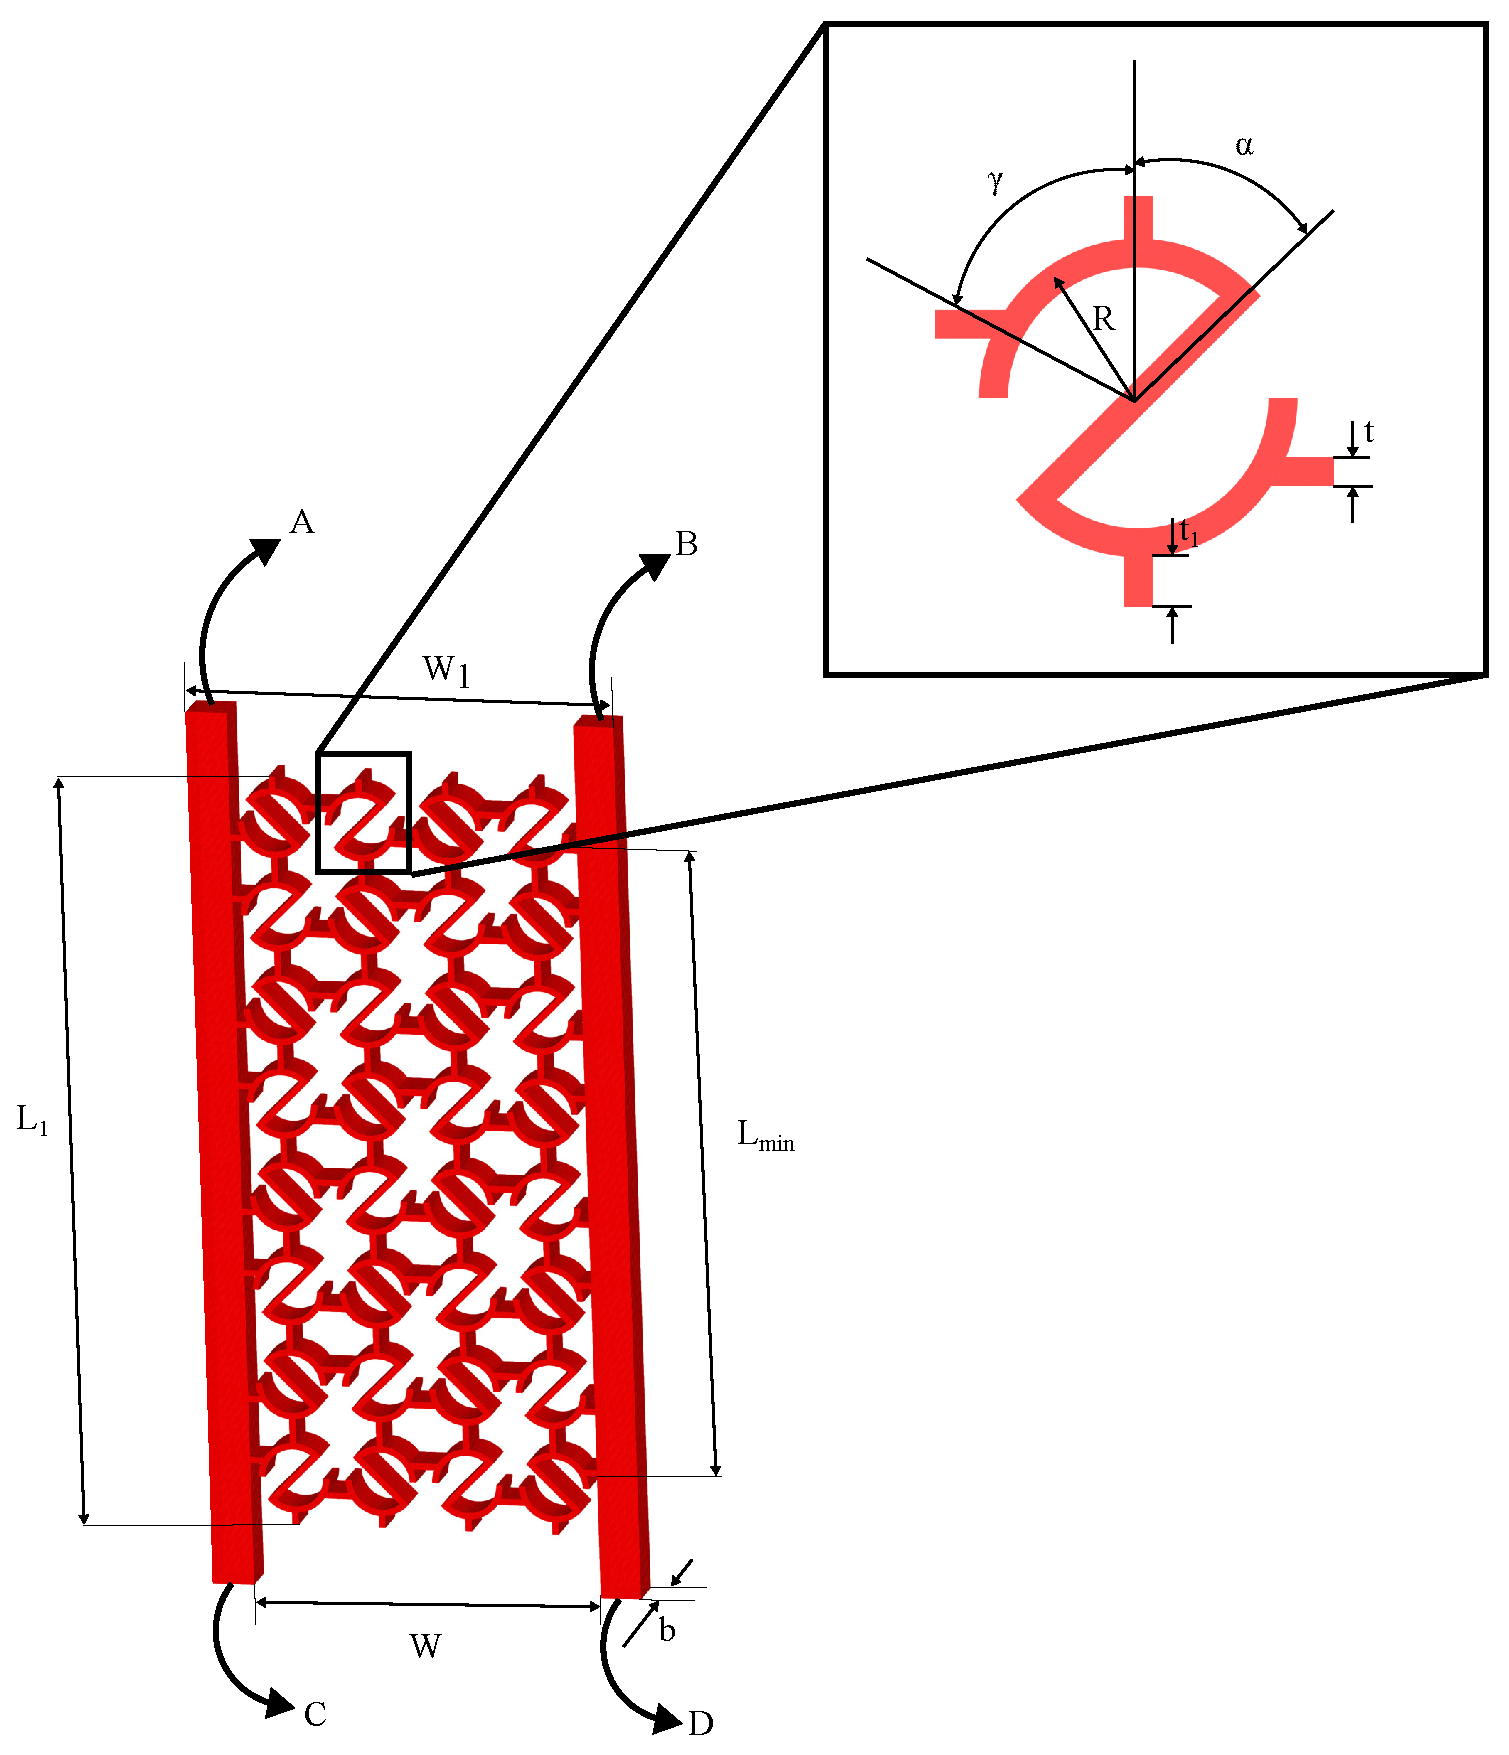
Figure 1. Surfaces A, B, C, and D of S-structure and various dimensions of S-structure and its unit cell
Preprints 109914 g001
Figure 2. Assembly scheme of RUCEs to obtain the entire system under transverse load.
Preprints 109914 g002
Figure 3. Mesh convergence study from (a) force-displacement and (b) Poisson’s ratio-displacement response under transverse load for various approximate global (element) sizes, l.
Preprints 109914 g003
Figure 4. Error in (a) force and (b) NPR calculation vs. approximate global size under transverse load.
Preprints 109914 g004
Figure 5. Mesh of (a) impactor and (b) RUCE of S-structure under transverse loading condition.
Preprints 109914 g005
Figure 6. Comparison between numerical and analytical results | (a) Elastic modulus, numerical (Enum) and analytical (Ea) and (b) Poisson’s ratio, numerical (PRnum) and analytical (PRan).
Preprints 109914 g006
Figure 7. Relationship between Energy absorbed (mJ) and elastic modulus (MPa) from simulation results.
Preprints 109914 g007
Figure 8. Parametric study of auxetic S-structure (a) Elastic modulus (MPa), (b) Poisson’s ratio, (c) relative density and (d) Specific energy absorption (J/kg) for various S-structures.
Preprints 109914 g008
Table 1. Geometric Parameters of S-structure Unit cells
Variations R (in mm) t (in mm) t1 (in mm) α γ b (in mm)
S1 4 0.8 1.5 45 75 5
S2 4 1.6 1.5 45 75 5
S3 4 0.4 1.5 45 75 5
S4 4 0.8 1.5 45 62.5 5
S5 4 0.8 1.5 45 50 5
S6 4 0.8 0.75 45 75 5
S7 4 0.8 1 45 75 5
S8 4 0.8 1.5 30 75 5
S9 4 0.8 1.5 60 75 5
S10 4 0.8 1.5 45 75 2.5
S11 4 0.8 1.5 45 75 3.75
Table 2. Elastic Properties of AlSi10Mg
Material Parameters Values
Density (in kg/ m 3 ) 2700
Elastic Modulus (in GPa) 75
Poisson’s Ratio 0.3
Table 3. Numerical study results for S1 structure for various approximate global size.
l (mm) F 4 (N) NPR(first peak) Absolute error in F 4 (%) Absolute error in NPR (first peak) (%) Time (s) N s t e p s
0.2 695.922 -0.358955 - - 921398 221
0.25 641.015 -0.353701 7.89 1.46 601450 334
0.3 599.039 -0.296 13.92 17.54 245588.2 330
0.35 517.979 -0.394992 25.57 10.04 17926 52
0.4 474.29 -0.371764 31.85 3.57 20280 56
0.45 475.383 -0.374599 31.69 4.36 7742.4 32
0.5 471.711 -0.372856 32.22 3.87 10348 41
Table 4. Dimensions required for numerical and other calculations.
Various S-structure W L W 1 L m i n
S1 46.001 85.678 56.001 81.122
S2 49.092 92.285 59.092 87.135
S3 44.455 82.374 54.455 78.026
S4 43.223 87.463 53.223 79.337
S5 38.965 89.057 48.965 77.743
S6 40.001 75.178 50.001 70.622
S7 42.001 78.678 52.001 74.122
S8 46.001 85.678 56.001 81.122
S9 46.001 85.677 56.001 81.123
S10 46.001 85.678 56.001 81.122
S11 46.001 85.678 56.001 81.122
Table 5. Numerical study results for various S-structures.
Various S-structure E (MPa) PR (first peak) EA (J) SEA (J/kg)
S1 31.17863 -0.354618 0.37 32.37
S2 253.188 -0.313944 1.11 48.73
S3 3.506994 -0.374515 0.28 48.55
S4 29.77344 -0.370364 0.48 42.03
S5 17.4955 -0.255436 0.89 77.95
S6 30.42813 -0.37018 0.36 34.81
S7 30.72542 -0.363079 0.35 32.39
S8 33.47418 -0.267152 0.40 37.84
S9 29.91472 -0.391942 0.46 38.32
S10 16.00413 -0.362093 0.26 44.94
S11 25.03883 -0.361589 0.30 35.31
Disclaimer/Publisher’s Note: The statements, opinions and data contained in all publications are solely those of the individual author(s) and contributor(s) and not of MDPI and/or the editor(s). MDPI and/or the editor(s) disclaim responsibility for any injury to people or property resulting from any ideas, methods, instructions or products referred to in the content.
Copyright: This open access article is published under a Creative Commons CC BY 4.0 license, which permit the free download, distribution, and reuse, provided that the author and preprint are cited in any reuse.
Prerpints.org logo

Preprints.org is a free preprint server supported by MDPI in Basel, Switzerland.

Subscribe

© 2024 MDPI (Basel, Switzerland) unless otherwise stated