1. Introduction
The cell potential generated across the plasma membrane is called the membrane potential. The mechanism by which it is generated has been studied for decades, and nowadays all textbooks describe passive and active transmembrane ion transport, governed by ion channels and the sodium pump, respectively, as the origin of the membrane potential [
1,
2]. This is the so-called membrane theory, one of the most fundamental concepts in physiology today. As its name suggests, the plasma membrane is an essential element in the generation of membrane potential; in fact, it is widely accepted that ion channels and sodium pump are integrated into the plasma membrane. Consequently, the absence of plasma membrane means the absence of ion transporters (ion channels and sodium pump). Consequently, the absence of the plasma membrane means that the membrane potential is an unimaginable event. Hence, the mechanism of membrane potential generation remains a controversial topic in some research groups.
The Association-Induction Hypothesis (AIH) is a long-forgotten physiological theory proposed by the late Gilbert Ling [
1,
2,
3]. AIH suggests that the membrane potential is generated without ion transport across the plasma membrane. The key factor in generating the membrane potential is the heterogeneous spatial distribution of the ions caused by ion adsorption. Consequently, no ion channels or pumps are required for membrane potential generation. The AIH contradicts the membrane theory.
This work was carried out with the aim of disproving the membrane theory and proving that the mechanism of ion adsorption is the mechanism of membrane potential generation, as suggested by the AIH.
2. Theory
First of all, two conflicit mechanisms of membrane potential generation − membrane theory and Assocaition-Induction Hypothesis (AIH) − are detailed here.
2.1. Membrane theory
As mentioned in
Section 1, the membrane theory is the best known and most widely accepted physiological theory. The method states that membrane potential is caused by transmembrane ion transport governed by ion transporters called ion channels and pumps. This mechanism is intuitively well understood and is even mathematically formulated with precision [
4,
5,
6]. Therefore, it is possible to theoretically reproduce the membrane potential. The theoretically predicted potential agrees well with the experimentally measured membrane potential. Although efforts have been made to develop this theory to accurately predict the membrane potential even today [
7,
8,
9], the fundamental part of membrane theory has never been denied or greatly altered. The foundations of membrane theory have remained solid for decades. In fact, researchers in classical physiology recognized that the existence of ion channels had been predicted and then experimentally discovered [
1,
2,
10]. This is the most important triumph of membrane theory. The discovery of the sodium pump is also another well-known proof of the support for membrane theory [
1,
2,
3,
11,
12]. As a result, virtually no one has questioned the membrane theory in mainstream physiology.
2.2. Association-Induction Hypothesis (AIH)
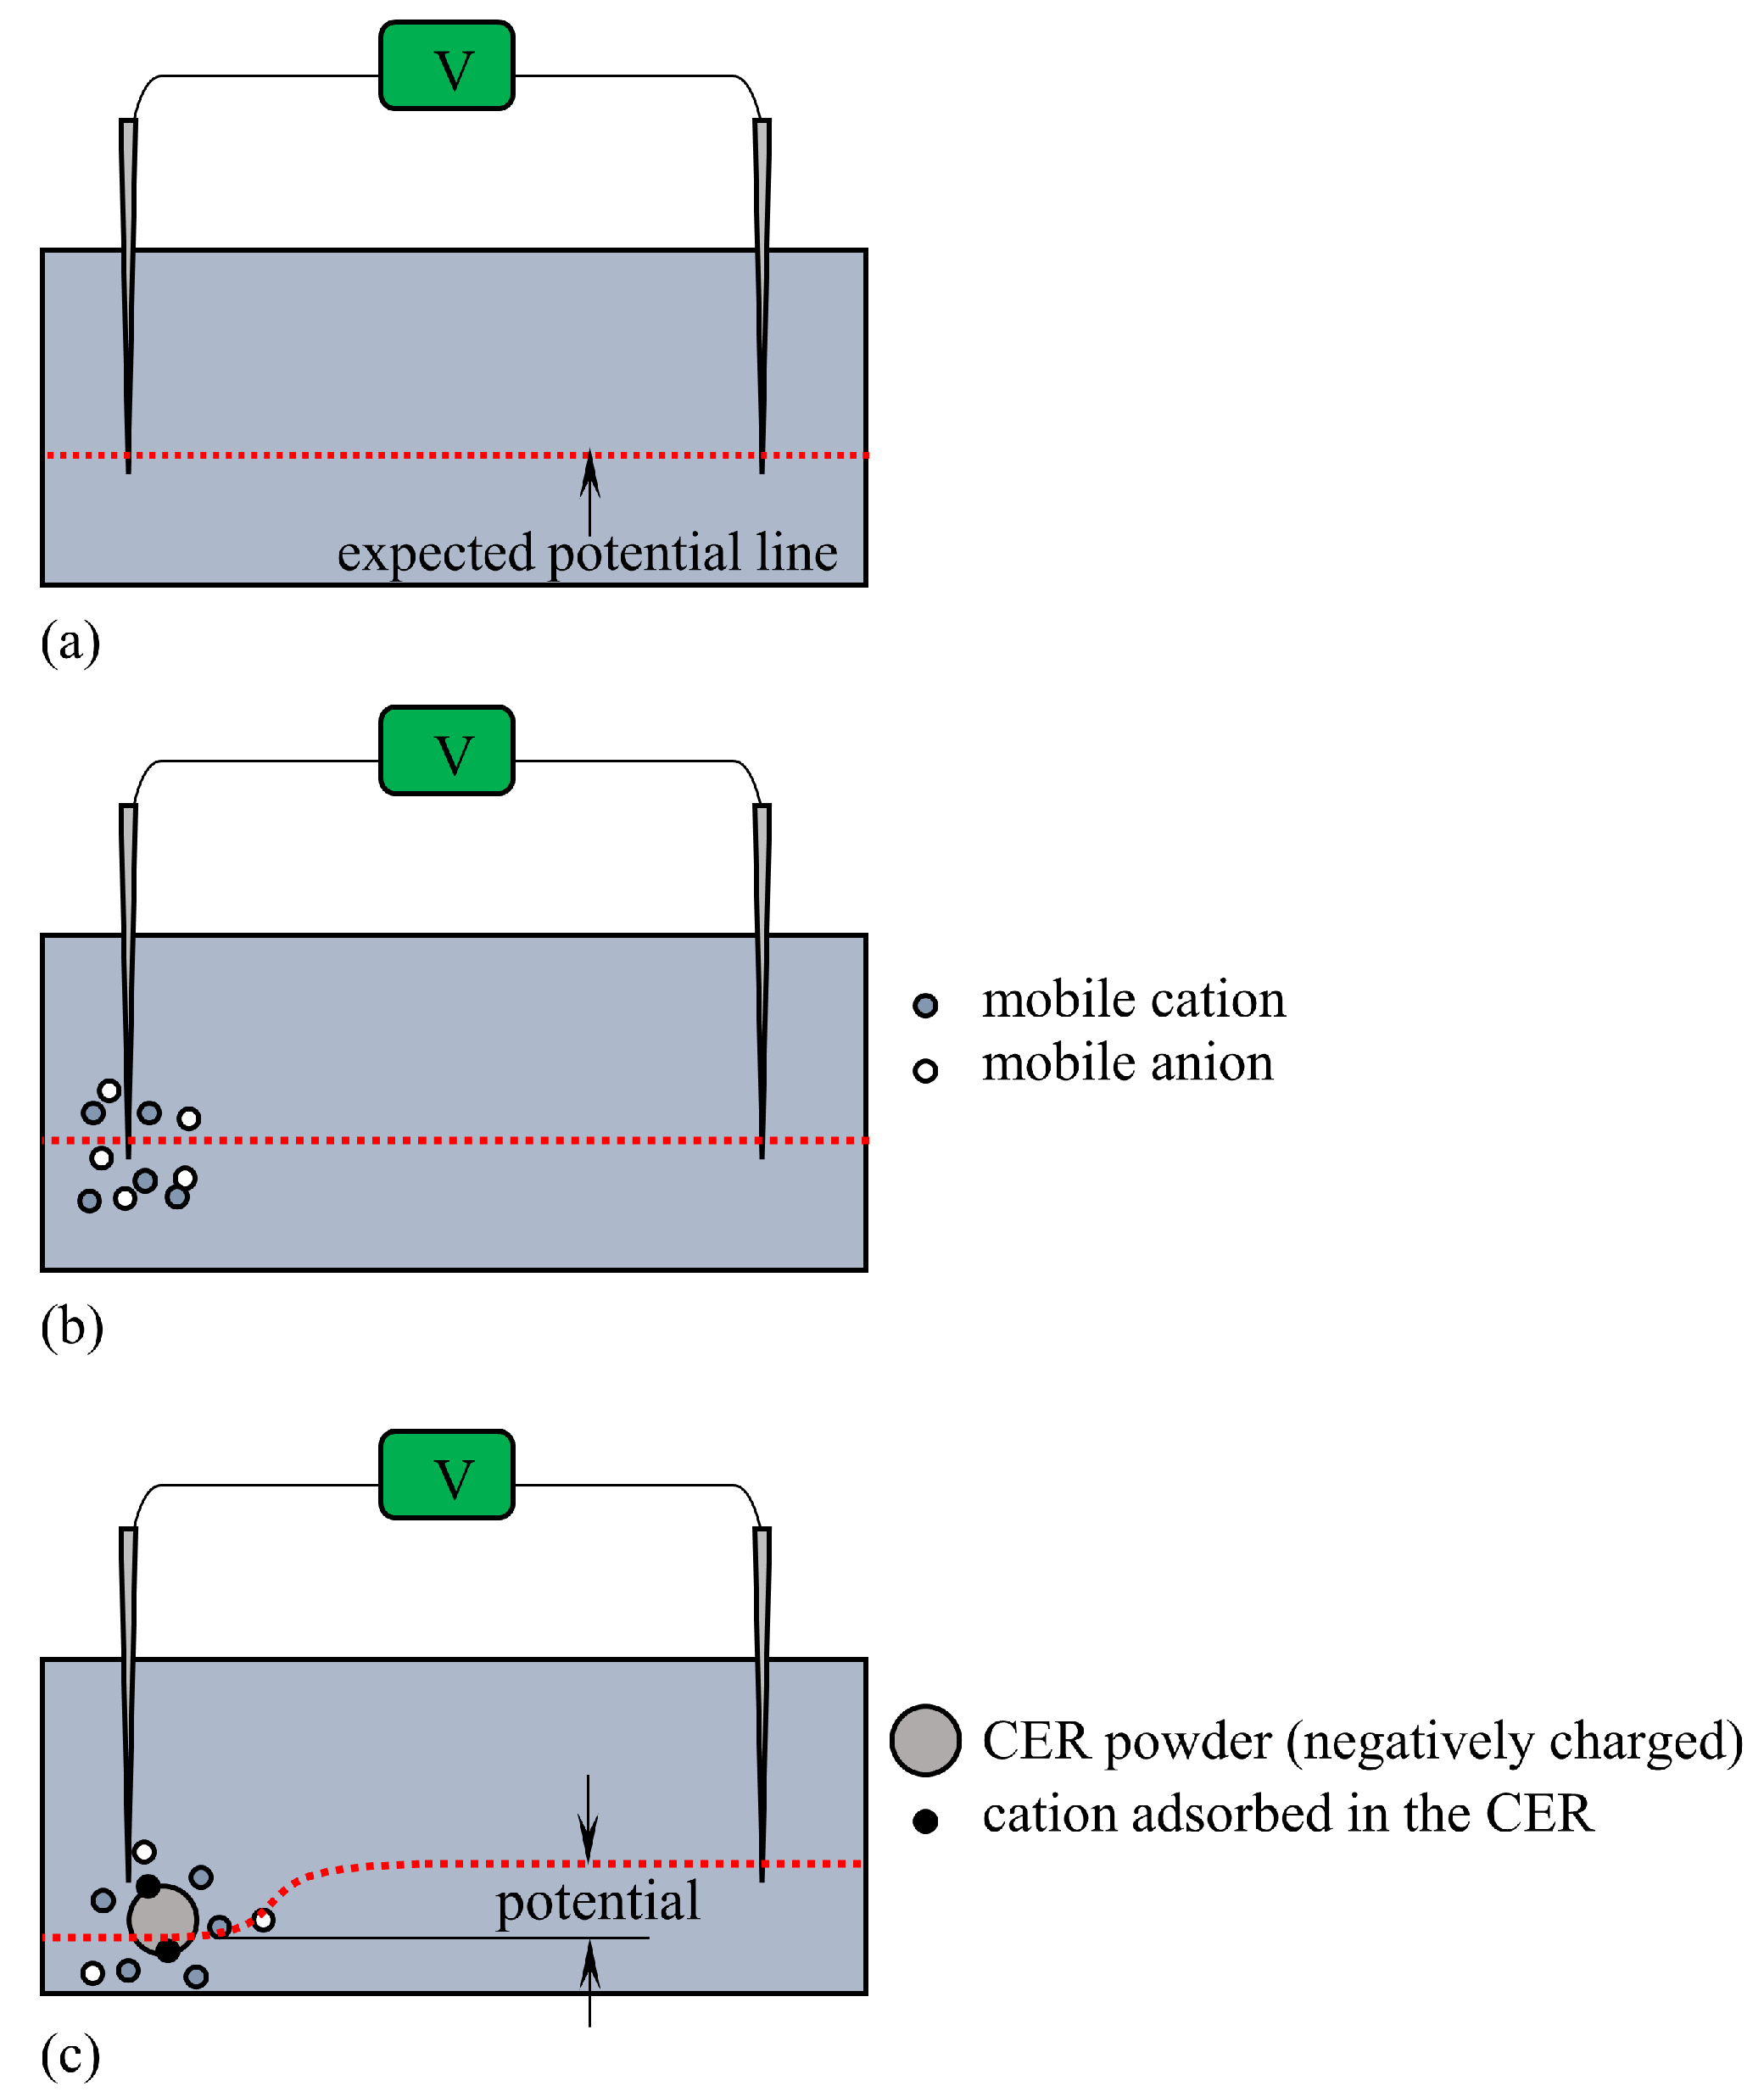
The Association-Induction Hypothesis (AIH) is a completely different theory from the membrane theory. According to this hypothesis, the membrane potential is generated by the heterogeneous spatial distribution of charges as a result of ion adsorption. It is explained in detail here using
Figure 1. Let us assume that mobile cations and anions are homogeneously distributed as shown in
Figure 1(a). Because of the homogeneity of the charge distribution, the potentials generated by the positive charges of the cations and the negative charges of the anions cancel each other out, and the homogeneous potential is formed everywhere. On the other hand, if mobile cations are localized, say they are localized by their adsorption on the inner surface of the plasma membrane, a heterogeneous ion distribution is achieved, as illustrated in
Figure 1 (b). As a result, a heterogeneous potential is generated, and this potential depends on the degree of adsorption (or desorption) of the ions and the location of the ion adsorption sites. This is the membrane potential based on the AIH. This AIH-based explanation is just the basic idea of electromagnetism in physics. The degree of heterogeneity of the ion distribution depends on ion adsorption. Consequently, ion adsorption governs the membrane potential.
The living cell is full of proteins and lipids that carry immobile charges, and these immobile charges can serve as adsorption sites for mobile ions. Adsorption (or desorption) can occur wherever there are adsorption sites for mobile ions. The AIH therefore asserts that the generation of membrane potential does not require the transport of ions across the plasma membrane and that even ion transporters such as ion channels and pumps are not necessary.
Figure 1.
Mobile ion distribution in a cell.
Figure 1.
Mobile ion distribution in a cell.
The AIH is based on the principle of physics. It does not require the existence of ion channels or pumps. Only the basic principles of physics are required. This kind of physics-based theorization of the mechanism of membrane potential generation without ion transporters has been carried out by a small number of researchers to date [
12,
13,
14,
15,
16,
17,
18,
19,
20,
21,
22]. They believe that physiology cannot exist alongside physics. How can we ignore physiology based on physics, and how can we support physiological study in the absence of physics?
We performed the investigation on the membrane potential mechanisms with in mind both the membrane theory and the AIH.
3. Experiment
The protoplasm is viscous in nature. To regard the protoplasm as an ordinary, highly fluid electrolyte solution would be to idealize the living-cell system too far. By treating the living cell in this way, we could be missing out on the fundamental nature of living cells. Not only protoplasm, but also the various facets of a living cell must be over-idealized in today’s physiology. A realistic view of the living cell must be necessary to truly theorize the characteristics of the living cell, including the generation of membrane potential [
1,
2,
11,
12,
13,
14,
15,
16,
17,
18,
19,
20,
21,
22,
23]. The authors of this article therefore decided to use the viscous aqueous solution as an experimental model of protoplasm. We decided to measure the potential of viscous aqueous solutions to elucidate the mechanism of membrane potential generation.
3.1. Potential in aqueous solution without PVA
3.1.1. Potential generated by the addition of KCl solution
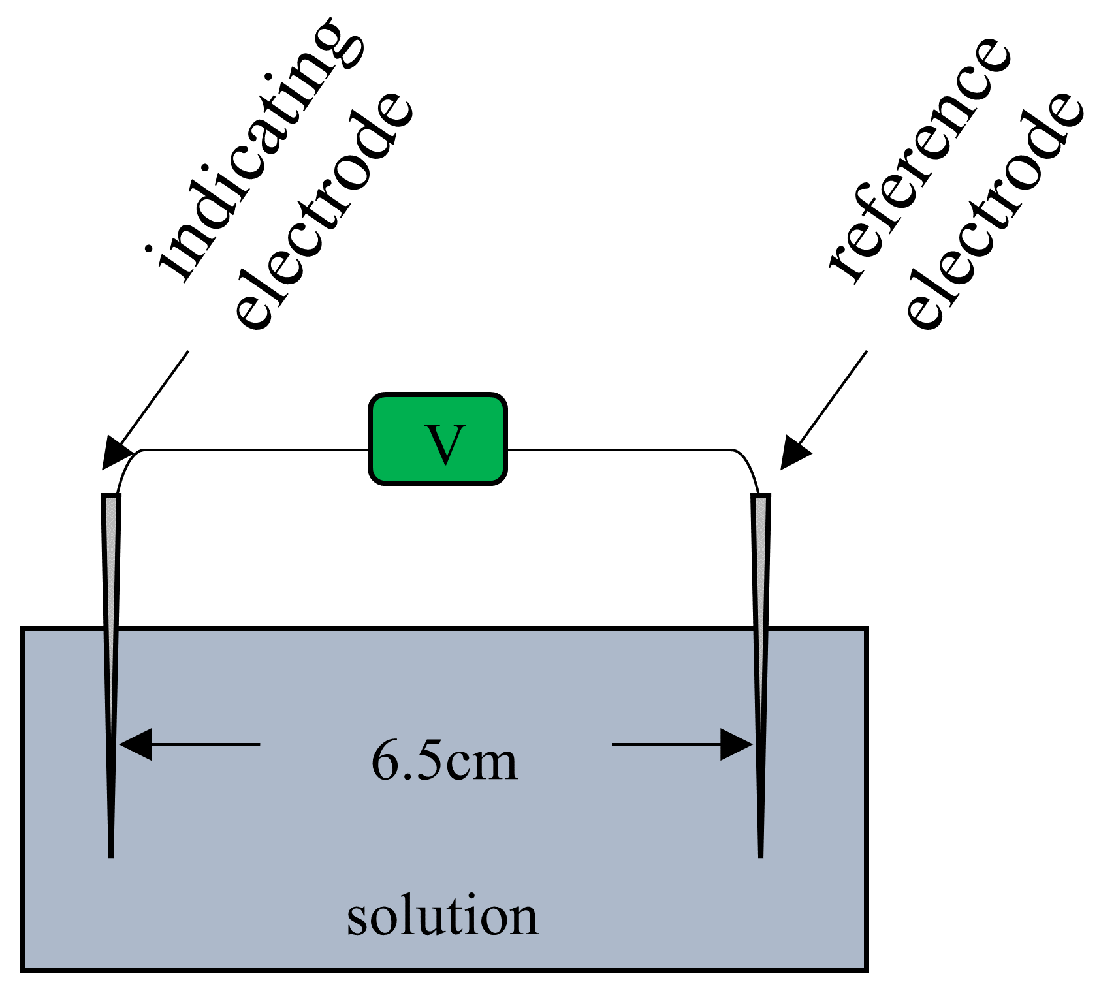
Figure 2 represents the experimental setup. The container of this setup is filled with a solution. Two Ag/AgCl electrodes (an indicating and a reference electrodes) are placed in the solution with 6.5 cm gap between them.
The potential generated between the two electrodes was measured as a function of time following the experimental procedure abstracted in
Table 1.
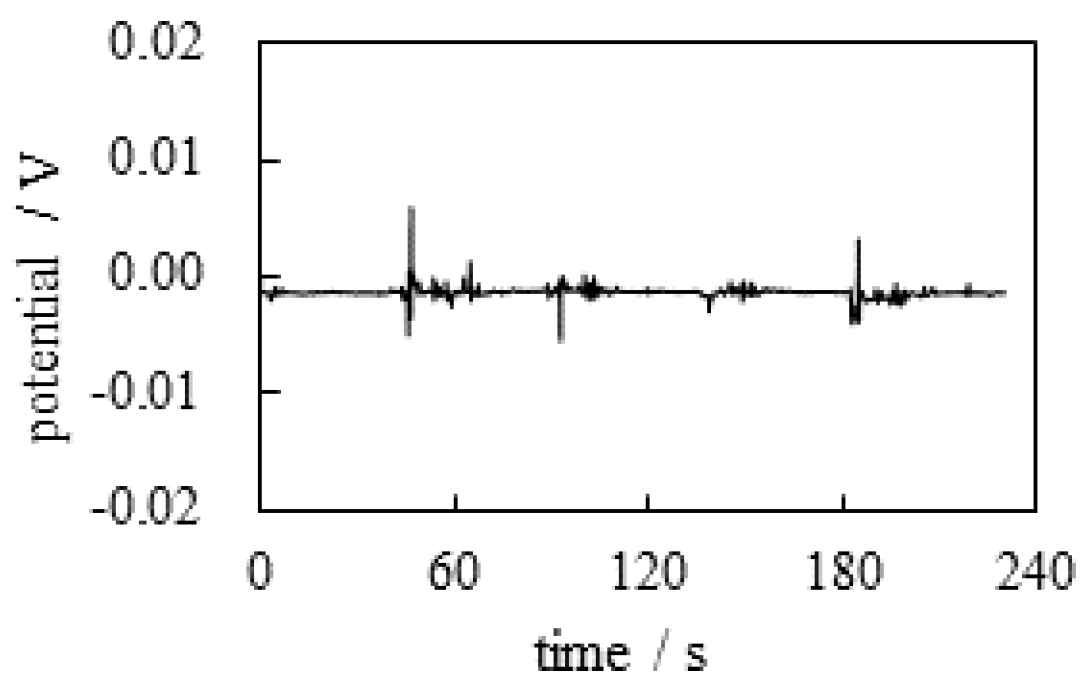
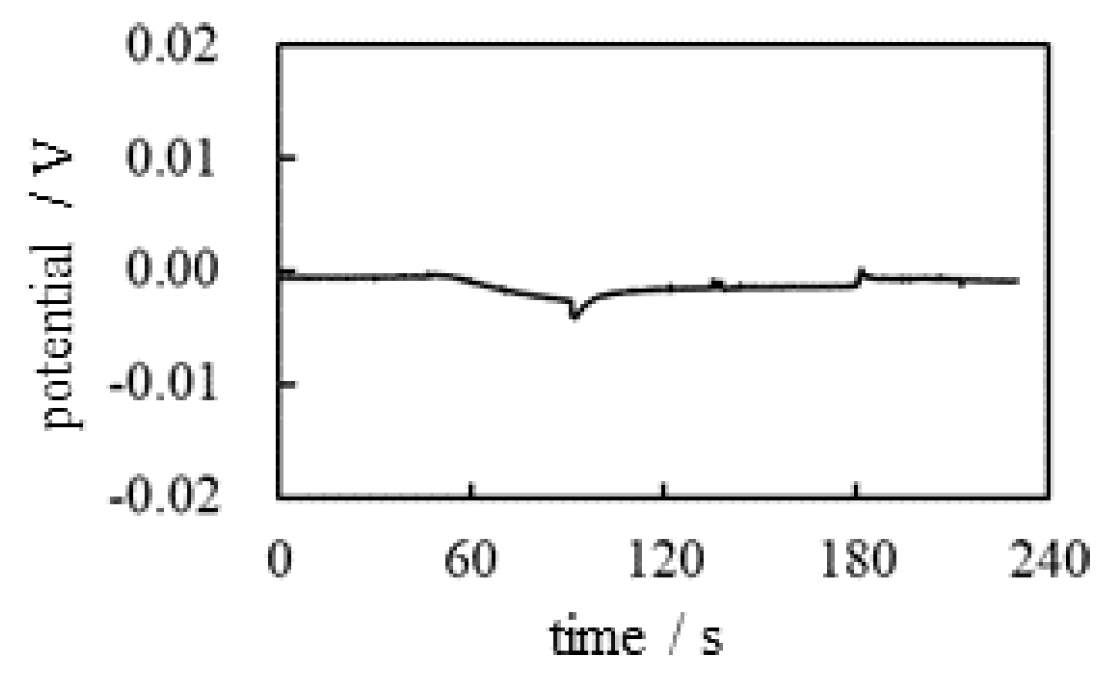
Figure 3 shows the time dependence of the potential generated between the indicating and the reference electrodes (see
Figure 2) under the experimental conditions in
Table 1. Although momentary potential perturbations were observed when the KCl solution was deposited close to the electrodes, the potential remained basically at 0 V.
According to the membrane theory, selective ion transport across the plasma membrane is responsible for generating a nonzero membrane potential. In this experiment , no ion-selective membrane was used. Therefore, the nonzero potential cannot be expected at all. Therefore, the observation of the experimentally observed zero potential is in perfect agreement with the membrane theory.
Table 1.
Procedure of potential measurememt.
Table 1.
Procedure of potential measurememt.
|
t†1 / s |
operation†2
|
|
0 |
onset time of the potential measurement |
| 45 |
addition of a few drops of M KCl solution near the indicating electrode |
| 90 |
addition of a few drops of M KCl solution near the indicating electrode |
| 135 |
addition of a few drops of M KCl solution near the reference electrode |
| 180 |
addition of a few drops of M KCl solution near the reference electrode |
Figure 3.
Time dependence of the potential between the indicating and the reference electrodes.
Figure 3.
Time dependence of the potential between the indicating and the reference electrodes.
3.1.2. Potential generated by the addition of Cation Exchange Resin
The same potential measurement as
was performed according to the experimental procedure summarized in
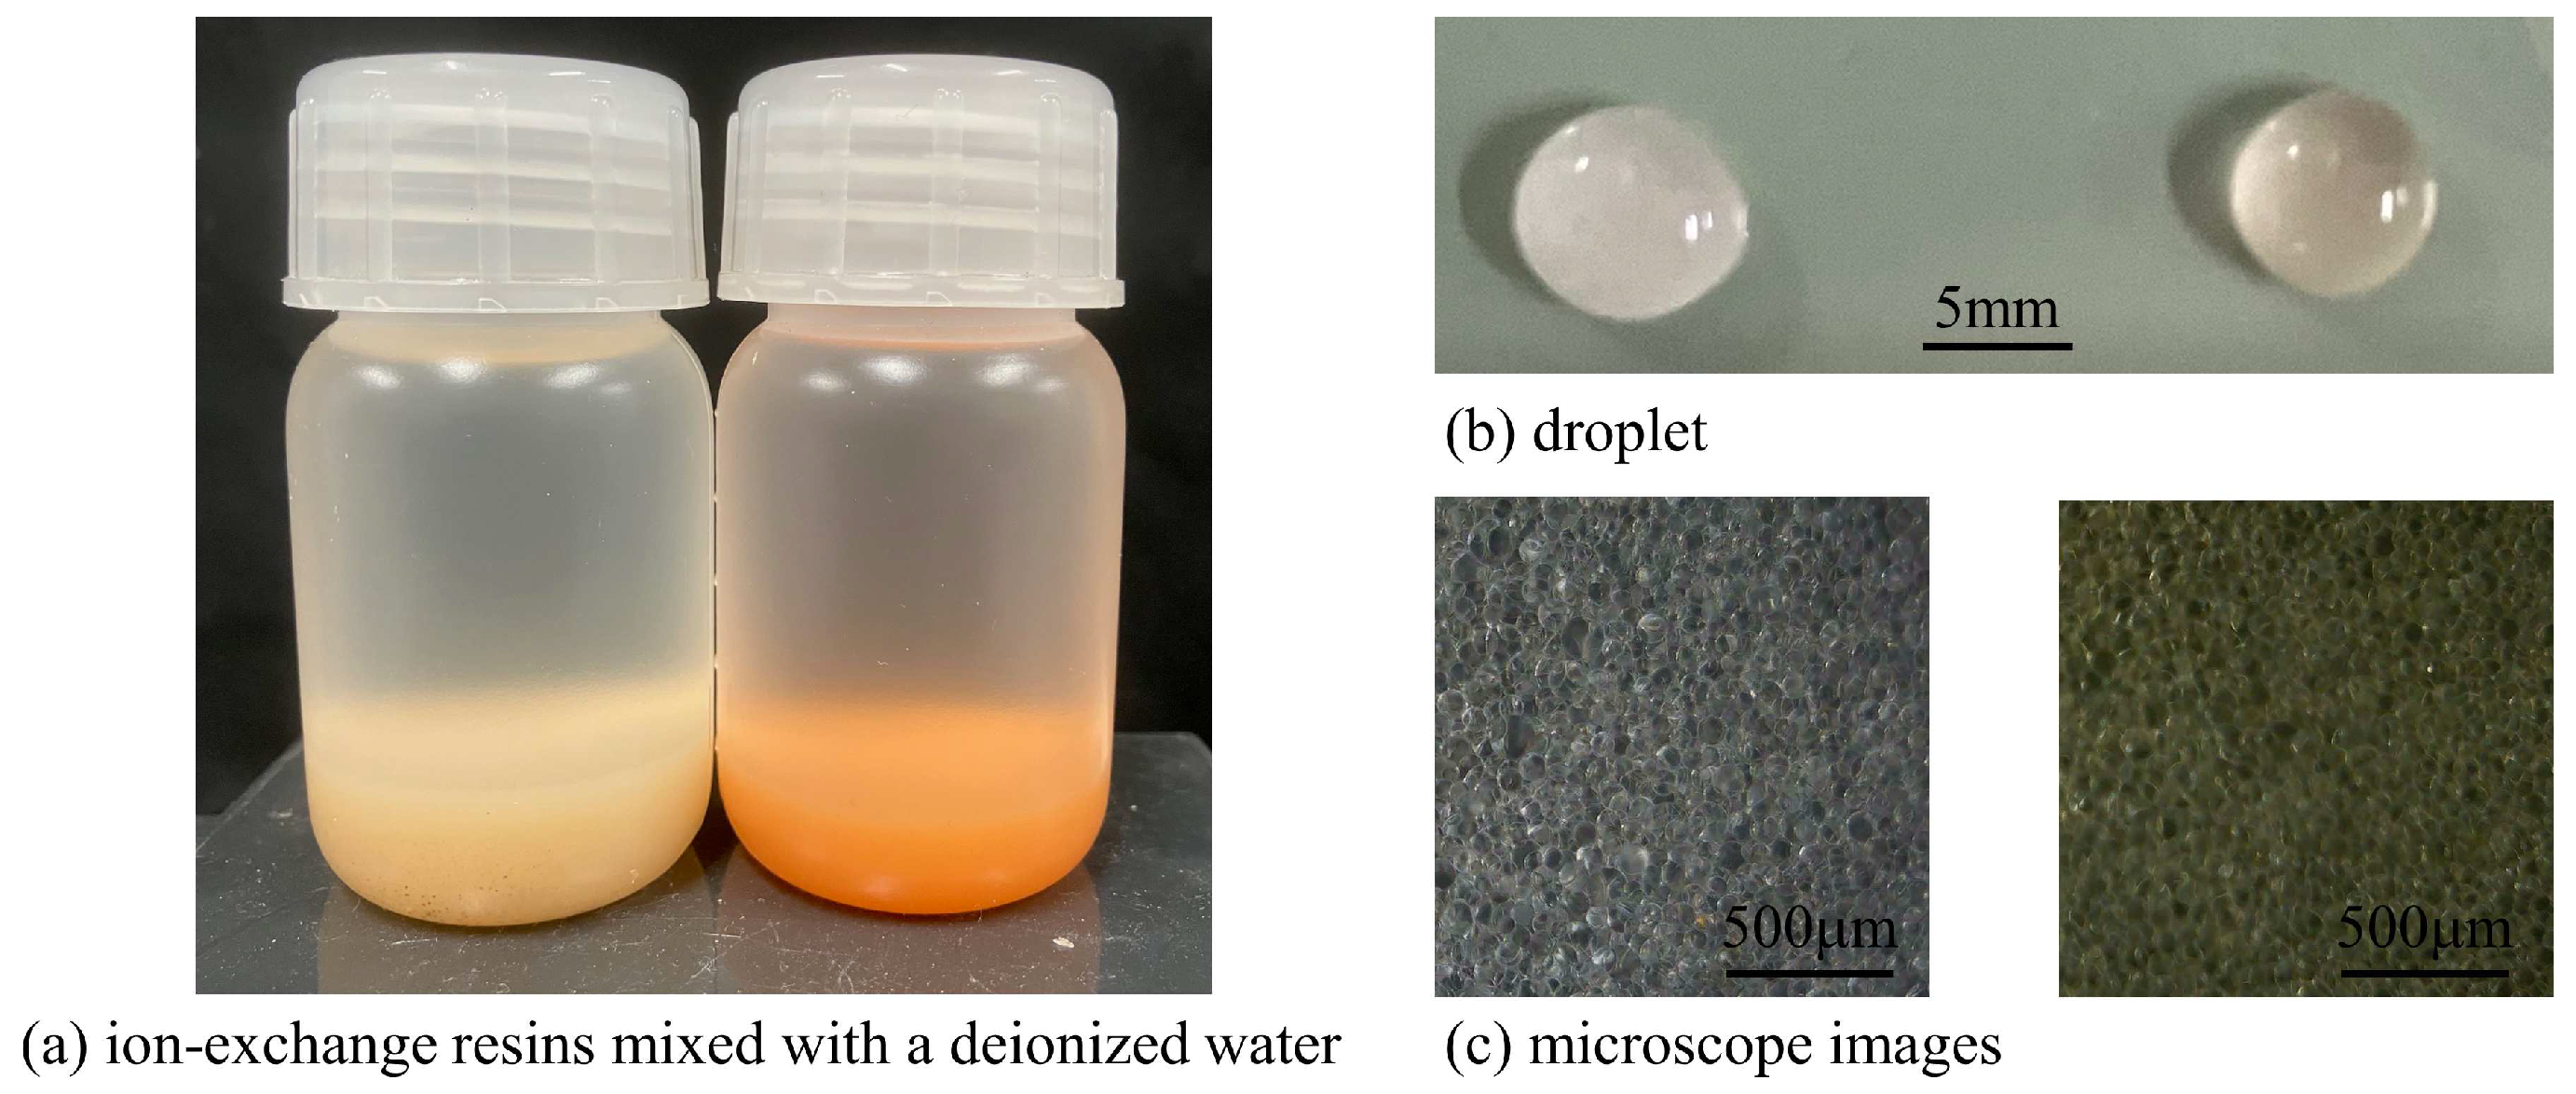
Table 2. In this measurement, Cation-Exchange Resin solution was used and it is the mixture of Cation-Exchange Resin (DOWE X, H form, Dow Chemical Company, Michigan, USA) and a deionized water (see
Figure 4).
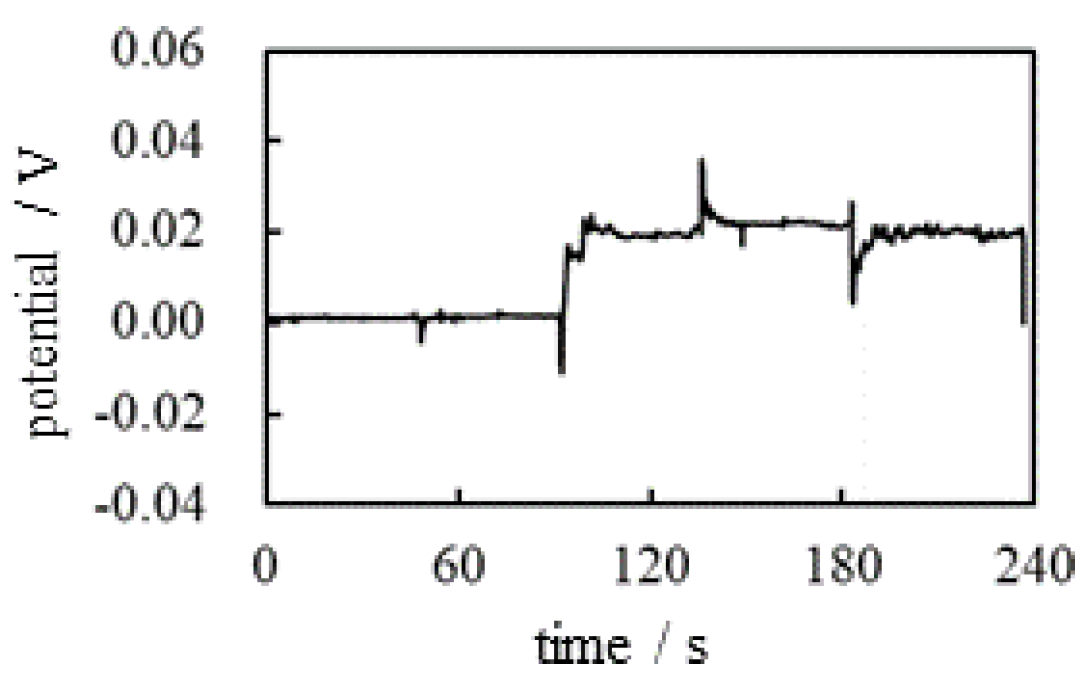
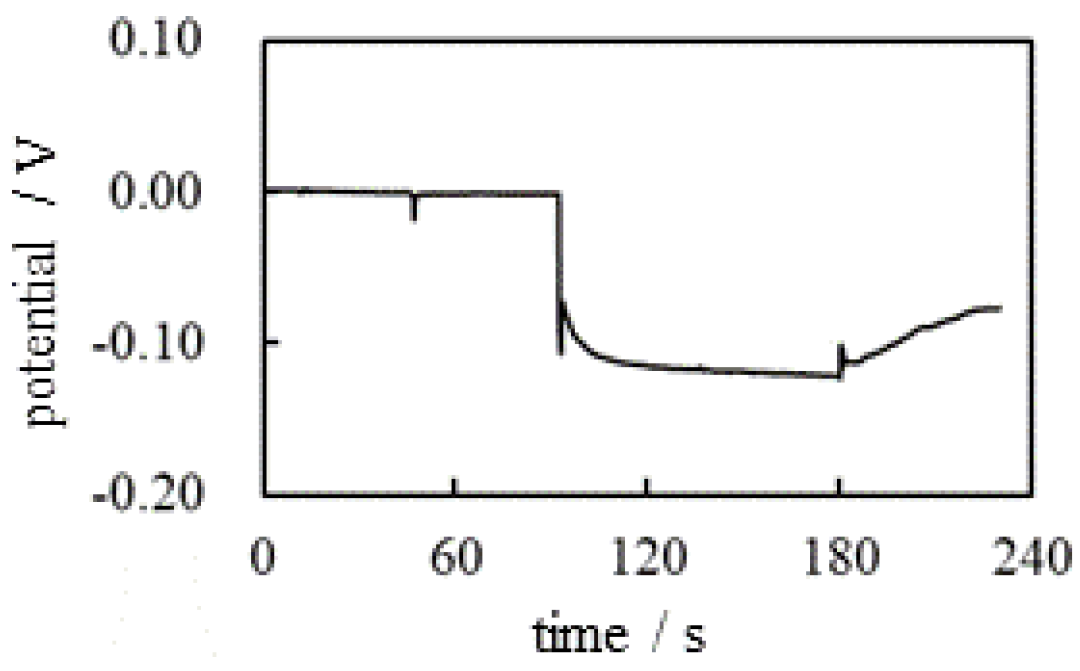
Figure 5 shows the potential versus time (see
Figure 2) under the experimental condition in
Table 2. There is no ion-selective membrane between the indicating and reference electrodes. However, the negative potential was clearly observed after t = 90 s. This nonzero potential cannot be explained by the membrane theory. However, the characteristics of this potential can be easily explained by electromagnetism. There were
and
near the indicating electrode after t = 45 s, but the total charge of
and
is undoubtedly zero, and these ions are in a thermal motion state. Consequently, the potentials generated by the individual ions are canceled, giving zero even after the addition of KCl at t = 45 s (see
Figure 6(a) and (b). However, the Cation Exchange Resin solution (CER solution) added in the vicinity of the indicating electrode at t = 90 s is a powdery macroscopic solid (see
Figure 4(c)), and the CER dissociates into a mobile cation and an immobile anion, as shown in
Figure 6. The non-zero potentials generated by these mobile cations are largely canceled out by the potentials of all other mobile anions in thermal motion. However, the negative charges on the CER powder are virtually immobile, since the CER powder is a visibly large particle. These charges cannot be fully neutralized according to the law of mass action [
24]. Consequently, a negative potential is generated in the vicinity of the indicating electrode. Consequently, the negative potential is generated after t = 90 s.
Table 2.
Procedure of potential measurememt
Table 2.
Procedure of potential measurememt
|
t†1 / s |
operation†2
|
|
0 |
onset time of the potential measurement |
| 45 |
addition of a few drops of M KCl solution near the indicating electrode |
| 90 |
addition of a few drops of CER solution†3 near the indicating electrode |
| 135 |
addition of a few drops of M KCl solution near the reference electrode |
| 180 |
addition of a few drops of CER solution†3 near the reference electrode |
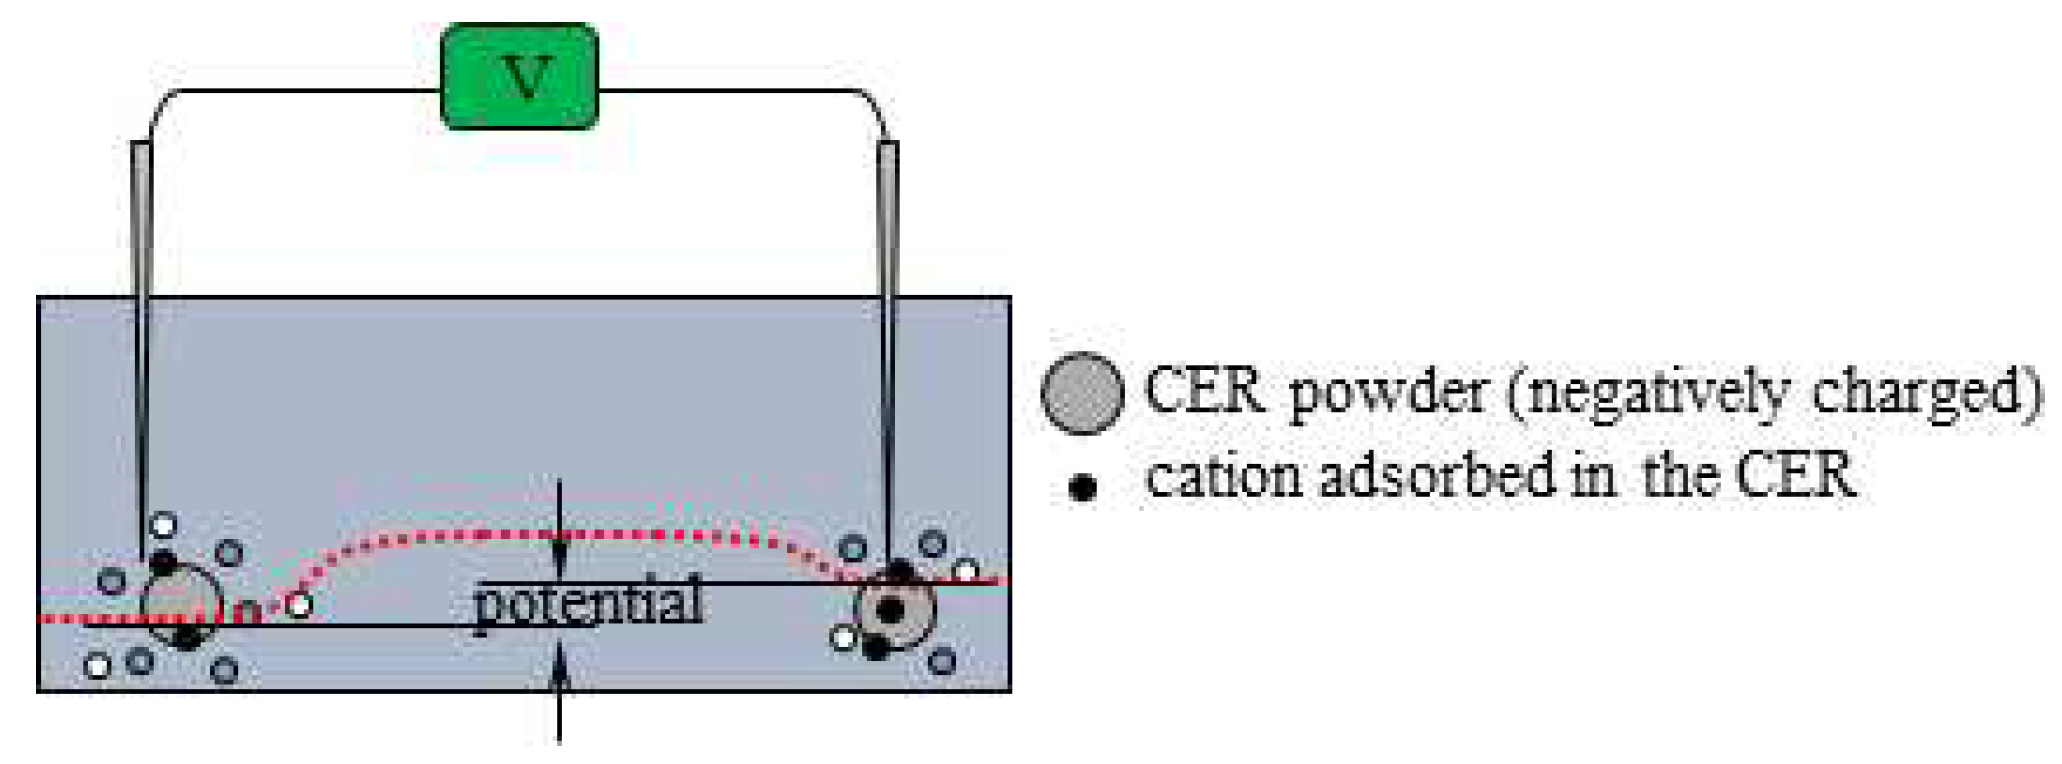
The potential began to increase when CER was added near the reference electrode at t = 180 s. This phenomenon can be explained by the same reason that was used to explain the potential drop at t = 90 s. Namely, the potential drop at t = 180 s is due to immobile negative charges of the CER added in proximity to the reference electrode as illustrated in
Figure 7.
3.1.3. Potential generated by the addition of Anion Exchange Resin
The same potential measurement as
was performed according to the experimental procedure summarized in
Table 3 where Anio-Exchange Resin (AER) was used instead of CER, and the AER solution is the mixture of Anion-Exchange Resin (DOWE X, Cl form, Dow Chemical Company, Michigan, USA) and a deionized water (see
Figure 4).
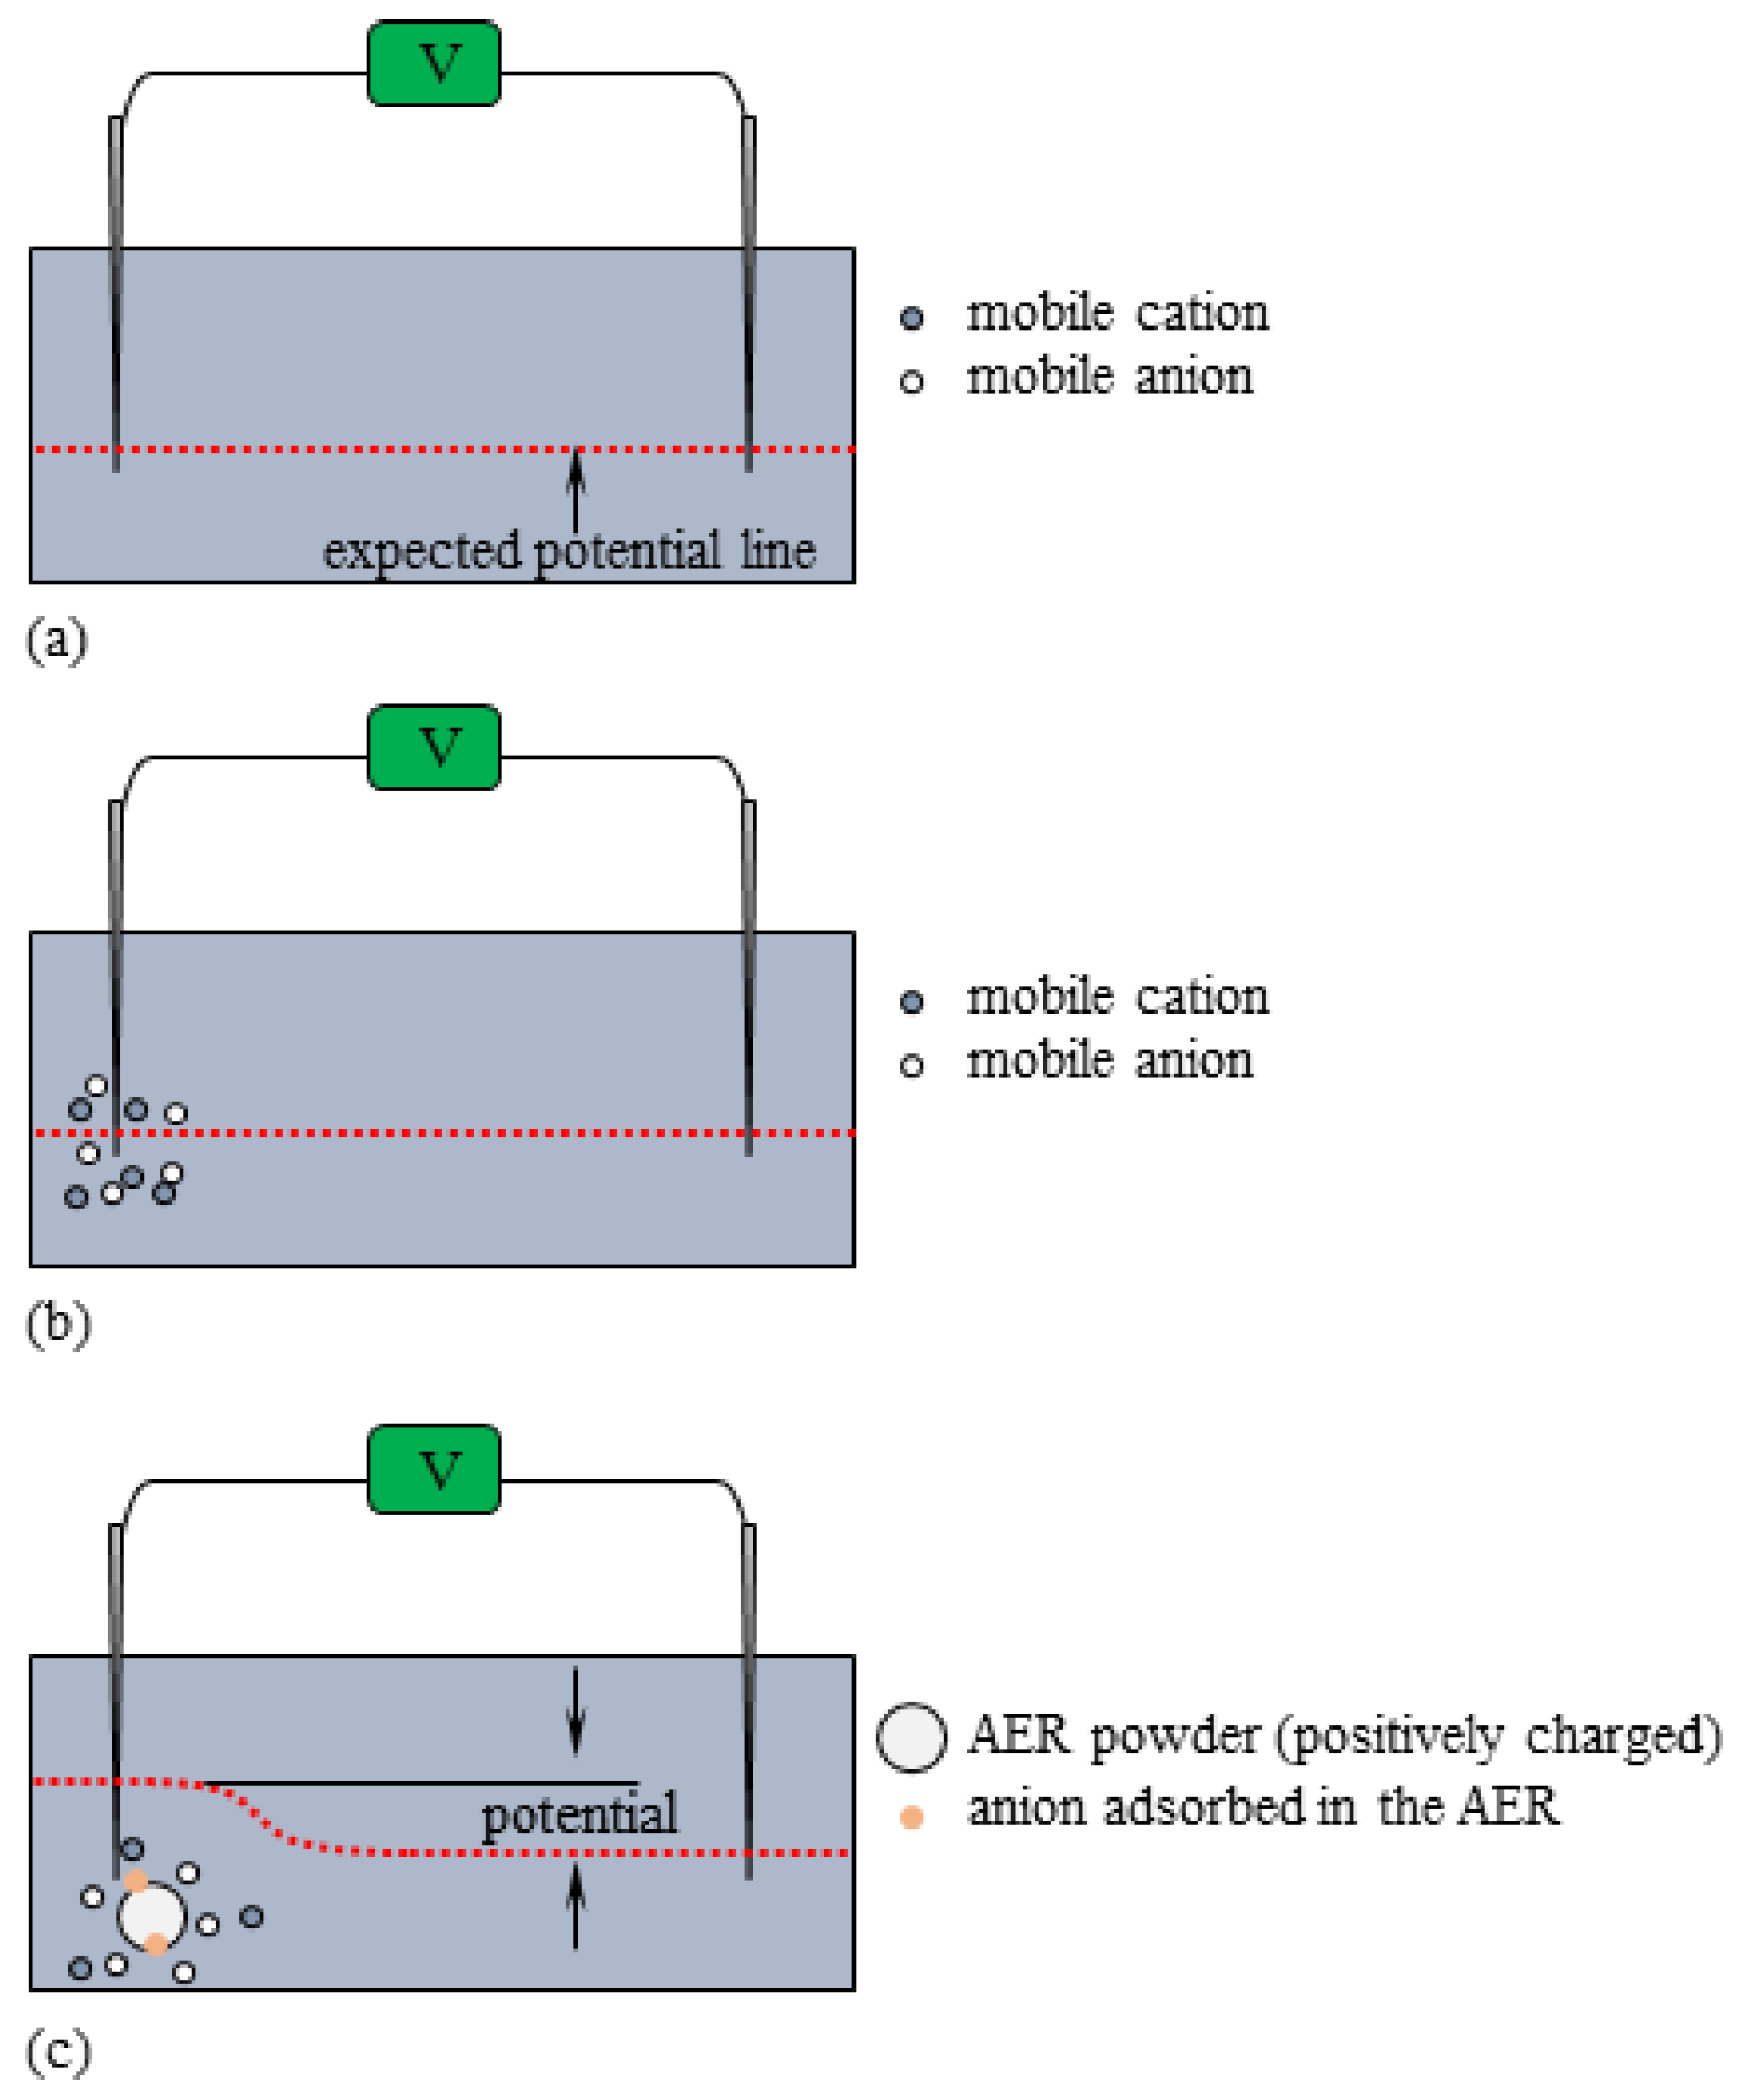
Figure 8 shows potential versus time. There is no ion-selective membrane between the indicating and reference electrodes. However, the positive potential was clearly observed after t = 90 s. This nonzero potential cannot be explained by membrane theory since no membranes are used in this potential measurement. But these potential characteristics can easily be explained by the same cause as
as follows:
There were
and
near the indicating electrode after t = 45 s (see
Figure 9). The total charge of
and
is zero and they are in the state of thermal motion. Consequently, the potential generated by the individual ions are all cencelled each other, resulting in a zero potential up to t = 90 s, even in the presence of
and
. However, the AER solution added in the vicinity of the indicating electrode at t = 90 s dissociates into a mobile anion and an immobile cation, as shown in
Figure 9(c). The non-zero potentials generated by these mobile cations are largely canceled out by the potentials of all other mobile anions in thermal motion. However, the positive charges of the AER powder are virtually immobile, which explains why the positive potential is generated in the vicinity of the indicator electrode.
Table 3.
Procedure of potential measurememt.
Table 3.
Procedure of potential measurememt.
|
t†1 / s |
operation†2
|
|
0 |
onset time of the potential measurement |
| 45 |
addition of a few drops of M KCl solution near the indicating electrode |
| 90 |
addition of a few drops of AER solution†3 near the indicating electrode |
| 135 |
addition of a few drops of M KCl solution near the reference electrode |
| 180 |
addition of a few drops of AER solution†3 near the reference electrode |
Figure 8.
Time dependence of the potential between the indicating and the reference electrodes.
Figure 8.
Time dependence of the potential between the indicating and the reference electrodes.
Figure 9.
AER nearby the indicating electrode when (a) 0 s ≤ t ≤ 45 s, (b) 45 s ≤ t ≤ 90 s, (c) 90 s ≤ t ≤ 135 s “potential” suggested by two vertical arrows represents the experimentally measured potential.
Figure 9.
AER nearby the indicating electrode when (a) 0 s ≤ t ≤ 45 s, (b) 45 s ≤ t ≤ 90 s, (c) 90 s ≤ t ≤ 135 s “potential” suggested by two vertical arrows represents the experimentally measured potential.
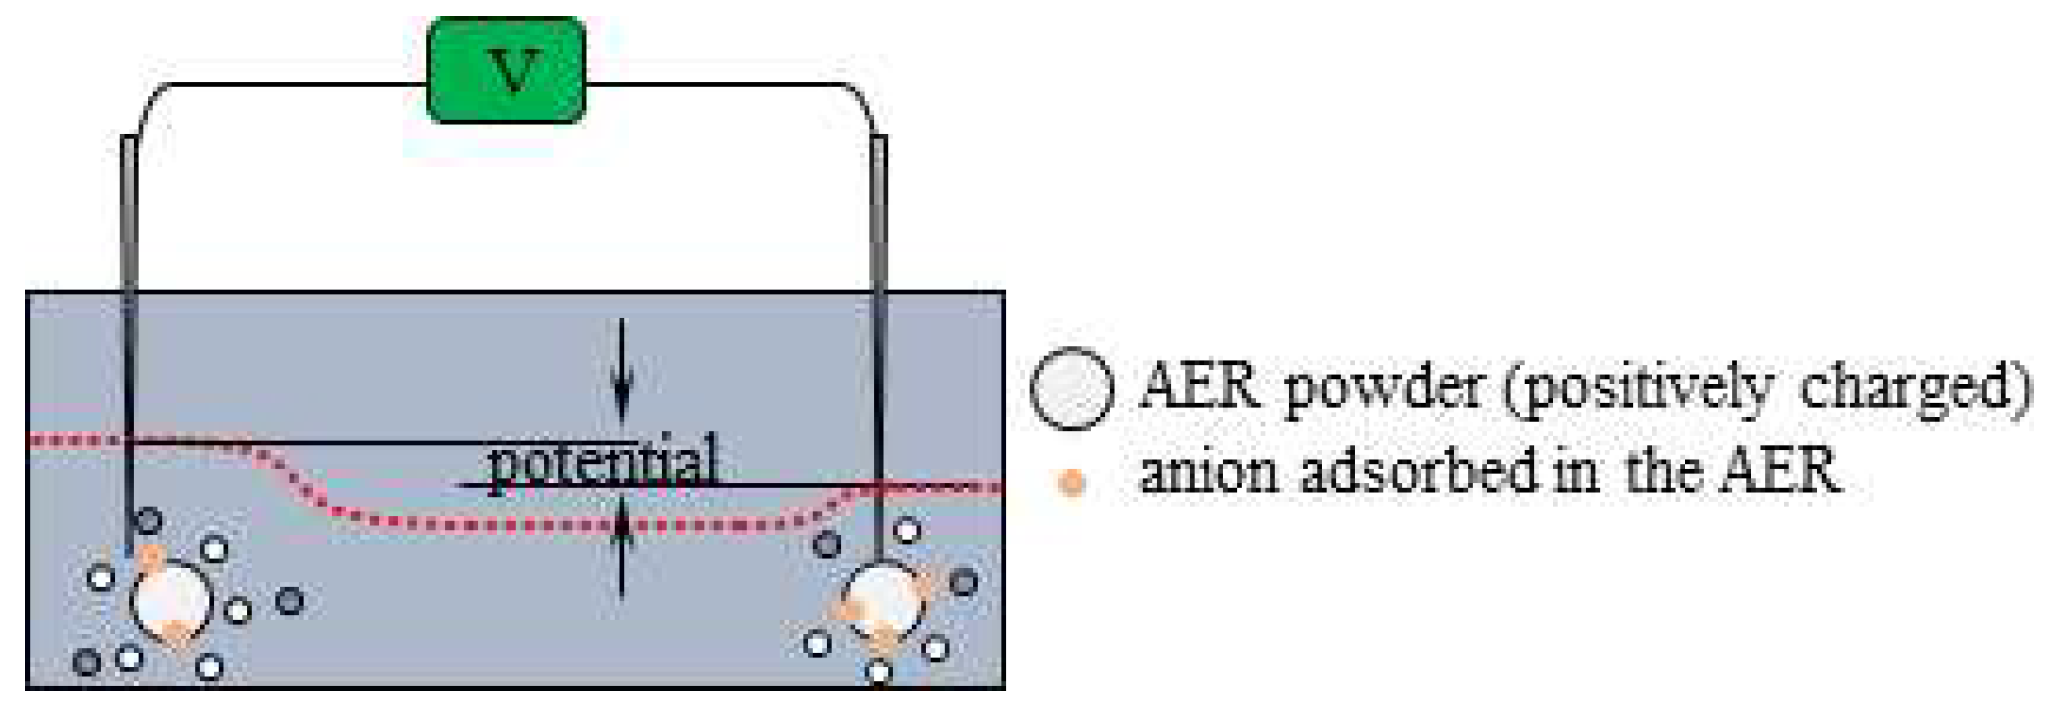
The potential was 0.02 V from t = 90 s to t = 180 s. When AER solution was added close to the reference electrode at t = 180 s, the potential suddenly decreased. This phenomenon can be explained by the same cause as the increase in potential at t = 90 s. In fact, the drop in potential at t = 180 s is due to immobile positive charges of the AERs added in the vicinity of the reference electrode, as illustrated in
Figure 10. But the potential gradually increases, reaching around 0.02 V at t = 190 s. This must be due to the dispersion of AER. Namely, the potential plunged just after the addition of AER solution at t = 180 s, but the AER particles dispersed and their influence on the potential became unable to reach the reference electrode. In addition, the AER must be largely neutralized by mobile anions. Consequently, the potential gradually returned to around 0.02 V after t = 190 s. In this connection, I would like to show an experimental result in the
Section 3.1.4.
Potential profiles described above by adding CER (AER) solution in
(
) become fully understandable from an electromagnetism viewpoint. Before showing the experiments in the sction
Section 3.2, we would like to perform a simple theoretical analysis on the potential generated in the vicinity of immobile charges as follows:
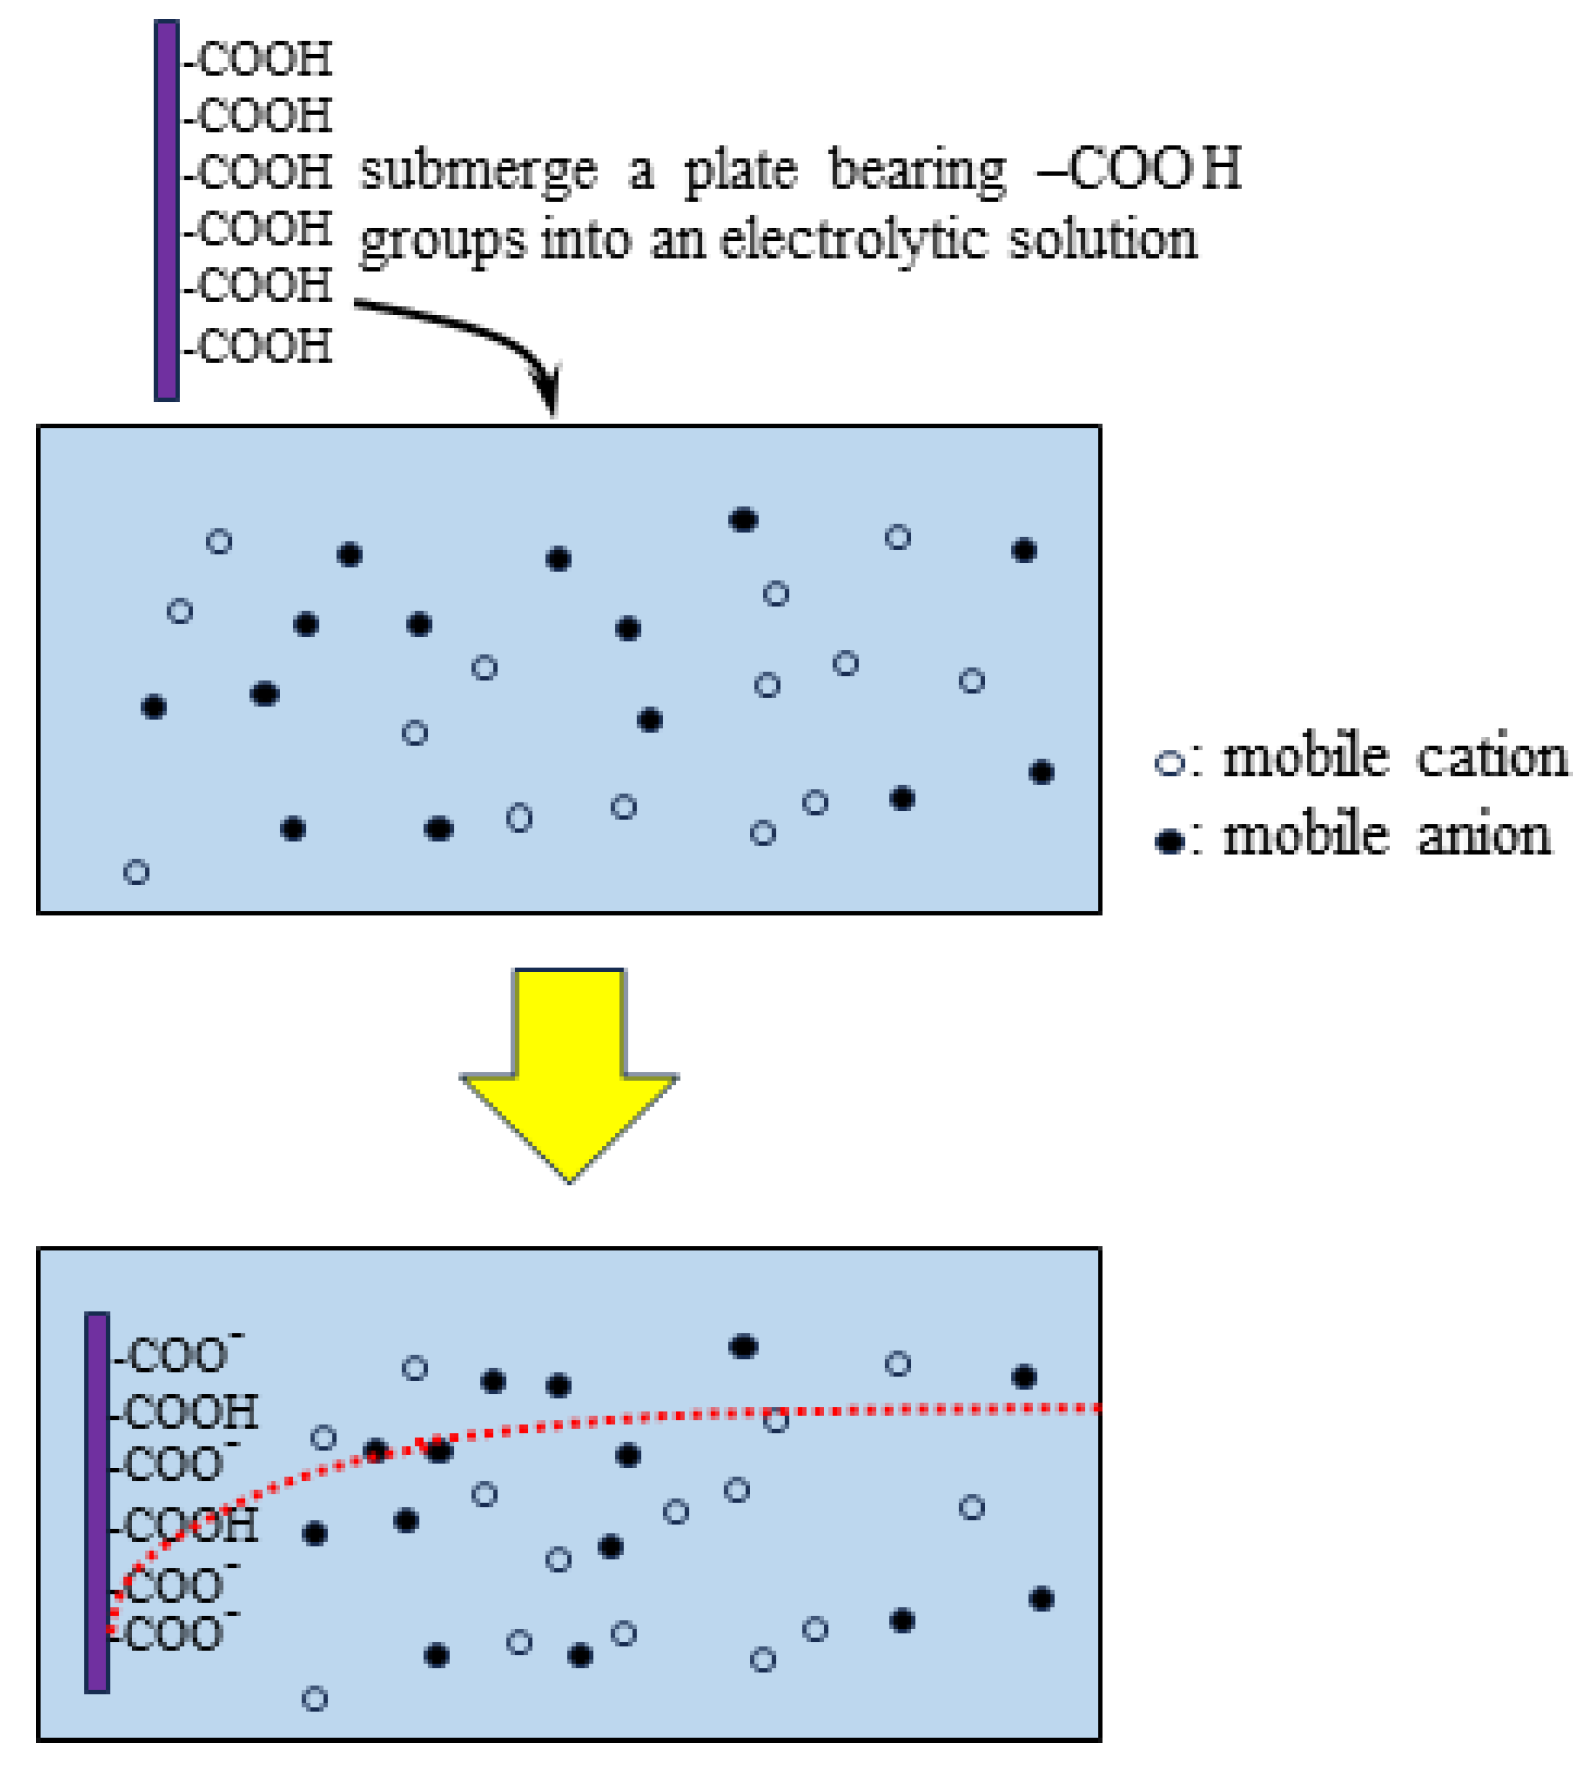
Let us consider the simplest analytical case of a solution potential where immobile charges are surrounded by mobile ions. Imagine a plate that contains immobile functional atomic groups
. Once this plate is immersed in an electrolytic solution, a certain amount of
dissociates and the plate carries negative charges of
(see
Figure 11). This system was discussed in an earlier work by H.T. (one of the authors of this paper ) [
27,
28]. The plate surface charge density,
, and the surface potential,
, are associated with each other by Eq.
1. The derivation process of Eq.
1 is shown in the references. [
27,
28] where
: relative permittivity of water,
: vacuum dielectric constant,
: ion concentration in bulk phase,
k: Boltmann constant,
T: temperature,
e: elementary charge and
≡
. Eq.
1 conforms to the Boltzmann distribution of ions and guarantees macroscopic electroneutrality. Consequently, the full contribution of ions to potential generation is taken into account in Eq.
1 thermodynamically.
Figure 11.
A plate bearing groups is submerged into an electrolytic solution. Due to the negative charges generated by the dissocaition of , the potential profile represented by the dotted line is expected. The surtface potential of this plate is negative by defining the bulk phase solution potential as zero.
is negative due to the negative charge of
, and
,
,
,
k,
T and
e are all positive quantities. Hence,
of Eq.
1 is negative. Therefore, the negative immobile charge of CER can generate the negative potential and it is clearly seen in
Figure 5. Similarly, the positive immobile charge of AER can generate the positive potential and is clearly seen in
Figure 8.
3.1.4. Potential generated by the CER and AER
We prepared a 10
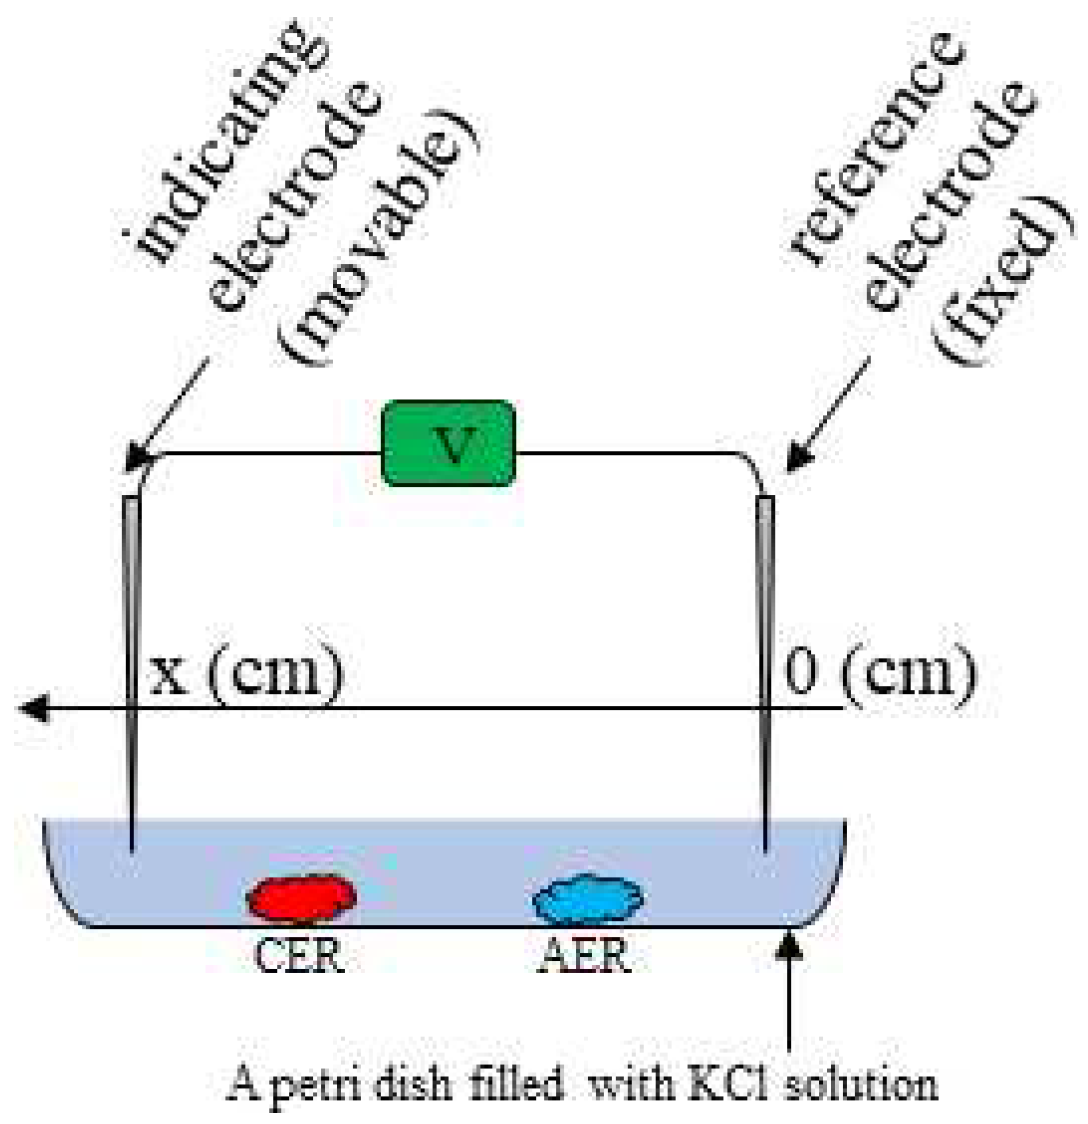
M KCl solution in a petri dish in which a tiny amount of Ion-Exchange Resins (IERs), CER and AER, was placed as illustrated in
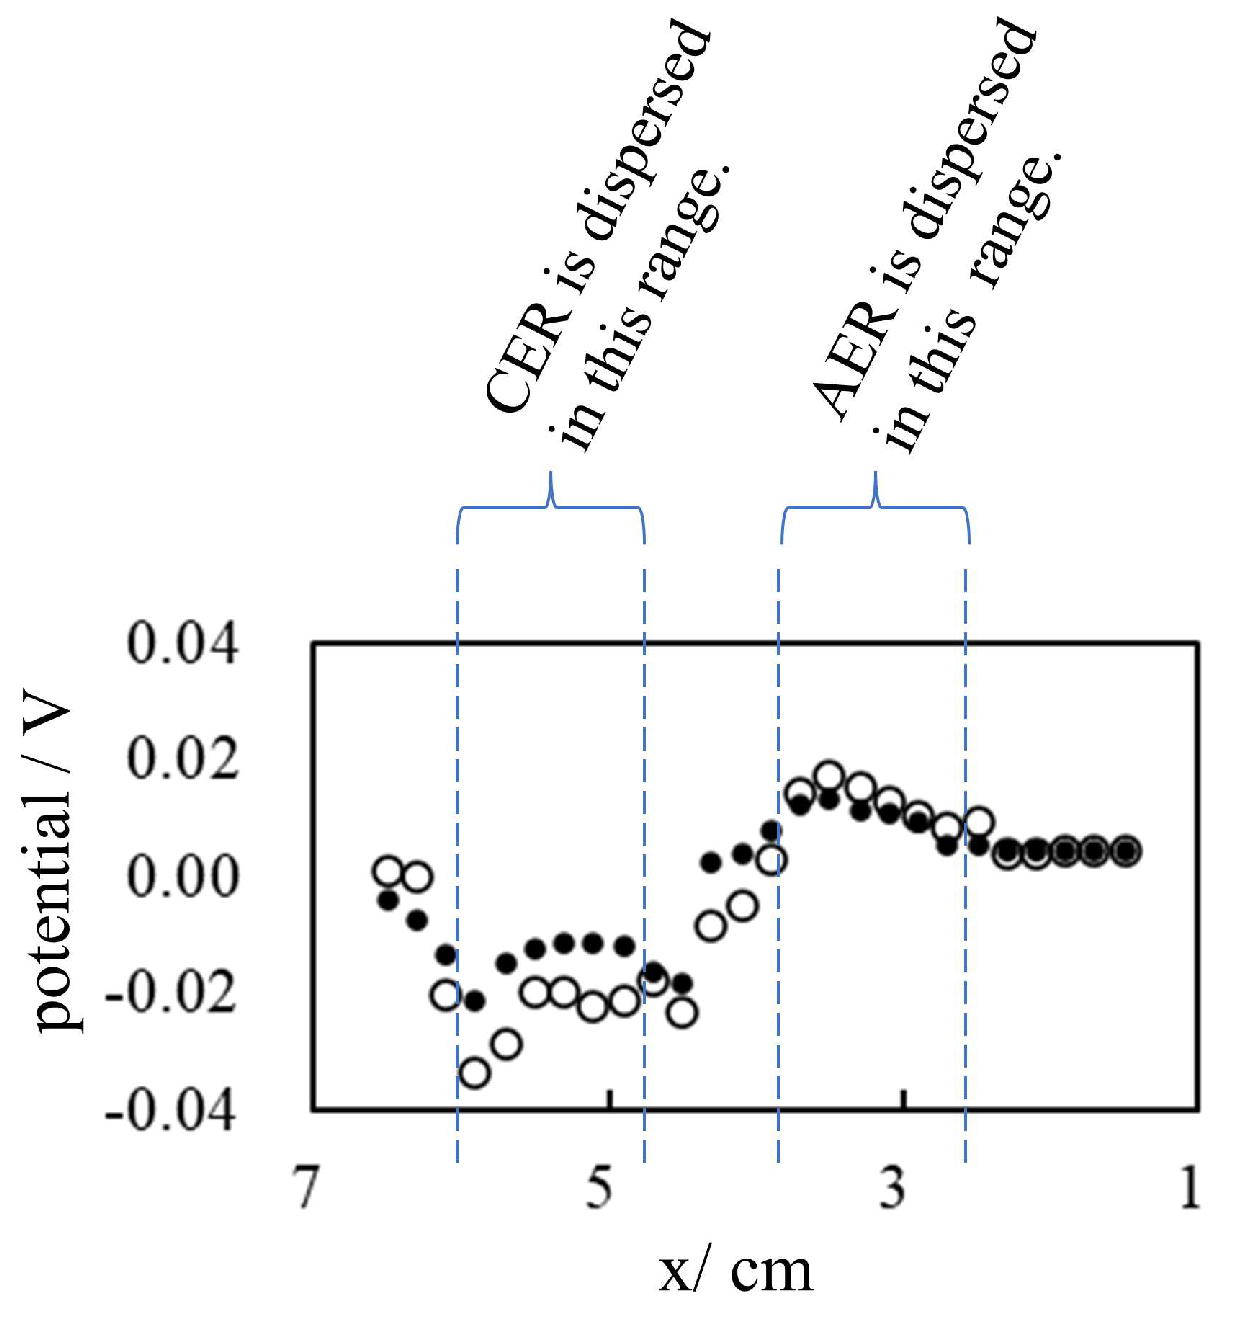
Figure 12. Then the potential between the two electrodes was measured by changing the gap of the electrodes, x cm. The position of the reference electrode was fixed while the position of the indicating electrode was moved from x = 6.5 cm to 1.5 cm and then moved back to x = 6.5 cm. The result is given in
Figure 13.
Figure 13 obviously suggests that the potential depends on the species of IER (CER or AER) near the reference electrode and the distance between the IER and the reference electrode. To be precise, the potential profiles shown in Figs.
Figure 5 and
Figure 8 are heavily influenced by the distance between the indicating electrode and the IER (CER or AER). Consequently, sometimes the potential cannot be maintained constant as observed in
Figure 8 after t = 180 s, as the significant potential drop induced at t = 180 s gradually was nullified by t = 190 s.
3.2. Potential in aqueous PVA solution
The same potential measurement as described in
Section 3.1 was performed here in the presence of a 16 wt% PVA solution. The experimental setup is the same as that illustrated in
Figure 2, but the 16 wt% PVA solution was used instead of the deionized water. The PVA solution is highly viscous, and it is an appropriate material to simulate the protoplasm.
3.2.1. Potential generated by the addition of KCl solution in the PVA solution
The container of the experimental setup was filled with the 16 wt% PVA solution. The potential generated between the two electrodes was measured as a function of time following the experimental procedure abstracted in
Table 4.
Figure 14 shows the time dependence of the potential generated between the indicating and the reference electrodes under the experimental conditions in
Table 4. Although a momentary disturbance of the potential was observed when the KCl solution was dropped near the electrodes, the potential remained basically at 0 V. According to the membrane theory, the selective ion transport across the plasma membrane is responsible for generating a nonzero membrane potential. In this experiment, no ion-selective membrane was used. Hence, the nonzero potential generation cannot be expected and the experimental observation of the zero potential in
Figure 14 is in perfect agreement with membrane theory.
Table 4.
Procedure of potential measurememt.
Table 4.
Procedure of potential measurememt.
|
t†1 / s |
operation†2
|
|
0 |
onset time of the potential measurement |
| 45 |
addition of a few drops of M KCl solution near the indicating electrode |
| 90 |
addition of a few drops of M KCl solution near the indicating electrode |
| 135 |
addition of a few drops of M KCl solution near the reference electrode |
| 180 |
addition of a few drops of M KCl solution near the reference electrode |
3.2.2. Potential generated by the CER
The same potential measurement as
was performed. The experimental procedure was basically the same as in
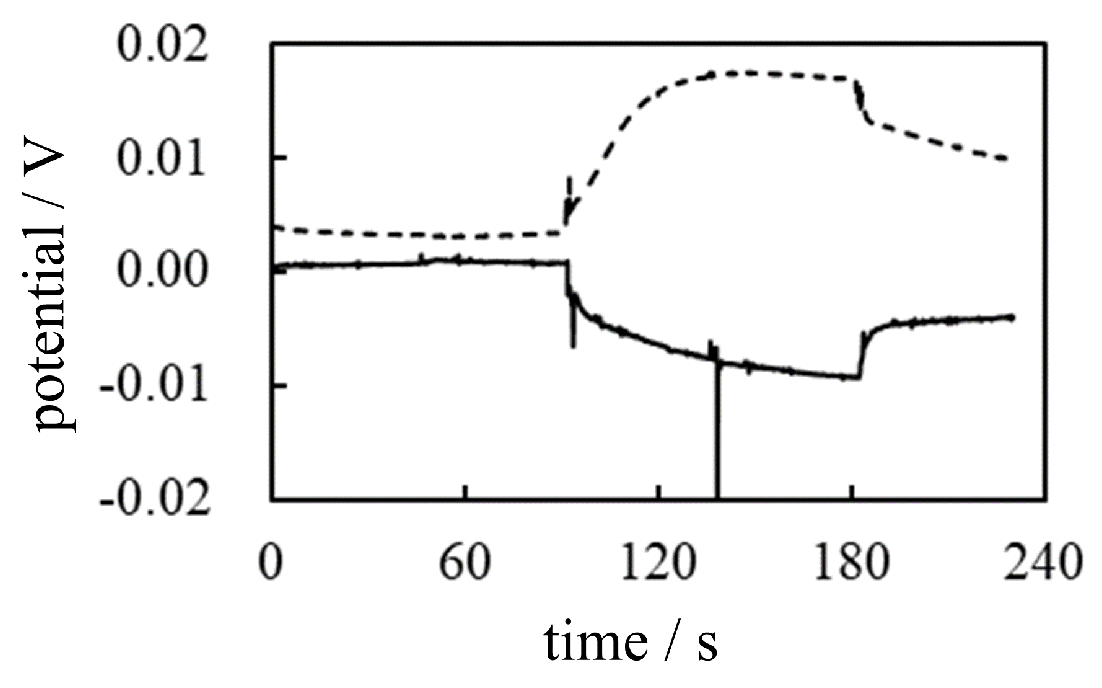
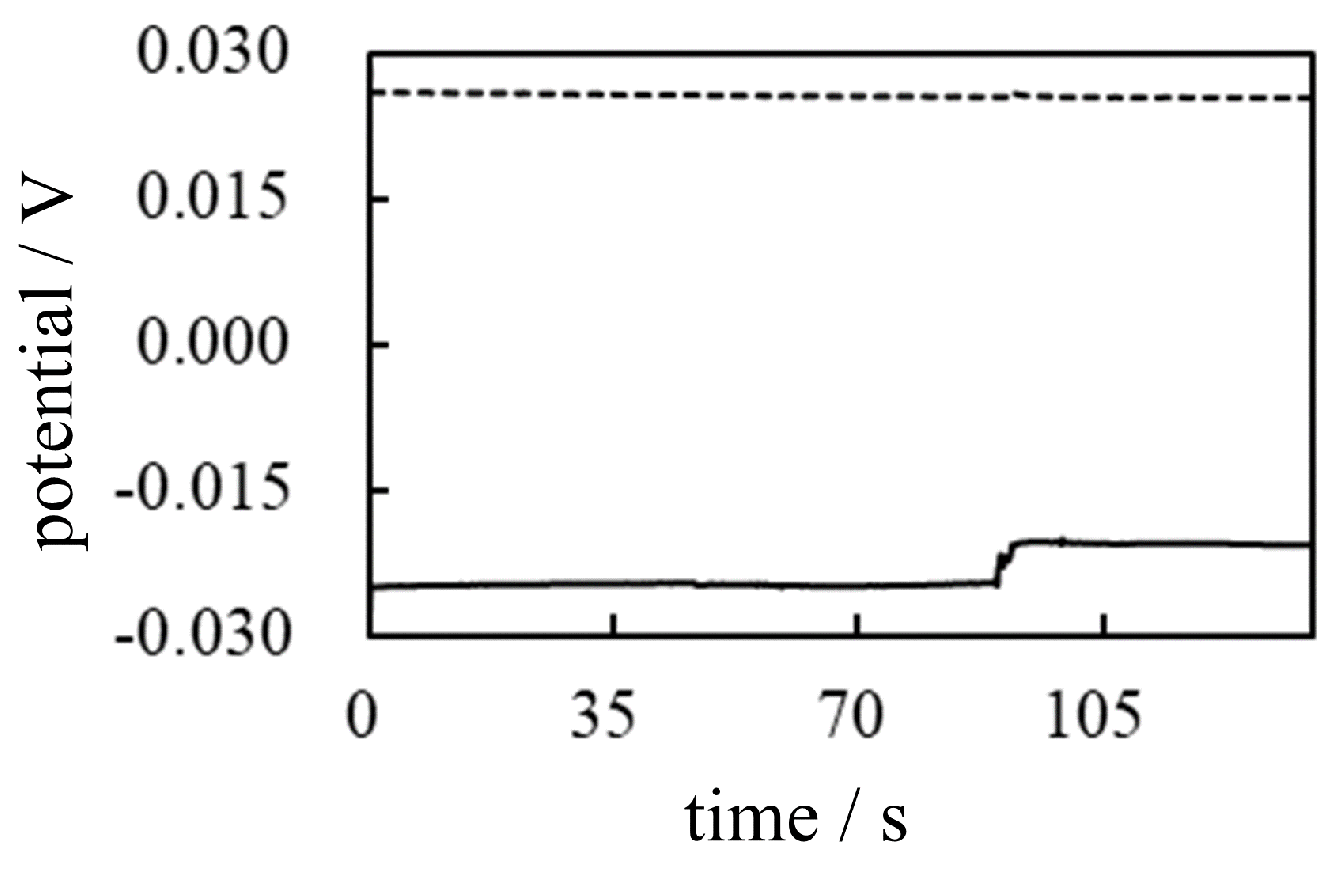
Table 2 but the container of the experimental setup was filled with a 16 wt% PVA solution in place of the deionized water. The solid line in
Figure 15 shows the potential vs. time of
.
The potential profile of
in
Figure 15 is to be analyzed step by step as follows: From t = 0 s to 45 s, the potential is 0 V. This is normal and nothing to mention. From t = 45 s to 90 s, no change in potential was induced, even with the addition of a
M KCl solution near the indicating electrode. This potential characteristic is also quite natural, since the electroneutrality of the
and
ions applies in this system and no ion-selective membrane is used in this system. However, the addition of CER solution in the vicinity of the indicating electrode at t = 90 s induced an abrupt drop in potential. This drop in potential cannot be explained by the membrane theory, since there is no ion-selective membranes in this experimental system. However, the use of common electromagnetism can explain this. Indeed, the interpretation used in
can be applied to this experiment
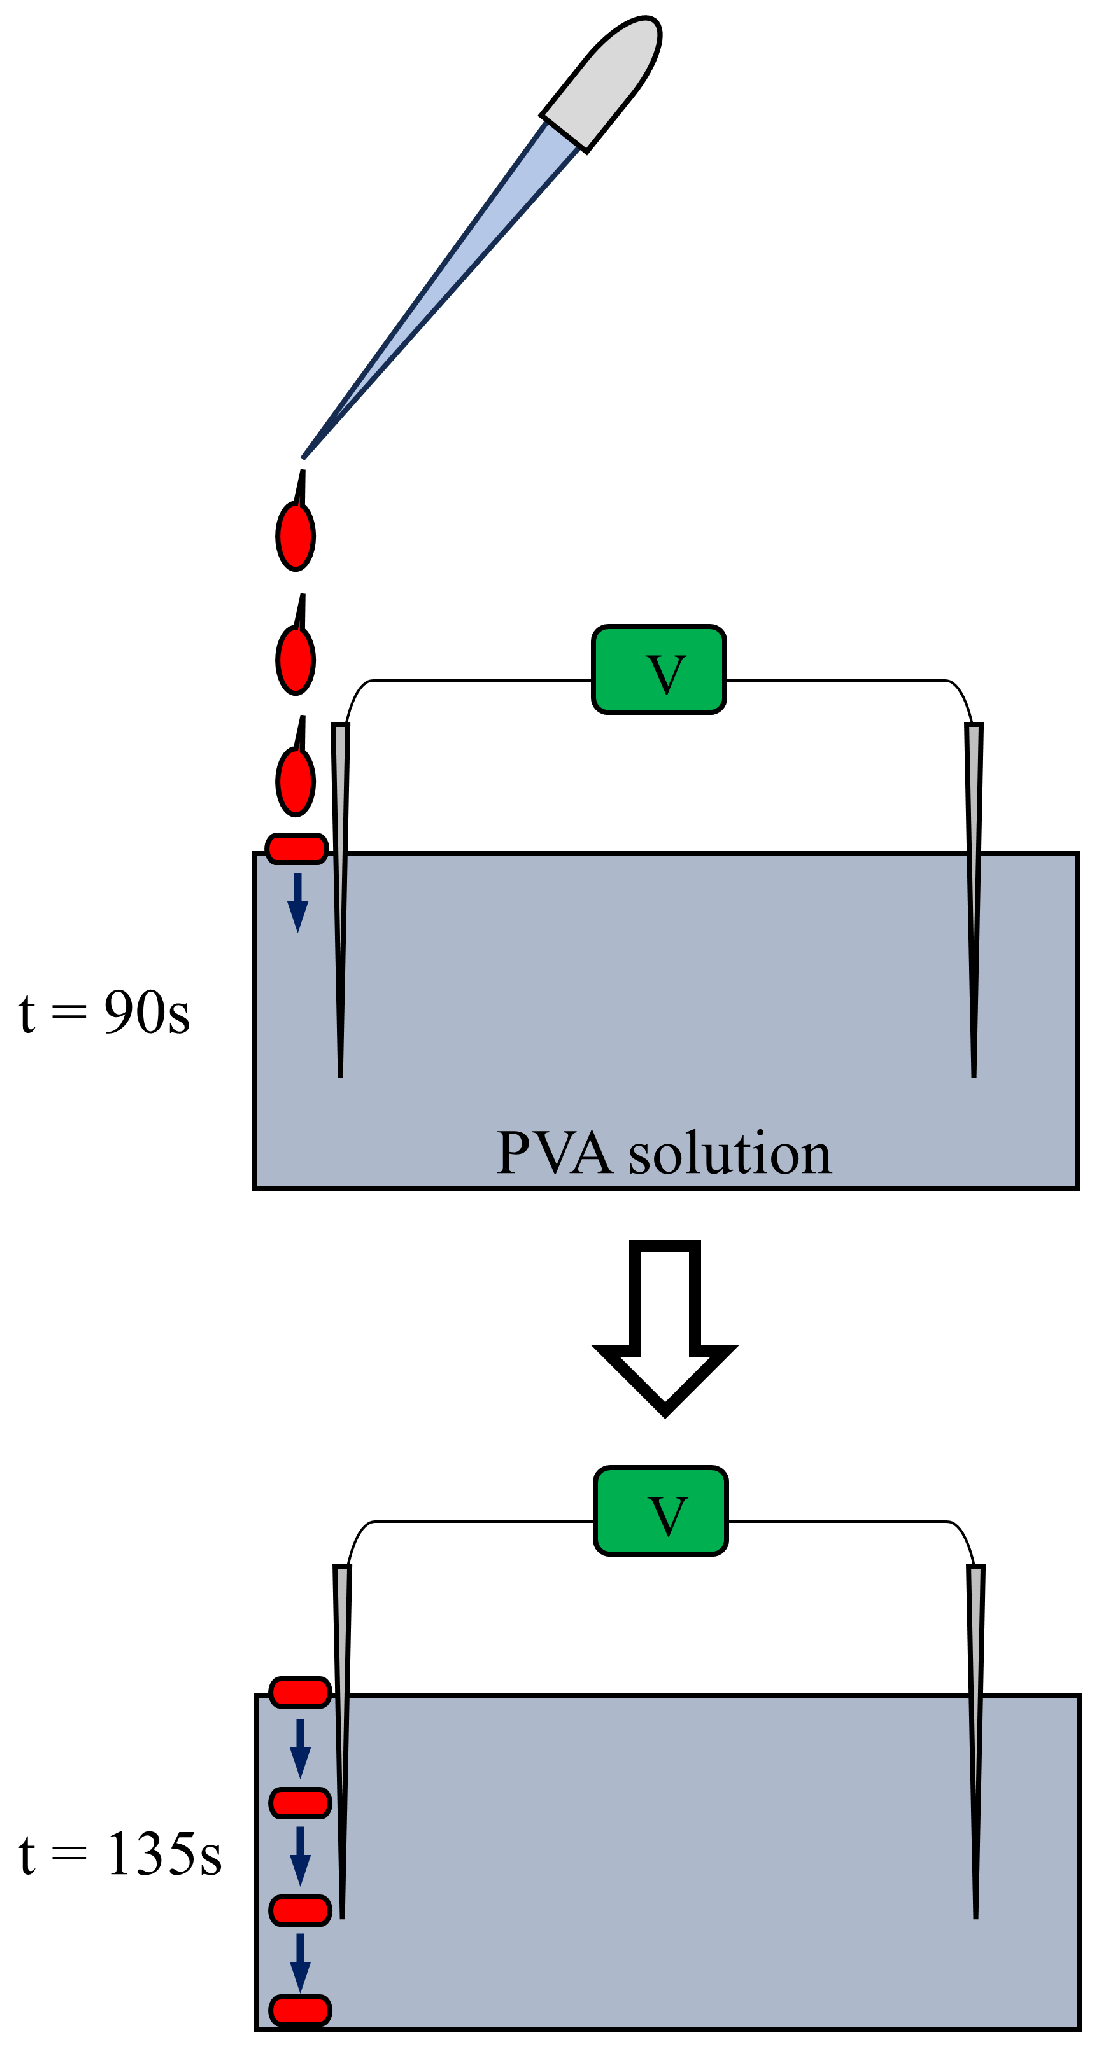
, i.e. the immobile negative charge of the CER generated the non-zero negative potential. A slow and continuous decrease in potential was observed from t = 90 s to t = 135 s. This must be a slow process of CER solution descent from the PVA surface to the bottom of the petri dish where the tip of the indicator electrode was inserted (see
Figure 16). The CER solution droplets from the pipette slowly reached the tip of the indicating electrode due to the high viscosity of the PVA solution, resulting in a slow decrease in potential.
Figure 15.
& Potential between the indicating and the reference electrodes vs. time 16 wt% PVA is used. Solid line: Dotted line:
Figure 15.
& Potential between the indicating and the reference electrodes vs. time 16 wt% PVA is used. Solid line: Dotted line:
The addition of a M solution of KCl in the vicinity of the reference electrode at t = 135 s caused virtually no discontinuous change in the downward potential trend. The steady and continuous decrease in potential continued until t = 180 s. However, the addition of CER in the vicinity of the reference electrode at t = 180 s triggered a discontinuous change in potential. This potential change is due to the same reason as the potential change observed at t = 90 s.
In abstract, potential generation does not require an ion-selective membrane, but heterogeneous spatial charge distribution by ion adsorption is necessary for non-zero potential generation, and this must be the mechanism of membrane potential generation. This mechanism is in harmony with the AIH described in
Section 2.2.
3.2.3. Potential generated by the AER
The same potential measurement as
was performed. The experimental procedure was basically the same as in
Table 3 but the solution filling the container was the 16 wt% PVA solution in place of the deionized water. The dotted line in
Figure 15 shows the potential vs. time of
.
The potential profile of
in
Figure 15 is virtually opposite to that
in
Figure 15 about the x-axis. This is due to the use of AER solution instead of the CER solution, namely, the sign of a fixed charge of AER is opposite to that of the CER. Therefore, such an opposite potential profile in
Figure 15 is basically explicable by the use of the same discussion employed for
with the opposite charge of AER in mind.
3.3. Potential across a membrane separating two solutions
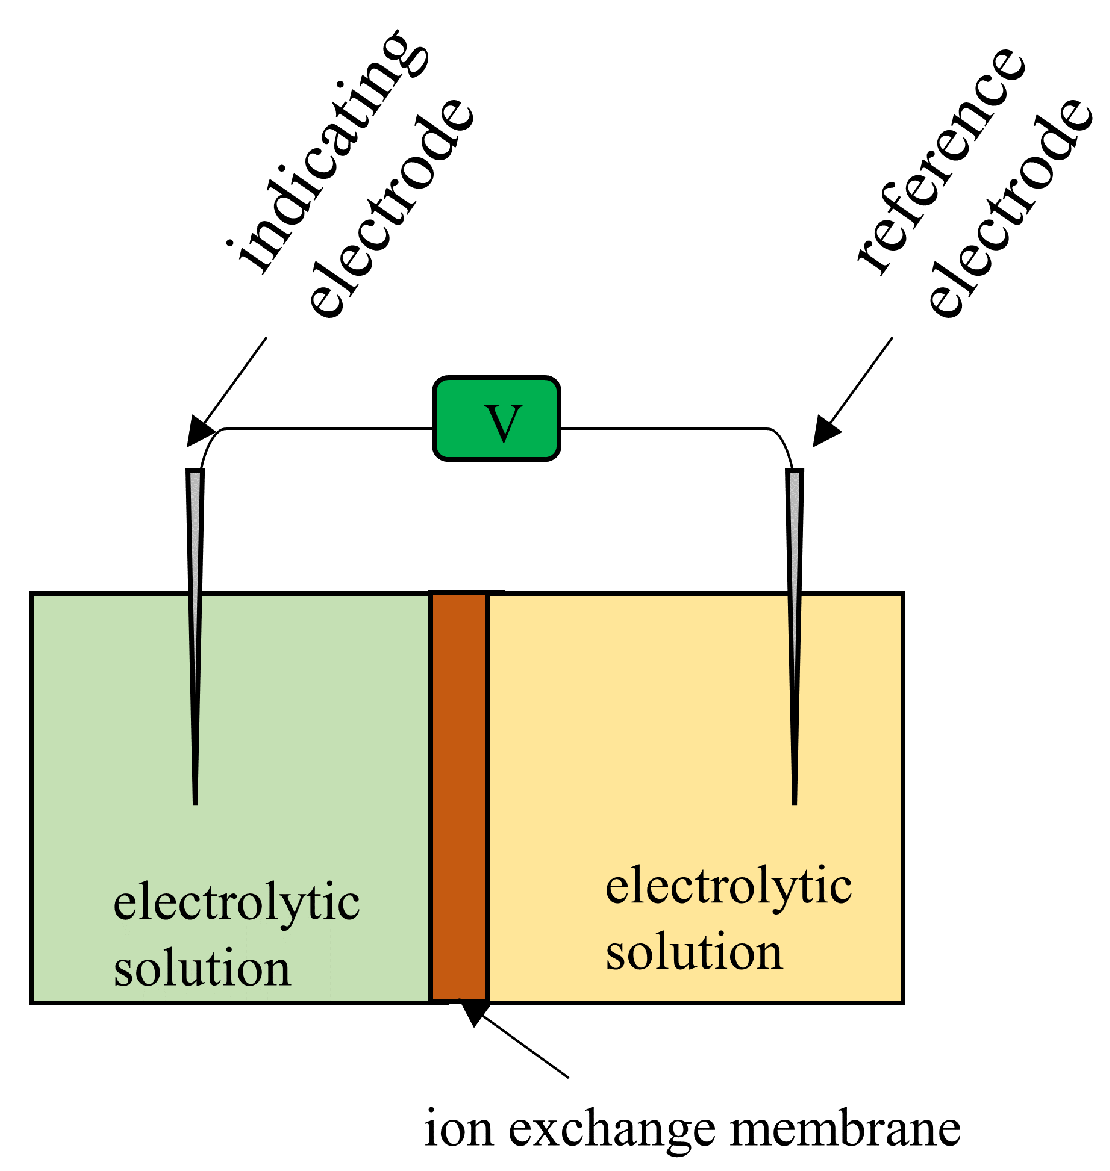
It is well known that the potential across an Ion Exchange Membrane (IEM) separating two electrolyte solutions is theoretically predictable quantitatively using membrane theory. Let us imagine that two KCl solutions are separated by an anion exchange membrane that is largely permeable to anions but not very permeable to cations;
Figure 17 roughly illustrates such a system.
The Goldman-Hodgkin-Katz equation (GHK eq.) is a well-known physiological equation that has been widely used to predict the membrane potential of a living cell. The GHK equation is even applicable to nonliving systems such as the one shown in
Figure 17. Tamagawa (one of the authors of this article) and Morita previously performed potential measurements across an anion exchange membrane separating two KCl solutions and found that the measured potentials obeyed the GHK eq. [
25]. If the membrane theory is correct, then selective ion transport across the ion exchange membrane should have taken place in their experiment. Thus, diffusion of ions across the membrane is necessary for the generation of the membrane potential.
For further discussion in the following sections, we would like to further explain the GHK eq. hypothesizing that the membrane theory is valid, although Tamagawa and Morita concluded that the potential they measured was caused by adsorption of ions onto the membrane rather than by the transmembrane ion transport [
25].
Figure 17.
Exprimental setup fpr measuring the potential between the two electrolytic solutions separated by a permeable ion exchange membrane
Figure 17.
Exprimental setup fpr measuring the potential between the two electrolytic solutions separated by a permeable ion exchange membrane
Imagine that the two KCl solutions are separated by an ion exchange membrane (IER) as shown in
Figure 17 and that the ion exchange membrane used is a cation exchange membrane. Its permeability to
is much greater than that to
. In this case, the membrane potential is given by Eq.
2. Denoting membrane permeability at
and
by
and
, respectively, and denoting the concentrations of ions of the left and right phases by[
i]
L and [
i]
R (
i =
,
), respectively, Eq.
2 is derived using the GHK eq. Since the membrane permeability at
is much greater than at
, Eq.
4 is derived. Thus, Eq.
2 can be approximated by Eq. 3. Now, if the cation exchange membrane is replaced by an anion exchange membrane, what are the characteristics of the potential? The anion exchange membrane is highly permeable to the anion
, but not very permeable to
. Consequently, Eq.
5 is derived, and the GHK eq. for this system can be given by Eq.
6, which gives Eq. 7. Since Eqs.
8 and
9 are valid, Eq.
10 is derived, i.e. the cation or anion for which the membrane permeability is higher determines the sign of the potential [
26]. With the discussion described so far in this section, we would like to show another experiment in the following sections.
3.3.1. Potential across an IEM generated by the addition of AER
The potential across the ion exchange membrane (IEM) was measured using the experimental setup identical to the illustration in
Figure 17 but two 16 wt% aqueous PVA solutions were used in place of the two electrolyte solutions. We followed the procedure given in
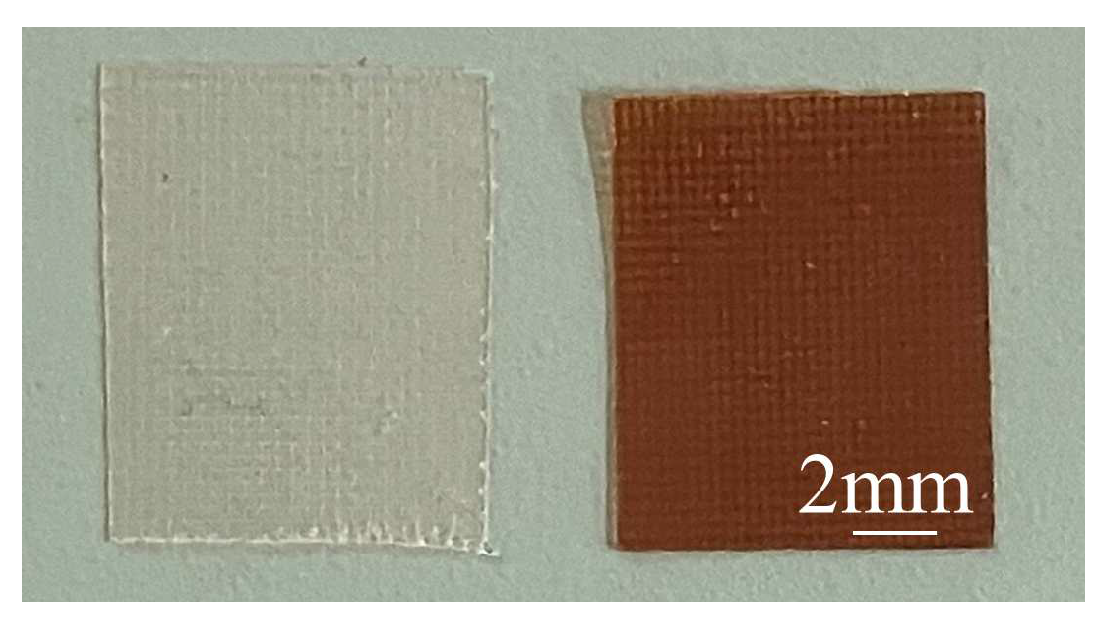
Table 5. Note that KCl solutions and IER solutions were dropped close to the indicating electrode only and they were never dropped in the vicinity of the reference electrode, unlike the other experiments presented so far. The IER solutions used in this experiment were AER and CER, which are the same as those used in the experiments described earlier. The IEMs used were Selemion AMV and Selemion CMV (Asahi Glass, Co. Ltd. Tokyo) shown in
Figure 18. Selemion AMV is an anion exchange membrane that bears fixed positive charges, whereas the Selemion CMV is a cation exchange membrane carrying fixed negative charges. Henceforth, Selemion AMV and Selemon CMV will be referred to simply as AMV and CMV, respectively.
Since AMV is positively charged, it must be much more permeable to mobile anions than to mobile cations. On the other hand, CMV must be far more permeable to mobile cations than to mobile anions because the CMV is positively charged. Consequently, the sign of the membrane potential across the AMV must be opposite to that across the CMV according to the discussion made using Eqs. 3∼
10 as long as the membrane theory is valid.
Table 5.
(-1 ∼-4) Procedure of potential measurememt across an IEM .
Table 5.
(-1 ∼-4) Procedure of potential measurememt across an IEM .
|
t†2/ s |
operation†3
|
|
0 |
onset time of the potential measurement |
| 45 |
addition of a few drops of M KCl solution near the indicating electrode |
| 90 |
addition of a few drops of IER solution†4 near the indicating electrode |
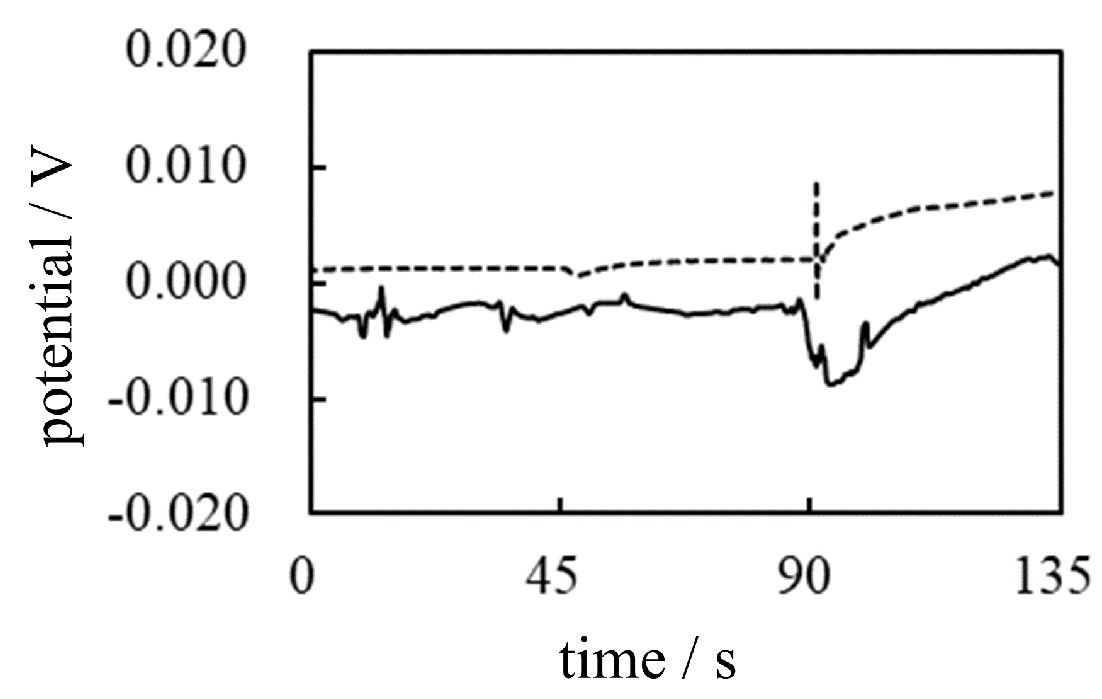
-1 Potential across AMV caused by AER We carried out the potential measurement following the procedure shown in
Table 5 under the conditions of using AMV as IEM and AER as IER. The solid line in
Figure 19 represents the experimental curve of potential data.
M KCl was added in the vicinity of the indicator electrode at t = 45 s, but it did not cause such an obvious change in potential, virtually no change in potential was induced. This phenomenon can be interpreted as the fact that
could not cross the AMV since
could not reach the AMV due to the high viscosity of the PVA solution as long as the membrane theory is correct. However, once AER solution was added in the vicinity of the indicating electrode at t = 90 s, the potential immediately plunged and began to rise. Of course, it is unlikely that mobile ions would reach the AMV so quickly because of the high viscosity of PVA. This experimental result suggests that ion transport across the membrane is not responsible for generating the membrane potential. It is strongly assumed that AMV has nothing to do with the generation of membrane potential and that the heterogeneous distribution of ions due to the immobile charge of AER is responsible for the generation of membrane potential, as suggested by AIH. The potential drop at t = 90 s is a potential fluctuation due to the momentary collision between the PVA solution and the AER solution. But after a while, this fluctuation gradually subsided, and the potential began to rise due to the immobile positive charge of the AER solution.
-2 Potential across CMV caused by AER The same potential measurement as
-1 in
Figure 19 was performed using the CMV in place of the AMV while the IER used was the AER which is the same type of IER used in the
-1. The CMV carries negative charges whose sign is opposite to that of the charge carried by the AMV. Consequently, the CMV must be highly permeable to
and only slightly permeable to
. Therefore, the potential change expected by the addition of AER at t = 90 s is the decrease in potential assuming that the membrane theory is correct. The membrane potential actually observed is given by the dotted curve in
Figure 19. Contrary to the expected potential profile, the actual observed potential showed an increase at t = 90 s by adding AER solution. Consequently, this experimental result confirms the hypothesis that the heterogeneous distribution of ions due to the immobile charge of AER is responsible for the generation of the membrane potential, as suggested by the AIH.
-3 Potential across AMV caused by CER The same potential measurement was again carried out following the procedure shown in
Table 5, with the proviso that AMV was used as IEM and CER solution as the IER solution in place of the AER solution. If the membrane theory is correct, the expected potential change should exhibit an increasing potential, which is the same potential trend of
-1 in which the AMV was used (see the solid line data curve of
-1 in
Figure 19). On the other hand, if the heterogeneous distribution of ions is responsible for generating the membrane potential, the potential must start to decrease with the addition of CER, since the sign of the immobile charge of CER is opposite to that of AER used in both
-1 and
-2, and the actual potential profiles of
-1 and
-2 in
Figure 19 exhibit the increase in potential by the addition of AER solution regardless of the type of IERs used. The actual trend in potential for
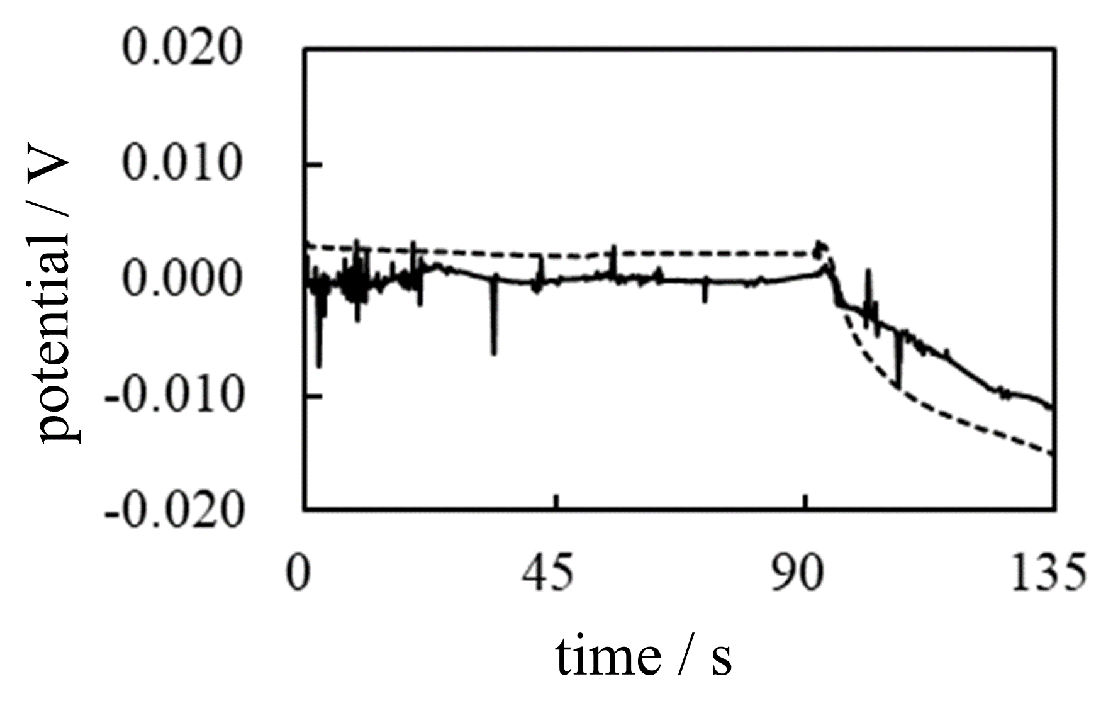
-3 is a decrease in potential, as represented by the solid line in
Figure 20. This strongly confirms that the membrane potential is generated by the heterogeneous ion distribution due to ion adsorption and not by membrane theory.
-4 Potential across CMV caused by CER The same potential measurement was again carried out following the procedure shown in
Table 5, with the proviso that the CMV was used as the IEM and the CER solution as the IER solution. As can be easily expected from the above discussion, the potential change occurs at the time when CER solution was added, t = 90 s, whereas no potential change is expected only by the addition of the KCl solution at t = 45 s. In fact, the dashed potential profile in
Figure 20 represents the experimentally measured potential for
-4 and is in full agreement with the expected potential profile based on the AIH. Therefore, the membrane potential of living cells must be caused by the heterogeneous spatial distribution of ions (charge) through ion adsorption, as predicted by the AIH.
4. Potential characteristics in a realistic living cell model
On the basis of the potential characteristics observed experimentally and the discussions described so far, the spatial charge distribution caused by the adsorption of mobile ions onto immobile charges plays a fundamental role in generating the membrane potential. This is fully in line with the AIH. In fact, a living cell contains many charged substances, such as lipids and proteins, and the adsorption of mobile ions onto these substances is inevitable. With this in mind, we focused on a more realistic model of a living cell and carried out measurements of its potential.
4.1. Potential in a charged solution in the absence of a membrane
4.1.1. Potential generated in the gelatin solution
An experimental setup illustration in
Figure 2 was made, but 16 wt% aqueous gelatin solution was poured into it. The gelatin solution used is a highly viscous like protoplasm and also carries fixed charges, whereas the protoplasm contains many immobile charges. Therefore, the aqueous gelatin solution is a highly suitable model of a living cell since the protoplasm is a viscous and geleatin molecules bear fixed charges.
Using this experimental system, the potential measurement was carried out according to the procedure in
Table 6.
The 16 wt% gelatin solution is a highly viscous charged solution. Therefore, the fixed charges of the gelatin molecules are practically immobile, and their counterions are the mobile ions.
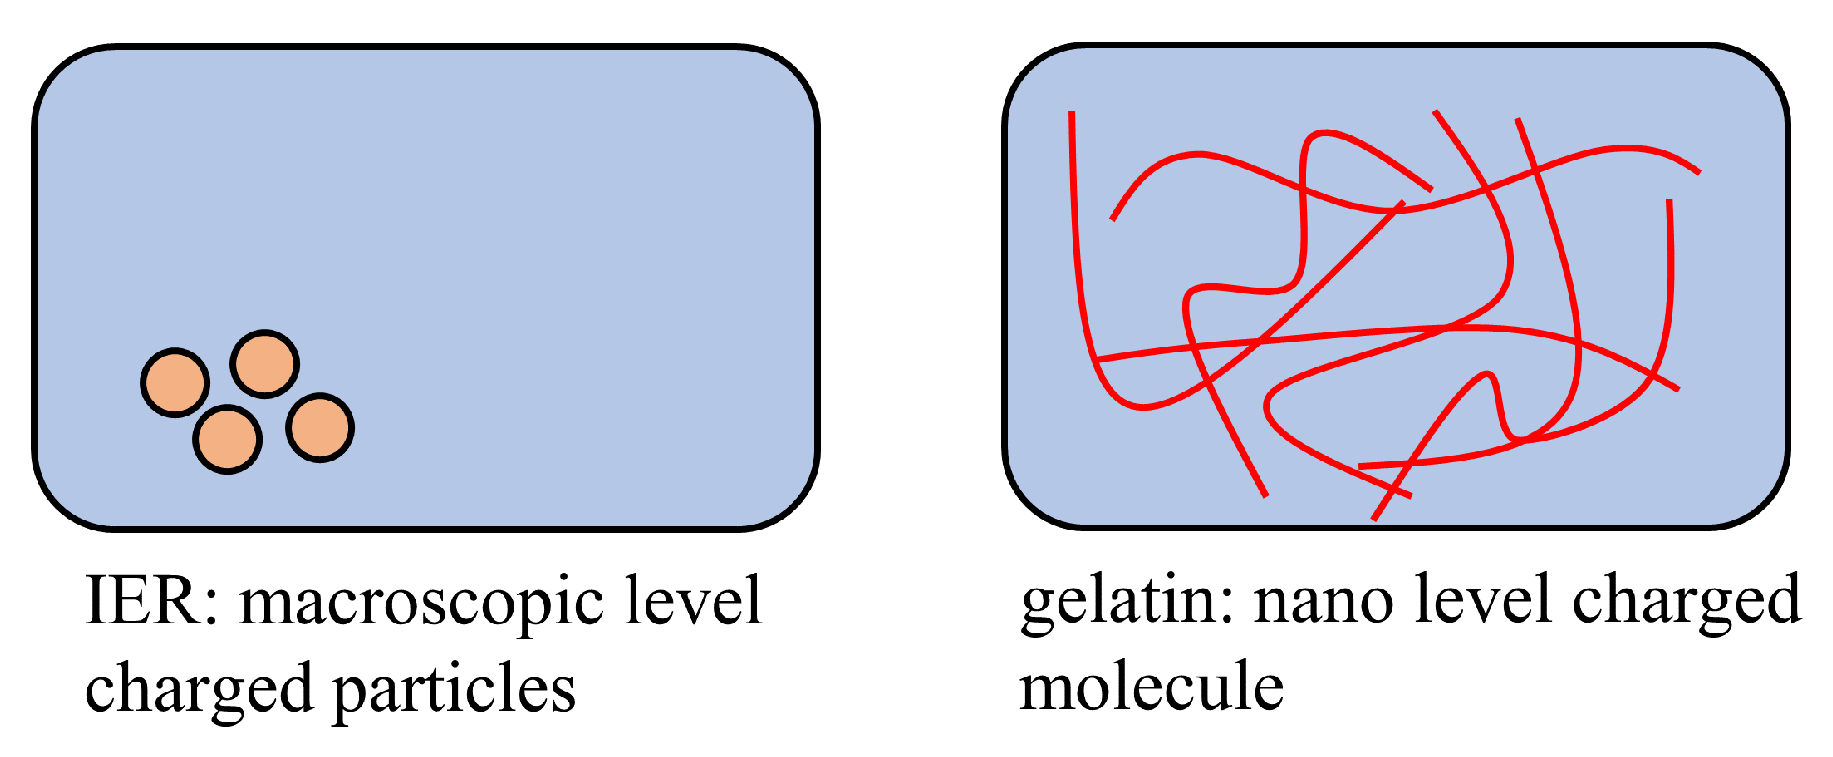
Figure 21 illustrates the macroscopic particles of ion exchange resin in a aqueous solution and a viscous solution highly congested with the gelatin molecules. IER particle dimension is macroscopic leves as clearly seen in
Figure 4. Therefore, the charges on the IER partciles are in the immobile state. Gelatin solution 16 wt% gelatin solution is highly viscous. So, the motion of gelatin molecules is significantly restricted. Hence, the charges on the geleatin molecules are virtually in the immobile state. Once deionized water or
M KCl solution is poured in (see
Table 6), the degree of dissociation of the gelatin molecule can be affected. This means that the degree of adsorption of ions on immobile charges will be altered. Therefore, a change in potential can be expected.
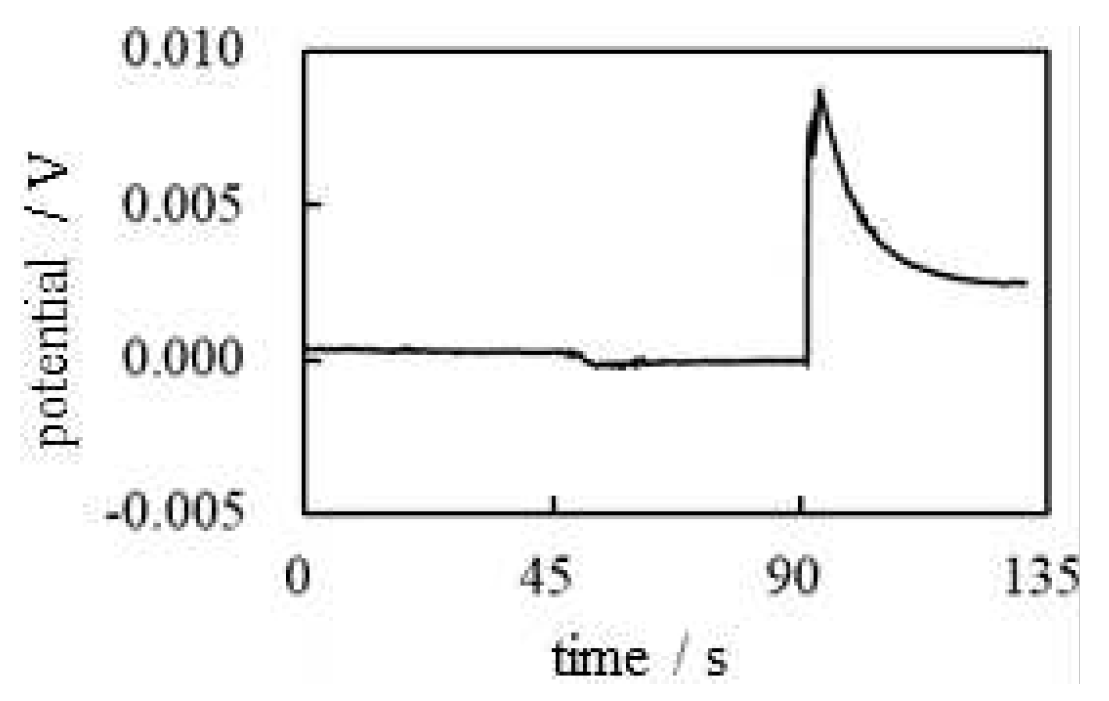
Figure 22 represents the potential measured experimentally according to the experimental procedure in
Table 6. Although the potential change induced by the addition of deionized water at t = 45 s is unclear, the potential change induced by the addition of a
M KCl solution at t = 90 s is quite clear. Consequently, the AIH is strongly supported.
4.1.2. Potential generated in the PVA solution
For comparison, the same measurement as
was carried out following the procedure in
Table 6 using the 16 wt% PVA solution instead of the 16 wt% gelatin solution (note: this experiment is basically the same as
). PVA is a neutral molecule. Therefore, the 16 wt% PVA solution is a neutral solution unlike the gelatin solution. Consequently, no net change in potential can be expected from the addition of aqueous solutions.
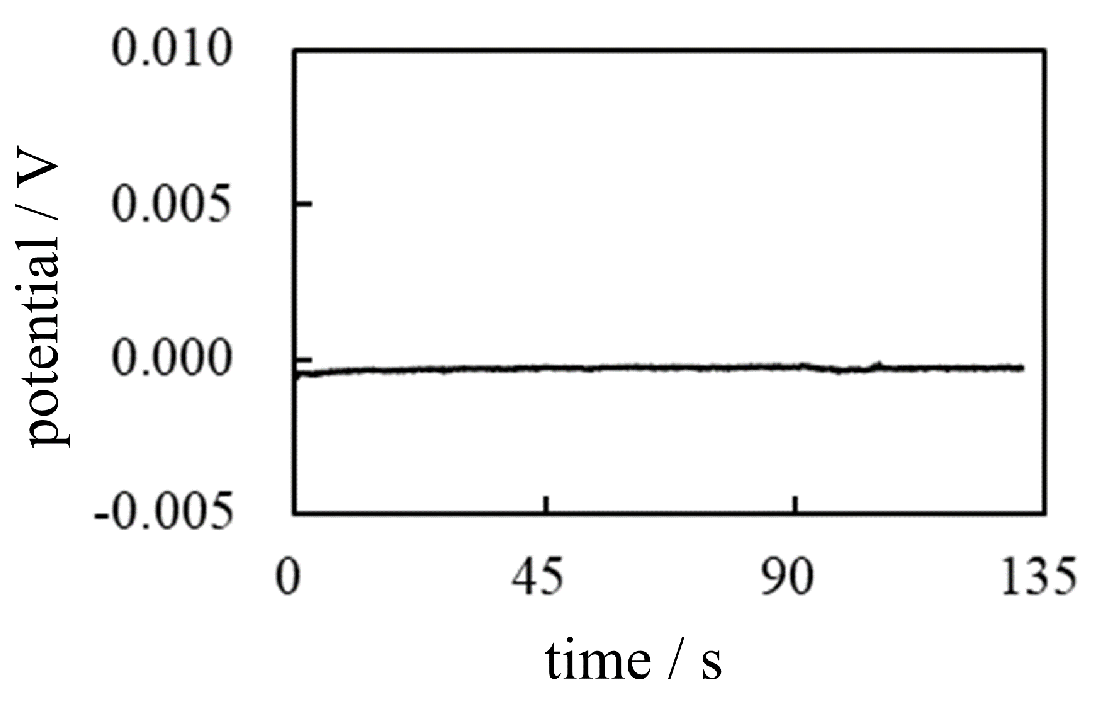
Figure 23 shows the experimentally measured potential profile. Compared to the profile in
Figure 22. It is no exaggeration to say that no potential change was induced from start to finish. Therefore, potential generation or change must be induced by the spatial fixation of ions by the ion adsorption (or desorption), as suggested by AIH.
4.2. Potential in a charged solution across a membrane
4.2.1.
The potential measurement was carried out using the setup illustrated in
Figure 17 following the procedure shown in
Table 6 in which gelatin solutions were poured onto both sides of a membrane in place of the electrolyte solution. The membranes used were an AMV and a CMV. As described above, the membrane does not play a fundamental role in potential generation. Consequently, whatever membrane is used, the potential characteristics should be fundamentally the same. In fact, the potential profiles obtained experimentally are fundamentally the same regardless of the membrane species used, as shown in
Figure 24. Furthermore, this potential profile is quite similar to the potential profile of
Figure 22 of
. Their similarlity is quite understandable as long as the AIH is valid. Because the AIH states that the membrane permeability to ions does not contribute the membrane potential generation [
1,
2,
3,
23]. Namely, the experimental system of
is the same as that of
other than presence/absence of the membrane.
4.2.2.
The same potential measurement as
was then performed using the procedure shown in
Table 6, but in this experiment, two types of solution were used instead of one. One is a gelatin solution and the other one is a PVA solution. A dialysis membrane was used as the membrane.
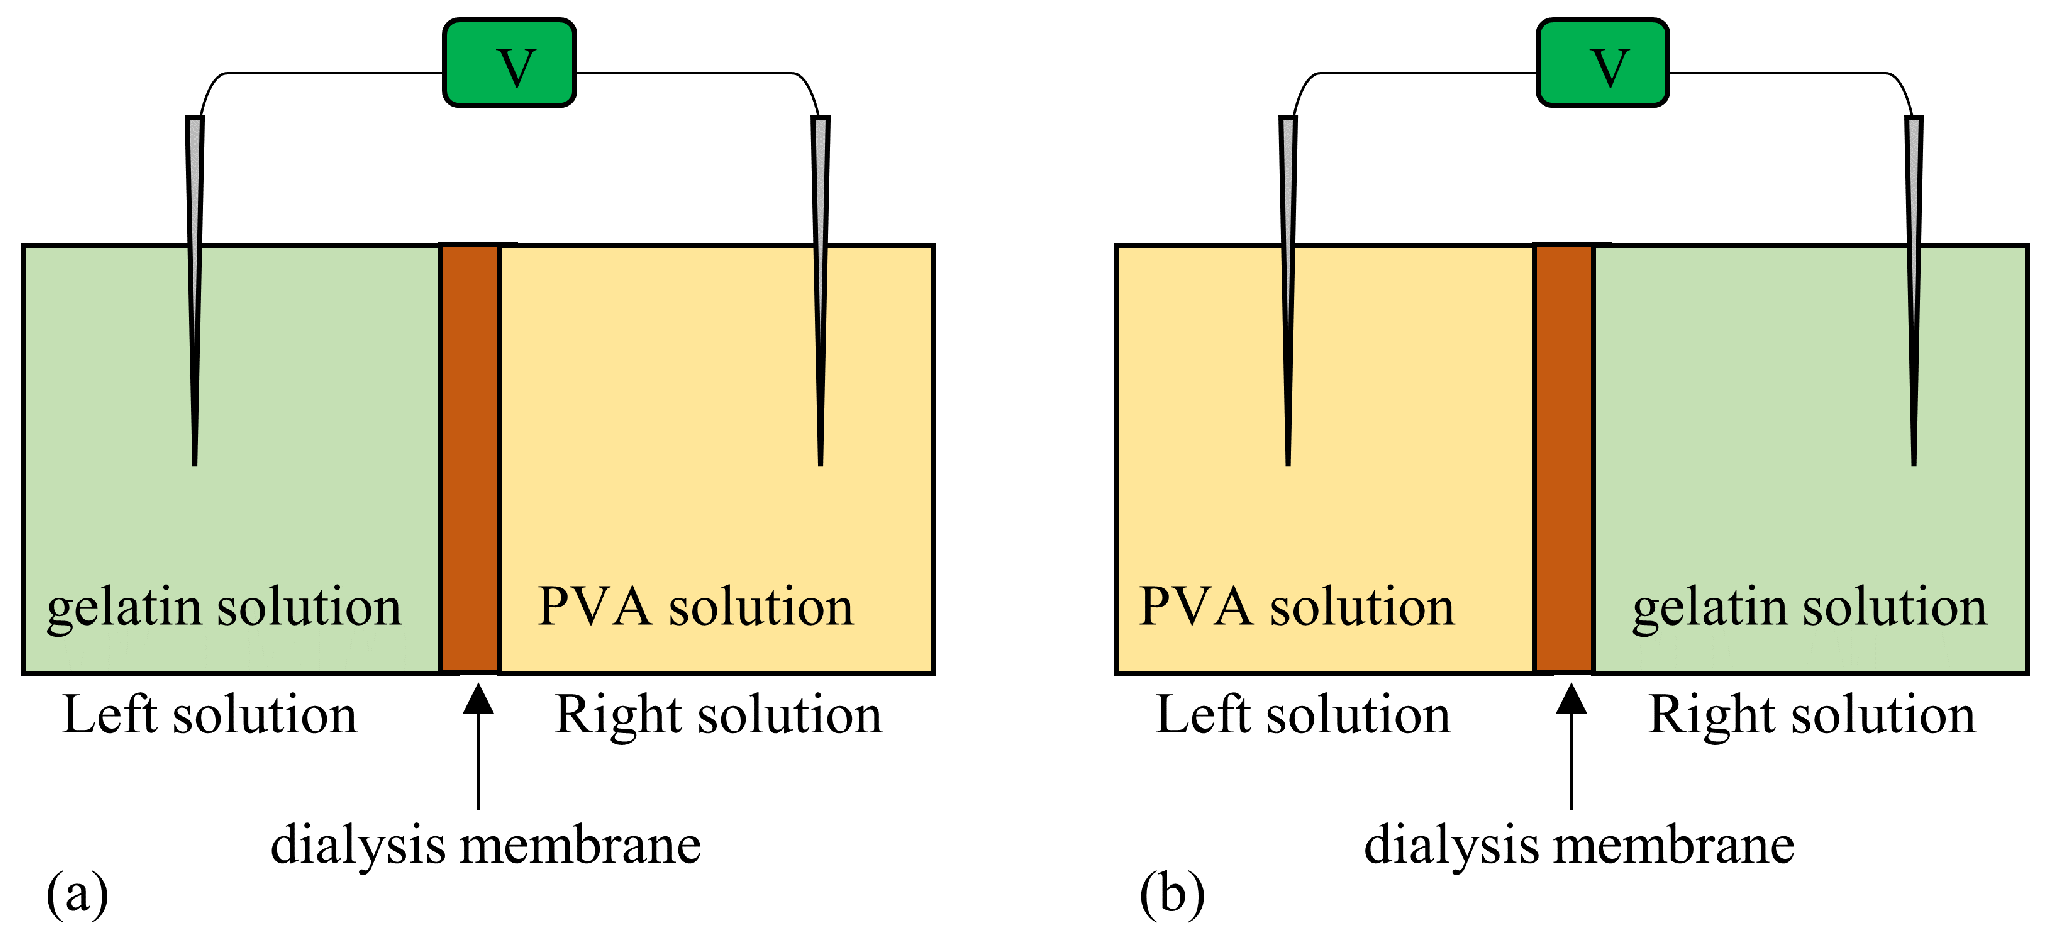
Figure 25 illustrates the setup used for
. A dialysis membrane is impermeable to gelatin and PVA molecules. The dialysis membrane is permeable to
,
and water molecules, i.e., the dialysis membrane is not an ion-selective membrane.
-1 Potential generated when the system in Figure 25(a) is used The potential profile is expected to be similar to
Figure 22 since the addition of water at t = 45 s and the addition of
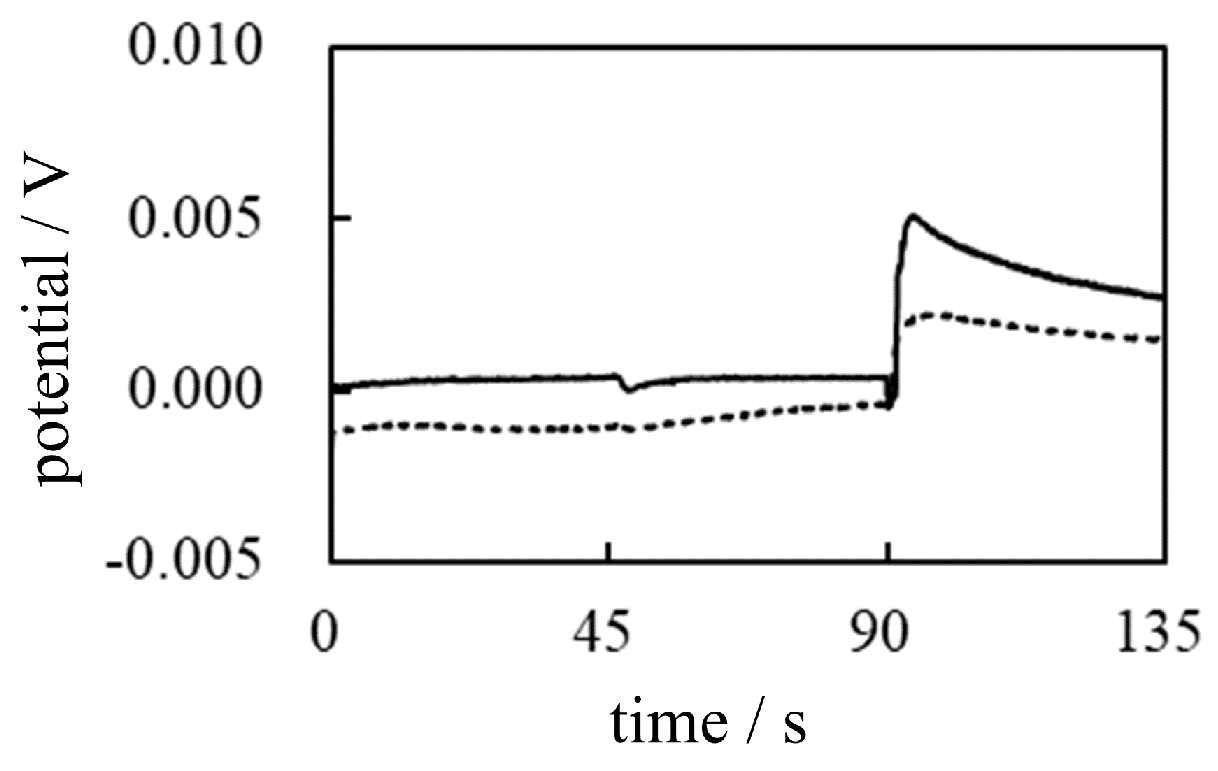
M KCl at t = 90 s are performed to the Left solution of gelatin (containing the immobile charges). As expected, the potential change was observed when the
M KCl solution was added at t = 90 s, as indicated by the solid line in
Figure 26.
-2 Potential generated when the system in Figure 25(b) is used On the other hand, the potential profile, when the system in
Figure 25(b) is used, is expected to be similar to
Figure 23 since the addition of water and
M KCl are performed in the left solution of PVA (electrically neutral molecule). As expected, the potential change was not observed even when the
M KCl solution was added at t = 90s, as indicated by the dotted line in
Figure 26.
So, both profiles in
Figure 26 are in line with the AIH prediction.
5. Viscous nature of living cell and the membrane potential
A highly fluid electrolyte solution cannot move rapidly through a viscous solution such as PVA and gelatin. The same must apply to the living cell system. Consequently, mobile ions in the protoplasm cannot easily reach the inner surface of the plasma membrane. Therefore, transmembrane ion transport is unlikely to occur as easily in living cells. Consequently, membrane potential generation is an entirely unthinkable event, although membrane theory attributes the generation of membrane potential in the living cell to transmembrane ion transport.
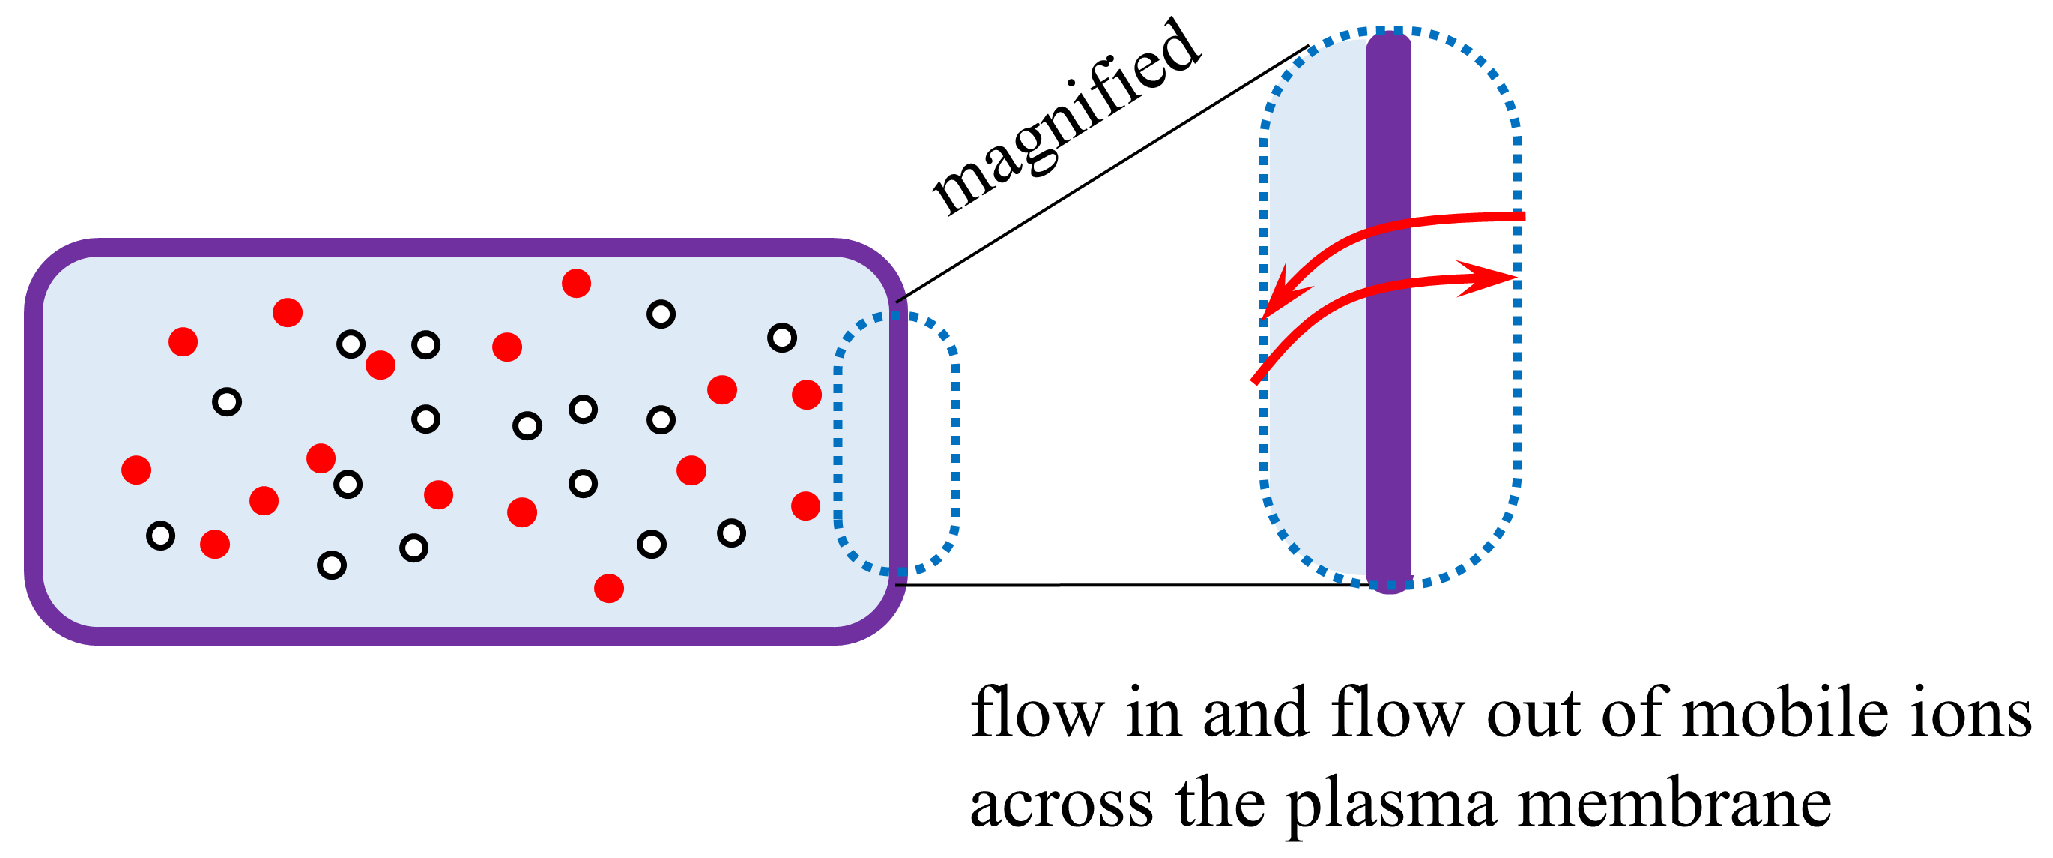
It can be argued that transmembrane ion transport occurs only in the vicinity of the plasma membrane, as illustrated in
Figure 27. Thus, the viscous nature of protoplasm does not affect the generation of membrane potential. However, common theoretical treatments performed to estimate the membrane potential always relate to the whole cell body. For example, when the well-known Goldman-Hodgkin-Katz equation (GHK eq.) is used to estimate cell potential, the local ion concentration is generally not taken into account, but the ion concentration in the entire cell is [
4,
5,
6]. If transmembrane ion transport is to be considered a local event, much of the theoretical treatment for estimating the emembrane potential must be reconsidered, even in the widely accepted membrane theory.
6. Conclusion
On the basis of our experimental and theoretical work described so far, membrane potential generation is a completely unimaginable event within the framework of membrane theory. Although membrane theory attributes the generation of the membrane potential of living cells to the transmembrane transport of ions, we discovered that the immobile charges of a living cell could serve as ion adsorption sites and that ion adsorption could result in the generation of a potential. This is an entirely natural event and an explanation in terms of traditional physics.
Living cells also contain a lot of heavily-motion-restricted charges like the charges of lipids and proteins. Therefore, it is quite natural to believe that the immobile charges of living cells are responsible for generating the membrane potential in view of the electromagnetism. At the same time, the long-forgotten physiological theory AIH also suggests that the immobile charge is responsible for generating the membrane potential. The potential characteristics of the artificial cell systems that we used for this work are in perfect agreement with the AIH prediction. How can we abandon AIH as a physiological theory? We should pay attention to the long-forgotten AIH.
Author Contributions
Conceptualization, H.T.; methodology, H.T.; validation, H.T. and B.D.; formal analysis, H.T.; investigation, H.T. and B.D.; data curation, H.T.; writing—original draft preparation, H.T.; writing—review and editing, H.T. and B.D.
Funding
This research received no external funding.
Conflicts of Interest
The authors declare no conflicts of interest.
Abbreviations
The following abbreviations are used in this manuscript:
| PVA |
polyvinyl alcohol |
| AIH |
Association-InductionHypothesis |
| IER |
Ion-Exchange Resin |
| AER |
Anion-Exchange Resin (DOWE X, Cl form, Dow Chemical Company, Michigan, USA) |
| CER |
Cation-Exchange Resin (DOWE X, H form, Dow Chemical Company, Michigan, USA) |
| IEM |
Ion-Exchange Membrane |
| AMV |
Selemino AMV (anion exchange membrane manufactured by Asahi Glass Co., Ltd.) |
| CMV |
Selemino CMV (cation exchange membrane manufactured by Asahi Glass Co., Ltd.) |
| GHK eq. |
Goldman-Hodgkin-Katz equation |
References
- Ling, G. N. A Revolution in the Physiology of the Living Cell, 1992, Krieger Pub Co, Malabar, Florida.
- Ling, G. N. Life at the Cell and Below-Cell Level: The Hidden History of a Fundamental Revolution in Biology, 2001, Pacific Press, New York.
- Ling, G. N. Debunking the alleged resurrection of the sodium pump hypothesis. Physiol. Chem. Phys. Med. NMR, 1997, 29, 123–198. [Google Scholar] [PubMed]
- Cronin, J. Mathematical aspects of Hodgkin-Huxley neural theory. Cambridge University Press, New York, 1987.
- Keener, J.; Sneyd, J. Mathematical physiology: I: cellular physiology. Interdisciplinary applied mathematics. Springer, New York, 2008.
- Ermentrout, G. B.; Terman, T. H. Mathematical foundations of neuroscience, vol 35. Interdisciplinary applied mathematics book. Springer, New York, 2010.
- Clay, J. R. Determining K channel activation curves from K+ channel K+ currents often requires the Goldman–Hodgkin–Katz equation. Frontiers in Cellular Neuroscience, 2009, 3, 1–6. [Google Scholar] [CrossRef] [PubMed]
- O. Alvarez and R. Latorre, The enduring legacy of the “constant-field equation” in membrane ion transport. J. Gen. Physiol., 2017, 1-10.
- Xie, D. An Extension of Goldman-Hodgkin-Katz Equations by Charges from Ionic Solution and Ion Channel Protein. arXiv:2208.11293, 2022. arXiv:2208.11293, 2022.
- Schwiening, C. J. A brief historical perspective: Hodgkin and Huxley Protein. J. Physiol., 2012, 590, 2571–2575. [Google Scholar] [CrossRef] [PubMed]
- Ion and water transport . TIBS - October, 1977.
- Edelman, L. DOUBTS ABOUT THE SODIUM-POTASSIUM PUMP ARE NOT PERMISSIBLE IN MODERN BIOSCIENCE. Cellular and Molecular Biology, 2005, 51, 725–729. [Google Scholar]
- Pollack, G. H. Cells, Gels and the Engines of Life: A New, Unifying Approach to Cell Function, Ebner & Sons, Seattle, USA, 2001.
- Pollack, G. H. The Fourth Phase of Water: Beyond Solid, Liquid, and Vapor, Ebner & Sons, Seattle, USA, 2013.
- G. E. Wnek, Perspective: Do Macromolecules Play a Role in the Mechanisms of Nerve Stimulation and Nervous Transmission? JOURNAL OF POLYMER SCIENCE, PART B: POLYMER PHYSICS 54, 7–14 (2016).
- Matveev, V.V. Comparison of fundamental physical properties of the model cells (protocells) and the living cells reveals the need in protophysiology. Int. J. Astrobiol. 2017, 16, 97–104. [Google Scholar] [CrossRef]
- Matveev, V.V. Cell theory, intrinsically disordered proteins, and the physics of the origin of life. Progress in Biophysics and Molecular Biology, 2019, 149, 114–130. [Google Scholar] [CrossRef] [PubMed]
- Bagatolli, L. A.; Mangiarotti, A.; Stock, R. P. Cellular metabolism and colloids: Realistically linking physiology and biological physical chemistry. Prog. Biophys. Mol. Biol. 2020, 162, 79–88. [Google Scholar] [CrossRef] [PubMed]
- Schneider, M. F. Living systems approached from physical principles. Prog. Biophys. Mol. Biol. 2020, 162, 2–25. [Google Scholar] [CrossRef] [PubMed]
- Bagatolli, L. A.; Stock, R. P. Lipids, membranes, colloids and cells: a long view. BBA Biomembranes, 2021, 1863, 183684. [Google Scholar] [CrossRef] [PubMed]
- Matveev, V. V. Membraneless physiology of the living cell. The past and the present. 4 Open, 2022, 5, 15. [Google Scholar] [CrossRef]
- Wnek, G. E.; Costa, A. C. S.; Kozawa, S. K. Bio-Mimicking, Electrical Excitability Phenomena Associated With Synthetic Macromolecular Systems: A Brief Review With Connections to the Cytoskeleton and Membraneless Organelles. Frontiers in Molecular Neuroscience, 2022, 15, 830892. [Google Scholar] [CrossRef] [PubMed]
- Ling, G. N. Nano-protoplasm: the Ultimate Unit of Life. Physiol. Chem. Phys. & Med. NMR, 2007, 39, 111–234. [Google Scholar]
- Lewis, G. N.; Randall, M. Thermodynamics and the Free Energy of Chemical Substances. McGraw-Hill, NY, 1961.
- Tamagawa, H.; Morita, S. Membrane Potential Generated by Ion Adsorption. Membranes, 2014, 4, 257–274. [Google Scholar] [CrossRef] [PubMed]
- Tamagawa, H.; Mulembo, T.; Delalande, B. What can S-shaped potential profles tell us about the mechanism of membrane potential generation? . Membranes, 2021, 50, 805–818. [Google Scholar] [CrossRef]
- Tamagawa, H.; Ikeda, K. Another interpretation of Goldman-Hodgkin-Katz equation based on the Ling’s adsorption theory, Euro. Biophys, J., 2018, 47, 869–879. [Google Scholar] [CrossRef]
- Tamagawa, H. Mathematical expression of membrane potential based on Ling’s adsorption theory is approximately the same as the Goldman–Hodgkin–Katz equation, J. Biol. Phys., 2019, 45, 13–30. [Google Scholar] [CrossRef] [PubMed]
Figure 2.
Experimental setup for measuring the solution potential.
Figure 2.
Experimental setup for measuring the solution potential.
Figure 4.
Ion-Exchange Resins (IERs) Left (a) bottle, (b) droplet, (c) microscope photo: Cation-Exchange Resin (CER) in a deionized water Right (a) bottle, (b) droplet, (c) microscope photo: Anion-Exchange Resin (AER) in a deionized water
Figure 4.
Ion-Exchange Resins (IERs) Left (a) bottle, (b) droplet, (c) microscope photo: Cation-Exchange Resin (CER) in a deionized water Right (a) bottle, (b) droplet, (c) microscope photo: Anion-Exchange Resin (AER) in a deionized water
Figure 5.
Time dependence of the potential between the indicating and the reference electrodes
Figure 5.
Time dependence of the potential between the indicating and the reference electrodes
Figure 6.
CER nearby the indicating electrode when (a) 0 s ≤ t ≤ 45 s, (b) 45 s ≤ t ≤ 90 s, (c) 90 s ≤ t ≤ 135 s “potential” suggested by two vertical arrows represents the experimentally measured potential.
Figure 6.
CER nearby the indicating electrode when (a) 0 s ≤ t ≤ 45 s, (b) 45 s ≤ t ≤ 90 s, (c) 90 s ≤ t ≤ 135 s “potential” suggested by two vertical arrows represents the experimentally measured potential.
Figure 7.
Potential profile change by the CER solution addition nearby the indicating electrode at t = 180 s “potential” suggested by two vertical arrows represents the experimentally measured potential.
Figure 7.
Potential profile change by the CER solution addition nearby the indicating electrode at t = 180 s “potential” suggested by two vertical arrows represents the experimentally measured potential.
Figure 10.
Potential profile change by the AER solution addition nearby the indicating electrode at t = 180s “potential” suggested by two vertical arrows represents the experimentally measured potential.
Figure 10.
Potential profile change by the AER solution addition nearby the indicating electrode at t = 180s “potential” suggested by two vertical arrows represents the experimentally measured potential.
Figure 12.
Experimental setup for measurring the KCl solution potential in the presence of CER and AER Be aware that the direction of x-axis is in the left.
Figure 12.
Experimental setup for measurring the KCl solution potential in the presence of CER and AER Be aware that the direction of x-axis is in the left.
Figure 13.
Potential between the indicating and the reference electrodes vs. the gap between the electrodes (x cm) in the presence of CER and AER The indicating electrode moves from x = 6.5 cm to 1.5 cm (∘), then it returns from x = 1.5 cm to x = 6.5 cm (•).
Figure 13.
Potential between the indicating and the reference electrodes vs. the gap between the electrodes (x cm) in the presence of CER and AER The indicating electrode moves from x = 6.5 cm to 1.5 cm (∘), then it returns from x = 1.5 cm to x = 6.5 cm (•).
Figure 14.
Potential between the indicating and the reference electrodes vs. time A 16 wt% PVA is used.
Figure 14.
Potential between the indicating and the reference electrodes vs. time A 16 wt% PVA is used.
Figure 16.
CER dropped from the tip of the pipette in the process of sinking from the surface of PVA solution to the petri dish bottom where the tip of the indicating electrode is placed.
Figure 16.
CER dropped from the tip of the pipette in the process of sinking from the surface of PVA solution to the petri dish bottom where the tip of the indicating electrode is placed.
Figure 18.
Ion Exchange Membranes (IEM) Left: Selemion AMV Right: Selemion CMV.
Figure 18.
Ion Exchange Membranes (IEM) Left: Selemion AMV Right: Selemion CMV.
Figure 19.
-1 &-2 Change of membrane potential across the IER caused by the addition of AER Solid line: -1, An AMV was used as an IEM Dotted line: -2, A CMV was used as an IEM.
Figure 19.
-1 &-2 Change of membrane potential across the IER caused by the addition of AER Solid line: -1, An AMV was used as an IEM Dotted line: -2, A CMV was used as an IEM.
Figure 20.
-3 &-4 Change of membrane potential across the IER caused by the addition of AER Solid line: -3 Dotted line: -4
Figure 20.
-3 &-4 Change of membrane potential across the IER caused by the addition of AER Solid line: -3 Dotted line: -4
Figure 21.
Immobile state Left: IER parciles in a aqueous solution are in the immobile state Right: Gelatin molecules in the viscous solution state Gelatin molecules are virtually in the immobile state.
Figure 21.
Immobile state Left: IER parciles in a aqueous solution are in the immobile state Right: Gelatin molecules in the viscous solution state Gelatin molecules are virtually in the immobile state.
Figure 22.
Potential generated in a gelatin solution vs. time.
Figure 22.
Potential generated in a gelatin solution vs. time.
Figure 23.
Potential generated in a PVA solution vs. time.
Figure 23.
Potential generated in a PVA solution vs. time.
Figure 24.
Potential generated across a membrane separating two gelatin solutions vs. time Solid line: potential across the CMV Dotted line: potential across the AMV.
Figure 24.
Potential generated across a membrane separating two gelatin solutions vs. time Solid line: potential across the CMV Dotted line: potential across the AMV.
Figure 25.
Setup for measuring the potential across a dialysis membrane separating a gelation solution and a PVA solution (a) Left: gelatin solution, Right: PVA solution (b) Left: gelatin solution, Right: gelatin solution For both experimental systems shown in (a) and (b), the indicating electode is always inserted in the Left solution while the reference electrode is always inserted in the Right solution.
Figure 26.
Potential generated across a dialysis membrane separating two solutions vs. time Solid line: -1 (Left phase = gelatin solution, Right phase = PVA solution) Dotted line: -2 (Left phase = PVA solution, Right phase = gelatin solution).
Figure 26.
Potential generated across a dialysis membrane separating two solutions vs. time Solid line: -1 (Left phase = gelatin solution, Right phase = PVA solution) Dotted line: -2 (Left phase = PVA solution, Right phase = gelatin solution).
Figure 27.
Illustration of the flow in and flow out of mobile ions across the plasma membrane.
Figure 27.
Illustration of the flow in and flow out of mobile ions across the plasma membrane.
Table 6.
Procedure of potential measurememt in a gelatin solution
Table 6.
Procedure of potential measurememt in a gelatin solution
|
t†2 / s |
operation |
|
0 |
onset time of the potential measurement |
| 45 |
addition of a few drops of deionized water near the indicating electrode |
| 90 |
addition of a few drops of M KCl near the indicating electrode |
|
Disclaimer/Publisher’s Note: The statements, opinions and data contained in all publications are solely those of the individual author(s) and contributor(s) and not of MDPI and/or the editor(s). MDPI and/or the editor(s) disclaim responsibility for any injury to people or property resulting from any ideas, methods, instructions or products referred to in the content. |
© 2024 by the authors. Licensee MDPI, Basel, Switzerland. This article is an open access article distributed under the terms and conditions of the Creative Commons Attribution (CC BY) license (http://creativecommons.org/licenses/by/4.0/).

