1. Introduction
The aging workforce occurs when the labor force structure is affected by the aging population, leading to a shift in age groups among workers [
1], [
2], [
3]. With older individuals facing longevity risks and a low fertility rate leading to skewed age group compositions among workers, there is now a trend for older people to work longer to support themselves without relying solely on pension income – especially given that most pension funds are insufficient. Consequently, statutory pension retirement ages have been raised to ensure economic growth and sufficient pensions when older adults retire.
Since gaining independence in 1957, Malaysia has experienced a consistent upward trend in labor force participation rates across different age groups and genders. These changes reflect broader socio-economic developments and shifts in the country's labor market structure. Previous studies have mainly focused on gender disparity in labor force participation, highlighting a strong correlation between women’s participation and national economic growth [
4]. Despite improvements in women’s educational attainment, their participation remains significantly lower than that of men [
5] [
6]. Furthermore, the statistics underlined demographic changes policy reforms like dual-earner couples trends which are playing key roles at enhancing high rates of female LFPR [
7]. The gender gap in labor force participation is clearly decreasing, with women surpassing men in areas like paid work hours and lifetime employment. This trend has been attributed to various factors, including increasing education levels among women, changing societal norms, and government policies promoting gender equality in the workforce.
Another significant trend in labor force participation in Malaysia is the increasing participation of older individuals. This is a result of both demographic changes, such as an aging population, and policy reforms that encourage extended workforce participation, workforce experience, and education [
8]. The decision to retire early may be influenced by the influx of new participants into the job market as well as negative perceptions about the performance of older workers compared to younger ones, possibly leading to age discrimination, or physical and mental health issues[
9], [
10], [
11]. In light of these complexities and uncertainties surrounding retirement decisions, the use of advanced forecasting methods becomes crucial in capturing and understanding the dynamics of labor force participation rates and accurately predicting future trends [
12]
One of the most notable shifts in Malaysia’s labor force is the narrowing gender gap, illustrating that women are increasingly participating in the workforce at levels comparable to or even higher than men. women are increasingly surpassing men in several labor-related aspects, such as paid work hours, lifetime labor experience, and educational attainment. A prominent study by [
13] explores the factors influencing labor force participation in Malaysia by employing a stochastic model approach to analyze the impact of both cyclical fluctuations and long-run structural trends on labor force participation rates. With ICT accessibility in enabling women to earn income and be part of the labor force, there is potential for increasing female labor force participation in Malaysia and reducing the need for immigrant labor [
14], [
15].
Despite these changes, there are still significant gender differences in LFPR. In the majority of nations, male LFPR remains higher than female participation. This is the result of a variety of factors, including discrimination, unequal access to education and training, and societal expectations regarding gender roles and responsibilities. In fact, informal care is unpaid care provided by family members, typically women, to ill or disabled children, elderly parents, or other family members influence the strong correlation with female LFPR [
16], [
17], [
18], [
19]. The proportion of women in the labor force in Malaysia [
20], offering valuable empirical data on LFP trends in the country especially the dual earner couple trends[
21]. This increase in labor force participation rates, particularly among women, can be attributed to a combination of demographic changes, policy reforms, and advancements in technology. The broader perspective on the demographic and economic factors influencing labor force participation in the region, offering valuable insights into the complexities of LFP dynamics includes the impact of old-age dependency, life expectancy, and GDP per capita on labor force productivity in selected ASEAN countries, including Malaysia [
22] and its states [
23].
A study exploring factors influencing LFP using a stochastic model approach to analyze both cyclical fluctuations and long-run structural trends affecting participation rates. They emphasize the role of information technology accessibility in enabling women to earn income as part of the workforce. Insights from [
14] suggest potential for increased female labor force participation as well as reduced reliance on immigrant labor. Increased research interest has delved into important trends such as economic influences by authors [
24], [
25]. Further statistical data presented by [
7] provides valuable empirical insights into recent dual-earner couple trends specifically relating to Malaysian women's involvement in the labour market. Technological advancements, policy interventions, and demographic shifts have all contributed to this trend. Finally, the broader perspective considers various factors such as old-age dependency, rising life expectancy, GDP per capita, influencing labor force productivity covering ASEAN countries including Malaysia [
22]. Aging workforce is one of the main components that affect this projection rate. Therefore, it raises several questions whether these older adults are willing to work in their golden ages regardless of their health status, productivity, [
26], [
27], [
28] and social responsibilities [
29].
The Lee-Carter mortality model is a prominent demographic tool used for predicting age-specific mortality rates. It is known for its straightforwardness and its two-factor structure, which takes into account both age and time variables. The Cairns-Blake-Dowd (CBD) model, which was introduced in 2006, builds upon the foundation of the Lee-Carter model. It expands the model's capabilities by integrating extra factors, such as a cohort factor in its three-factor variant. The Lee-Carter model is commonly utilised for different age groups, but the Cairns-Blake-Dowd model focuses specifically on the elderly population. Several research suggested tweaks to the Lee-Carter model that would make it more effective at modeling and forecasting rates. Some examples of these adjustments are using a Bayesian method [
30] incorporating randomness or an error term into the model [
30], [
31], or employing a state-space model to get around the biodemographic constraint and using resampling method to improve forecasting accuracy [
32]. Moreover, Lee-Carter model has been contrasted with other models, including the neural networks [
33], autoregressive integrated moving average (ARIMA) model [
34], and modified Lee-Carter model with bias-corrected estimators [
35]. Although several improvements have been made, the Lee-Carter model is still commonly used for predictions. There have been various methods and models used to forecast mortality rates, with the Lee-Carter model and Cairns-Blake-Dowd model being commonly used in empirical studies. CBD model with a cohort effect was found to provide the greatest fit for males in England and Wales [
36], whereas the quadratic CBD model showed the best fit to mortality data in other studies [
37]. However, other research indicated that variants of Lee-Carter model better suit their data [
31], [
38], [
39]. For simplicity of this research, the standard Lee-Carter model and CBD model were utilized to compare the LFPR forecast for higher ages.
To forecast LFPR, it is essential to consider the challenges and complexities associated with predicting such behavior. Previous studies have highlighted the difficulty of accurately forecasting LFP rates, with some demonstrating that even sophisticated econometric models perform similarly to random walk models in short-term predictions [
40] Furthermore, the evolution of labor supply behavior, particularly among married women, has been studied extensively, revealing significant changes in participation elasticities over time [
41] However, there is a scarcity of stochastic forecasts for LFPR, with existing studies primarily relying on time series modeling, indicating a gap in the literature for more advanced forecasting methods [
42]. Moreover, the use of credible regression approaches with random coefficients and Kou-Modified Lee-Carter model, has been proposed for modeling and forecasting mortality dynamics, suggesting the potential applicability of similar methods in forecasting LFPR [
43]. Furthermore, the adaptation of the Lee-Carter method for forecasting LFPR, ELR in specific regions, such as Brazil, highlights the need for tailored forecasting approaches to account for regional variations in labor force behavior [
12]. While some studies have focused on joint modeling of male and female labor force participation and unemployment rates, there is a lack of comprehensive research that integrates various factors influencing LFPR, such as impacts of lifestyle, demographic, economic, and social determinants [
44]. Furthermore, the cyclical behavior of labor force participation has been studied, emphasizing the dynamic nature of LFPR and the need for models that can capture such fluctuations [
45].
In line with the literature, this study will further the research by applying the Lee-Carter and Cairns-Blake-Dowd models to forecast the labor force participation rate and calculate the duration of retirement for older workers aged 50 to 64 years old, both male and female. where both employees and employers contribute to private and public funds. The results exposed discrepancies between the models, providing evidence of model risk for longer retirement durations.
3. Results
3.1. Results for Lee Carter Model
3.1.1. Time index, and Period effect,,
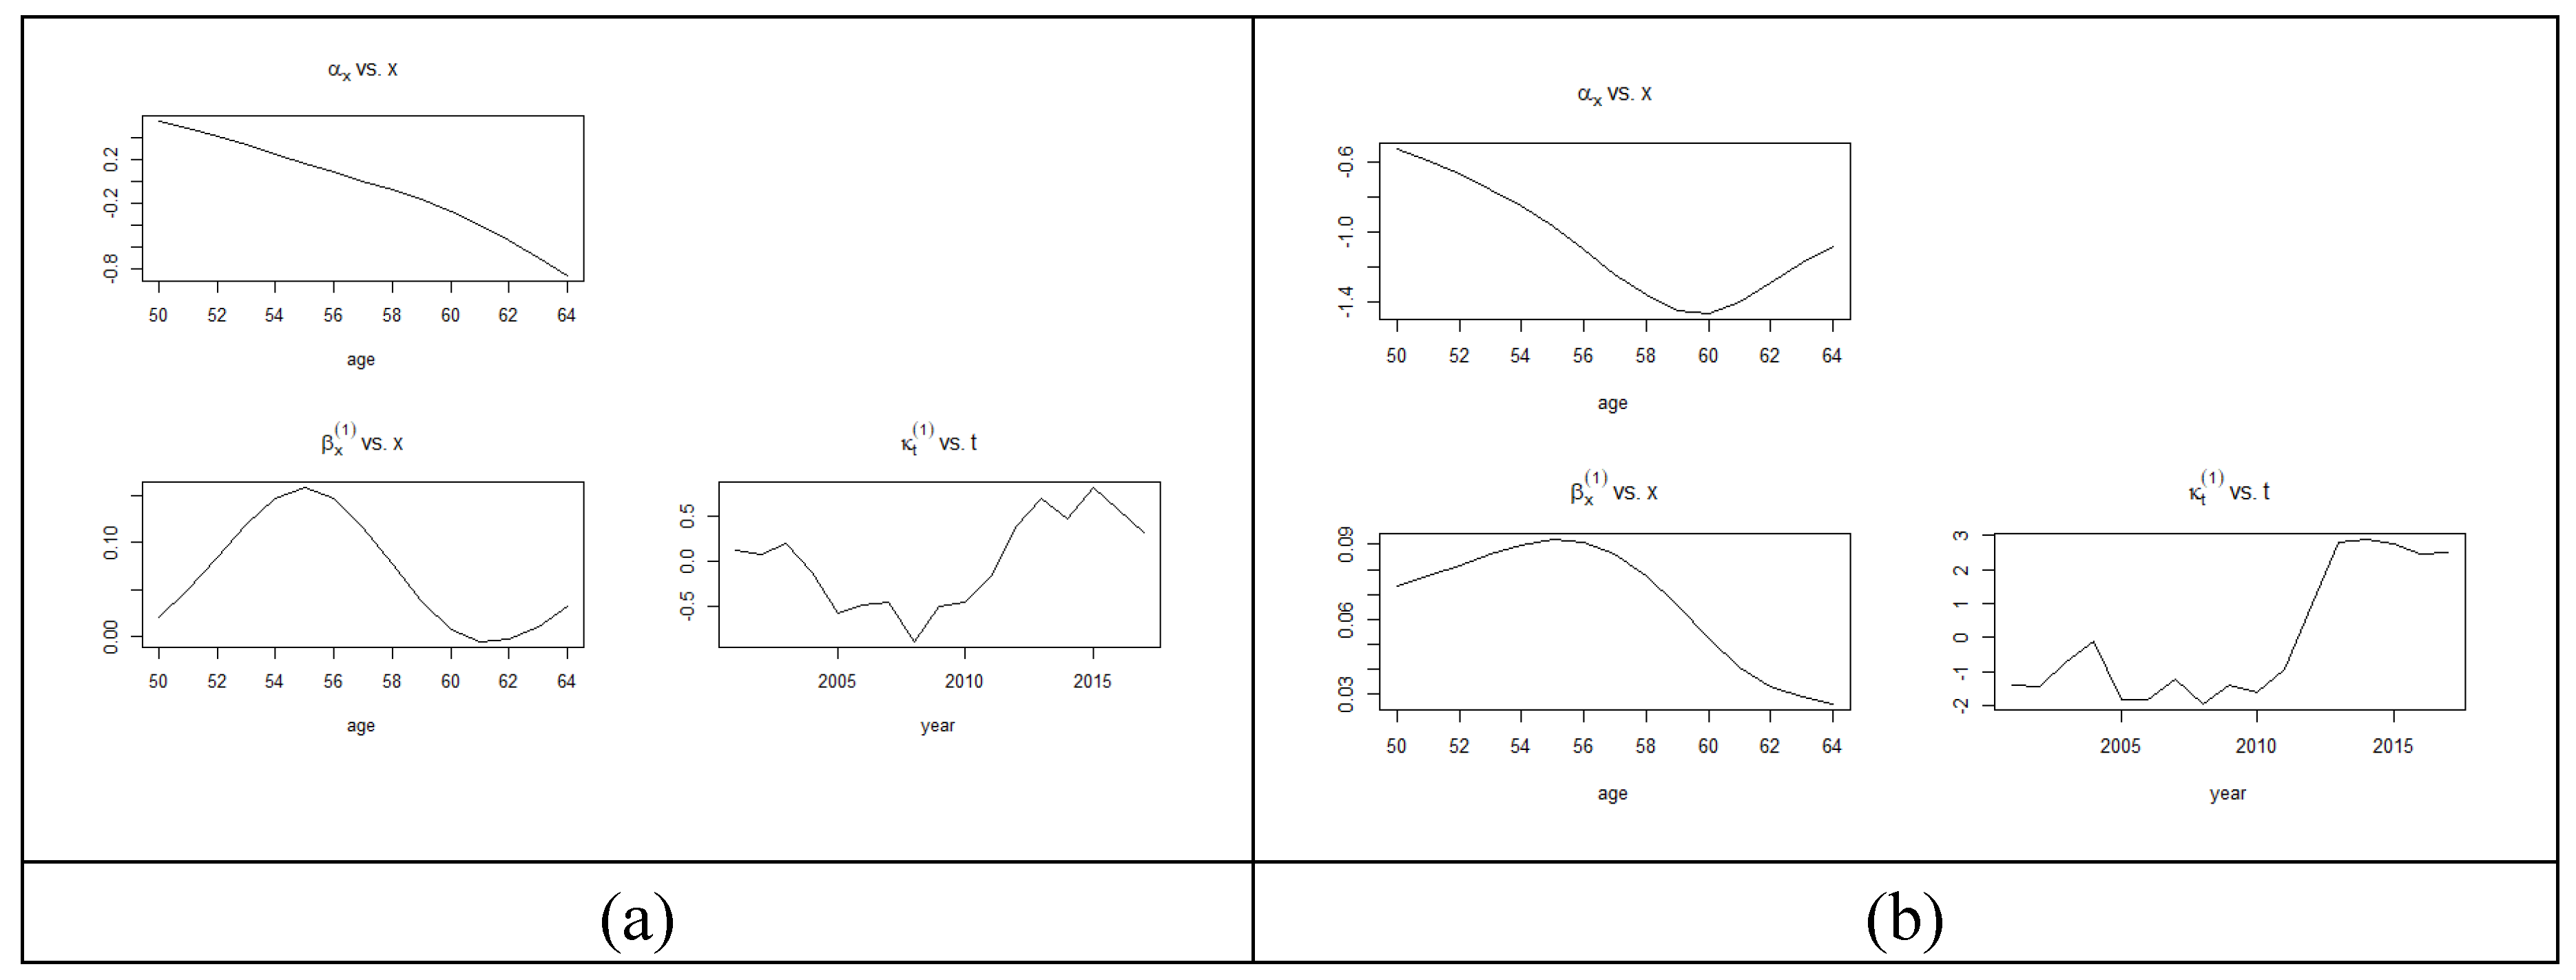
The parameter estimates under the Lee Carter estimation for LFP male and female are shown in
Figure 1. The
values indicate the sensitivity of the rate to changes in the underlying factors captured by parameter
. The higher the
value, the more responsive the rate is to the changes in
.
The values male workers are positive but decrease with age. This implies that younger age groups' LFP rates are more sensitive to the overall time trend captured by , indicating a stronger reaction to economic or policy changes. The parameter indicates the trend over time. The fluctuations between positive and negative values suggest varying periods of growth and decline in the LFPR. Positive values in the later years (2012-2017) imply a recovery or an upward trend in the labor force participation rate.
We also estimated the parameters of Lee Carter model for female LFP rate (age 50-64) and the parameters are shown in
Figure 1(b). The
bx values are positive across all ages and decrease less dramatically with age compared to males. This could mean that the female labor force across different ages is consistently responsive to the same economic or policy changes influencing LFPR. The
values for females are highly negative in the early and mid-2000s, indicating a significant decline in LFP rates, but the positive
values after 2012 show a strong reversal in the trend, suggesting a possible increase in female labor force participation.
The difference in the sensitiveness of values between male and female LFP rates implied that there might be gender-specific factors influencing the rates. It also suggested that changes in economic, social, or demographic conditions captured by the parameter had a stronger influence on female LFPR compared to male. Therefore, the findings indicated that there were gender disparities in the LFPR, with females being more responsive to the changes captured by the parameter. These disparities could be influenced by several factors, including societal norms.
The Lee-Carter model parameters suggest that younger males have higher baseline LFPR that decrease with age, with increased participation rates in recent years. For females, the baseline participation rates are lower, decrease with age, and show a significant rebound in participation rates in later years.
3.1.2. Forecasted
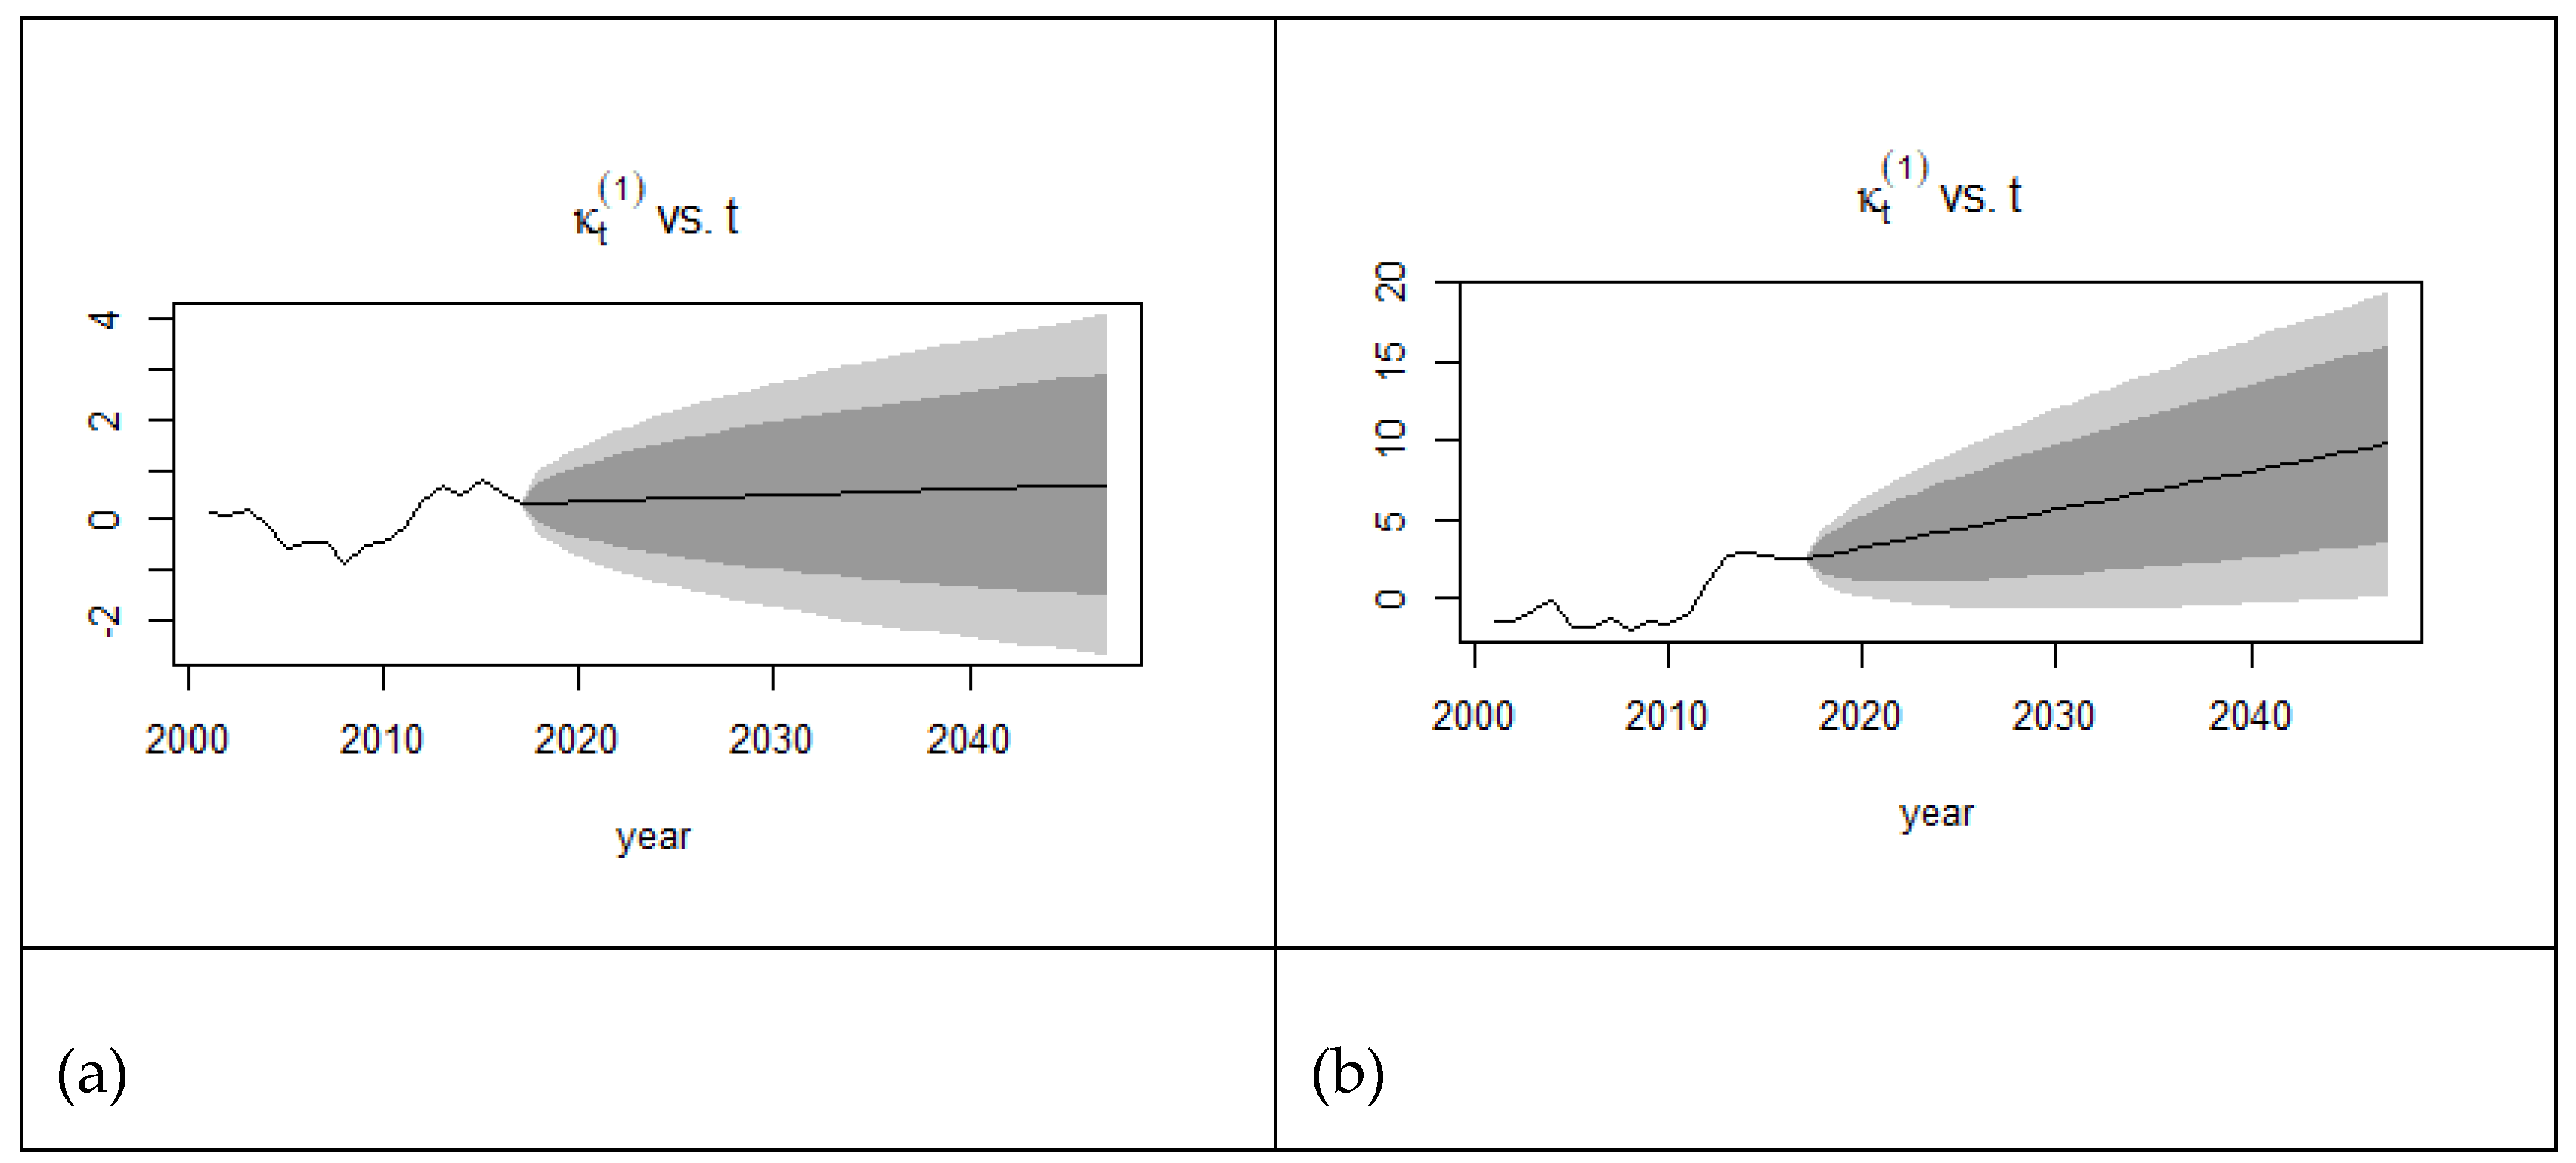
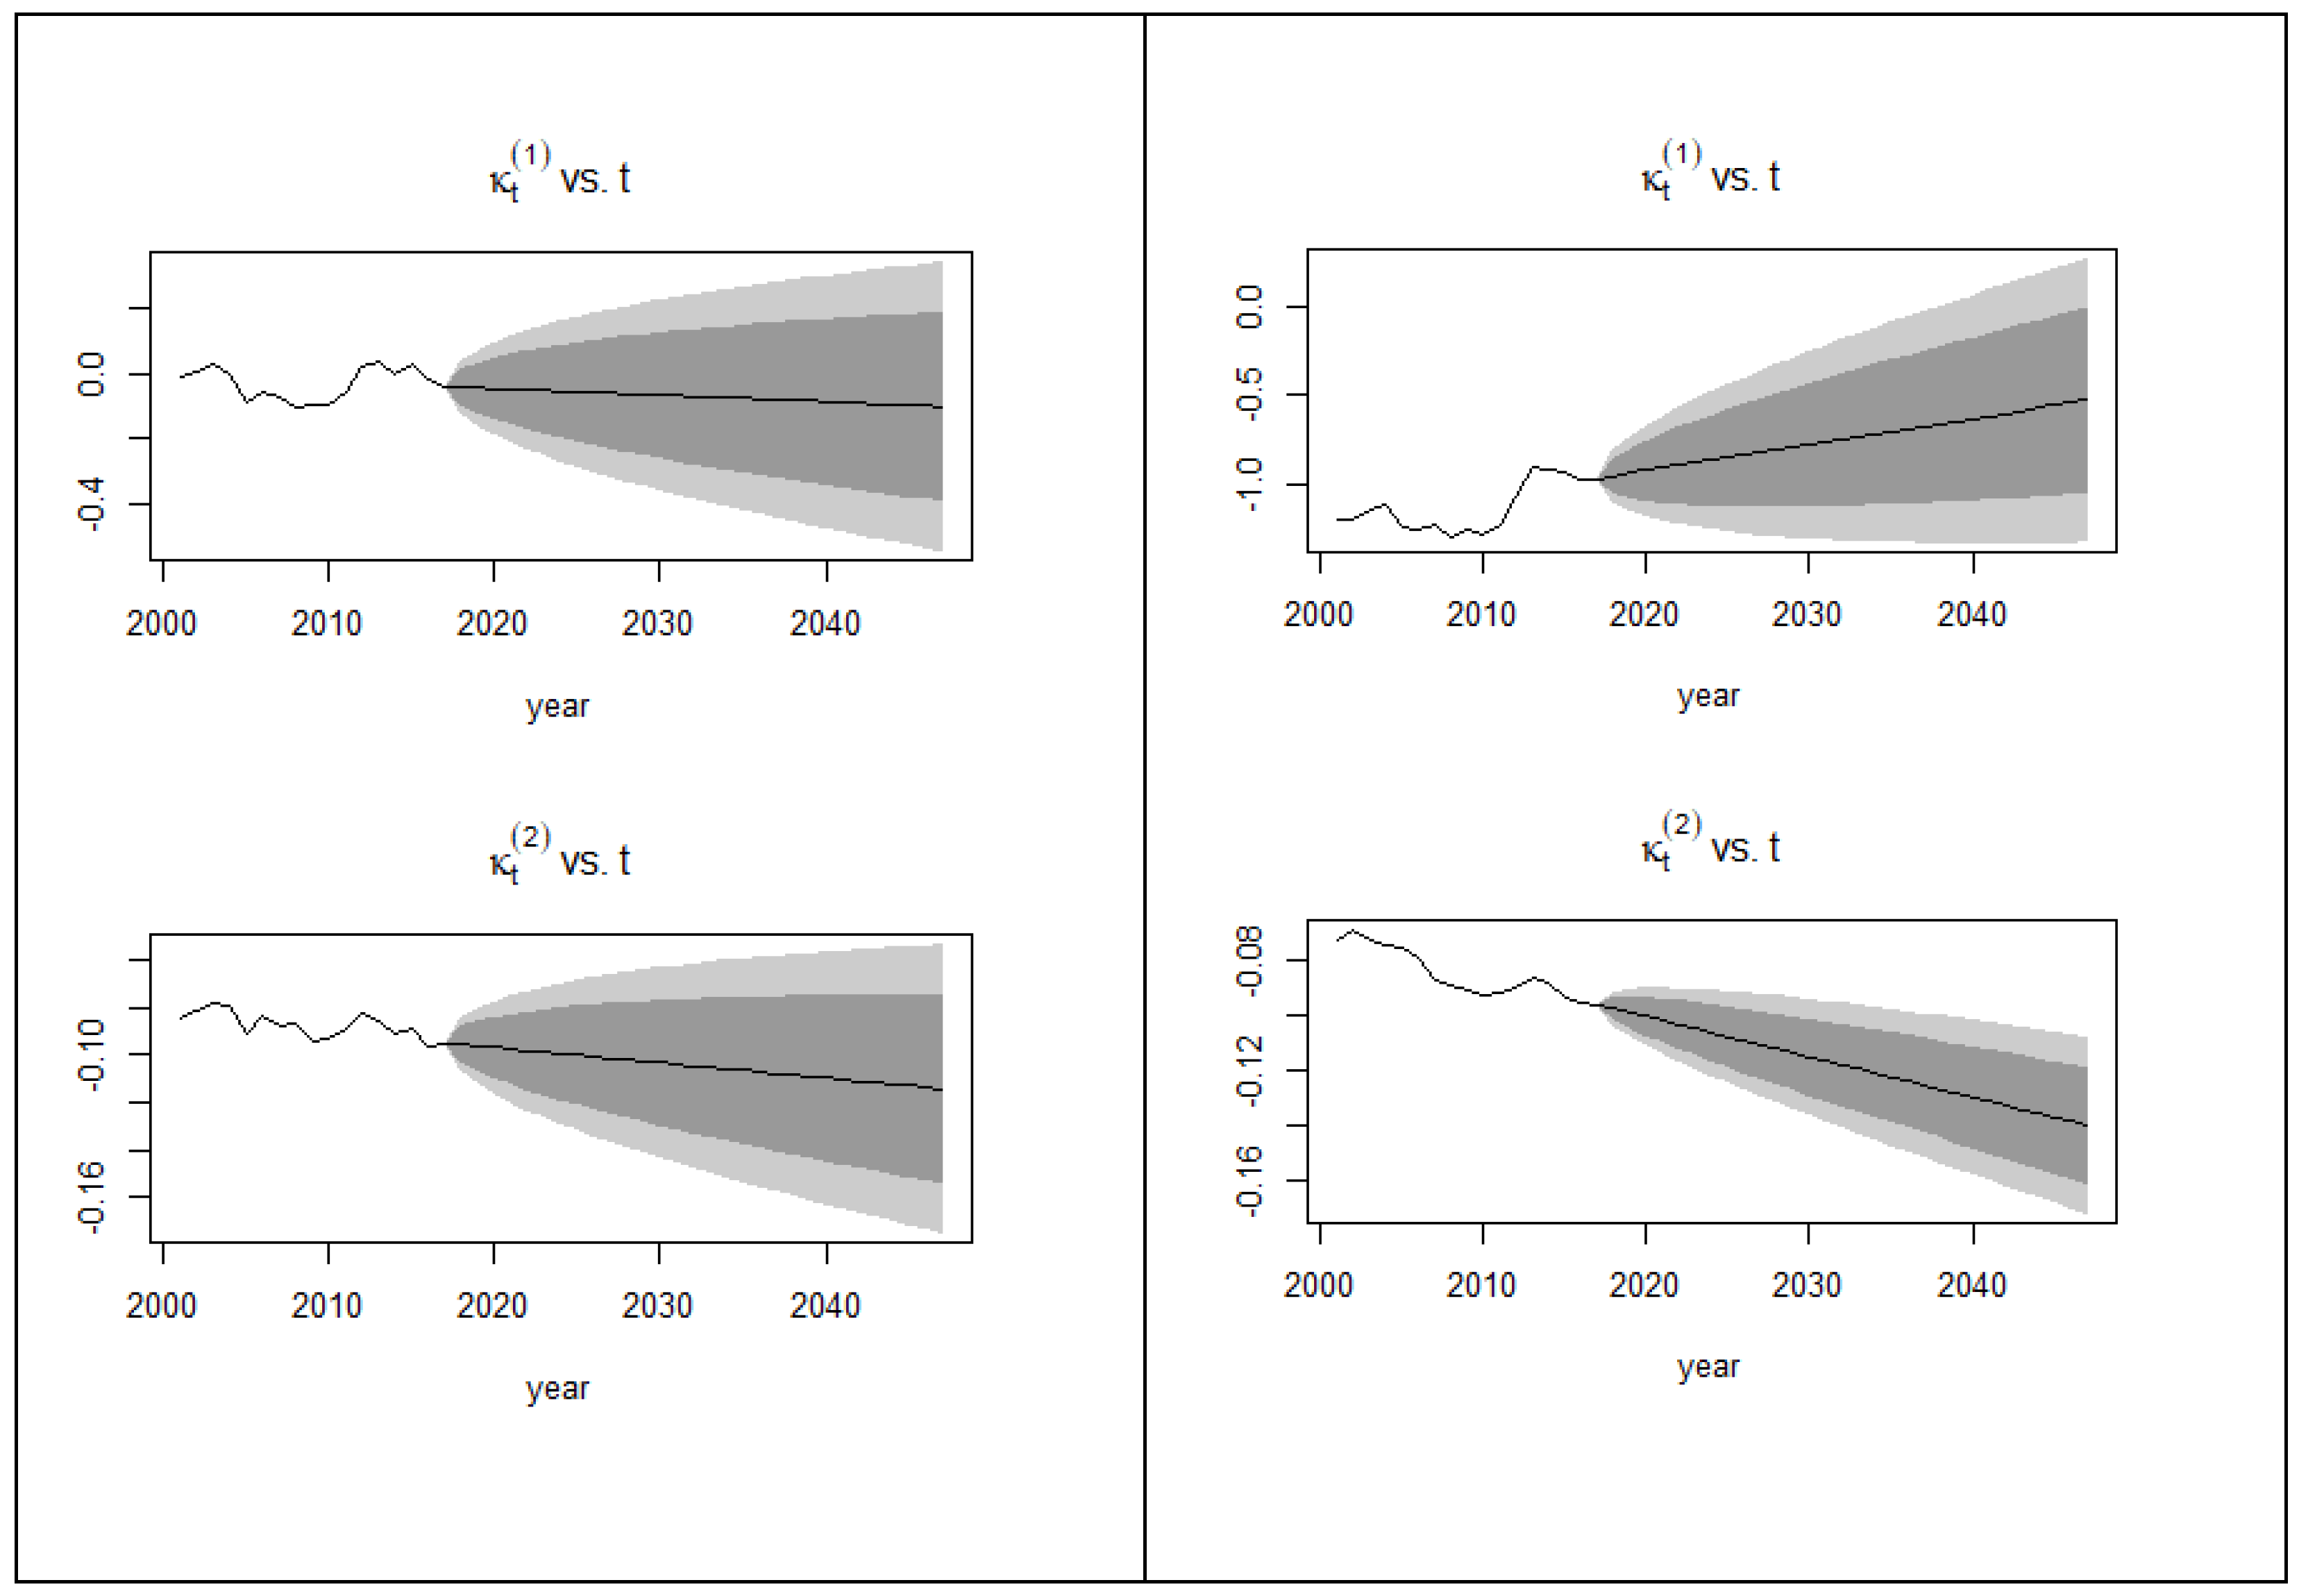
The forecast of labor force participation for the male and female Malaysian population from 2018 to 2047, reveals distinct trends. For males, the forecasted values steadily increase from 0.33 in 2018 to 0.70 in 2047. This gradual rise indicates a consistent upward trend in the labor force participation of older men over the forecast period. The increase might reflect the growing inclination among older men to remain in or re-enter the workforce due to economic necessities or personal choice, as well as potential policy shifts encouraging extended working lives.
For females, the forecasted values begin at a much higher level of 2.75 in 2018 and escalate more sharply to 9.81 by 2047. The higher starting point and steeper incline in forecasted for females suggest a more significant shift in labor force participation among older women. This could be due to changes in societal norms, increased empowerment and education, policy reforms aimed at encouraging female labor force participation, or a combination of these factors.
Figure 2.
Forecasted time index, kt for LC model for (a) male and (b) female.
Figure 2.
Forecasted time index, kt for LC model for (a) male and (b) female.
The much higher forecasted values for females throughout the period suggest that while both older men and women are projected to participate more in the labor force, the relative increase for women is substantially more pronounced. This might imply a notable shift in gender dynamics within the labor market, possibly reflecting a closing gender gap in labor force participation among older age groups in Malaysia.
3.2. Results for Cairns-Blake-Dowd Model
3.2.1. Time index and
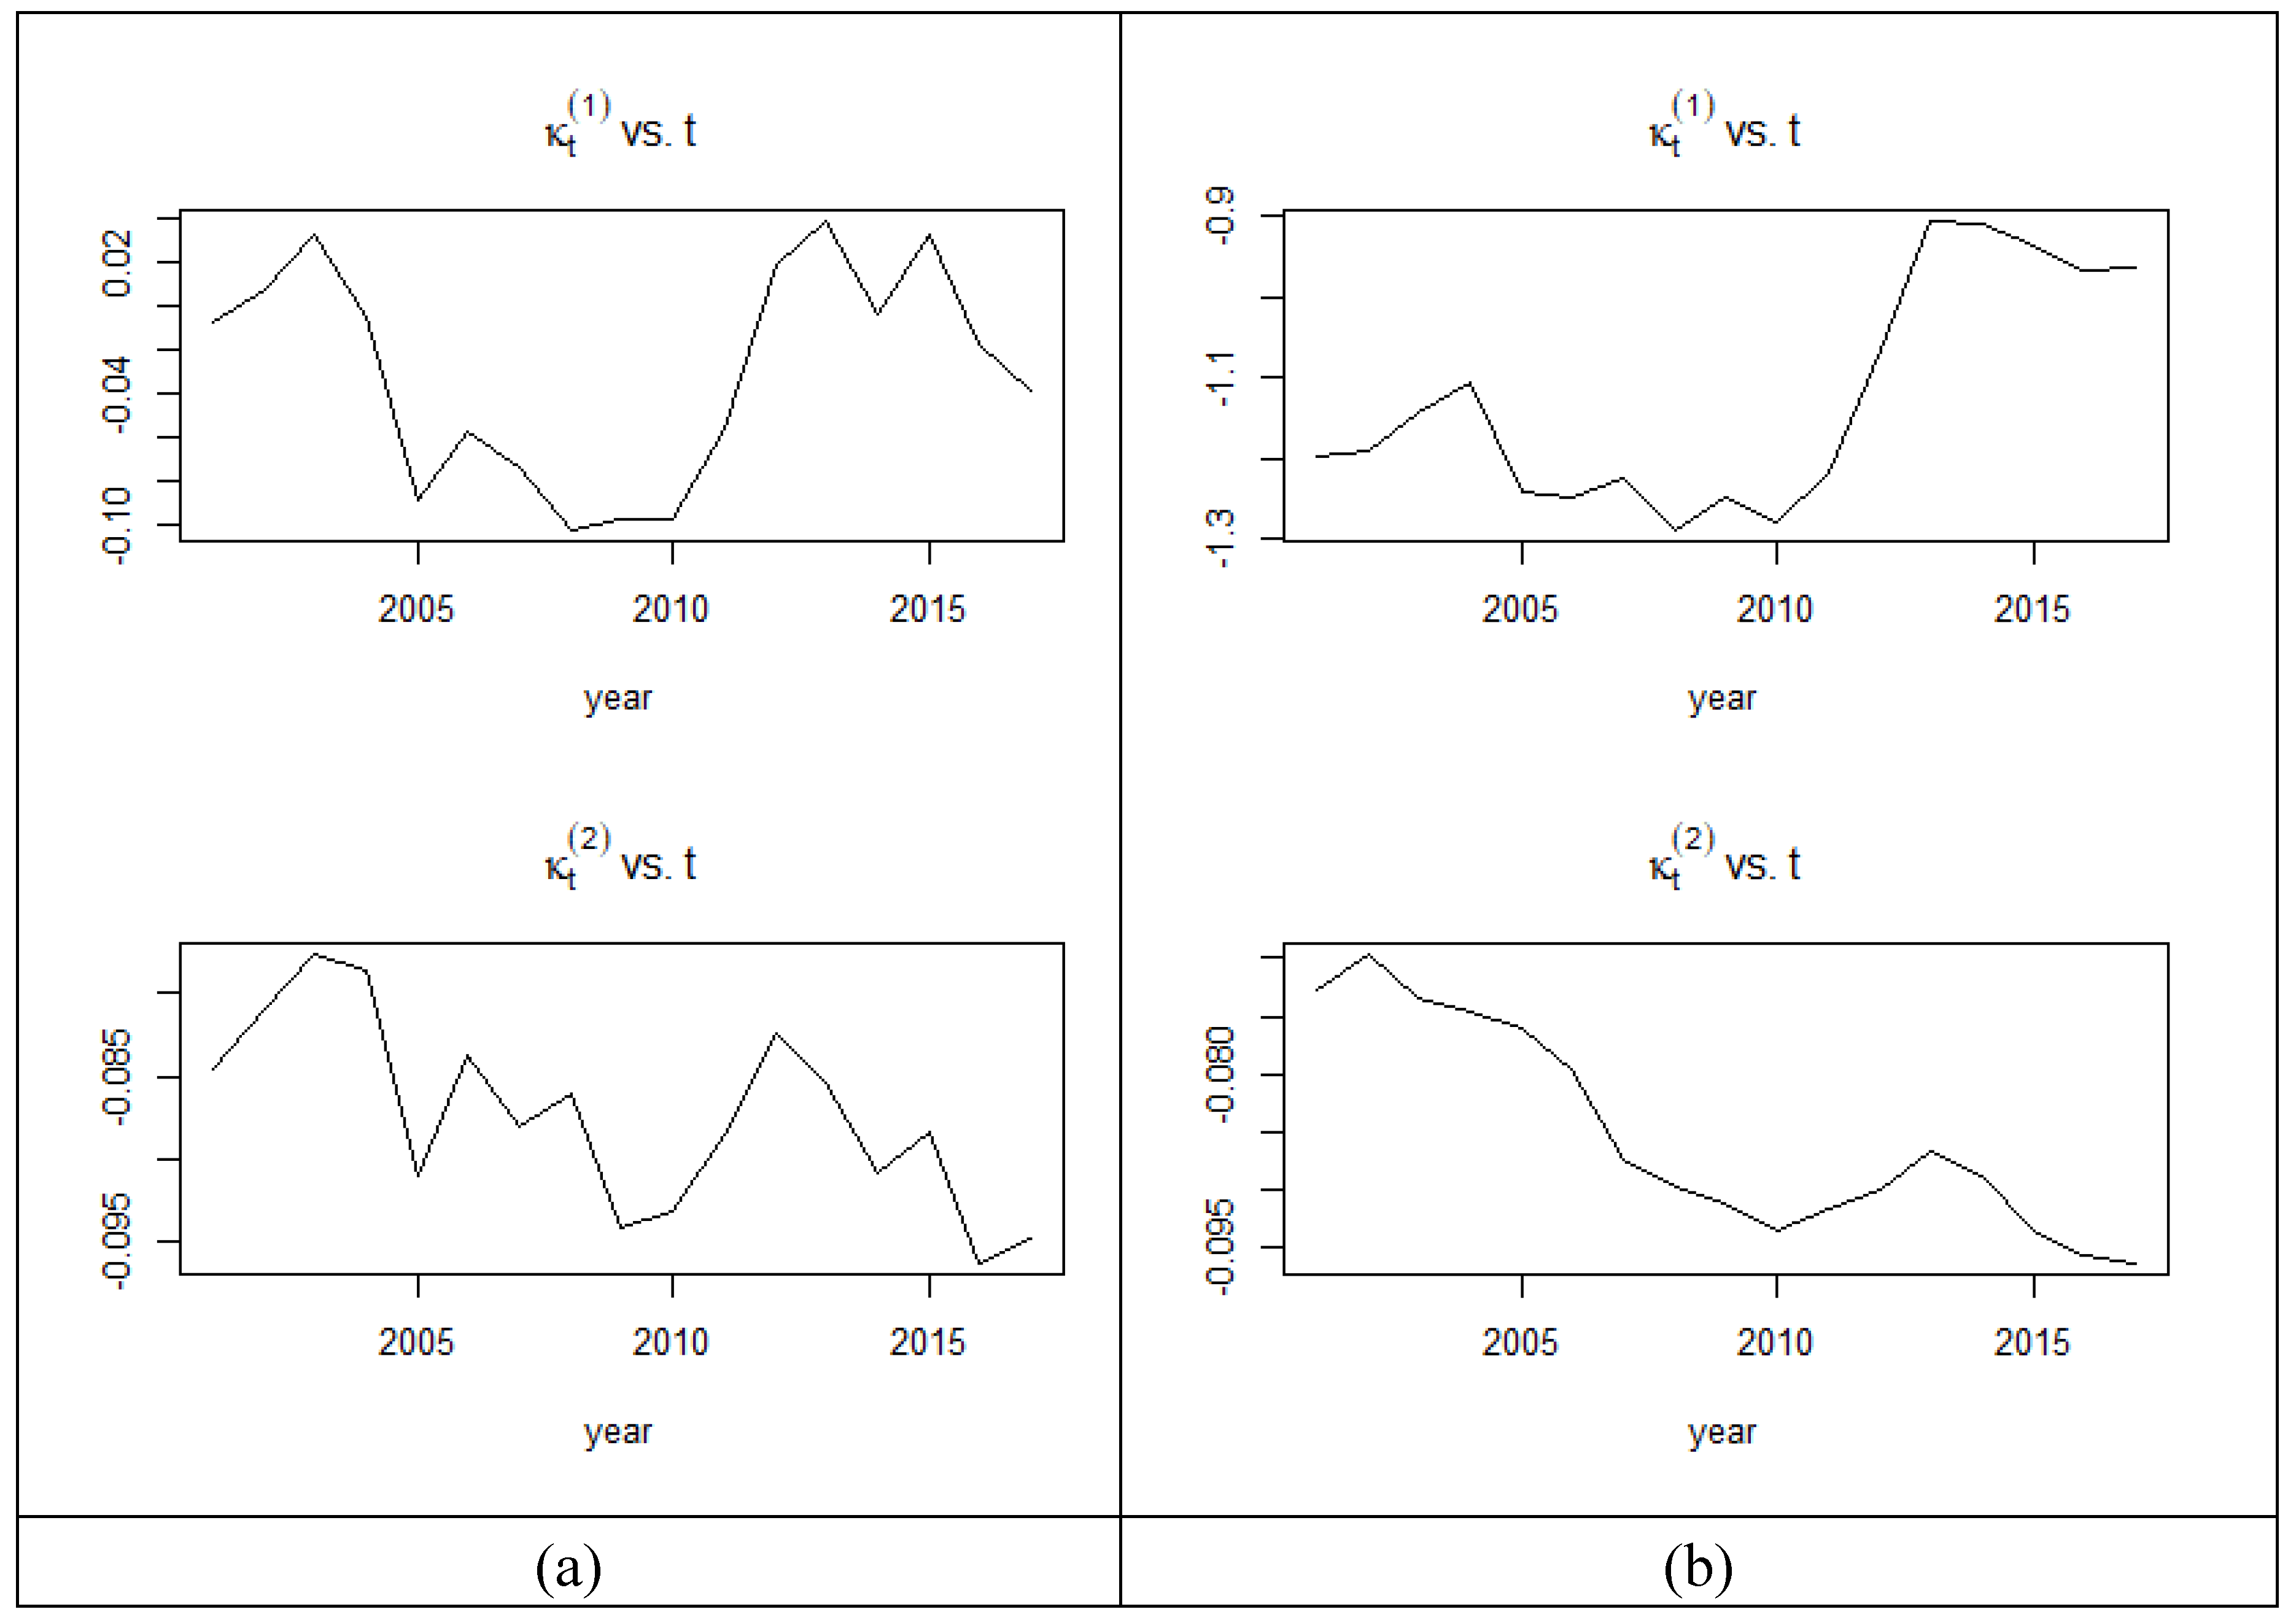
Figure 3 shows the time-varying parameter of CBD model for male LFPR (2001-2017). The time index
is the model intercept, therefore it affects all ages equally. Specifically, if
decreases over time, it indicates that people of all ages are entering the labor force at an increasing rate. The slope of the model is represented by the time index
, which affects each age in a unique way. For male labor force, The
values exhibit variability, with negative values indicating periods of decline and positive values indicating growth in the LFPR. and
values are negative throughout, which may suggest a long-term structural decline in LFPR.
For female workers in
Figure 4, the
and
values showed decreasing trends. The decreasing trend of
and
values for females are similar to men with larger in magnitude, suggesting a more significant and consistent decline in LFPR over the years, which are shown in
Figure 3.
The Cairns-Blake-Dowd model parameters for males indicate periods of both decline and growth in LFPR with an overall structural decline, whereas for females, they suggest a more pronounced decline in LFPR that may be stabilizing in recent years.
3.2.2. Forecasted and
For males, both forecasted and values decrease over the forecast period. The negative slope in both parameters suggests a decrease in the force of mortality, which can be interpreted as an improvement in the survival rates or a delay in mortality among the male population. Since these parameters are inversely related to labor force participation in the context of survival rates, the implication could be that older males are expected to stay active in the labor force for longer periods due to improved life expectancy.
The values for females show a much larger magnitude of decrease compared to males, indicating a more significant decrease in mortality force. This significant shift may reflect a stronger trend among females towards increased survival and potentially greater labor force participation at older ages compared to males.
Overall, the trends suggest that both older Malaysian men and women are expected to have increased longevity, with a more pronounced effect among women. This would likely contribute to an increased presence of older adults in the labor market as they live healthier for longer and choose or need to continue working. The forecast indicates the importance of considering gender-specific health improvements and longevity in planning for labor market participation policies, retirement planning, and pension sustainability.
3.3. Labor Force Participation rate (LFPR)
The training and test sets were used respectively to estimate the parameters and to obtain the prediction errors (RMSE and MAPE). We select the better model between Lee-Carter and CBD by comparing the Akaike Information Criterion (AIC) and Bayesian nformation Criterion (BIC), root mean square error (RMSE) and mean absolute percentage error (MAPE) using the test data (2017-2021). The
Table 1 shows the out-of-sample results for male and female LFPR.
where
k is the number of estimated parameters,
L is the maximized value of the likelihood function of the model and
n is the number of observations.
where
is the actual observed value,
is the predicted value l and
n is the number of observations.
The AIC and BIC of CBD model were higher than Lee-Carter model, indicating a poorer fit to the data. The RMSE and MAPE for CBD model were also higher than Lee-Carter model, indicating a lower accuracy in forecasting the LFPR. Based on these measures, the Lee-Carter model outperformed the CBD model.
For males, the Lee Carter model has better goodness-of-fit measures (AIC, BIC) and forecast accuracy (RMSE, MAPE) compared to the CBD model. For females, while the Lee Carter model has higher AIC and BIC values, its forecasts are significantly less accurate than for males. The CBD model has a higher AIC and BIC but a lower MAPE, suggesting more accurate average forecasts. The Lee Carter model is preferred for males due to its overall lower AIC, BIC, RMSE, and MAPE.
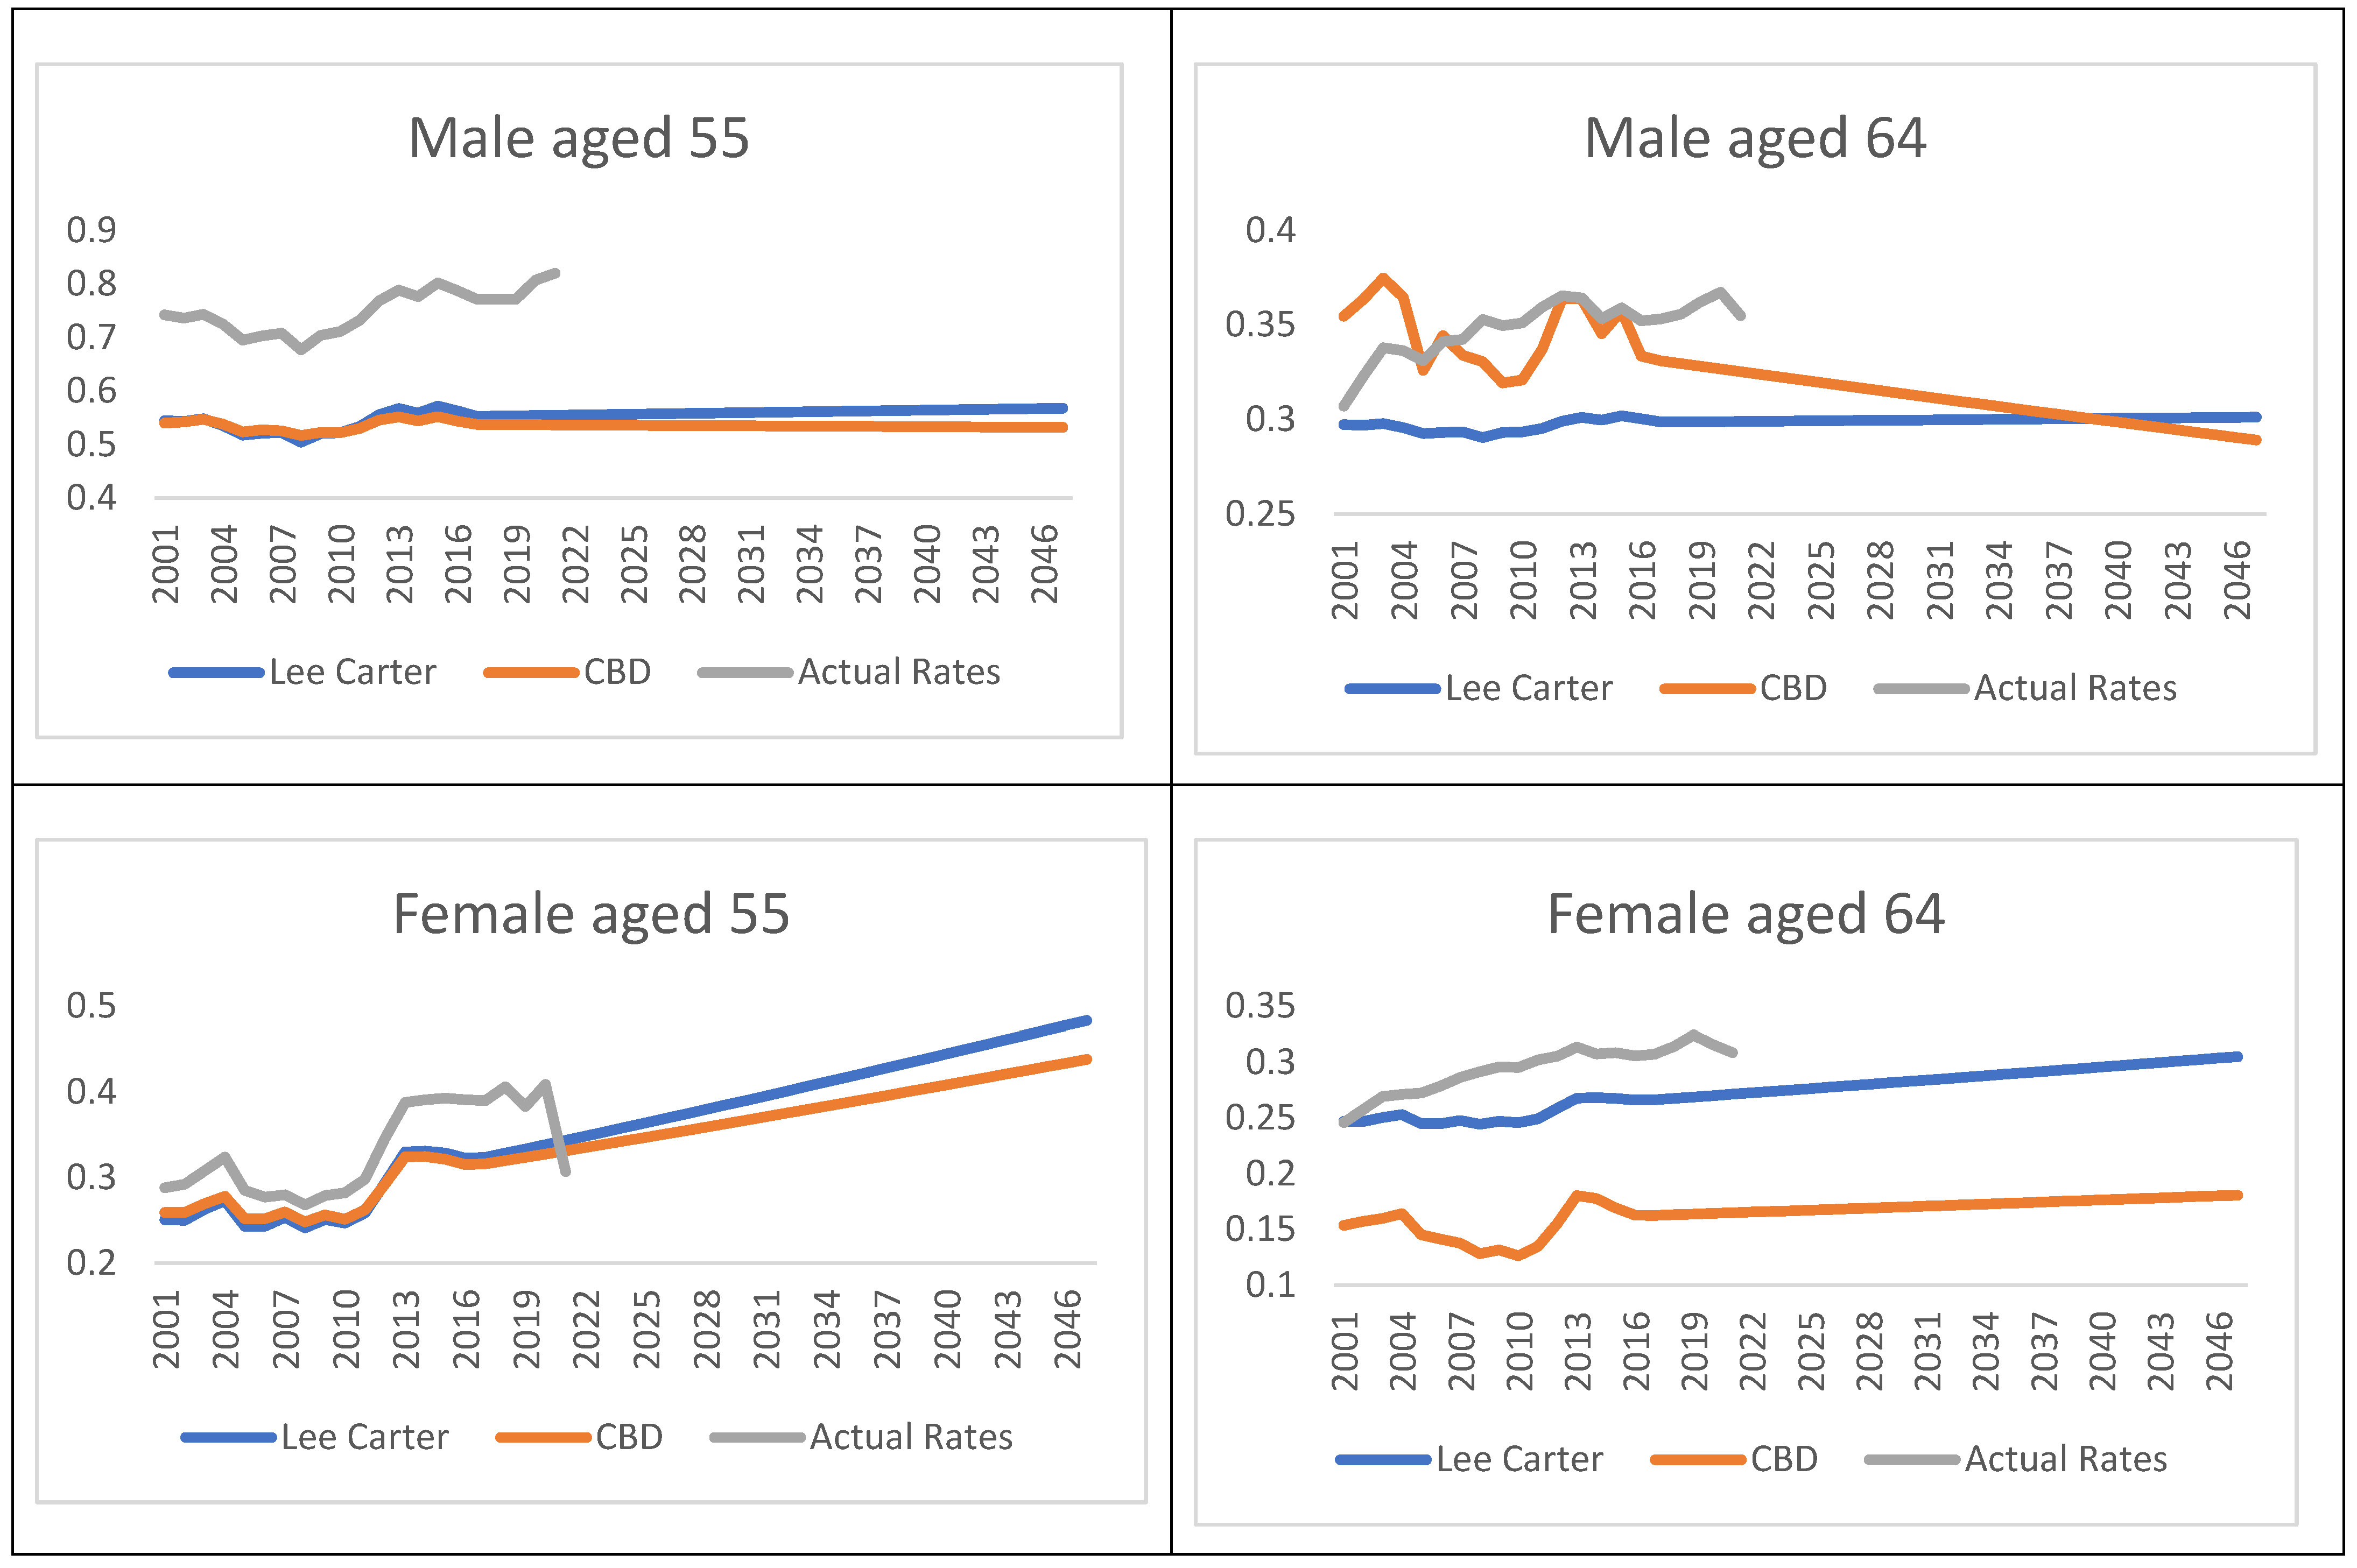
The Lee Carter model as shown in
Figure 5 forecasts a steady but marginal increase in LFPR from 0.29 in 2018 to 0.3013 in 2047. This CBD model shows a more significant decrease, from 0.323 in 2018 to 0.29 in 2047. The actual LFPR rose from 0.3557 in 2018 to 0.35 in 2021. The Lee-Carter model's prediction of a slight increase seems to align more closely with the actual trend, while the CBD model indicates a potential overestimation of the decline. Both models might not fully capture the observed increase in the actual LFPR.
For male worker aged 55, the Lee-Carter model shows a gradual increase, more aligned with the actual increasing trend up to 2021, whereas the CBD model predicts a slight decline. For this demographic, the Lee-Carter model appears to provide a better fit. Meanwhile, for age 64, the Lee-Carter model predicts a slight increase, more in line with the actual data, while the CBD model forecasts a notable decrease. Again, the Lee-Carter model seems more accurate.
For female forecast, both models predict an increase, but the Lee-Carter model’s predictions are higher, which seems more consistent with the actual trend of increasing participation rates. For older workers, the Lee-Carter model's predictions are more consistent with the actual rates, while the CBD model considerably underestimates the LFPR.
The Lee-Carter model generally provides a better fit and forecast for the Malaysian LFPR across both genders and age groups. It more accurately reflects the actual trends observed in the historical data and offers projections that align more closely with the expected demographic and labor market trends in Malaysia.
3.4. Duration of retirement
Working life expectancy and expected length of retirement (ELR) are two related concepts that are important when considering employment and retirement planning. Working life expectancy is the projected number of years an individual is expected to be actively participating in the labor force, while the ELR is the projected number of years an individual is likely to spend in retirement after exiting the labor force.
The ELR is calculated starting from age 50, [
56] and reflects the expected duration of retirement given the labor force participation rate and life expectancy. As shown in
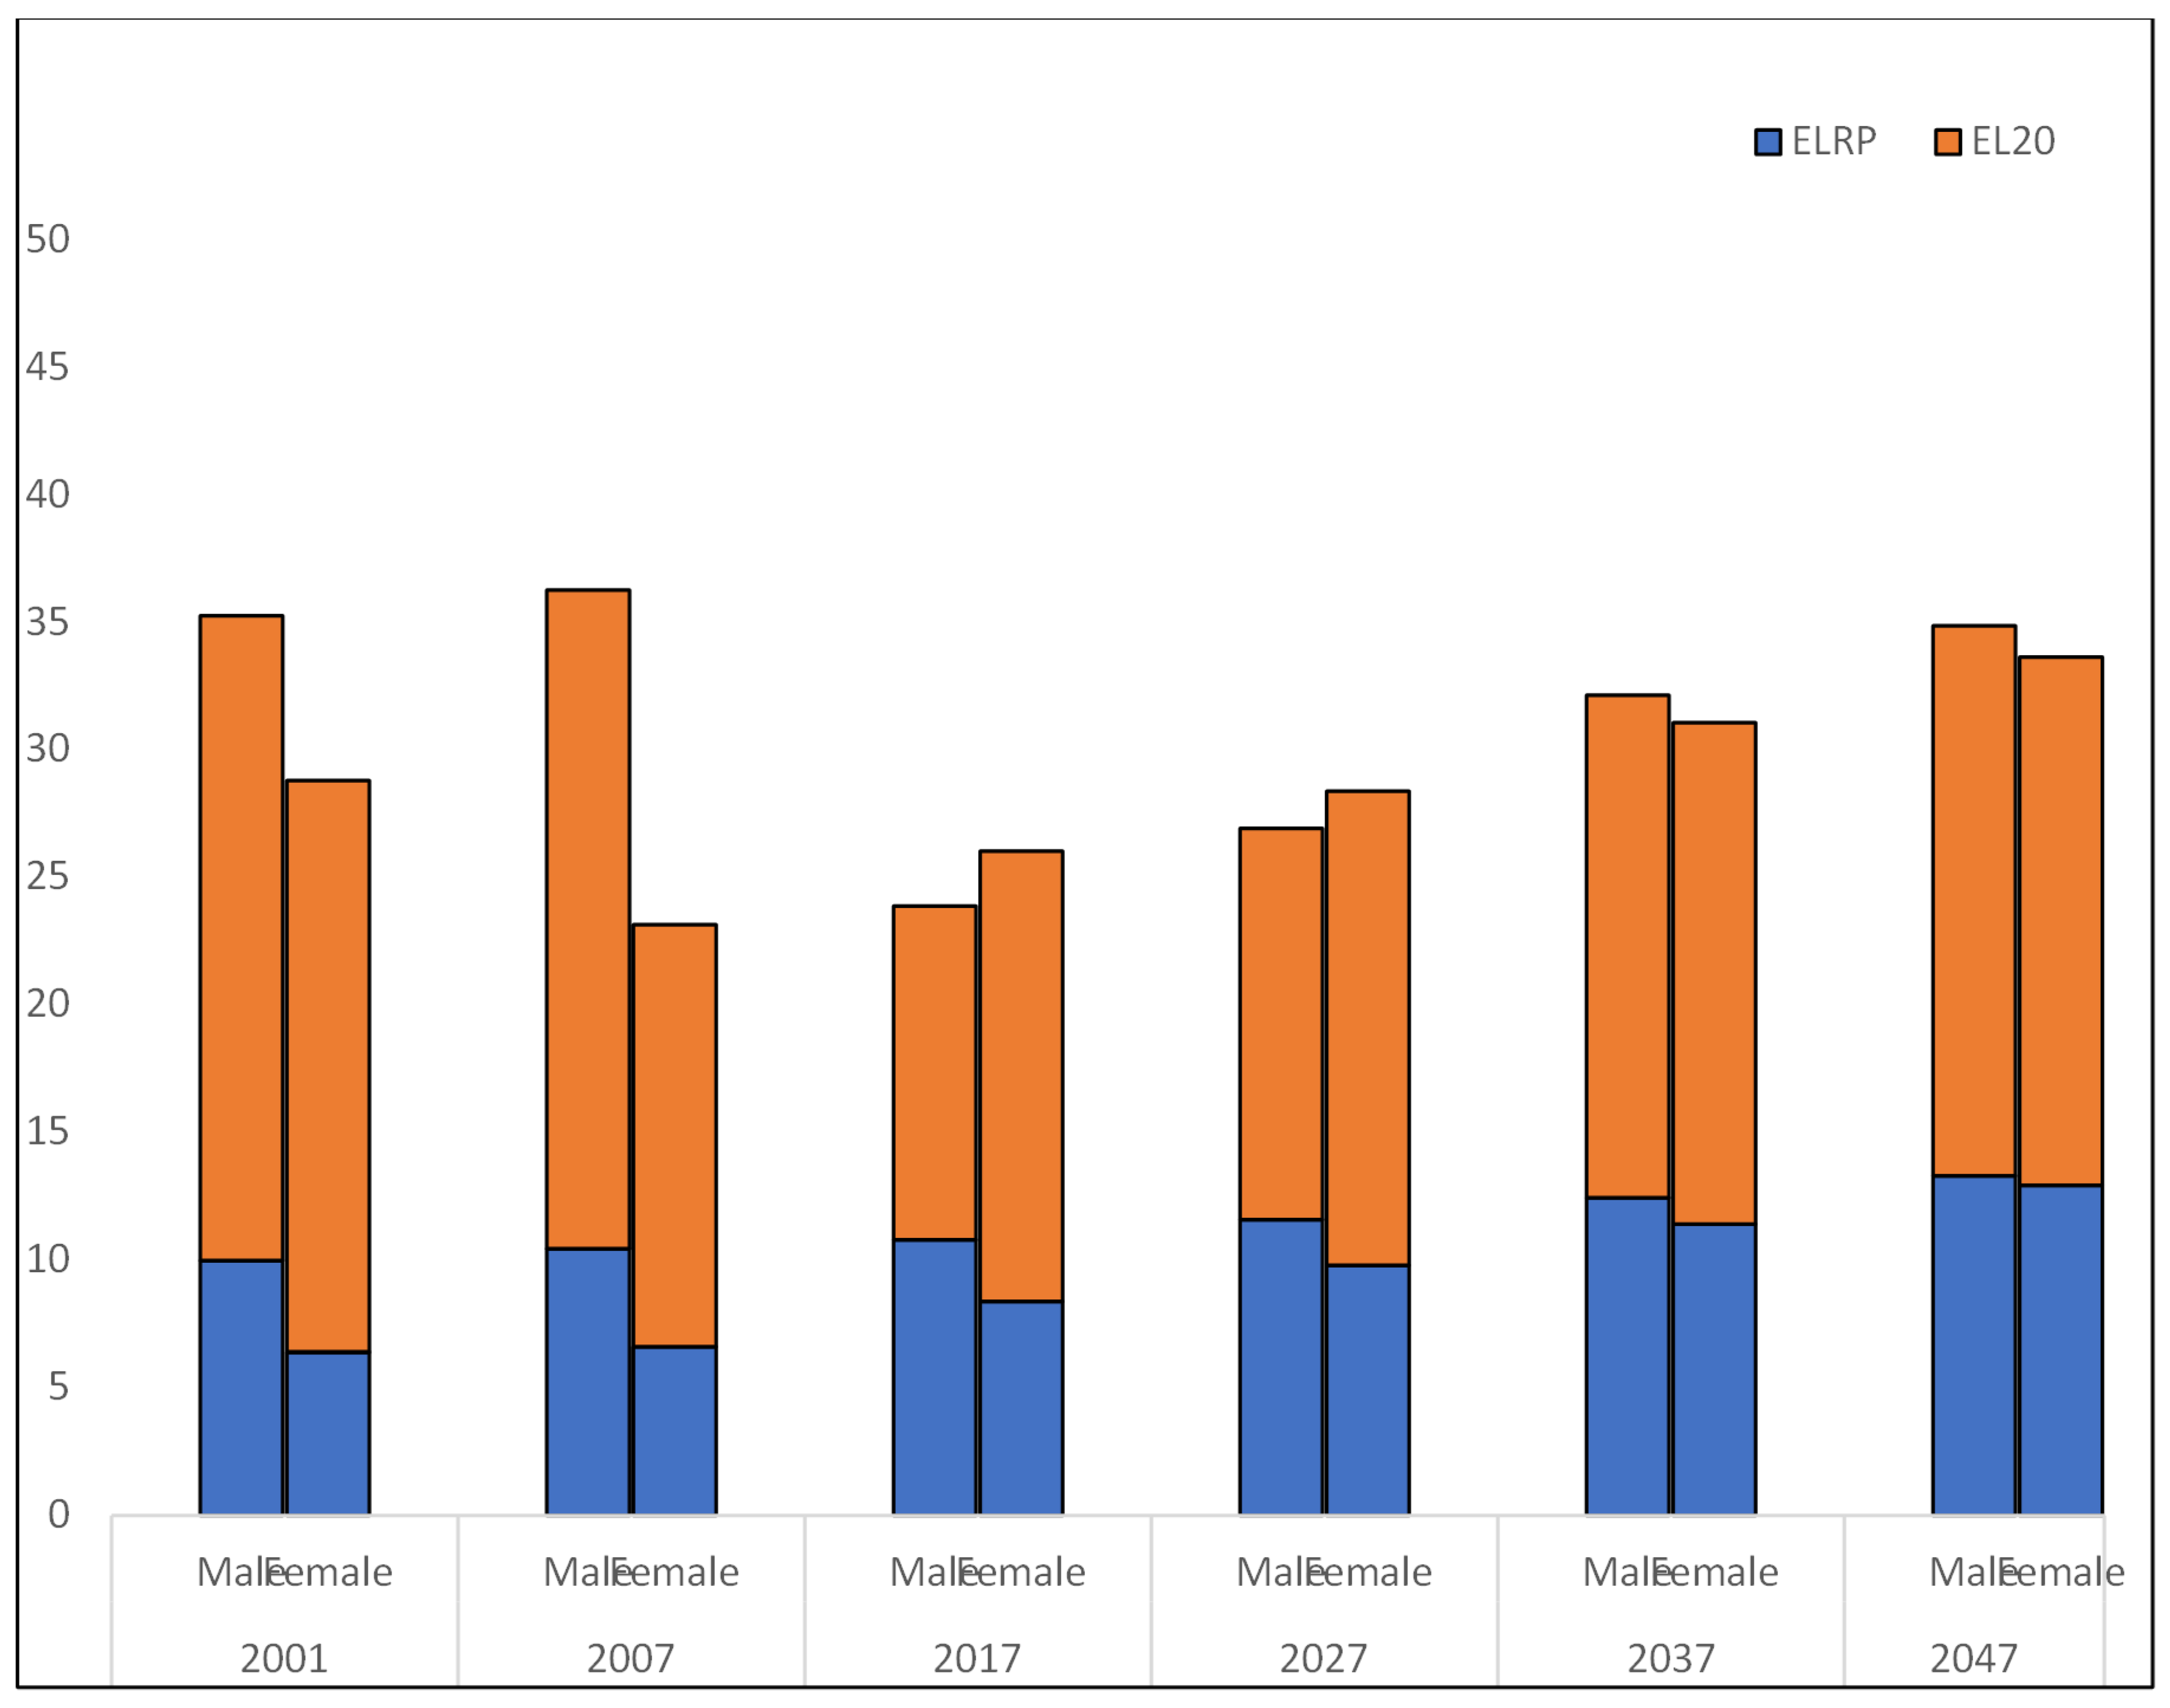
Figure 7, both males and females are expected to experience longer periods of ELR, which correlates with the increase in life expectancy at age 50 (EL50). This indicates that as healthcare improves and mortality rates decline, individuals are expected to live longer post-retirement. For males, the LFPR remains relatively stable, suggesting that the increase in the ELR is primarily driven by the increase in life expectancy rather than changes in LFPR. For females, there is a marked increase in LFPR, indicating that a larger proportion of the female population is remaining in the labor force at age 50. This could be due to social changes, economic needs, or policy interventions aimed at increasing female LFPR. Despite the increase in LFPR, the ELR still doubles, suggesting that the increase in life expectancy outpaces the increase in labor force participation, leading to a longer retirement period.
The difference in trends between males and females may reflect different societal, economic, or biological factors affecting labor force participation and longevity. Females not only start with a higher life expectancy at age 50 but also show a significant increase in labor force participation, indicating a substantial shift in the role of females in the Malaysian workforce and their retirement planning.
The relationship between LFPR, ELR, and EL50 for Malaysian workers is indicative of broader demographic and socioeconomic trends. As both males and females are expected to live longer past the age of 50, the duration of retirement is increasing, which poses challenges for retirement savings, pension sustainability, and social services for the elderly.
3.5. Residual Analysis
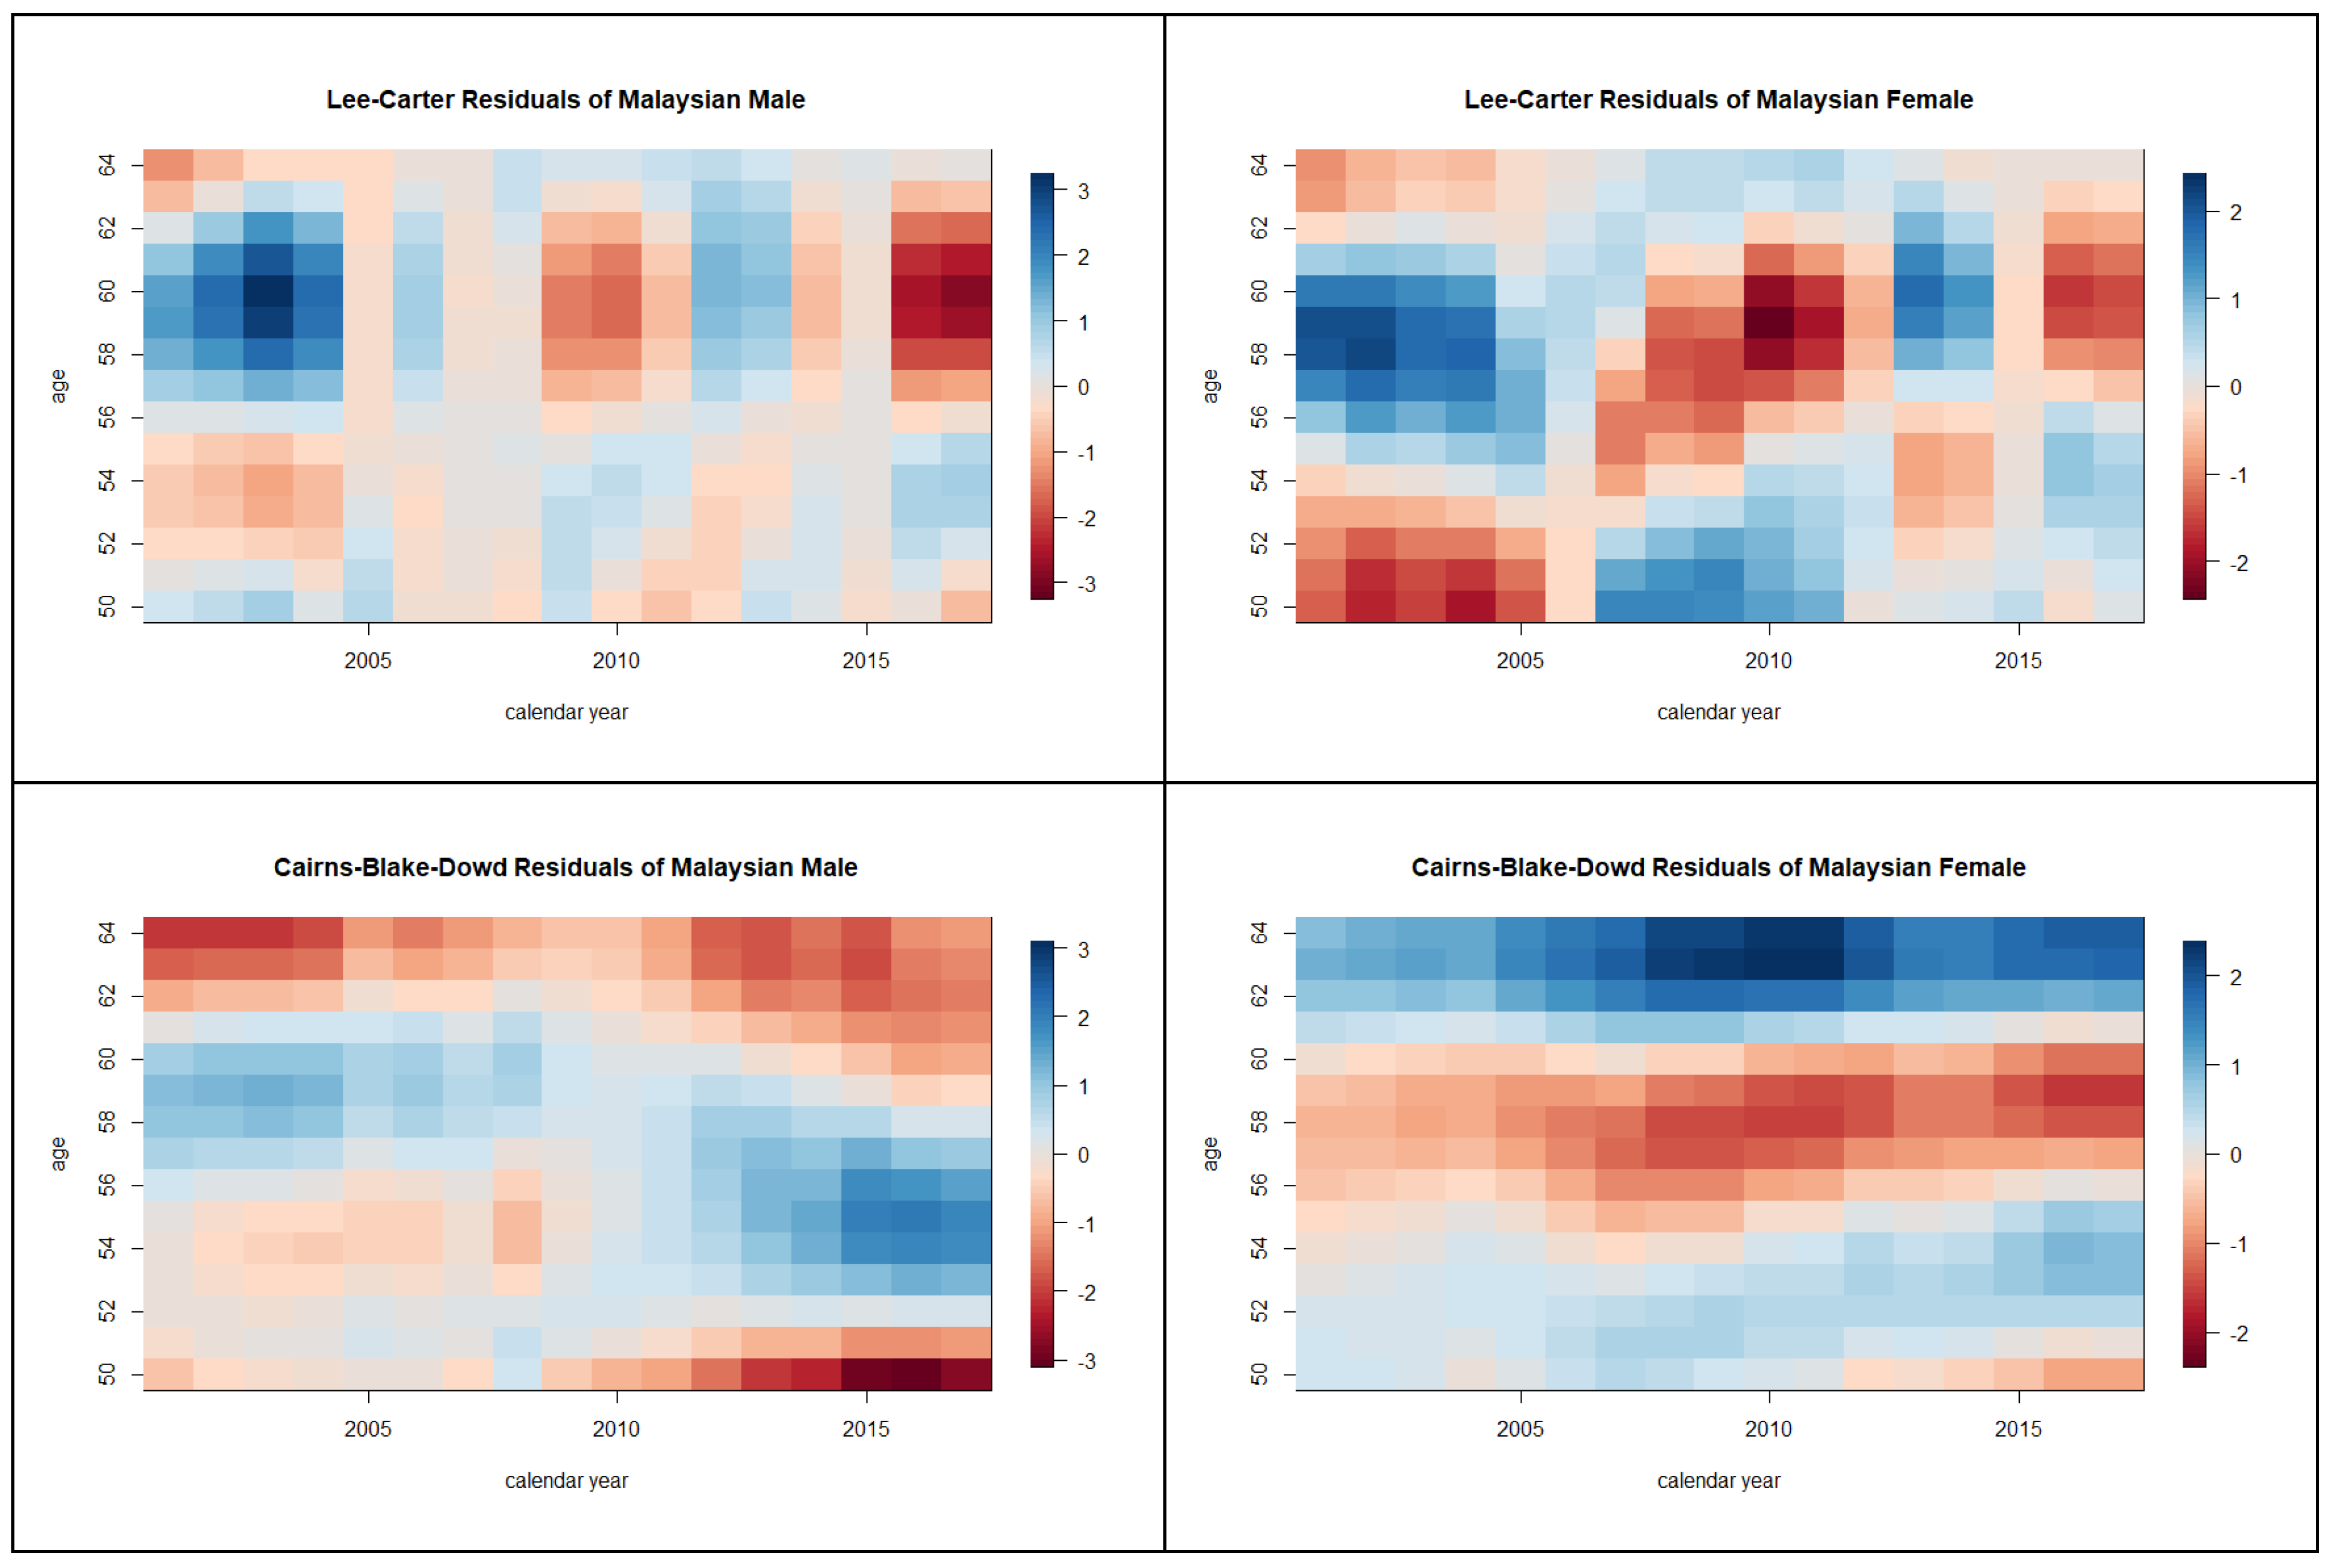
The residual heatmap in
Figure 6 shows the goodness of fit of the residuals based on the colour intensity of the heatmap. For males, the Lee Carter fitted values show a decrease in labor force participation as age increases, which is typical considering the retirement transition. The year-to-year changes in fitted values are relatively smooth for both genders, suggesting that the model captures the overall trend without large fluctuations. For females, the fitted values also decrease with age, but they start at a lower participation rate compared to males. This difference is consistent with global labor market trends where female participation rates are often lower than those of males.
The CBD model fitted values for males show a general trend that mirrors the Lee-Carter model results, with a declining participation rate with age. However, the variations year-to-year seem to be more pronounced, indicating that this model may capture more volatility in the labor market or respond to different trends and economic conditions. For females, the fitted values from this model also reflect a decrease with age. The Cairns-Blake-Dowd model appears to capture a steeper decline in participation rates for the older ages compared to the Lee-Carter model, which could indicate that it is more sensitive to retirement or exit from the labor market.
Figure 6.
Residual Heatmap for the Fitted LFPR.
Figure 6.
Residual Heatmap for the Fitted LFPR.
The residuals for males in the CBD model show differences in the fit across different age groups and times. The color variation indicates that in certain periods, the model's estimation deviates from the actual data. For females, the residuals plot shows a clearer pattern of underestimation and overestimation across ages and years, suggesting that the model might be capturing some cyclical trends or responding to external factors affecting female labor force participation.
This demonstrated a lengthening of retirement ages as shown in
Table 2 and
Figure 7. There has been a little change in the typical age of retirement in Malaysia during the past few decades. In the years ahead, retirement age is predicted to rise. In light of the sustainability issues of pension scheme, several studies recommended the transition to define contribution plan for public servants, rather than revising on changes in retirement age, coverage, pension benefits, and contributions[
58].
Figure 7.
Life expectancy at age 50 (EL50) and expected length of retirement at age 50 (ELR).
Figure 7.
Life expectancy at age 50 (EL50) and expected length of retirement at age 50 (ELR).
4. Discussion
The projections of LFP trends showed an overall upward trend over time. The stochastic mortality models provided a more complete picture of the future LFP patterns by using a probabilistic framework that accounts for inherent uncertainties. Both Lee Carter and CBD models use random fluctuations to provide a variety of potential outcomes, in contrast to deterministic models that generate a single set of outcomes based on fixed assumptions.
The application of the Lee-Carter and Cairns-Blake Dowd stochastic methods, originally designed for mortality forecasting, to LFPR projections has demonstrated empirical viability. The key parameter estimates, particularly in the Lee-Carter model, which capture the general trend over time, have been instrumental in reflecting changes in the labor force dynamics associated with an ageing workforce. This adaptability is rooted in the methods' inherent flexibility to capture and project age-specific patterns and trends.
In adapting these mortality models to forecast LFPR, the research has highlighted the importance of considering the distinct socio-economic factors that influence labor market participation as opposed to mortality. For instance, while mortality trends tend to be driven by biological and environmental factors, LFP is influenced by a broader array of variables including economic conditions, social norms, policy changes, and individual health status.
The suitability of these methods for LFPR forecasting within the context of an aging workforce is underscored by their ability to incorporate the age-profile changes over time due to behavioral changes over time [
40]. An aging workforce implies a shift in the age-profile of labor market participants, and these stochastic models are well-equipped to handle such transitions due to their origin in demographic analysis.
When applying the Lee-Carter and Cairns-Blake Dowd models with a gender-specific approach, the outcomes illustrate distinct patterns between male and female labor force participation. The forecasted LFPR indicate that female labor force engagement is expected to grow significantly, a trend that aligns with global observations of increasing female economic participation. In contrast, male LFPR display relative stability with only marginal increases. This distinction may be attributed to changing gender roles, improved access to education for women, and policies encouraging female workforce participation.
The forecasted parameter estimates have revealed differences in the expected length of retirement (ELR) between genders, with females experiencing a more pronounced increase. This finding is consequential for planning retirement and pension systems, as it indicates different financial needs and pressures between male and female retirees particularly health-related outcomes including life expectancy, healthy life expectancy, and adolescent health [
59], particularly given that men typically live shorter lives than women[
60].
Comparing the two models, the Lee-Carter approach has shown a more consistent fit for the historical LFPR, as evidenced by lower AIC and BIC values for both genders. This suggests that the Lee-Carter model may provide a more accurate and parsimonious fit for LFPR data. However, it is important to note that the CBD model offers a dual stochastic process that may capture more complex age and period effects, potentially offering a nuanced understanding of LFPR trends, especially when considering policy changes or economic shocks. Comparing the two models, the Lee-Carter approach has shown a more consistent fit for historical LFPR, as evidenced by lower AIC and BIC values for both genders, suggesting that it may provide a more accurate and parsimonious fit for LFPR [
38]
The empirical findings from both models provide critical insights for policymakers. The increasing LFPR among older age groups underscore the necessity to design inclusive labor policies that cater to the needs of an aging workforce. As a result, a considerable number of senior employees have indicated a readiness to prolong their retirement [
61], [
62]. Nevertheless, mounting evidence indicates that social inequality is widening as one approaches retirement from the workforce. In contrast to the tendency of high-skilled workers to retire at a later age, low-skilled workers may be required to work longer in order to qualify for a sufficient pension [
63]. This may include flexible working arrangements, lifelong learning initiatives, and age-friendly workplace adaptations.
Furthermore, the gender-specific approach reveals the need for gender-responsive policies that support the transition of more women into the workforce and address the challenges they may face, such as the gender pay gap, just as those who hold part-time or low-paying occupations regardless of education attainment. and balancing work with caregiving responsibilities as well as the level of conflict between work and personal life [
63], [
64].
5. Conclusions
The objective of this study was to fit the LFPR for Malaysian labor market using the Lee-Carter and Cairns-Blake-Dowd (CBD) stochastic models. The results showed that the Lee-Carter model performed better than the CBD model in terms of forecasting the LFP rates. Generally, both men and women were projected to have higher LFP rates in the later years (2046) compared to the earlier years (2016), and therefore were more likely to be actively seeking employment in the later years.
The forecasts generated using the Lee-Carter and Cairns-Blake Dowd models have yielded a nuanced understanding of LFPR trends in the context of an aging population. The Lee-Carter model, with its singular time trend parameter , suggested a steady increase in LFPR among older age groups, particularly among females. This could reflect societal shifts such as delayed retirement and increased female empowerment in the workforce. Conversely, the CBD model, with its dual stochastic process, offered insights into the variability of LFPR, capturing potential fluctuations that could arise from economic cycles or abrupt policy changes.
Female workers tend to be varied when it comes to retirement preference depending on their social responsibilities, family responsibilities and financial outcomes. Predictions show that the female participation rate will increase in the future especially when the life expectancy has improved over time. As mentioned by [
65] mortality improvement will influence retirement outcome. The elderly would rather work than retire and relax during their golden ages and offer their invaluable skills and wisdom.
The ELR calculations based on the Lee-Carter model's projections highlighted an increasing trend, indicating that individuals are expected to spend more time in retirement. This has profound implications for social security systems and the financial planning required to support longer retirement periods. Malaysia, like many nations, faces demographic transitions - aging population, shifting retirement ages, and varying employment trends among different age groups. The time and age indices in these models adeptly capture these transitions, making them relevant for current and future demographic analyses. This limitation also restricted the robustness of the forecasts, as stochastic models such as Lee-Carter and CBD typically benefit from larger datasets to fine-tune their predictive capabilities. Additionally, the application of models originally designed for mortality forecasting to LFPR posed challenges. While both processes—mortality and labor participation—are affected by age, they are inherently different phenomena influenced by a distinct set of socio-economic factors. therefore, it is crucial to predict whether the Malaysian LFPR will follow the same pattern as in more developed economies [
66], [
67]. As such, these models stand as significant tools in understanding and planning for the future of Malaysia's workforce.
