
Submitted:
05 February 2024
Posted:
05 February 2024
You are already at the latest version
Abstract
To accurately and non-destructively monitor the growth of spring wheat in the Hetao Irrigation Area, UAV remote sensing was employed during various fertility stages. Digital image indices from diverse fertilization treatments were calculated and compared with physiological indices to identify the most sensitive digital image indices corresponding to these indices. The study underscored the critical importance of the flowering stage in the growth of spring wheat, thus highlighting the necessity of focusing on this stage. This finding reiterated that the flowering stage was pivotal for spring wheat development in the Hetao Irrigation Area. Several digital image indices, such as GLA, R, G, INT, g, GRVI, MGRVI, RGBVI, EXG, and GRRI, exhibited a high frequency of significant correlations with physiological indices during the four primary reproductive stages of wheat. Consequently, these sensitive digital image indices during the flowering stage can more effectively characterize the physiological indices of spring wheat.
Keywords:
Spring Wheat 1
; UAV 2
; Digital Image Index 3 Physiological Indicators 4
1. Introduction
Remote sensing technology has advanced agricultural quantitative remote sensing, making it the predominant and precise method for assessing global plant growth. A mathematical model establishes relationships between image information derived from remote sensing sensors and specific plant parameters. Analyzing image characteristics facilitates monitoring, diagnosis, and comprehension of plant growth status, enabling accurate regulation and management of plant growth [1]. Several studies have shown that crop quantitative remote sensing was effective in reflecting actual nitrogen levels and monitoring nitrogen across various cereal crops [2-4]. Mullan [5] used a digital image analysis tool for high throughput screening of four large wheat populations to validate the relationship between the digital image analysis and measures of normalized difference vegetation index (NDVI), leaf area index and light penetration through the crop canopy. Image processing techniques has immense potential to use characteristics like size, shape, color and texture attributes from digital images to characterize the agricultural produce [6]. Due to the ability of crop stems, leaves, and other above-ground organs to absorb, reflect, and refract visible with its advantages of mobility, timeliness, ease of operation and high resolution, light, parameters such as color, hue, brightness, and saturation can be enable a comprehensive characterization of plants, and digital image index is possible to standardize spectral information from visible light bands, specifically red (R), green (G), and blue (B) [7,8].
The Unmanned Aerial Vehicles (UAVs) for remote sensing with its advantages of mobility, timeliness, ease of operation and high resolution, has recently shown significant advantages in extracting crop information and monitoring nutrient levels across small to medium spatial scales [9-11]. In contrast to the expensive and strict requirements associated with hyperspectral and multispectral remote sensing in crop monitoring, digital image analysis using low-cost drones has provided a fast, non-destructive, and efficient method for quantitative crop remote sensing. Bhadra [12] identified that multi-temporal observation with UAV-based RGB images provides enough information for the 3D CNN architectures to accurately estimate soybean yield non-destructively and efficiently. Wan [13] explored the potential of fusing spectral and structural information extracted from the unmanned aerial vehicle (UAV) carrying RGB and multispectral cameras in the whole growth period of rice to improve the grain yield prediction. These findings demonstrate that the UAV digital images can improve the prediction accuracy of crop physiological indicators as well as achieve an efficient monitoring of crop growth [14,15].
This study conducted field trials on spring wheat with varying nitrogen levels and captured digital images using UAVs at different reproductive stages. Plant morphological and physiological yield indicators were also collected and analyzed. Eighteen digital image indices were selected for analysis, and correlation analyses were used to determine the most effective diagnostic digital image indices across various stages.
2. Materials and Methods
This study conducted simultaneous field wheat fertilizer control trials at two locations: Xinhua Agricultural Cooperative Farm, Linhe District, and Yonglian Village, Xinguangzhong Town, Wuyuan County Bayannur City, Inner Mongolia Autonomous Region in 2019. The locations of the experimental plots are shown in Figure 1.
The test variety was the locally dominant wheat variety, Yongliang 4. Sowing took place in early March 2019 and 2020, and harvesting took place in late July 2019 and 2020. The seeding rate was 375 kg/hm2, using a wheat planter for seed fertilizer layer seeding with a row spacing of 15 cm. The seed fertilizer was applied together with phosphorus and potash fertilizer at the time of sowing, followed by an additional treatment during the jointing stage of the wheat. Irrigation was carried out in a water-saving mode, twice during the whole life cycle (jointing + flowering, each irrigation 900 m3/hm2). Other management measures were in line with conventional wheat cultivation practices. The fertilization experiment included six different modes: CK, farmer model (FM), control of fertilization patterns (CF), control of fertilization-N (CF-N), control of fertilization-P (CF-P), and control of fertilization-K (CF-K). Details of the specific fertilization rates and methods are shown in Table 1.
Digital image data was collected on Late May (tasseling stage), Mid June (filling stage), and Early July (maturity stage) in 2019. A DJI Royal MAVIC 2 Professional Edition equipped with a Hasselblad L1D-20c camera was used for high-definition digital photography. The camera features a new 1-inch 20-megapixel CMOS sensor, a built-in wide-angle lens with a 28mm equivalent focal length, an adjustable aperture value ranging from f/2.8 to f/11, and a maximum sensitivity of 12,800. The study collected and stored digital images in TIF format. The drone's flight lasted approximately 30 minutes. To minimize the impact of external factors on image acquisition, the study was conducted between 10:00 and 14:00 under clear and cloudless sky conditions. Radiometric correction was carried out using a black-and-white board to minimize errors, and the UAV was flown at an altitude of 50 meters.
Digital image indices have been effectively used to estimate plant physiological and biochemical parameters, such as leaf area index, biomass, and nitrogen content. This effectiveness was due to their ability to enhance vegetation information, reduce the impact of non-vegetation elements on plant mapping features, and improve the accuracy of remote sensing inversion. This study screened digital image indices for monitoring wheat growth research, integrating insights from previous studies with pre-analysis of experimental data. The name of each digital image index and the formula used to calculate it are shown in Table 2 below:
The study examined plant parameters, including leaf area (PLA), leaf area index (LAI), chlorophyll SPAD, dry matter accumulation (DMA), fluorescence parameters (Fv/Fm), intercellular CO2, concentration (Ci), stomatal conductance (Gs), net photosynthetic rate (NPR), transpiration rate (Tr/E), water use efficiency (WUE), spike number (PN), grain number (GN), thousand grain weight (TKW), yield (Y), and plant nitrogen content (NC).
The study also measured the stem and leaf nitrogen content (SLNC), stem and leaf phosphorus content (SLPC), stem and leaf potassium content (SLKC), seed nitrogen content (KNC), seed phosphorus content (KPC), kernel potassium content (KKC), glume nitrogen content (GNC), phosphorus content of glumes (GPC), potassium content of glumes (GKC), number of spikes (PN), number of grains in spikes (GN), thousand kernel weight (TKW), and yield (Y), with corresponding vegetation indices.
The study utilized the correlation coefficient (r) to measure the degree of correlation between wheat digital image indices and physiological growth characterization parameters. The coefficient was calculated using the following formula:
The correlation coefficient (r) indicates the degree of linear relationship between two variables. A correlation between two variables can be positive, negative, or non-existent, indicated by r > 0, r < 0, and r = 0, respectively. The absolute value of r indicates the strength of the correlation. To determine the significance of the correlation coefficient, refer to the critical value table for correlation coefficients. Significance levels are denoted by * and ** at the 0.05 and 0.01 levels, respectively.
Adobe Photoshop CC 2018 software was used for digital image processing. Non-wheat leaf information was excluded from the experimental plots after segmenting the images based on different fertilization treatments. The red (R), green (G), and blue (B) values from each treatment plot and the two-year trial plots were extracted and used to compute the average of each digital image index. The R programming language was used for calculating, correlating, analyzing, and graphing each variable.
3. Results
3.1. Relationships between digital image indices and wheat Physiological indicators at the time of jointing and flowering.
The analysis involved correlating wheat physiological indices SPAD, LAI, LAD, and DMA with each digital image index. After conducting correlation analysis, it was discovered that during the wheat jointing stage, the SPAD value showed a highly significant negative correlation with the g, RGBVI, and GLA indices. Additionally, it showed a significant correlation with the GRRI, GBRI, GRVI, and MGRVI indices, and a significant positive correlation with the R, G, B, INT, and CIVE indices. The LAI values showed a significant negative correlation only with R. The LAD had a highly significant negative correlation with the EXG index, a significant negative correlation with R, r, RBRI, and IKAW indices, and a significant positive correlation with GRRI, GRVI, and MGRVI. On the other hand, DMA, PN, GN, TKW, and Y did not show any significant correlation with any of the digital image indices(Figure 2a).
A highly significant positive correlation was observed between the SPAD of wheat during the flowering stage and the CIVE index (Figure 2b). The single plant leaf area (PLA) showed a significant positive correlation with the g and b indices and a significant negative correlation with the r, EXG, and GBRI indices. The correlation analysis revealed that the leaf area index (LAI) was positively correlated with the green leaf area index (GLA). On the other hand, the dry matter content (DMA) showed a highly significant positive correlation with the red (R), green (G), and near-infrared (INT) indices, and a highly significant negative correlation with the GLA index. Furthermore, DMA exhibited significant negative correlations with the red edge (r), excess green (EXG), red-blue ratio index (RBRI), and inverse difference vegetation index (IKAW) and significant positive correlations with the green (g), green-red ratio index (GRRI), modified green-red index (MGRVI), and red-green-blue index (RGBVI). The correlation analysis showed that stomatal conductance had a negative correlation with the G and INT indices, and a positive correlation with the g index. Additionally, stomatal conductance had negative correlations with the R, EXG, RBRI, and IKAW indices, and positive correlations with GRRI, GRVI, MGRVI, RGBVI, and GLA, all of which showed high or significant levels of correlation. In contrast, the net photosynthetic rate showed positive correlations with the b, GRRI, GRVI, and MGRVI indices, and negative correlations with the EXG, GBRI, RBRI, and IKAW indices. However, the fluorescence parameters, intercellular CO2 concentration, transpiration rate, and water use efficiency did not show significant correlations with any of the digital image indices.
3.2. Relationships between digital image indices and wheat physiological indicators at the time of filling and mature
During the wheat filling stage, the correlations between the wheat physiological indicators SPAD, LAI, LAD and DMA and each digital image index were analyzed. The results showed that SPAD had a highly significant negative correlation with EXG and CIVE indices and a highly significant positive correlation with GRRI, GRVI and MGRVI indices. The results showed that SPAD had significant positive correlations with the g, RGBVI, and GLA indices, and significant negative correlations with the R, G, and INT indices (see Figure 3a). In addition, LAI had significant negative correlations with the R, G, INT, and CIVE indices, and significant positive correlations with the g and GLA indices. Conversely, the LAD showed significant negative correlations with the RBRI and IKAW indices, and a significant positive correlation with the b index. Similarly, the DMA had significant negative correlations with the EXG and CIVE indices and significant positive correlations with the GRRI, GRVI and MGRVI indices.
Wheat maturity stage shows that physiological indices, such as DMA and plant nitrogen content, were correlated with each digital image index in Figure 3b. The analysis revealed significant positive correlations between DMA and the g, GBRI, RBRI, IKAW, RGBVI, and GLA indices, and significant negative correlations with the R, G, B, b, INT, and CIVE indices. No significant correlations were found between plant nitrogen content (NC), stem and leaf nitrogen content (SLNC), stem and leaf phosphorus content (SLPC), kernel nitrogen content (KNC), kernel phosphorus content (KPC), glume nitrogen content (GNC), glume phosphorus content (GPC), number of spikes (PN), number of grains in a spike (GN), thousand kernel weight (TKW), and yield (Y) and any of the digital image indices. The correlation analysis revealed that the stem and leaf potassium content (SLKC) had significant negative correlations with the R, G, B, and INT indices. Additionally, the seed potassium content (KKC) showed significant negative correlations with the g, GBRI, RGBVI, and GLA indices, but significant positive correlations with the b and CIVE indices. Furthermore, the glumes' potassium content (GKC) showed significant positive correlations with the g, GBRI, GRVI, MGRVI, RGBVI, and GLA indices, but significant negative correlations with the EXG and CIVE indices.
3.3. Changes in digital image indices during various fertile stages of wheat under fertilizer treatments.
Figure 4 showed the differences in wheat digital image indices across different fertilization treatments. The values of each digital image index were higher in CK and CF of fertilization treatments compared to the other fertilization treatments. The index B of the digital image showed an increasing trend followed by a decreasing trend in the CF-P and CF-K fertilization treatments, while it displayed a decreasing trend followed by an increasing trend in other fertilization treatments. On the other hand, the digital image index INT showed a more gradual change in the CF-P and CF-K fertilization treatments, while it displayed a distinct trend of decreasing followed by increasing in other fertilization treatments. Additionally, the index of INT, which represents the digital image, changed at a slower rate in the CF-P and CF of fertilization treatments. In contrast, it exhibited a relatively stable trend in the CF-P and CF-K fertilization treatments. However, in other fertilization treatments, it displayed a trend of initially decreasing followed by an increase.
The digital image index GRRI showed a low value in the CK of fertilization treatment and a relatively higher value in treatments with nitrogen application. The digital image indices GBRI and RBRI displayed an increasing trend with fertility in the CK of fertilization treatment, while showing a decreasing-increasing-decreasing trend in treatments with nitrogen application. The RBRI digital image index underwent a slight change in the CK of fertilization treatment and a relatively significant change in treatments with nitrogen application (Figure 5). Figure 6 showed that the digital image indices GRVI and MGRVI had lower values in the CK of fertilization treatment, but relatively higher values in treatments with nitrogen application. Both indices exhibited a trend of increasing and then decreasing in correlation with the fertility process. The digital image index IKAW underwent a minor change in the CK of fertilization treatment, but a relatively significant change in treatments with nitrogen application. The other digital image indices did not show sensitivity to the nitrogen application treatments.
As indicated in Table 3, the analysis of variance (ANOVA) demonstrated significant differential effects of fertilization treatments on the digital image indices G, B, and INT. No significant effects were observed on the remaining indices.
4. Discussion
Hyperspectral and multispectral remote sensing bands provide abundant and uninterrupted information, enabling precise feature recognition and mapping. However, their use in field production was limited due to expensive equipment, complex operation, and high technological requirements. Since the early 21st century, coinciding with the widespread use of digital cameras, research into crop growth monitoring using digital images has significantly increased. However, the use of handheld or stationary digital cameras was limited by low image resolution and restricted indices in digital images, preventing this research from evolving into a self-contained system. On the other hand, UAV digital images have become increasingly popular for small- to medium-scale crop monitoring in farmlands due to their straightforward operation, relatively low cost, and minimal technical requirements. The DJI MAVIC 2 Professional UAV was chosen for this study because of its widespread use in contemporary applications and its technical parameters and application effects that are ideally suited to meet the requirements of crop production monitoring in research areas.
This study used UAV remote sensing to capture digital images of spring wheat during four crucial fertility stages. The commonly used digital image indices of the crop were analyzed to establish quantitative relationships between these indices and the physiological indicators of wheat during each fertility period. The study aimed to investigate the potential of UAV digital images for monitoring the growth of spring wheat under various fertilization treatments. Based on the correlation analysis results presented in Figure 7, the digital image indices GLA, R, G, INT, g, GRVI, MGRVI, RGBVI, EXG, and GRRI were found to have a higher frequency of significant correlation with physiological indices during the four key reproductive periods of wheat. Therefore, they are considered more suitable for characterizing the physiological indices of wheat. The indices of r and CIVE have low correlation with physiological indicators across wheat reproductive periods and are not recommended for use in monitoring wheat physiological indicators, the same results have been found in other studies as well [18,19]. EXG, MGRVI, and RGBVI consistently showed strong correlations with biomass and yield across all fertility stages of winter wheat [7]. The present study showed that these indices also exhibited significant correlations with biomass during the flowering period of spring wheat. However, their performance was not exceptional in other fertility periods.
Xiao [20] found a significant correlation between the aboveground biomass of winter wheat during the pulling stage and several digital image indices, including R, G, B, GRRI, GBRI, RBRI, r, g, and b. However, in the present study, no significant correlation was found between the above-ground biomass at the jointing stage of spring wheat and any of the digital image indices. Both studies found a significant correlation between the digital image indices R, G, and GBRI and changes in SPAD. The results of this study indicate that digital image indices R, G, and B exhibit significant negative correlations with biomass at all fertility periods in spring wheat. Similar findings were observed in studies on rice, maize, and spring wheat [20-22]. Umut [23] concluded that the digital image indices RGBVI and GLA were significantly correlated with leaf area index (LAI) in spring wheat. Similarly, the present study found a significant positive correlation between the digital image index GLA and LAI in spring wheat at filling and mature stages. However, RGBVI did not exhibit a significant correlation with LAI. The study found a strong correlation between digital image indices and physiological indices of wheat during the flowering stage. The mean correlation coefficients were flowering (0.638) > filling (0.626) > maturity (0.548) > jointing (0.523). In contrast, Yang [7] found that the correlation coefficients for winter wheat digital image indices with biomass and yield at different fertility periods followed the order of jointing, flowering, tasseling, and pre-overwintering. The difference in the above results may be due to variations in wheat planting times. The ANOVA results indicate that the various fertilization treatments had significant differential effects only on the digital image index G, B, and INT. The colors in the UAV images appeared more saturated during the wheat flowering stage compared to the jointing stage, this is mainly due to the fact that the indices lose sensitivity at this stage [24-26]. During the later stages of wheat fertility, digital image index showed a significant correlation with potassium content in all parts of the plant. However, there was no significant correlation with nitrogen and phosphorus. These findings are consistent with a study conducted by Shi and Wang [27,28].
5. Conclusions
UAV digital images have become increasingly popular for small- to medium-scale crop monitoring in farmlands due to their straightforward operation, relatively low cost, and minimal technical requirements. This advancement in unmanned aerial vehicle (UAV) digital image monitoring technology and methods will enable its application to other crops and further promote the development of UAV remote sensing monitoring. The DJI MAVIC 2 Professional UAV was chosen for this study because of its widespread use in contemporary applications and its technical parameters and application effects that are ideally suited to meet the requirements of crop production monitoring in research areas. On the other hand, several digital image indices, such as GLA, R, G, INT, g, GRVI, MGRVI, RGBVI, EXG, and GRRI, showed significant correlations with physiological indices during the four primary reproductive stages of wheat. Especially, these digital image indices can effectively characterize the physiological indices of spring wheat during the flowering stage.
Author Contributions
M.X.: Writing—original draft. Y.Z.: Supervision. J.L.: investigation. L.L: investigation. P.Z.: Formal analysis. Q.W.: Visualization. M.L.: Resources. H.W.: investigation. All authors have read and agreed to the published version of the manuscript.
Funding
This research was funded by Inner Mongolia Natural Science Foundation Program, grant number “2021MS03089”, Inner Mongolia Basic Research Operating Expenses Colleges and Universities Program, grant number “BR231509”, and Inner Mongolia Autonomous Region Higher Education Institutions Carbon Peak Carbon Neutral Research Special Project, grant number “STZX202214”.
Data Availability Statement
Not applicable.
Acknowledgments
This research was supported by the Inner Mongolia's innovative extension system for promoting and innovating wheat industry.
Conflicts of Interest
The authors declare no conflict of interest.
References
- Omia, E.; Bae, H.; Park, E.; Kim, M.S.; Baek, I.; Kabenge, I.; Cho, B.-K. Remote Sensing in Field Crop Monitoring: A Comprehensive Review of Sensor Systems, Data Analyses and Recent Advances. Remote Sens. 2023, 15, 354. [Google Scholar] [CrossRef]
- Li, W.; Wang, K.; Han, G.; Wang, H.; Tan, N.; Yan, Z. Integrated diagnosis and time-series sensitivity evaluation of nutrient deficiencies in medicinal plant (Ligusticum chuanxiong Hort.) based on UAV multispectral sensors. Frontiers in Plant Science 2023, 13. [Google Scholar] [CrossRef]
- Benincasa, P.; Antognelli, S.; Brunetti, L.; Fabbri, C. A.; Natale, A.; Sartoretti, V.; Modeo, G.; Guiducci, M.; Tei, F.; Vizzari, M. Reliability of ndvi derived by high resolution satellite and uav compared to in-field methods for the evaluation of early crop n status and grain yield in wheat. Experimental Agriculture. 2018, 54, 604–622. [Google Scholar] [CrossRef]
- Corti, M.; Cavalli, D.; Cabassi, G.; Vigoni, A.; Degano, L.; Gallina, P. Application of a low-cost camera on a UAV to estimate maize nitrogen-related variables. Precision Agric. 2019, 20, 675–696. [Google Scholar] [CrossRef]
- Mullan, Daniel & Reynolds, Matthew. Quantifying genetic effects of ground cover on soil water evaporation using digital imaging. Functional Plant Biology. 2010, 37, 703–712. [Google Scholar] [CrossRef]
- Sharma, R.; Kumar, M.; Alam, M.S. Image processing techniques to estimate weight and morphological parameters for selected wheat refractions. Sci Rep. 2021, 11, 20953. [Google Scholar] [CrossRef]
- Yang Jun; Ding Feng.; Chen Chen.; Liu Tao.; Sun Chengming.; Ding Dawei.; Huo Zhongyang. Correlation of wheat biomass and yield with UAV image characteristic parameters. Transactions of the Chinese Society of Agricultural Engineering 2019, 35, 104–110.
- Poley, Lucy & Mcdermid, Greg. A Systematic Review of the Factors Influencing the Estimation of Vegetation Aboveground Biomass Using Unmanned Aerial Systems. Remote Sensing 2020, 12, 1052–1098. [CrossRef]
- Xiaoqin, W.; Miaomiao, W.; Shaoqiang, W.; Yundong, W. Extraction of vegetation information from visible unmanned aerial vehicle images. Transactions of the Chinese Society of Agricultural Engineering 2015, 31. [Google Scholar] [CrossRef]
- Costa, L.; Kunwar, S.; Ampatzidis, Y.; Albrecht, U. Determining leaf nutrient concentrations in citrus trees using UAV imagery and machine learning. Precision Agric 2022, 23, 854–875. [Google Scholar] [CrossRef]
- Anita Simic Milas.; Matthew Romanko.; Patrick Reil.; Tharindu Abeysinghe & Anuruddha Marambe. The importance of leaf area index in mapping chlorophyll content of corn under different agricultural treatments using UAV images. International Journal of Remote Sensing 2018, 39, 5415–5431. [CrossRef]
- Bhadra, S.; Sagan, V.; Skobalski, J.; Grignola, F.; Sarkar, S.; Vilbig, J. End-to-end 3D CNN for plot-scale soybean yield prediction using multitemporal UAV-based RGB images. Precision Agric. 2023. [CrossRef]
- Liang Wan.; Haiyan Cen.; Jiangpeng Zhu.; Jiafei Zhang.; Yueming Zhu.; Dawei Sun.; Xiaoyue Du.; Li Zhai.; Haiyong Weng.; Yijian Li.; Xiaoran Li.; Yidan Bao.; Jianyao Shou.; Yong He. Grain yield prediction of rice using multi-temporal UAV-based RGB and multispectral images and model transfer – a case study of small farmlands in the South of China. Agricultural and Forest Meteorology 2020, 291, 108096. [CrossRef]
- Xiuliang Jin.; Shouyang Liu.; Frédéric Baret.; Matthieu Hemerlé.; Alexis Comar. Estimates of plant density of wheat crops at emergence from very low altitude UAV imagery. Remote Sensing of Environment 2017, 198, 105–114. [CrossRef]
- Maitiniyazi Maimaitijiang.; Vasit Sagan.; Paheding Sidike.; Matthew Maimaitiyiming.; Sean Hartling.; Kyle T. Peterson.; Michael J.W. Maw.; Nadia Shakoor.; Todd Mockler.; Felix B. Fritschi. Vegetation Index Weighted Canopy Volume Model (CVMVI) for soybean biomass estimation from Unmanned Aerial System-based RGB imagery. Journal of Photogrammetry and Remote Sensing 2019, 151, 27–41. [CrossRef]
- Mao, W. Yiming Wang and Yue Rong Wang. Real-time Detection of Between-row Weeds Using Machine Vision; ASABE: St, Joseph, MI, USA, 2003. [Google Scholar] [CrossRef]
- G. Poley, L.; J. McDermid, G. A Systematic Review of the Factors Influencing the Estimation of Vegetation Aboveground Biomass Using Unmanned Aerial Systems. Remote Sens. 2020, 12, 1052. [CrossRef]
- Niu, Y.; Zhang, L.; Zhang, H.; Han, W.; Peng, X. Estimating Above-Ground Biomass of Maize Using Features Derived from UAV-Based RGB Imagery. Remote Sens. 2019, 11, 1261. [Google Scholar] [CrossRef]
- Guo Tao.; Yan An.; Geng Hongwei. Prediction of Wheat Plant Height and Leaf Area Index Based on UAV Image. Journal of Triticeae Crops, 2020(09):1-12Index Based on UAV Image.
- Xiao, Y.B.; Jia, L.L.; Chen, X.P.; Zhang, F. N status diagnosis of winter wheat by using digital image analysis technology. Chinese Agricultural Science Bulletin 2008, 24, 448–453. [Google Scholar]
- Zhou Hua-jie; Liu Ya-dong.; Fu Jindong.; Sui Fang-gong.; Cui Rixian. Analysis of Maize Growth and Nitrogen Nutrition Status Based on Digital Camera Image. Journal of Qingdao Agricultural University (Natural Science) 2015, 32, 1–7.
- Jia Liang-liang; Fan Ming-sheng.; Zhang Fu-suo.; Chen Xin-ping.; Lü Shi-hua.; Sun Yanming. Nitrogen Status Diagnosis of Rice by Using a Digital Camera. Spectroscopy and Spectral Analysis 2009, 29, 2176–2179. [CrossRef]
- Umut Hasan. Wheat Leaf Area Index (LAI) Inversion by Using “Satellite-UAV-Ground” Multi-source Remote Sensing Data. Ph.D. Thesis, Xinjiang University, 2019.
- Li, W.; Jiang, J.; Weiss, M.; Madec, S.; Tison, F.; Philippe, B.; Comar, A.; Baret, F. Impact of the reproductive organs on crop BRDF as observed from a UAV. Remote Sensing of Environment 2021, 259, 112433. [Google Scholar] [CrossRef]
- Xu, L.; Zhou, L.; Meng, R.; Zhao, F.; Lv, Z.; Xu, B.; Zeng, L.; Yu, X.; Peng, S. An improved approach to estimate ratoon rice aboveground biomass by integrating UAV-based spectral, textural and structural features. Precision Agriculture 2022, 23, 1276–1301. [Google Scholar] [CrossRef]
- Zhang, Z.; Flores, P.; Igathinathane, C.; Igathinathane, C.; Naik, D.; Kiran, R.; Ransom, J.K. Wheat lodging detection from UAS imagery using machine learning algorithms. Remote Sensing 2020, 12, 1838. [Google Scholar] [CrossRef]
- Shi Xiao-yan. Evaluation of some physiological parameters of winter wheat leaves using digital image processing. Ph.D. Thesis, Heibei Agriculture University, 2005.
- Wang, Y.; Wang, D.; Shi, P.; et al. Estimating rice chlorophyll content and leaf nitrogen concentration with a digital still color camera under natural light. Plant Methods. 2014, 10, 36. [Google Scholar] [CrossRef] [PubMed]
Figure 1.
Map of test site locations.
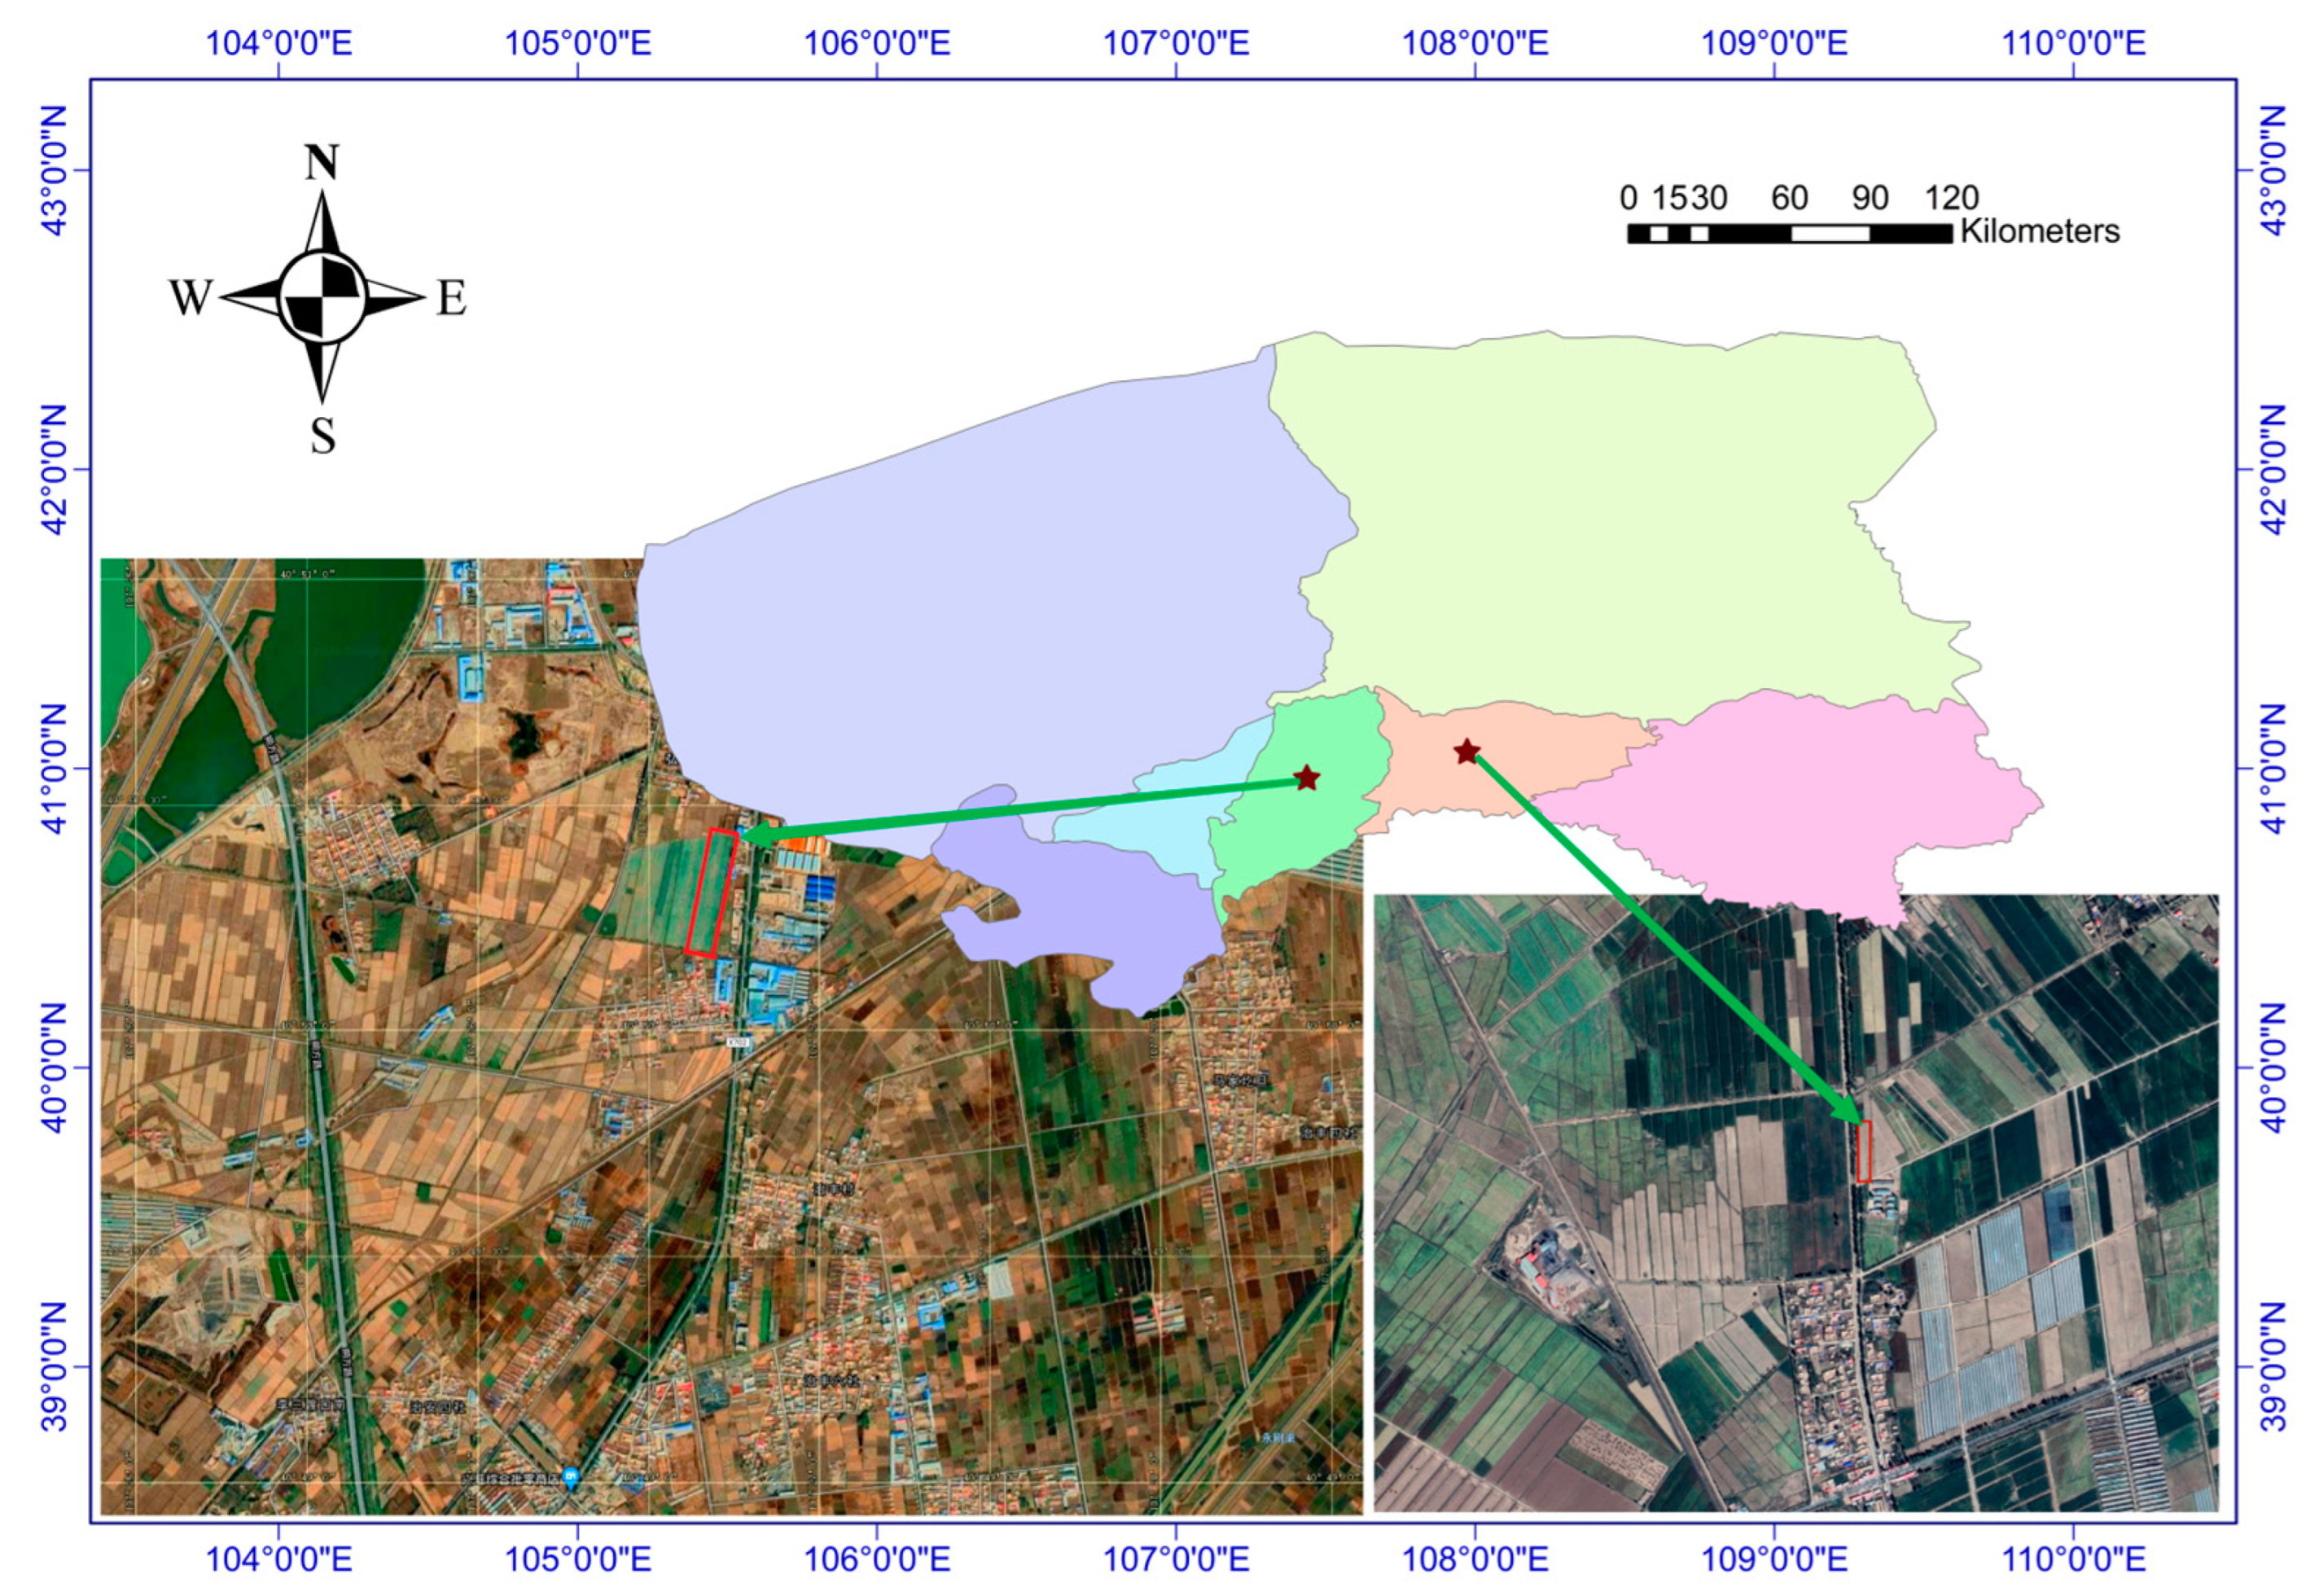
Figure 2.
Correlation coefficients of different digital image indices with wheat physiological indicators at jointing and flowering stages.
Figure 2.
Correlation coefficients of different digital image indices with wheat physiological indicators at jointing and flowering stages.
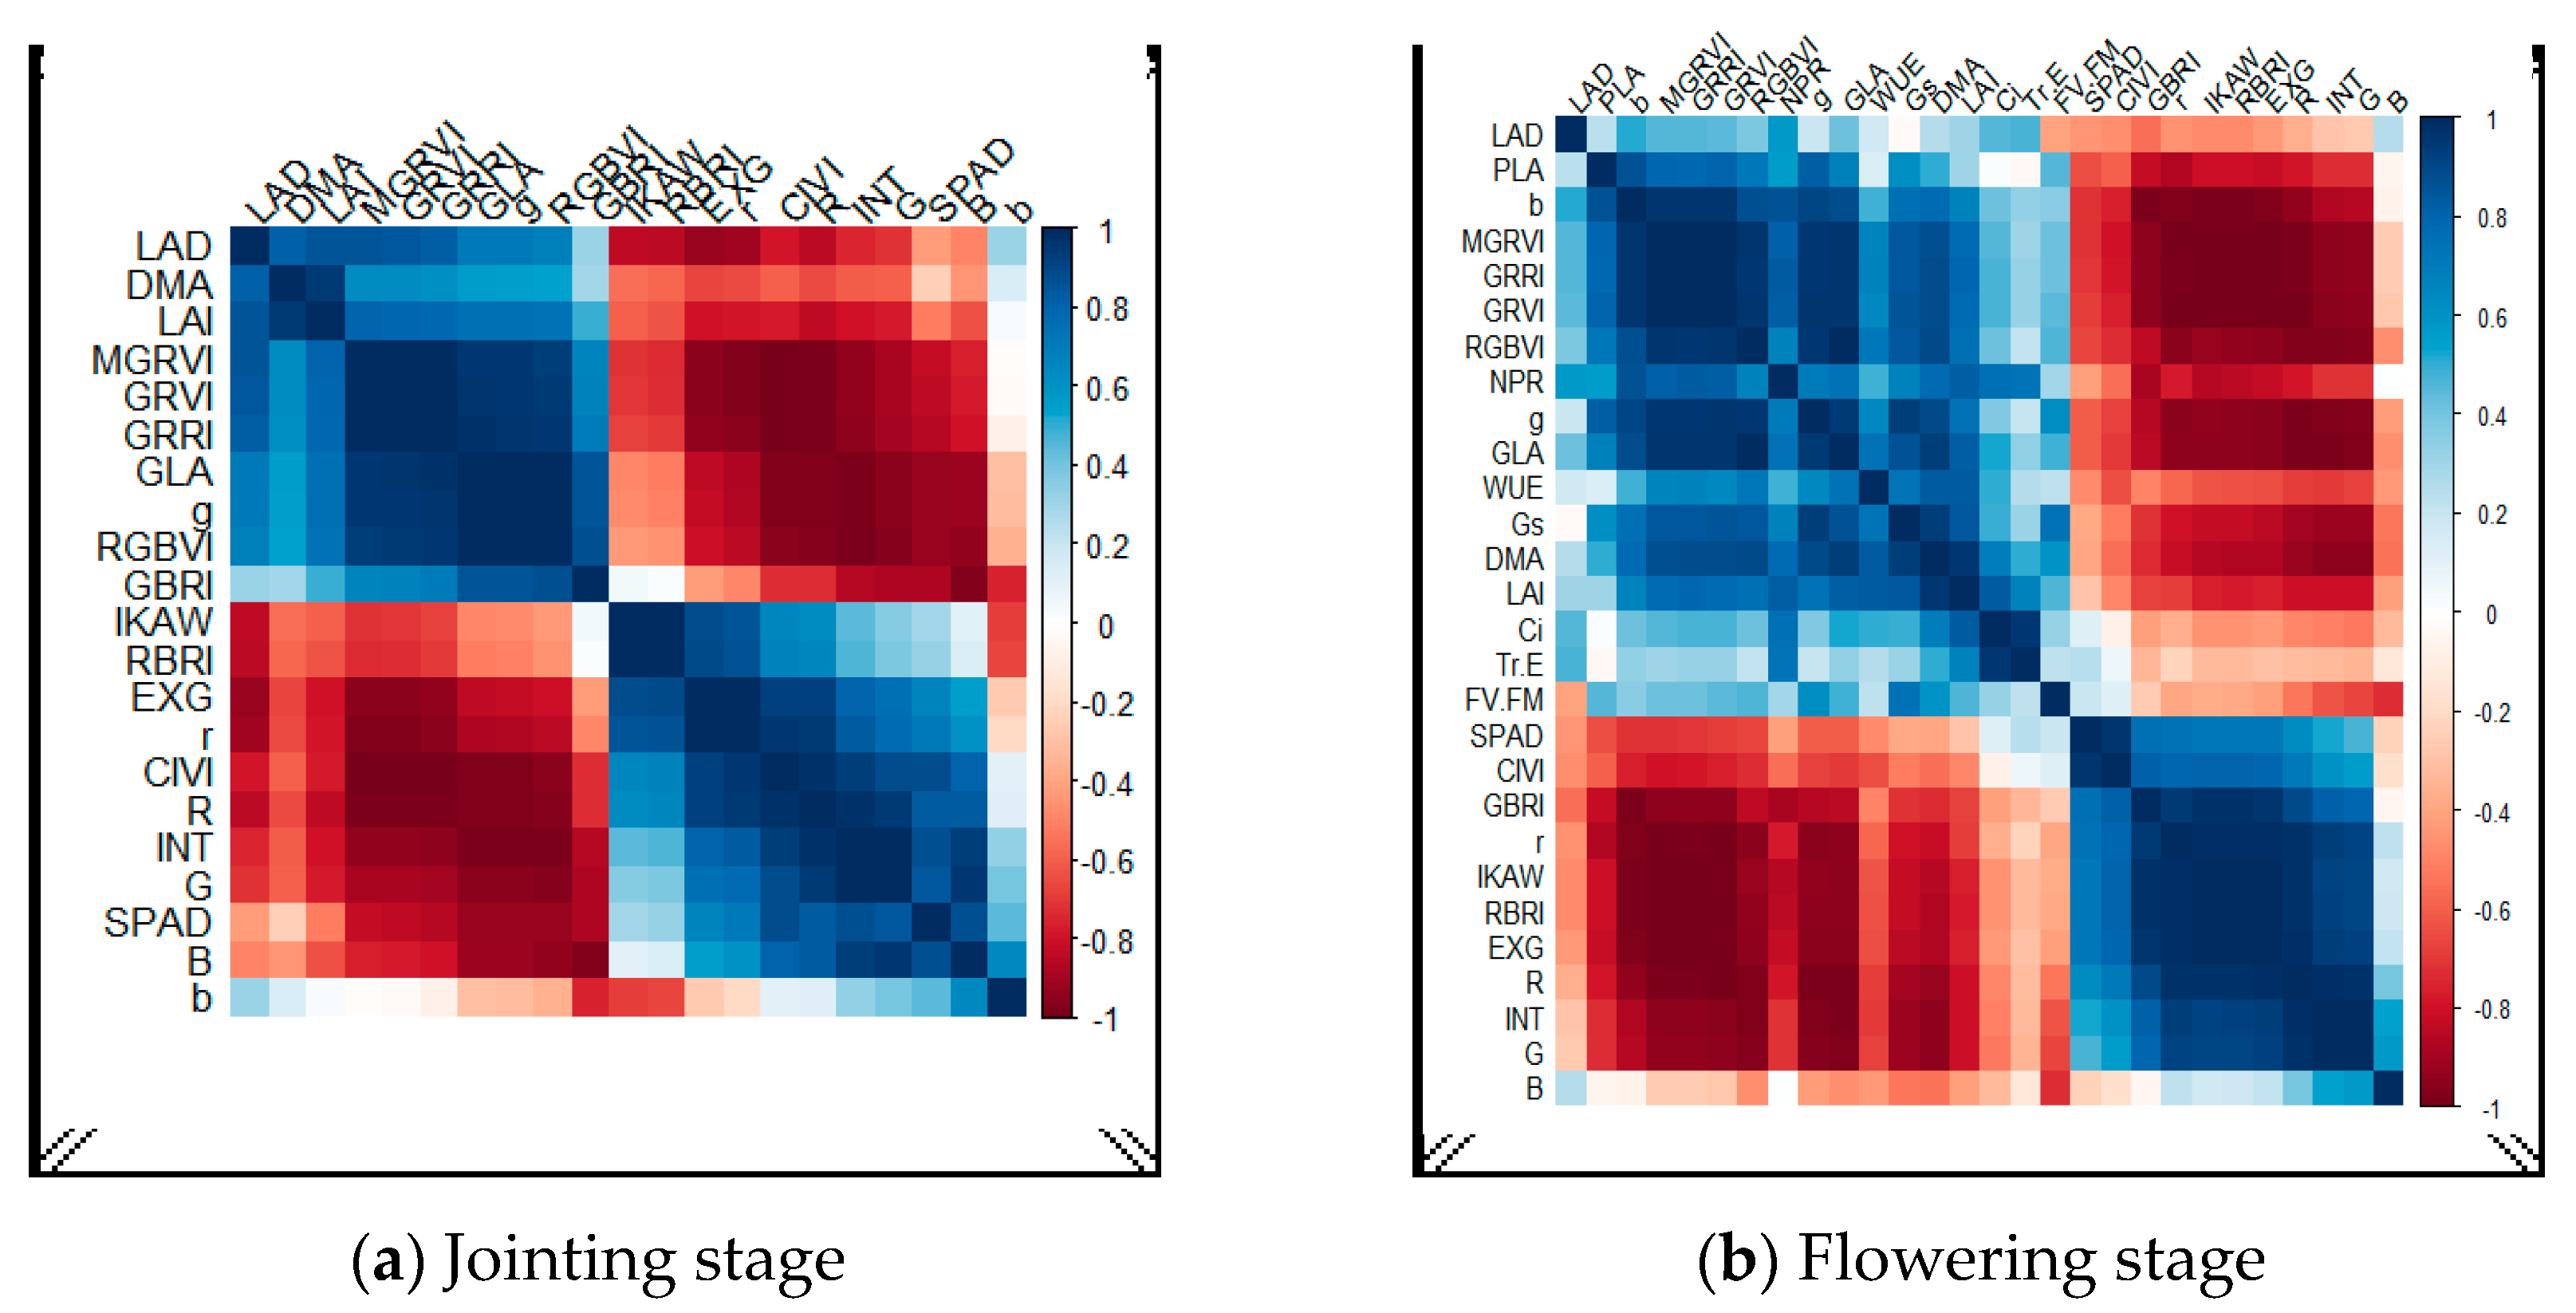
Figure 3.
Correlation coefficients of different digital image indices with wheat physiological indicators at filling and mature stages.
Figure 3.
Correlation coefficients of different digital image indices with wheat physiological indicators at filling and mature stages.
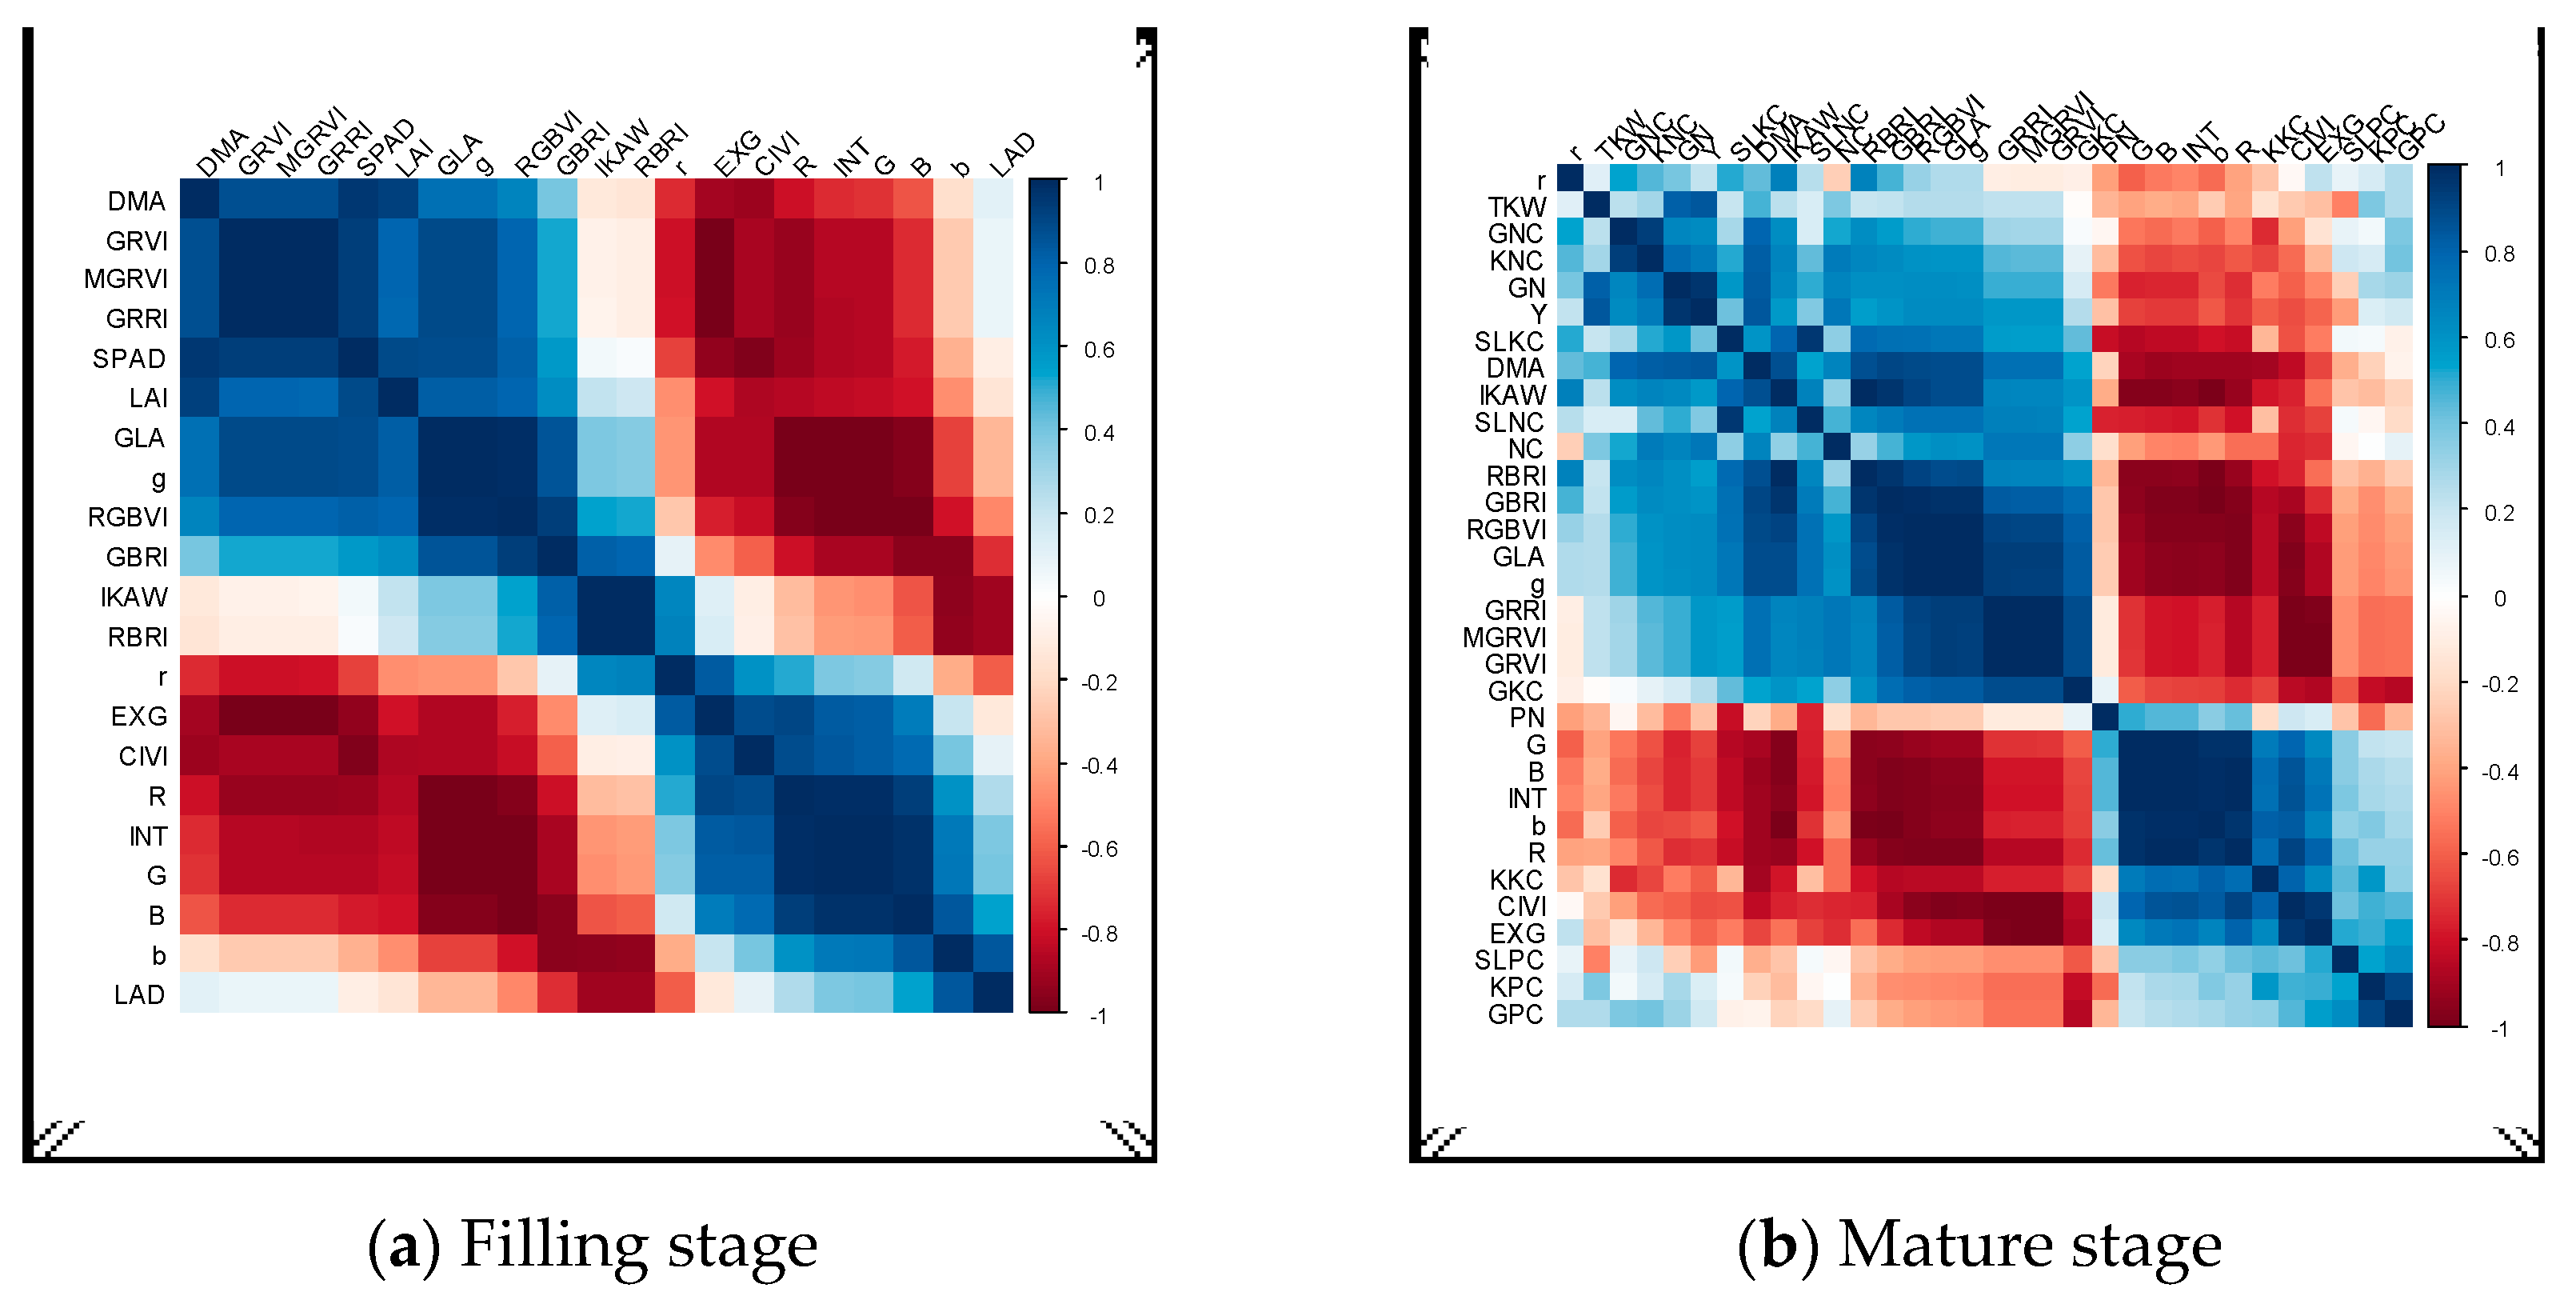
Figure 4.
Variation of wheat digital image indices with fertility period under different fertilization treatments.
Figure 4.
Variation of wheat digital image indices with fertility period under different fertilization treatments.
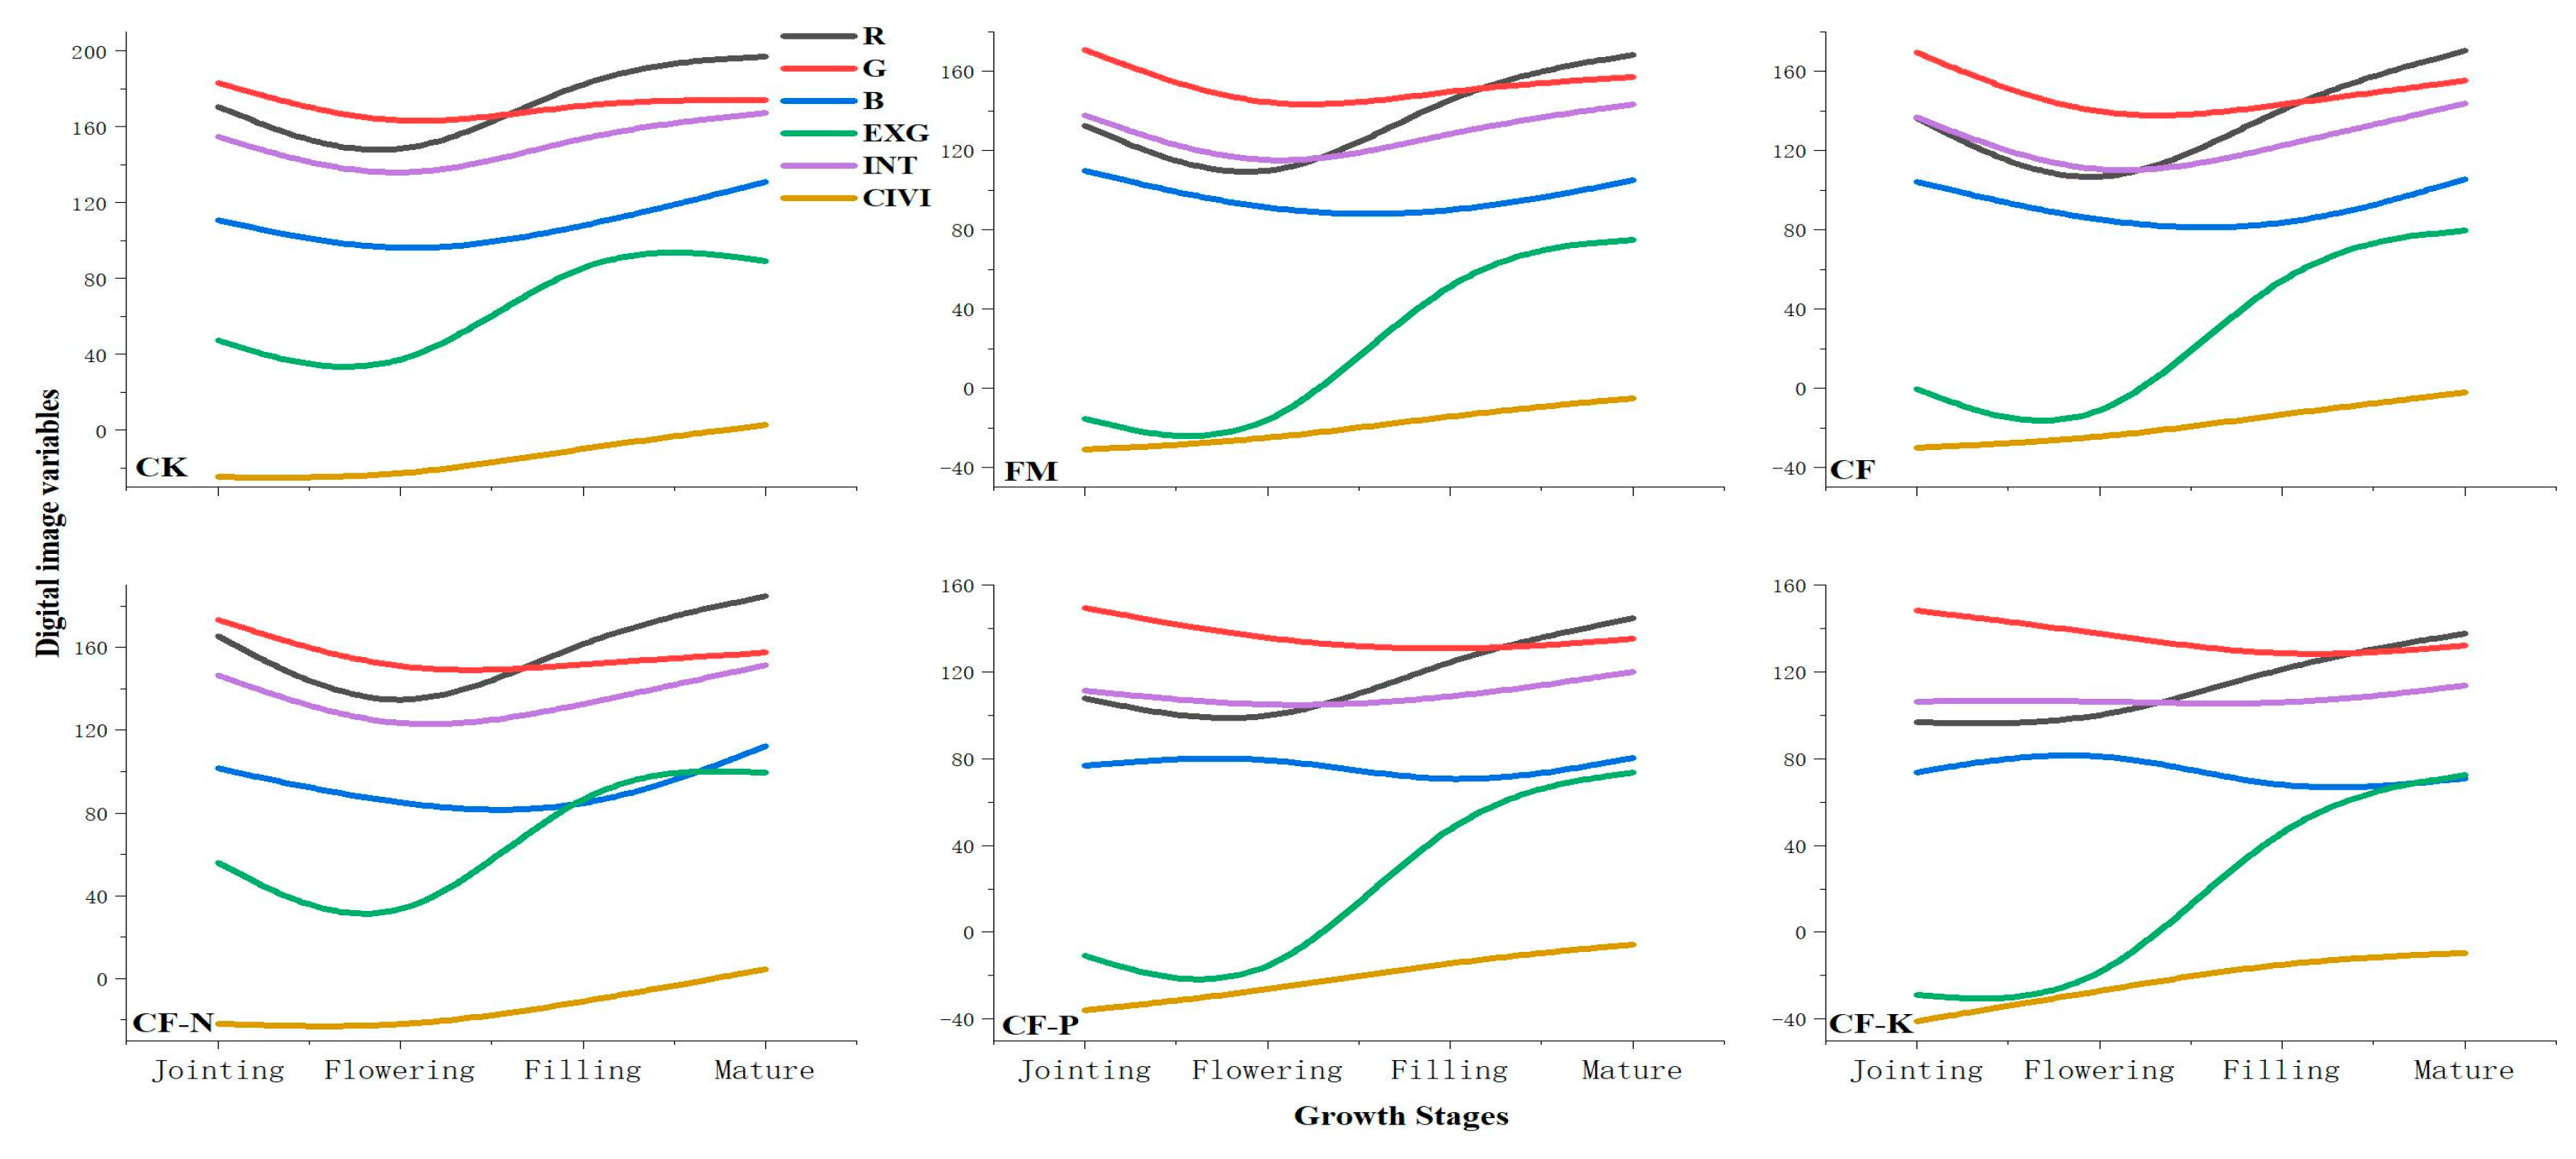
Figure 5.
Variation of wheat digital image indices with fertility period under different fertilization treatments.
Figure 5.
Variation of wheat digital image indices with fertility period under different fertilization treatments.
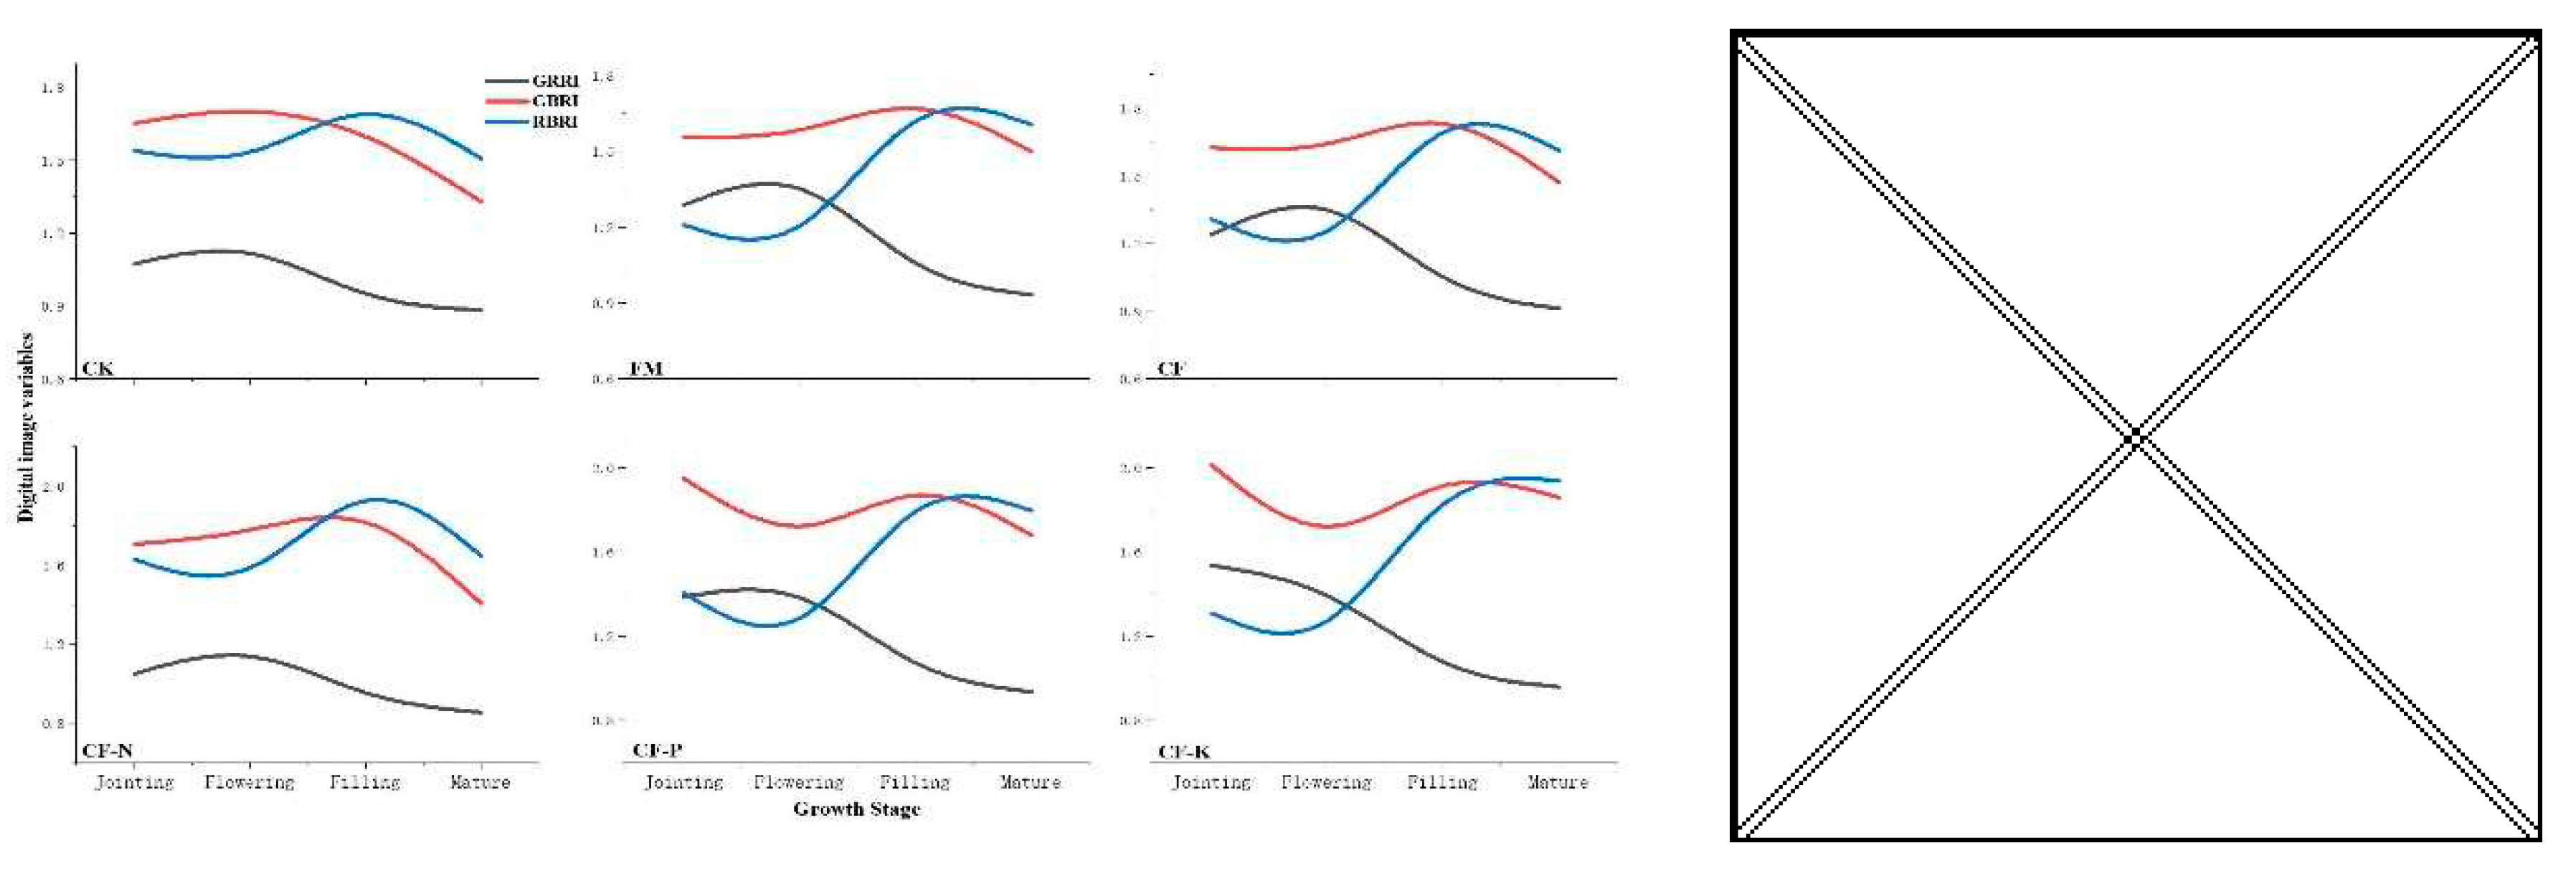
Figure 6.
Variation of wheat digital image indices with fertility period under different fertilization treatments.
Figure 6.
Variation of wheat digital image indices with fertility period under different fertilization treatments.
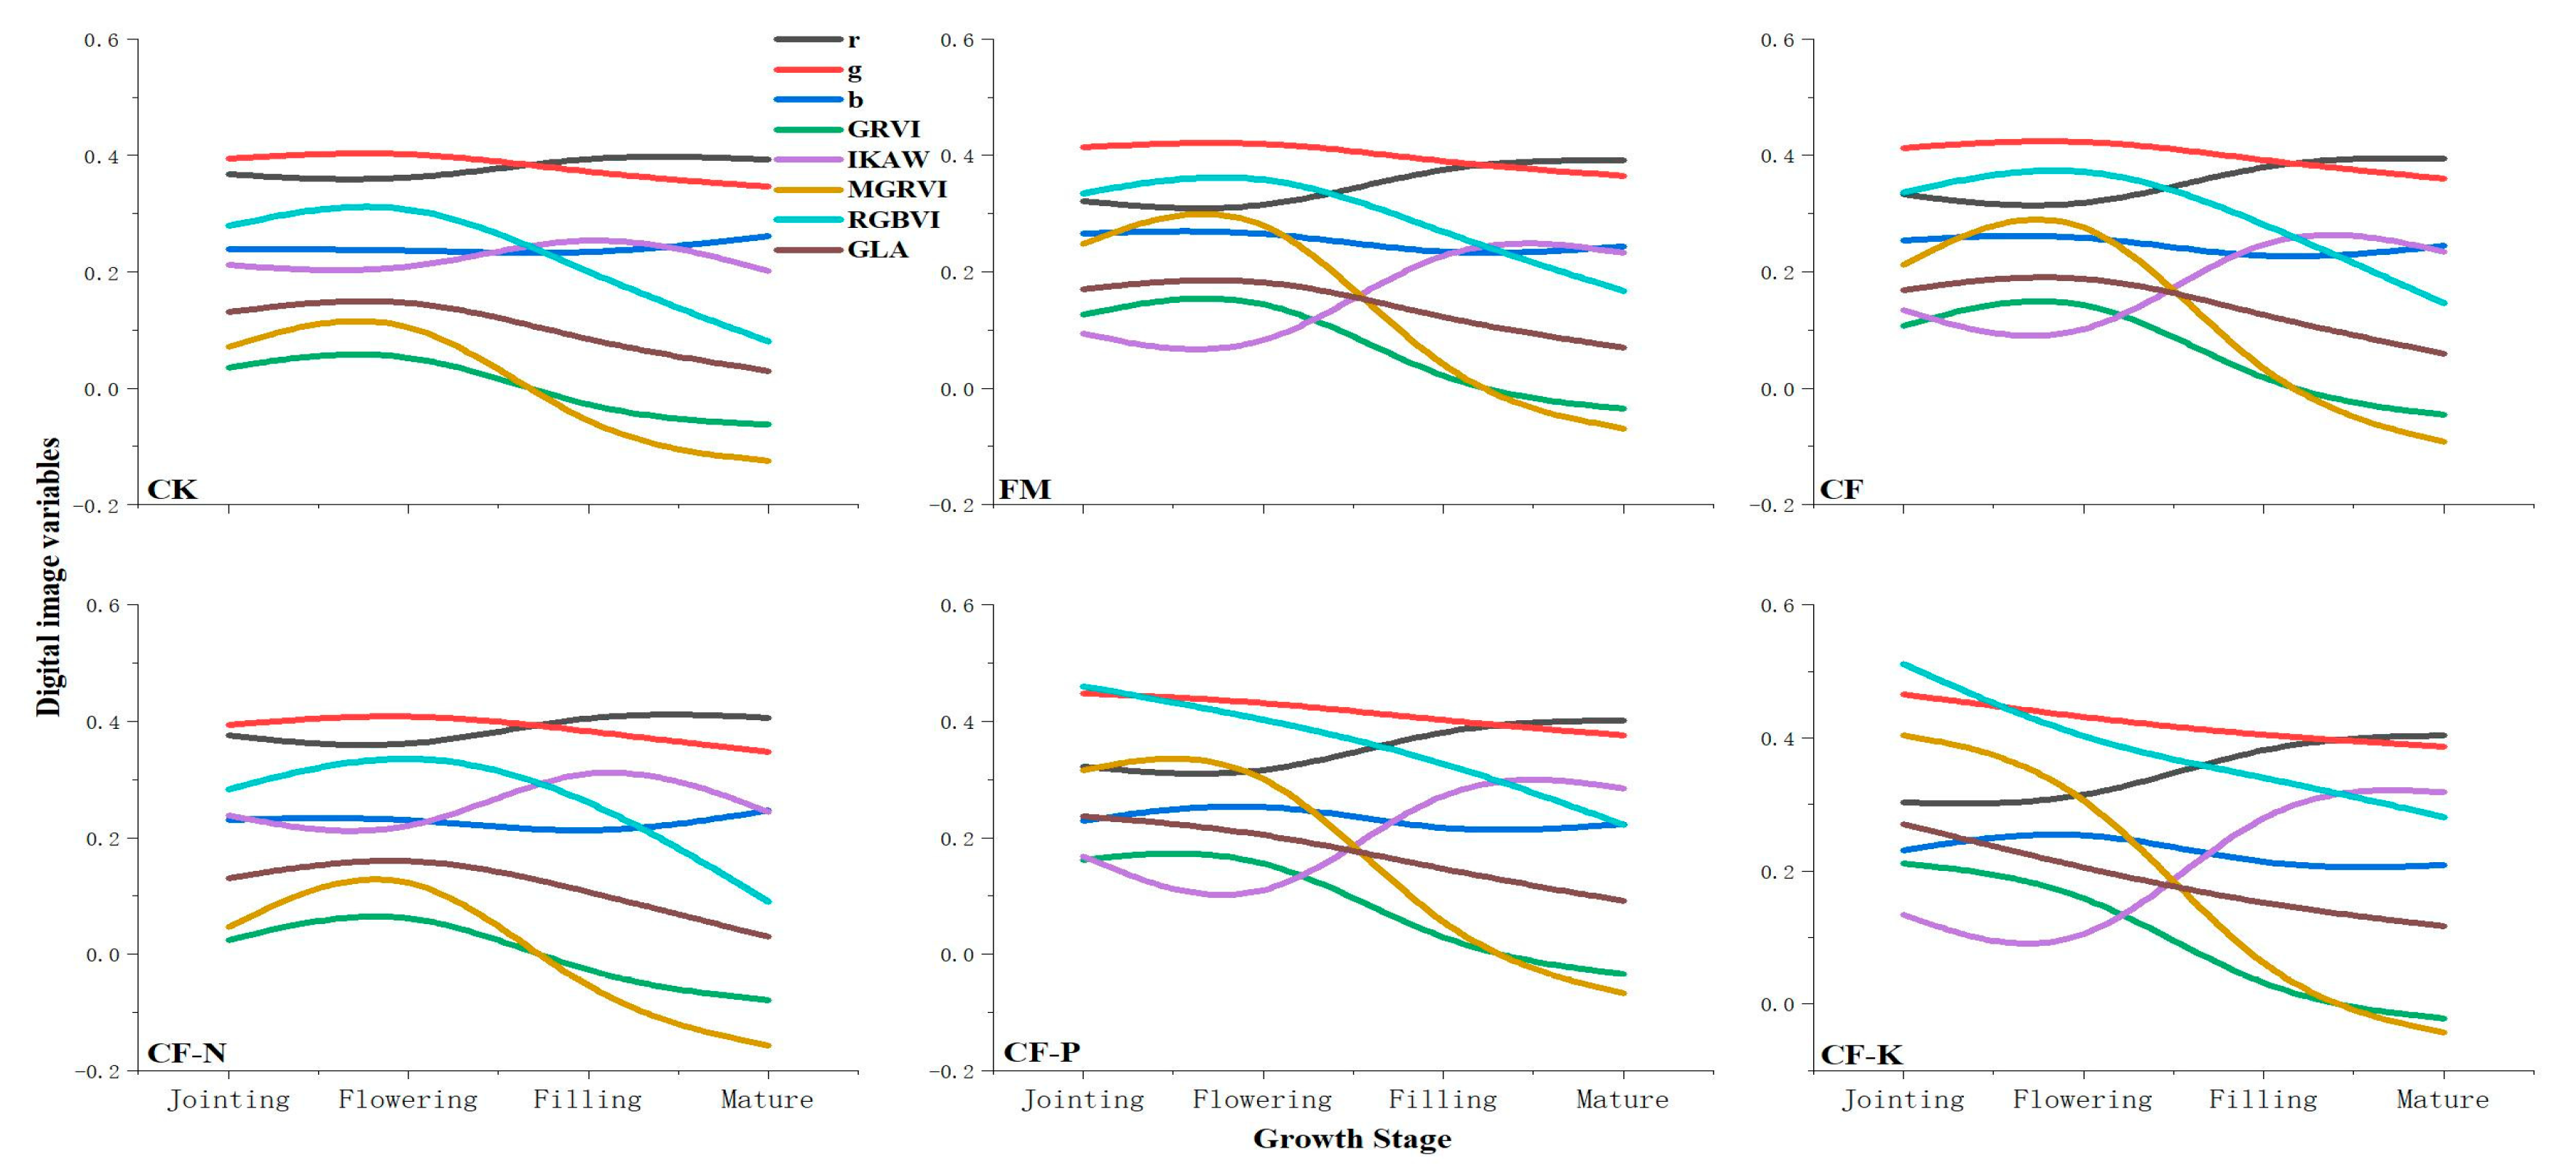
Figure 7.
Frequency of significant correlation between each digital image index and physiological indicators at different wheat reproductive periods.
Figure 7.
Frequency of significant correlation between each digital image index and physiological indicators at different wheat reproductive periods.
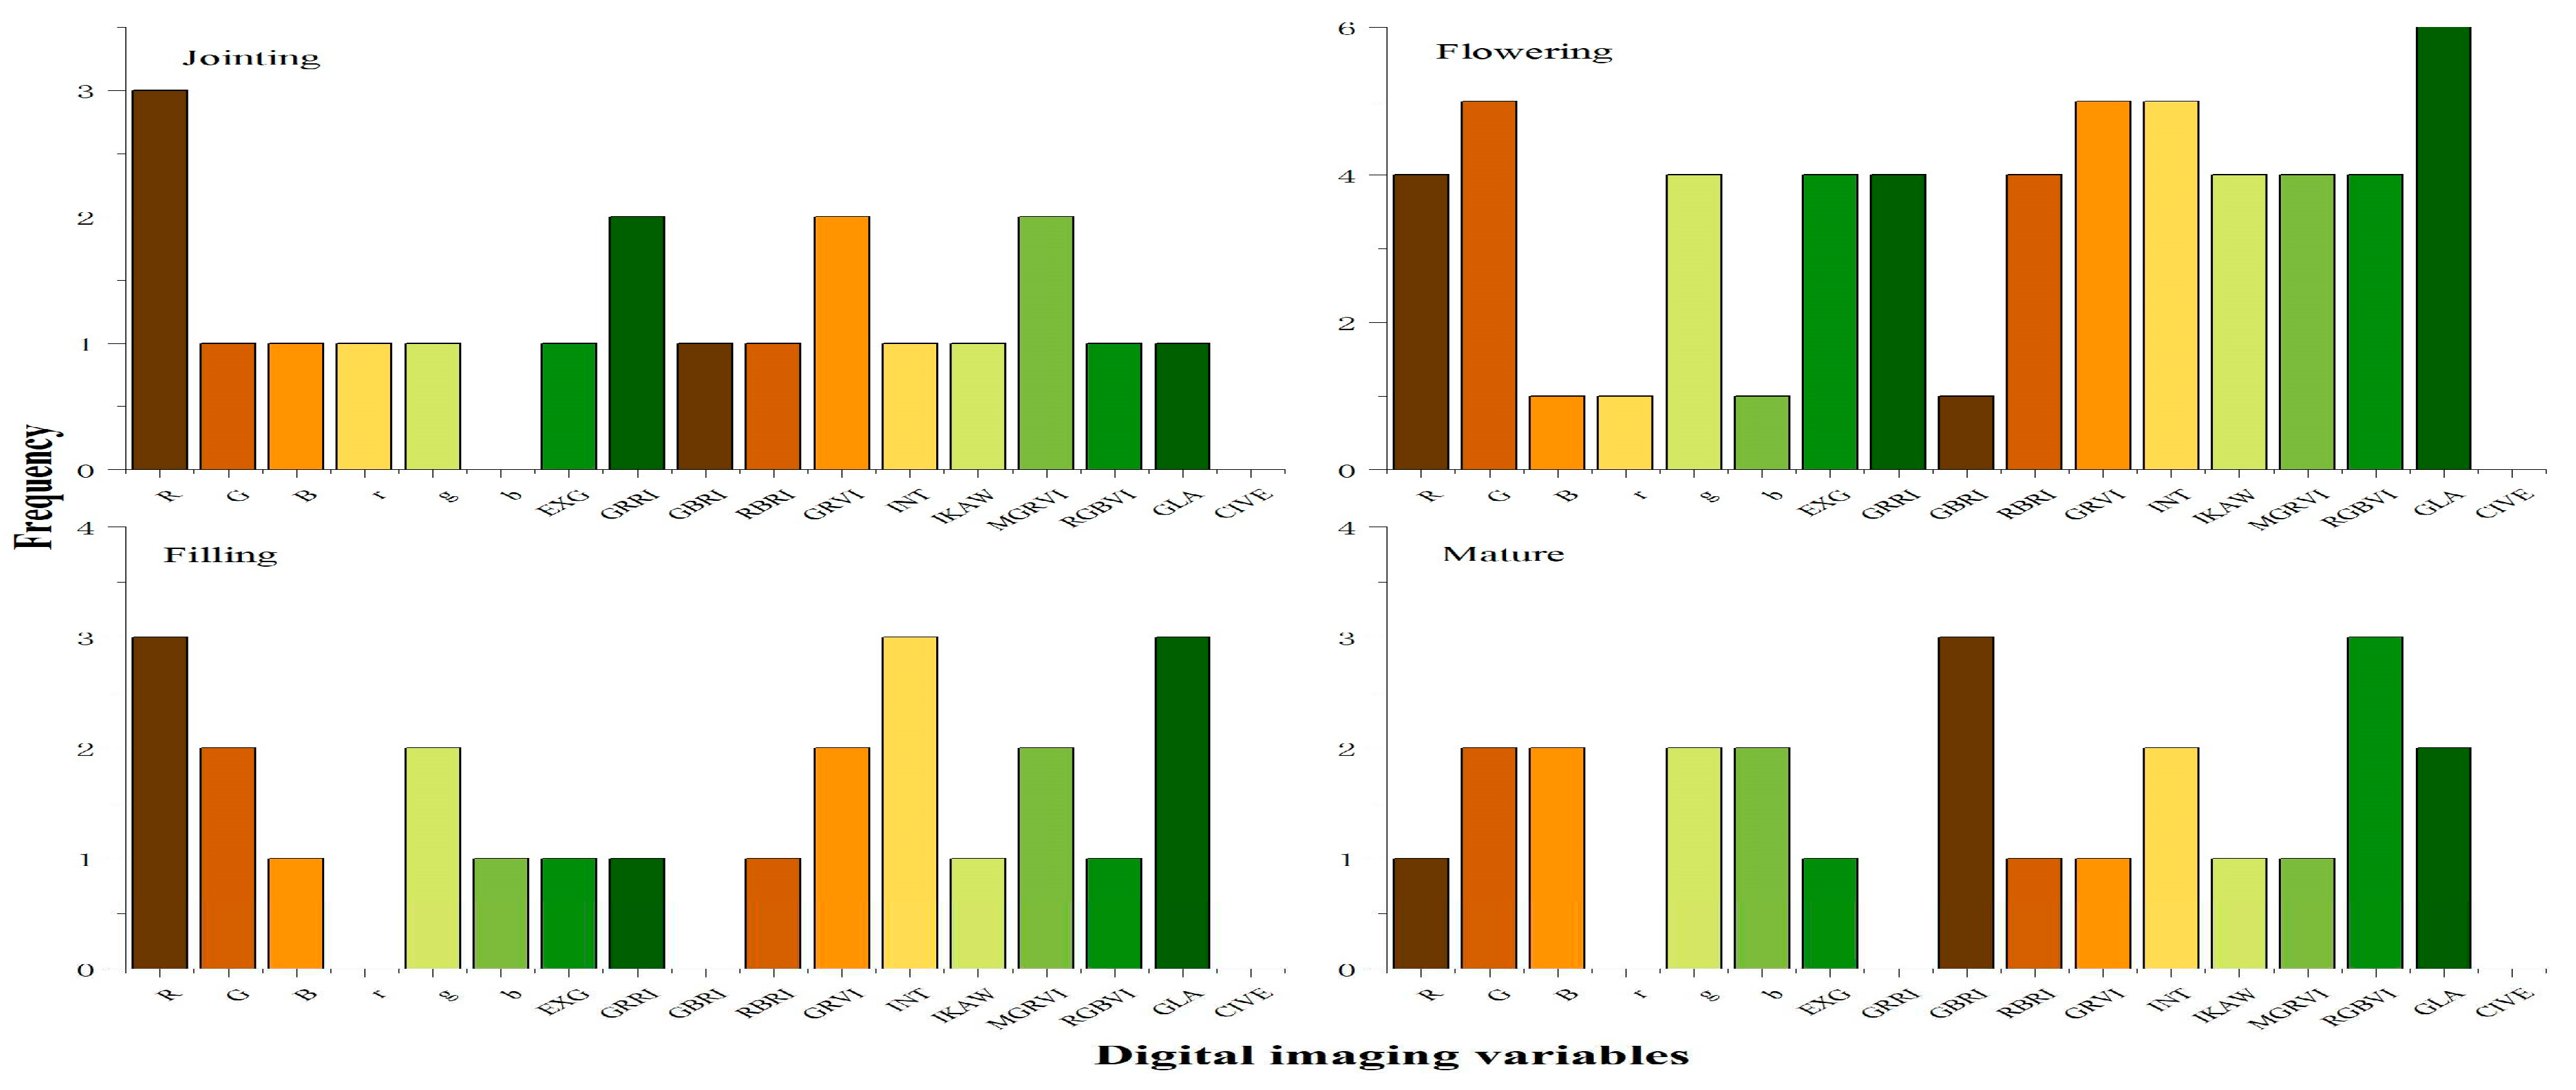

Table 1.
This table displays the fertilization rates of treatments.
| Treatments | Fertilizer rate (kg/hm2) | |||
|---|---|---|---|---|
| Nitrogen | Phosphate fertilizer (P2 O5 ) |
Potash fertilizer (K2 O) |
||
| Sowing N | Top-dressing N | |||
| CK | 0 | 0 | 0 | 0 |
| FM | 94.5 | 207 | 241.5 | 0 |
| CF | 52.5 | 124.5 | 61.5 | 60 |
| CF-N | 0.0 | 0.0 | 61.5 | 60 |
| CF-P | 52.5 | 124.5 | 0.0 | 60 |
| CF-K | 52.5 | 124.5 | 61.5 | 0.0 |
Table 2.
Calculation of digital image indices and cited literature sources. R, G, B and near infrared (NIR) indicate the measured reflectance (digital numbers) in red, green, blue and near-infrared wavelength ranges, respectively.
Table 2.
Calculation of digital image indices and cited literature sources. R, G, B and near infrared (NIR) indicate the measured reflectance (digital numbers) in red, green, blue and near-infrared wavelength ranges, respectively.
| Digital Image Index | Calculating formula |
Source Literature Reference |
|---|---|---|
| R | R | - |
| G | G | - |
| B | B | - |
| r | R/(R+G+B) | Citation 16 |
| g | G /(R+G+B) | Citation 16 |
| b | B /(R+G+B) | Citation 16 |
| ExG | 2 x G-R-B | Citation 17 |
| GRRI | G / R | Citation 17 |
| GBRI | G / B | Citation 17 |
| RBRI | R / B | Citation 17 |
| GRVI | (G-R)/(G+R) | Citation 17 |
| INT | (R+G+B)/3 | Citation 16 |
| IKAW | (R-B)/ (R+B) | Citation 17 |
| MGRVI | (G2 - R2 )/(G2 + R2) | Citation 17 |
| RGBVI | (G2 -B×R)/(G2 +B×R) | Citation 17 |
| GLA | (2×G-R-B)/(2×G+R+B) | Citation 17 |
| CIVE | 0.441R-0.881G+0.385B+18.7875 | Citation 17 |
Table 3.
Analysis of variance (ANOVA) of digital image indices under different fertilization treatments.
Table 3.
Analysis of variance (ANOVA) of digital image indices under different fertilization treatments.
| Digital Image Indices | P-value p-value |
CK | FM | CF | CF-N | CF-P | CF-K |
|---|---|---|---|---|---|---|---|
| R | 0.058 | 172.68 | 136.87 | 135.57 | 158.85 | 117.82 | 113.33 |
| G | 0.007 | 171.64a | 153.92abc | 149.85bc | 156.93ab | 136.97c | 136.00c |
| B | 0.011 | 109.60a | 97.31ab | 92.59abc | 93.67abc | 76.49bc | 73.69c |
| EXG | 0.580 | 64.11 | 22.52 | 28.71 | 67.09 | 22.18 | 16.96 |
| INT | 0.005 | 151.30a | 129.37abc | 126.00bc | 136.48ab | 110.42c | 107.67c |
| CIVE | 0.906 | -14.08 | -18.99 | -17.80 | -13.36 | -20.49 | -22.68 |
| r | 0.791 | 0.38 | 0.35 | 0.36 | 0.39 | 0.35 | 0.35 |
| g | 0.414 | 0.38 | 0.40 | 0.40 | 0.39 | 0.41 | 0.42 |
| b | 0.674 | 0.24 | 0.25 | 0.25 | 0.23 | 0.23 | 0.23 |
| GRRI | 0.634 | 1.01 | 1.17 | 1.15 | 1.00 | 1.20 | 1.24 |
| GBRI | 0.181 | 1.59 | 1.59 | 1.63 | 1.70 | 1.80 | 1.86 |
| RBRI | 0.859 | 1.58 | 1.41 | 1.47 | 1.71 | 1.56 | 1.58 |
| GRVI | 0.656 | 0.00 | 0.07 | 0.06 | 0.00 | 0.08 | 0.10 |
| IKAW | 0.844 | 0.22 | 0.16 | 0.18 | 0.26 | 0.21 | 0.21 |
| MGRVI | 0.666 | 0.00 | 0.13 | 0.11 | -0.00 | 0.16 | 0.18 |
| RGBVI | 0.318 | 0.22 | 0.29 | 0.29 | 0.25 | 0.36 | 0.38 |
| GLA | 0.419 | 0.10 | 0.14 | 0.14 | 0.11 | 0.17 | 0.18 |
Disclaimer/Publisher’s Note: The statements, opinions and data contained in all publications are solely those of the individual author(s) and contributor(s) and not of MDPI and/or the editor(s). MDPI and/or the editor(s) disclaim responsibility for any injury to people or property resulting from any ideas, methods, instructions or products referred to in the content. |
© 2024 by the authors. Licensee MDPI, Basel, Switzerland. This article is an open access article distributed under the terms and conditions of the Creative Commons Attribution (CC BY) license (http://creativecommons.org/licenses/by/4.0/).
Copyright: This open access article is published under a Creative Commons CC BY 4.0 license, which permit the free download, distribution, and reuse, provided that the author and preprint are cited in any reuse.


