1. GeoSurf Satellite Constellations at Millimeter Wavelengths
GeoSurf constellations [
1] share most advantages of current GEO (Geostationary), MEO (Medium Earth Orbit) and LEO (Low Earth Orbit) satellite constellations, without suffering most drawbacks of these designs, because GeoSurf uses zenith radio propagation paths worldwide, therefore as if the site were at the equator and connecting to a GEO satellite at the zenith.
In [
2] we have studied the tropospheric attenuation of GeoSurf zenith paths and compared it to that of the slant paths to GEO, MEO and LEO satellites. In [
3] we have studied the annual average probability distribution
of exceeding rain attenuation
(dB), and have shown how it depends on carrier frequency at sites located in different climatic regions, sites considered also in the present paper. As experimental results, we have considered the rain attenuation time series
simulated with the Synthetic Storm Technique (SST) [
4] from on–site rain rate time series
recorded for several years.
Because these studies refer to channels with negligible linear (amplitude and phase) distortions – i.e., narrow–band channels – in [
5] we have simulated the slowly time–varying transfer–function and linear distortions in ultra–wideband radio links in GeoSurf constellations working at millimeter wavelengths, namely 80 GHz in 10–GHz bandwidth channels. We think that these channels can be used in future worldwide internet adopting spread spectrum modulation and Code Division Multiple Access (CDMA) [
6,
7,
8,
9,
10], with BPSK and QPSK modulation. In fact, CDMA can provide large processing gain, it is robust against frequency interference, it does not require multiple access coordination, all characteristics which, together with the further advantages of the GeoSurf constellations mentioned in
Table 1 of [
1], makes it an effective choice to provide high bit rates to scattered users.
Continuing our development of GeoSurf satellite constellations design, in [
11] we have studied the interference caused by amplitude and phase distortions induced by rain (simulations with the SST) in ultra–wideband communication systems designed for using amplitude modulation. We have shown that the theoretical capacity loss of these channels is small, therefore they can be used at millimeter waves.
In the present paper, our aim is to study fade durations at millimeter waves by simulating rain attenuation time series at 80 GHz, with the SST, from long–term on–site recordings of rain rate time series .
Fade duration is the second most–important link parameter required for designing a satellite link faded by rain because it gives the interval
exceeds an attenuation threshold
(dB), usually the link power margin compared to clear sky. Therefore, fade durations have been measured, at lower frequency bands, in several satellite links, as reported in more recent references [
12,
13,
14,
15,
16,
17,
18,
19,
20,
21,
22,
23,
24,
25,
26,
27], in slant paths not larger than about 60°, as in the ITU–R Recommendation [
28].
No measurements or predictions are, however, available for zenith paths, even when low–latitude sites are considered [
16]. Now, the SST is a powerful tool that can simulate reliable time series
in slant paths in which simulations of fade duration statistics were validated years ago [
29] and more recently [
22].
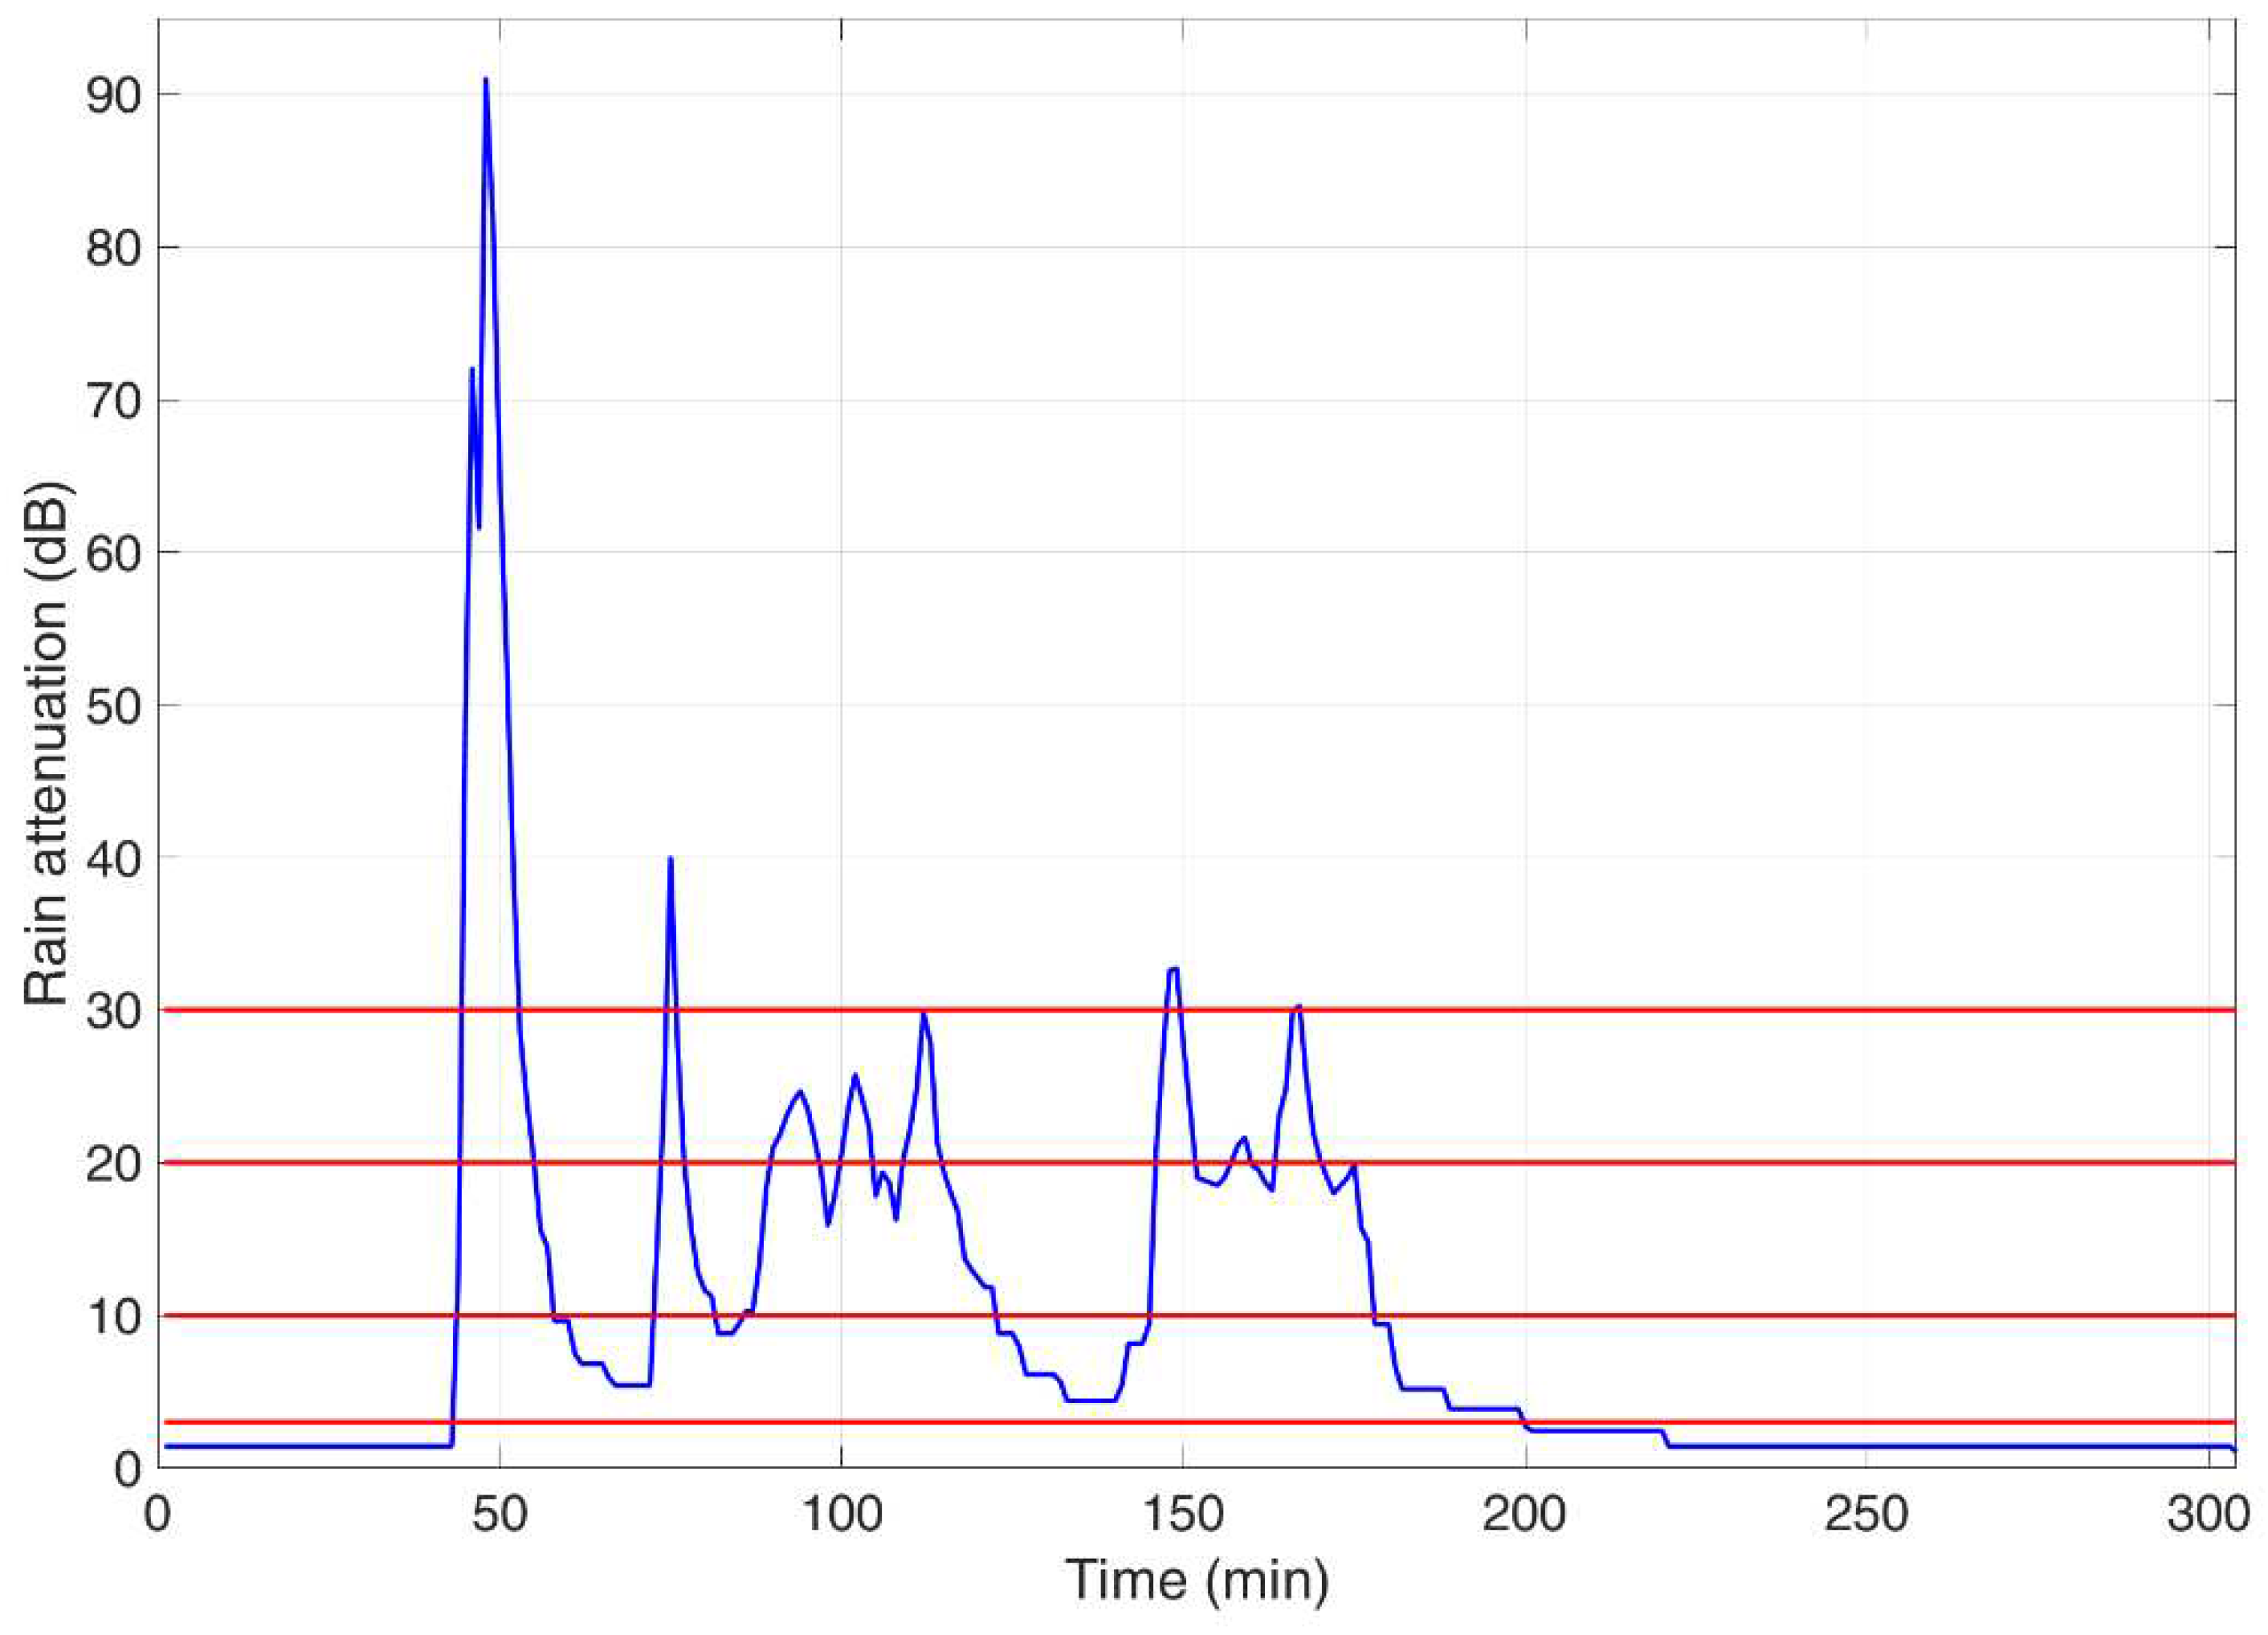
Figure 1 shows
at 80 GHz, circular polarization, simulated in the zenith path at Spino d’Adda (
Table 1). A threshold
(dB) can be crossed more than once, with different intervals
(min) which define the stochastic variable “fade duration”. Since
is usually the power margin of the radio link, any time
the communication link fades and the communication system experiences an outage.
We can count the number of these occurrences and calculate the outage probability. Long ago, we called this stochastic process “process B” [
30]. However, besides the number of occurrences, also the duration
itself is another stochastic variable of great importance because it gives the outage duration. We called this process of fade duration “process A” [
30].
In other words, process B gives the statistics of outages, process A give the statistics of outage duration. In satellite communications both are, of course, useful because some services – especially non–real time services, such as data delivery – can more disturbed by the number of outages (e.g., in an average year, month, etc.) rather than by their duration, while some others – especially real–time services such as television, video conference etc. – are more disturbed by the duration of the outage.
In the next section, we define the probability distribution of the processes A and B; in
Section 3 we present worldwide sites investigated with the Synthetic Storm Technique; in
Section 4 we show the fade duration experimental results; in
Section 5 we study the interdependence of the two processes; in
Section 6 we define and study a uniformity index, which compares real cases – fade durations fragmented in many different intervals, with changing
and site – to the limiting case of all fades lasting the same time; finally, in
Section 7 we conclude by summarizing the main results and their impact on system design.
2. Fade Duration Processes A and B
According to
Section 1, fade duration can be studied from two points of view, both useful. The stochastic variable is the same for both processes – namely the interval
in which
continuously – but the statistical “weight” given to
is different. In process A an interval
is given a weight
, while in process B it is given a weight of one unit. This approach of distinguishing and studying the two processes is very fruitfull when a stocastic variable assumes values in a large range – as it occurs for rainfall fades – and when they impact on system differently, according to the interruptions tolerated by users.
Figure 1.
Rain attenuation time series, 80 GHz circular polarization, zenith path, at Spino d’Adda, 6 May 2000, rain event starts at 17.30 local time. The red lines are drawn at thresholds 3, 10, 20 and 30 dB.
Figure 1.
Rain attenuation time series, 80 GHz circular polarization, zenith path, at Spino d’Adda, 6 May 2000, rain event starts at 17.30 local time. The red lines are drawn at thresholds 3, 10, 20 and 30 dB.
The conditional cumulative probability distribution of exceeding a fade duration
in process A,
is defined by:
In Eq.(1), is the number of fades of duration , is the total time the threshold is exceeded in the reference time (e.g., in an average year, month, etc.). According to Eq.(1), can be also read as the fraction of the total time for which .
The conditional cumulative probability distribution of exceeding
in process B,
is defined by:
In Eq. (2), is the total number of fade durations the threshold is exceeded in the reference time. According to Eq.(2), is read in the usual way of percentage of total occurrences for which . In both equations the integrals are calculated as discrete summations.
3. Worldwide Sites Investigated with the Synthetic Storm Technique
To illustrate the general characteristics of
and
and their relationship, we report the results concerning the sites listed in
Table 1, located in different climatic regions. The rain attenuation expected in GeoSurf radio–links is independent of the particular GeoSurf design (e.g., altitude and number of satellites), because all paths to/from a satellite of the constellation are always vertical (zenith paths) [
1].
is calculated with the Synthetic Storm Technique [
4].
Besides being in different climatic regions, these particular sites are useful study–cases because: (a) on–site rain–rate time series
(mm/h) – the input physical measurements to the SST [
4] – with rain rate averaged in 1–min intervals, were continuously recorded for several years; (b) they are the sites of important NASA and ESA satellite ground stations (Fucino, Madrid, White Sands), or the site where long–term radio propagation experiments were performed in Italy (Fucino, Gera Lario, Spino d’Adda) or large cities (Prague, Norman, Tampa, Vancouver).
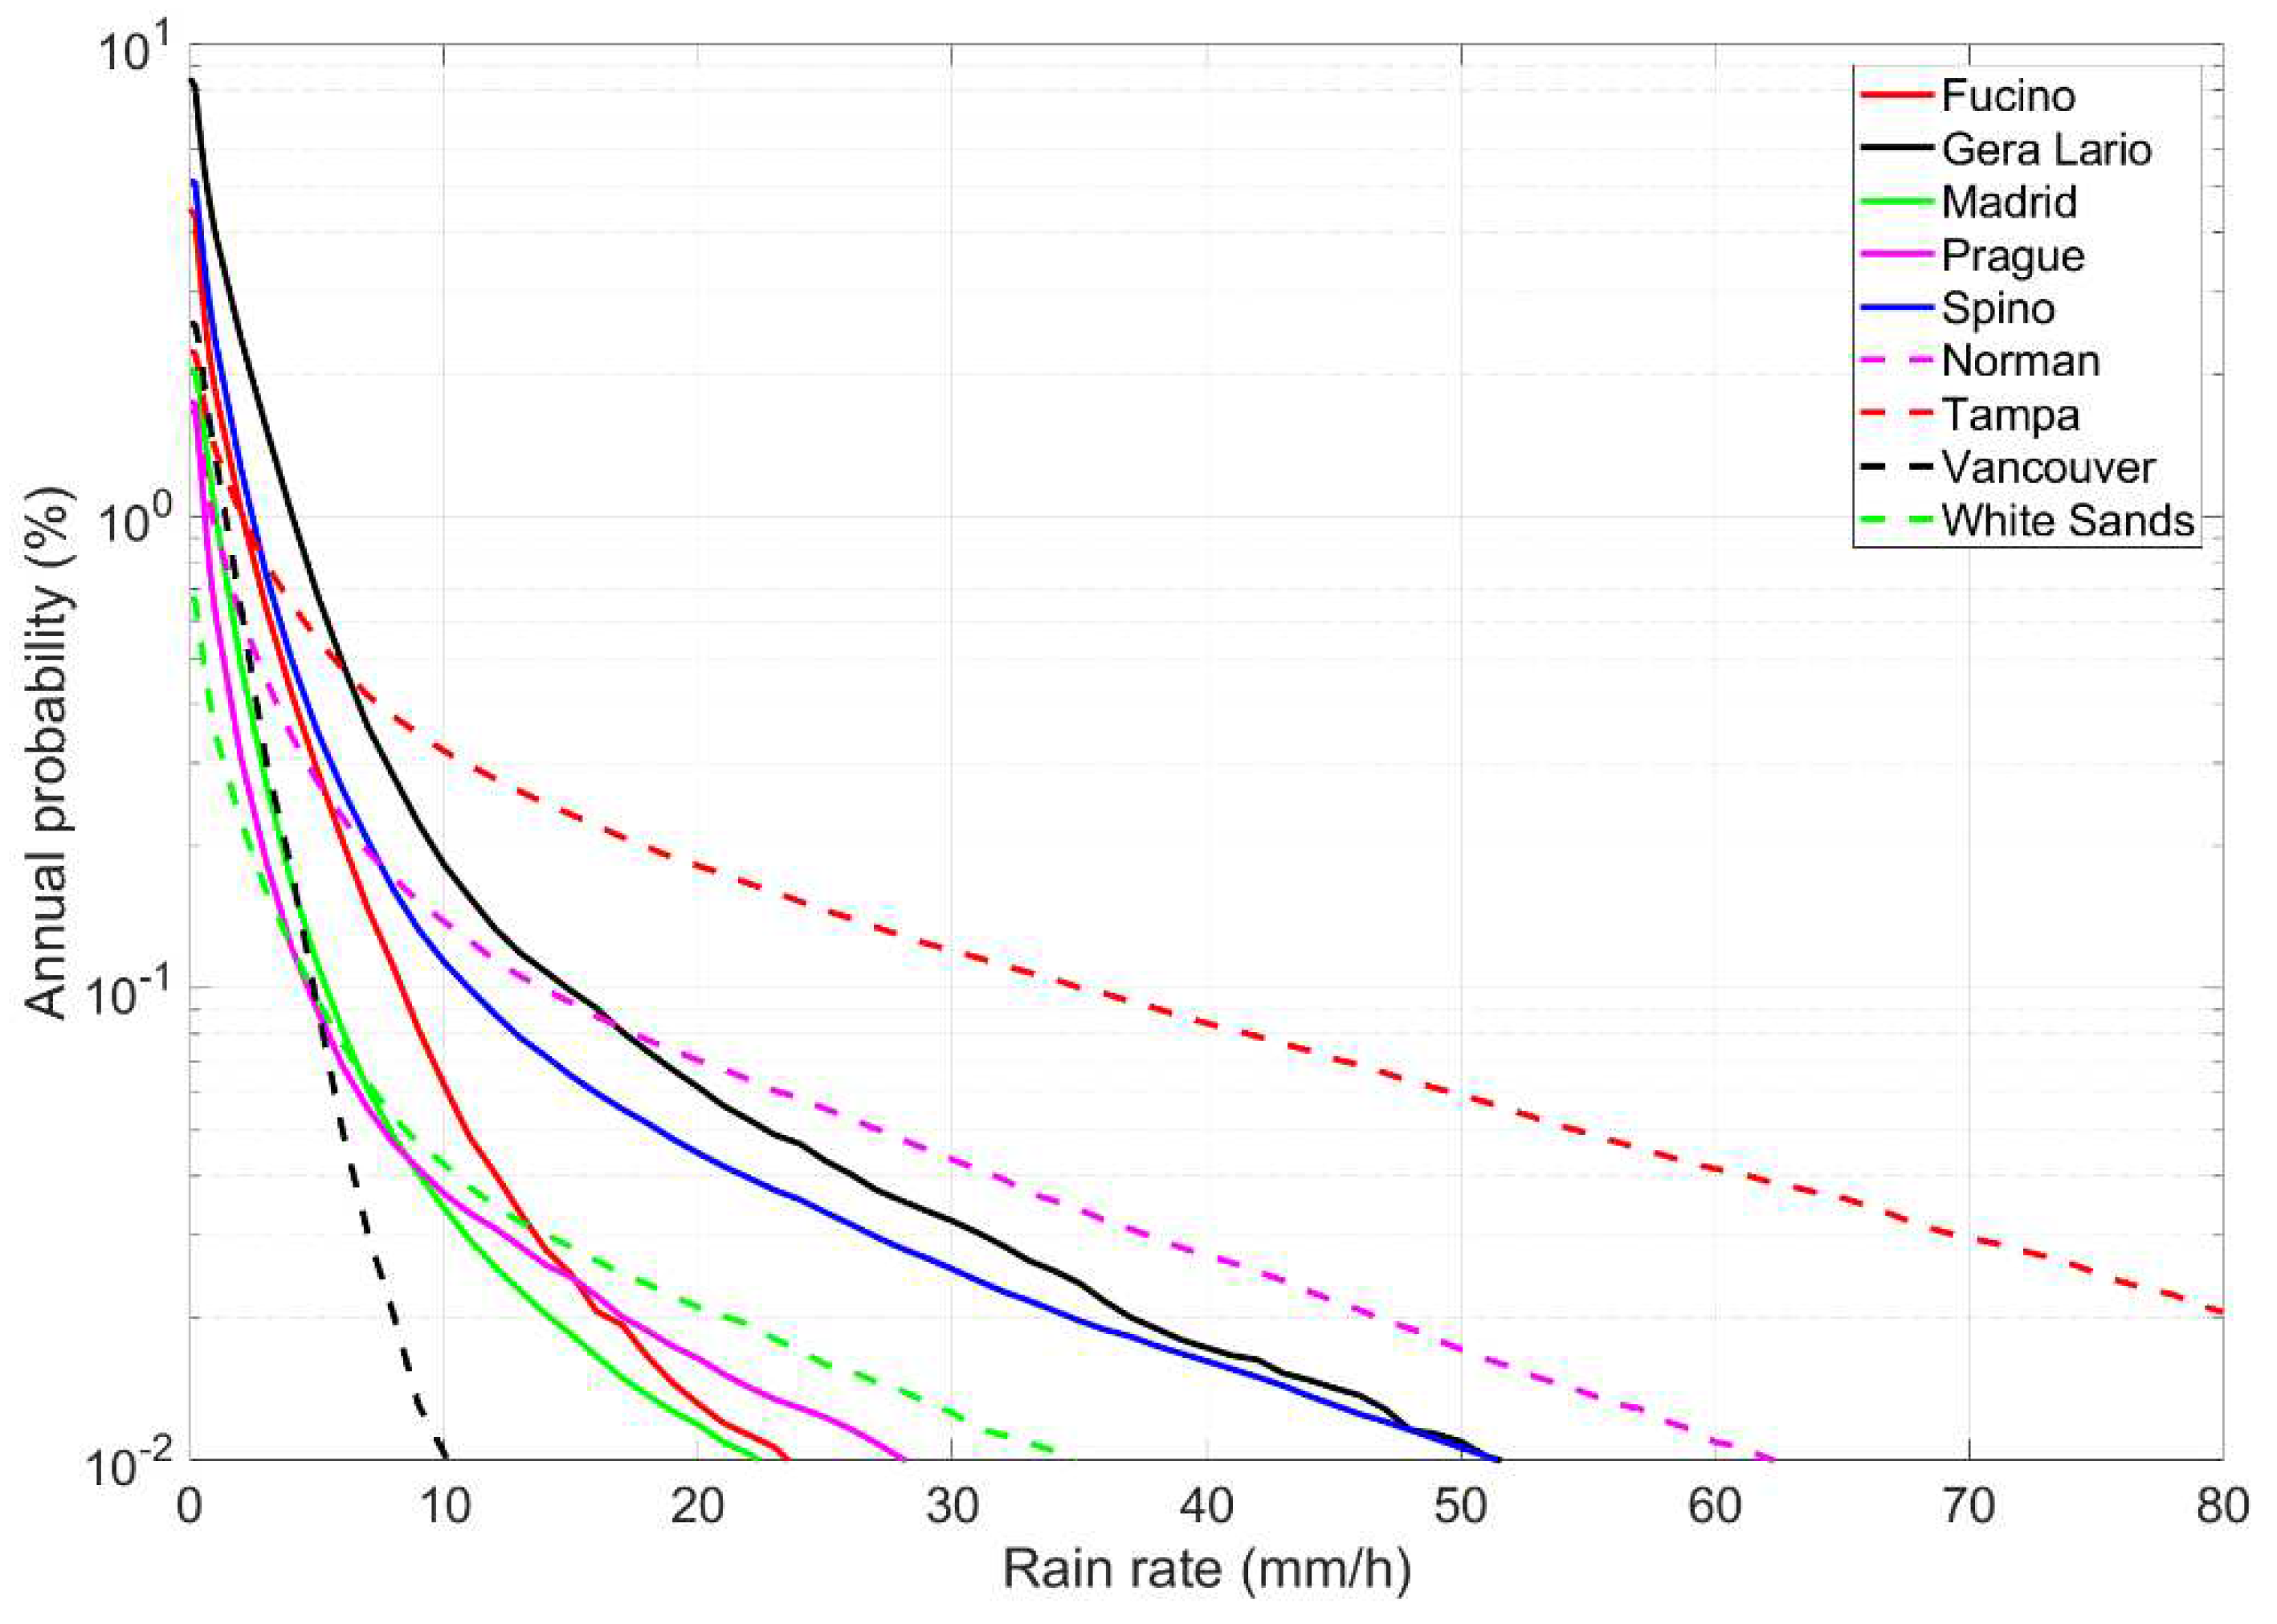
Figure 2 shows the average annual probability distribution
of exceeding
(mm/h, averaged in 1 min) measured at the indicated sites. The different climatic rain conditions of these sites are clearly evident by comparing the rain rate exceeded with the same probability.
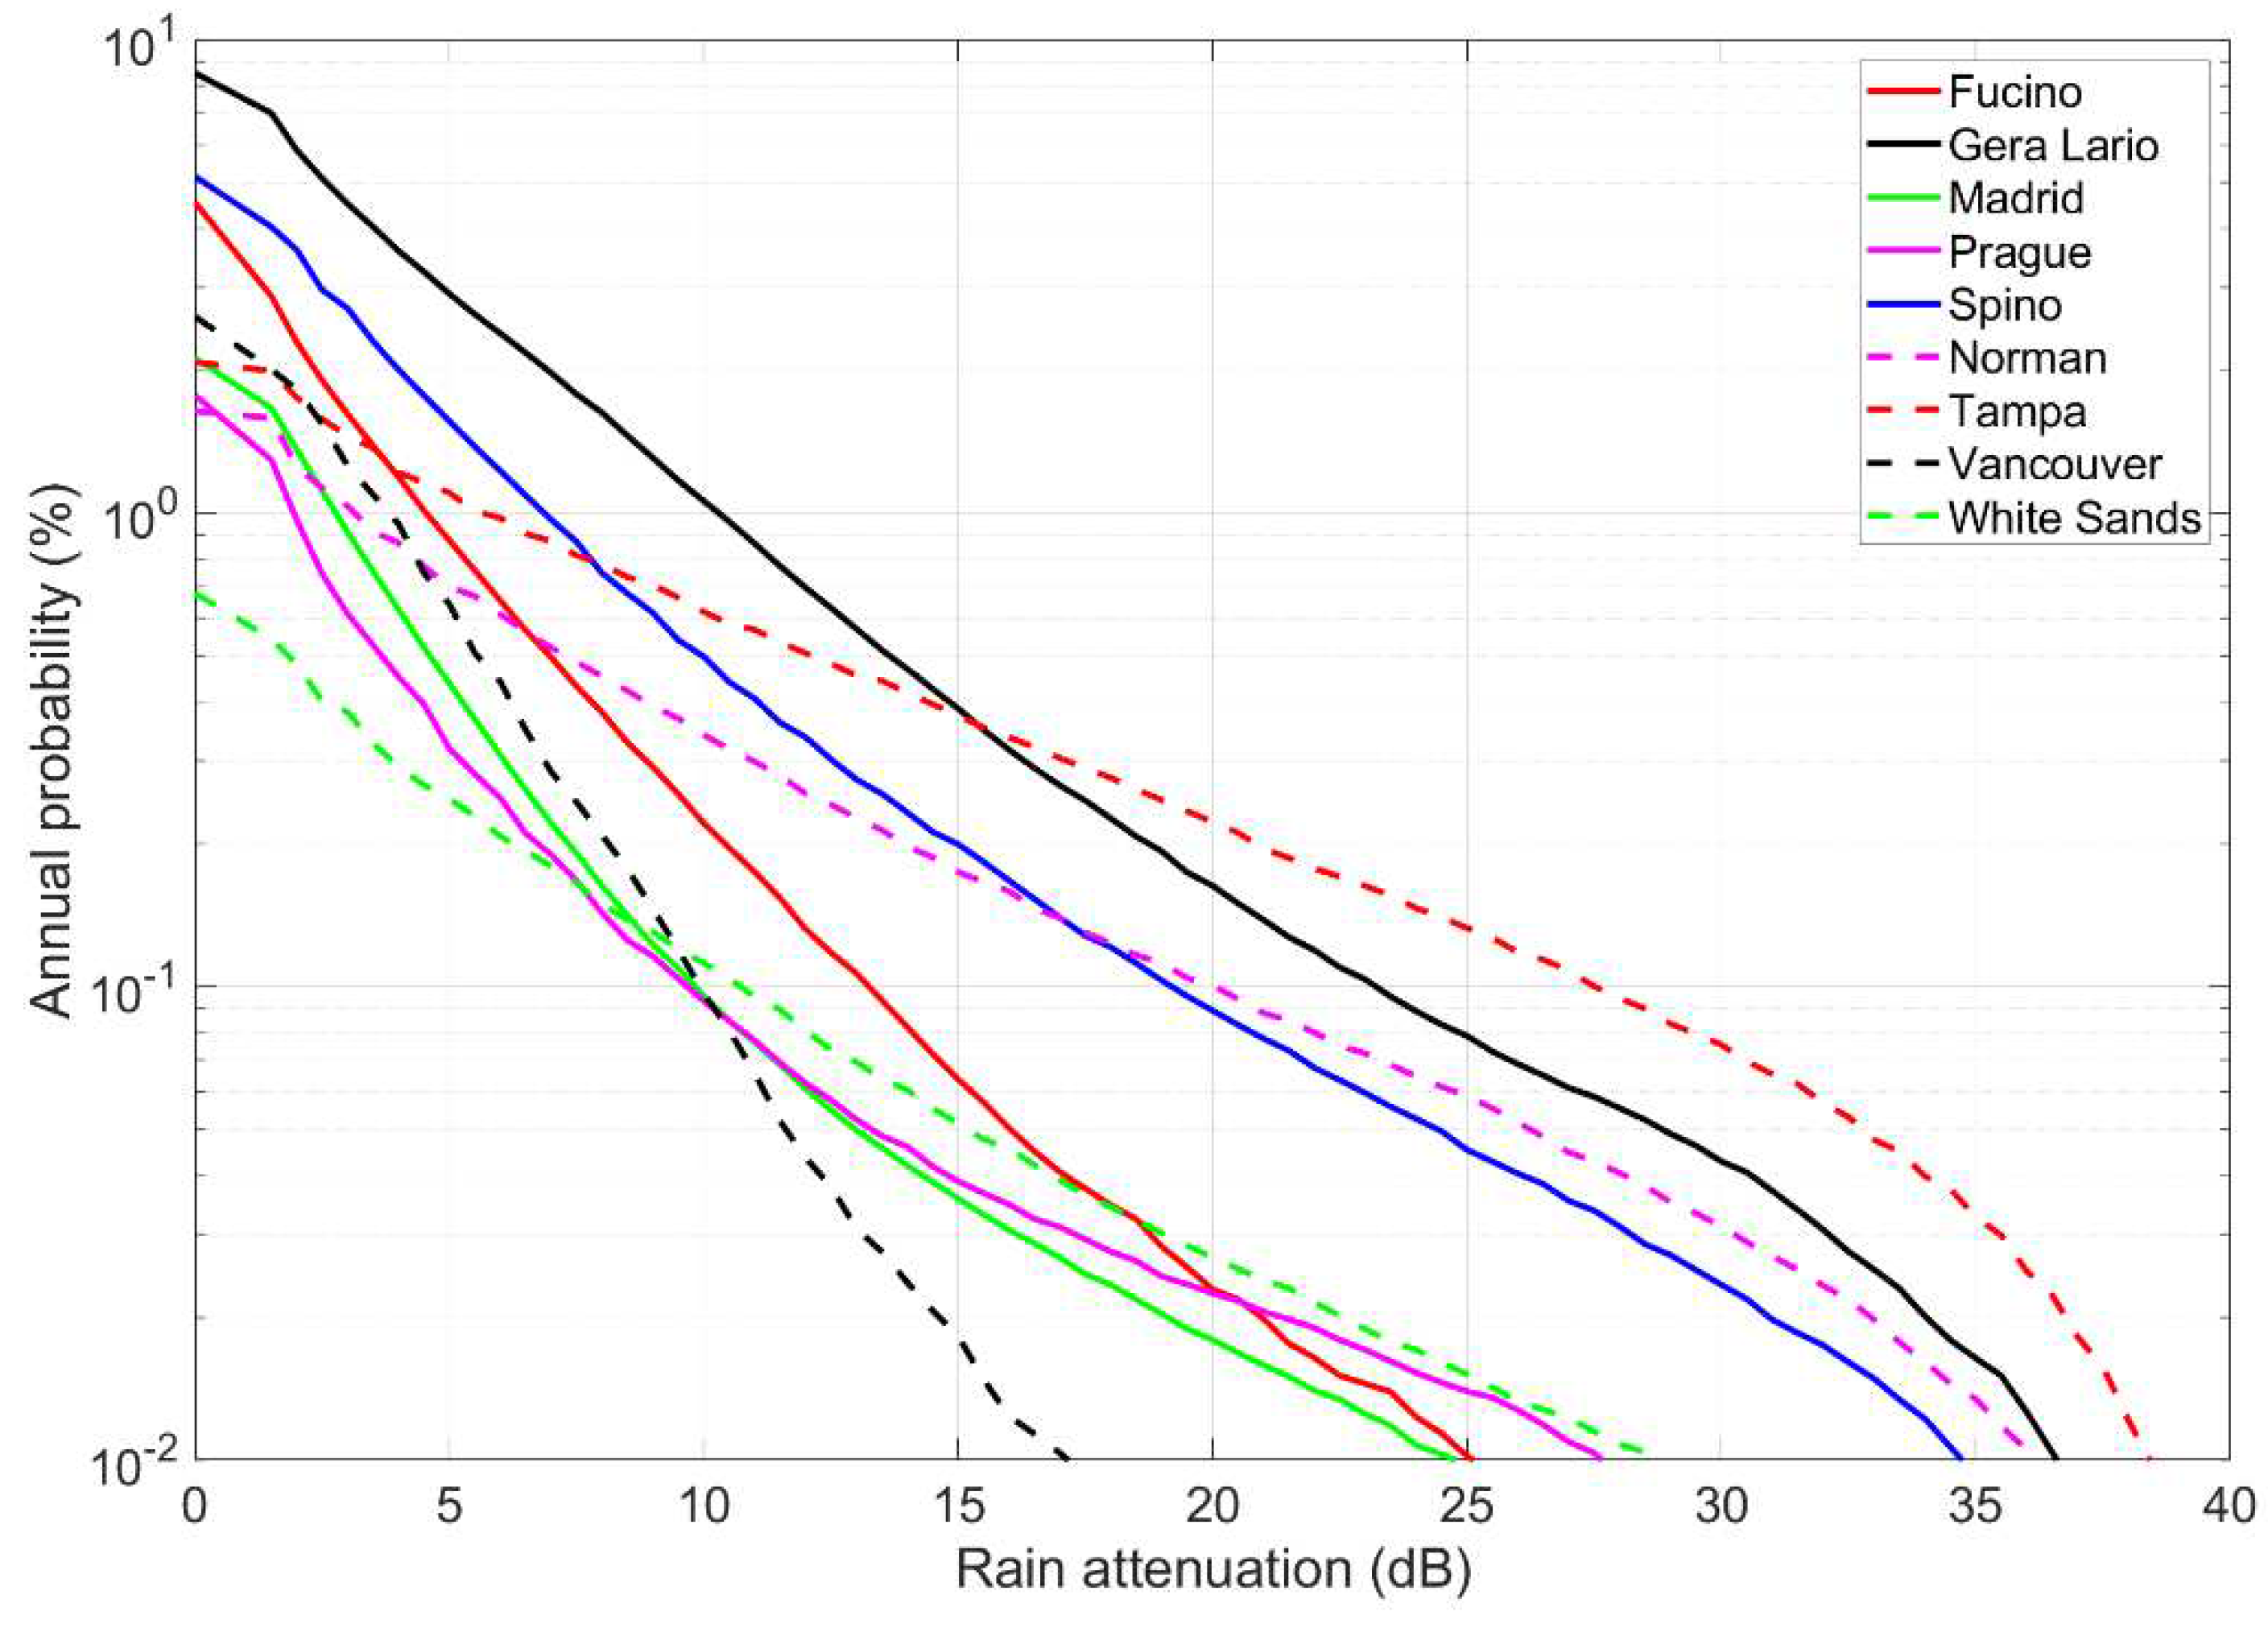
Figure 3 shows the average annual probability distribution
of exceeding
(dB) at 80 GHz, circular polarization, calculated with Equation (29) of Reference [
4]. The large differences found in
Figure 2 are substantially reiterated.
These probability distributions are, of course, the first information asked for by satellite communication designers because they indicate, for a given outage probability , the power margin necessary to maintain service continuity. For example, in the Spino d’Adda area (such as in Milan, 20 km away), if the rainfall outage probability tolerated by users of the GeoSurf satellite constellations is 0.01% of the time, then the minimum link power margin is 19 dB. In the Tampa area it is 27 dB.
The fade durations that add up to 0.01% of the time are, of course, made of many intervals whose impact on system design can be studied and assessed just according to and of the area, therefore in the next section we report these probabilities.
4. Fade Duration Experimental Results
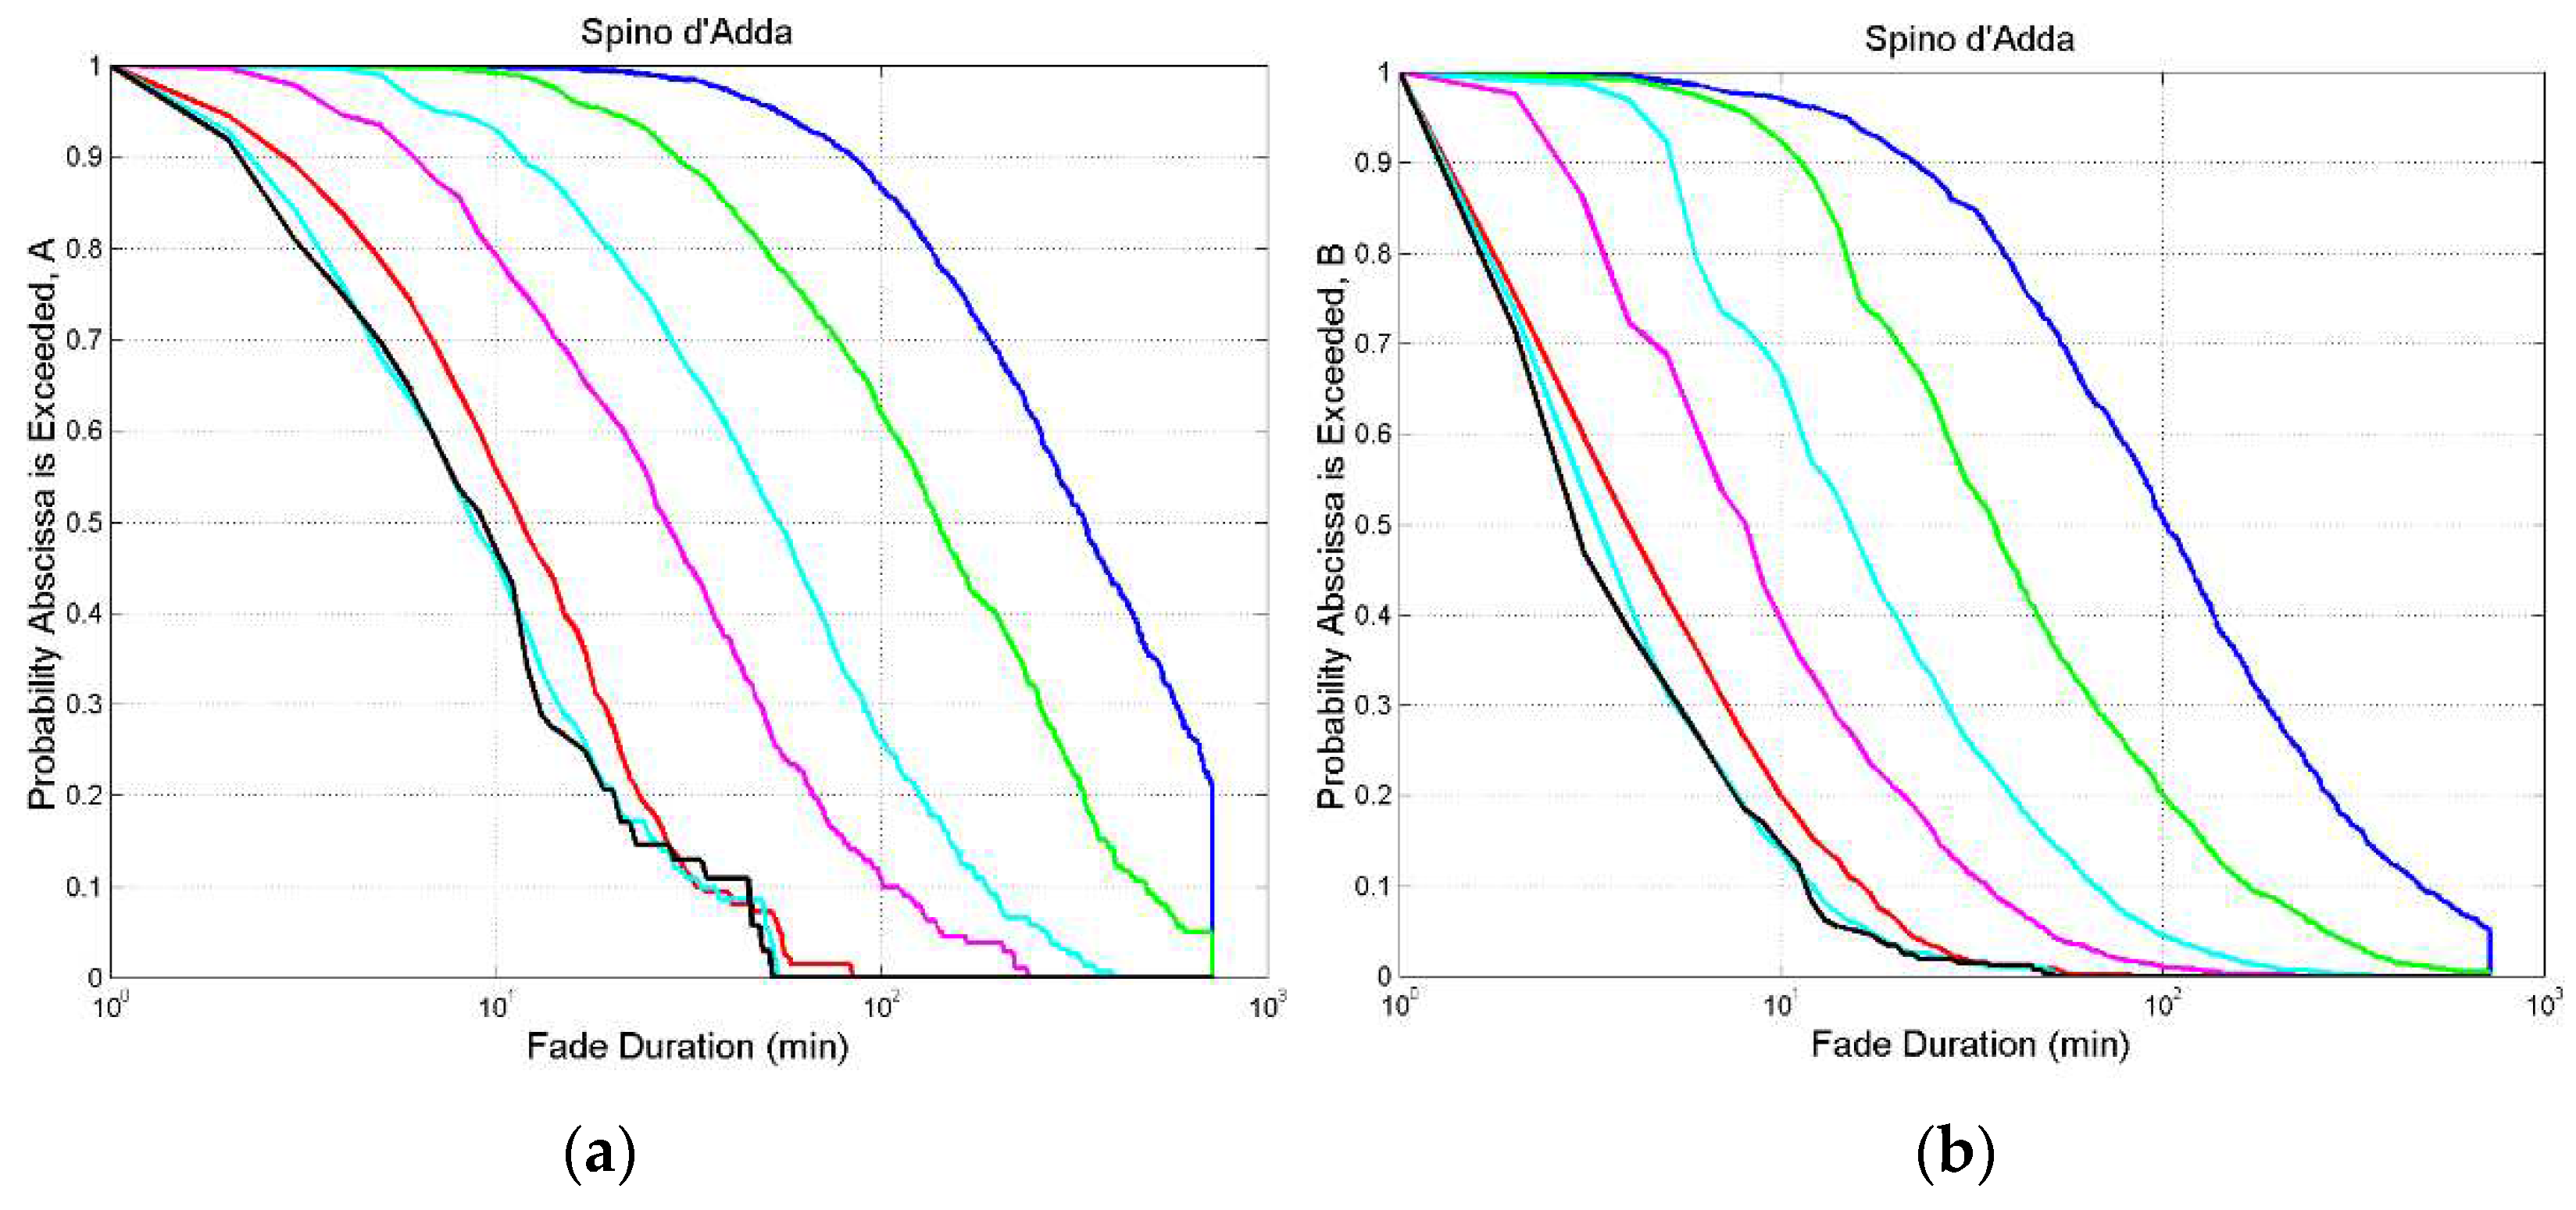
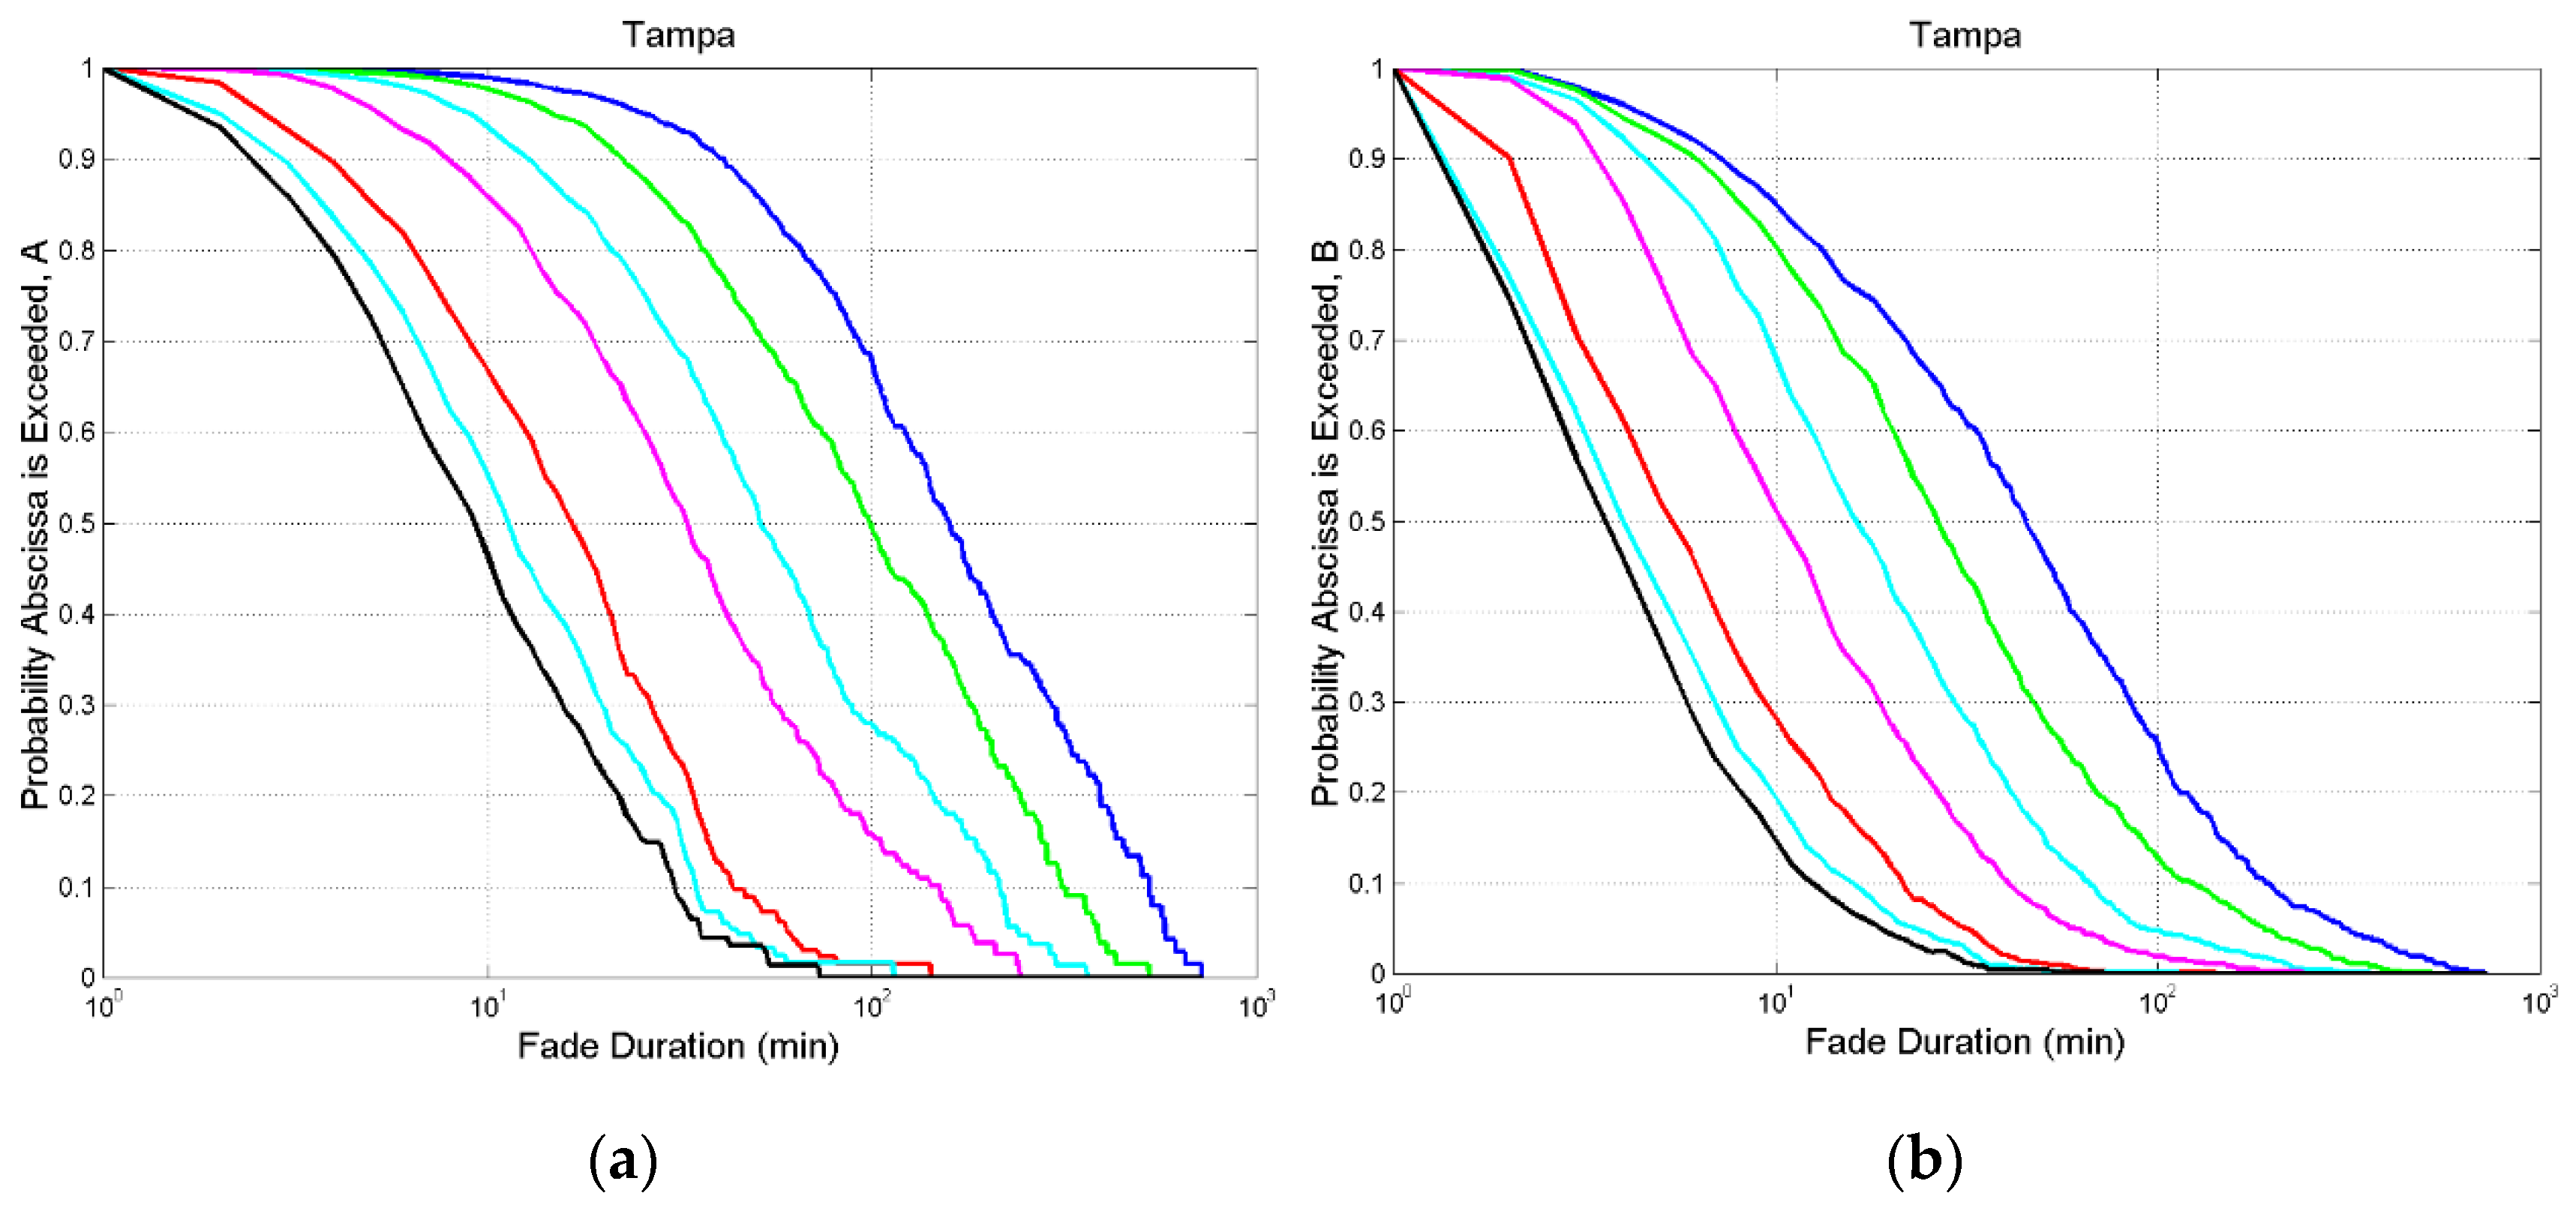
Figure 4 and
Figure 5 show
and
for some thresholds in the zenith paths at Spino d’Adda and Tampa.
min, the time resolution of
and
. For the other sites listed in
Table 1 their probability distributions are reported in
Appendix A. Notice that the blue line gives
and
for
dB, hence the probability distributions of rainfall intervals of the single rain events (thunderstorms, etc.).
As threshold increases, fade duration largely decreases, as physically expected.
A fade duration is exceed with very different probability at the different sites; or, at the same probability, is diverse.
The probability distributions tend to overlap at the largest thresholds. In other words, the same fade duration is substantially found also at higher thresholds, as shown in
Figure 1.
The two processes are, of course, not independent.
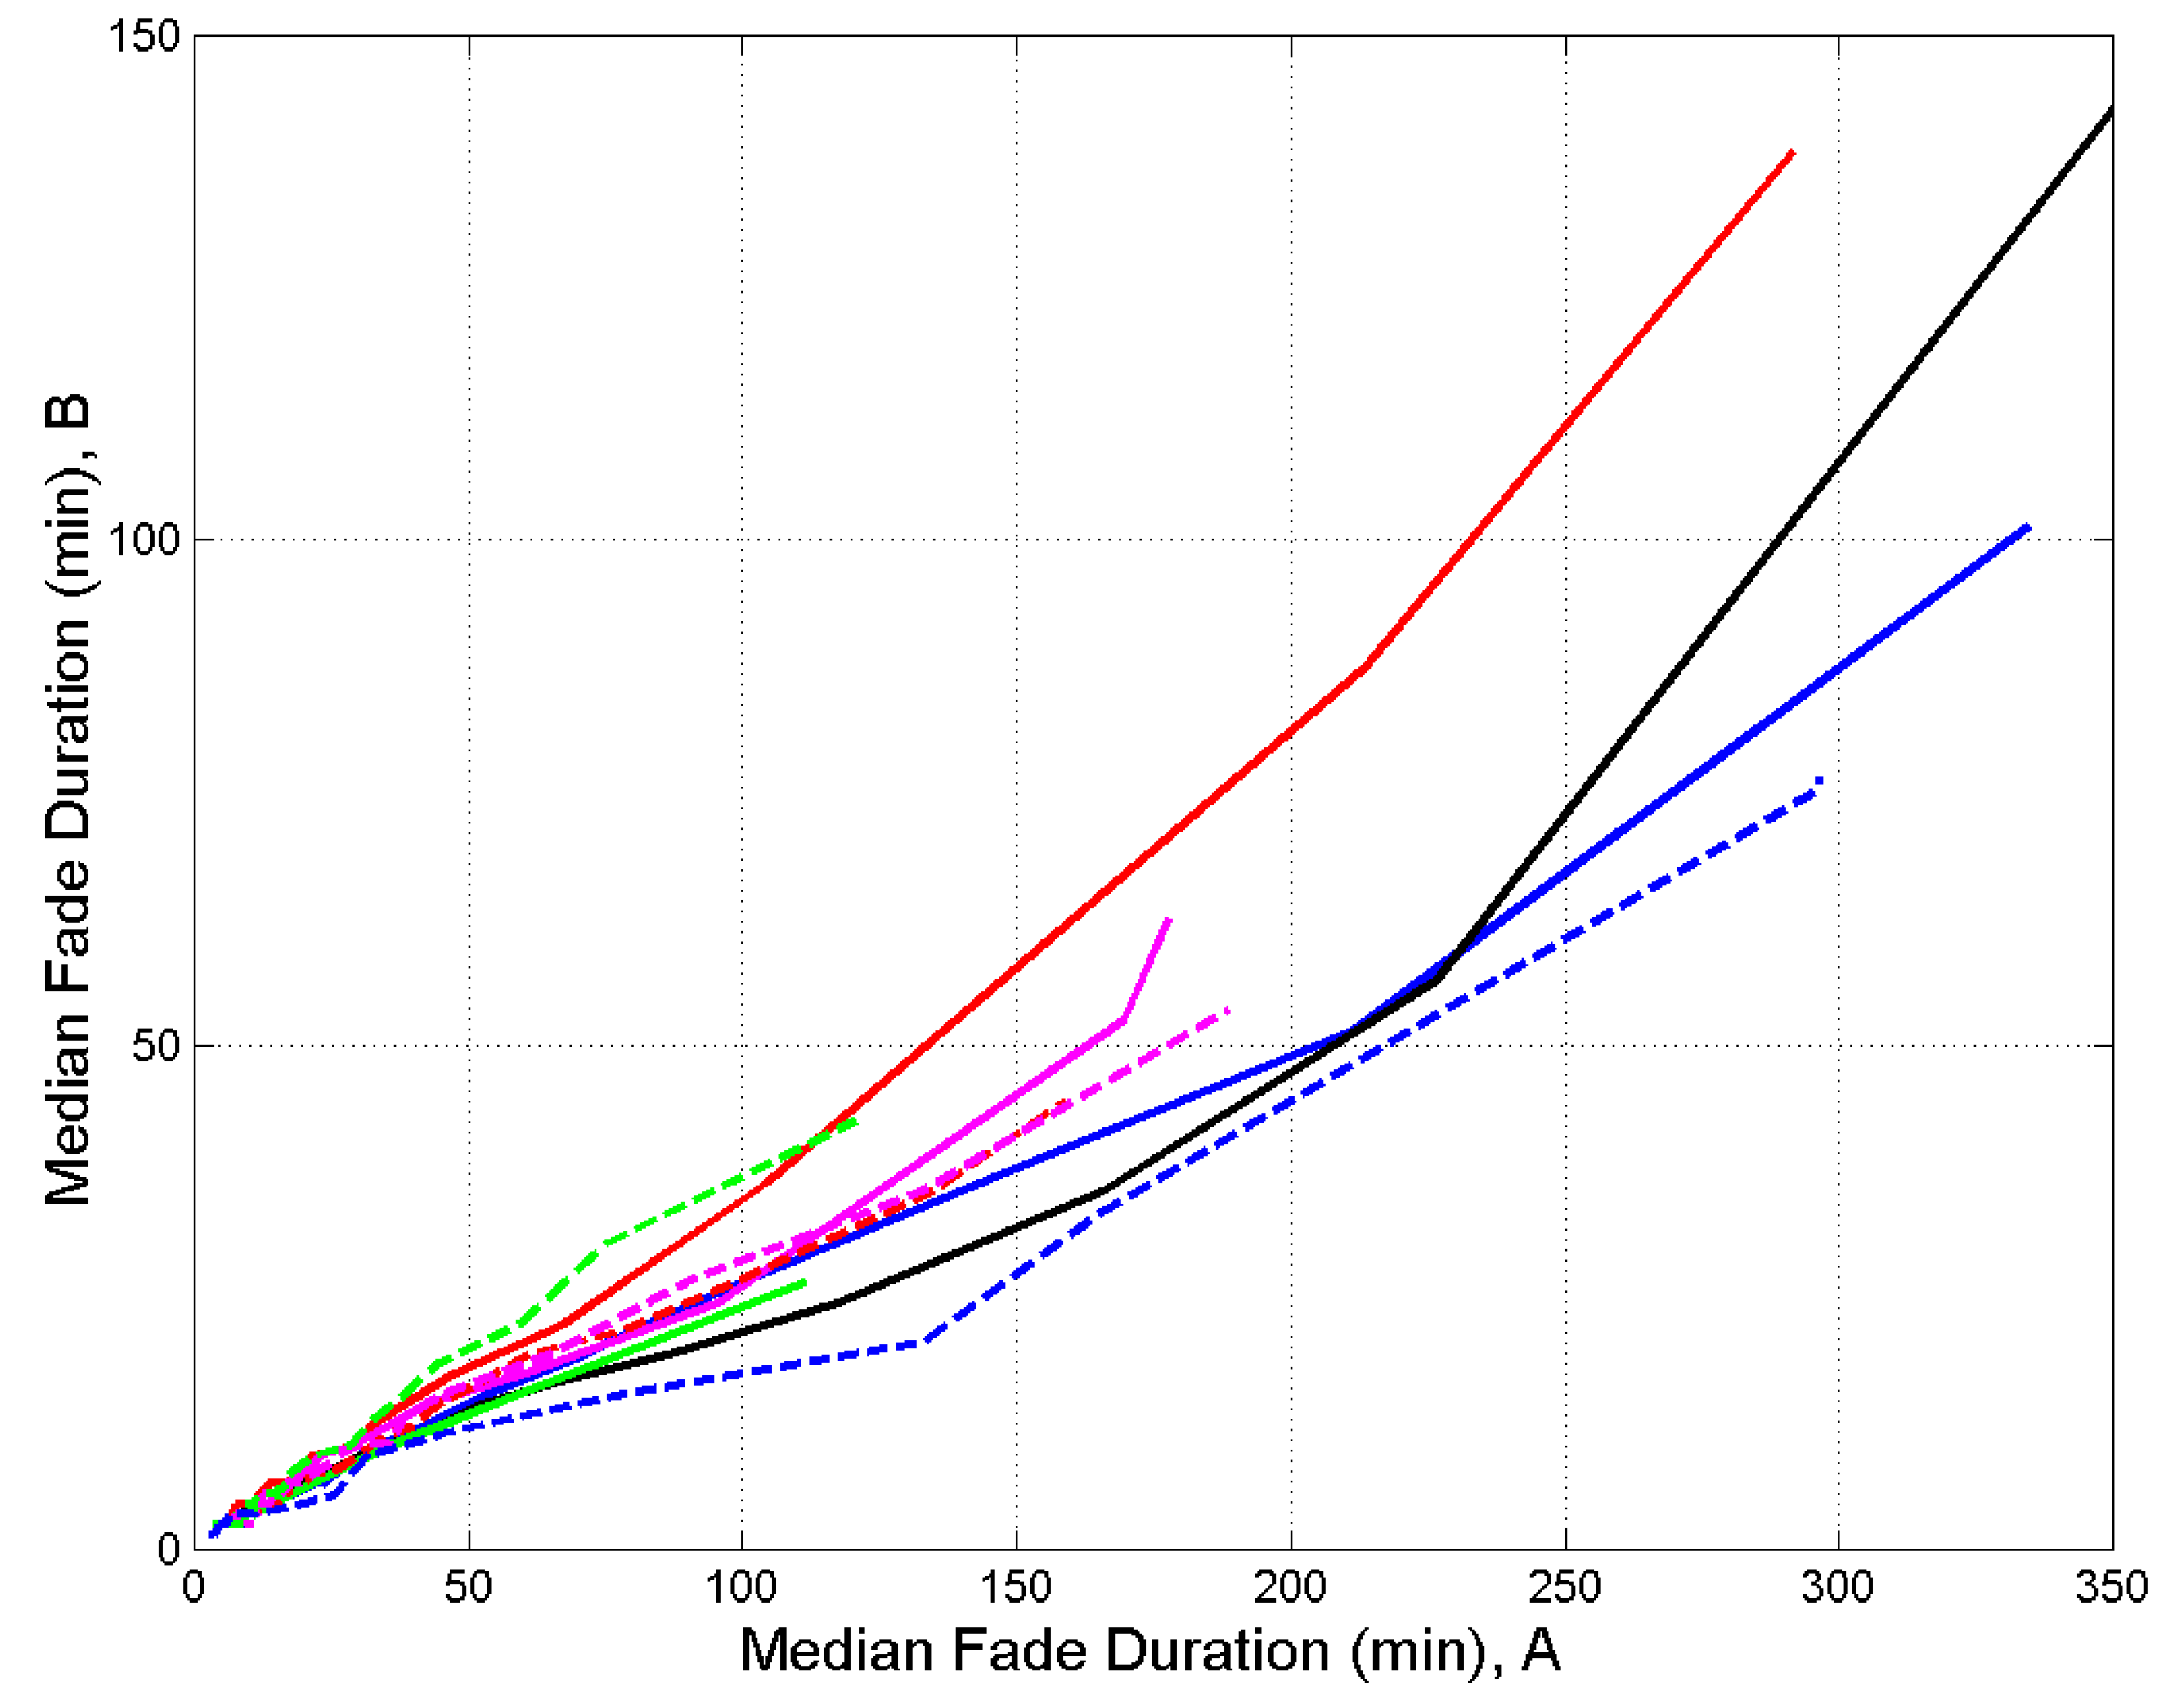
Figure 6 shows the median value – value exceeded with probability 0.5 – in process B,
(min), versus the median value in process A,
(min), for the same threshold, and all sites. Recall that the median value is a statistical parameter more useful than the mean value when a stochastic variable varies in a large range, as fade duration does. We can see that
, always.
Remember that
refers to the number of occurrences and
to the fraction of time. For example, in Spino d’Adda we find that when
min then
min, therefore, at a particular threshold (it is
dB,
Figure 4a, green line,), 50% of the outages are due to fade durations longer than 25 min, while 50% of the outage time is due to fade durations longer than 100 min, an event that occurs with probability 0.2 (
Figure 4b, green line).
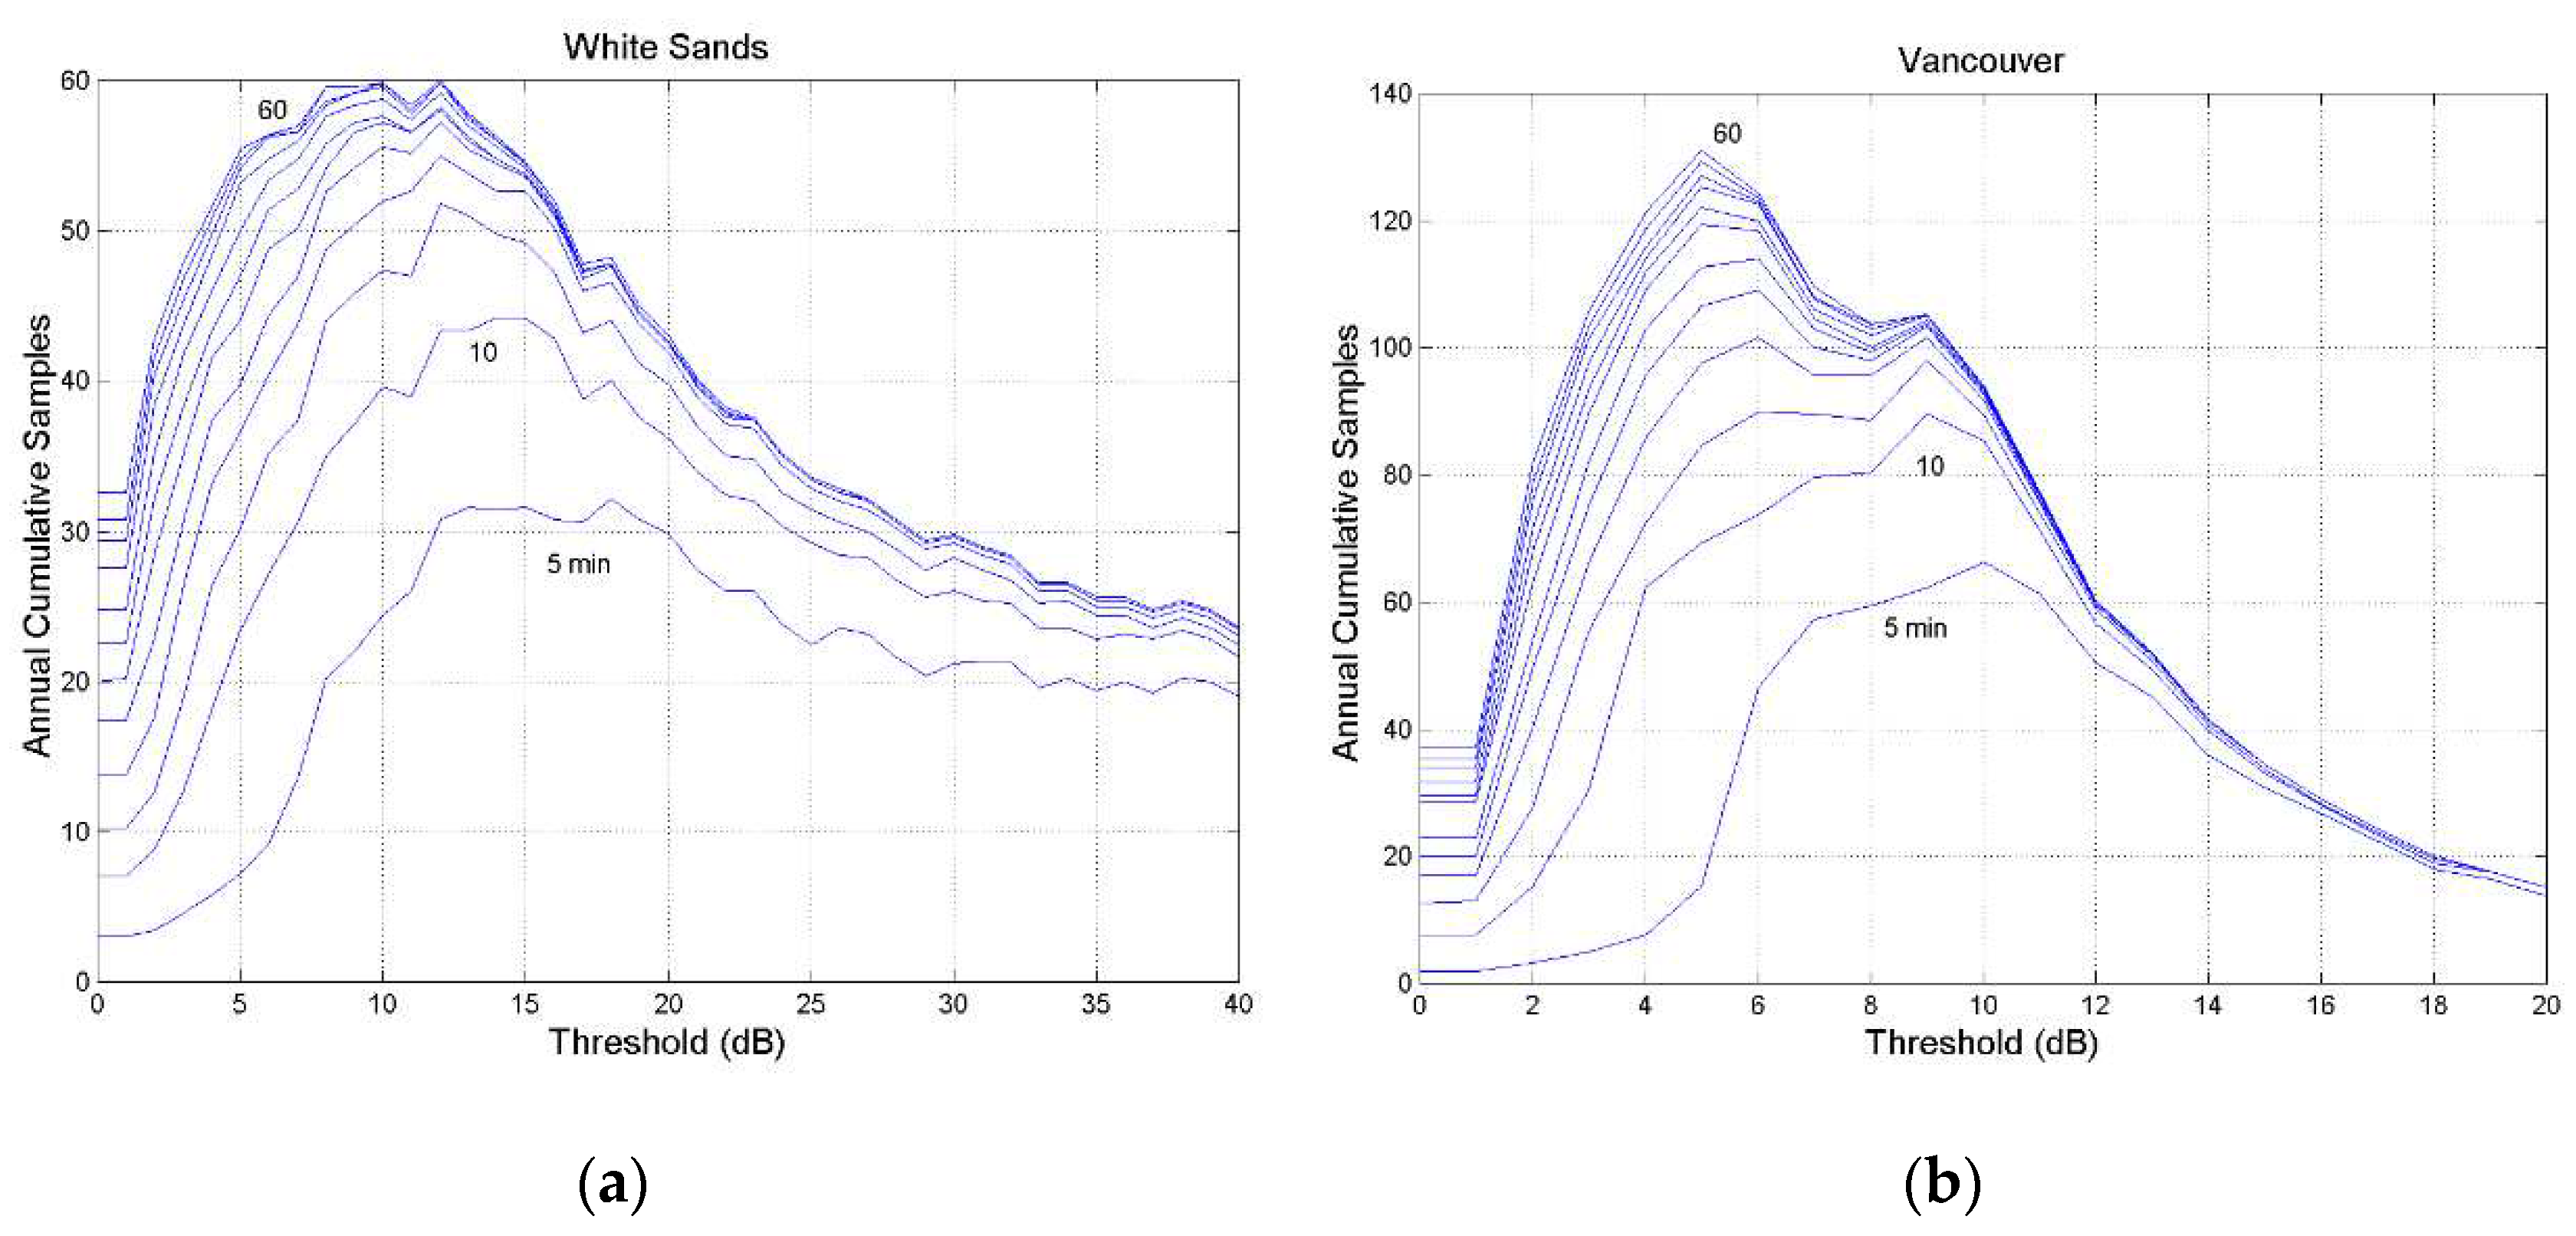
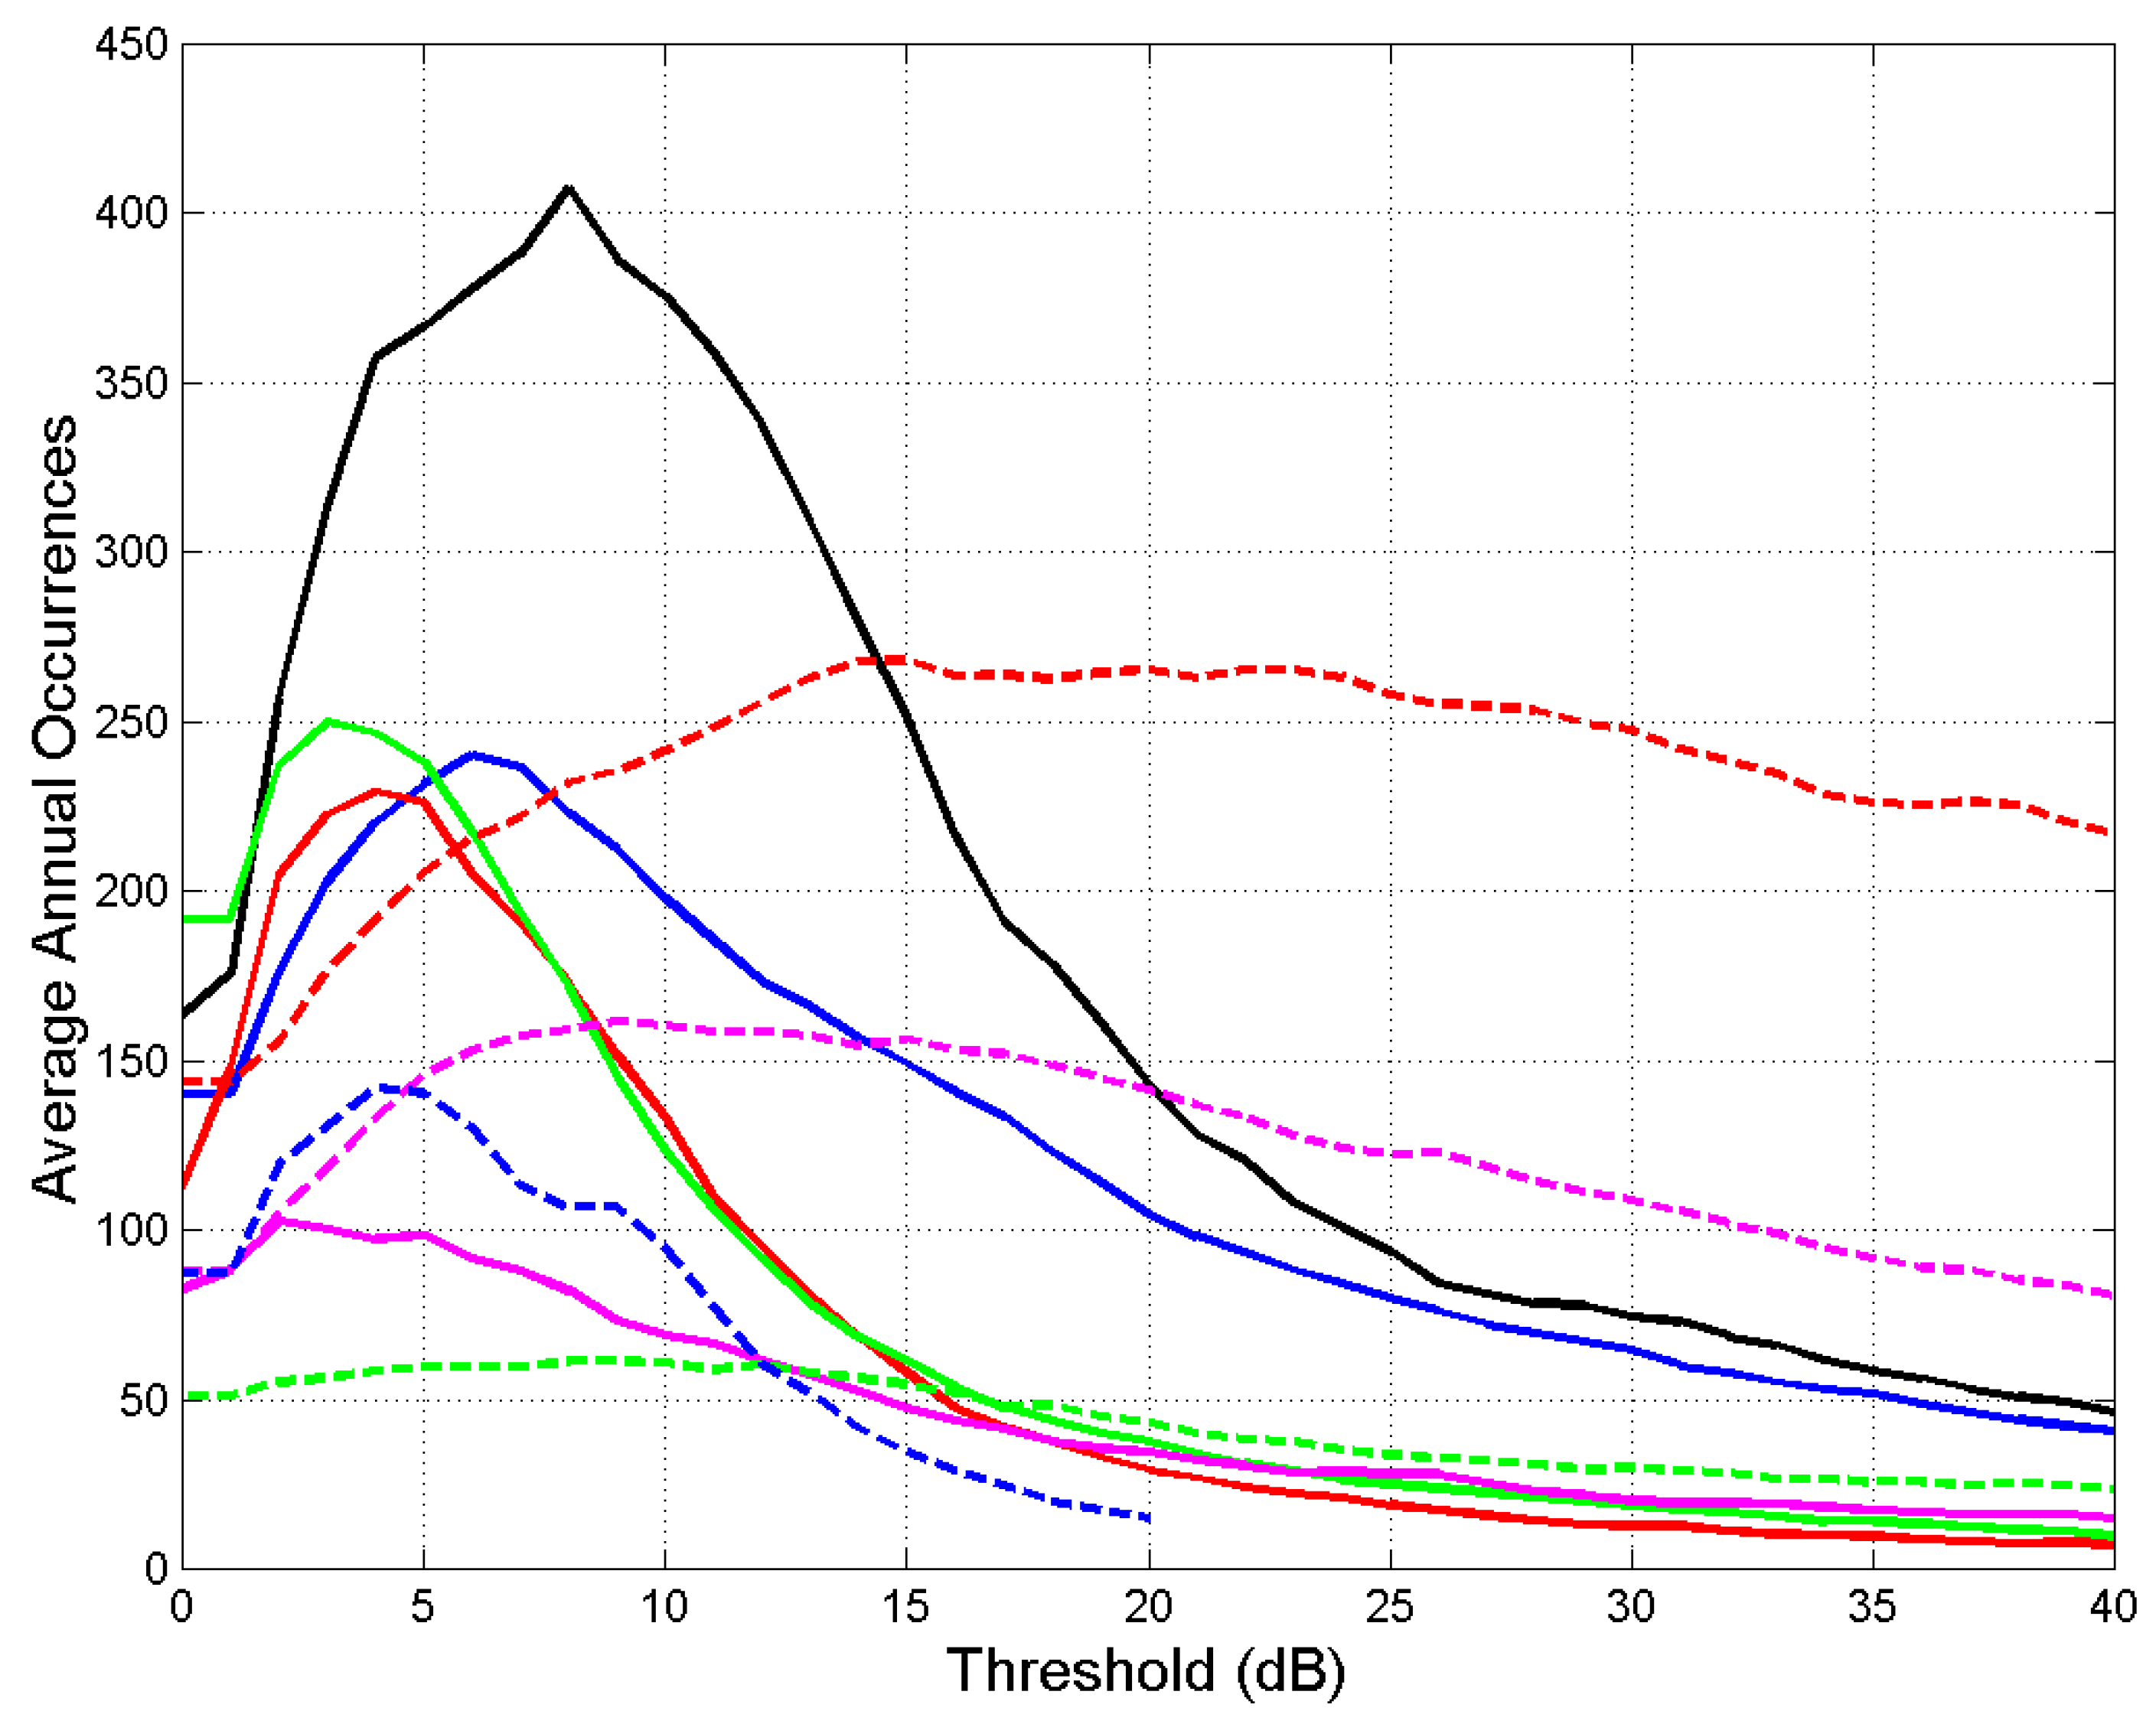
Figure 7 shows the average annual number of outage occurrences versus attenuation threshold. It is interesting to notice that peak values can be quite sharp, mostly below 10 dB, especially in Gera Lario. Tampa, Norman and White Sands show peaks less pronounced. These features are not directly obtainable from the
shown in
Figure 3, but only from the histograms giving
and
.
Notice the quite different behavior of Gera Lario, very likely due to the particular geographical location among high mountains at the Northern Lake Como, with more frequent rain events than at Spino d’Adda, just 84 km away.
Also of interest is the cumulative number of occurrences versus threshold
at equal fade duration exceeded, i.e. the actual cumulative number of occurrences which yield
.
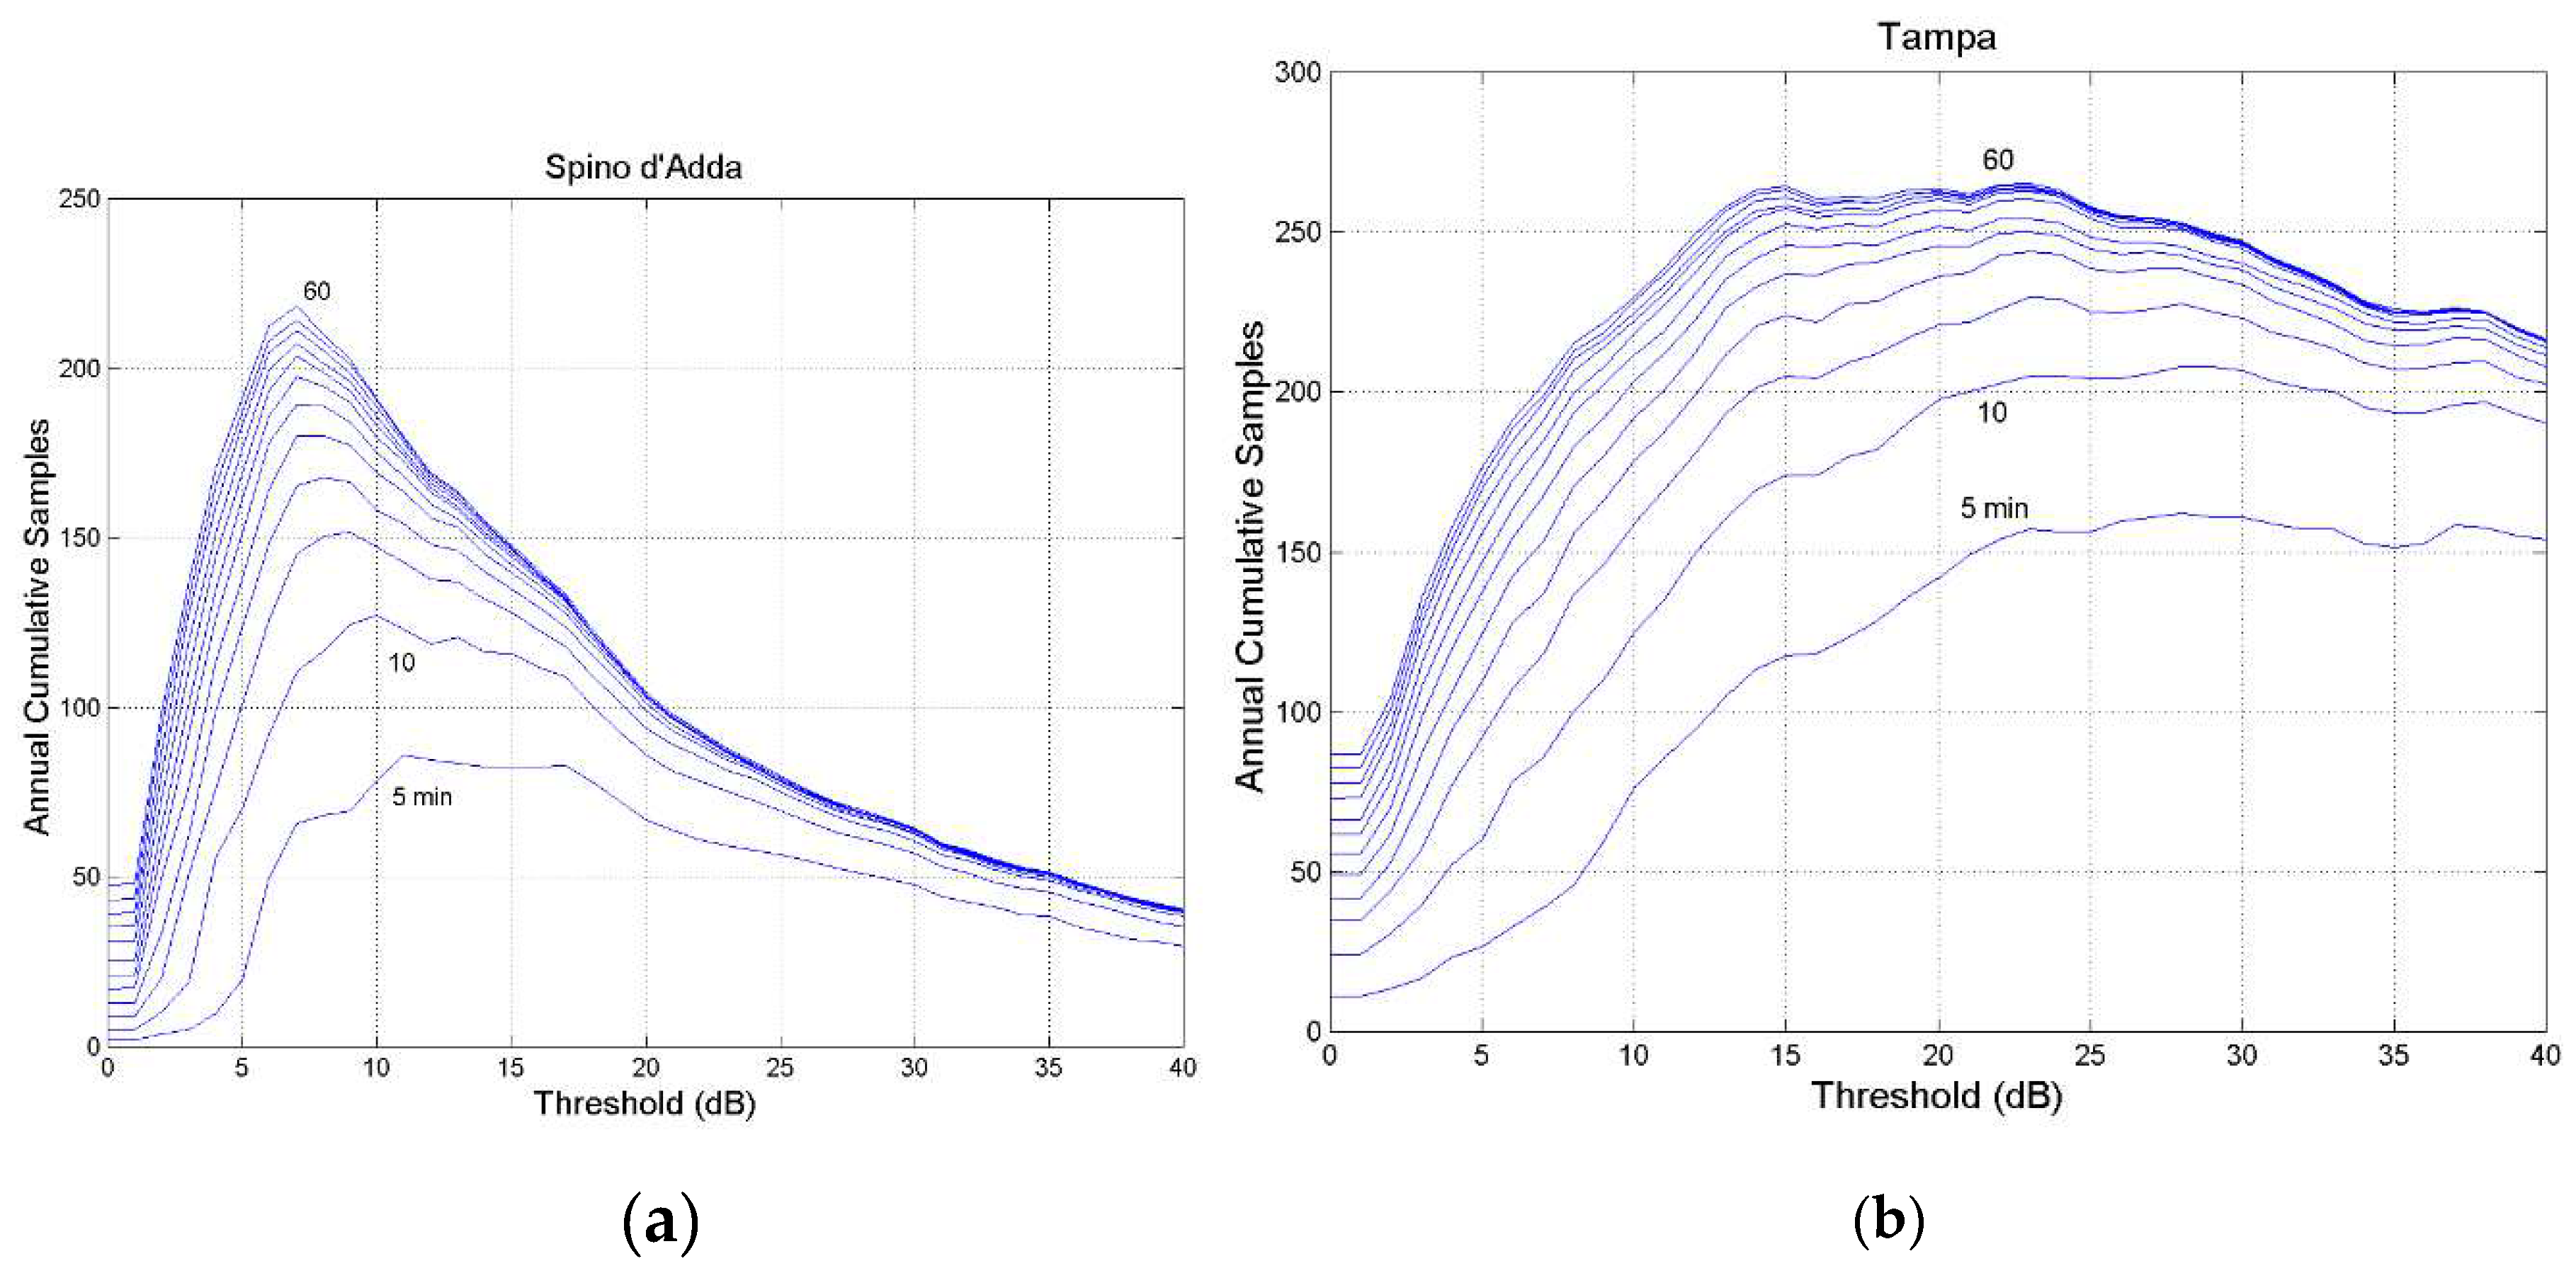
Figure 8 shows these curves, in 5–min steps, for Spino d’Adda and Tampa, while
Appendix B reports the data of the other sites.
-
a)
As threshold increases, the occurrences largely decrease for any , as physically expected.
-
b)
As fade duration D increases, sharp peaks are clearly evident in many sites.
-
c)
Peaks tend to occur at lower thresholds.
-
d)
-
As fade duration D increases curves tend to collapse, in agreement with the probability
shown in
Figure 4a and
Figure 5b. For example, the curves regarding 𝐷 = 50~60 min tend to coincide.
As we have previously recalled, the two processes are not independent and this fact can be assessed by studying versus as we show in the next section by defining a useful parameter, the uniformity index.
5. Processes A and B Interdependence
To show that the two processes are not independent, let us study the relationship between
and
, at equal
, i.e. the function
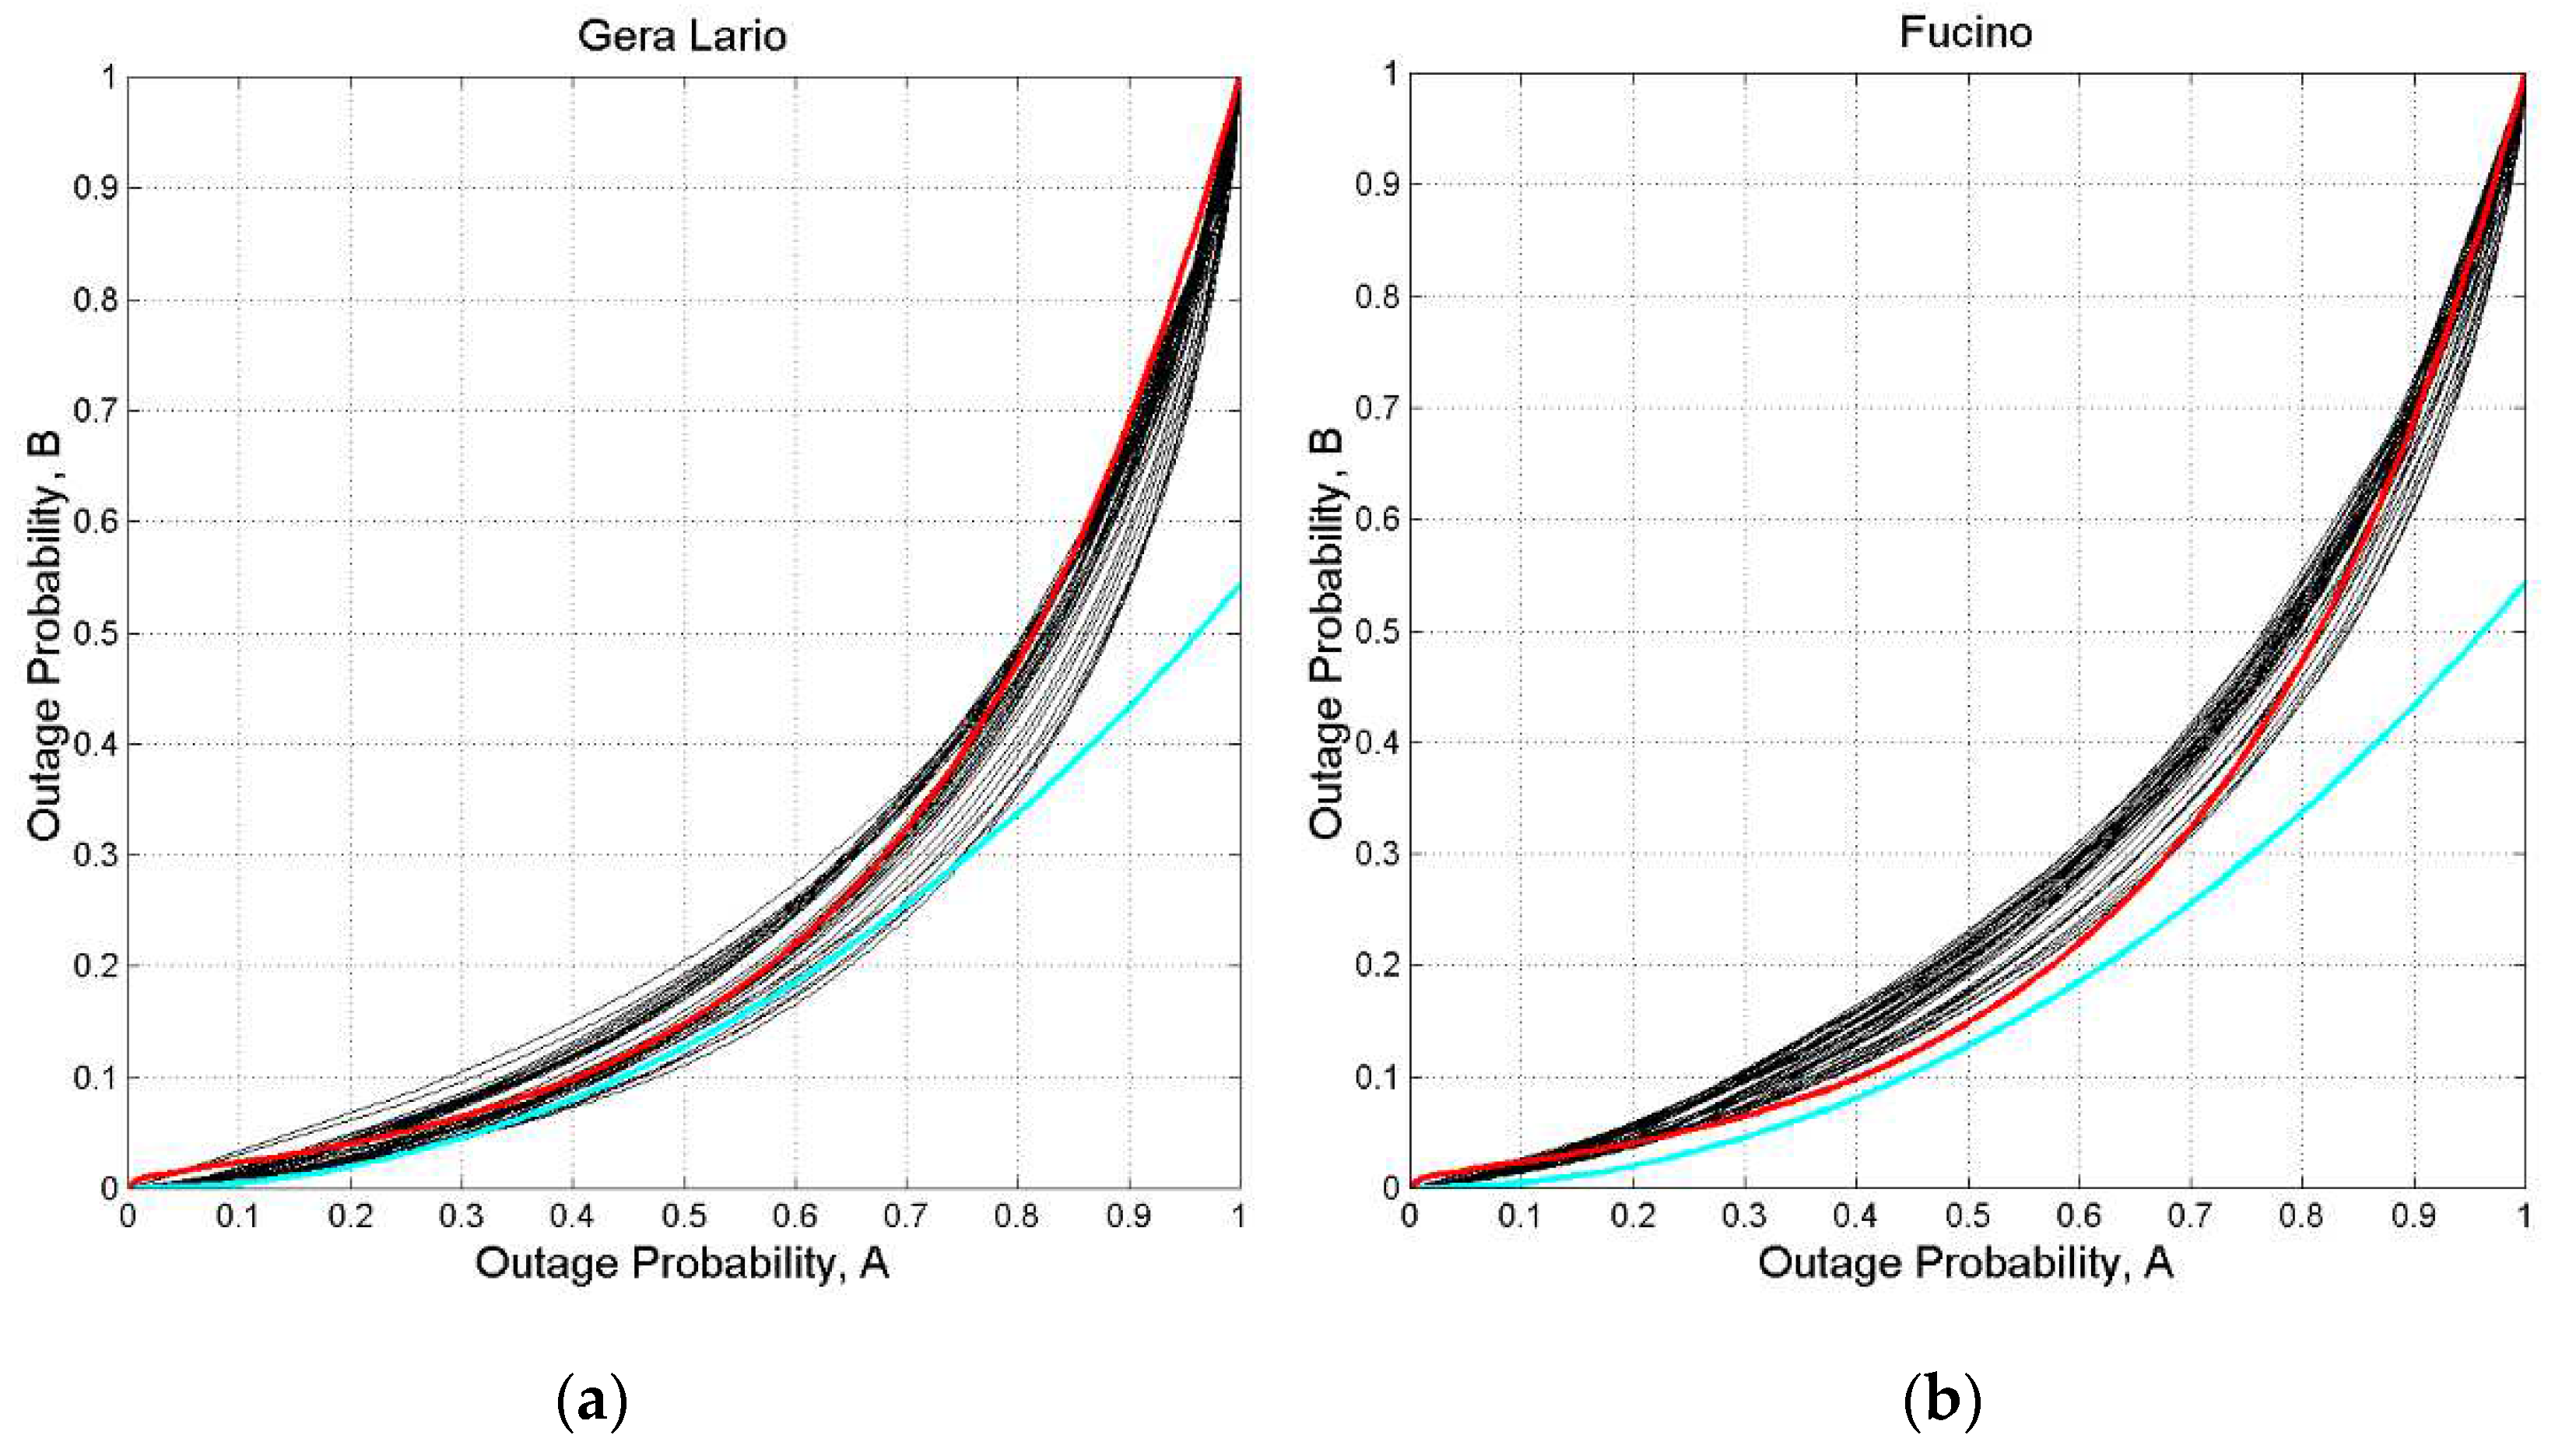
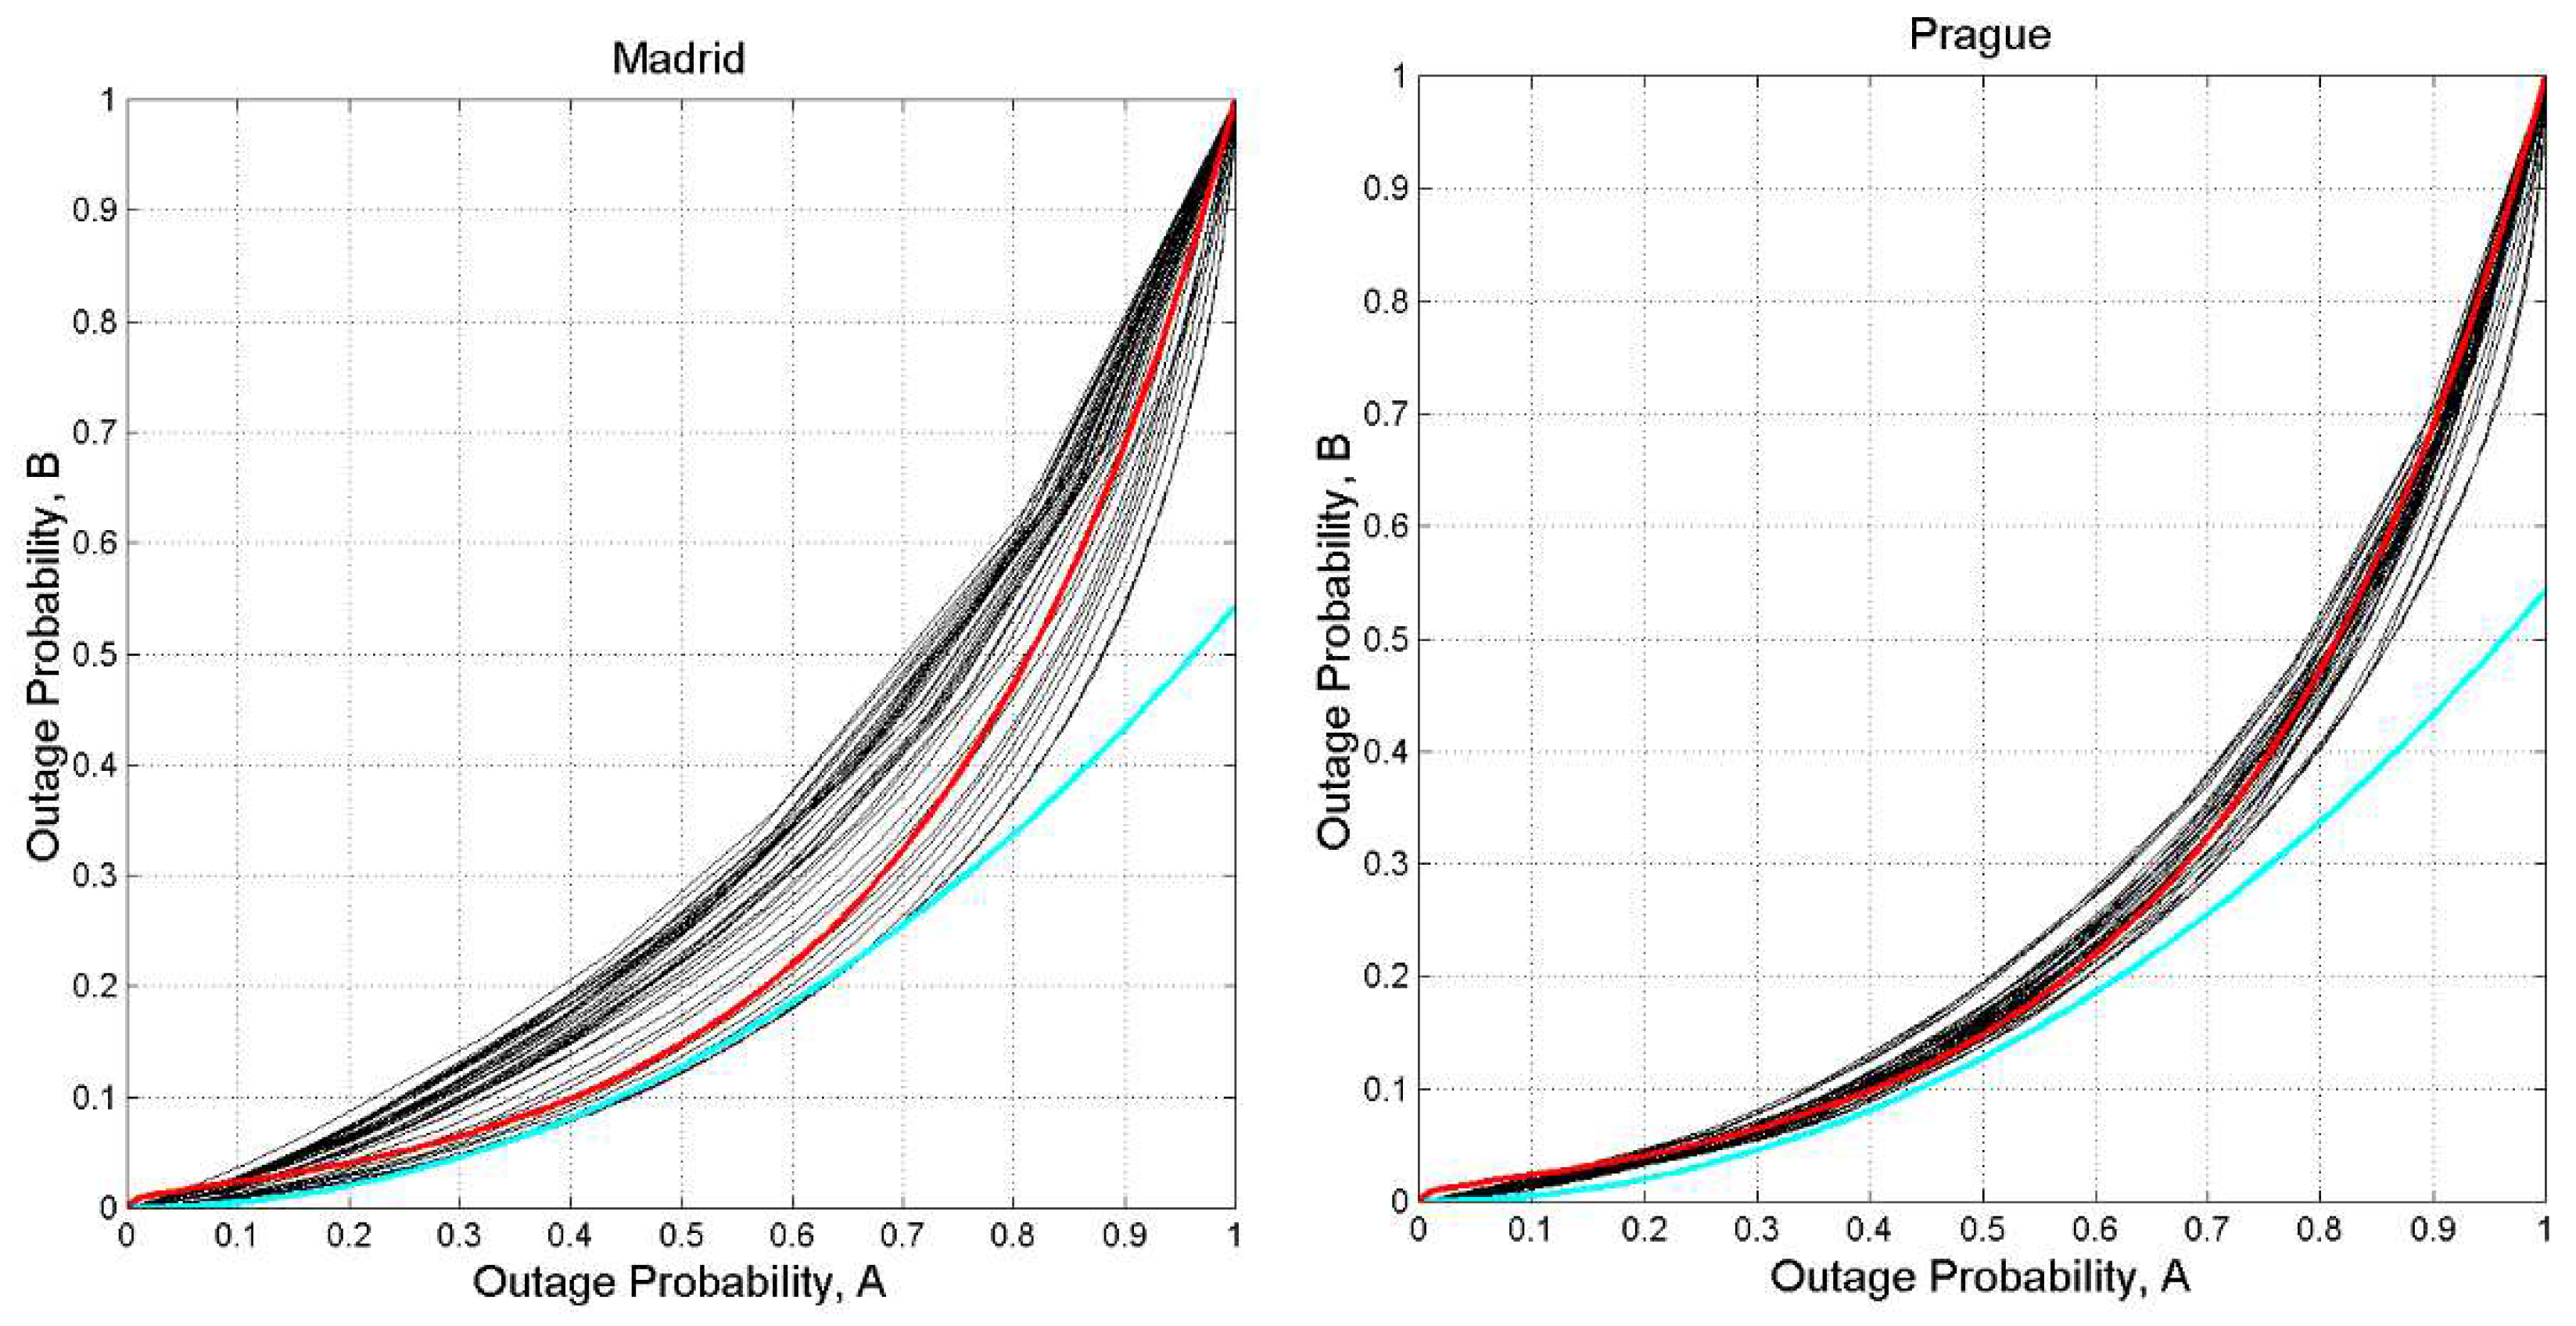
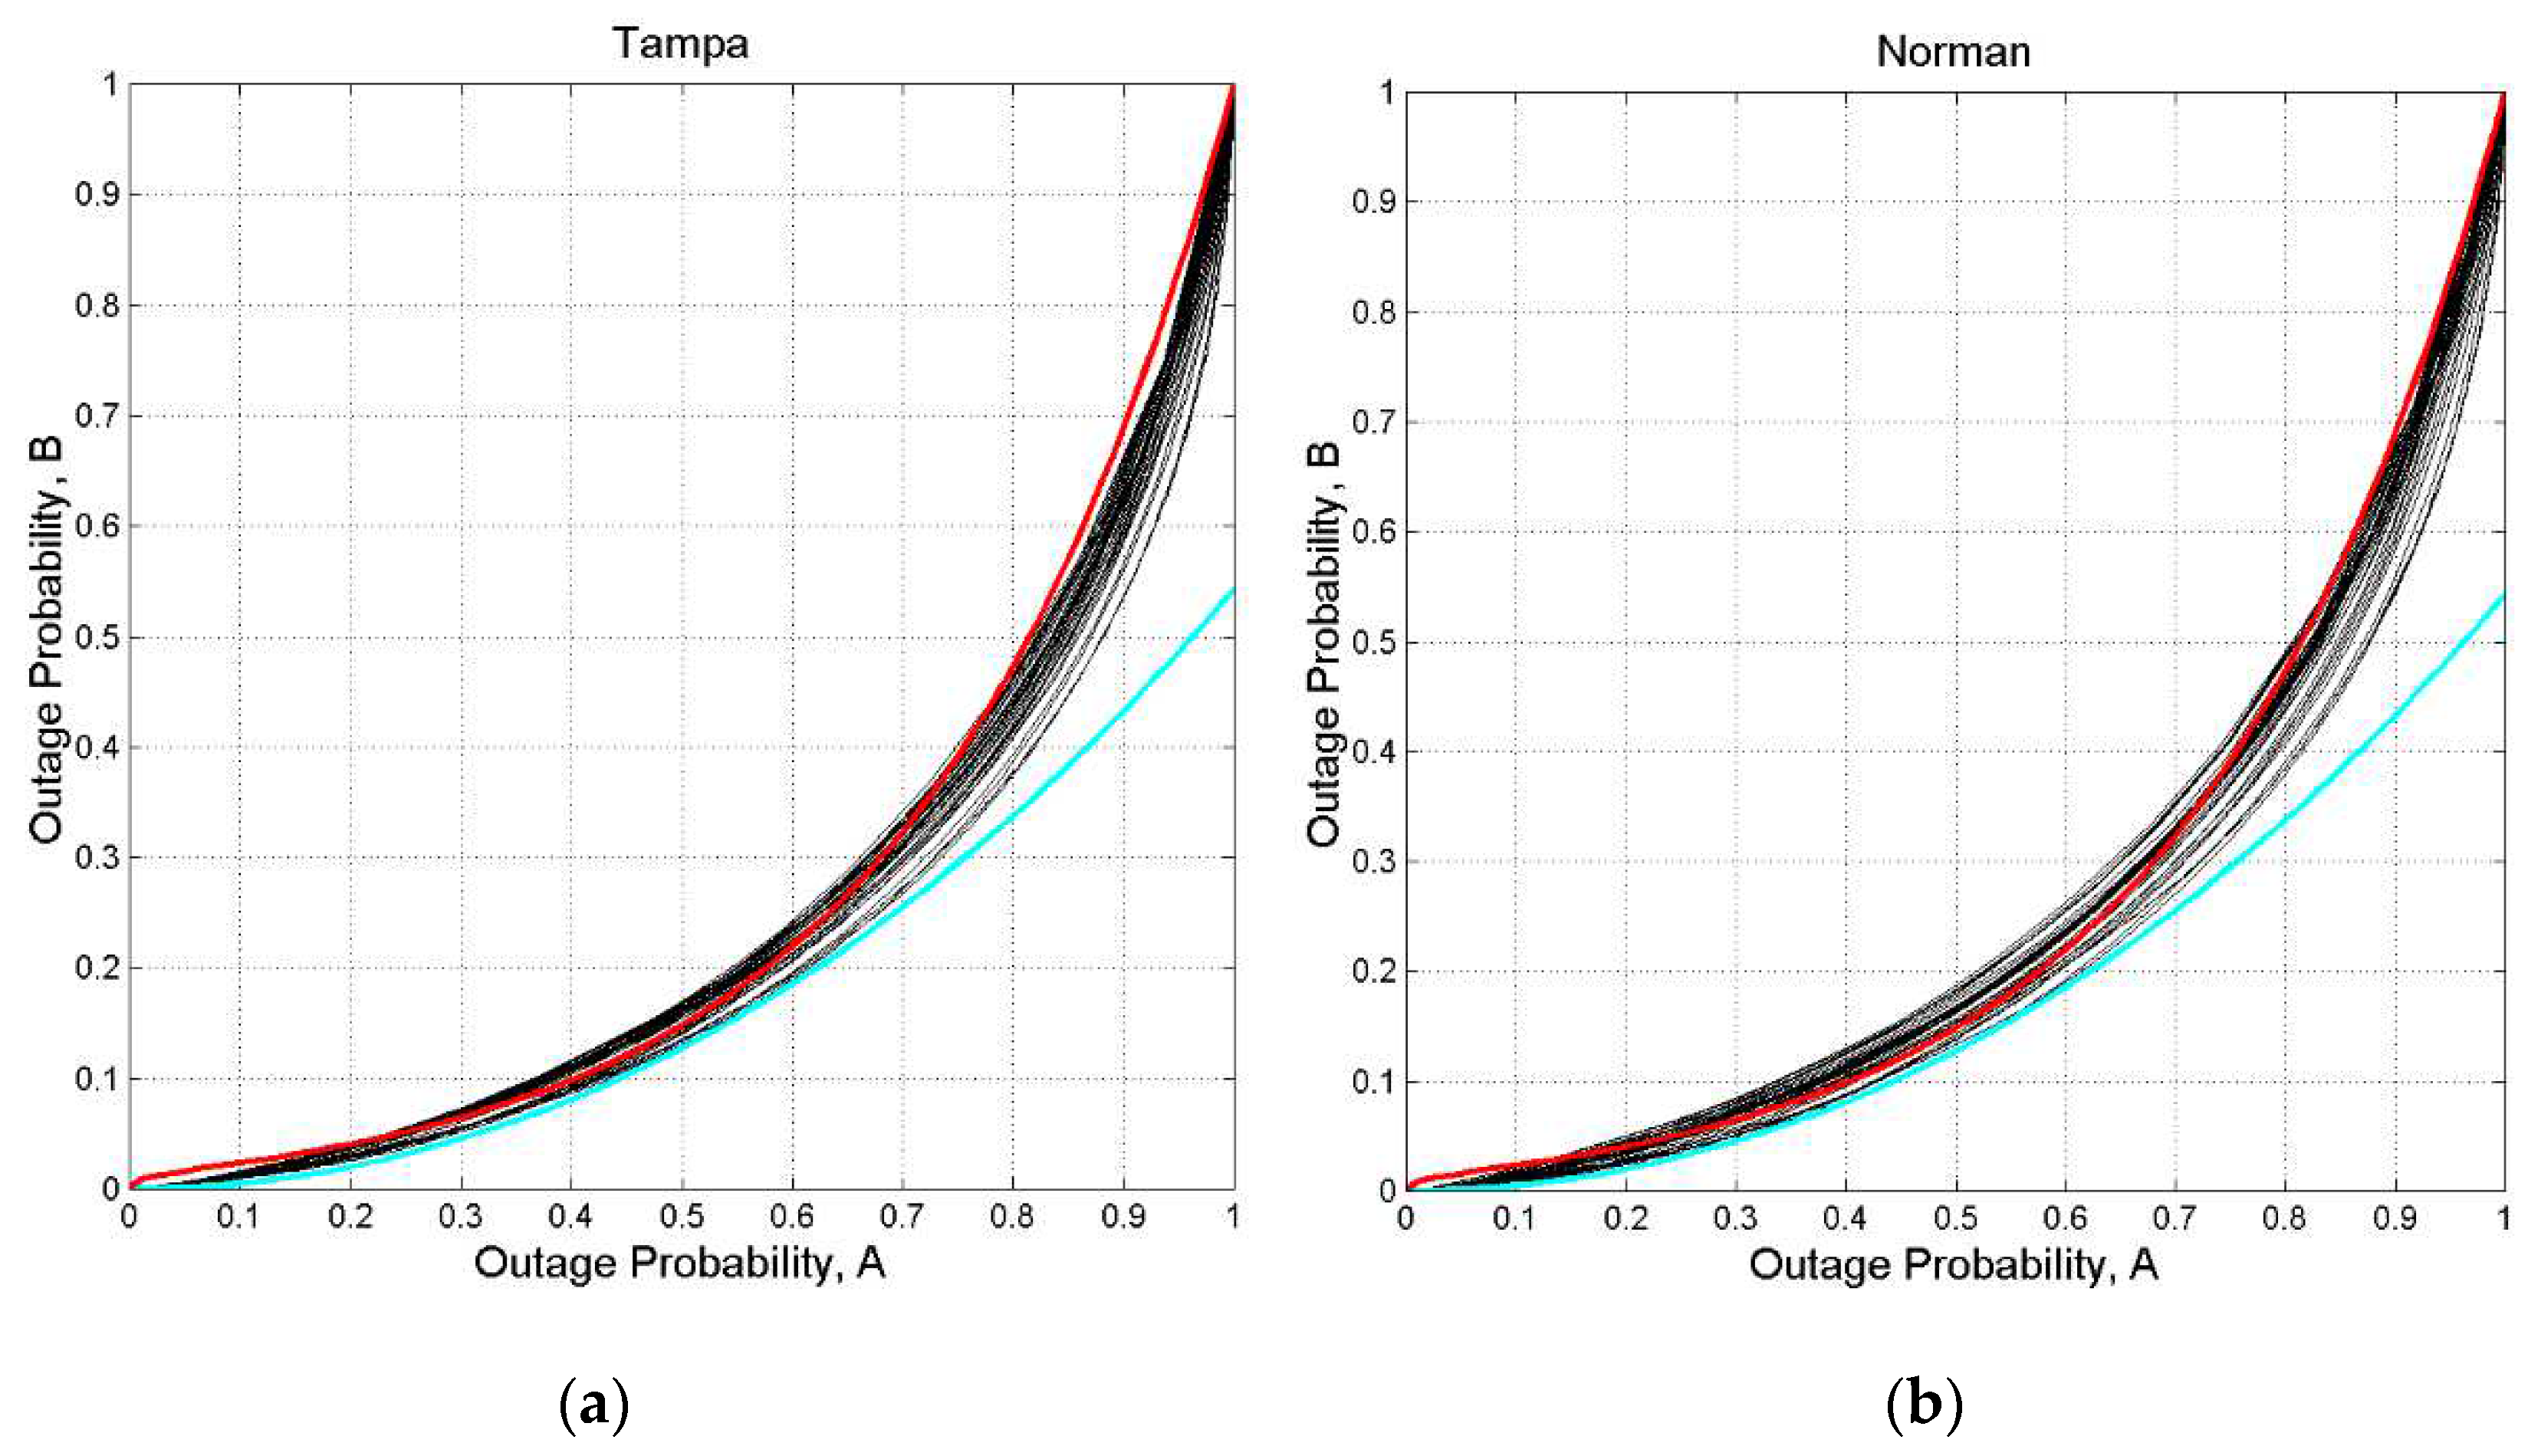
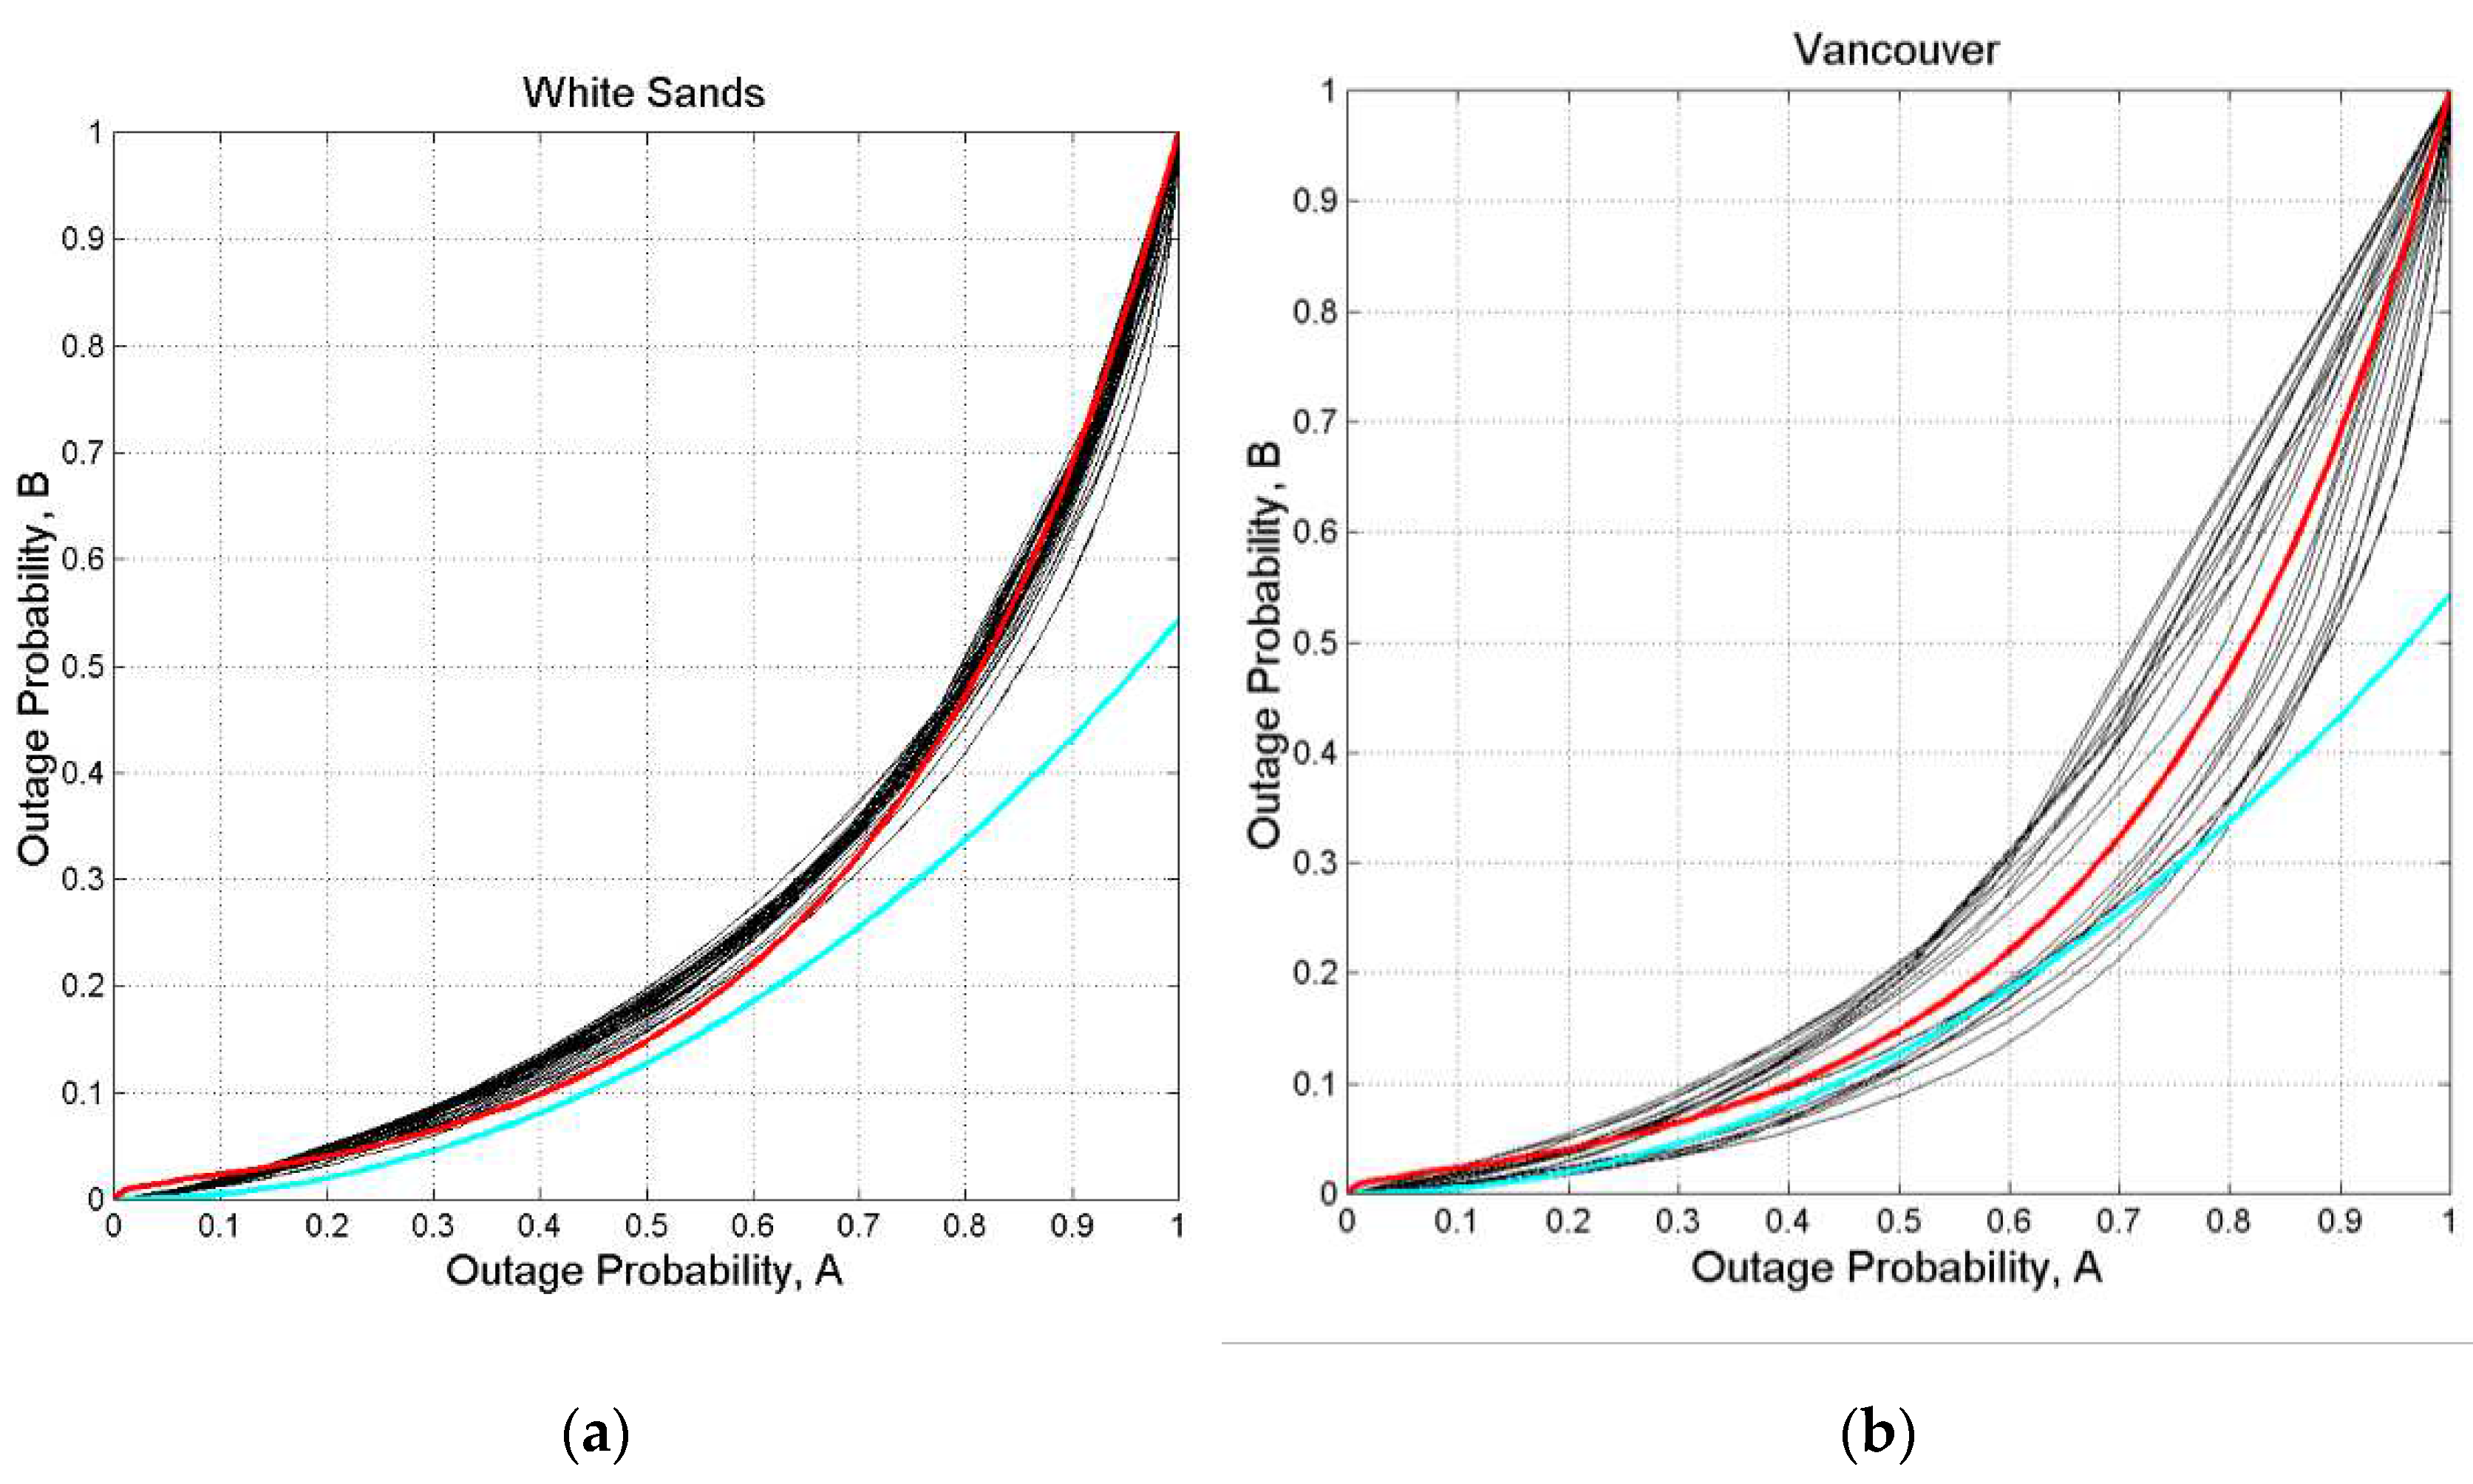
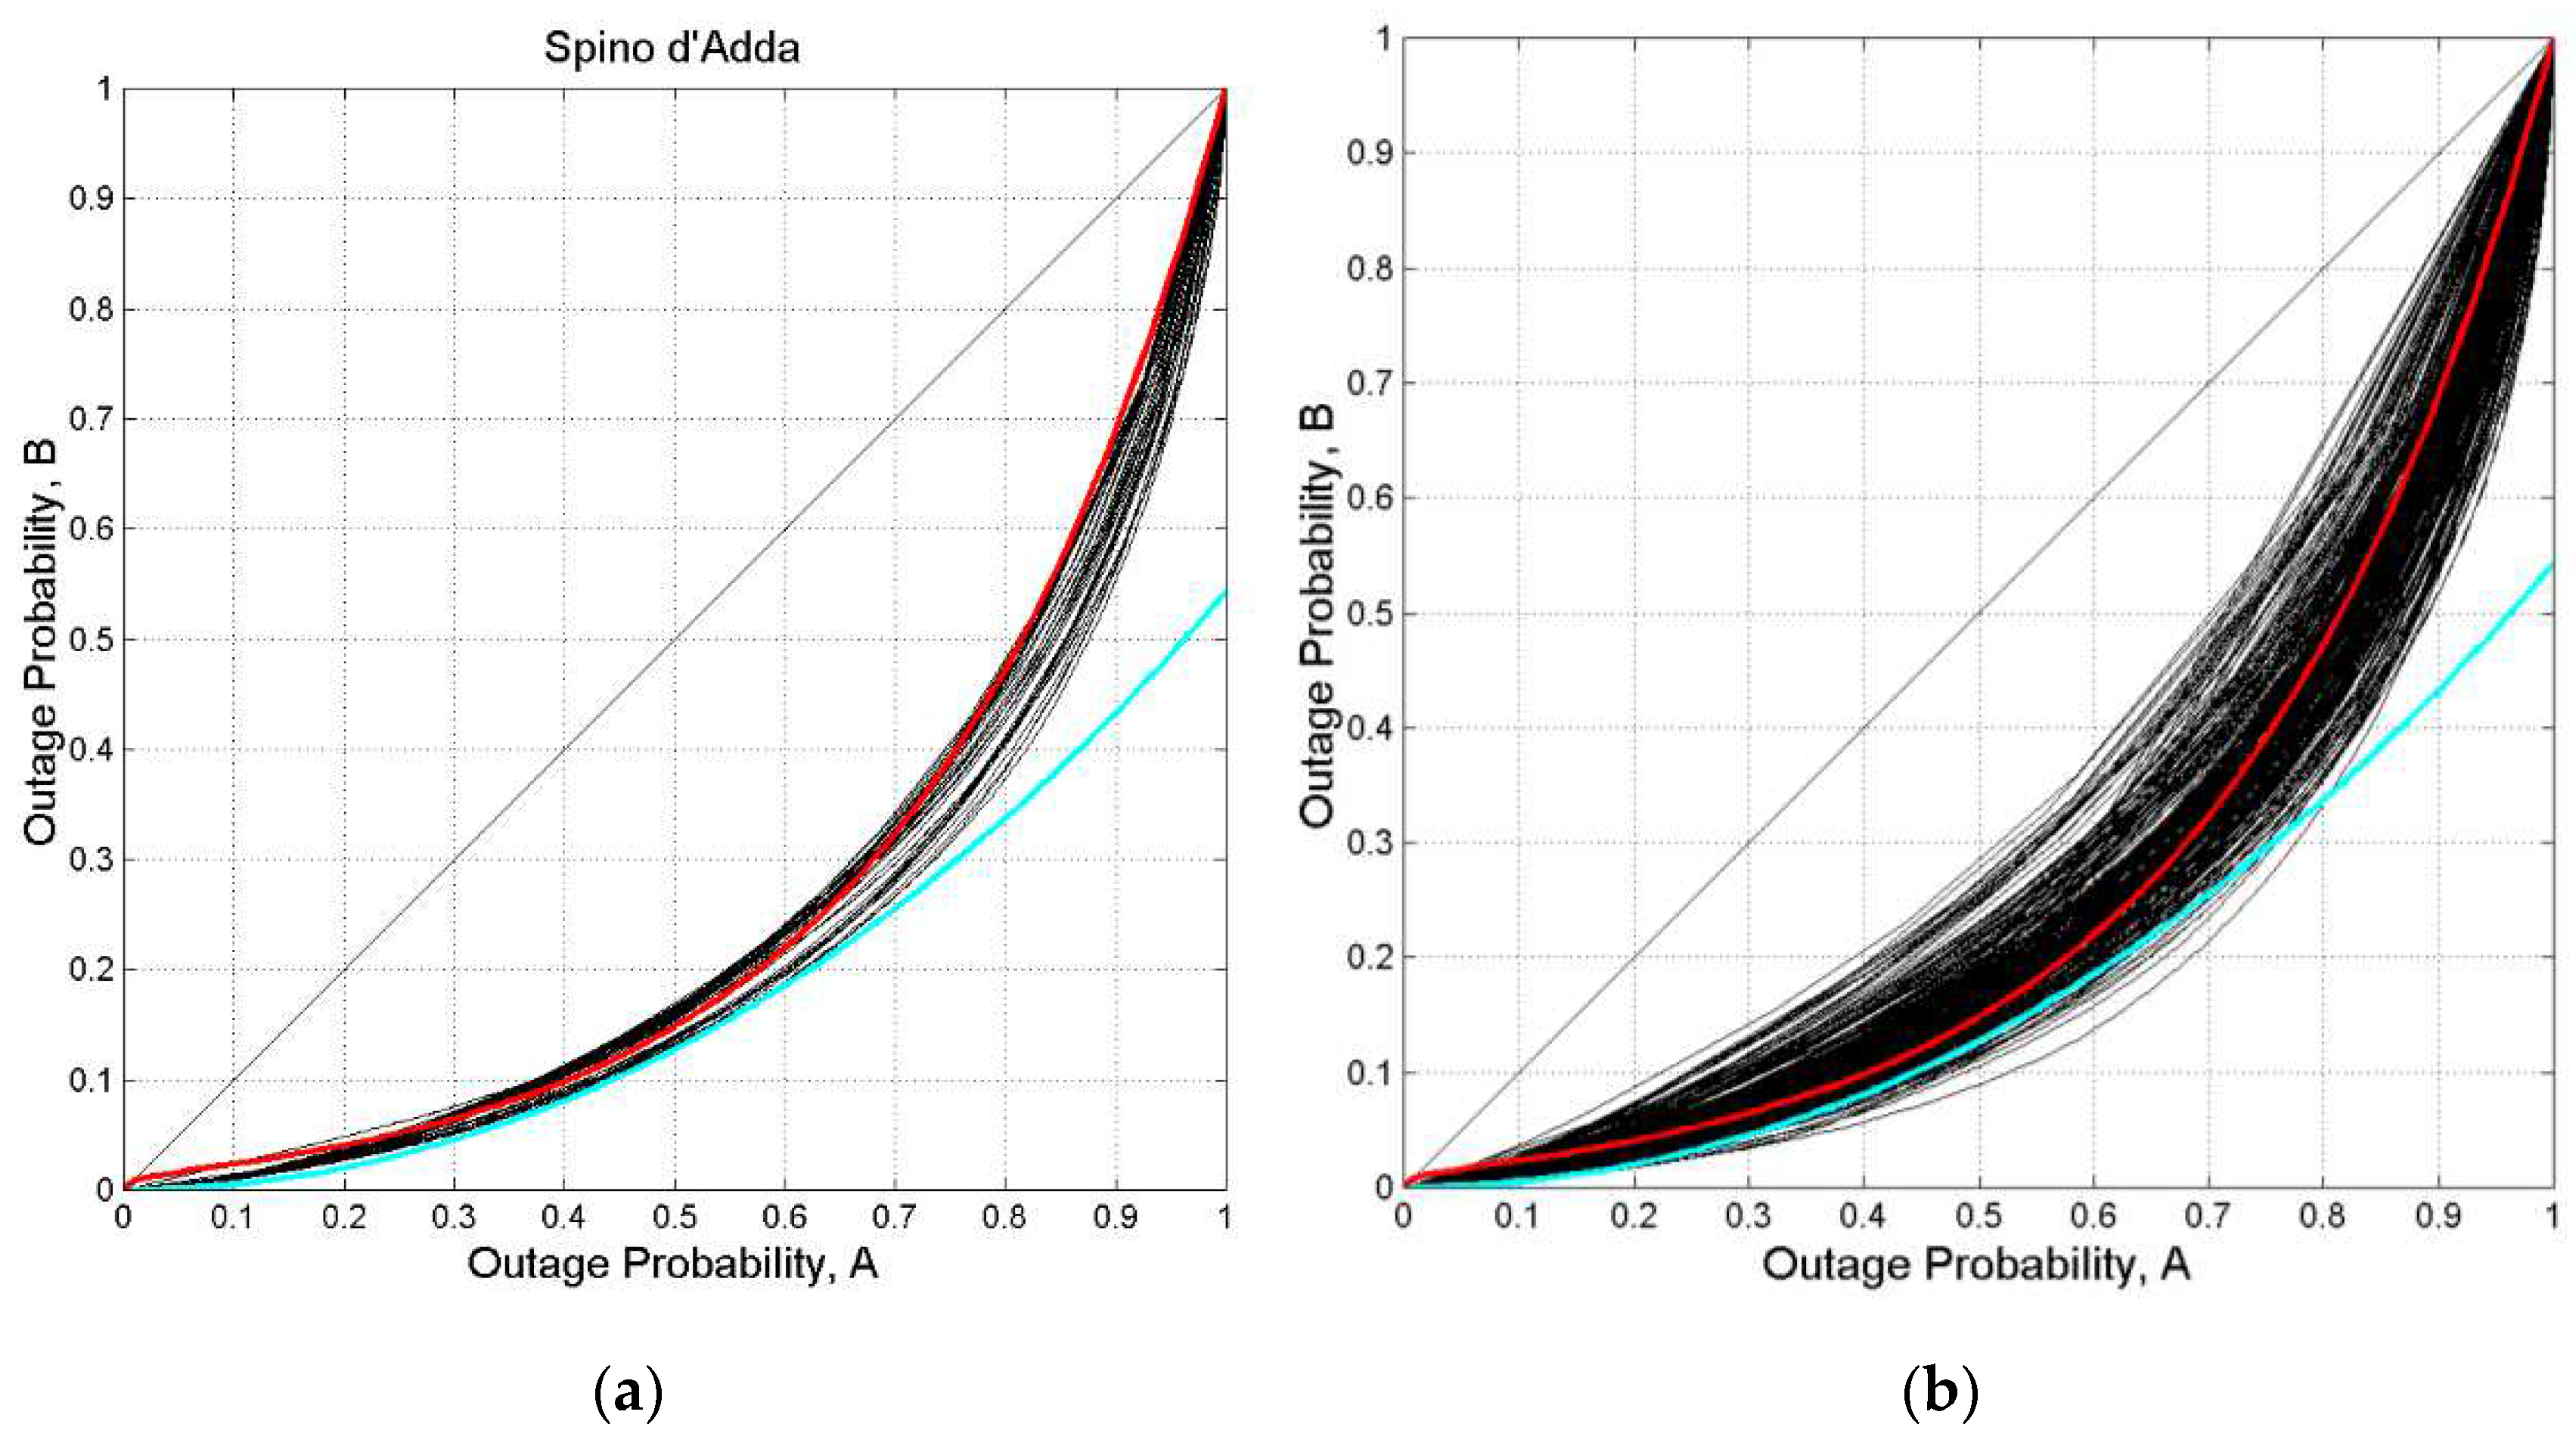
Figure 9a shows this relationship for Spino d’Adda. Each curved black line refers to a threshold, from 0 to 40 dB (41 curves). Similar curves are found for all the other sites (
Appendix C). Notice that the
scale is reversed in both
and
axes shown in
Figure 9, in other words,
decreases as
and
increase.
These curves give the following information. Since the largest values of exceeded give , we can see that a large increase in does not correspond to a similar increase in . In other words, few samples of the longest fades give a significant fraction of time but not a significant number of occurrences. For example, if then .
The approximate exponential nature of the relationships shown in
Figure 9a can be modelled by the following equation, with
,
:
In Equations (3)(4),
,
and the corresponding curve is the red line drawn in
Figure 9. These numerical values have been determined by averaging the log values of
and
of Equation (3) obtained by a best–fit analysis of each of the 41 curves. Notice that Equation (3) tends to represent an average value at small
and an upper bound at large
.
The cyan line drawn in
Figure 9 is the hyperbolic cosine minus 1:
Equation (5) practically gives a lower bound for all sites (
Appendix C), quite precise in the range
. For
.
Figure 9b shows the curves of all sites and thresholds. We can see that Equation (3), with the values of
and
found for Spino d’Adda, is a good estimate of the average value. In conclusion, Equations (3)(4) describe useful overall relationships that link
to
.
The 45° line drawn in
Figure 9 represents the curve linking
and
in the unrealistic case in which all fade durations were equal, namely when the two processes coincide. It is, however, a good reference line, as we show now by defining a uniformity index
in the next section.
6. Uniformity Index
How can we measure the difference between real cases – fade durations fragmented in many different intervals with changing threshold and site – and the limiting case of identity/uniformity of the two processes when all fades last the same time? We propose the following index
, referred to as the uniformity index and a function of threshold
, defined by:
In other words, Equation (6) is the ratio between the area under each function
shown in
Figure 9 and in
Appendix C, and the area under the 45°line, which is 0.5. Therefore
.
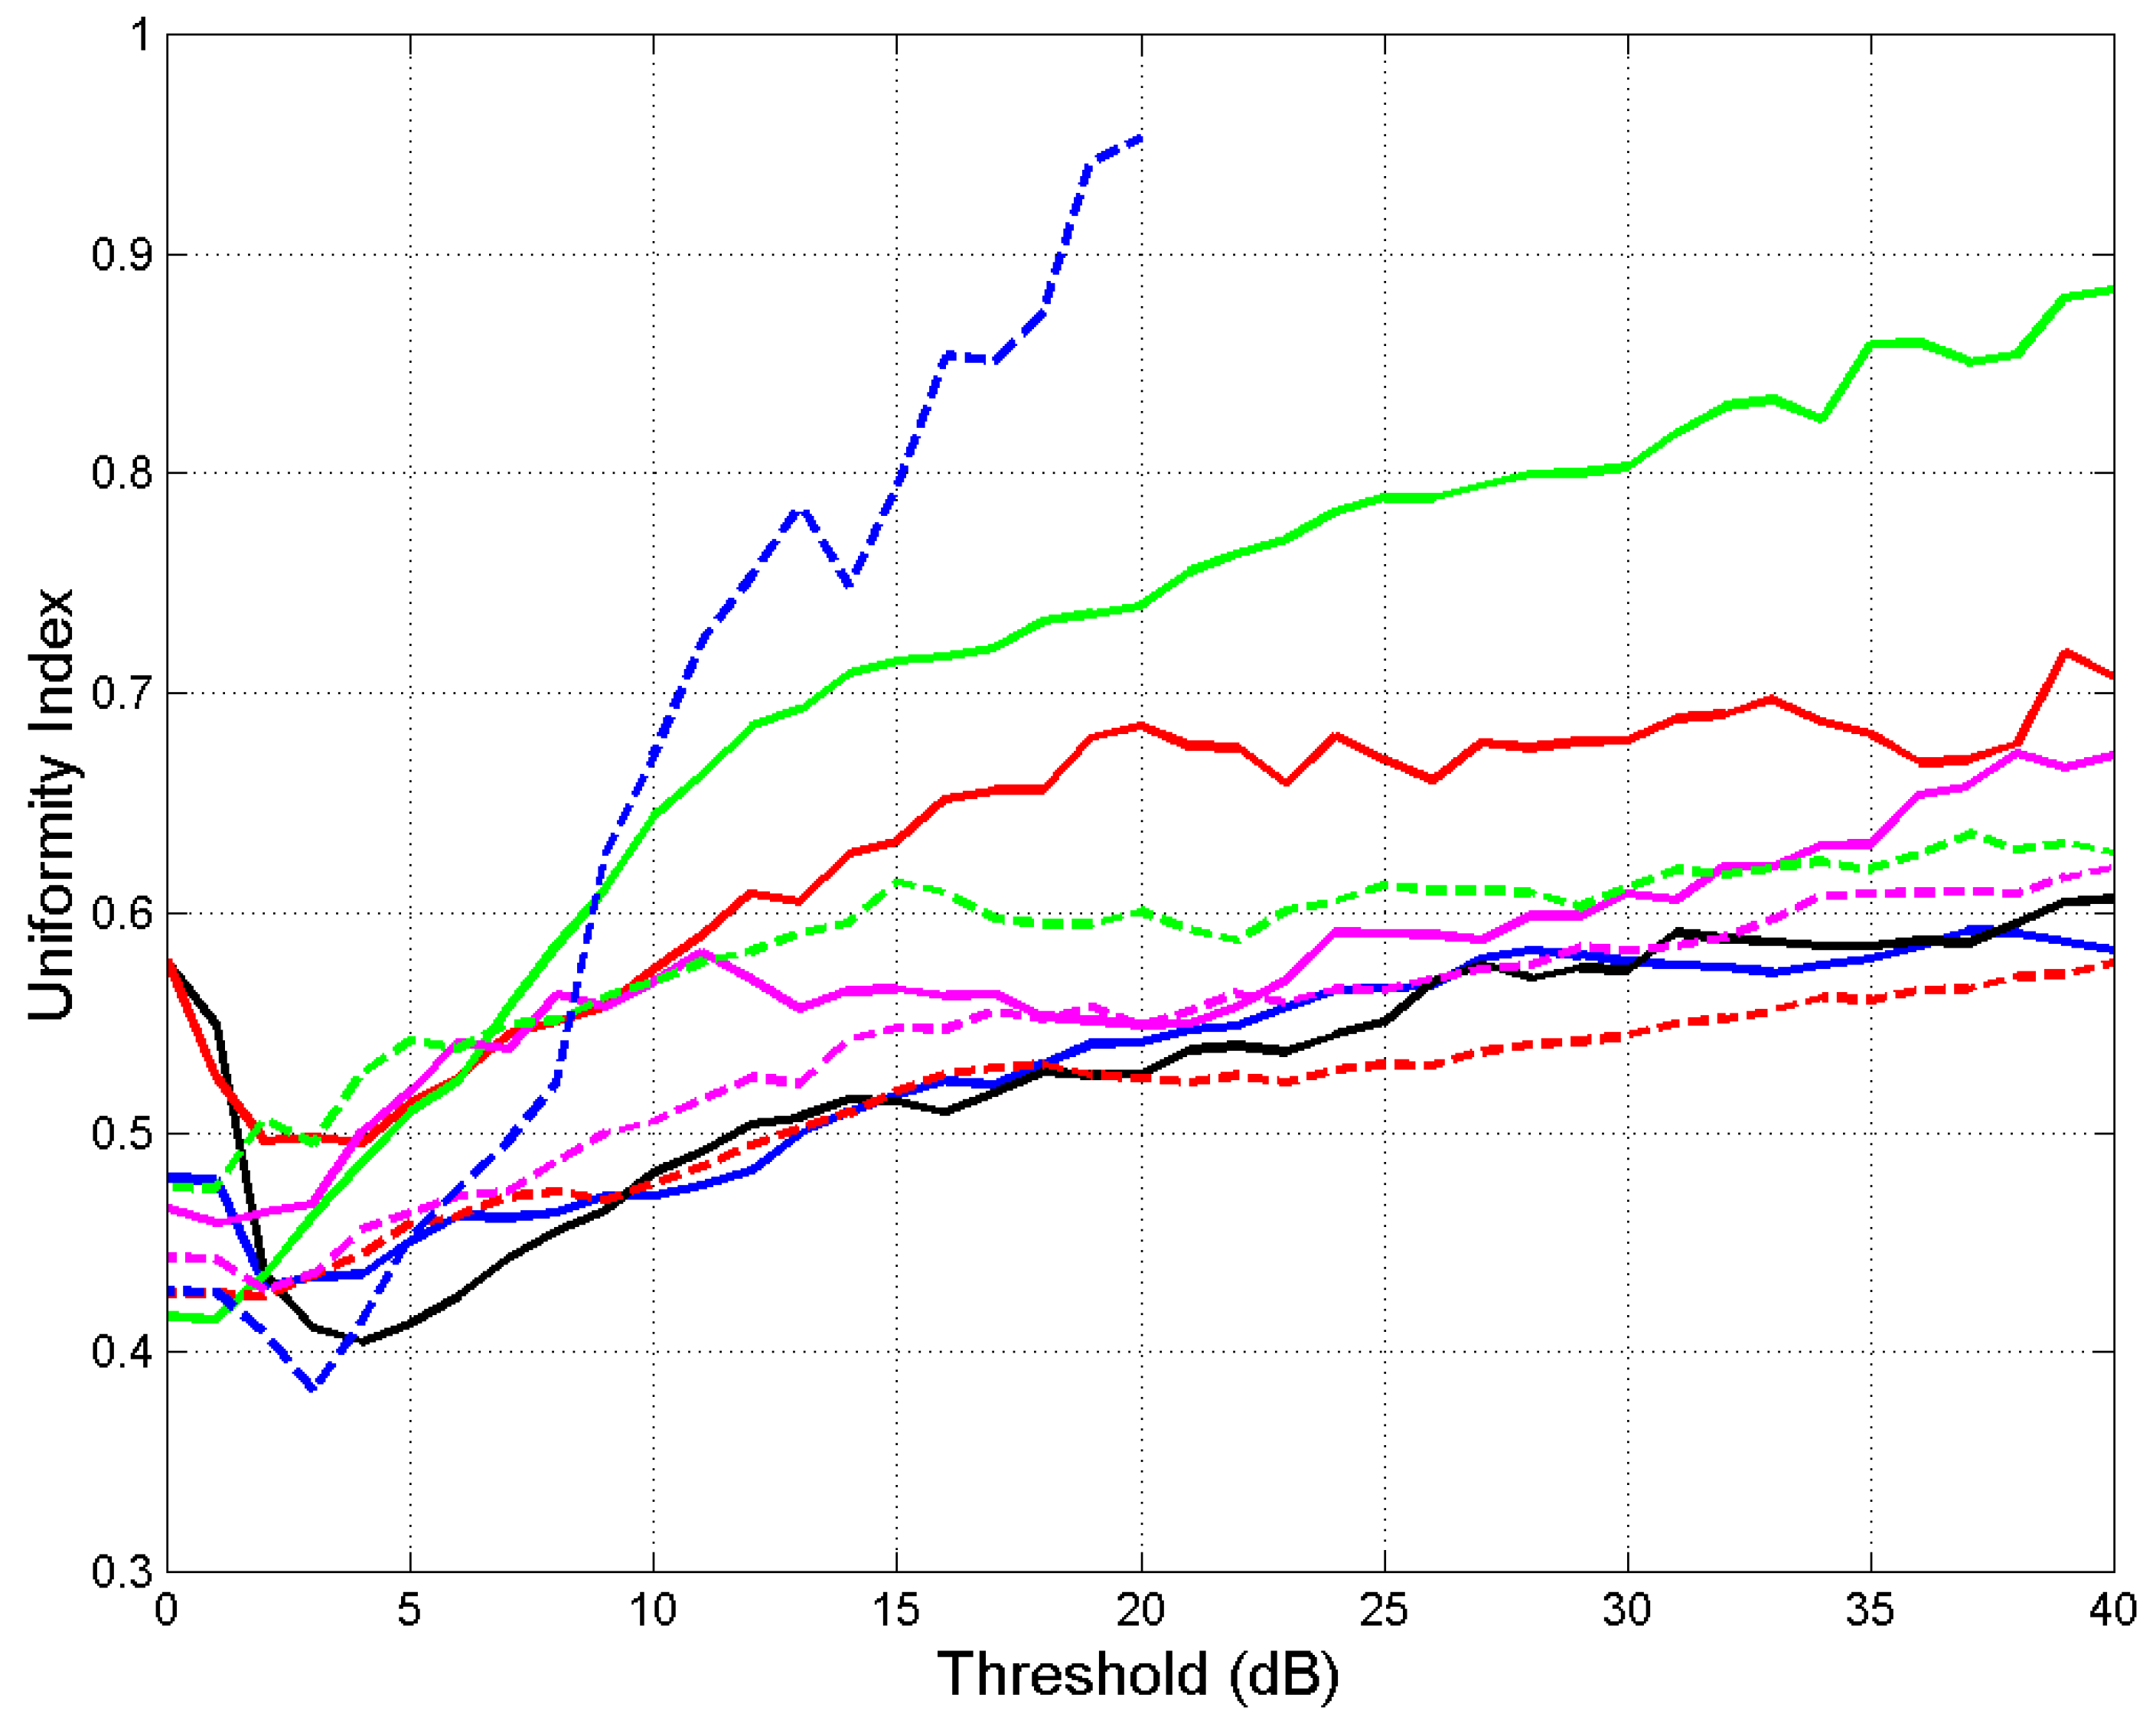
Figure 10 shows uniformity index versus threshold, for each site. We can observe the following features:
- a)
for all sites.
- b)
For
dB,
ranges from
to
. Since this value refers to the single rain events (i.e., the time series
of each rain event), then the duration of rain events does change in a large range. In fact, if all rain events were of equal duration
, they would give
,
. This case would be represented by the point (1,1) in
Figure 9, with probability
, a Dirac impulse of unit area.
- c)
Some sites show marked dips at low thresholds. In other words, at these thresholds the two processes are the furthest away from the uniformity model (Spino d’Adda, Gera Lario, Madrid, Vancouver).
- d)
As the threshold increases,
increases, therefore the two processes tend to be closer to the uniformity model at larger rain attenuation. This a sound physical result because fades tend to be more similar in duration at large rain attenuation (see, for example,
Figure 1).
approaches 1 at very large thresholds (Madrid, Vancouver).
- e)
The red line, Equation (3), gives
(a line
in
Figure 10) practically the mid–range value at
dB:
.
Figure 10.
Uniformity index versus the threshold indicated in abscissa at the indicated sites. Spino d’Adda: continuous blue line; Gera Lario: continuous black line; Fucino: continuous red line; Madrid: continuous green line; Prague: continuous magenta line; Tampa: dashed red line; Norman: dashed magenta line; White Sands: dashed green line; Vancouver: dashed blue line.
7. Conclusion
Fade duration is the second most–important link parameter required for designing a satellite link faded by rain because it gives the interval the rain attenuation time series exceeds an attenuation threshold (dB), namely the link power margin compared to clear sky. Since no measurements are avaliable for zenith paths of GeoSurf satellite constellations, we have simulated with the Synthetic Storm Technique at sites located in different climatic regions.
We have studied the two stochastic processes A and B of fade durations. Process B gives the statistics of outages, process A gives the statistics of outage duration. We have found that fade duration
largely decreases as threshold increseas and it is exceeded with different probability at the diverse sites of
Table 1.
To show that the two processes are not independent, we have studied the relationship between their probabilities and defined a uniformity index , which compares real cases – fade durations fragmented in many different intervals with changing threshold and site – with the limiting case of all fades lasting the same time. We have found that for all sites. As the threshold increases, increases, therefore the two processes tend to be closer to the uniformity model at larger rain attenuation. approaches 1 at very large thresholds.
These results should guide the designers of future GeoSurf satellite constellations to take care of the diverse communications services, differently affected by the two fade duration processes. Process B (occurrences) impacts, especially, on non–real time services, such as data delivery, which can more disturbed by the number of outages rather than by their duration. Process A (fraction of time) impacts, especially on real–time services such as television, video conference etc., which are more disturbed by the duration of the outage.
Author Contributions
Conceptualization, E.M. and C.R.; methodology; software, E.M. and C.R.; validation, E.M. and C.R.; investigation, E.M. and C.R..; data curation, E.M. and C.R..; writing—original draft preparation, E.M.; writing—review and editing, E.M. and C.R..; visualization, E.M. and C.R. Both authors have read and agreed to the published version of the manuscript.
Funding
This research received no external funding.
Institutional Review Board Statement
Not applicable.
Data Availability Statement
Data available from the authors.
Acknowledgments
In this section, you can acknowledge any support given which is not covered by the author contribution or funding sections. This may include administrative and technical support, or donations in kind (e.g., materials used for experiments).
Conflicts of Interest
The authors declare no conflicts of interest.
Appendix A
In this appendix we report the probability distribution
and
of exceeding
for some thresholds for the sites listed in
Table 1.
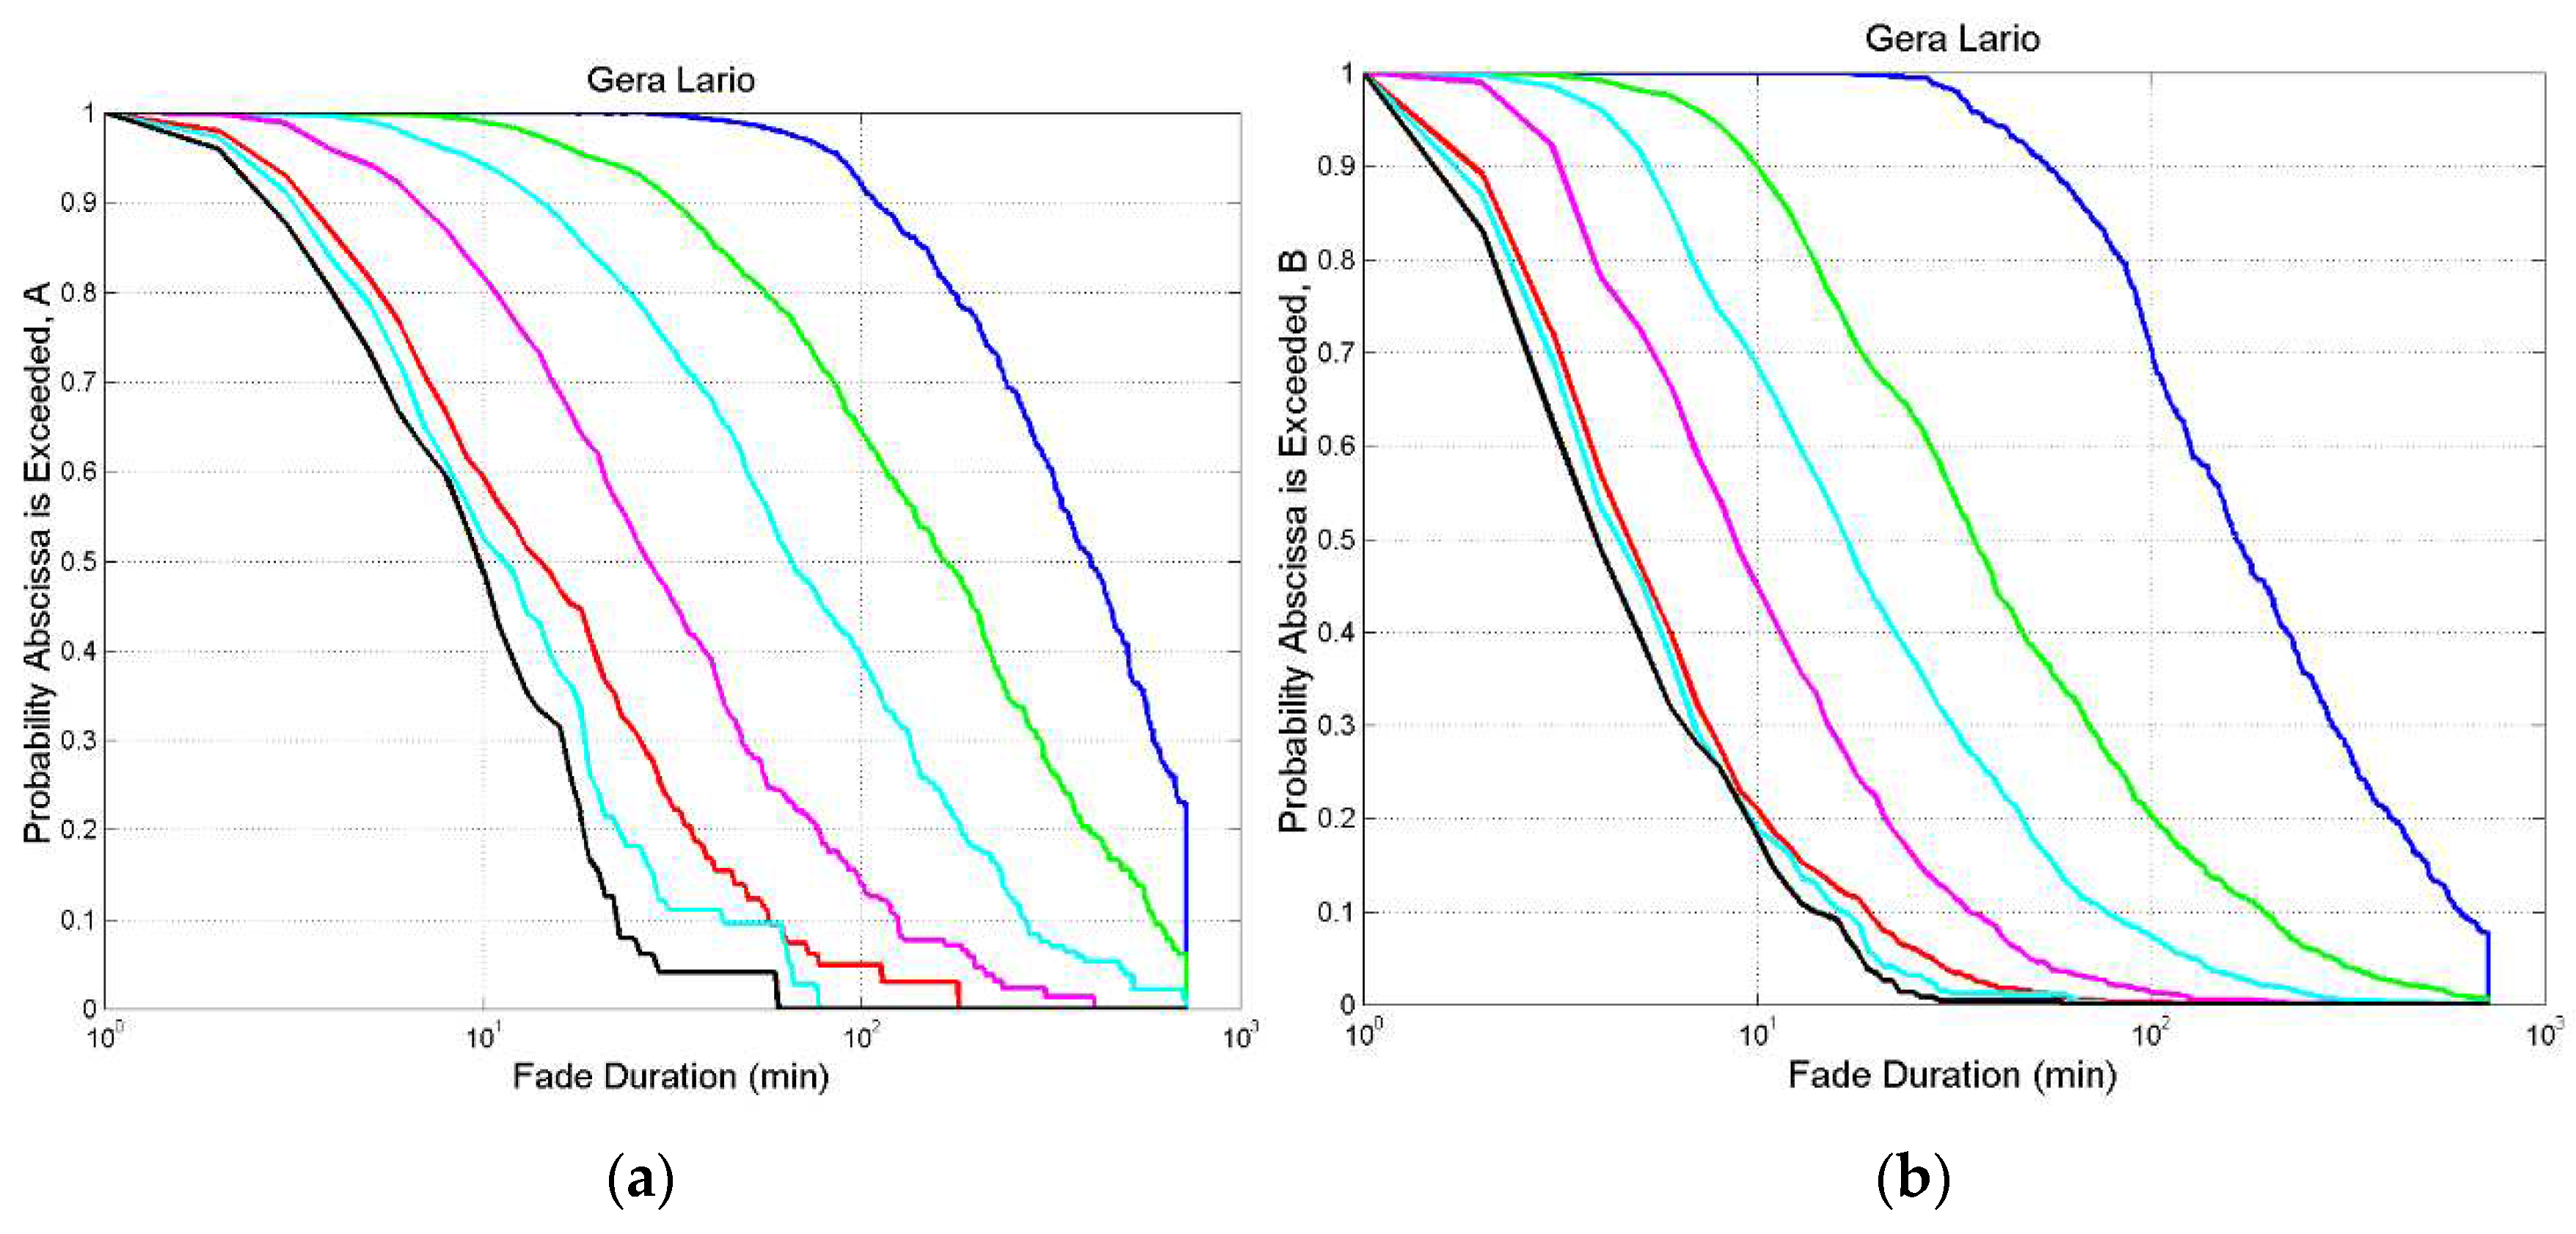
Figure A1.
Gera Lario. (a) Probability distribution of exceeding the value indicated in abscissa at the following thresholds: 0 dB, blue; 3 dB, green; 6 dB, cyan; 10 dB, magenta; 20 dB, red; 29 dB, cyan and black.; (b) , same legend.
Figure A1.
Gera Lario. (a) Probability distribution of exceeding the value indicated in abscissa at the following thresholds: 0 dB, blue; 3 dB, green; 6 dB, cyan; 10 dB, magenta; 20 dB, red; 29 dB, cyan and black.; (b) , same legend.
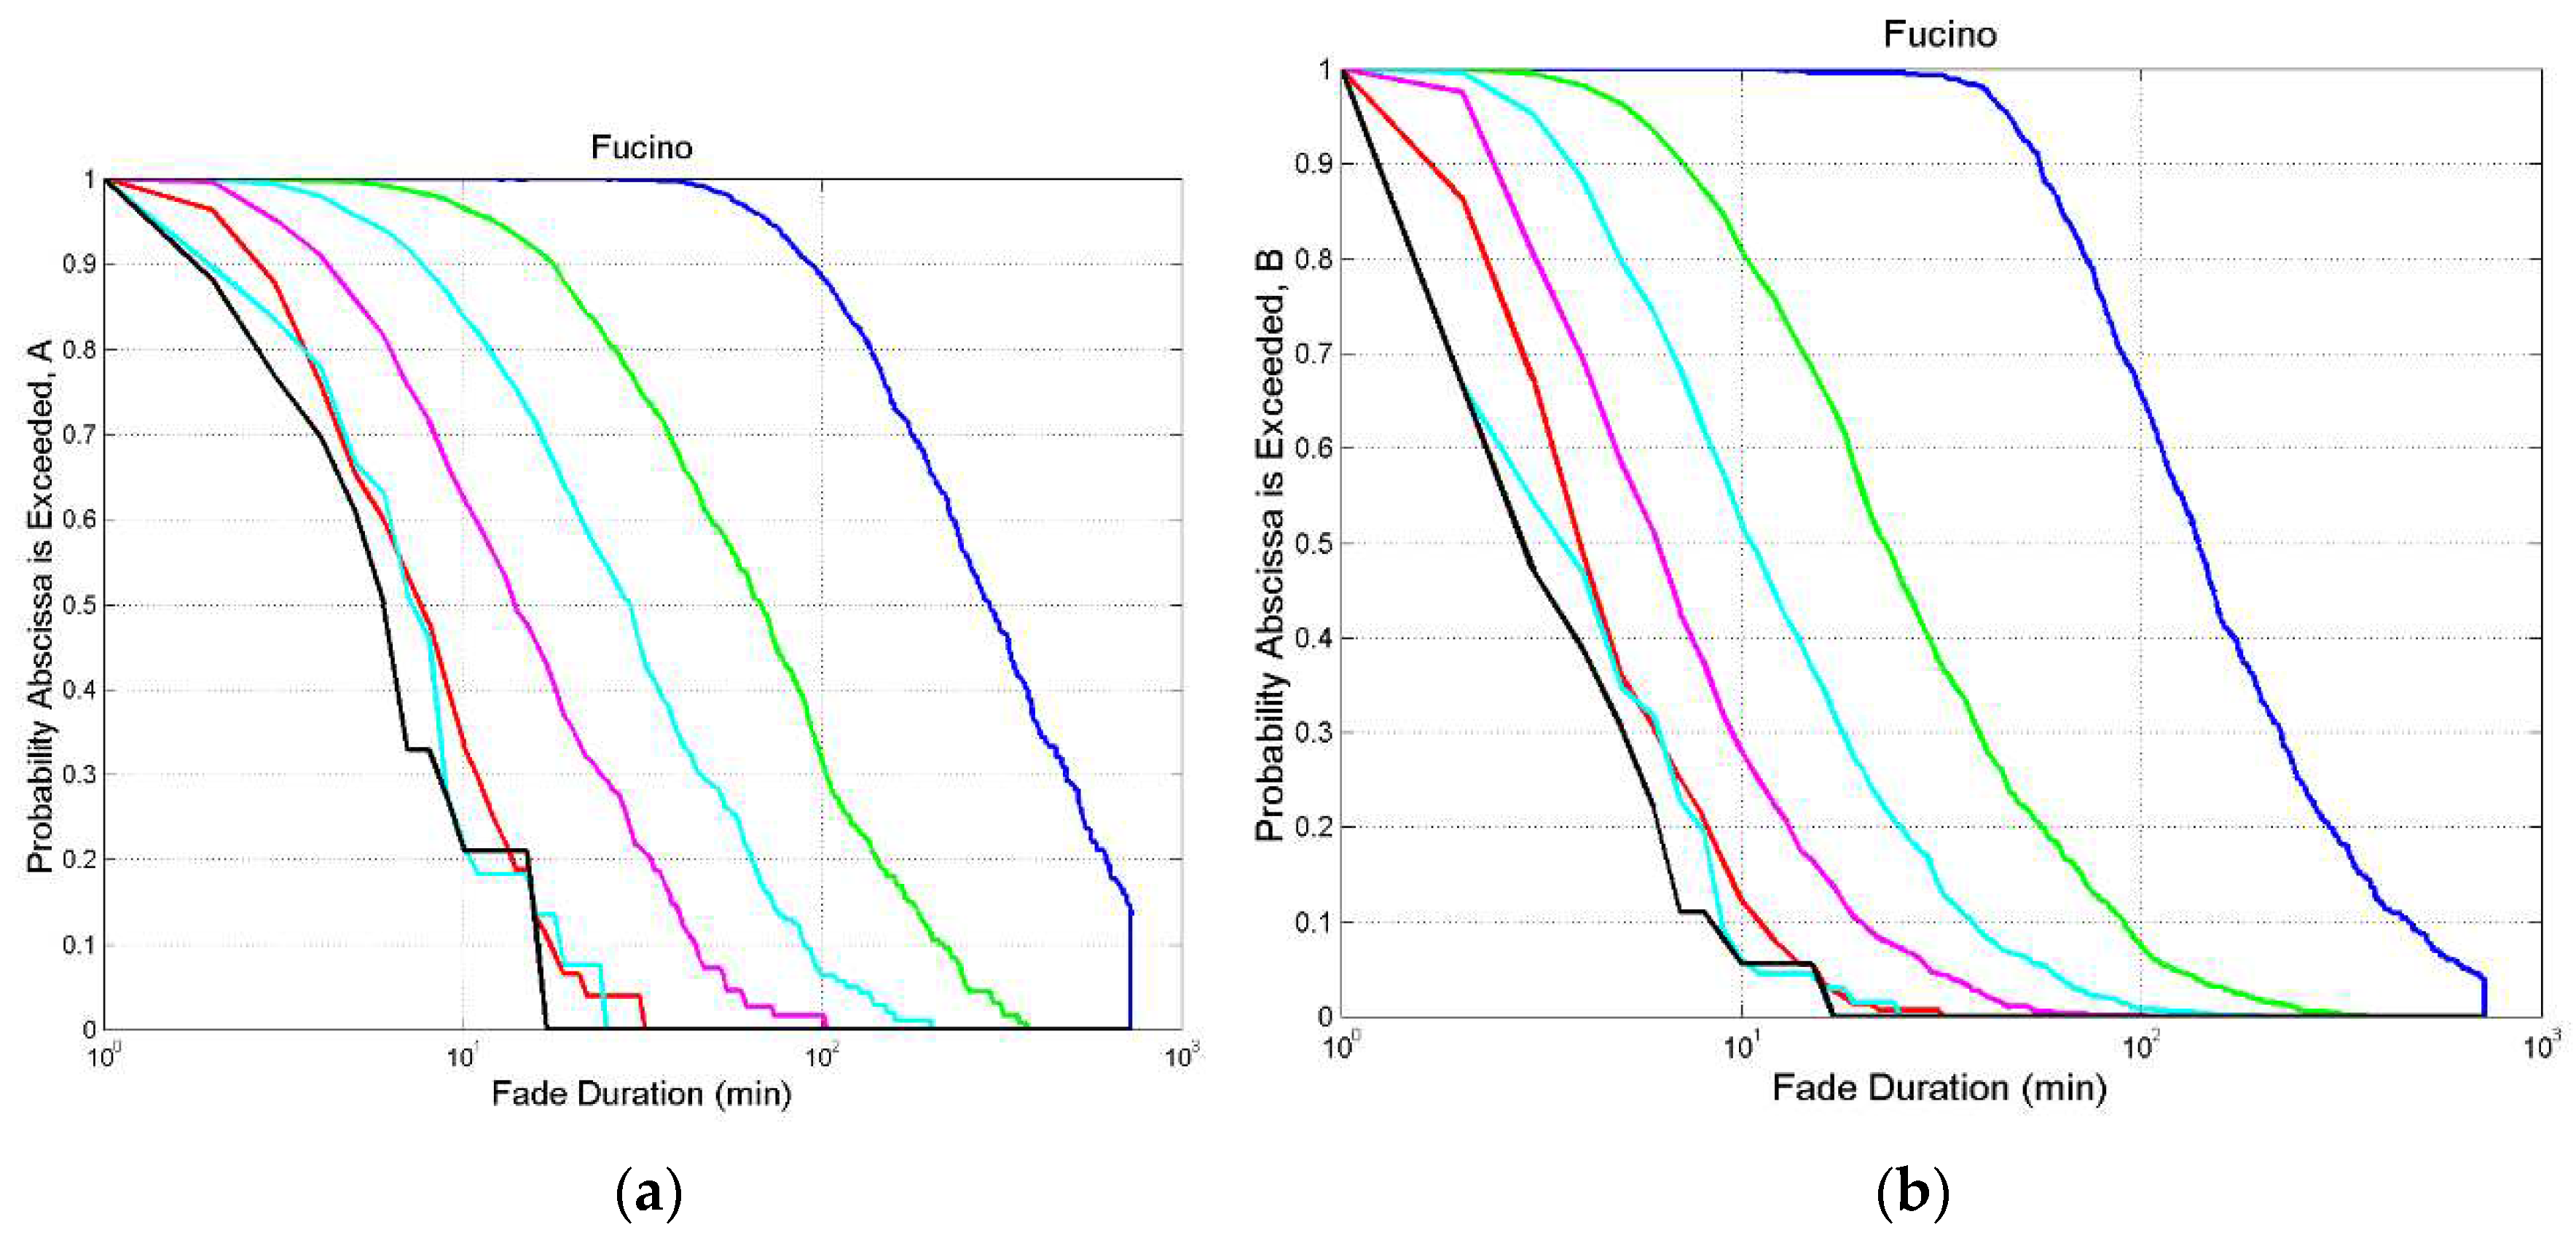
Figure A2.
Fucino. (a) Probability distribution of exceeding the value indicated in abscissa at the following thresholds: 0 dB, blue; 3 dB, green; 6 dB, cyan; 10 dB, magenta; 20 dB, red; 29 dB, cyan and black.; (b) , same legend.
Figure A2.
Fucino. (a) Probability distribution of exceeding the value indicated in abscissa at the following thresholds: 0 dB, blue; 3 dB, green; 6 dB, cyan; 10 dB, magenta; 20 dB, red; 29 dB, cyan and black.; (b) , same legend.
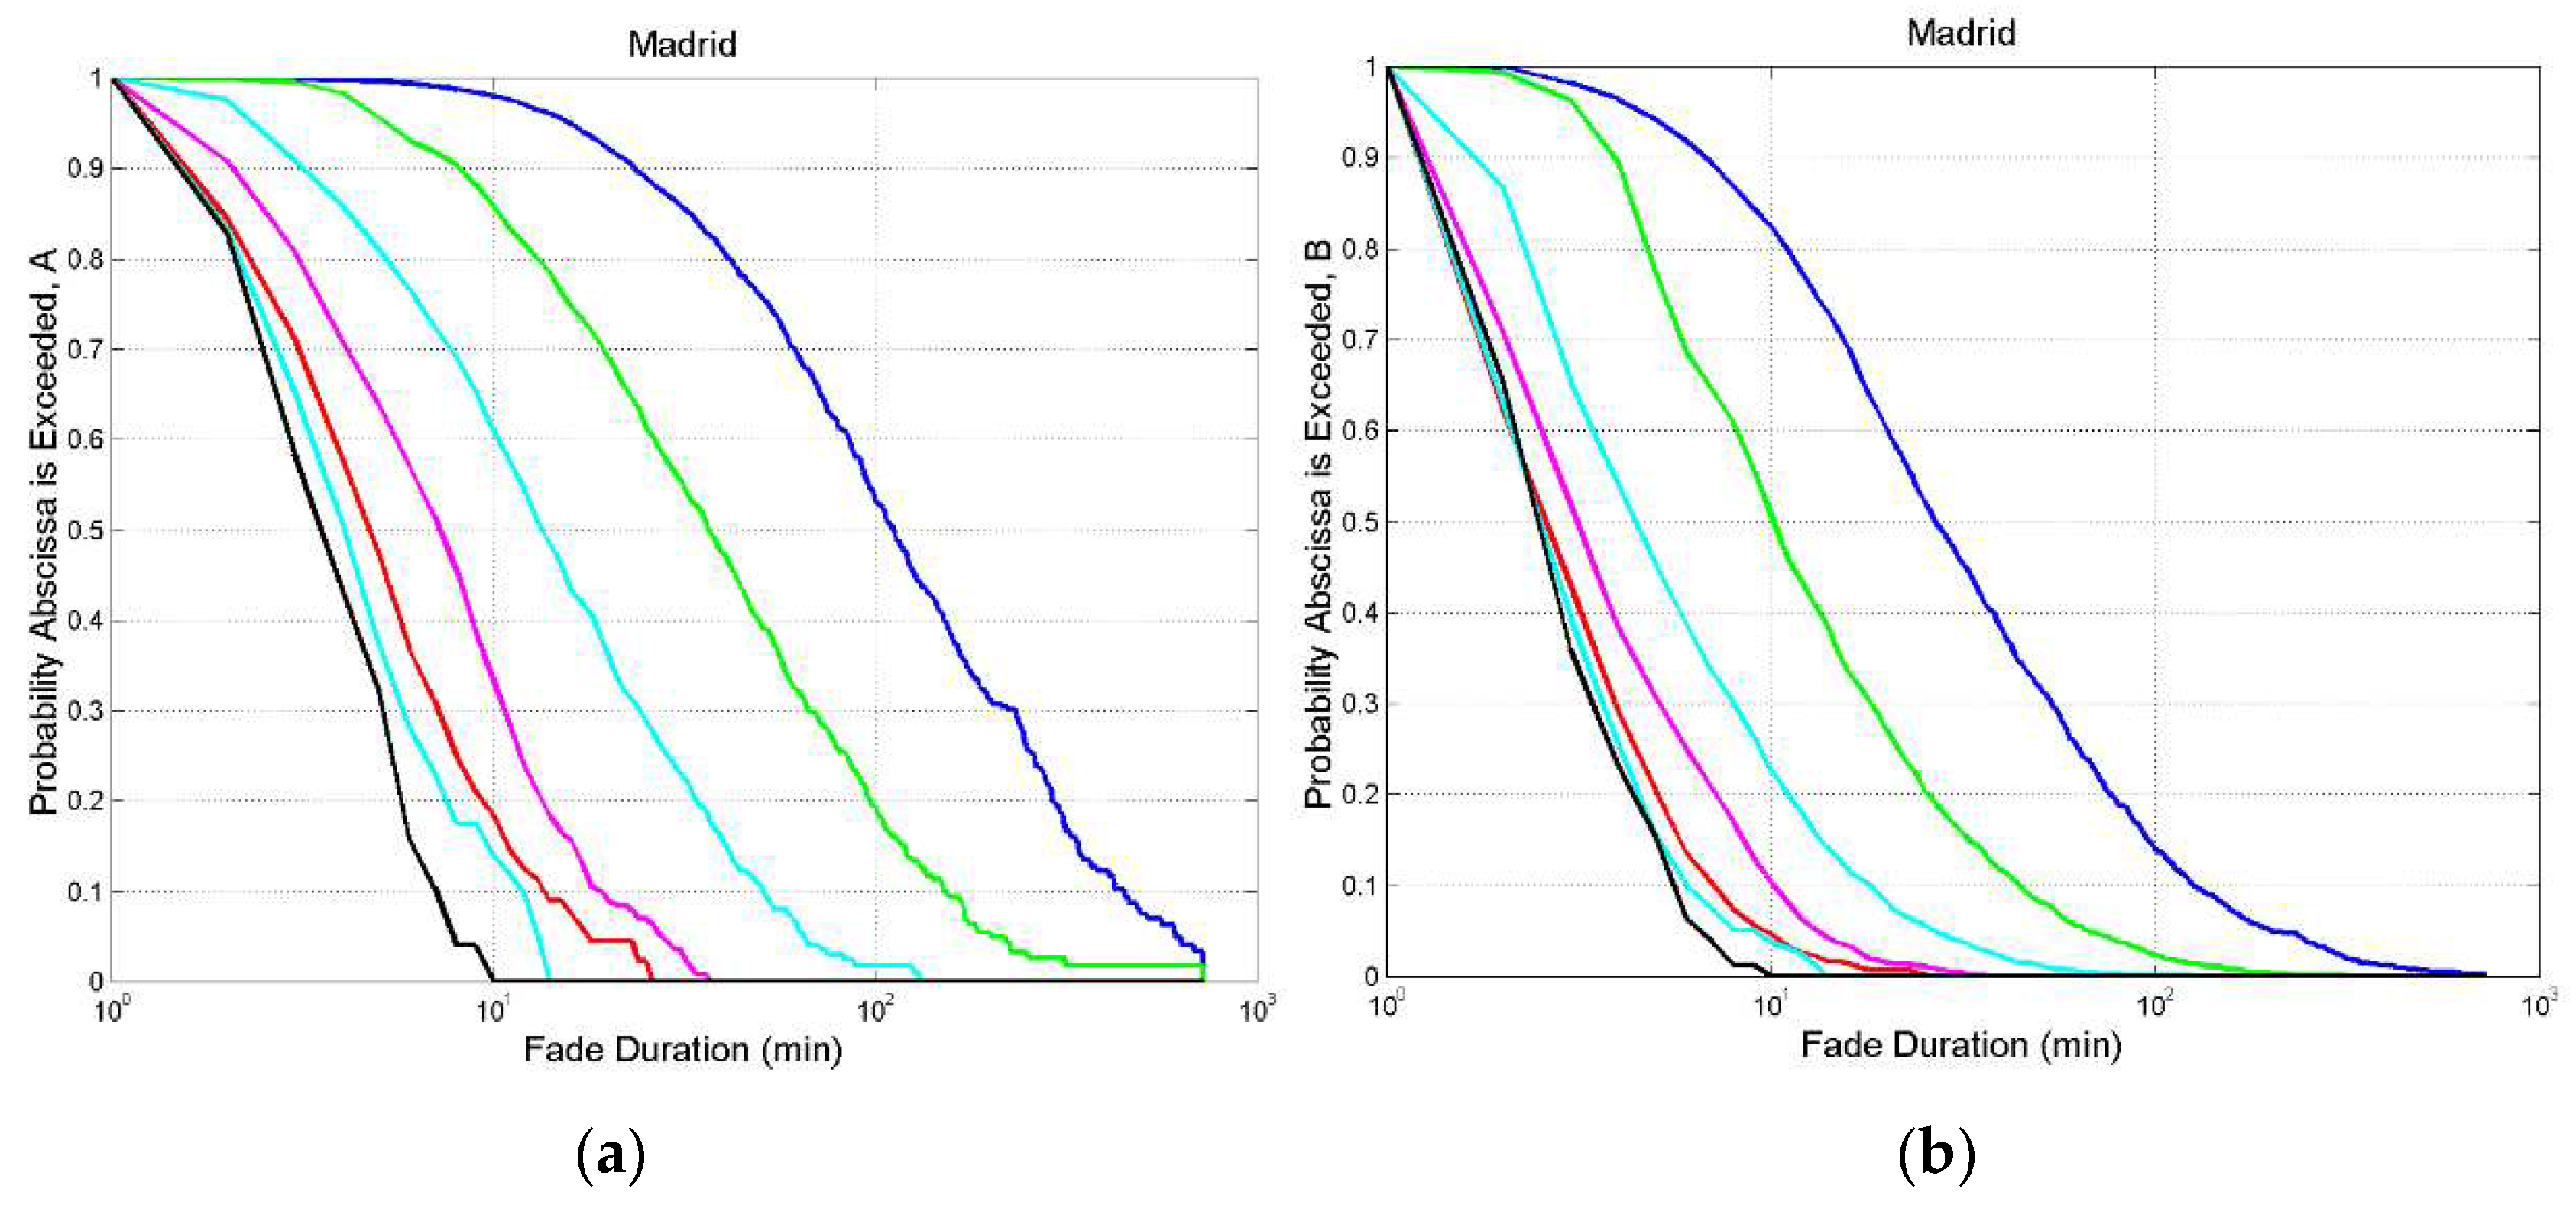
Figure A3.
Madrid. (a) Probability distribution of exceeding the value indicated in abscissa at the following thresholds: 0 dB, blue; 3 dB, green; 6 dB, cyan; 10 dB, magenta; 20 dB, red; 29 dB, cyan and black.; (b) , same legend.
Figure A3.
Madrid. (a) Probability distribution of exceeding the value indicated in abscissa at the following thresholds: 0 dB, blue; 3 dB, green; 6 dB, cyan; 10 dB, magenta; 20 dB, red; 29 dB, cyan and black.; (b) , same legend.
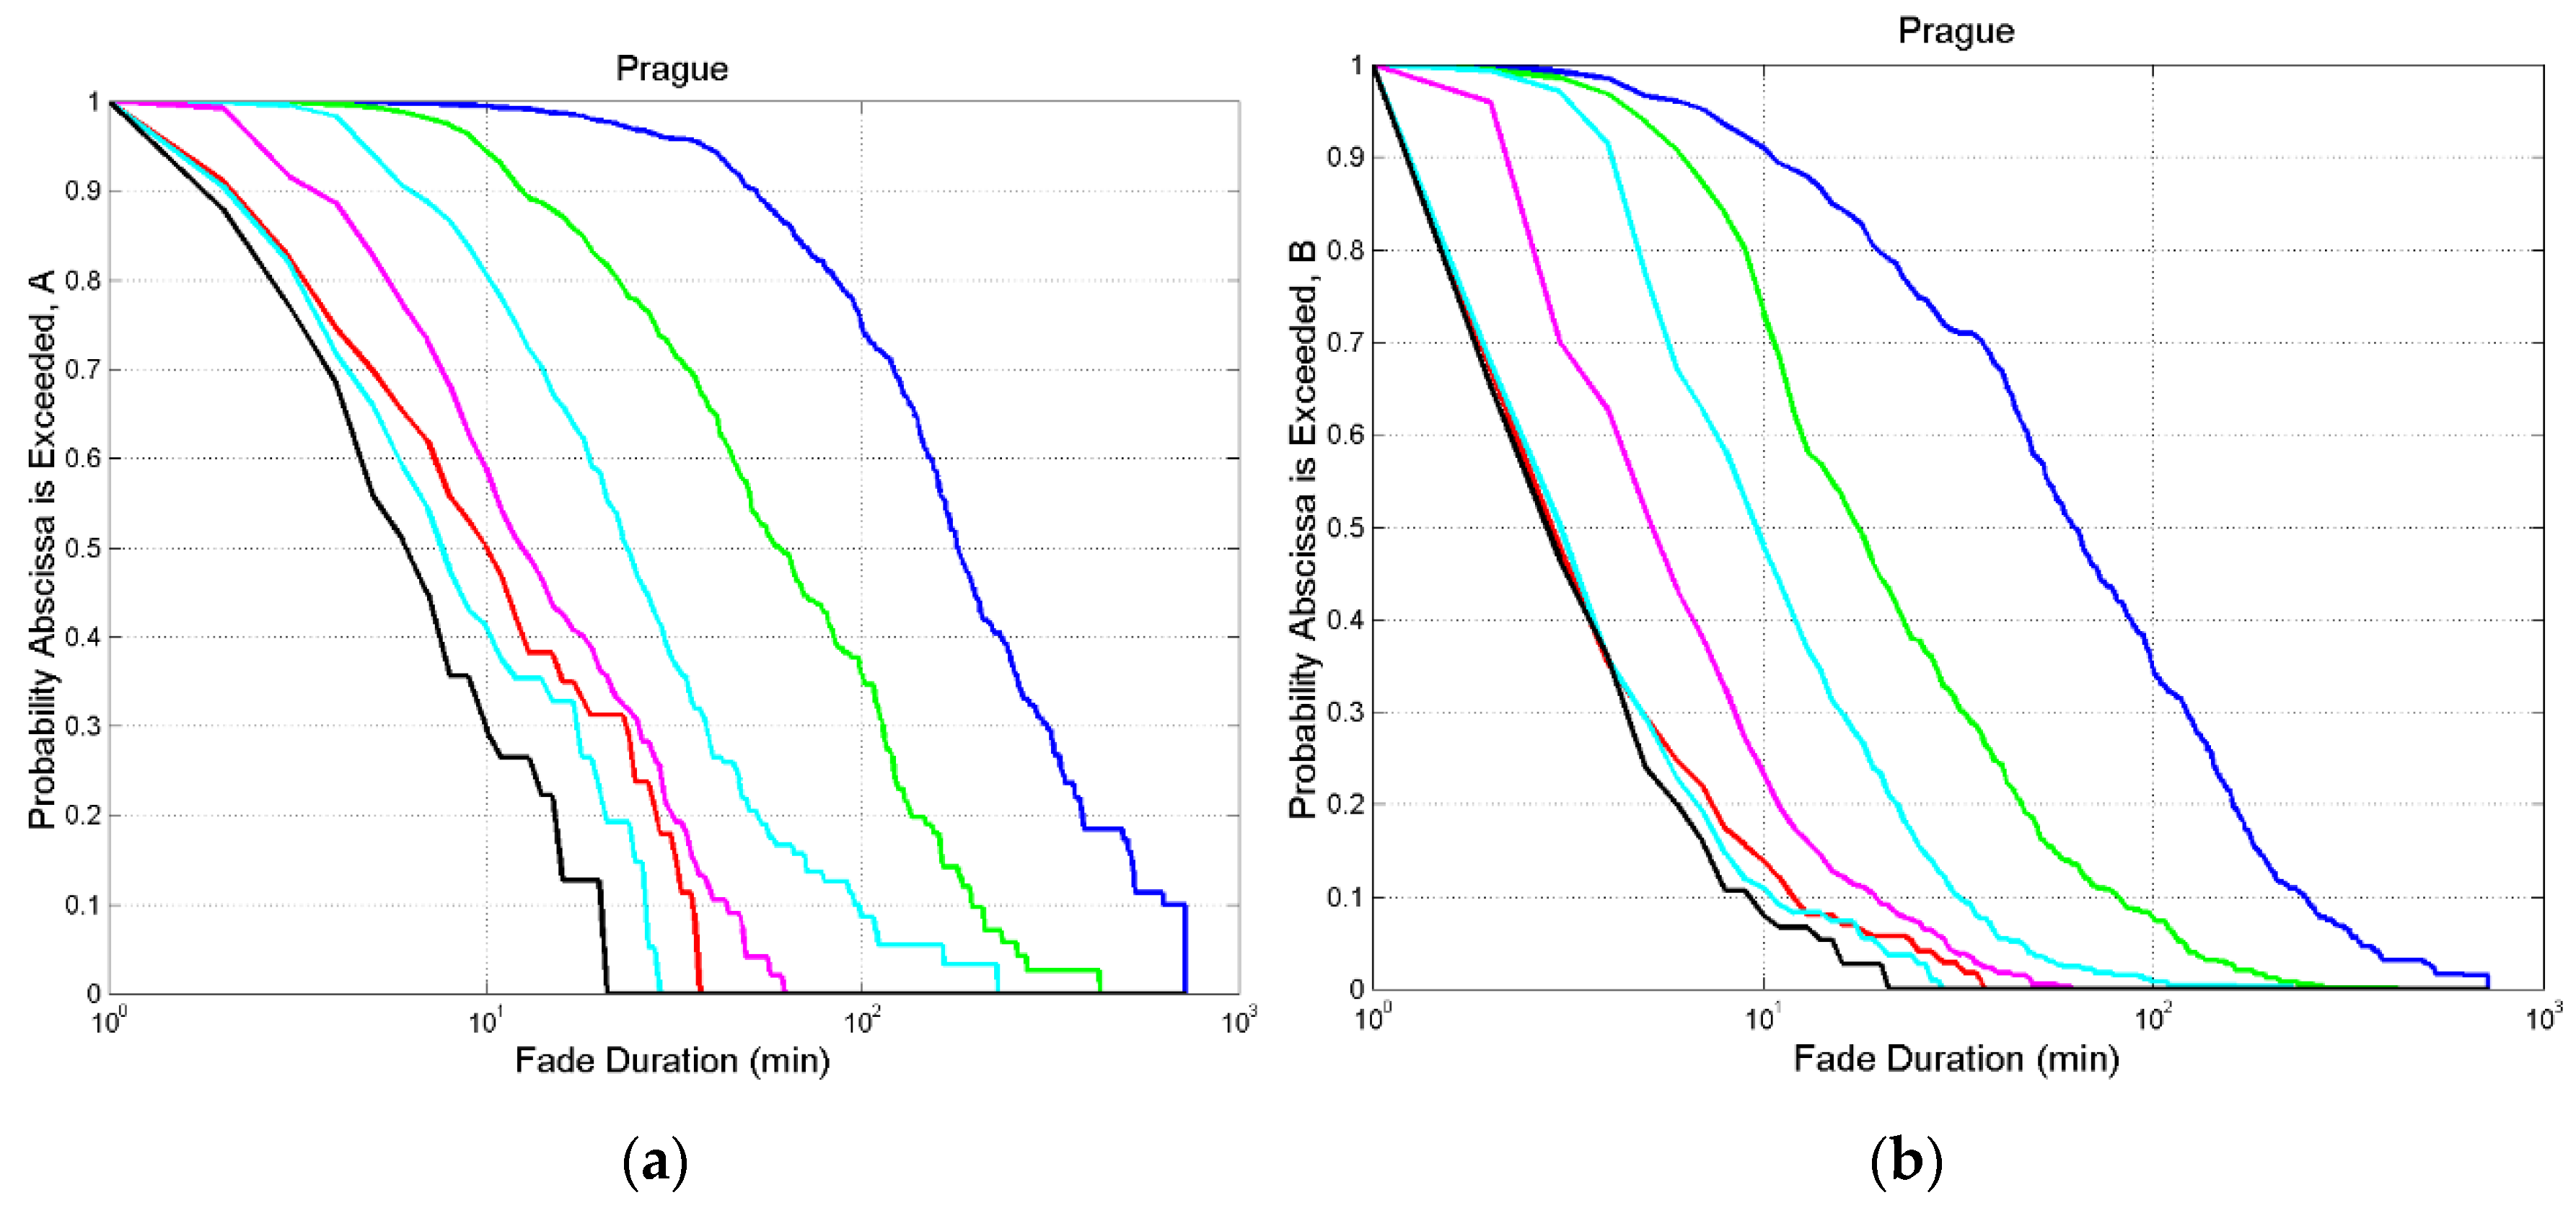
Figure A4.
Prague. (a) Probability distribution of exceeding the value indicated in abscissa at the following thresholds: 0 dB, blue; 3 dB, green; 6 dB, cyan; 10 dB, magenta; 20 dB, red; 29 dB, cyan and black.; (b) , same legend.
Figure A4.
Prague. (a) Probability distribution of exceeding the value indicated in abscissa at the following thresholds: 0 dB, blue; 3 dB, green; 6 dB, cyan; 10 dB, magenta; 20 dB, red; 29 dB, cyan and black.; (b) , same legend.
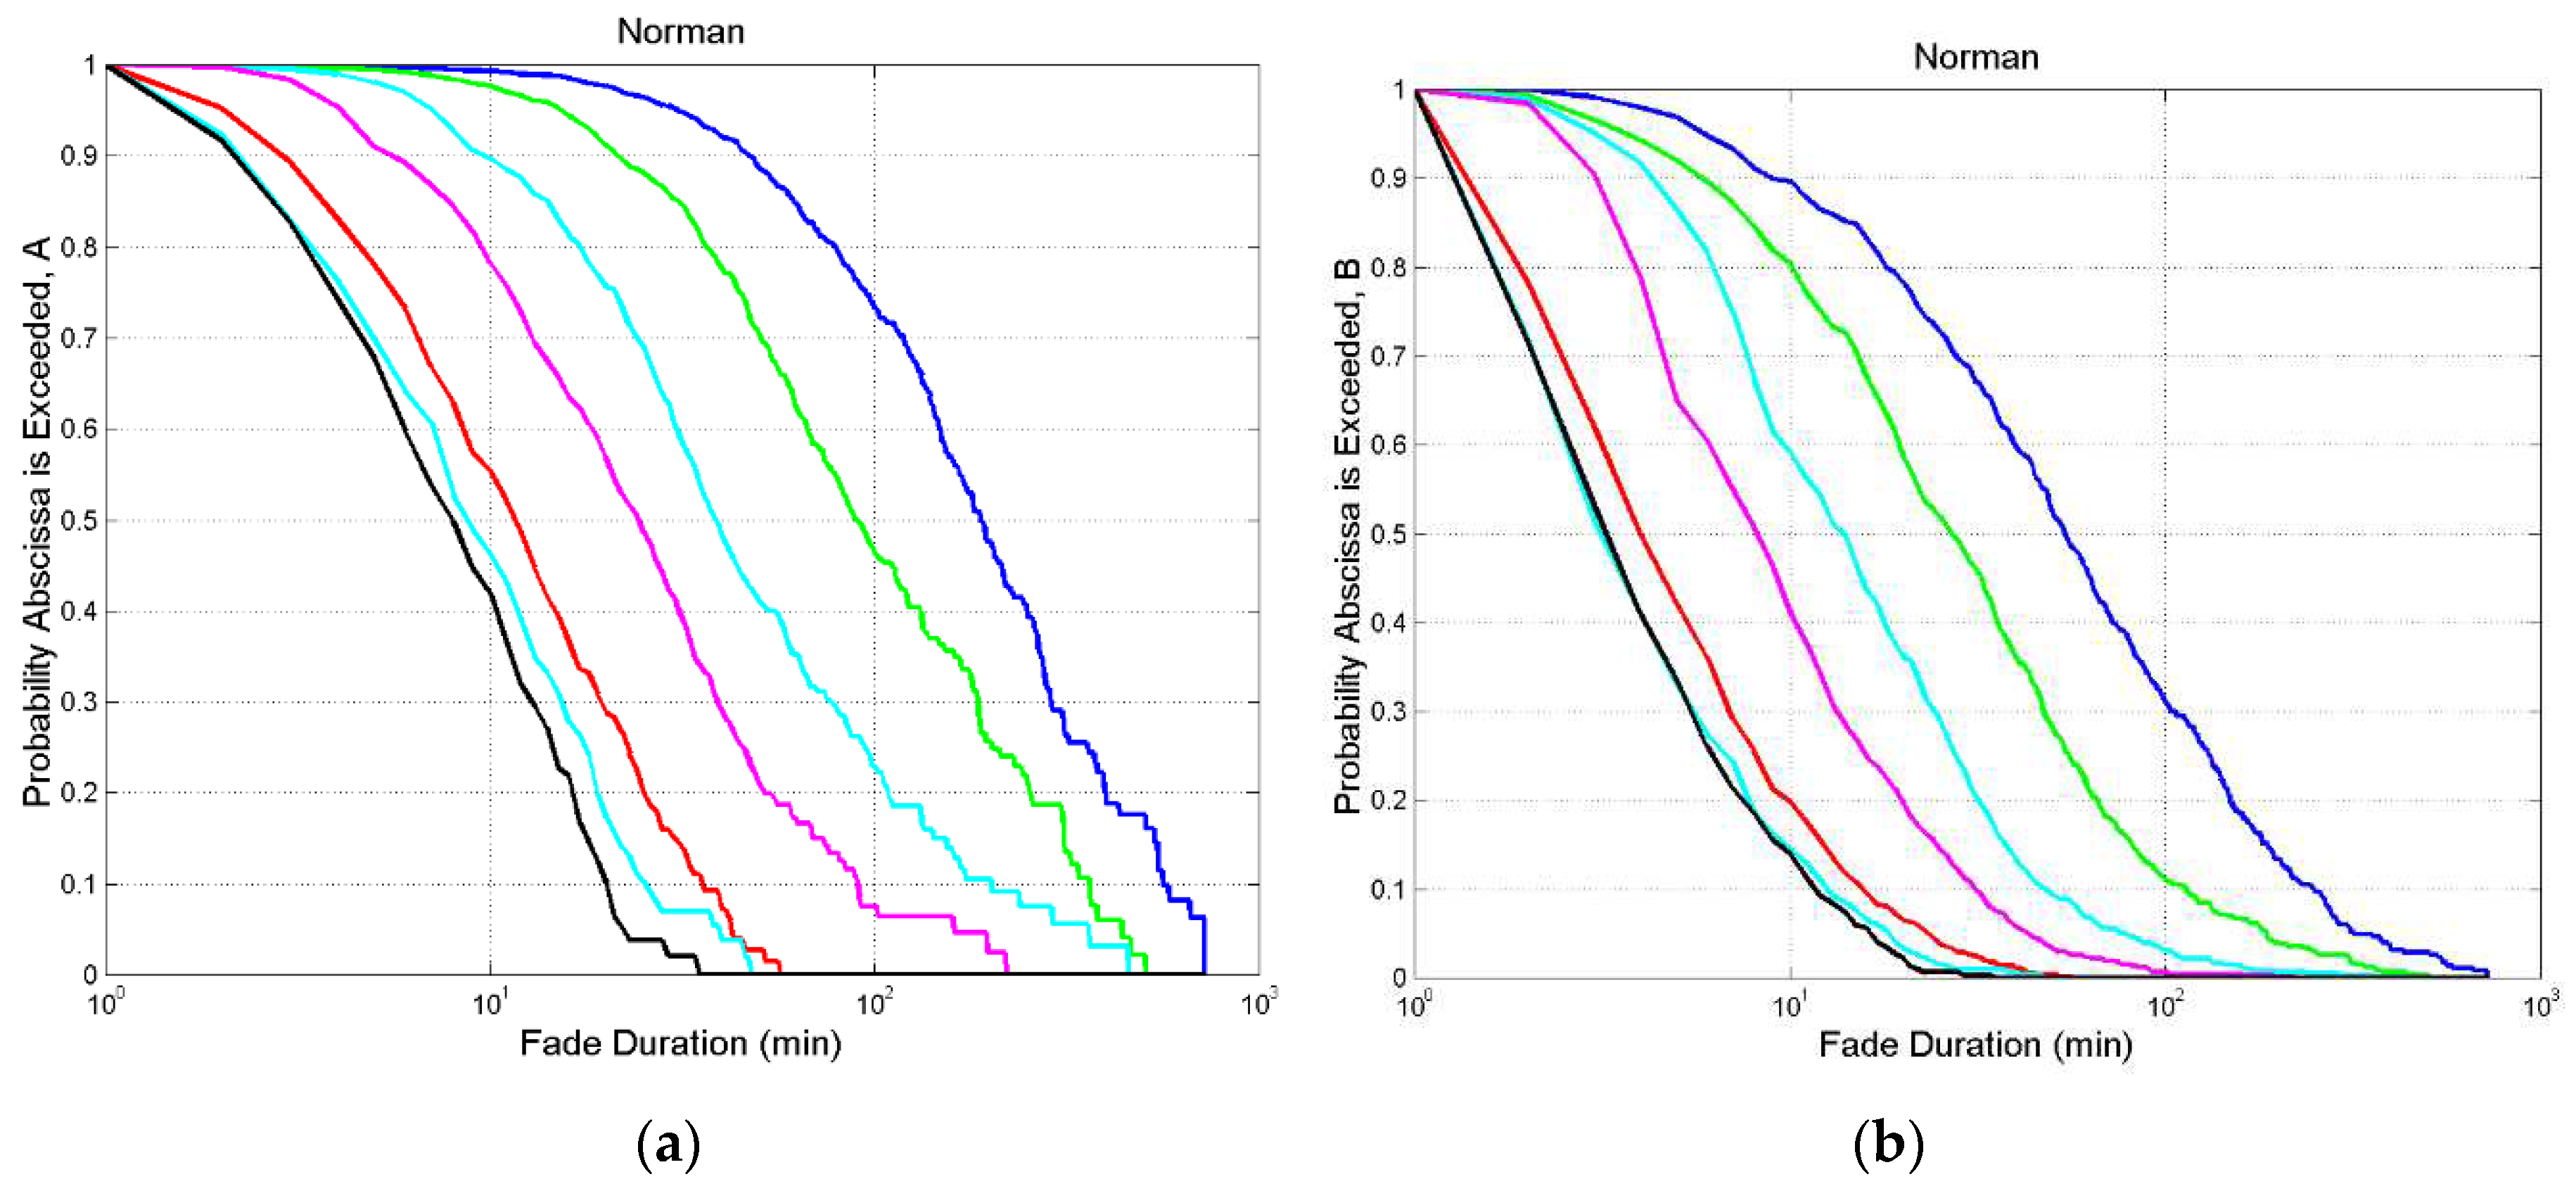
Figure A5.
Norman. (a) Probability distribution of exceeding the value indicated in abscissa at the following thresholds: 0 dB, blue; 3 dB, green; 6 dB, cyan; 10 dB, magenta; 20 dB, red; 29 dB, cyan and black.; (b) , same legend.
Figure A5.
Norman. (a) Probability distribution of exceeding the value indicated in abscissa at the following thresholds: 0 dB, blue; 3 dB, green; 6 dB, cyan; 10 dB, magenta; 20 dB, red; 29 dB, cyan and black.; (b) , same legend.
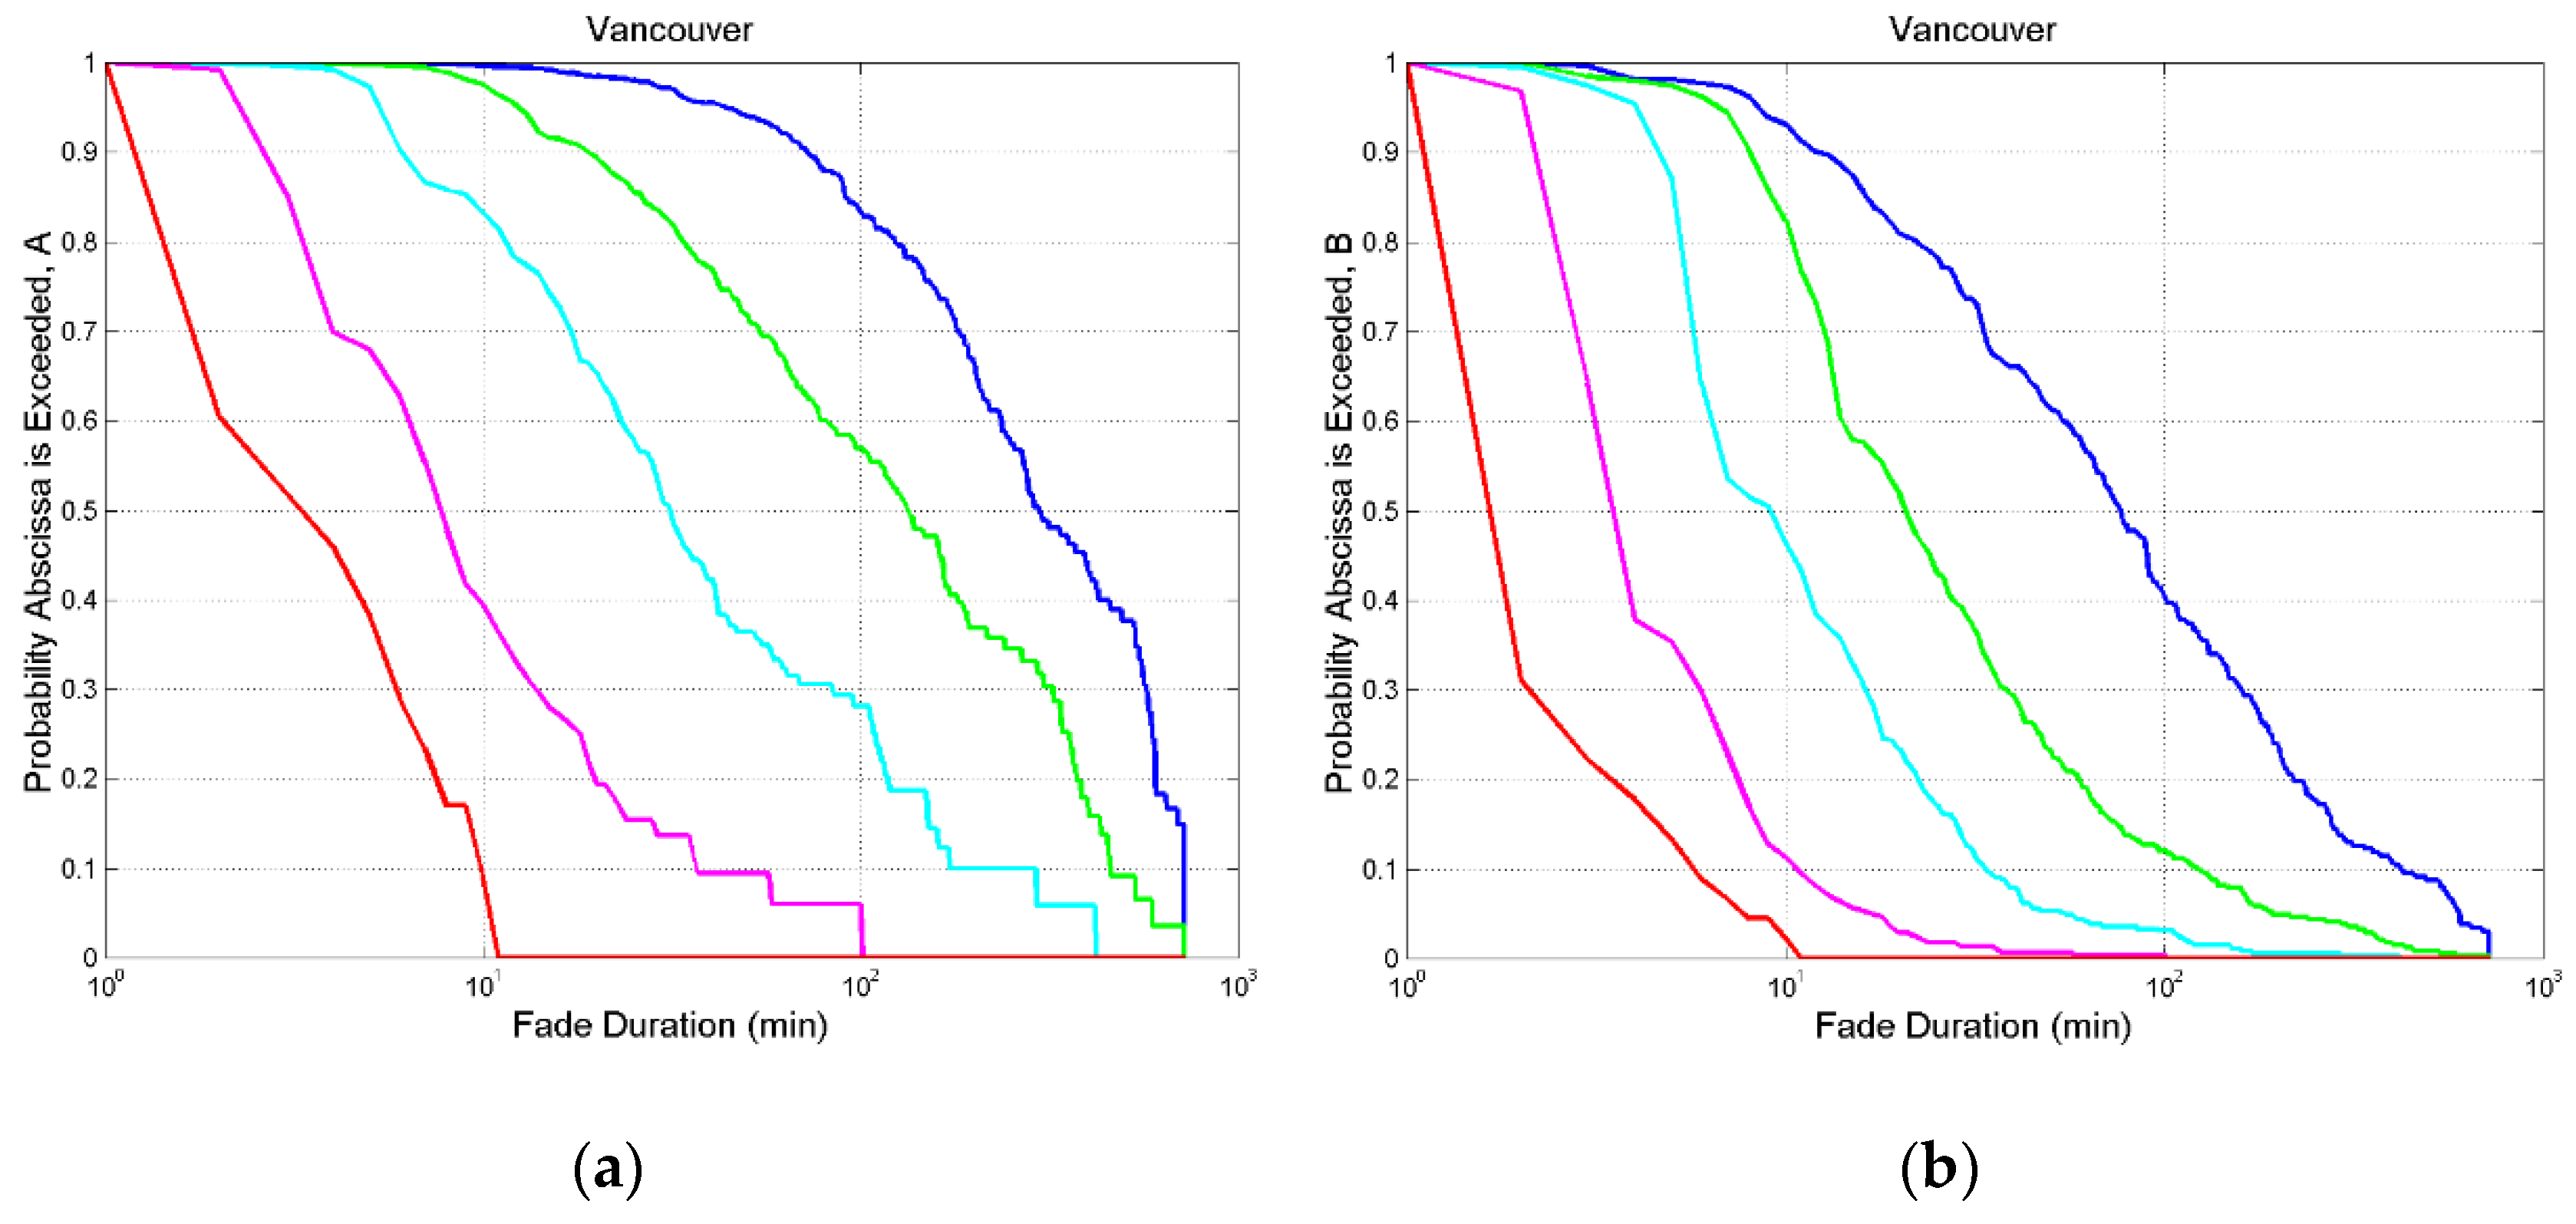
Figure A6.
Vancouver. (a) Probability distribution of exceeding the value indicated in abscissa at the following thresholds: 0 dB, blue; 3 dB, green; 6 dB, cyan; 10 dB, magenta; 20 dB, red; 29 dB, cyan and black.; (b) , same legend.
Figure A6.
Vancouver. (a) Probability distribution of exceeding the value indicated in abscissa at the following thresholds: 0 dB, blue; 3 dB, green; 6 dB, cyan; 10 dB, magenta; 20 dB, red; 29 dB, cyan and black.; (b) , same legend.
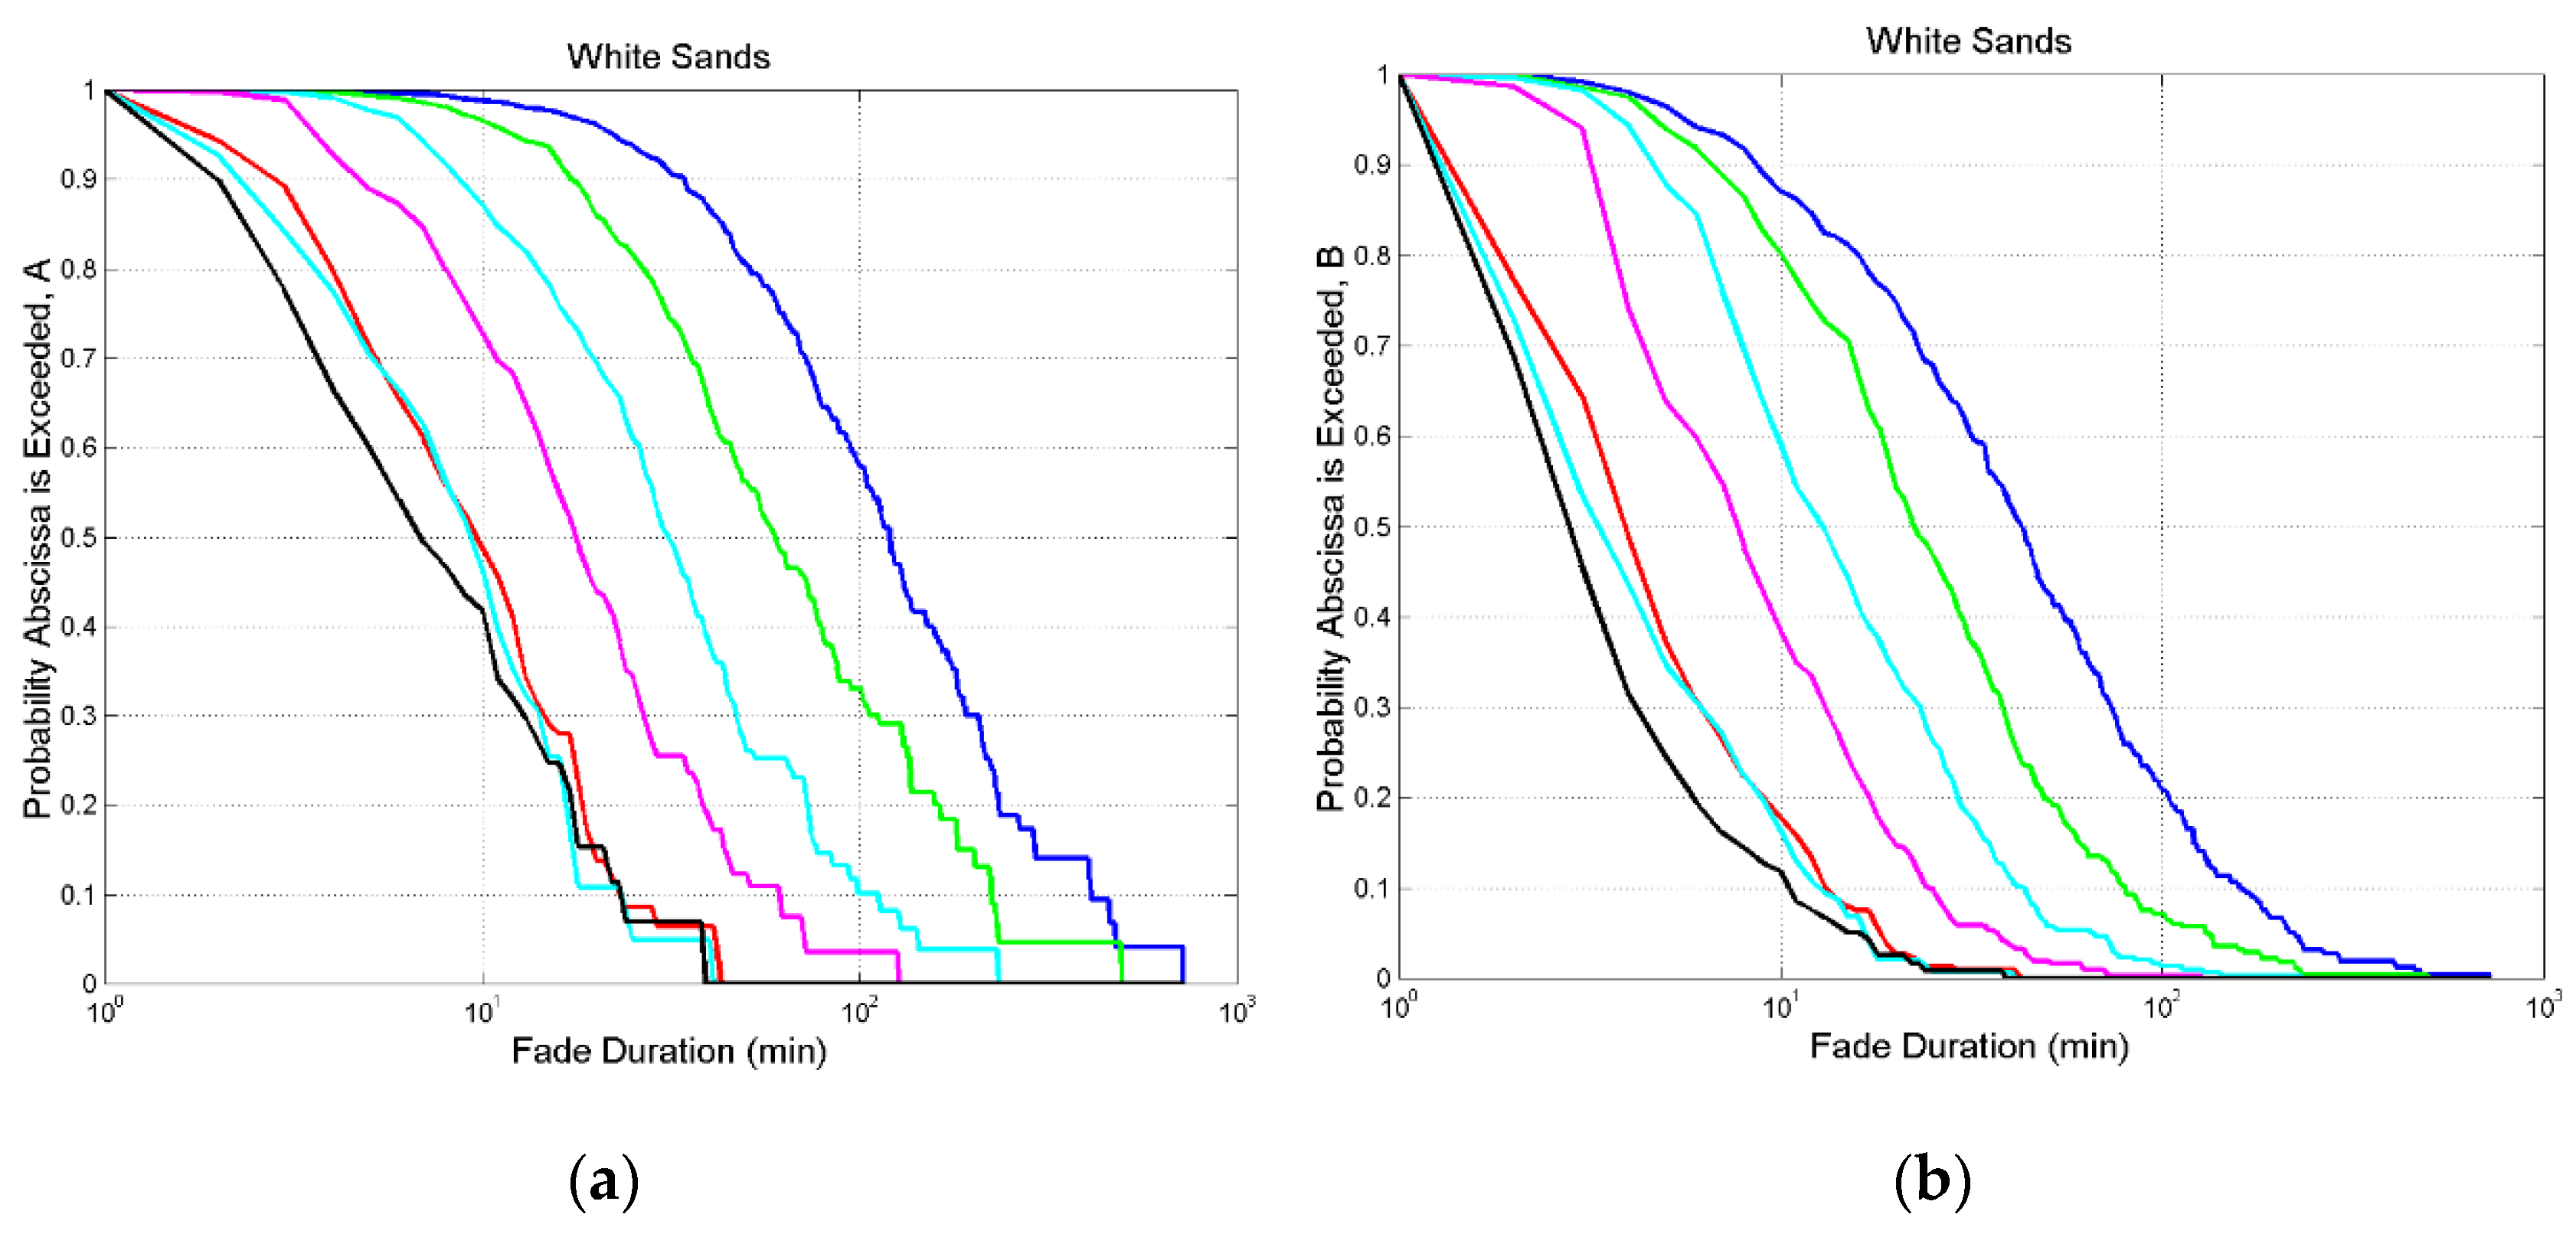
Figure A7.
White Sands. (a) Probability distribution of exceeding the value indicated in abscissa at the following thresholds: 0 dB, blue; 3 dB, green; 6 dB, cyan; 10 dB, magenta; 20 dB, red; 29 dB, cyan and black.; (b) , same legend.
Figure A7.
White Sands. (a) Probability distribution of exceeding the value indicated in abscissa at the following thresholds: 0 dB, blue; 3 dB, green; 6 dB, cyan; 10 dB, magenta; 20 dB, red; 29 dB, cyan and black.; (b) , same legend.
Appendix B
In this appendix we report the annual cumulative number of outage occurrences for some thresholds and sites listed in
Table 1.
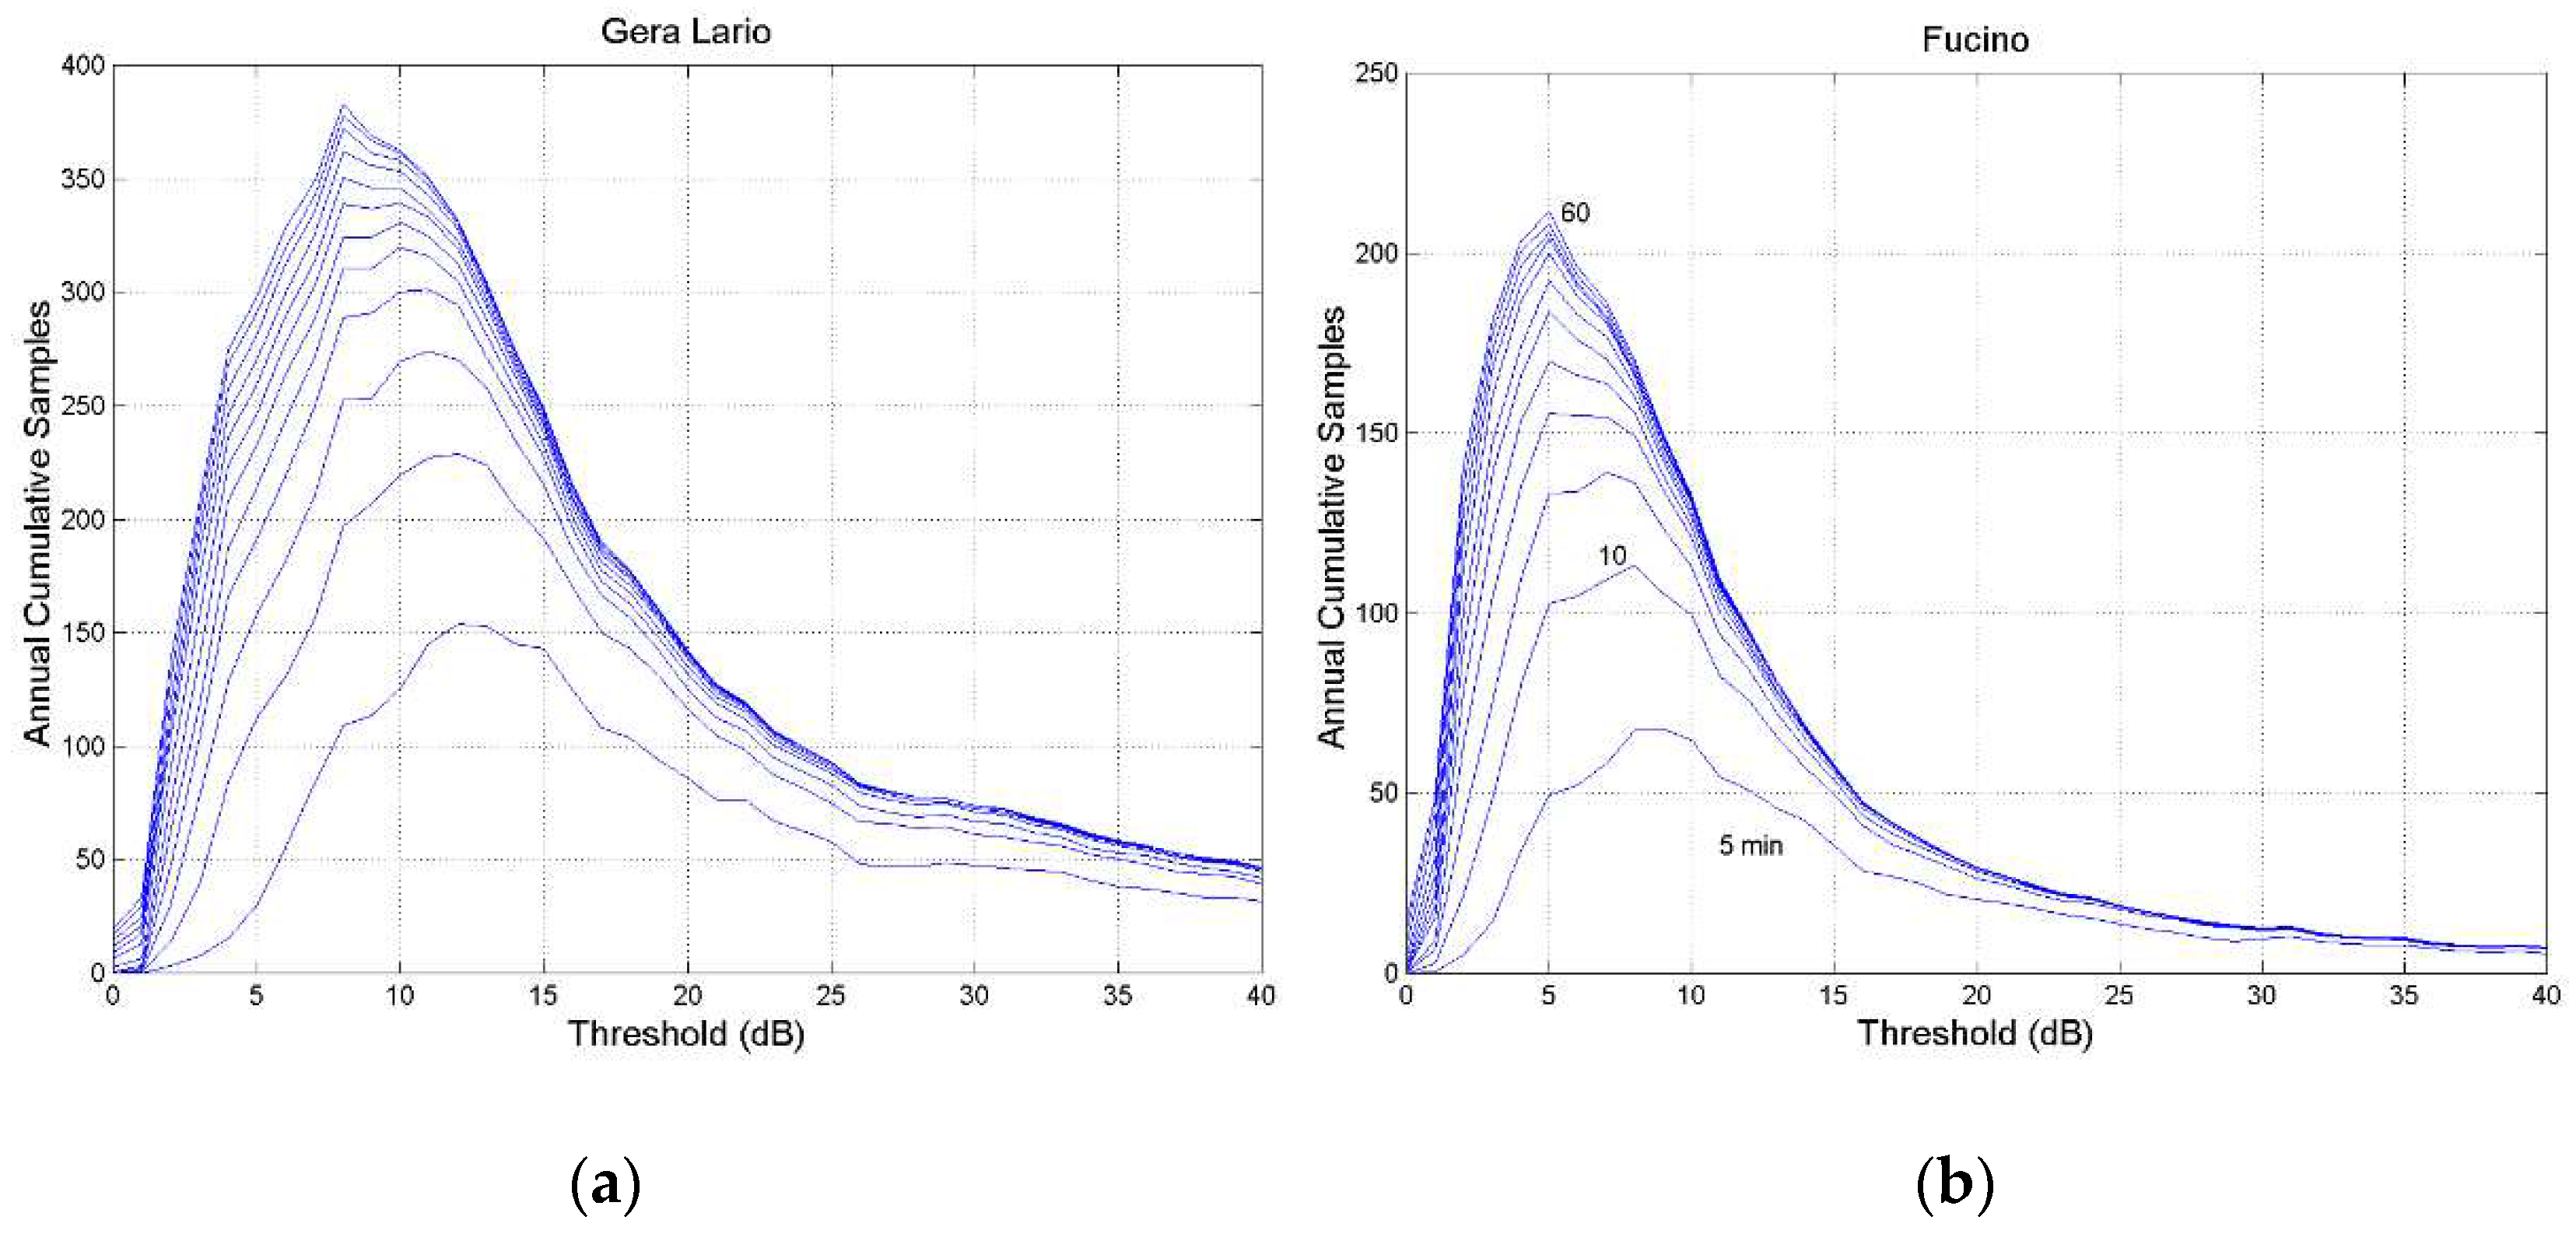
Figure A8.
Annual cumulative number of outage occurrences at the threshold indicated in abscissa, 80 GHz, circular polarization, zenith paths: (a) Gera Lario; (b) Fucino. The lines refer to constant fade duration, in 5–min steps, from min to . The axis has different range.
Figure A8.
Annual cumulative number of outage occurrences at the threshold indicated in abscissa, 80 GHz, circular polarization, zenith paths: (a) Gera Lario; (b) Fucino. The lines refer to constant fade duration, in 5–min steps, from min to . The axis has different range.
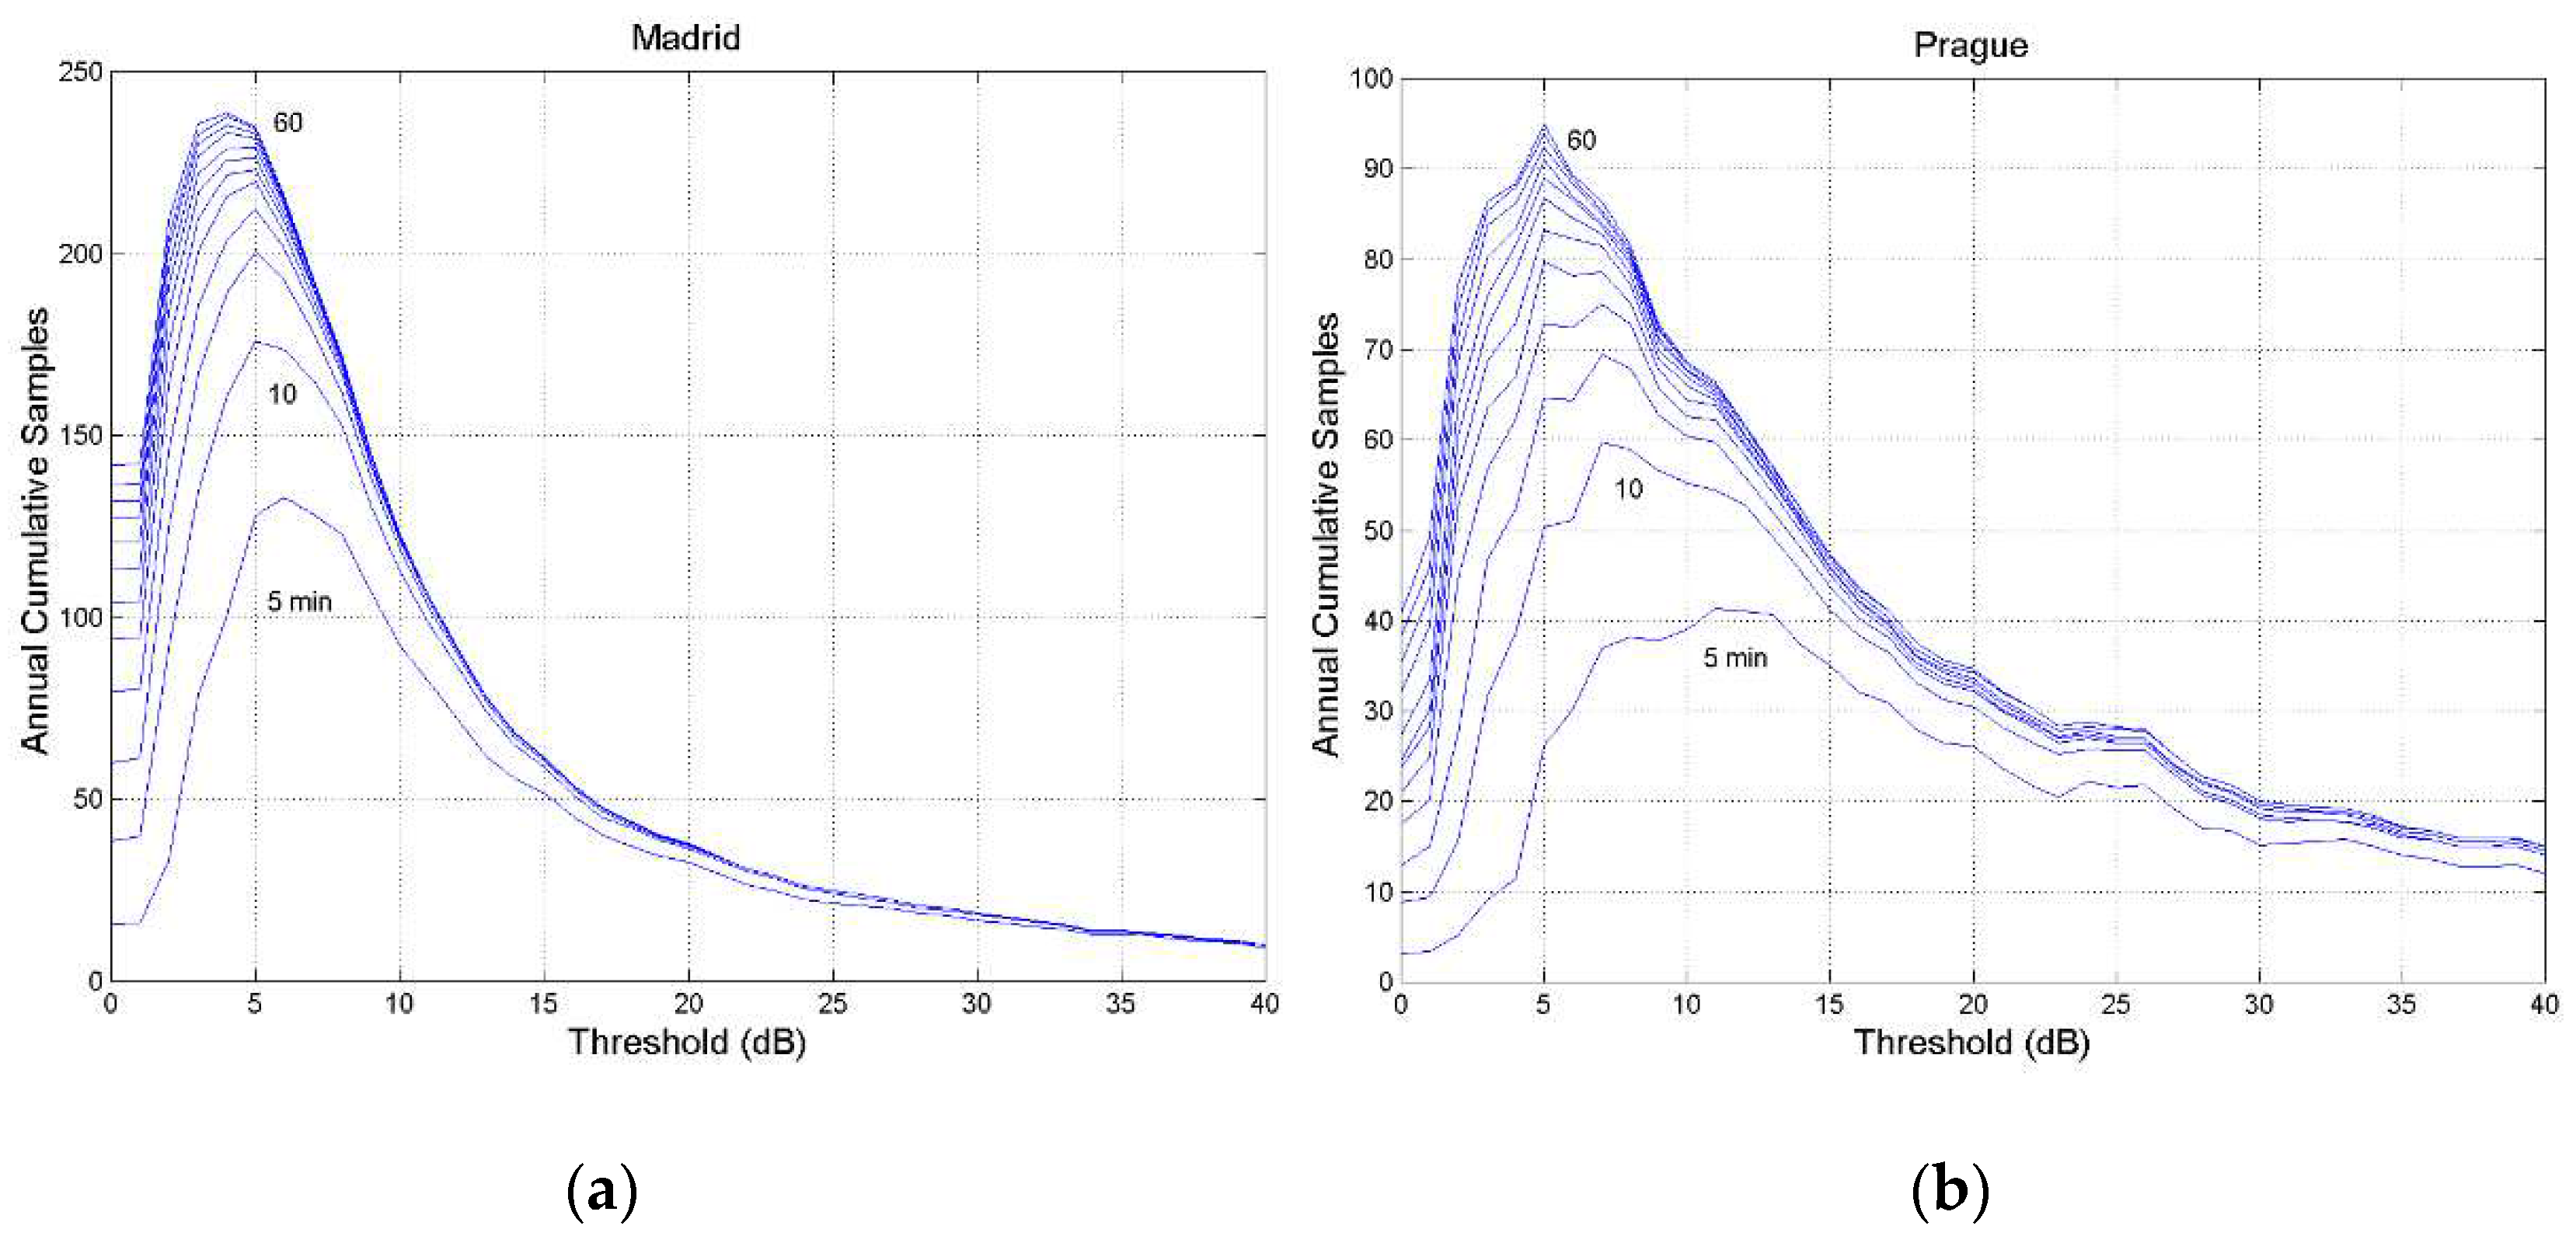
Figure A9.
Annual cumulative number of outage occurrences at the threshold indicated in abscissa, 80 GHz, circular polarization, zenith paths: (a) Madrid; (b) Prague. The lines refer to constant fade duration, in 5–min steps, from min to . The axis has different range.
Figure A9.
Annual cumulative number of outage occurrences at the threshold indicated in abscissa, 80 GHz, circular polarization, zenith paths: (a) Madrid; (b) Prague. The lines refer to constant fade duration, in 5–min steps, from min to . The axis has different range.
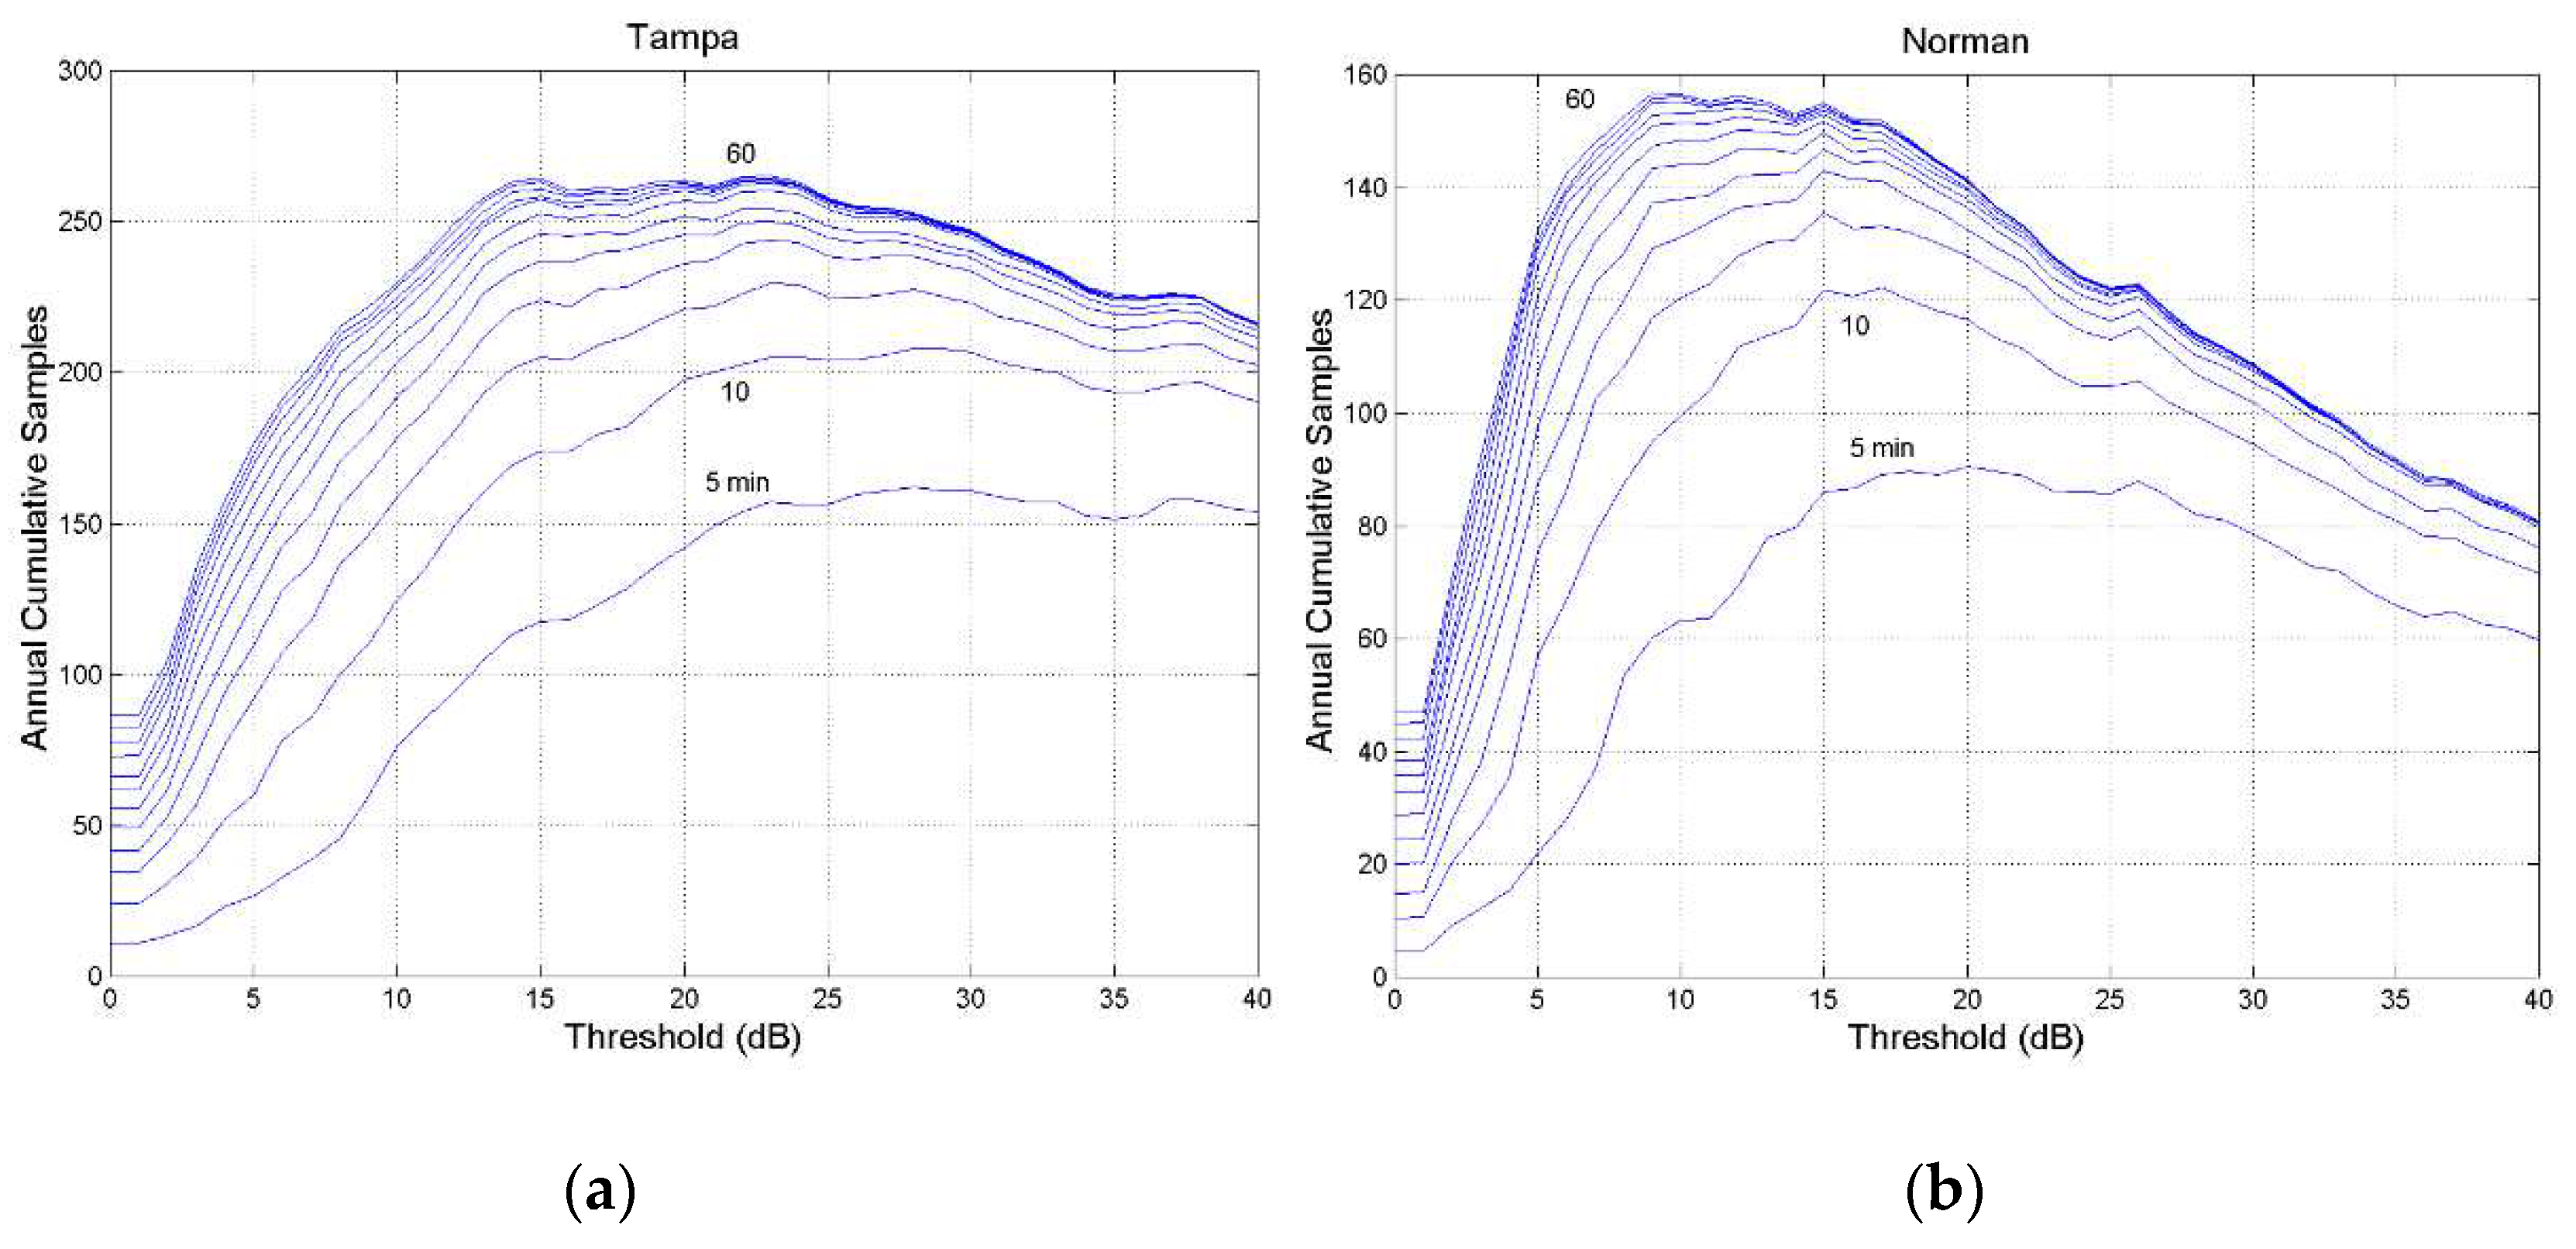
Figure A10.
Annual cumulative number of outage occurrences at the threshold indicated in abscissa, 80 GHz, circular polarization, zenith paths: (a) Tampa; (b) Norman. The lines refer to constant fade duration, in 5–min steps, from min to . The axis has different range.
Figure A10.
Annual cumulative number of outage occurrences at the threshold indicated in abscissa, 80 GHz, circular polarization, zenith paths: (a) Tampa; (b) Norman. The lines refer to constant fade duration, in 5–min steps, from min to . The axis has different range.
Figure A11.
Annual cumulative number of outage occurrences at the threshold indicated in abscissa, 80 GHz, circular polarization, zenith paths: (a) White Sands; (b) Vancouver. The lines refer to constant fade duration, in 5–min steps, from min to . The axis has different range.
Figure A11.
Annual cumulative number of outage occurrences at the threshold indicated in abscissa, 80 GHz, circular polarization, zenith paths: (a) White Sands; (b) Vancouver. The lines refer to constant fade duration, in 5–min steps, from min to . The axis has different range.
Appendix C
In this appendix we report
(y–axis) versus
x–axis for thresholds from 0 to 40 dB, for the sites listed in
Table 1.
Figure A12.
(axis) versus PS,A(D) x−axis, for thresholds from 0 to 40 dB, 80 GHz, circular polarization, zenith paths: (a) Gera Lario; (b) Fucino. The red line is drawn from Equation (3); the cyan line is drawn from Eq. (5).
Figure A12.
(axis) versus PS,A(D) x−axis, for thresholds from 0 to 40 dB, 80 GHz, circular polarization, zenith paths: (a) Gera Lario; (b) Fucino. The red line is drawn from Equation (3); the cyan line is drawn from Eq. (5).
Figure A12.
(axis) versus PS,A(D) x−axis, for thresholds from 0 to 40 dB, 80 GHz, circular polarization, zenith paths: (a) Madrid; (b) Prague. The red line is drawn from Equation (3); the cyan line is drawn from Eq. (5).
Figure A12.
(axis) versus PS,A(D) x−axis, for thresholds from 0 to 40 dB, 80 GHz, circular polarization, zenith paths: (a) Madrid; (b) Prague. The red line is drawn from Equation (3); the cyan line is drawn from Eq. (5).
Figure A13.
(axis) versus PS,A(D) x−axis, for thresholds from 0 to 40 dB, 80 GHz, circular polarization, zenith paths: (a) Tampa; (b) Norman. The red line is drawn from Equation (3); the cyan line is drawn from Eq. (5).
Figure A13.
(axis) versus PS,A(D) x−axis, for thresholds from 0 to 40 dB, 80 GHz, circular polarization, zenith paths: (a) Tampa; (b) Norman. The red line is drawn from Equation (3); the cyan line is drawn from Eq. (5).
Figure A14.
(axis) versus PS,A(D) x−axis, 80 GHz, circular polarization, zenith paths: (a) White Sands, for thresholds from 0 to 40 dB; (b) Vancouver, for thresholds from 0 to 20 dB. The red line is drawn from Equation (3); the cyan line is drawn from Eq. (5).
Figure A14.
(axis) versus PS,A(D) x−axis, 80 GHz, circular polarization, zenith paths: (a) White Sands, for thresholds from 0 to 40 dB; (b) Vancouver, for thresholds from 0 to 20 dB. The red line is drawn from Equation (3); the cyan line is drawn from Eq. (5).
References
- Matricciani, E. Geocentric Spherical Surfaces Emulating the Geostationary Orbit at Any Latitude with Zenith Links. Future Internet 2020, 12, 16. [Google Scholar] [CrossRef]
- Matricciani, E.; Riva, C.; Luini, L. Tropospheric Attenuation in GeoSurf Satellite Constellations. Remote Sens. 2021, 13, 5180. [Google Scholar] [CrossRef]
- Matricciani, E.; Riva, C. Outage Probability versus Carrier Frequency in GeoSurf Satellite Constellations with Radio–Links Faded by Rain. Telecom 2022, 3, 504–513. [Google Scholar] [CrossRef]
- Matricciani, E. Physical–mathematical model of the dynamics of rain attenuation based on rain rate time series and a two–layer vertical structure of precipitation. Radio Science 1996, 31, 281–295. [Google Scholar] [CrossRef]
- Matricciani, E.; Riva, C. Transfer–functions and Linear Distortions in Ultra–Wideband Channels Faded by Rain in GeoSurf Satellite Constellations. Future Internet 2023, 15, 27. [Google Scholar] [CrossRef]
- Turin, G.L. Introduction to spread spectrum antimultipath techniques and their application to urban digital radio. Proceedings of the IEEE 1980, 328–353. [Google Scholar] [CrossRef]
- Pickholtz, R.; Schilling, D.; Milstein, L. Theory of spread–spectrum communications – A tutorial. IEEE Trans. On Communications 1982, 855–884. [Google Scholar] [CrossRef]
- Viterbi, A.J. CDMA Principles of Spread Spectrum Communications, 1995, Addinson–Wesly, Reading, MA.
- Dinan, E.H.; Jabbari, B. Spreading codes for direct sequence CDMA and wideband CDMA celluar networks, IEEE Communication Magazine, 1998, September, 48–54.
- Veeravalli, V.V. Mantravadi, The coding–spreading trade–off in CDMA systems. IEEE Trans. On Selecteded Areas in Communications 2002, 396–408. [Google Scholar] [CrossRef]
- Matricciani, E.; Magarini, M.; Riva, C. Feasibility of Ultra-Wideband Channels at Millimeter Wavelengths Faded by Rain in GeoSurf Satellite Constellations. Telecom 2023, 4, 732–745. [Google Scholar] [CrossRef]
- Kelmendi, A.; Hrovat, A.; Mohorčič, M.; Vilhar, A. Prediction Model of Fade Duration Statistics for Satellite Communications at Ka and Q bands. IEEE Transactions on Antennas and Propagation 2019, 67, 5519–5531. [Google Scholar] [CrossRef]
- Pimienta-del-Valle, D. , M. Riera, J.M.; Garcia-del-Pino, P.; Siles, G.A. Alphasat Experiment in Madrid: Modeling Considerations on Fade and Inter-Fade Durations, 2018, 12th European Conference on Antennas and Propagation (EuCAP 2018, London, UK). [CrossRef]
- Badron, K.; Ismail, A.F.; Din, J.; Tharek, A.R. Rain induced attenuation studies for V-band satellite communication in tropical region. Journal of Atmospheric and Solar-Terrestrial Physics 2011, 73, 601–610. [Google Scholar] [CrossRef]
- Chakraborty, S.; Verma, P.; Paudel, B.; Shukla, A.; Das, S. Validation of Synthetic Storm Technique for Rain Attenuation Prediction Over High-Rainfall Tropical Region. IEEE Geoscience and Remote Sensing Letter 2021, 19, 1–4. [Google Scholar] [CrossRef]
- Mandeep, J.S. Fade duration statistics for Ku-band satellite links. Advances in Space Research 2013, 52, 445–450. [Google Scholar] [CrossRef]
- Dao, H.; Al-Khateeb, K.; Ahmad Fadzil Ismail, A.F. Analysis of rain fade duration over satellite-earth path at Ku-Band in tropics, 2012 International Conference on Computer and Communication Engineering (ICCCE). Kuala Lumpur, Malaysia. [CrossRef]
- García-del-Pino, P.J.M.; Riera, J-M.A.; Benarroch, A. Fade and interfade duration statistics on an Earth-space link at 50 GHz. IET Microwaves Antennas & Propagation 2011, 5, 790–794. [Google Scholar] [CrossRef]
- Cheffena, M.; Tjelta, T.; Breivik, T.O. Fade duration statistics of millimetre wavelength terrestrial line-of-sight links, Proceedings of the Fourth European Conference on Antennas and Propagation, 2010, Barcelona, Spain, 1-5.
- Boulanger, X.; Gabard, B.; Casadebaig, L.; Castanet, L. Four Years of Total Attenuation Statistics of Earth-Space Propagation Experiments at Ka-Band in Toulouse. IEEE Transactions on Antennas and Propagation 2015, 63, 2203–2214. [Google Scholar] [CrossRef]
- Nandi, D.; Pérez-Fontán, F.; Pastoriza-Santos, V.; Machado, M. Analysis of rain fade characteristics from experimental satellite measurements at Ka/Q bands for a temperate location Vigo, Spain. Advances in Space Research 2021, 68, 1754–1760. [Google Scholar] [CrossRef]
- Siat Ling Jong, S.L.; Riva, C.; D’Amico, M.; Lam, H.Y.; Yunus, M.M.; Din, J. Performance of synthetic storm technique in estimating fade dynamics in equatorial Malaysia. International Journal of satellite communications and networking 2018, 36. [Google Scholar] [CrossRef]
- Garcia-Rubia, J.M.; Riera, J.M.; Garcia-del-Pino, P.; Pimienta-del-Valle, D.; Siles, G.A. Fade and Interfade Duration Characteristics in a Slant-Path Ka-Band Link. IEEE Transactions on Antennas and Propagation 2017, 65, 7198–7206. [Google Scholar] [CrossRef]
- Chakraborty, S.; Chakraborty, M.; Das, S. Second order experimental statistics of rain attenuation at Ka band in a tropical location. Advances in Space Research 2012, 67, 4043–4053. [Google Scholar] [CrossRef]
- Siat Ling Jong, S.L.; Riva, C.; D’Amico, M.; Lam, H.Y.; Yunus, M.M.; Din, J. Performance of synthetic storm technique in estimating fade dynamics in equatorial Malaysia. International Journal of satellite communications and networking 2018, 36. [Google Scholar] [CrossRef]
- Papafragkakis, A. Z.; Kourogiorgas, C.I.; Panagopoulos, A.D.; Ventouras, S. Second Order Excess Attenuation Statistics in Athens, Greece at 19.701 GHz using ALPHASAT, 2020, 12th International Symposium on Communication Systems, Networks and Digital Signal Processing (CSNDSP), Porto, Portugal,. [CrossRef]
- Kelmendi, A.; Hrovat, A.; Mohorčič, M.; Švigelj, A. Alphasat Propagation Measurements at Ka- and Q- Bands in Ljubljana: Three Years’ Statistical Analysis, 2021, IEEE Antennas and Wireless Propagation Letters, 20, 2, 174-178. [CrossRef]
- Recommendation ITU–R P.618–14. Propagation data and prediction methods required for the design of Earth-space telecommunication systems; (8) 2023, ITU: Geneva, Switzerland.
- Matricciani, E. Prediction of fade duration due to rain in satellite communication systems. Radio Science 1997, 22, 935–941. [Google Scholar] [CrossRef]
- Matricciani, E. Duration of rain-induced fades of signal from SIRIO at 11. 6 GHz, Electronics Letters 1981, 17, 29–30. [Google Scholar] [CrossRef]
Figure 2.
Annual probability distribution (%) of exceeding the value indicated in abscissa at the indicated sites. Spino d’Adda: continuous blue line; Gera Lario: continuous black line; Fucino: continuous red line; Madrid: continuous green line; Prague: continuous magenta line; Tampa: dashed red line; Norman: dashed magenta line; White Sands: dashed green line; Vancouver: dashed blue line.
Figure 3.
Annual probability distribution (%) of exceeding the value indicated in abscissa – 80 GHz, circular polarization, zenith paths – at the indicated sites. Spino d’Adda: continuous blue line; Gera Lario: continuous black line; Fucino: continuous red line; Madrid: continuous green line; Prague: continuous magenta line; Tampa: dashed red line; Norman: dashed magenta line; White Sands: dashed green line; Vancouver: dashed blue line.
Figure 4.
Spino d’Adda. (a) Probability distribution of exceeding the value indicated in abscissa at the following thresholds: 0 dB, blue; 3 dB, green; 6 dB, cyan; 10 dB, magenta; 20 dB, red; 29 dB, cyan and black.; (b) , same legend.
Figure 4.
Spino d’Adda. (a) Probability distribution of exceeding the value indicated in abscissa at the following thresholds: 0 dB, blue; 3 dB, green; 6 dB, cyan; 10 dB, magenta; 20 dB, red; 29 dB, cyan and black.; (b) , same legend.
Figure 5.
Tampa. (a) Probability distribution of exceeding the value indicated in abscissa at the following thresholds: 0 dB, blue; 3 dB, green; 6 dB, cyan; 10 dB, magenta; 20 dB, red; 29 dB, cyan and black.; (b) , same legend.
Figure 5.
Tampa. (a) Probability distribution of exceeding the value indicated in abscissa at the following thresholds: 0 dB, blue; 3 dB, green; 6 dB, cyan; 10 dB, magenta; 20 dB, red; 29 dB, cyan and black.; (b) , same legend.
Figure 6.
Median fade duration in process B (axis) versus the median fade duration in process A (axis) at the indicated sites. Spino d’Adda: continuous blue line; Gera Lario: continuous black line; Fucino: continuous red line; Madrid: continuous green line; Prague: continuous magenta line; Tampa: dashed red line; Norman: dashed magenta line; White Sands: dashed green line; Vancouver: dashed blue line.
Figure 7.
Average annual number of outage occurrences at the threshold indicated in abscissa – 80 GHz, circular polarization, zenith paths – at the indicated sites. Spino d’Adda: continuous blue line; Gera Lario: continuous black line; Fucino: continuous red line; Madrid: continuous green line; Prague: continuous magenta line; Tampa: dashed red line; Norman: dashed magenta line; White Sands: dashed green line; Vancouver: dashed blue line.
Figure 8.
Annual cumulative number of outage occurrences at the threshold indicated in abscissa, 80 GHz, circular polarization, zenith paths: (a), at Spino d’Adda; (b) Tampa. The continuous lines are drawn at equal fade duration, in 5–min steps from min to . The y–axis has different range.
Figure 8.
Annual cumulative number of outage occurrences at the threshold indicated in abscissa, 80 GHz, circular polarization, zenith paths: (a), at Spino d’Adda; (b) Tampa. The continuous lines are drawn at equal fade duration, in 5–min steps from min to . The y–axis has different range.
Figure 9.
(y–axis) versus PS,A(D) x–axis, for thresholds from 0 to 40 dB, 80 GHz. The continuous red line is drawn from Equation (3); the continuous cyan line is drawn from Eq. (5). (a) Spino d’Adda; (b) all sites.
Figure 9.
(y–axis) versus PS,A(D) x–axis, for thresholds from 0 to 40 dB, 80 GHz. The continuous red line is drawn from Equation (3); the continuous cyan line is drawn from Eq. (5). (a) Spino d’Adda; (b) all sites.
Table 1.
Geographical coordinates, altitude (km), number of years of continuous rain rate time series measurements at the indicated sites.
Table 1.
Geographical coordinates, altitude (km), number of years of continuous rain rate time series measurements at the indicated sites.
| Site |
Latitude N (°) |
Longitude E (°) |
(m) |
Rain Rate (Years) |
| Spino d’Adda (Italy) |
45.4 |
9.5 |
84 |
8 |
| Gera Lario (Italy) |
46.2 |
9.4 |
210 |
5 |
| Fucino (Italy) |
42.0 |
13.6 |
680 |
5 |
| Madrid (Spain) |
40.4 |
356.3 |
630 |
8 |
| Prague (Czech Republic) |
50.0 |
14.5 |
250 |
5 |
| Tampa (Florida) |
28.1 |
277.6 |
50 |
4 |
| Norman (Oklahoma) |
35.2 |
262.6 |
420 |
4 |
| White Sands (New Mexico) |
32.5 |
253.4 |
1463 |
5 |
| Vancouver (British Columbia) |
49.2 |
236.8 |
80 |
3 |
|
Disclaimer/Publisher’s Note: The statements, opinions and data contained in all publications are solely those of the individual author(s) and contributor(s) and not of MDPI and/or the editor(s). MDPI and/or the editor(s) disclaim responsibility for any injury to people or property resulting from any ideas, methods, instructions or products referred to in the content. |
© 2024 by the authors. Licensee MDPI, Basel, Switzerland. This article is an open access article distributed under the terms and conditions of the Creative Commons Attribution (CC BY) license (http://creativecommons.org/licenses/by/4.0/).
