1. Introduction
Recent advancements in artificial intelligence (AI)-based prediction of the El Niño-Southern Oscillation (ENSO) using sea surface temperature (SST) have marked significant progress, yet gaps remain in the field. The introduction of a hidden Markov model by [
1] and [
2] development of a self-attention-based neural network, the 3D-Geoformer, have pushed the boundaries of prediction lead times. [
3] employed explainable deep learning to enhance understanding of global SST influences, while [
4] and [
5] introduced models like MIMO and Unet-LSTM for multi-scale SST prediction with high accuracy. Despite these strides, challenges persist in integrating subsurface ocean information and generalizing these models across different ocean basins. Meanwhile, explainable Artificial Intelligence (XAI) is a rapidly evolving field that focuses on making machine learning models more transparent and understandable to humans.
The landscape of ENSO prediction methodologies is diverse, ranging from traditional statistical models such as Canonical Correlation Analysis (CCA) and Empirical Orthogonal Functions (EOFs) to intricate dynamical simulations grounded in General Circulation Models (GCMs). Recently, the advent of XAI has added a new dimension to this field, offering nuanced approaches to model complex climatic systems. XAI techniques aim to provide insights into how AI systems make decisions, especially in complex tasks like spatial drought prediction. One such study emphasizes the development of explainable deep learning models to shed light on ENSO prediction [
6].
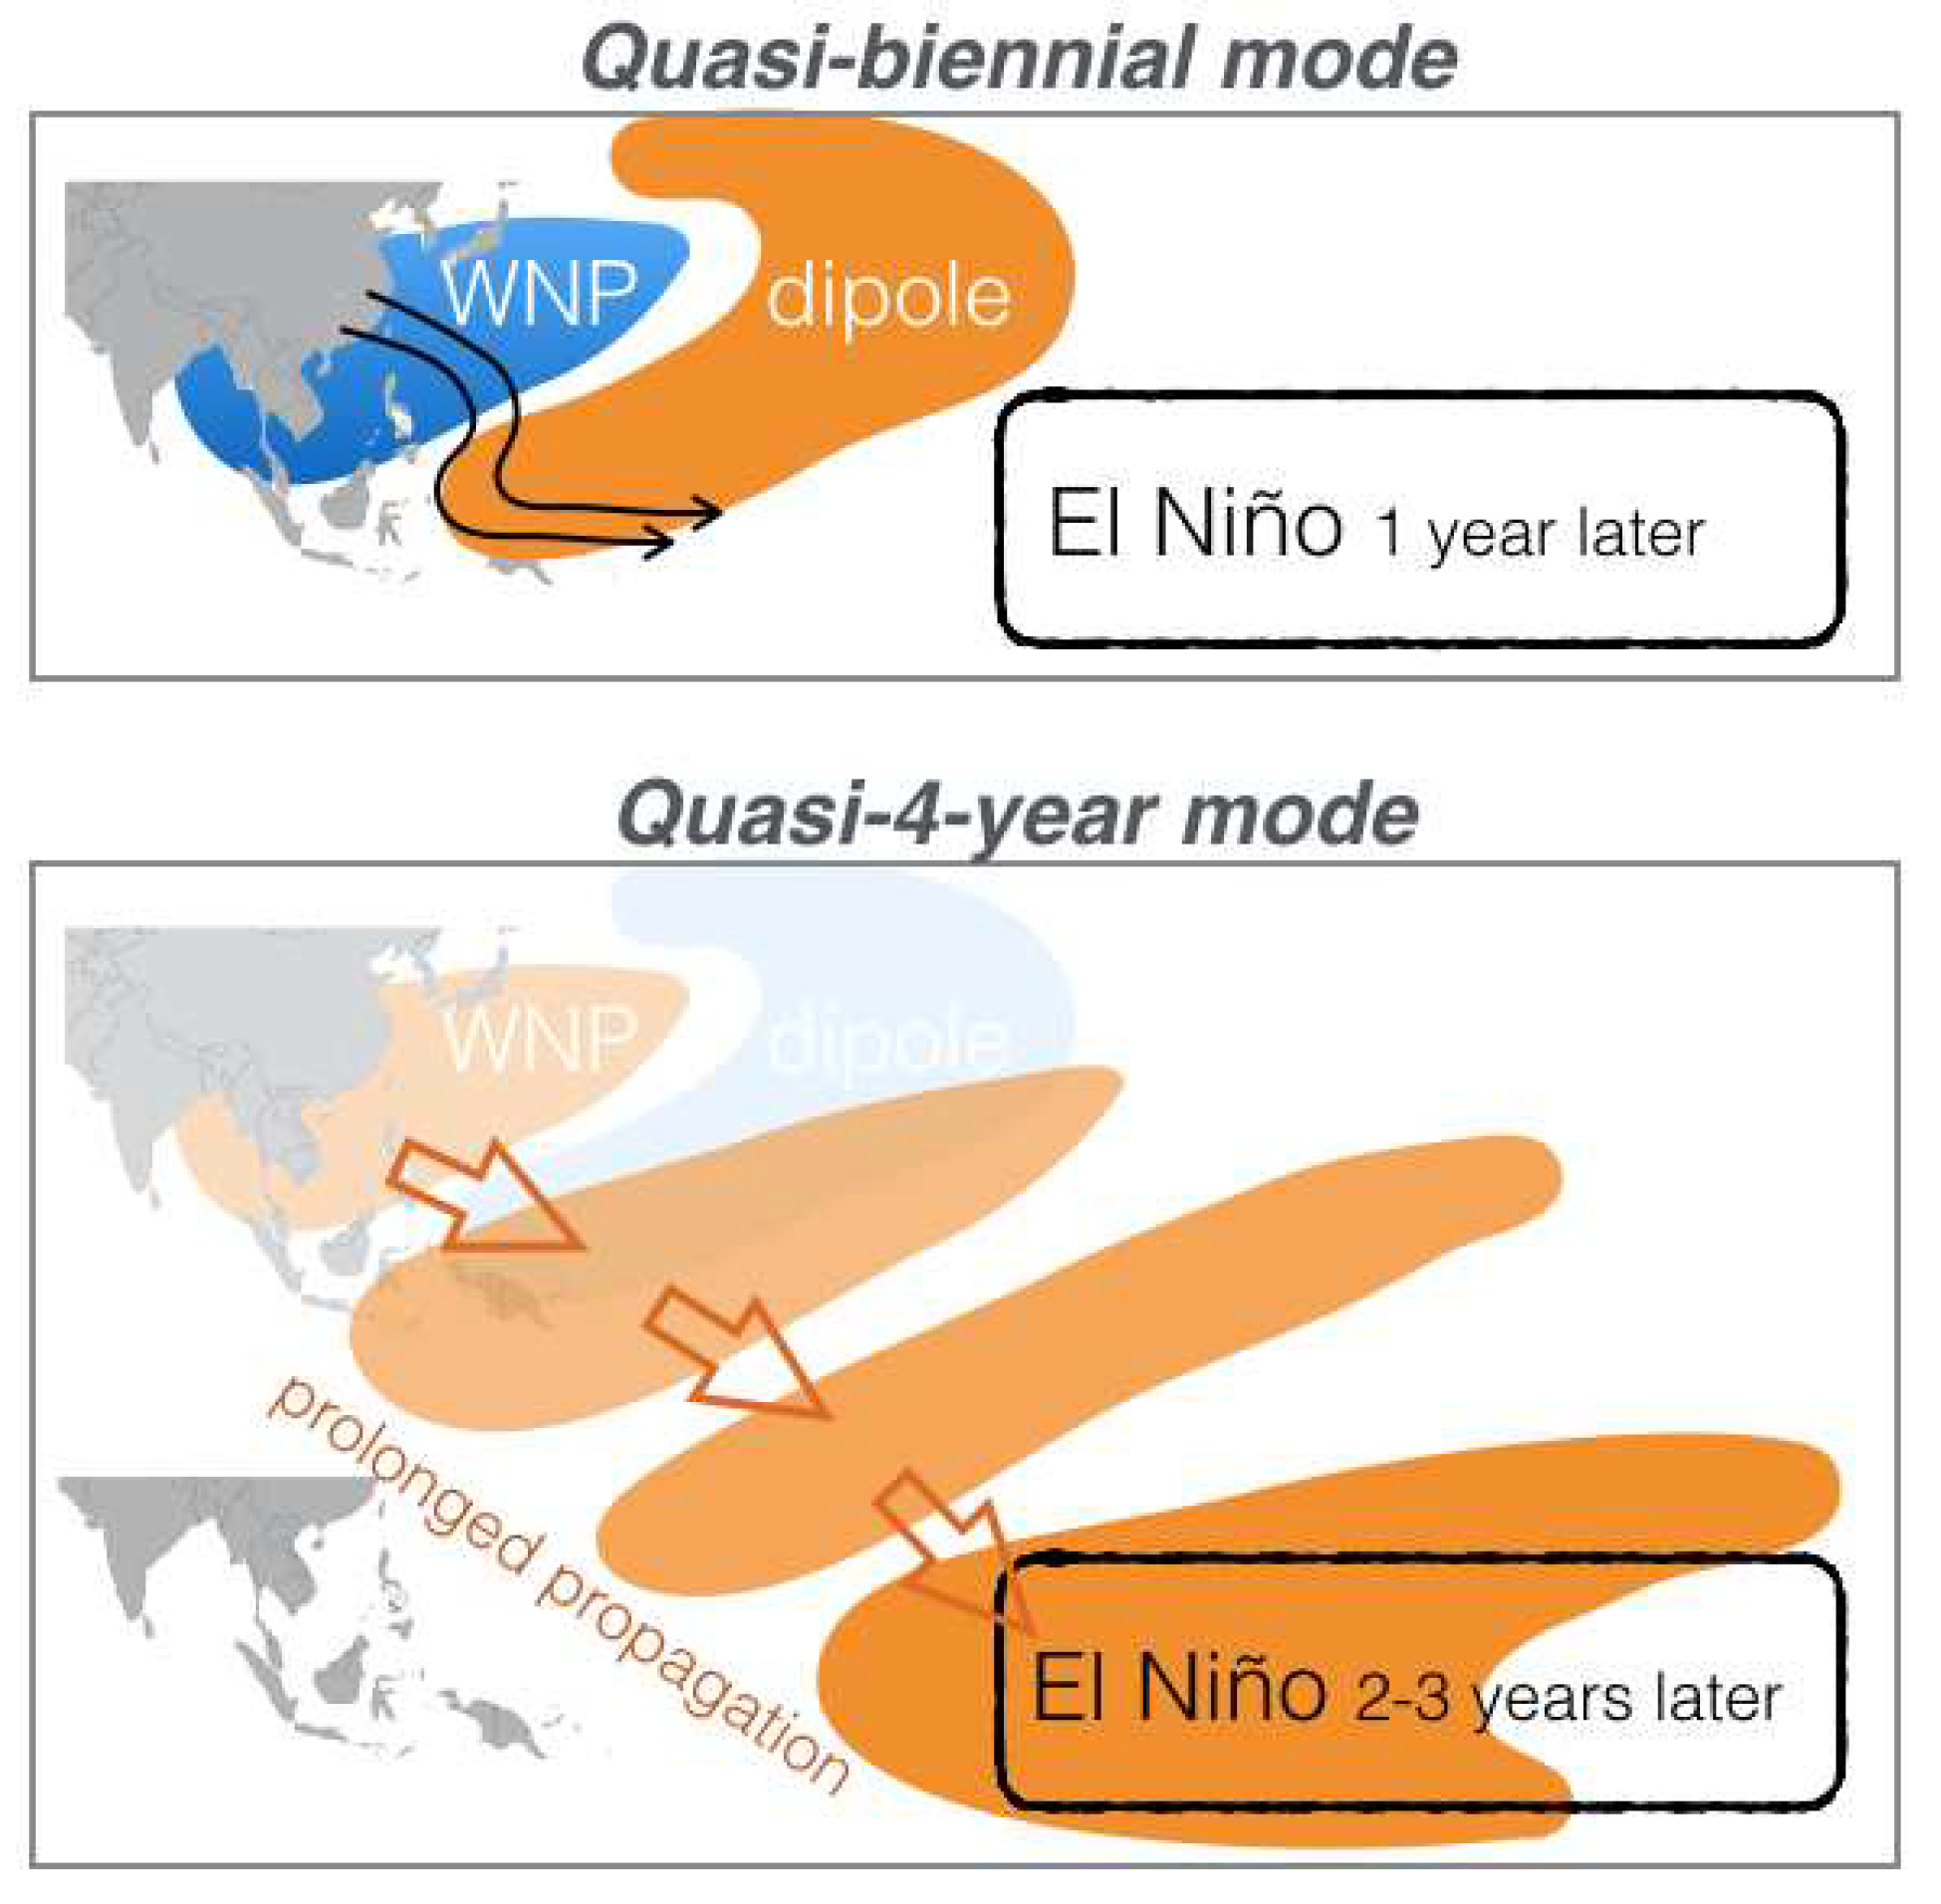
Despite significant advancements in understanding ENSO, the field has reached a plateau regarding prediction accuracy, especially concerning long-term forecasts. Warm and cold sea surface temperature (SST) anomalies propagate from the western North Pacific (WNP) to the central–eastern equatorial Pacific over 1–3 years, culminating in the development of El Niños and La Niñas. As illustrated in
Figure 1, the WNP is defined as a specific SSTA pattern depicting an opposite signed dipole located in the east of Taiwan and northeast of Papua New Guinea, which forms one year before a full-fledged El Nino/La Nina [
7]; a later analysis by [
8] found that the same-signed SSTA east of Taiwan can propagate southeastward to the Niño-3 region over a duration up to 4 years and, under favorable conditions, can connect to ENSO development [
9]. These anomalies are influenced by a complex interplay of factors such as the Kuroshio current, the North Pacific Subtropical Gyre, and wind stress curl [
10].
This study aims to bridge the gap between advancements in XAI and the dynamics of ENSO specific to the WNP region. Employing machine learning and XAI techniques, we focus on ENSO prediction within the WNP area, as depicted in
Figure 1. Our preliminary research [
10,
11] has unveiled dynamic insights into previously unexplored aspects of 1-year and 3-year ENSO predictability, as illustrated in the top and bottom of
Figure 1, respectively; these insights draw on the foundational work of [
7] and [
8]. Building on the XAI methodology established by [
6], our study delves deeper into these novel facets of ENSO predictability, emphasizing the unique characteristics of the WNP region.
2. Data and Methodology
All observational and model data utilized in this study are monthly averages. Specifically, we rely on Sea Surface Temperature (SST) reanalysis data from the Japanese Meteorological Center (JMA) COBE-SST v2, with a 1° resolution [
12,
13,
14]. Zonal wind data are from ERA5 reanalysis with a 0.25° resolution [
15]. Data from 1940 to 2019 are used in this study. The long-term average of each month from 1940 to 2019 and the linear trend are both removed. The data from 1940 to 2000 were used as a training set, and the data from 2001 to 2019 were used as a testing set. Input data is normalized to the scale between -0.5 and 0.5.
Our research methodology draws significant inspiration from [
6], which leveraged Convolutional Neural Networks (CNNs) and Long Short-Term Memory (LSTM) networks for climate prediction. The neural network architecture we employ closely adheres to the specifications in [
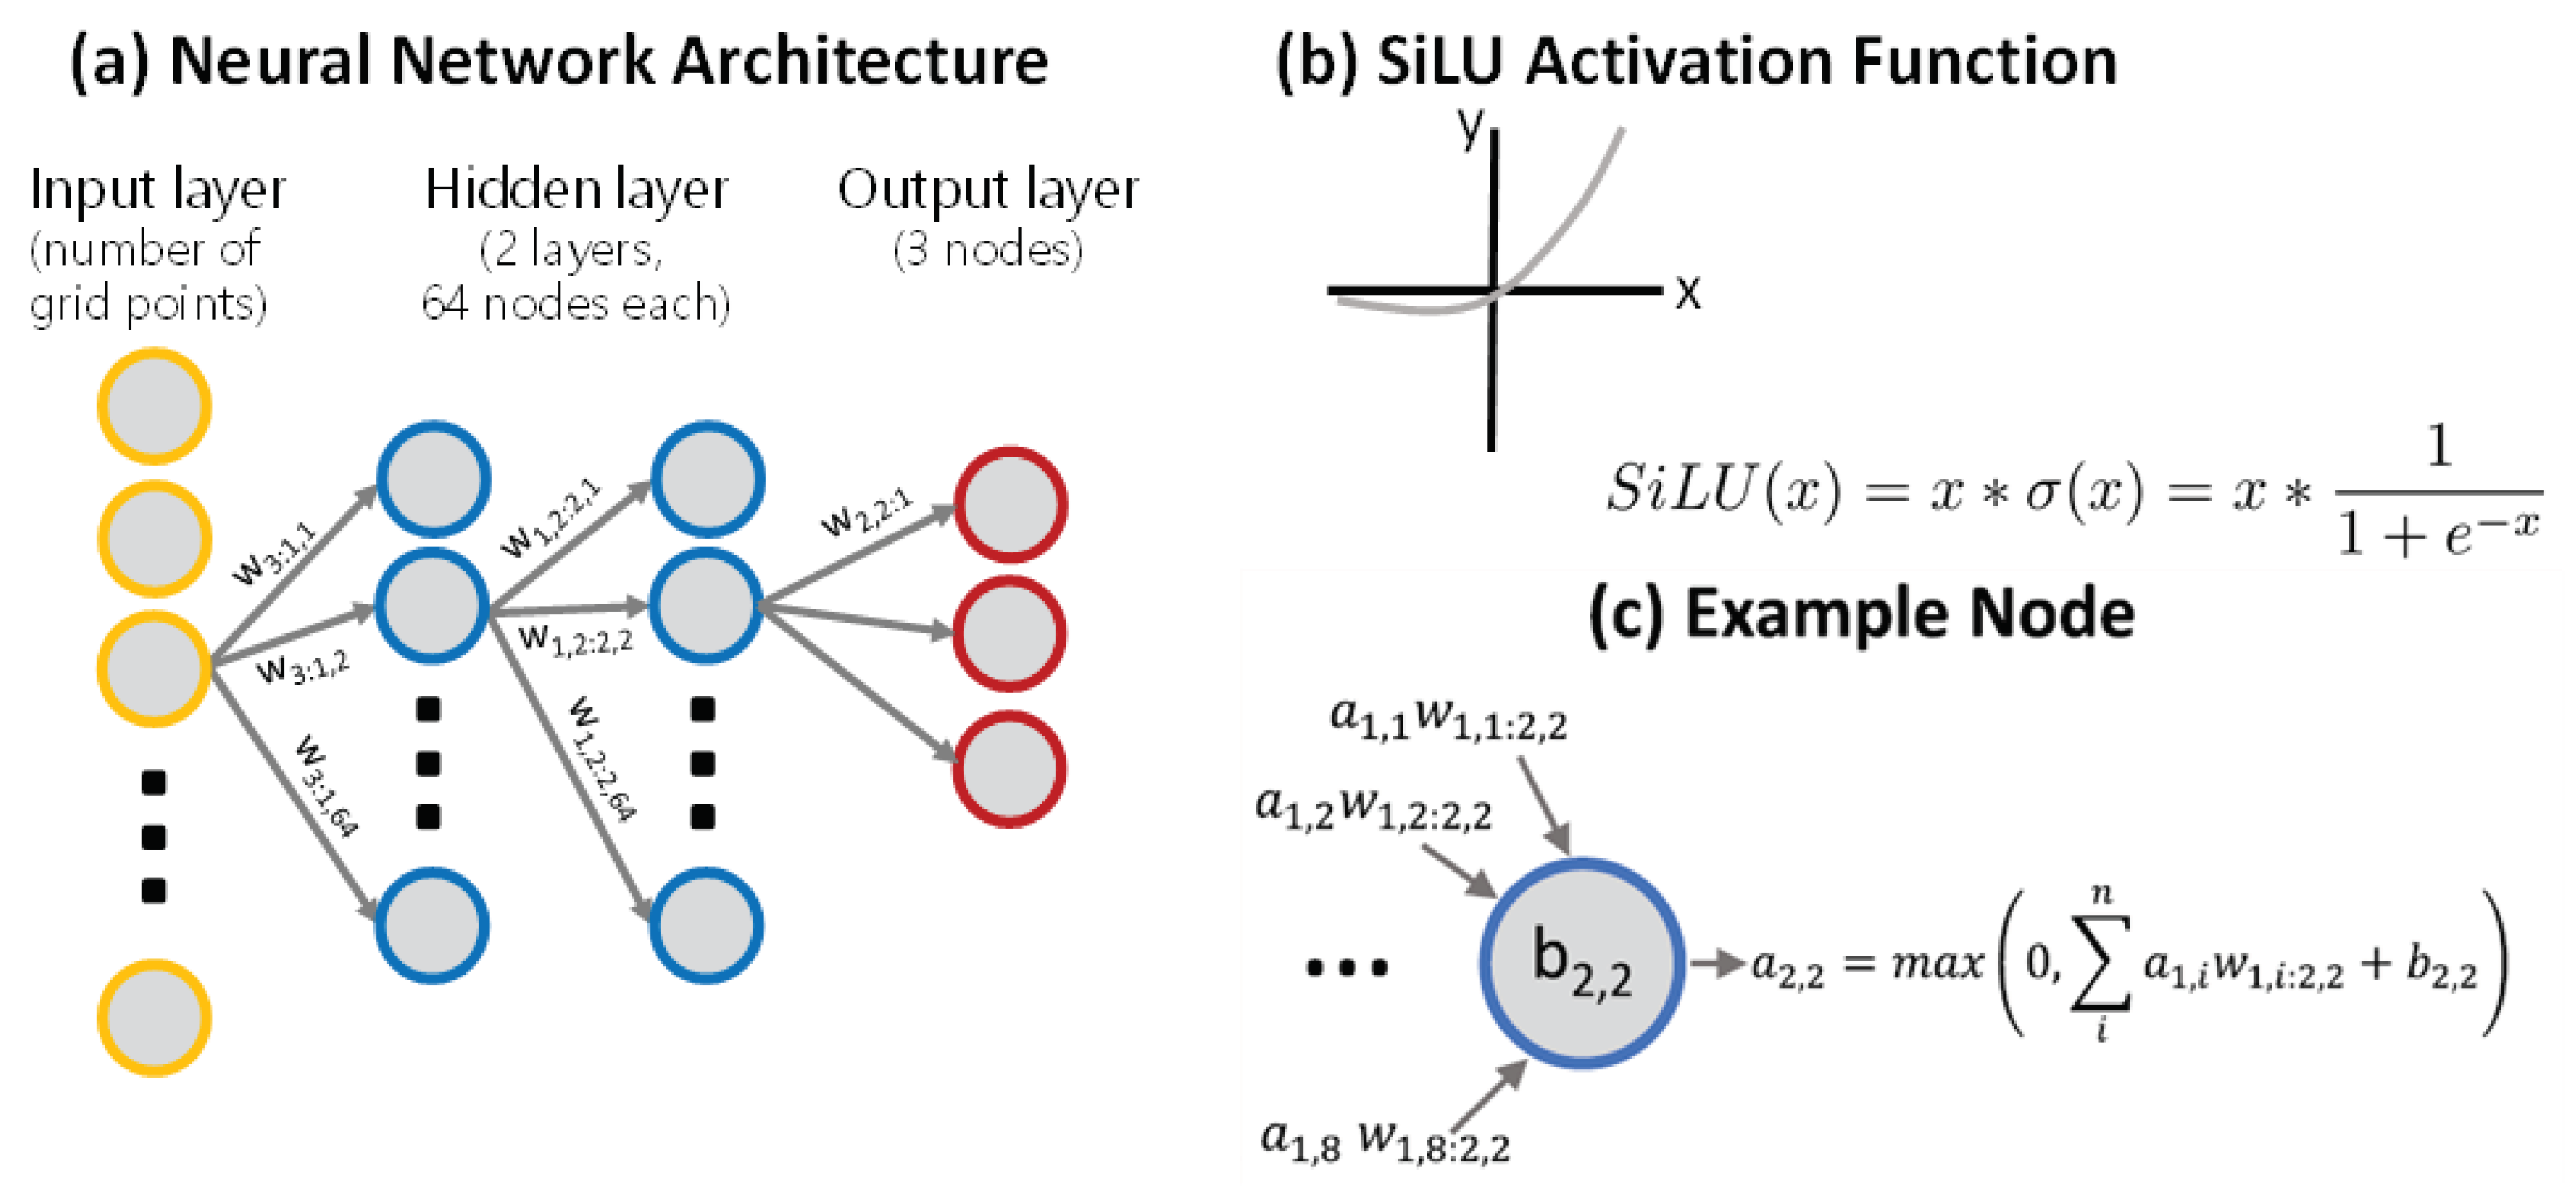
6], but with some modifications to serve the purpose of this study. The main structure of this model is a fully connected classification deep learning model (
Figure 2a). The number of nodes in the input layer is the same as the number of grid points. There are two connected layers in the hidden layer structure, each contains sixty-four nodes. Three nodes in the output layers since this model is applied to identify an El Nino (warm), La Nina (cold), or normal month. The SiLU (Sigmoid Linear Unit) is adopted as an activation function (
Figure 2b) because SiLU keeps features from the negative value region. Adaptive moment estimation (ADAM) is adopted as an optimizer.
There were three labels in the data, El Nino (warm), La Nina (cold), and normal. With normal years often having more than five times the quantity compared to El Nino or La Nina, resulting in a data imbalance issue. Therefore, in selecting the loss function, this study uses the Cross Entropy Loss method, which allows the adjustment of weights. When calculating the loss function, we added weights inversely proportional to the quantity of data for each category. This imposed a higher penalty when the category with fewer data was misclassified. Batch size is equal to the total input data, allowing the neural network to review all the data at once for parameter adjustment. With this adjustment, the loss function could gradually and stably decrease during training, resulting in a more robust model.
In order to build a model with good performance and robustness, hundred sets of randomly generated initial parameters are prepared for each training. A model with high accuracy on both training and testing datasets is selected. If there are no suitable models, two attempts are made: 1) Reduce the values outside the WNP region, allowing the neural network to focus on identifying relationships within the WNP region. 2) Incorporate zonal wind from the 70hPa level of ERA5 data in the polar region (explained later).
Integrated Gradients (IG) [
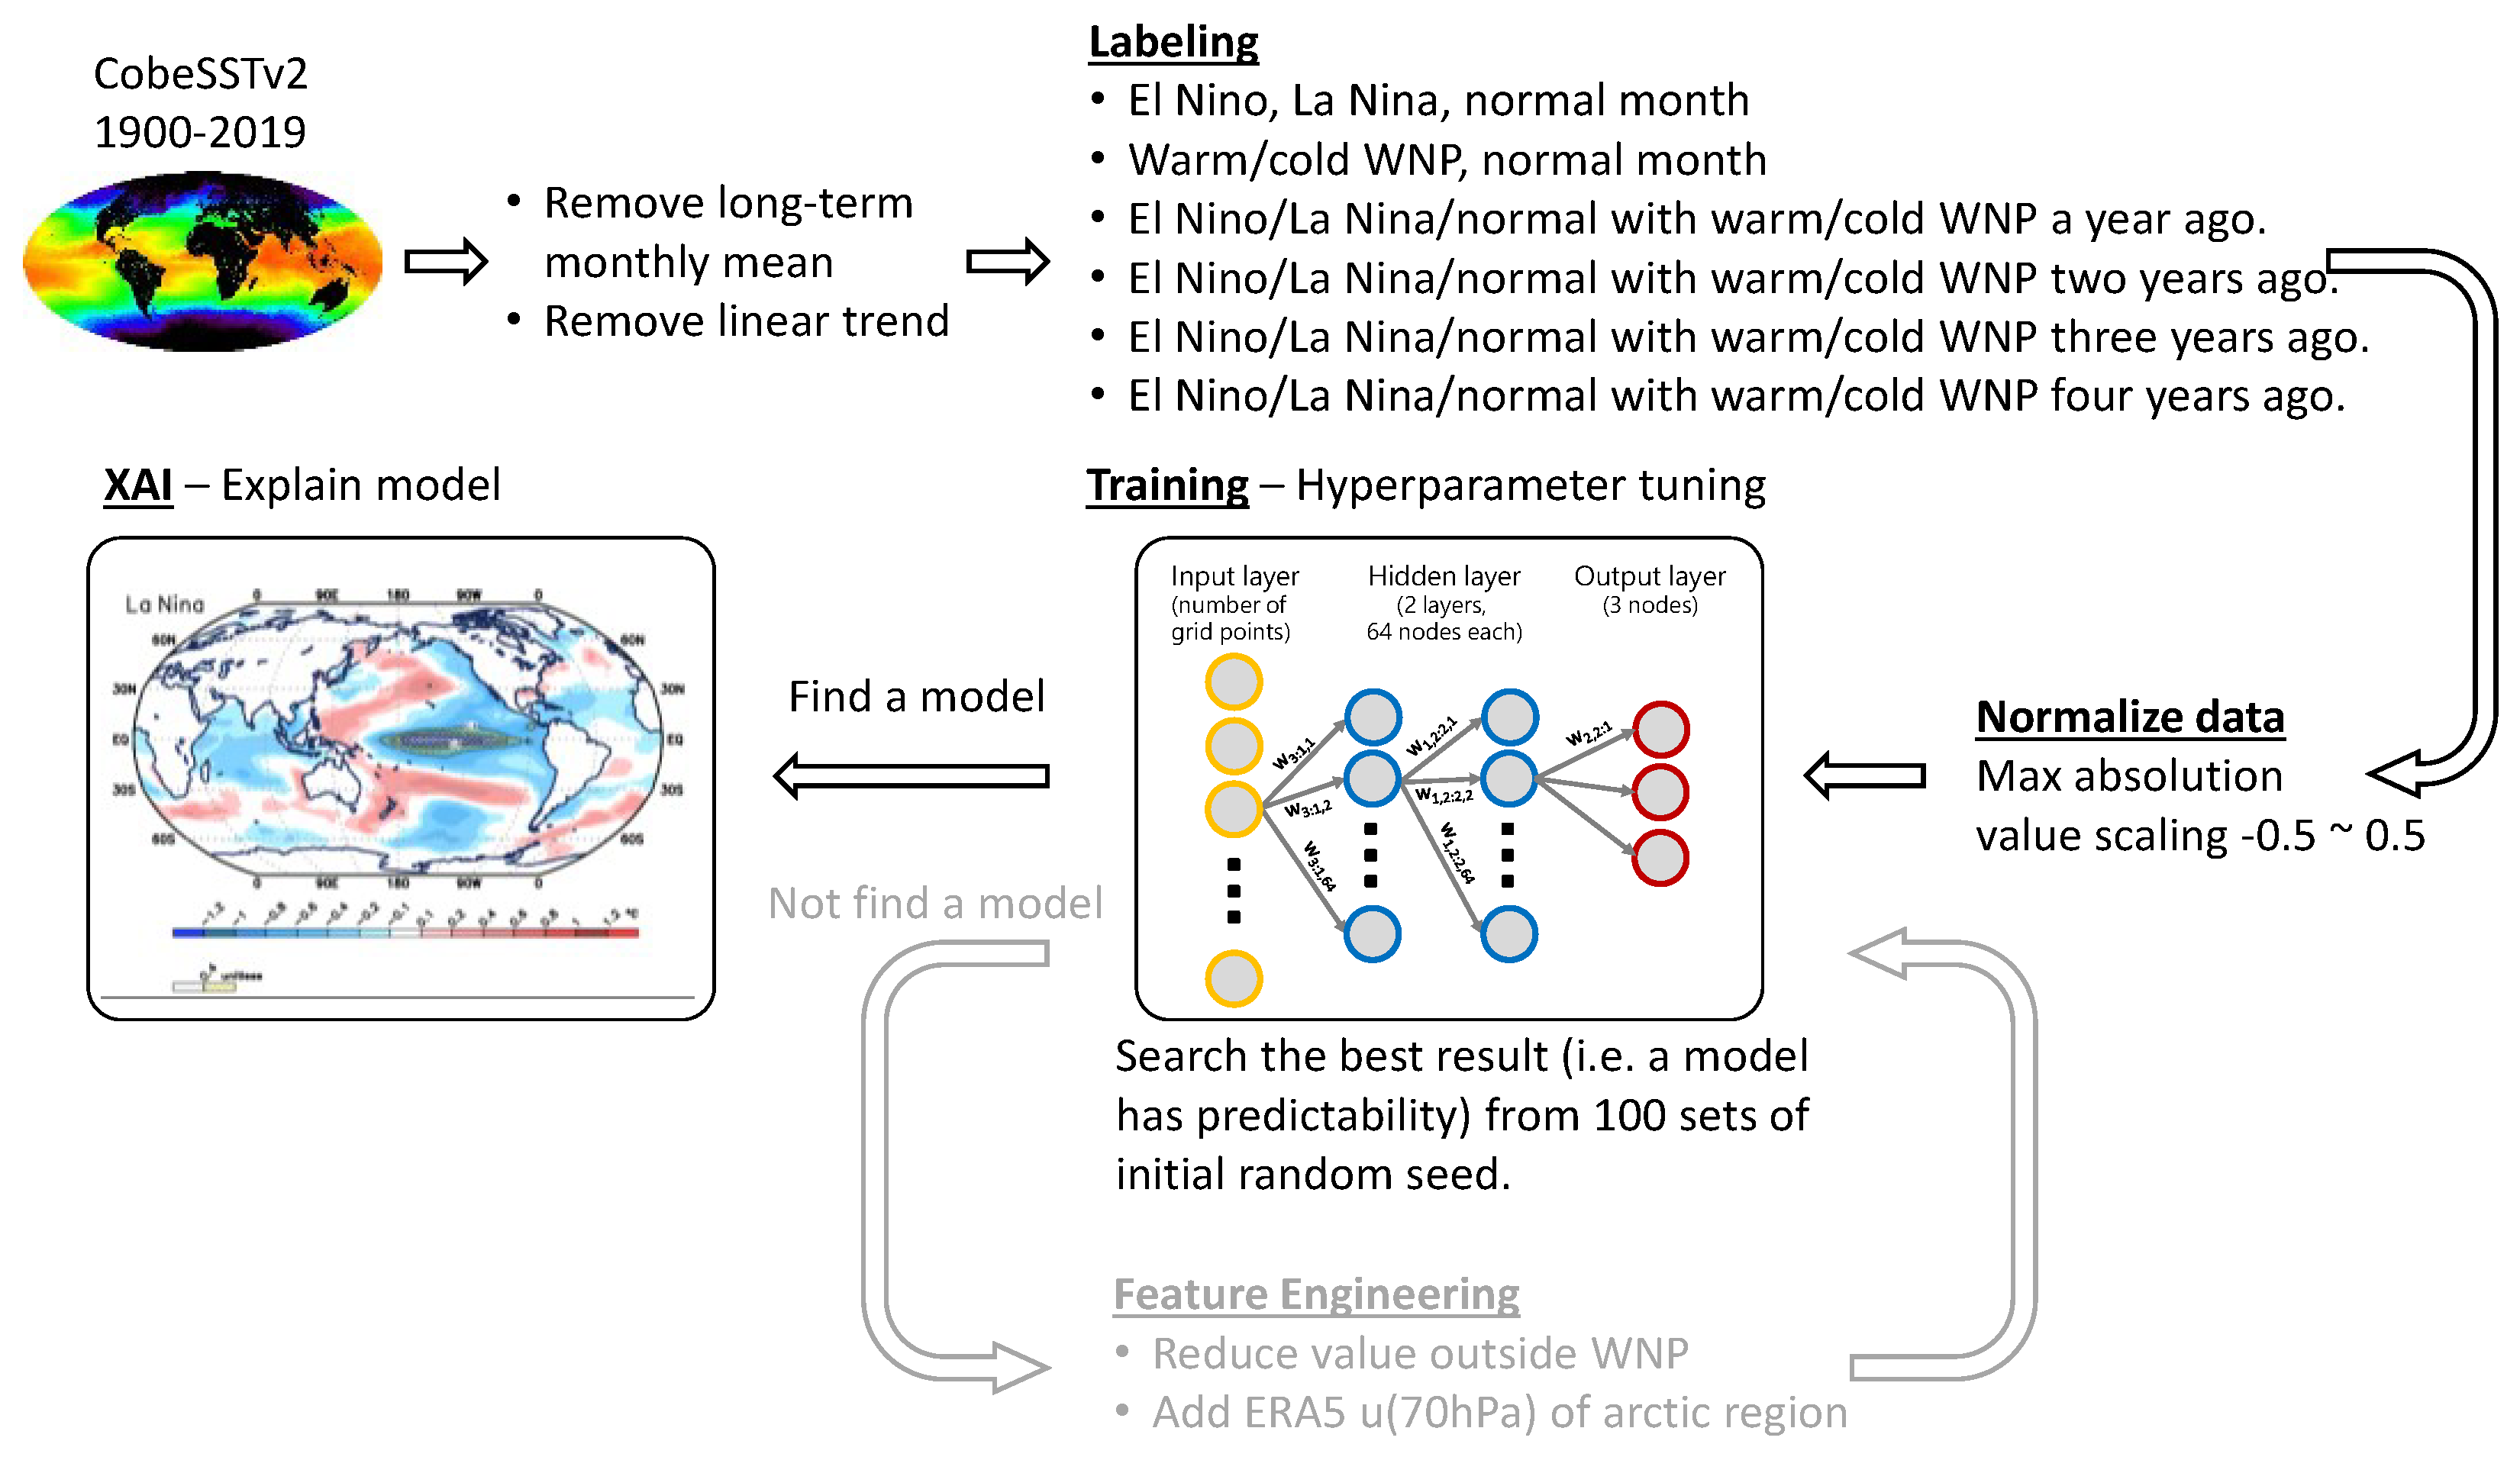
16] was used in this study for XAI. IG is similar in spirit to LPR but uses integration along the entire gradient path to determine the importance of input features in making a classification decision, addressing some of LPR’s shortcomings. IG does not require modifications to the original neural network architecture and provides a feature importance distribution of the input data. The flow of data preparation, model training, and explanation processes is depicted in
Figure 3.
3. Results
In a comparative analysis with [
6], who achieved a 60% accuracy rate in predicting ENSO events one year in advance, our model sets this "0.6" as a baseline for performance.
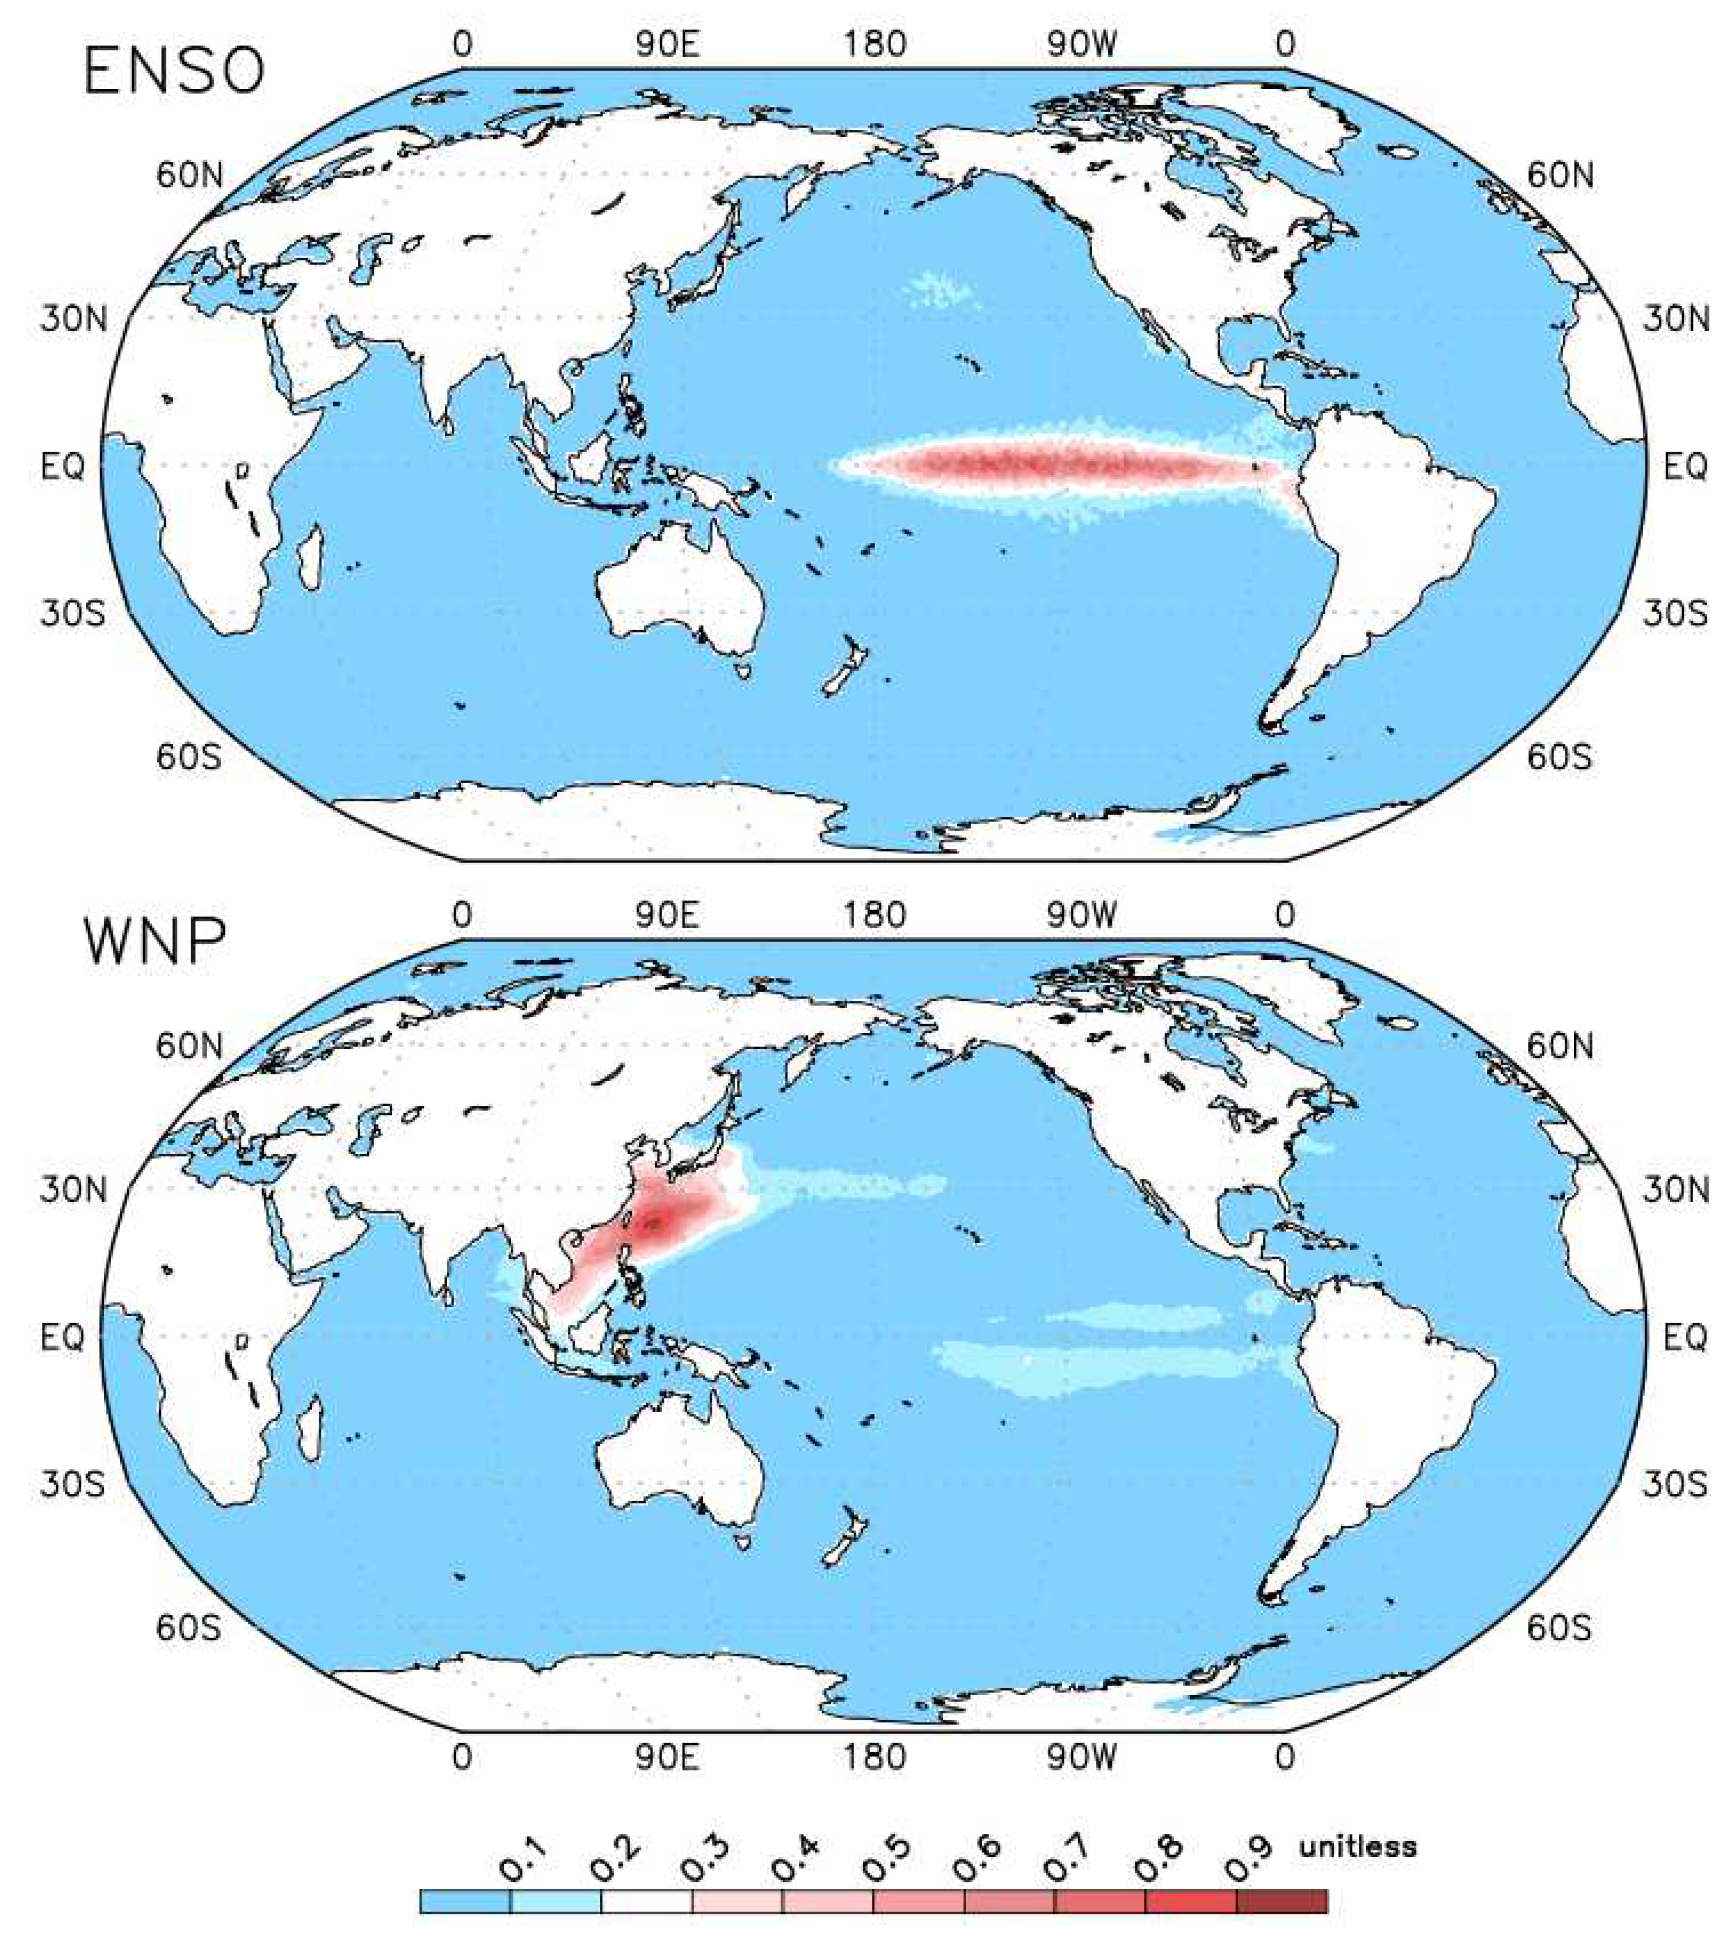
Figure 4 demonstrates that our XAI model can fully replicate the methodology of [
6], identifying the relationship between ENSO and the WNP’s SST conditions (highlighted in red). By incorporating the state of the WNP, we can further discern the warm, cold, and neutral states of ENSO one year in advance. Our model was trained on data from 1940-1999 and tested on data from 2000-2020. The results, compared to those of [
6] who did not consider the WNP, are significantly improved.
3.1. One-Year Predictability
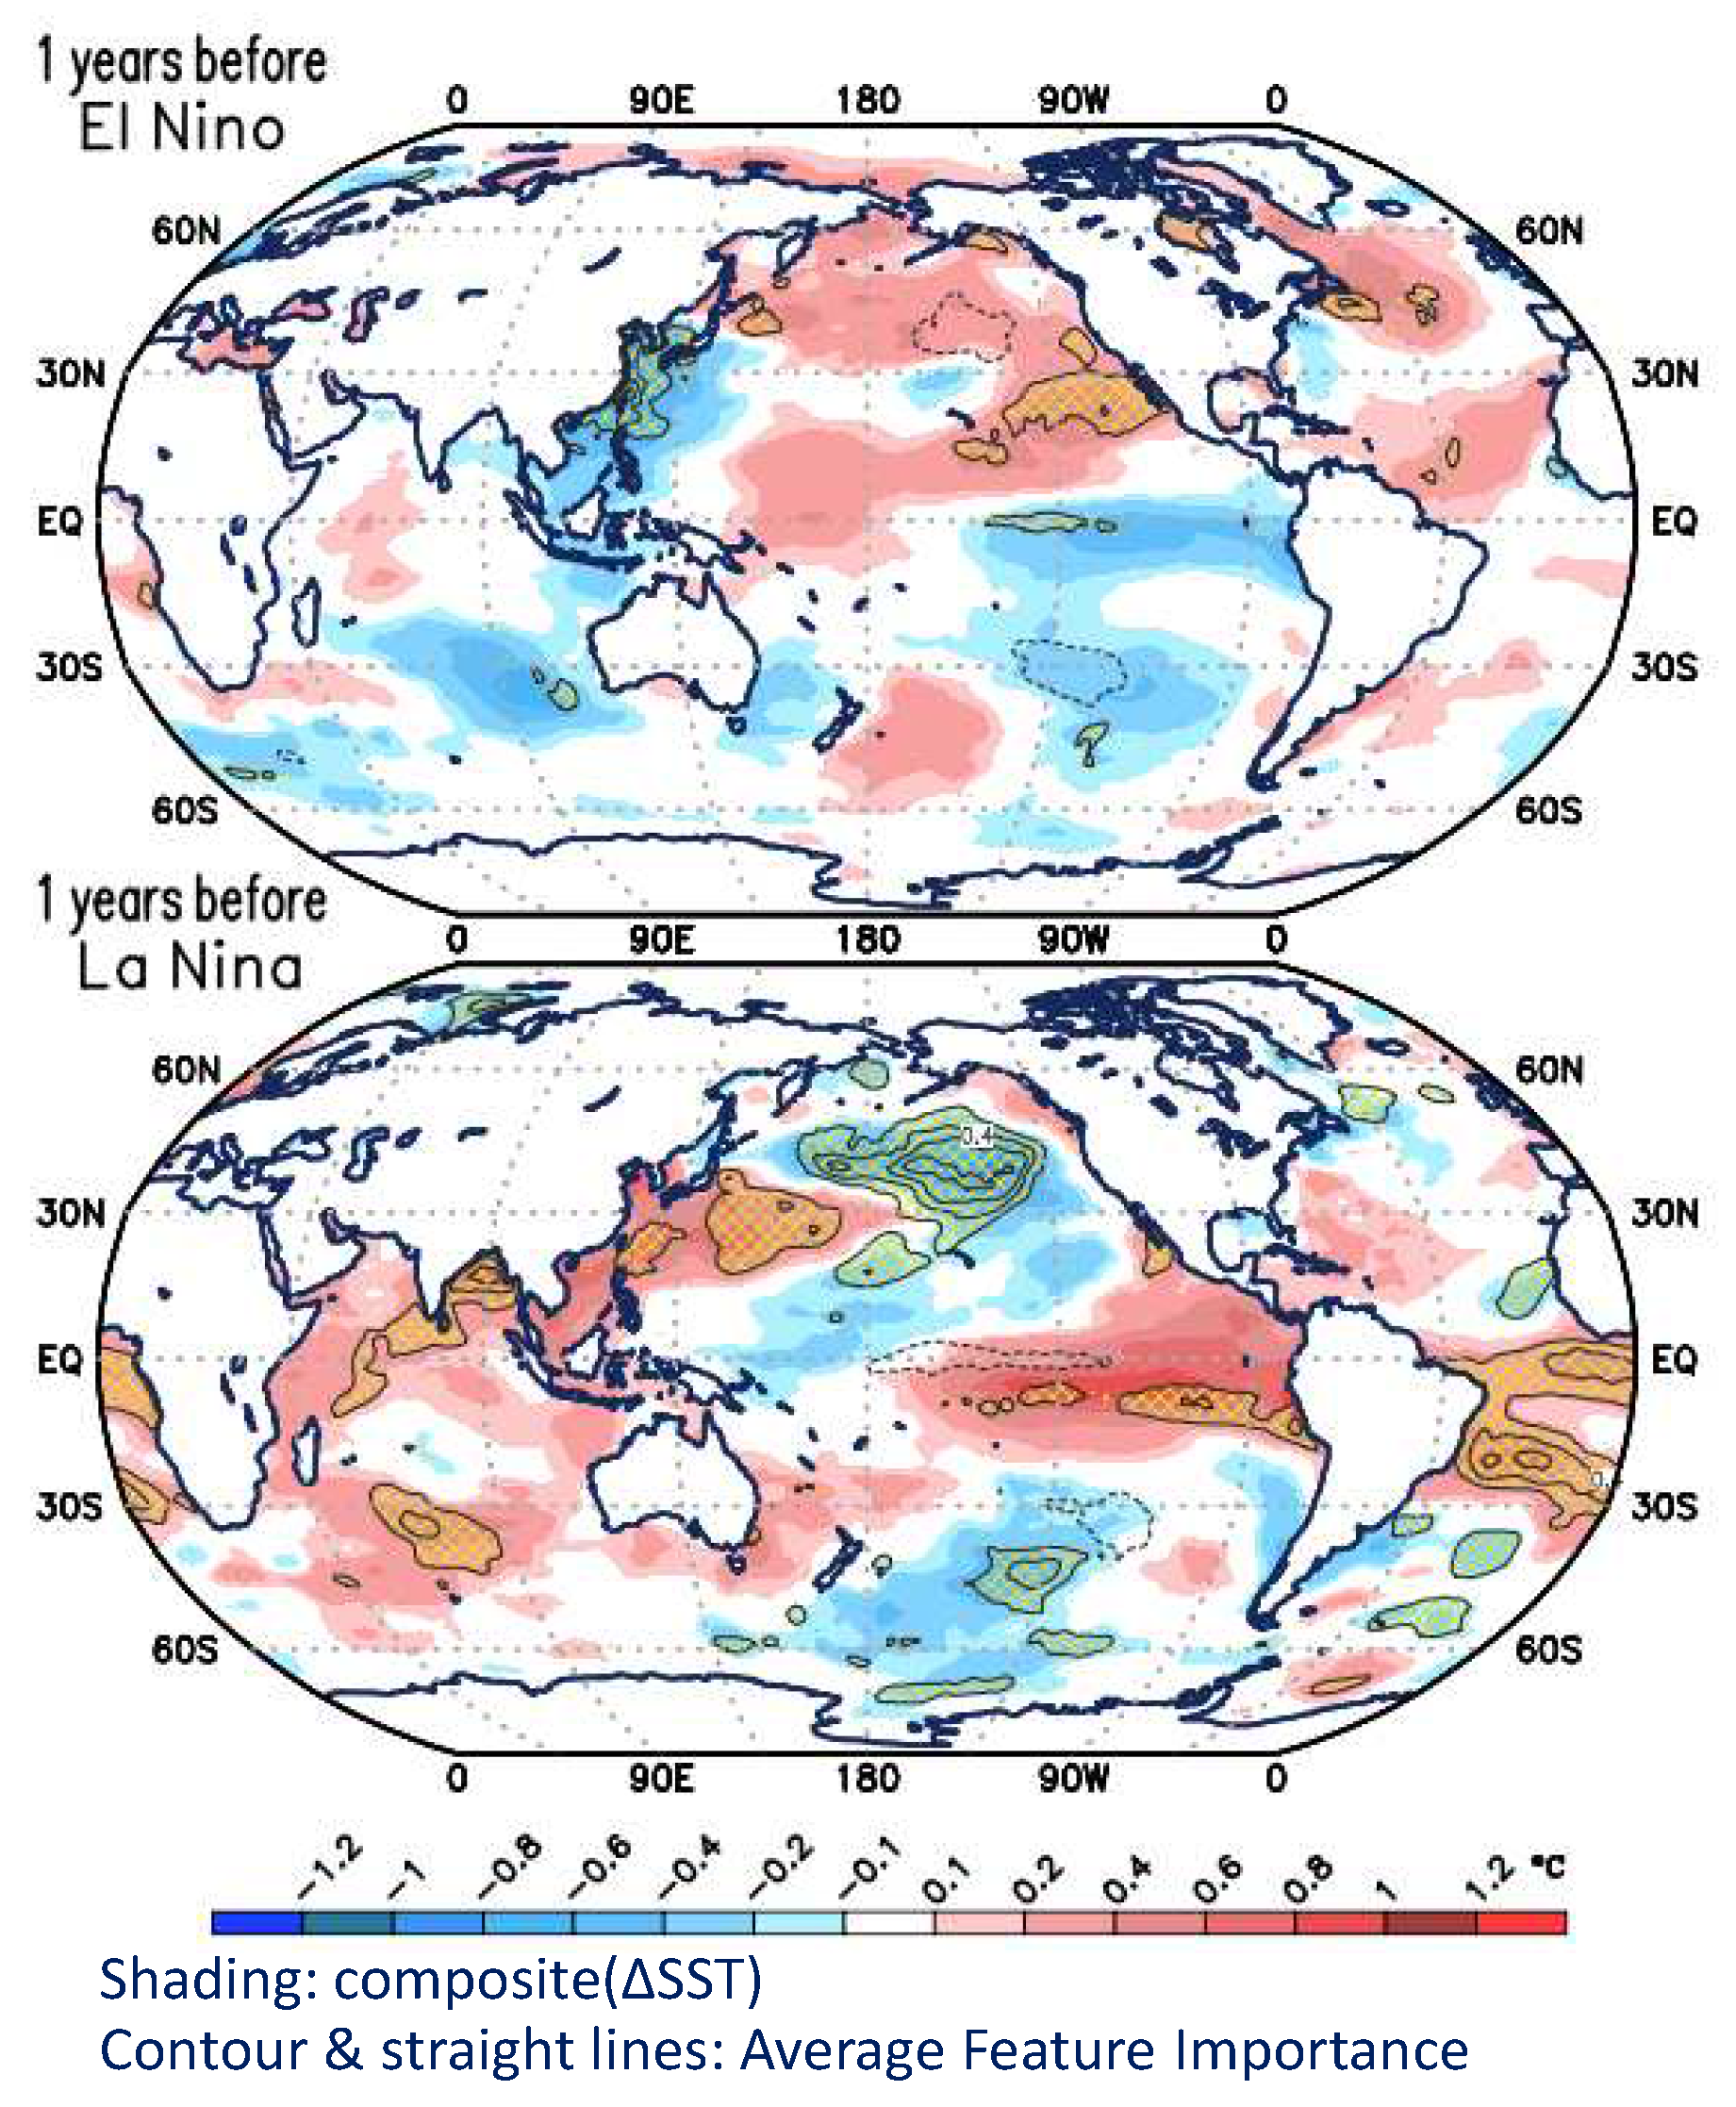
The outcomes after incorporating the WNP are illustrated in
Figure 5. The map section displays the composite sea surface temperature anomalies for warm and cold ENSO events one year prior (colored regions), along with the strength of stratified correlations (contour lines and light yellow shading). The accompanying coefficient table and consolidated results are also provided (
Table 1). Notably, the accuracy indicates that the neural network effectively captures the sea temperature signals in the WNP region. After accounting for these WNP signals, the neural network elevates the ENSO prediction accuracy to 85%’ as shown in
Table 1 alongside other statistics. This model is particularly effective in capturing strong El Niño and La Niña cases, lending significant implications for seasonal prediction.
The WNP region serves as a critical precursor for ENSO events, affecting them primarily through zonal advection and thermocline feedback mechanisms. The model’s success in this area is noteworthy given the increasing amplitude and frequency of summer westerly anomalies in a warming climate. These anomalies imply stronger and more frequent El Niños under WNP influence. The intensification of westerlies induces stronger westerly wind stress, amplifying Kelvin wave activity in the western equatorial Pacific. This leads to stronger downstream effects related to the Bjerknes feedback, facilitating an easier transition to an amplified El Niño [
17,
18,
19].
The XAI methods inspired by Toms et al. [
6] were instrumental in achieving this level of predictability. XAI’s ability to provide insights into the model’s decision-making process allowed us to understand why the model was particularly effective in picking up the WNP’s 1-year lead for ENSO development. The model’s XAI features revealed that the key variables contributing to this high level of accuracy were related to the documented strengthening effects of both Ekman and geostrophic heat advection and entrainment of subsurface water in the equatorial Pacific [
9,
10].
3.2. Three-Plus Years of Predictability
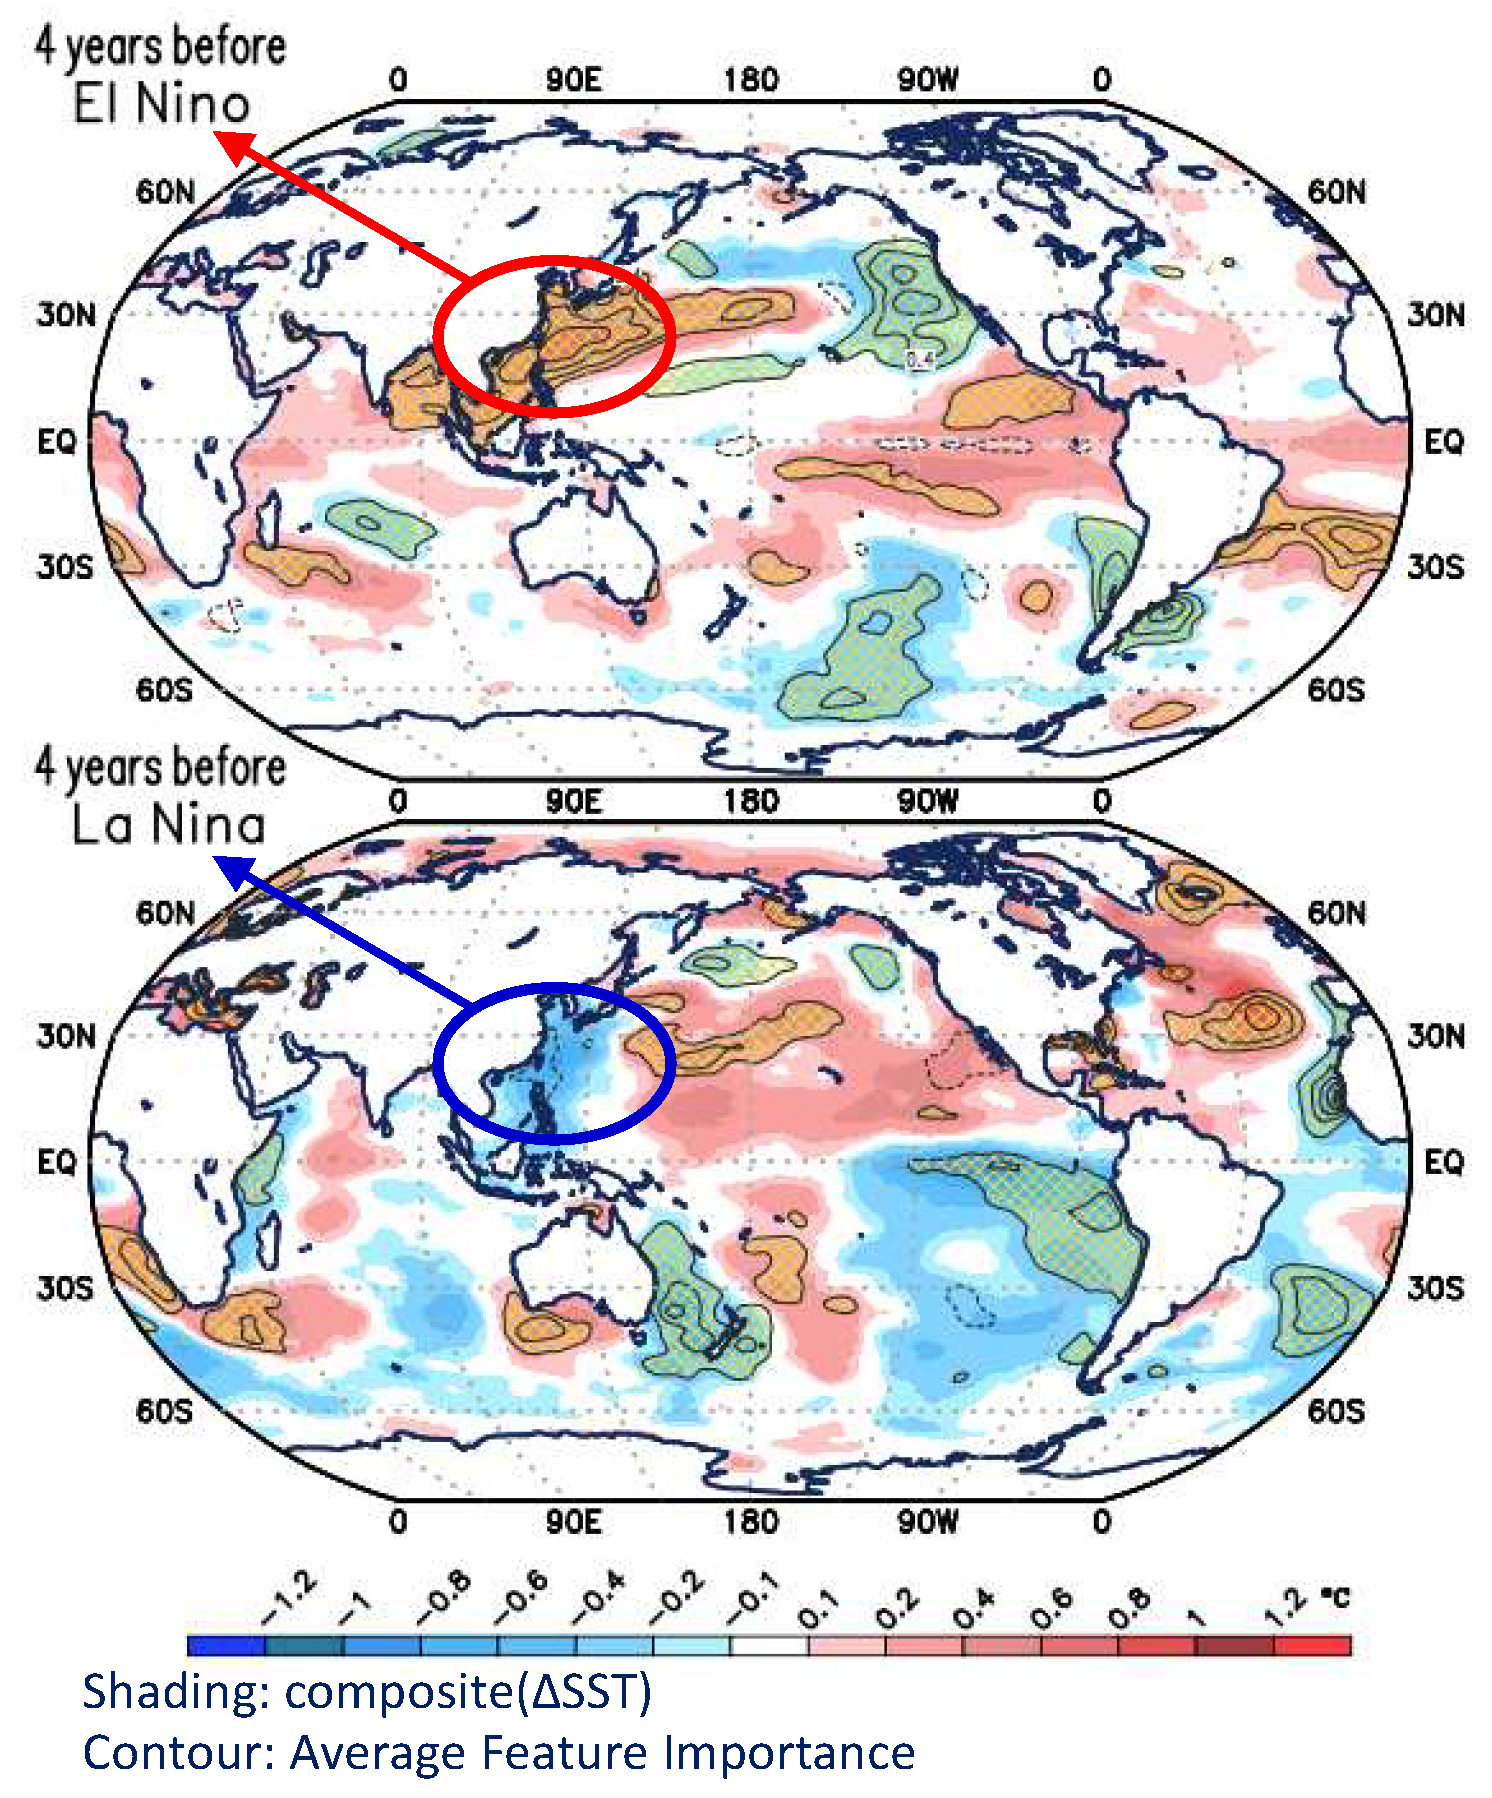
In an effort to extend the frontiers of ENSO predictability, we conducted additional tests focusing on the beyond-one-year lead times. The analyses revealed significant but varying ENSO predictabilities for both different years in advance, with a marginal WNP signal three years before ENSO and, counterintuitively, a robust WNP signal four years prior.
Figure 6 shows that four years before an ENSO event, the WNP exhibits significant feature strength. Unlike the anti-phase relationship one year before, as shown in
Figure 5, the long-lead WNP signal to ENSO is in-phase four years prior, meaning that warm WNP could coincide with an El Nino event four years later. In essence, and as observed in [
8] and explained in [
10], warm WNP conditions would appear to propagate to equatorial eastern Pacific linking to El Niño events four years later, and vice versa for cold WNP conditions. We avoid the term "caused" because the physical mechanisms driving these SST anomalies and their influence on ENSO events are still under investigation, while the role of air-sea coupling is difficult to isolated from the coupled ENSO dynamics. However, the focus here is on predictability, and with an estimated predictability rate of 0.75 (
Table 2), we believe that leveraging this phenomenon of WNP could offer a viable pathway for advancing seasonal ENSO forecasts.
Recent research has continued to unravel the intricate relationship between ENSO and the Arctic polar vortex. Kumar et al. [
20] assessed the structure and evolution of polar vortex during different ENSO phases, revealing significant impacts on polar vortex behavior. Furthermore, the work of [
21] on stratosphere-troposphere coupling in the Southern Hemisphere provided insights into the predictability of surface climate, underlining the global reach of ENSO-polar vortex interactions. These studies underscore the complex and far-reaching influence of ENSO on Arctic circulation dynamics, adding to our understanding of climate teleconnection and predictability.
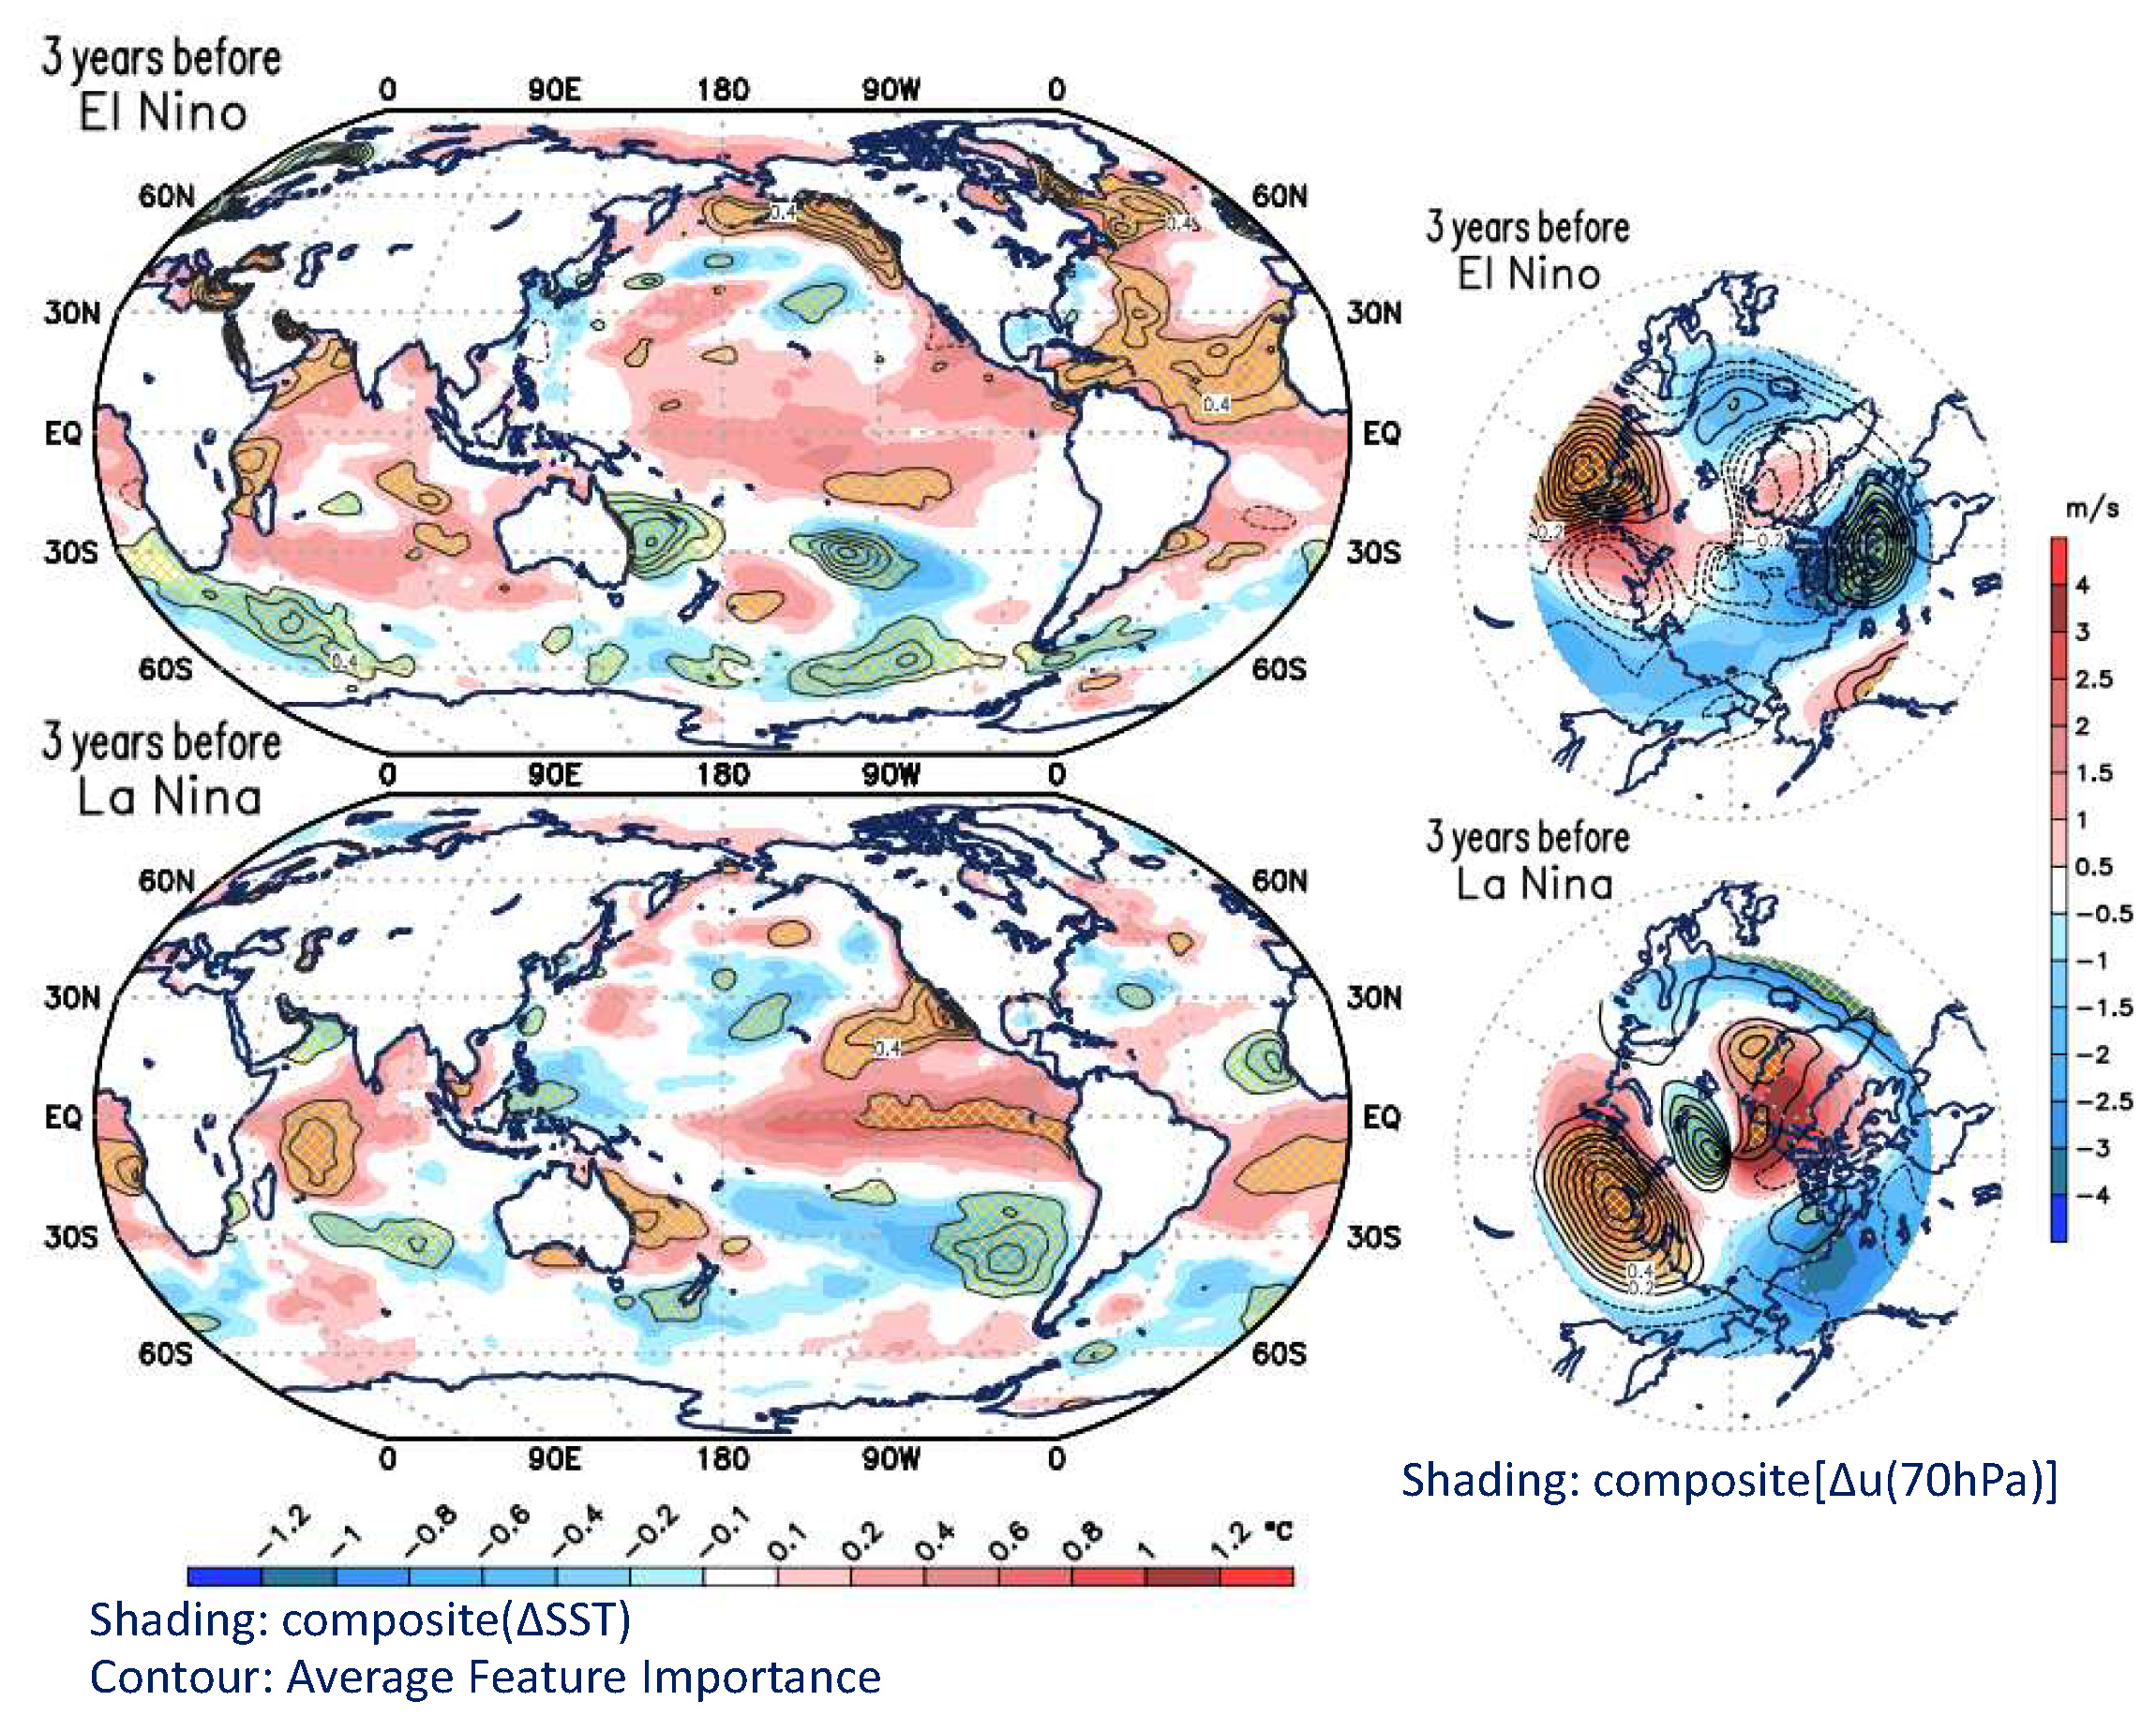
Recognizing the established relationship between ENSO, the North Pacific, and Arctic winter stratospheric circulation, we attempt next to examine whether incorporating polar vortex behavior would help the relatively low skill at 3-year lead. Thus, we incorporated 70hPa polar u-wind within 65°N as an additional predictor to examine this association with tropical low-frequency variability. The results, illustrated in
Figure 7, are intriguing. Despite the relatively low signal strength of SST three years before an ENSO event, the inclusion of 70hPa 65°N u-wind alongside the WNP signal led to a predictability rate as high as 0.9 for ENSO events three years in advance, based on data from 2000-2019 (
Table 3). This polar circulation signal was significant only three years prior to an ENSO event, lacking notable features at other times.
This result suggests that the state of polar vortex three years before an ENSO event, when juxtaposed with the right WNP condition, could influence the North Pacific Oscillation (NPO), subsequently affecting the East Asian winter monsoon. These, in turn, impact the WNP-triggered development of ENSO in the following year. A strong polar vortex keeps cold air contained at the poles. However, shifting of the jet stream and development of wave trains during El Niños can warm and weaken the polar vortex and release outbreaks of cold winds towards the mid-latitudes [
22,
23,
24]. This sudden stratospheric warming (SSW) may adjust ENSO impacts on regional climates [
25]. In the Pacific, a disrupted polar vortex may contribute to sea level pressure anomalies characteristic of both positive and negative NPO phases [
26], making the timing of the polar vortex weakening 3 years before ENSO in
Figure 7 potentially significant in ENSO development.
4. Discussion
While the model seemed to have achieved a high accuracy rate for three-to-four-year predictions of ENSO, it’s crucial to approach these findings with scientific caution. Our analyses suggest that the four-year WNP SSTA propagation is consistent with the reshaping of an SSTA along the southeastern quadrant of the North Pacific Subtropical Gyre as it shifts in and out of equilibrium. The SSTA’s propagation is influenced by geostrophic flow dynamics, and the sea surface height gradient is most pronounced to the southeast [
10]. This ensures that any SSTA originating from the WNP moves downslope towards the central–eastern equatorial Pacific. On the polar vortex’s role in enhancing the three-year ENSO prediction via the WNP pattern, the same dynamics apply; that is, the Arctic circulation modulates the NPO or North Pacific Subtropical Gyre leading to slight changes in the otherwise pan-four-year propagation of WNP that links to ENSO development 3-4 years later. While these findings are encouraging, they are subject to the limitations of the model and the quality of the input data.
In theory, the gradual movement of warm and cold SSTAs from the WNP to the central–eastern equatorial Pacific could potentially extend ENSO prediction lead times up to 3–4 years [
8]. However, it’s important to consider that these results are based on a single model and a specific set of conditions. Further research is needed to validate these findings and to explore how they might generalize to other models and conditions. This study serves as a preliminary step in understanding how deterministic relationships between extratropical precursors and ENSO through subtropical gyres can contribute to advancements in longer lead time (>1 year) ENSO predictions.
Long-term predictability has been a complex and often elusive goal in ENSO research. This level of long-term predictability has been a challenging frontier in ENSO research. The presented XAI model’s relative success is attributed to its ability to capture slow-moving, large-scale oceanic and atmospheric patterns in the WNP region. These patterns are pivotal in ENSO development and are illustrated in
Figure 1. The neural network architecture of the model, inspired by [
6], appears to be effective in capturing these slow-moving patterns. However, it is also important to note that while the XAI model outperforms many traditional forecasting methods, further validation is needed to confirm these results.
5. Concluding Remarks
Traditional empirical forecasts and regression analyses have shown that using WNP sea surface temperatures to predict ENSO one year in advance yields a predictability of only around 0.6 (correlation coefficient). This is consistent with the findings of [
6], who also achieved a predictability of 0.6 using machine learning. Even using the so-called Pacific Meridional Mode (PMM) concept to predict winter ENSO nine months in advance only reaches a predictability of 0.6. Our experiments demonstrate that by integrating advanced machine learning methods with physical mechanisms (i.e., using XAI with the WNP precursor), one can elevate the accuracy of one-year ENSO predictions to 0.85—a significant improvement from 0.6. The application of XAI further substantiates the physical relationship between WNP and ENSO, reinforcing the findings of [
7,
8] that there are indeed predictive signals in the WNP region one year before ENSO events.
Moreover, our study reveals unprecedented interannual predictability by leveraging quasi-four-year modal characteristics, as shown in
Figure 4 and [
8]. Specifically, sea surface temperature anomalies move from the WNP region southeastward to the equatorial eastern Pacific. Using XAI methods, we achieved a predictability as high as 0.75 for ENSO events four years in advance, post-2000. This opens up a new frontier in ENSO forecasting that warrants further in-depth and theoretical investigation.
While these results are promising, it’s crucial to approach them with scientific caution. The complex relationships captured by machine learning methods between oceanic and atmospheric variables are still not fully understood and require further scrutiny to assess their physical significance. Nonetheless, the advancements in predictability achieved in this study mark a noteworthy step forward in the realm of ENSO research.
Author Contributions
Conceptualization, L.D. and S.Y.W.; methodology, S.Y.W. and K.B.; formal analysis, L.D. and K.B.; writing—original draft preparation, L.D. and S.Y.W..; funding acquisition, L.D. and S.Y.W. All authors have read and agreed to the published version of the manuscript.
Funding
This research was Supported by National Natural Science Foundation of China (Grant No.41875071).
Institutional Review Board Statement
Not applicable.
Informed Consent Statement
Not applicable.
Data Availability Statement
All data used is publicly available.
Acknowledgments
We thank Paul Tsay’s technical assistance on XAI methods.
Conflicts of Interest
The authors declare no conflicts of interest.
References
- Zhang, M.; Rojo-Hernández, J.D.; Yan, L.; Mesa, Ó.; Lall, U. Hidden Tropical Pacific Sea Surface Temperature States Reveal Global Predictability for Monthly Precipitation for Sub-Season to Annual Scales. J. Geophys. Res. 2022, 49, e2022GL099572. [Google Scholar] [CrossRef]
- Zhou, L.; Zhang, R.-H. A self-attention–based neural network for three-dimensional multivariate modeling and its skillful ENSO predictions. Sci. Adv. 2023, 9, eadf2827. [Google Scholar] [CrossRef]
- Liu, Y.; Duffy, K.; Dy, J.G.; Ganguly, A. Explainable deep learning for insights in El Niño and river flows. Nat. Commun. 2023, 14, 339. [Google Scholar] [CrossRef]
- Hou, S.; Li, W.; Liu, T.; Zhou, S.; Guan, J.; Qin, R.; Wang, Z. MIMO: A Unified Spatio-Temporal Model for Multi-Scale Sea Surface Temperature Prediction. Remote Sens. 2022, 14, 2371. [Google Scholar] [CrossRef]
- Taylor, J.; Feng, M. A deep learning model for forecasting global monthly mean sea surface temperature anomalies. Front. Clim. 2022, 4, 932932. [Google Scholar] [CrossRef]
- Toms, B.A.; Barnes, E.A.; Ebert-Uphoff, I. Physically interpretable neural networks for the geosciences: Applications to Earth system variability. JAMES 2020, 12, e2019MS002002. [Google Scholar]
- Wang, S.-Y.; L’Heureux, M.; Chia, H.-H. ENSO prediction one year in advance using western North Pacific sea surface temperatures. Geophys. Res. Lett. 2012, 39, L05702. [Google Scholar] [CrossRef]
- Wang, S.-Y.; Jiang, X.; Fosu, B. Global eastward propagation signals associated with the 4–5-year ENSO cycle. Clim. Dyn. 2015, 44, 2825–2837. [Google Scholar] [CrossRef]
- Fosu, B.; He, J.; Wang, S.-Y. The influence of wintertime SST variability in the Western North Pacific on ENSO diversity. Clim. Dyn. 2020, 54, 3641–3654. [Google Scholar] [CrossRef]
- Borhara et al in review.
- Borhara, K.; Fosu, B.; Wang, S.-Y. The role of the western North Pacific (WNP) as an El Niño–Southern Oscillation (ENSO) precursor in a warmer future climate. Clim. Dyn. 2023, 61, 3755–3773. [Google Scholar] [CrossRef]
- Folland, C.K.; Parker, D.E. Correction of instrumental biases in historical sea surface temperature data. Q. J. R. Meteorol. Soc. 1995, 121, 319–367. [Google Scholar] [CrossRef]
- Ishii, M.; Shouji, A.; Sugimoto, S.; Matsumoto, T. Objective Analyses of Sea-Surface Temperature and Marine Meteorological Variables for the 20th Century using ICOADS and the Kobe Collection. Int. J. Climatol. 2005, 25, 865–879. [Google Scholar] [CrossRef]
- Japan Meteorological Agency. Characteristics of Global Sea surface temperature analysis data (COBE-SST) for climate use. Vol. 12. Monthly Report on Climate System Separated, 2006, 116pp.
- Hersbach, H.; Bell, B.; Berrisford, P.; et al. The ERA5 global reanalysis. Q. J. R. Meteorol. Soc. 2020, 146, 1999–2049. [Google Scholar] [CrossRef]
- Sundararajan, M.; Taly, A.; Yan, Q. Axiomatic Attribution for Deep Networks. In Proceedings of the International Conference on Machine Learning; 2017. [Google Scholar]
- Kessler, W.S.; McPhaden, M.J.; Weickmann, K.M. Forcing of intraseasonal Kelvin waves in the equatorial Pacific. J. Geophys. Res. 1995, 100(C6), 10613–10631. [Google Scholar] [CrossRef]
- Wang, B. Dynamic Meteorology | Kelvin Waves. In Encyclopedia of Atmospheric Sciences, 2nd ed.; Academic Press: MA, USA, 2015; pp. 347–352. [Google Scholar]
- Li, Z.; Fedorov, A.V. Coupled dynamics of the North Equatorial Countercurrent and Intertropical Convergence Zone with relevance to the double-ITCZ problem. Proc. Natl. Acad. Sci. 2022, 119(31), e2120309119. [Google Scholar] [CrossRef]
- Kumar, V.; Shigeo, Y.; Matthew, H. Hitchman. QBO and ENSO effects on the mean meridional circulation, polar vortex, subtropical westerly jets, and wave patterns during boreal winter. J. Geophys. Res. 2022, e2022JD036691. [Google Scholar] [CrossRef]
- Thompson, D.W.J.; Baldwin, M.P.; Solomon, S. Stratosphere–troposphere coupling in the Southern Hemisphere. J. Atmos. Sci 2005, 708–715. [Google Scholar] [CrossRef]
- García-Herrera, R.; Calvo, N.; Garcia, R.R.; Giorgetta, M.A. Propagation of ENSO temperature signals into the middle atmosphere: A comparison of two general circulation models and ERA-40 reanalysis data. J. Geophys. Res. 2006, 111, D06101. [Google Scholar] [CrossRef]
- Butler, A.H.; Polvani, L.M. El Niño, La Niña, and stratospheric sudden warmings: A reevaluation in light of the observational record. Geophys. Res. Lett. 2011, 38, L13807. [Google Scholar] [CrossRef]
- Domeisen, D.I.; Garfinkel, C.I.; Butler, A.H. The teleconnection of El Niño Southern Oscillation to the stratosphere. Rev. Geophys. 2019, 57, 5–47. [Google Scholar] [CrossRef]
- Butler, A.H.; Polvani, L.M.; Deser, C. Separating the stratospheric and tropospheric pathways of El Niño–Southern Oscillation teleconnections. Environ. Res. Lett. 2014, 9, 024014. [Google Scholar] [CrossRef]
- Lian, Y.; Shen, B.Z.; Li, S. F.; Zhao, B.; Gao, Z. T.; Liu, G.; Liu, P.; Cao, L. Impacts of polar vortex, NPO, and SST configurations on unusually cool summers in Northeast China. Part I: Analysis and diagnosis. Adv. Atmos. Sci. 2013, 30, 193–209. [Google Scholar] [CrossRef]
|
Disclaimer/Publisher’s Note: The statements, opinions and data contained in all publications are solely those of the individual author(s) and contributor(s) and not of MDPI and/or the editor(s). MDPI and/or the editor(s) disclaim responsibility for any injury to people or property resulting from any ideas, methods, instructions or products referred to in the content. |
© 2024 by the authors. Licensee MDPI, Basel, Switzerland. This article is an open access article distributed under the terms and conditions of the Creative Commons Attribution (CC BY) license (http://creativecommons.org/licenses/by/4.0/).
