Submitted:
05 February 2024
Posted:
06 February 2024
You are already at the latest version
Abstract
Keywords:
1. Introduction
2. Materials and Methods
2.1. Site and Stand Description
2.2. Measurements and Analyses
3. Results
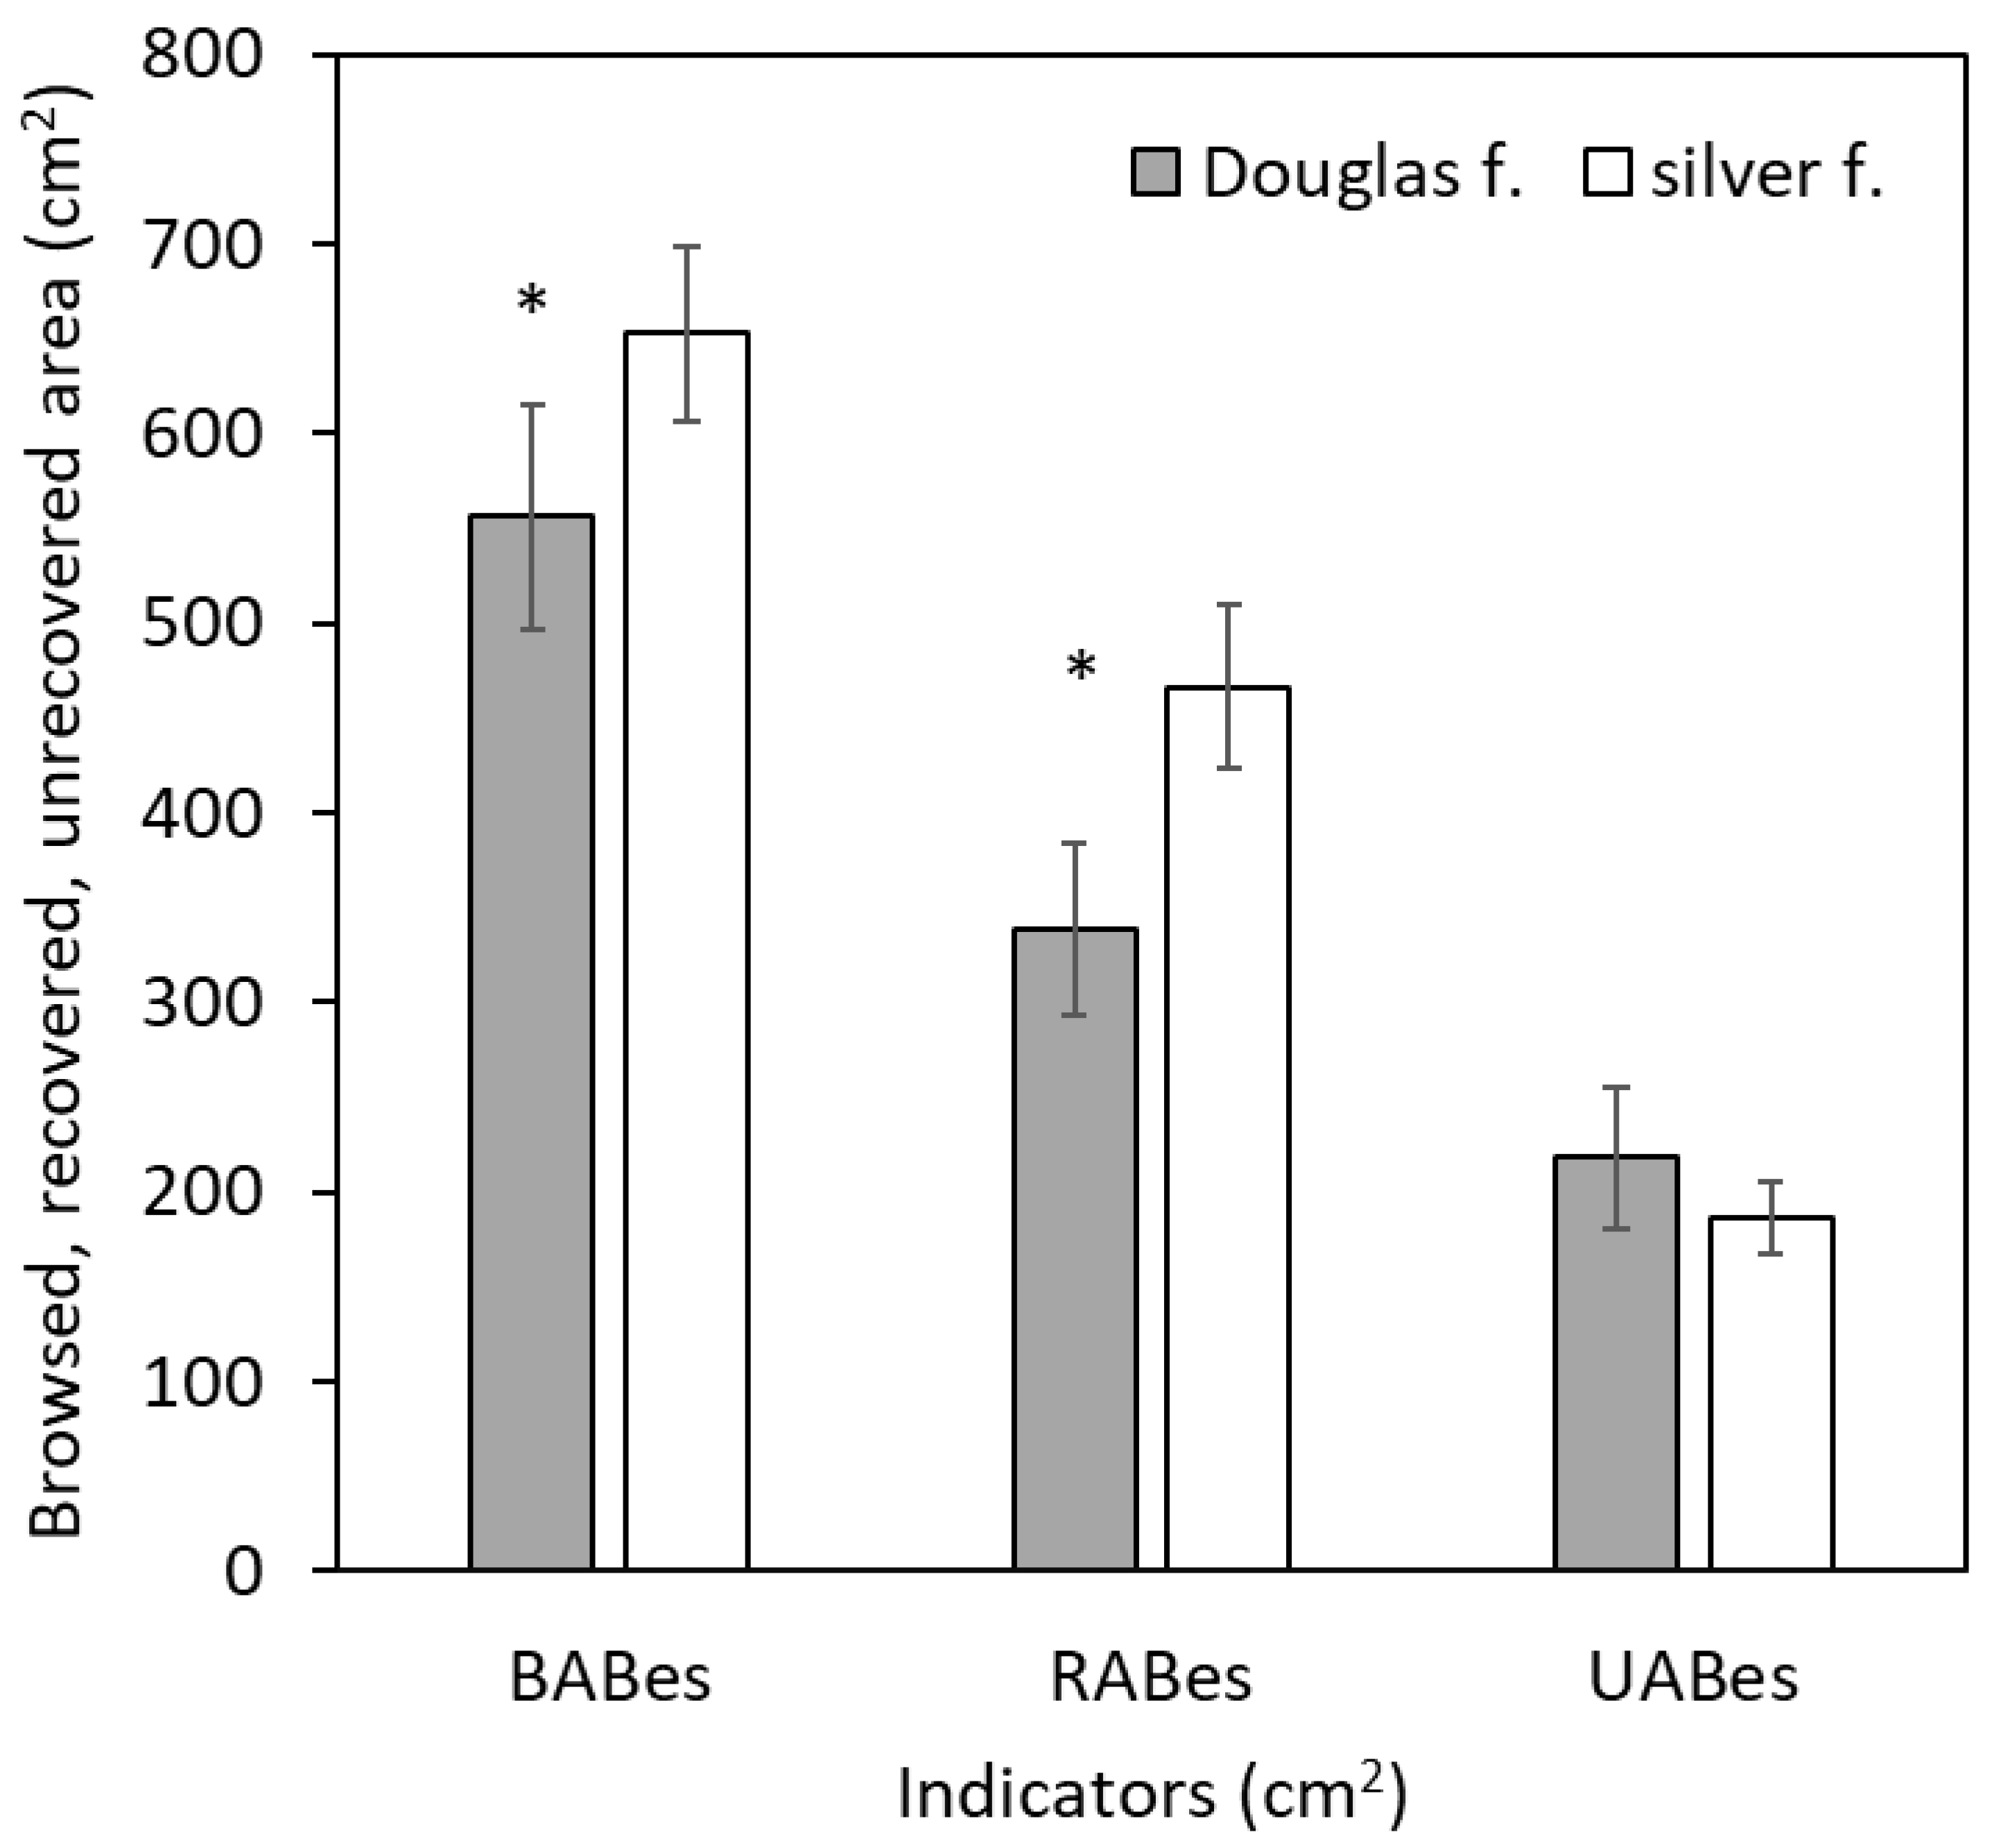
4. Discussion
4.1. Bark Browsing (Stripping)
4.2. Bark Recovery
5. Conclusions
Author Contributions
Funding
Data Availability Statement
Acknowledgments
Conflicts of Interest
References
- Hertog, I.M.; Brogaard, S.; Krause, T. Barriers to expanding continuous cover forestry in Sweden for delivering multiple ecosystem services. Ecosyst. Serv. 2022, 53, 101392. [Google Scholar] [CrossRef]
- Thom, D.; Seidl, R. Natural disturbance impacts on ecosystem services and biodiversity in temperate and boreal forests. Biol. Rev. Camb. Philos. Soc. 2016, 91, 760–781. [Google Scholar] [CrossRef] [PubMed]
- Ruba, J.; Miezite, O.; Luguza, S. Abiotic risks of managing young forest stands of Norway spruce (Picea abies (L.) Karst.). Res. Rural Dev. 2013, 27–33. [Google Scholar]
- Lalík, M.; Galko, J.; Kunca, A.; Nikolov, Ch.; Rell, S.; Zúbrik, M.; Dubec, M.; Vakula, J.; Gubka, A.; Leonotvyč, R.; Longauerová, V.; Konôpka, B. Ecology, management and damage by the large pine weevil (Hylobius abietis) (Coleoptera: Curculionidae) in coniferous forests within Europe. Cent. Eur. For. J. 2021, 67, 91–107. [Google Scholar] [CrossRef]
- Šebeň, V. Národná inventarizácia a monitoring lesov Slovenskej republiky 2015-2016. Lesnícke štúdie 65, Národné lesnícke centrum: Zvolen, Slovakia, 2017, 256 p. (in Slovak).
- Carpio, A.; Apollonio, M.; Acevedo, P. Wild ungulate overabundance in Europe: contexts, causes, monitoring and management recommendations. Mam. Rev. 2020, 51, 95–108. [Google Scholar] [CrossRef]
- Valente, A.M.; Acevedo, P.; Figueredo, A.M.; Fonseca, C.; Torres, R.T. Overabundant wild ungulate populations in Europe: management with consideration of socio-ecological consequences. Mamm. Rev. 2020, 50, 353–366. [Google Scholar] [CrossRef]
- Balčiauskas, L.; Kawata, Y. Red deer in Lithuania: history, status and management. Sustainability 2022, 14, 14091. [Google Scholar] [CrossRef]
- Kopij, G. Spatial and temporal variation in population densities of roe deer Capreolus capeolus and the red deer Cervus elaphus in SW Poland. Agric. For. 2023, 69, 1239–154. [Google Scholar]
- Červený, J.; Hell, P.; Slamečka, J. Otto’s Encyclopedia: Game Management. Otto’s Publisher, 2010, Praha, Czech Republic, 591 p.
- Senn, J.; Suter, W. Ungulate browsing on silver fir (Abies alba) in the Swiss Alps: beliefs in search of supporting data. For. Ecol. Manag. 2003, 181, 151–164. [Google Scholar] [CrossRef]
- Häsler, H.; Senn, J. Ungulate browsing on European silver fir (Abies alba): the role of occasions, food shortage and diet preferences. Wildlife Bio. 2012, 18, 67–74. [Google Scholar] [CrossRef]
- San-Miguel-Ayanz, J.; De Rigo, D.; Caudulo, G.; Durrant, T.H.; Mauri, A. European Atlas of Forest Tree Species; Publication Office of the European Union: Luxembourg, 2016; 200 p. [Google Scholar]
- Třeštík, M.; Podrázský, V. Soil improving role of silver fir (Abies alba Mill.): A case study. ZLV 2017, 62, 182–188. (In Czech) [Google Scholar]
- Dobrowolska, D.; Boncina, A.; Klumpp, R. Ecology and silviculture of silver fir (Abies alba Mill.): a review. J. For. Res. 2017, 22, 1–10. [Google Scholar] [CrossRef]
- Mina, M.; del Río, M.; Huber, M.O.; Thürig, E.; Rohner, B. The symmetry of competitive interactions in mixed Norway spruce, silver fir and European beech forests. J. Veg. Sci. 2018, 29, 775–787. [Google Scholar] [CrossRef]
- Vacek, S.; Bulušek, D.; Vacek, Z.; Bílek, L.; Schwarz, O.; Simon, J.; Štícha, V. The role of shelterwood cutting and protection against game browsing for the regeneration of silver fir. Austrian J. For. Sci. 2015, 132, 81–102. [Google Scholar]
- Bödeker, K.; Jordan-Fragstein, C.; Vor, T.; Ammer, Ch.; Knoke, T. Abrupt height growth setbacks show overbrowsing of tree saplings, which can be reduced by raising deer harvest. Sci. Rep. 2023, 13, 12021. [Google Scholar] [CrossRef] [PubMed]
- Pagan, J.; Randuška, D. Atlas drevín. 2 - Cudzokrajné dreviny. Bratislava, Príroda, 1988, 408 p. (In Slovak).
- Podrázský, V.; Kupka, I.; Prknová, H. Substitution of Norway spruce for Douglas-fir: changes of soil microbial activities as climate change induced shift in species composition – a case study. Cent. Eur. For. J. 2020, 66, 71–77. [Google Scholar] [CrossRef]
- Martiník, A. Possibilities of growing Douglas fir (Pseudotsuga menziesii [Mirb.] Franco) in the conception of sustainable forest management. Ekológia (Bratislava) 2003, 22 (Suppl. S3), 136–146. [Google Scholar]
- Vitali, V.; Büntgen, U.; Bauhus, J. Silver fir and Douglas fir are more tolerant to extreme droughts than Norway spruce in south-western Germany. Glob. Chang. Biol. 2017, 23, 5108–5119. [Google Scholar] [CrossRef]
- Finďo, S.; Petráš, R. Ekologické základy ochrany lesa proti poškozovaniu zverou. Zvolen, National Forest Centre, 2007, 186 p. (in Slovak).
- Vacek, Z.; Cukor, J.; Linda, R.; Vacek, S.; Šimůnek, V.; Brichta, J.; Gallo, J. , Prokůpková, A. Bark stripping, the crucial factor affecting stem rot development and timber production of Norway spruce forests in Central Europe. For. Ecol. Manag. 2020, 474, 118360. [Google Scholar] [CrossRef]
- Hahn, Ch.; Vospernik, S.; Gollob, Ch.; Ritter, T. Bark stripping damage by red deer (Cervus elaphus L.) assessing the spatial distribution on the stand level using generalized additive models. Eur. J. For. Res. 2023, 142, 1–16. [Google Scholar] [CrossRef]
- Konôpka, B.; Zach, P.; Kulfan, J. Wind - An important ecological factor and destructive agent in forests. Lesn. Čas. – For. J. 2016, 62, 123–130. [Google Scholar] [CrossRef]
- Kunca, A.; Zúbrik, M.; Galko, J.; Vakula, J.; Leontovyč, R.; Konôpka, B.; Nikolov, Ch.; Gubka, A.; Longauerová, V.; Maľová, M.; Rell, S.; Lalík, M. Salvage felling in the Slovak Republic’s forests during the last twenty years (1998-2017). Cent. Eur. For. J. 2019, 65, 3–11. [Google Scholar] [CrossRef]
- Hahn, Ch.; Vospernik, S. Position, size, and spatial patterns of bark stripping wounds inflicted by red deer (Cervus elaphus L.) on Norway spruce using generalized additive models in Austria. Ann. For. Sci. 2022, 79, 13. [Google Scholar] [CrossRef]
- Wam, H. K.; Solberg, E. J.; Eriksen, R.; Granhus, A. Monitoring deer food and browsing in forests: Coherence and discrepancies between national and local inventories. Ecol. Indic. 2021, 120, 106967. [Google Scholar] [CrossRef]
- Cukor, J.; Vacek, Z. , Linda, J.; Vacek, S.; Marada, P.; Šimůnek, V.; Havránek, F. Effects of Bark Stripping on Timber Production and Structure of Norway Spruce Forests in Relation to Climatic Factors. Forests 2019, 10, 320. [Google Scholar] [CrossRef]
- Šebeň, V.; Kulla, V. Realizačný projekt objektu Husárik – aktualizovaná verzia 1.2. National Forest Centre – Forest Research Institute: Zvolen, Slovakia, 2011, 29 p. (In Slovak).
- Hlásny, T. et al. Spruce Forests Decline in the Beskids. National Forest Centre – Forest Research Institute: Zvolen, 2010, 182 p.
- Hančinský, L.: Lesné typy Slovenska. Príroda: Bratislava, Slovakia, 1972, 307 p. (In Slovak).
- Konôpka, B.; Šebeň, V.; Pajtík, J.; Shipley, L.A. Excluding Large Wild Herbivores Reduced Norway Spruce Dominance and Supported Tree Species Richness in a Young, Naturally Regenerated Stands. Forests 2021, 12, 737. [Google Scholar] [CrossRef]
- Kulla, L.; Sitková, Z. Rekonštrukcie nepôvodných smrečín. National Forest Centre – Forest Research Institute: Zvolen, Slovakia, 2010, 208 p. (In Slovak).
- Konôpka, B.; Šebeň, V.; Pajtík, J.; Shipley, L.A. Influence of Tree Species and Size on Bark Browsing by Large Wild Herbivores. Plants 2022, 11, 2925. [Google Scholar] [CrossRef]
- Konôpka, B.; Šebeň, V.; Pajtík, J. What have we learnt from the stand level estimates on stem bark browsing by large wild herbivores? Cent. Eur. For. J. 2023, 69, 21–30. [Google Scholar] [CrossRef]
- Prien, S. Wildschäden im Wald. Ökologische Grundlagen und Integrierte Schutzmaßnahmen; Paul Parey: Berlin, Germany, 1997; 257p. [Google Scholar]
- Welch, D.; Staines, B.W.; Scott, D.; Catt, D.C. Bark stripping damage by red deer in Sitka spruce forest in Western Scotland II. Wound size and position. Forestry 1988, 61, 245–254. [Google Scholar] [CrossRef]
- Renaud, P.C.; Verheyden-Tixier, H.; Dumont, B. Damage to saplings by red deer (Cervus elaphus): Effect of foliage height and structure. For. Ecol. Manag. 2003, 181, 31–37. [Google Scholar] [CrossRef]
- Konôpka, B.; Pajtík, J.; Šebeň, V.; Merganičová, K. Modeling Bark Thickness and Bark Biomass on Stems of Four Broadleaved Tree Species. Plants 2022, 11, 1148. [Google Scholar] [CrossRef] [PubMed]
- Vasiliauskas, R.; Stenlid, J. Discoloration following bark stripping wounds on Fraxinus excelsior. Eur. J. For. Pathol. 1998, 28, 383–390. [Google Scholar] [CrossRef]
- Tavankar, F.; Ezzati, S.; Latteriny, F.; Lo Monaco, A.; Venazi, R.; Picchio, R. Assessment of Wound Recovery and Radial Growth 10 Years after Forest Operations in Hardwood Stands. Forests 2022, 13, 1393. [Google Scholar] [CrossRef]
- Tavankar, F.; Picchio, R.; Nikooy, M.; Lo Monaco, A.; Venanzi, R.; Bodaghi, A.I. Healing rate of logging wounds on broadleaf trees in Hyrcanian forest with some technological implications. Drewno 2017, 60, 199. [Google Scholar] [CrossRef]
- Pusz, W.; Baturo-Ciesniewski, A.; Kaczmarek-Pienczewska, A.; Patejuk, K.; Czarnota, P. Is the Survivability of Silver Fir under Condition of Strong Ungulate Pressure Related to Mycobiota of Bark-Stripping Wounds? Forests 2021, 12, 976. [Google Scholar] [CrossRef]
- Delvaux, C.; Sinsin, B.; Darchanbeau, F.; Van Damme, P. Recovery from bark harvesting of 12 medicinal tree species in Benin, West Africa. J. App. Ecol. 2009, 46, 703–712. [Google Scholar] [CrossRef]
- Delvaux, C.; Sinsin, B.; Van Damme, P.; Beeckman, H. Wound reaction after bark harvesting: microscopic and macroscopic phenomena in ten medicinal tree species (Benin). Trees 2010, 24, 941–951. [Google Scholar] [CrossRef]
- Stobbe, H.; Schmitt, U.; Eckstein, D.; Dujesiefken, D. Developmental stages and fine structure of surface callus formed after debarking of living lime trees (Tilia sp.). Ann. Bot. 2002, 89, 773–782. [Google Scholar] [CrossRef]
- Mwange, K.N.; Hou, H.W.; Cui, K.M. Relationship between endogenous indole-3-acetic acid and abscisic acid changes and bark recovery in Eucommia ulmoides Oliv. after girdling. J. Exp. Bot. 2003, 54, 1899–1907. [Google Scholar] [CrossRef]
- Zwieniecki, M.A.; Melcher, P.J.; Field, T.S.; Holbrook, N.M. A potential role for xylem–phloem interactions in the hydraulic architecture of trees: effects of phloem girdling on xylem hydraulic conductance. Tree Physiol. 2004, 24, 911–917. [Google Scholar] [CrossRef]
- Schmitt, U.; Liese, W. Wound reaction of the parenchyma in Betula. Iawa Bull. 1990, 11, 413–420. [Google Scholar] [CrossRef]
- Frankenstein, C.; Schmitt, U.; Koch, G. Topochemical studies on modified lignin distribution in the xylem of poplar (Populus spp.) after wounding. Ann. Bot. 2006, 97, 195–204. [Google Scholar] [CrossRef] [PubMed]
- Nakou, A.; Sauter, U.H.; Kohnle, U. Improved models of harvest-induced bark damage. Ann. For. Sci. 2015, 73, 233–246. [Google Scholar] [CrossRef]
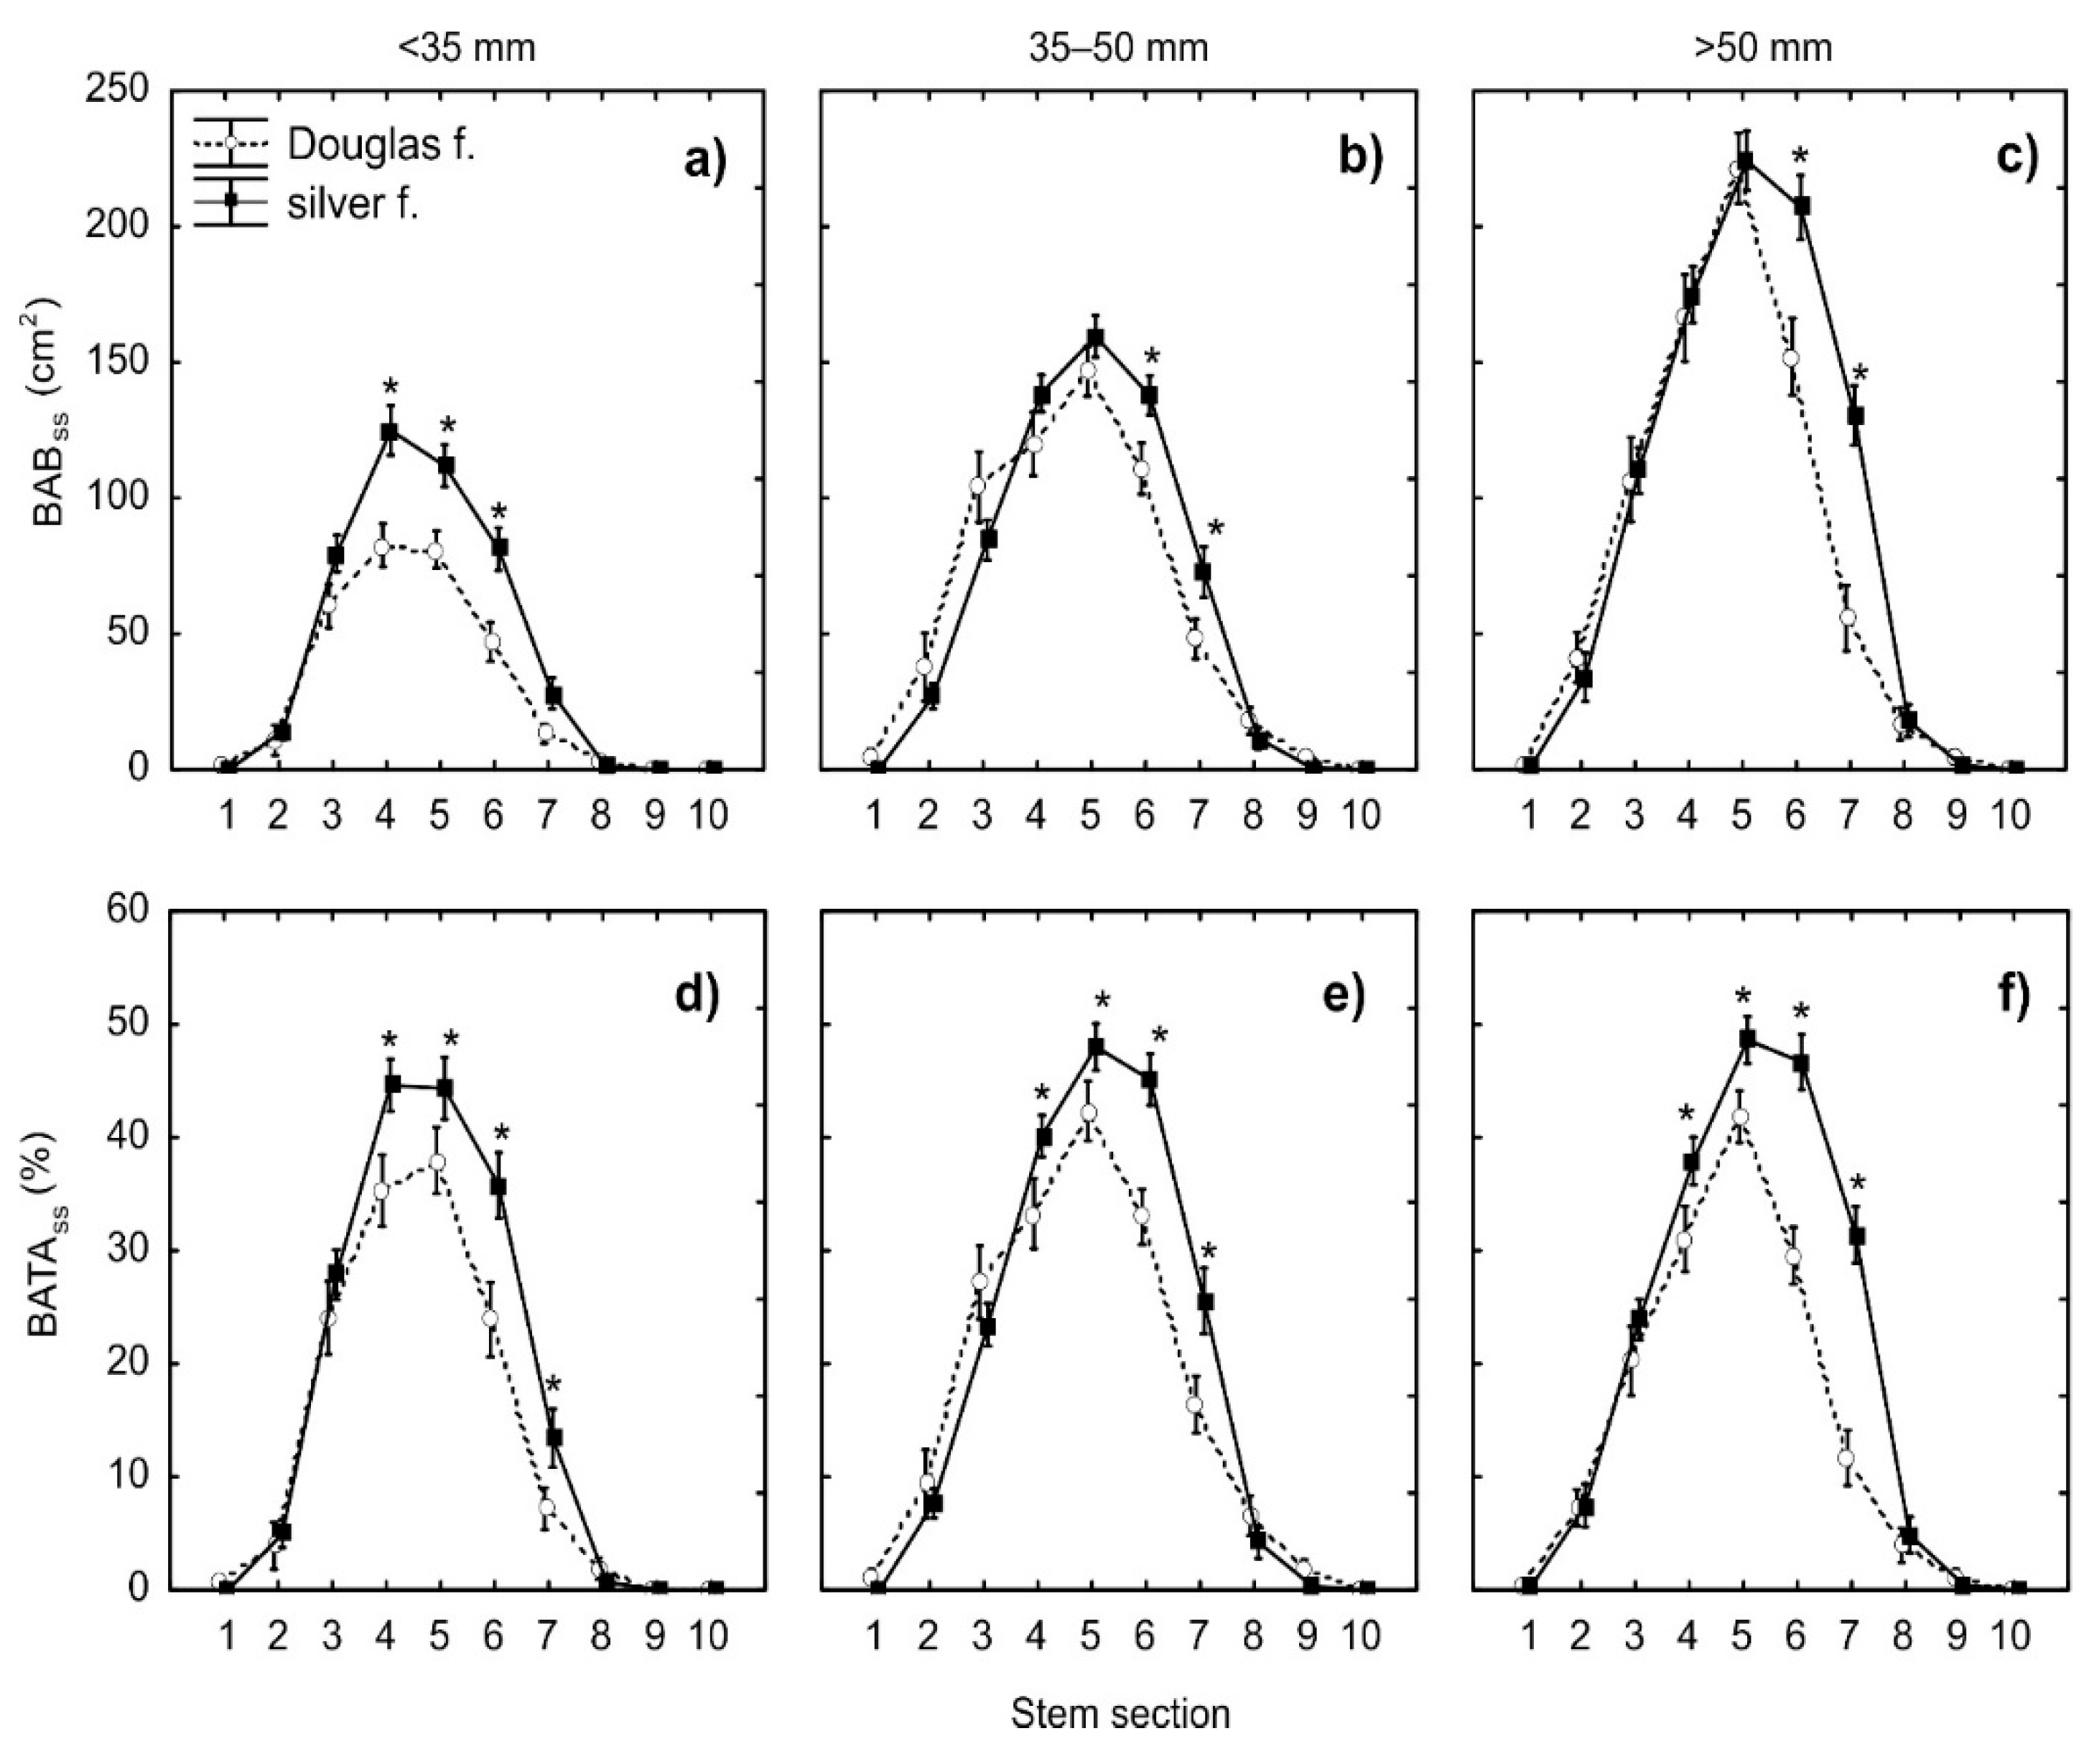
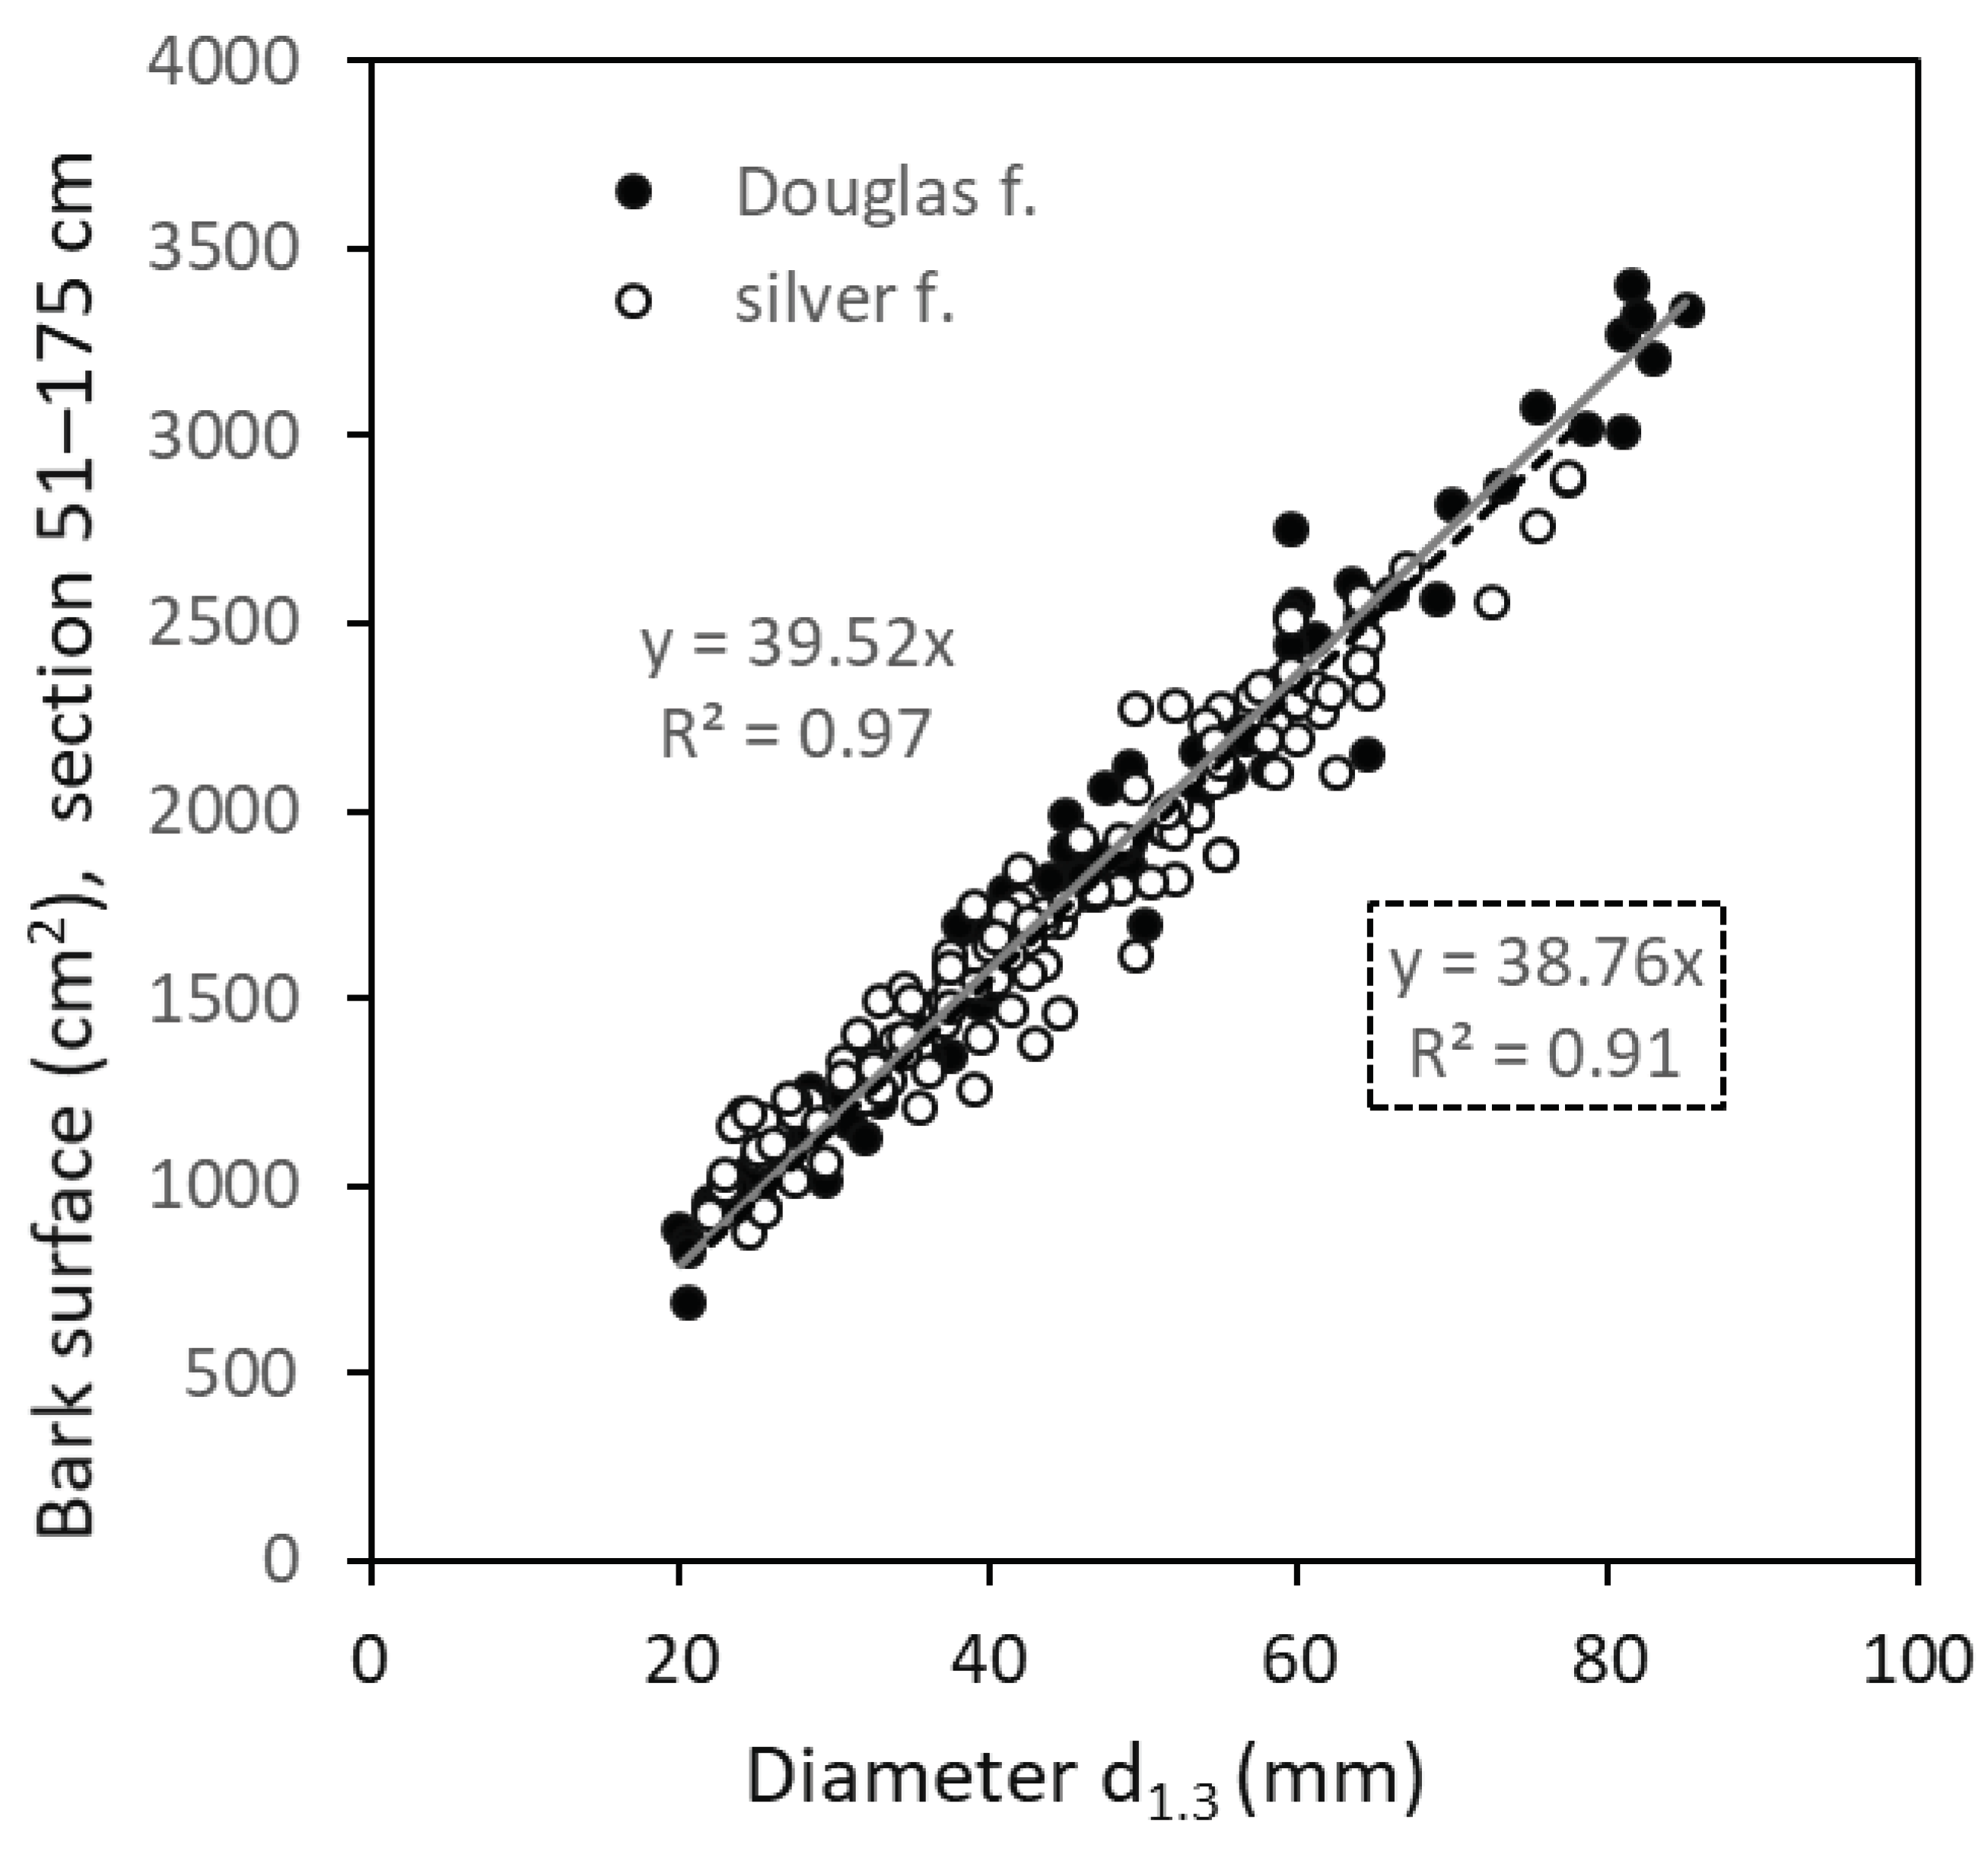
| Level | Stem sections | Entire stem | ||
|---|---|---|---|---|
| Indicator | Abbreviation | Unit | Abbreviation | Unit |
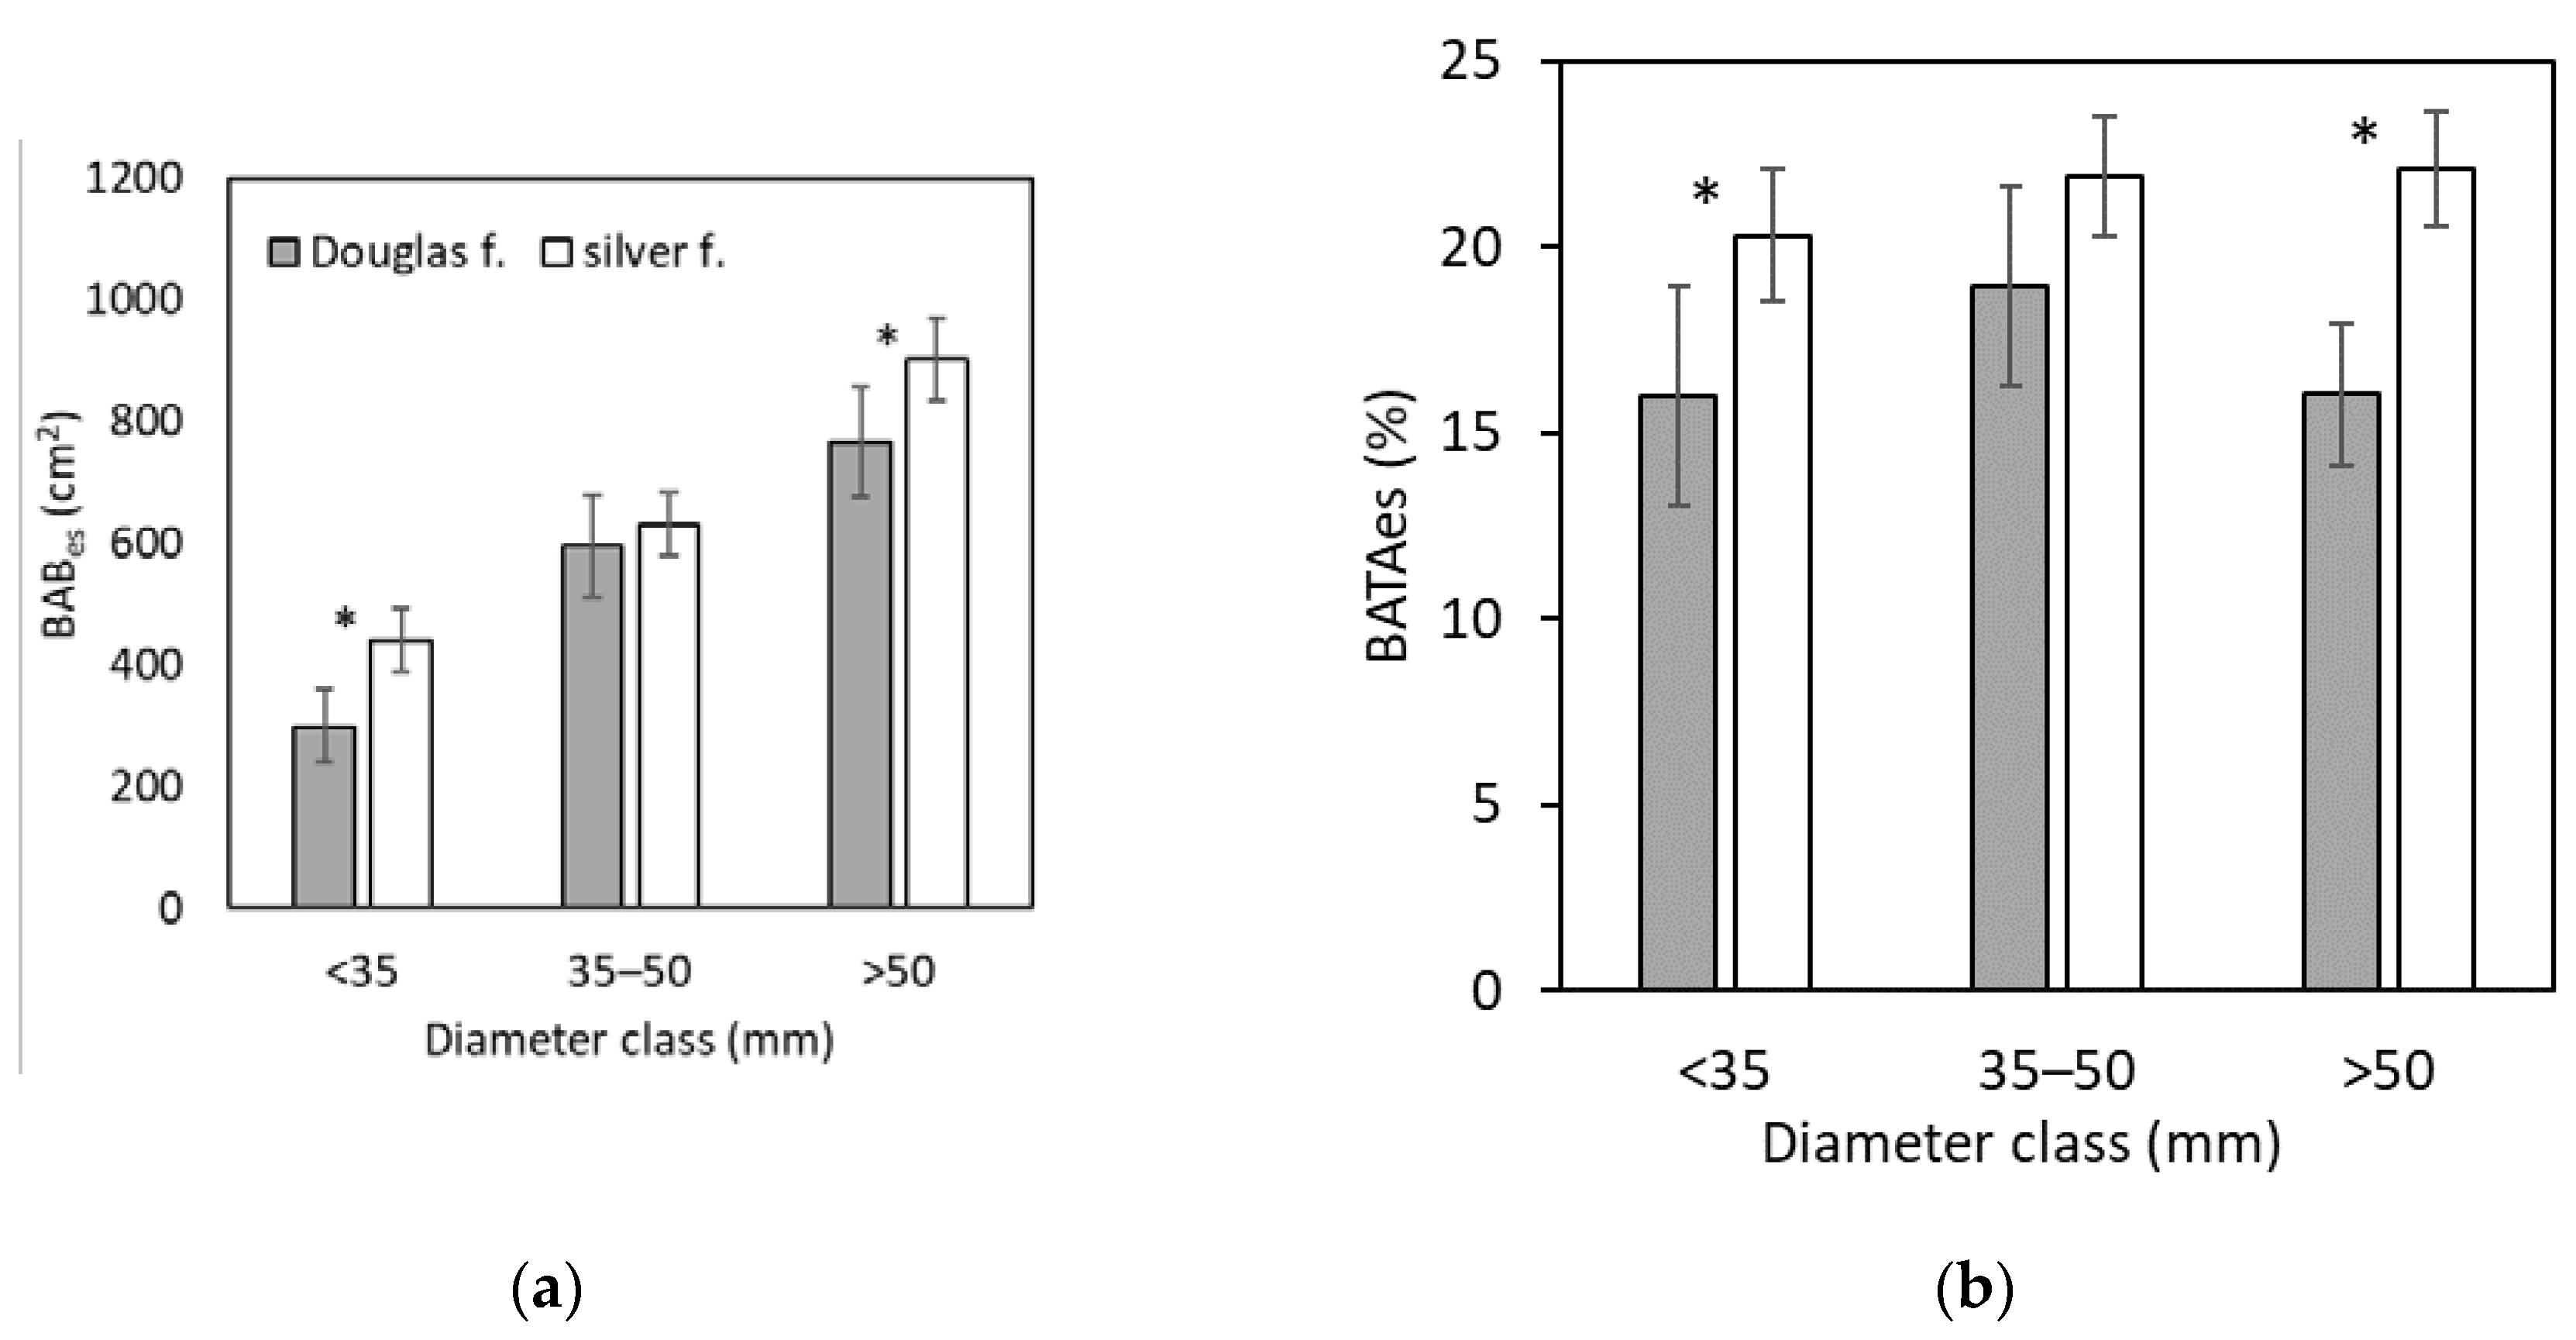
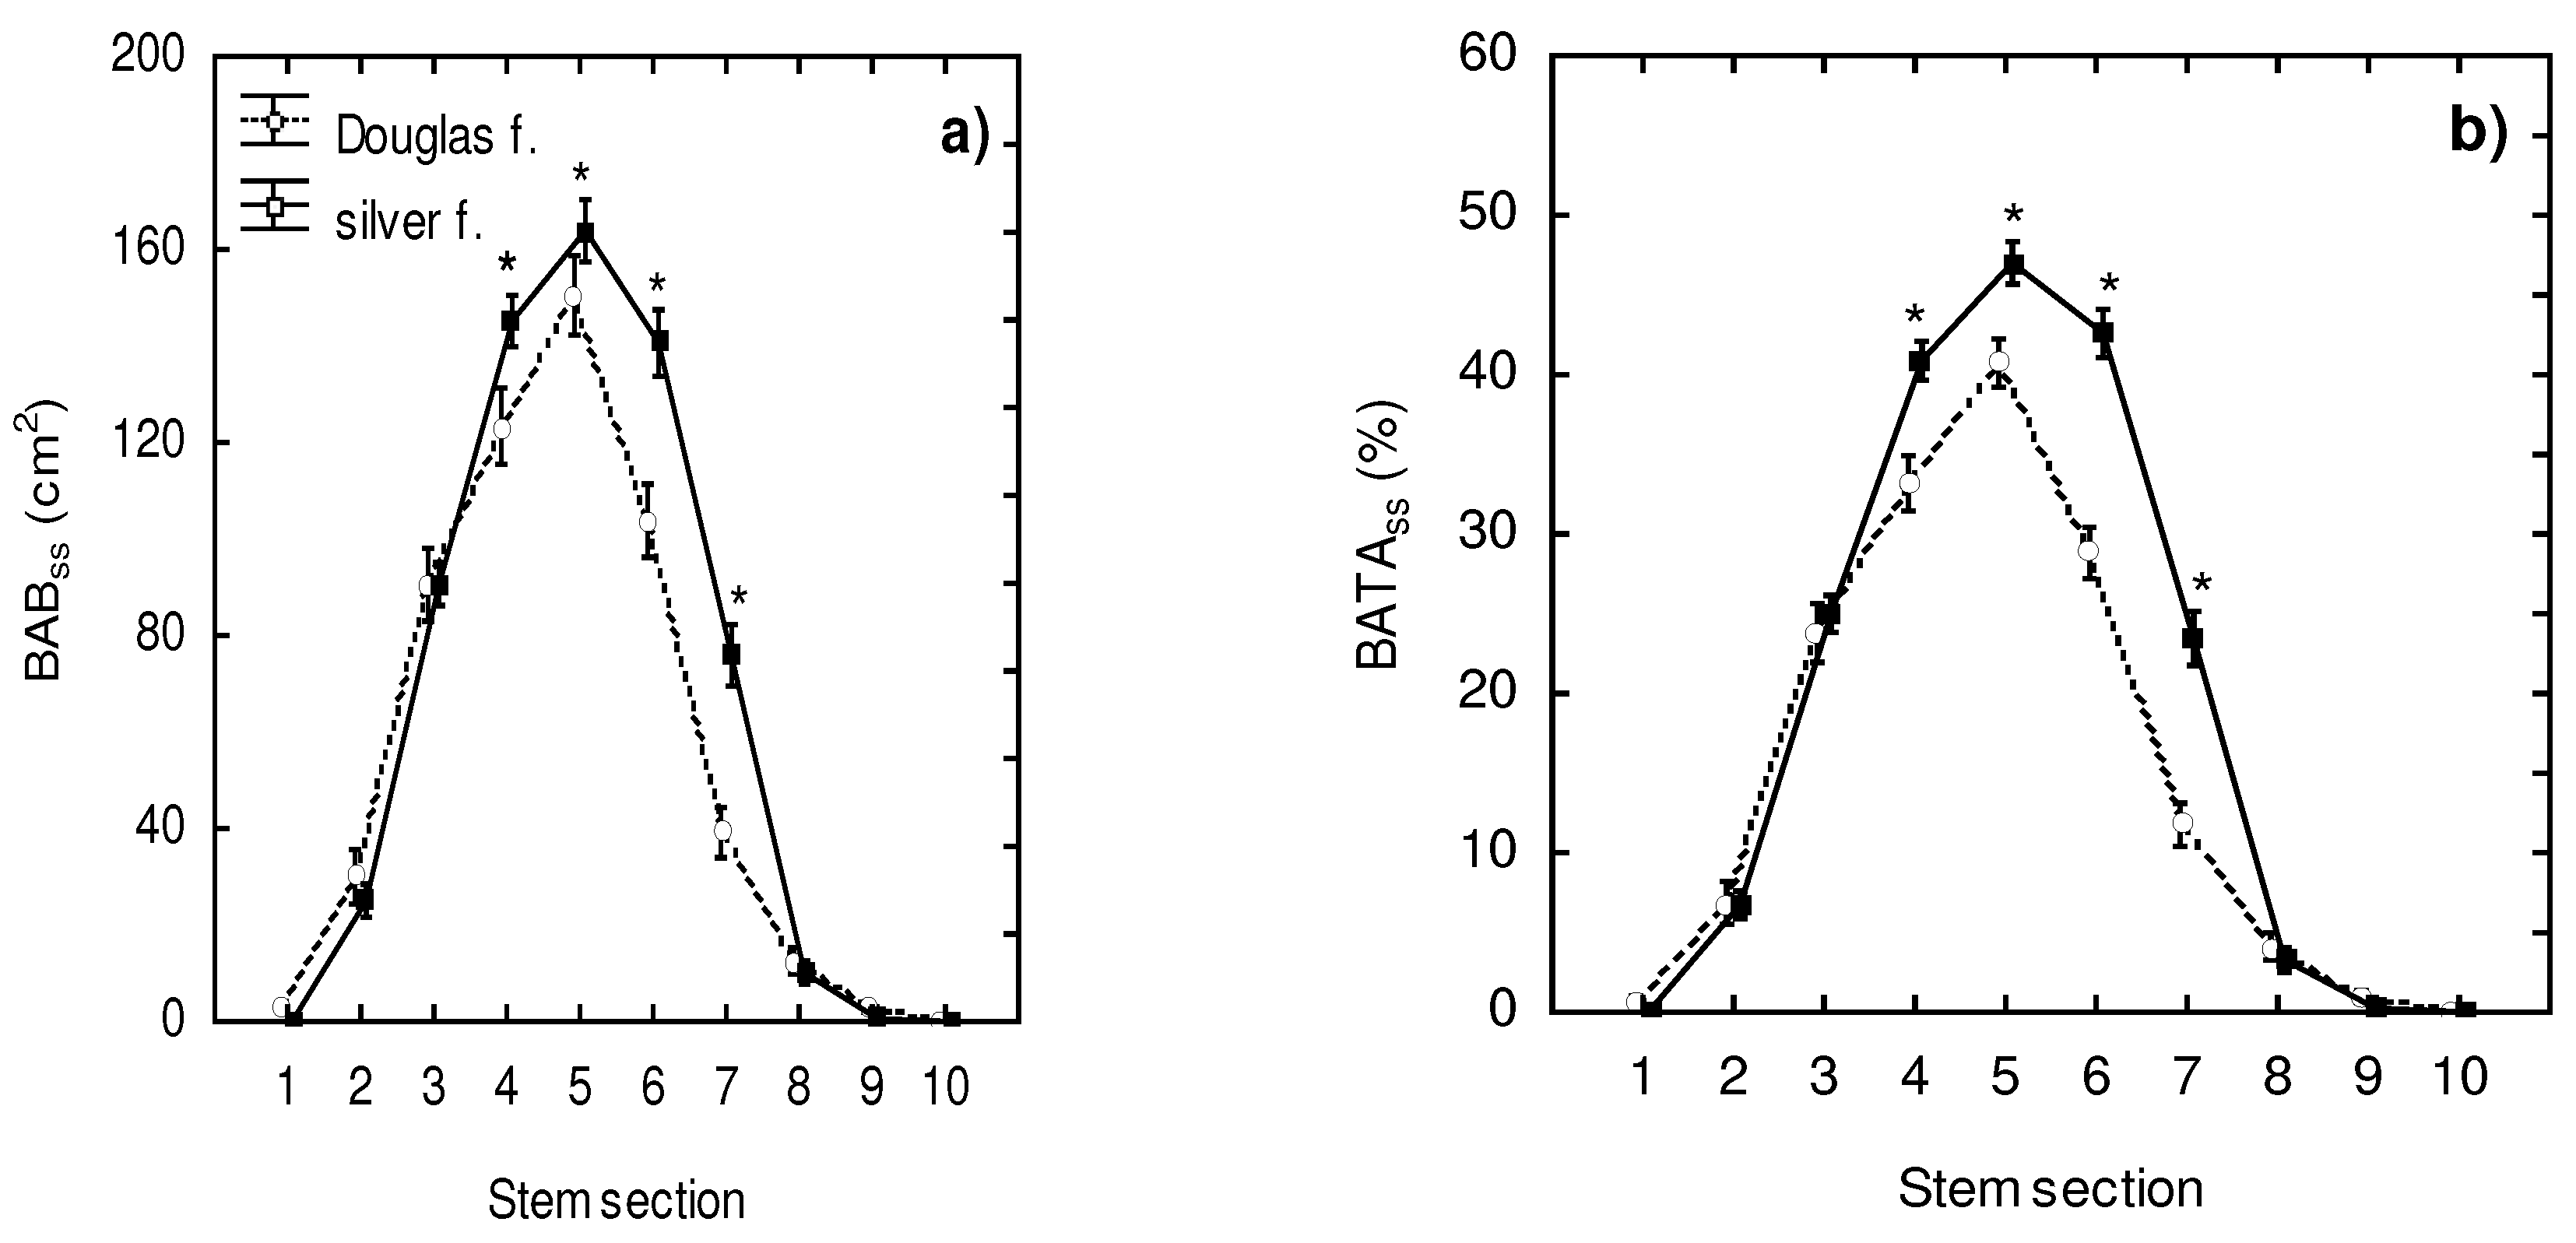
| Browsed area of bark | BABss | cm2 | BABes | cm2 |
| Recovered area of bark | RABss | cm2 | RABes | cm2 |
| Unrecovered area of bark | UABss | cm2 | UABes | cm2 |
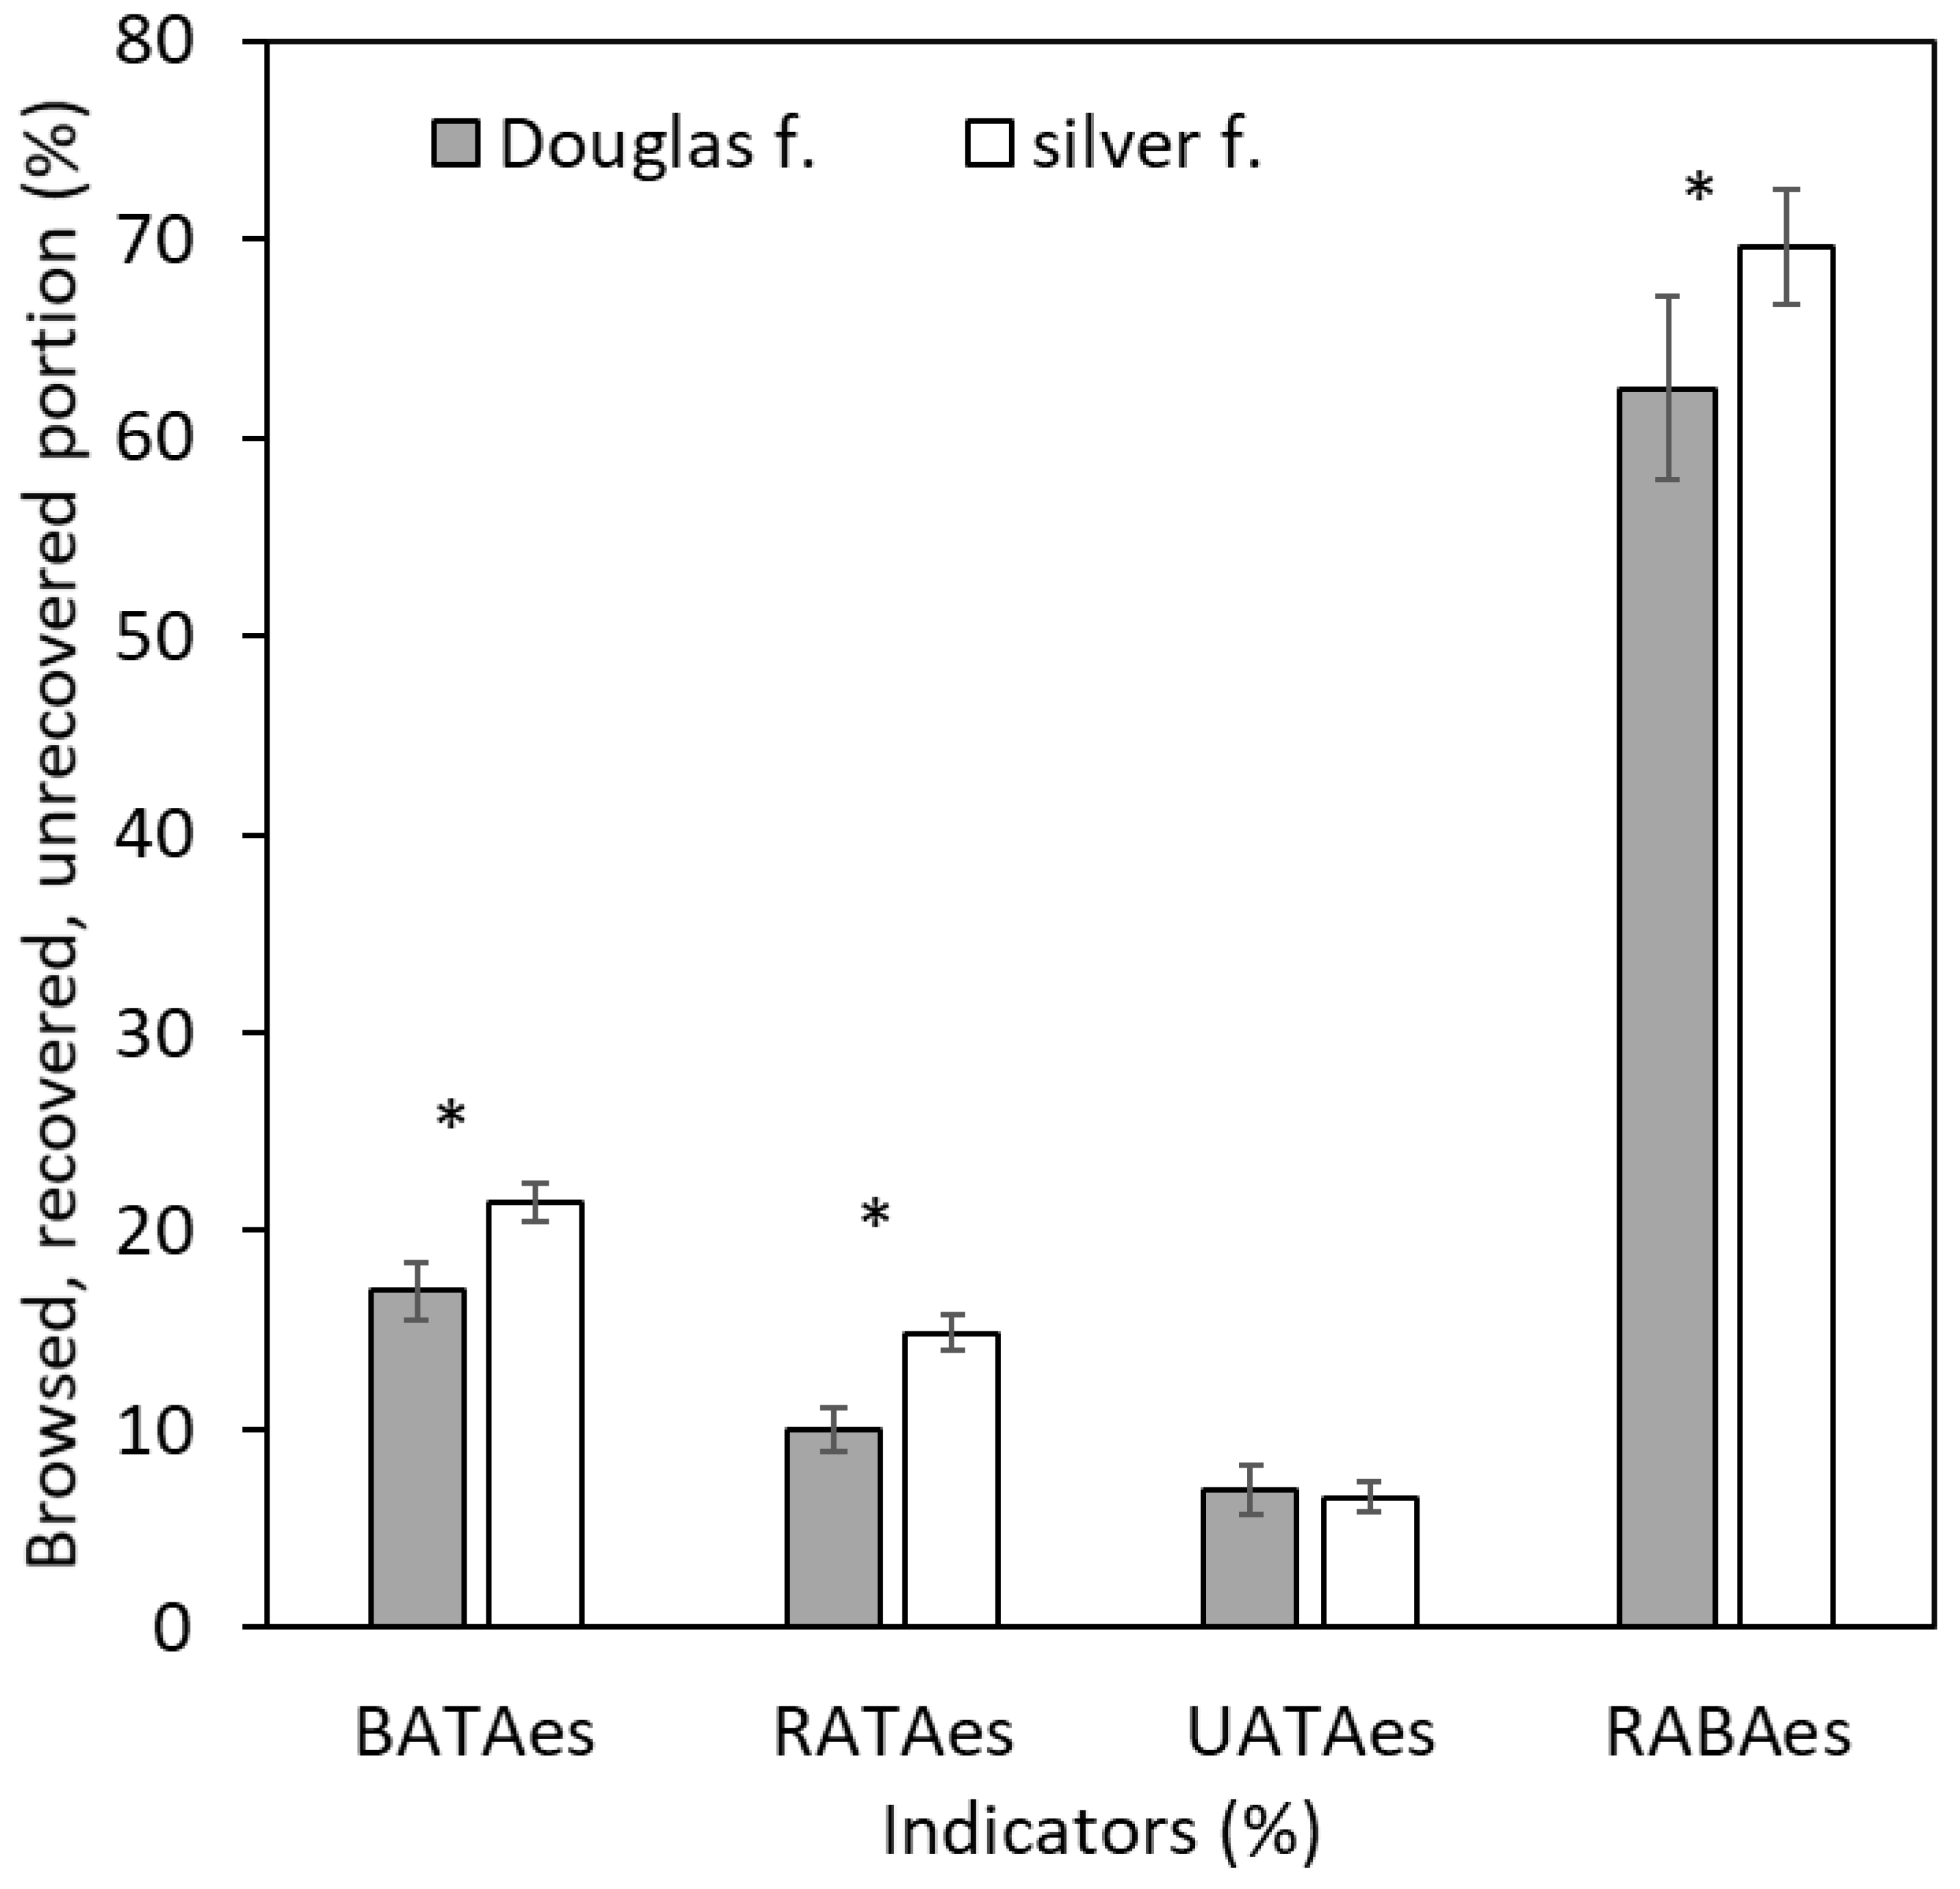
| Browsed area to total area | BATAss | % | BATAes | % |
| Recovered area to total area | RATAss | % | RATAes | % |
| Unrecovered area to total area | UATAss | % | UATAes | % |
| Recovered area to browsed area | RABAss | % | RABAes | % |
| Tree species | Characteristics | Mean | S.D. | Minimum | Maximum | 25th percentile | 75th percentile |
|---|---|---|---|---|---|---|---|
| Douglas fir | Tree height (m) | 4.01 | 1.17 | 2.50 | 7.80 | 3.10 | 4.60 |
| (n = 100) | Diameter d1.3 (mm) | 45.13 | 18.08 | 16.50 | 85.00 | 30.50 | 59.00 |
| Silver fir | Tree height (m) | 3.63 | 0.80 | 2.40 | 6.50 | 3.00 | 4.30 |
| (n=110) | Diameter d1.3 (mm) | 42.53 | 13.11 | 19.50 | 77.50 | 32.50 | 52.00 |
| Type of ANOVA |
Factor vs indicators |
BABes | RABes | UABes | ||||||
| Df | F-value | p-values | Df | F-value | p-values | Df | F-value | p-values | ||
| two-way |
TS | 1 | 13.611 | <0.0001 | 1 | 34.310 | <0.0001 | 1 | 2.503 | 0.115 |
| DC | 2 | 87.327 | <0.0001 | 2 | 95.967 | <0.0001 | 2 | 4.156 | 0.017 | |
| TSxDC | 2 | 1.442 | 0.239 | 2 | 3.419 | 0.035 | 2 | 3.937 | 0.020 | |
| Type of ANOVA |
Factor vs indicators |
BABss | RABss | UABss | ||||||
| Df | F-value | p-values | Df | F-value | p-values | Df | F-value | p-values | ||
| three-way | TS | 1 | 29.436 | <0.0001 | 1 | 88.197 | <0.0001 | 1 | 5.138 | 0.024 |
| DC | 2 | 188.858 | <0.0001 | 2 | 241.102 | <0.0001 | 2 | 8.532 | <0.0001 | |
| SS | 9 | 405.010 | <0.0001 | 9 | 300.746 | <0.0001 | 9 | 97.346 | <0.0001 | |
| TSxDC | 2 | 3.118 | 0.044 | 2 | 8.590 | <0.0001 | 2 | 8.155 | <0.0001 | |
| TSxSS | 9 | 8.025 | <0.0001 | 9 | 12.288 | <0.0001 | 9 | 4.995 | <0.0001 | |
| DCxSS | 18 | 19.675 | <0.0001 | 18 | 23.680 | <0.0001 | 18 | 2.423 | <0.0001 | |
| TSxDCxSS | 18 | 1.841 | 0.017 | 18 | 2.116 | 0.004 | 18 | 3.164 | <0.0001 | |
| Type of ANOVA |
Factor vs indicators |
BATAes | RATAes | UATAes | RABAes | ||||||||
|---|---|---|---|---|---|---|---|---|---|---|---|---|---|
| Df | F-value | p-values | Df | F-value | p-values | Df | F-value | p-values | Df | F-value | p-values | ||
| two-way | TS | 1 | 26.469 | <0.0001 | 1 | 54.712 | <0.0001 | 1 | 0.382 | 0.537 | 1 | 8.044 | 0.005 |
| DC | 2 | 2.402 | 0.93 | 2 | 12.663 | <0.0001 | 2 | 5.59 | 0.003 | 2 | 7.196 | <0.0001 | |
| TSxDC | 2 | 1.102 | 0.334 | 2 | 3.362 | 0.037 | 2 | 1.006 | 0.367 | 2 | 2.877 | 0.059 | |
| Type of ANOVA |
Factor vs indicators |
BATAss | RATAss | UATAss | RABAss | ||||||||
| Df | F-value | p-values | Df | F-value | p-values | Df | F-value | p-values | Df | F-value | p-values | ||
| three-way | TS | 1 | 56.593 | <0.0001 | 1 | 126.623 | <0.0001 | 1 | 0.688 | 0.407 | 1 | 7.587 | 0.006 |
| DC | 2 | 12.052 | <0.0001 | 2 | 46.891 | <0.0001 | 2 | 10.326 | <0.0001 | 2 | 37.289 | <0.0001 | |
| SS | 9 | 455.791 | <0.0001 | 9 | 344.52 | <0.0001 | 9 | 102.707 | <0.0001 | 9 | 227.703 | <0.0001 | |
| TSxDC | 2 | 3.196 | 0.041 | 2 | 10.387 | <0.0001 | 2 | 3.002 | 0.049 | 2 | 1.855 | 0.157 | |
| TSxSS | 9 | 12.120 | <0.0001 | 9 | 16.94 | <0.0001 | 9 | 4.330 | <0.0001 | 9 | 4.805 | <0.0001 | |
| DCxSS | 18 | 3.931 | <0.0001 | 18 | 4.832 | <0.0001 | 18 | 3.625 | <0.0001 | 18 | 1.588 | 0.055 | |
| TSxDCxSS | 18 | 0.868 | 0.0619 | 18 | 2.137 | 0.004 | 18 | 1.395 | 0.123 | 18 | 1.089 | 0.356 | |
Disclaimer/Publisher’s Note: The statements, opinions and data contained in all publications are solely those of the individual author(s) and contributor(s) and not of MDPI and/or the editor(s). MDPI and/or the editor(s) disclaim responsibility for any injury to people or property resulting from any ideas, methods, instructions or products referred to in the content. |
© 2024 by the authors. Licensee MDPI, Basel, Switzerland. This article is an open access article distributed under the terms and conditions of the Creative Commons Attribution (CC BY) license (http://creativecommons.org/licenses/by/4.0/).


