1. Introduction
The development of improved charging strategies for electric vehicles (EVs) has emerged as a pivotal pursuit within the automotive industry [
1,
2]. As the global transition towards decarbonization and electric mobility accelerates, the need for efficient and cost-effective charging solutions becomes increasingly pronounced. This imperative is underpinned by the twin objectives of minimizing the cost of recharging electric vehicles and never running out of energy while driving. In this paper, we formalize and implement eleven different commonly used charging strategies across three electricity markets, and compare their relative costs, as a means to quantify the tangible benefits achievable with relatively simple and scalable automation.
One of the foremost challenges impeding the widespread adoption of electric passenger cars lies in addressing the complexities associated with their charging requirements. Despite the environmental benefits and technological advancements in this domain, potential users often express apprehensions regarding the convenience of charging. This concern is exacerbated by the fluctuating energy costs, which can significantly impact the overall affordability and practicality of EV ownership. Regular people have difficulties understanding and predicting the true costs associated with switching to electromobility. Intelligent solutions that enhance the efficiency of the charging process, such as automatic charging strategies enabled by energy price forecasts, promise to significantly improve the user experience, thereby addressing a key barrier to the broader adoption of electric passenger cars.
Our objective is to quantify improvement potential in charging strategies by implementing and comparing different realistic solutions. Since these benefits clearly depend on the specifics of electricity price fluctuations, we showcase the results from three different markets. All but the most basic strategies require some estimation of the future energy prices to make charging decisions. Given that it is not possible to have perfect knowledge of future prices, we utilize commercial forecasts from StormGeo, an energy forecasting company, and further compare them against our own very simple directly-computed forecasts.
One key consideration is that we focus on realistic, or practical, strategies – ones that can be directly implemented today in a relatively straightforward way by an individual vehicle owner, or a family household. While much work is done on smart grid optimization, no corresponding customer-ready solutions exist on the market yet. In many cases, starting and stopping the charging at a given time, or at a given charge level, is the most advanced automation capability available to a “regular” (i.e., not overly tech savvy) EV user. With quick technological development, this is likely to improve in the future, of course, but understanding what solutions are feasible already today will certainly help with increased EV market penetration.
The contributions of this paper are as follows. First, we compare eleven different realistic charging strategies in terms of overall energy costs, across three different electricity markets: Sweden, Denmark, and Germany. Second, we quantify the benefits of using commercially available electricity forecasts, as opposed to a naive approach, as a key component in some charging strategies. We also demonstrate how these benefits differ across the aforementioned markets, depending on varying patterns exhibited by energy prices. Finally, we benchmark the results against perfect future knowledge, with a week-long planning horizon.
2. Related Work
This section presents the related research, in particular earlier work on optimal charging strategies. The closest to our paper is Ayyadi et al. [
3], who proposed a method to minimize the cost of charging electric vehicles (EVs) by considering factors like electricity prices, battery degradation costs, and charging constraints. The approach, applied to a residential area with varying EV penetration rates, employs Monte Carlo Simulations to handle uncertainties in arrival and departure times. Results from optimization done through linear programming on a single-phase Low Voltage distribution network demonstrate a significant reduction (50% for 100% EV penetration, and 38% for 50% penetration) in charging costs compared to uncoordinated charging. Unlike our paper, they consider a setup where multiple vehicle owners collaborate and synchronize charging times to minimize the effects on the electricity distribution grid. While certainly an important future challenge, at the current stage of smart grid and EV integration, it is not a particularly realistic scenario. In fact, even the much simpler strategies proposed in this paper can sometimes be too difficult to implement for less tech-savvy car owners.
Under a related but somewhat different scenario, similar challenges are present in the widespread use of electric buses, such as high charging costs and inefficient use of charging resources. The researchers in [
4] propose a model using mixed integer programming to optimize charging power and time, aiming to reduce overall charging costs. To enhance efficiency in large-scale charging scenarios, they introduce a column-generation-based algorithm. Experimental analysis demonstrates that the optimized charging strategy can cut charging costs by approximately 36.1% compared to uncontrolled charging, showcasing its potential for application in large-scale fleet operations. However, just as in [
3], they assume a significantly more fine-grained control over the charging process than what is convenient today. In addition, a single owner or operator of a large vehicle fleet, as is typical with public transport, can enforce a synchronized solution that would not be possible for independent owners of passenger cars.
The integration of electric vehicles (EVs) and renewable energy holds promise for a fossil fuel-free future, but managing EV fleets efficiently presents challenges. This involves collaboration among various stakeholders, including governments, automakers, and end-users. While EVs are primarily for driving needs, existing charging models do not consider the stochastic nature of driving patterns. The study [
5] introduces a dynamic programming model that optimally charges an EV, considering the uncertainty in its usage. Using an inhomogeneous Markov model fitted with real EV usage data, the research highlights the significant impact of the inherent randomness in driving needs on the charging strategy. Accounting for uncertainties in driving patterns is an important future work, but out of the scope for this paper.
Authors in [
6] consider the optimization of the operational cost of a charging station serving plug-in hybrid electric vehicles (PHEVs) by incorporating a local storage energy unit with finite capacity. The pricing of electrical power is determined by a real-time pricing scheme, where prices are continuously updated based on the grid’s state. The charging station is modeled as a continuous-time Markov Decision Process with control actions, including the probability of blocking new arrivals, the charging rate, and the proportion of cars served by the battery. Using dynamic programming, the researchers prove the existence of an optimal policy that minimizes costs over an infinite time horizon. They also demonstrate that this optimal policy is both stationary and bang-bang, meaning it assumes only extreme values in the action set. The possibility of using EV batteries as local energy storage is certainly enticing, but the vehicle-to-grid technology is not mature enough to be an option for an average EV owner.
3. Methodology
In this section, we describe in detail the methodology we have employed to produce insights concerning the comparison of different charging strategies under varying conditions. For practical reasons, we focus on much of the discussion on simple strategies – since they are the most common among typical vehicle owners today.
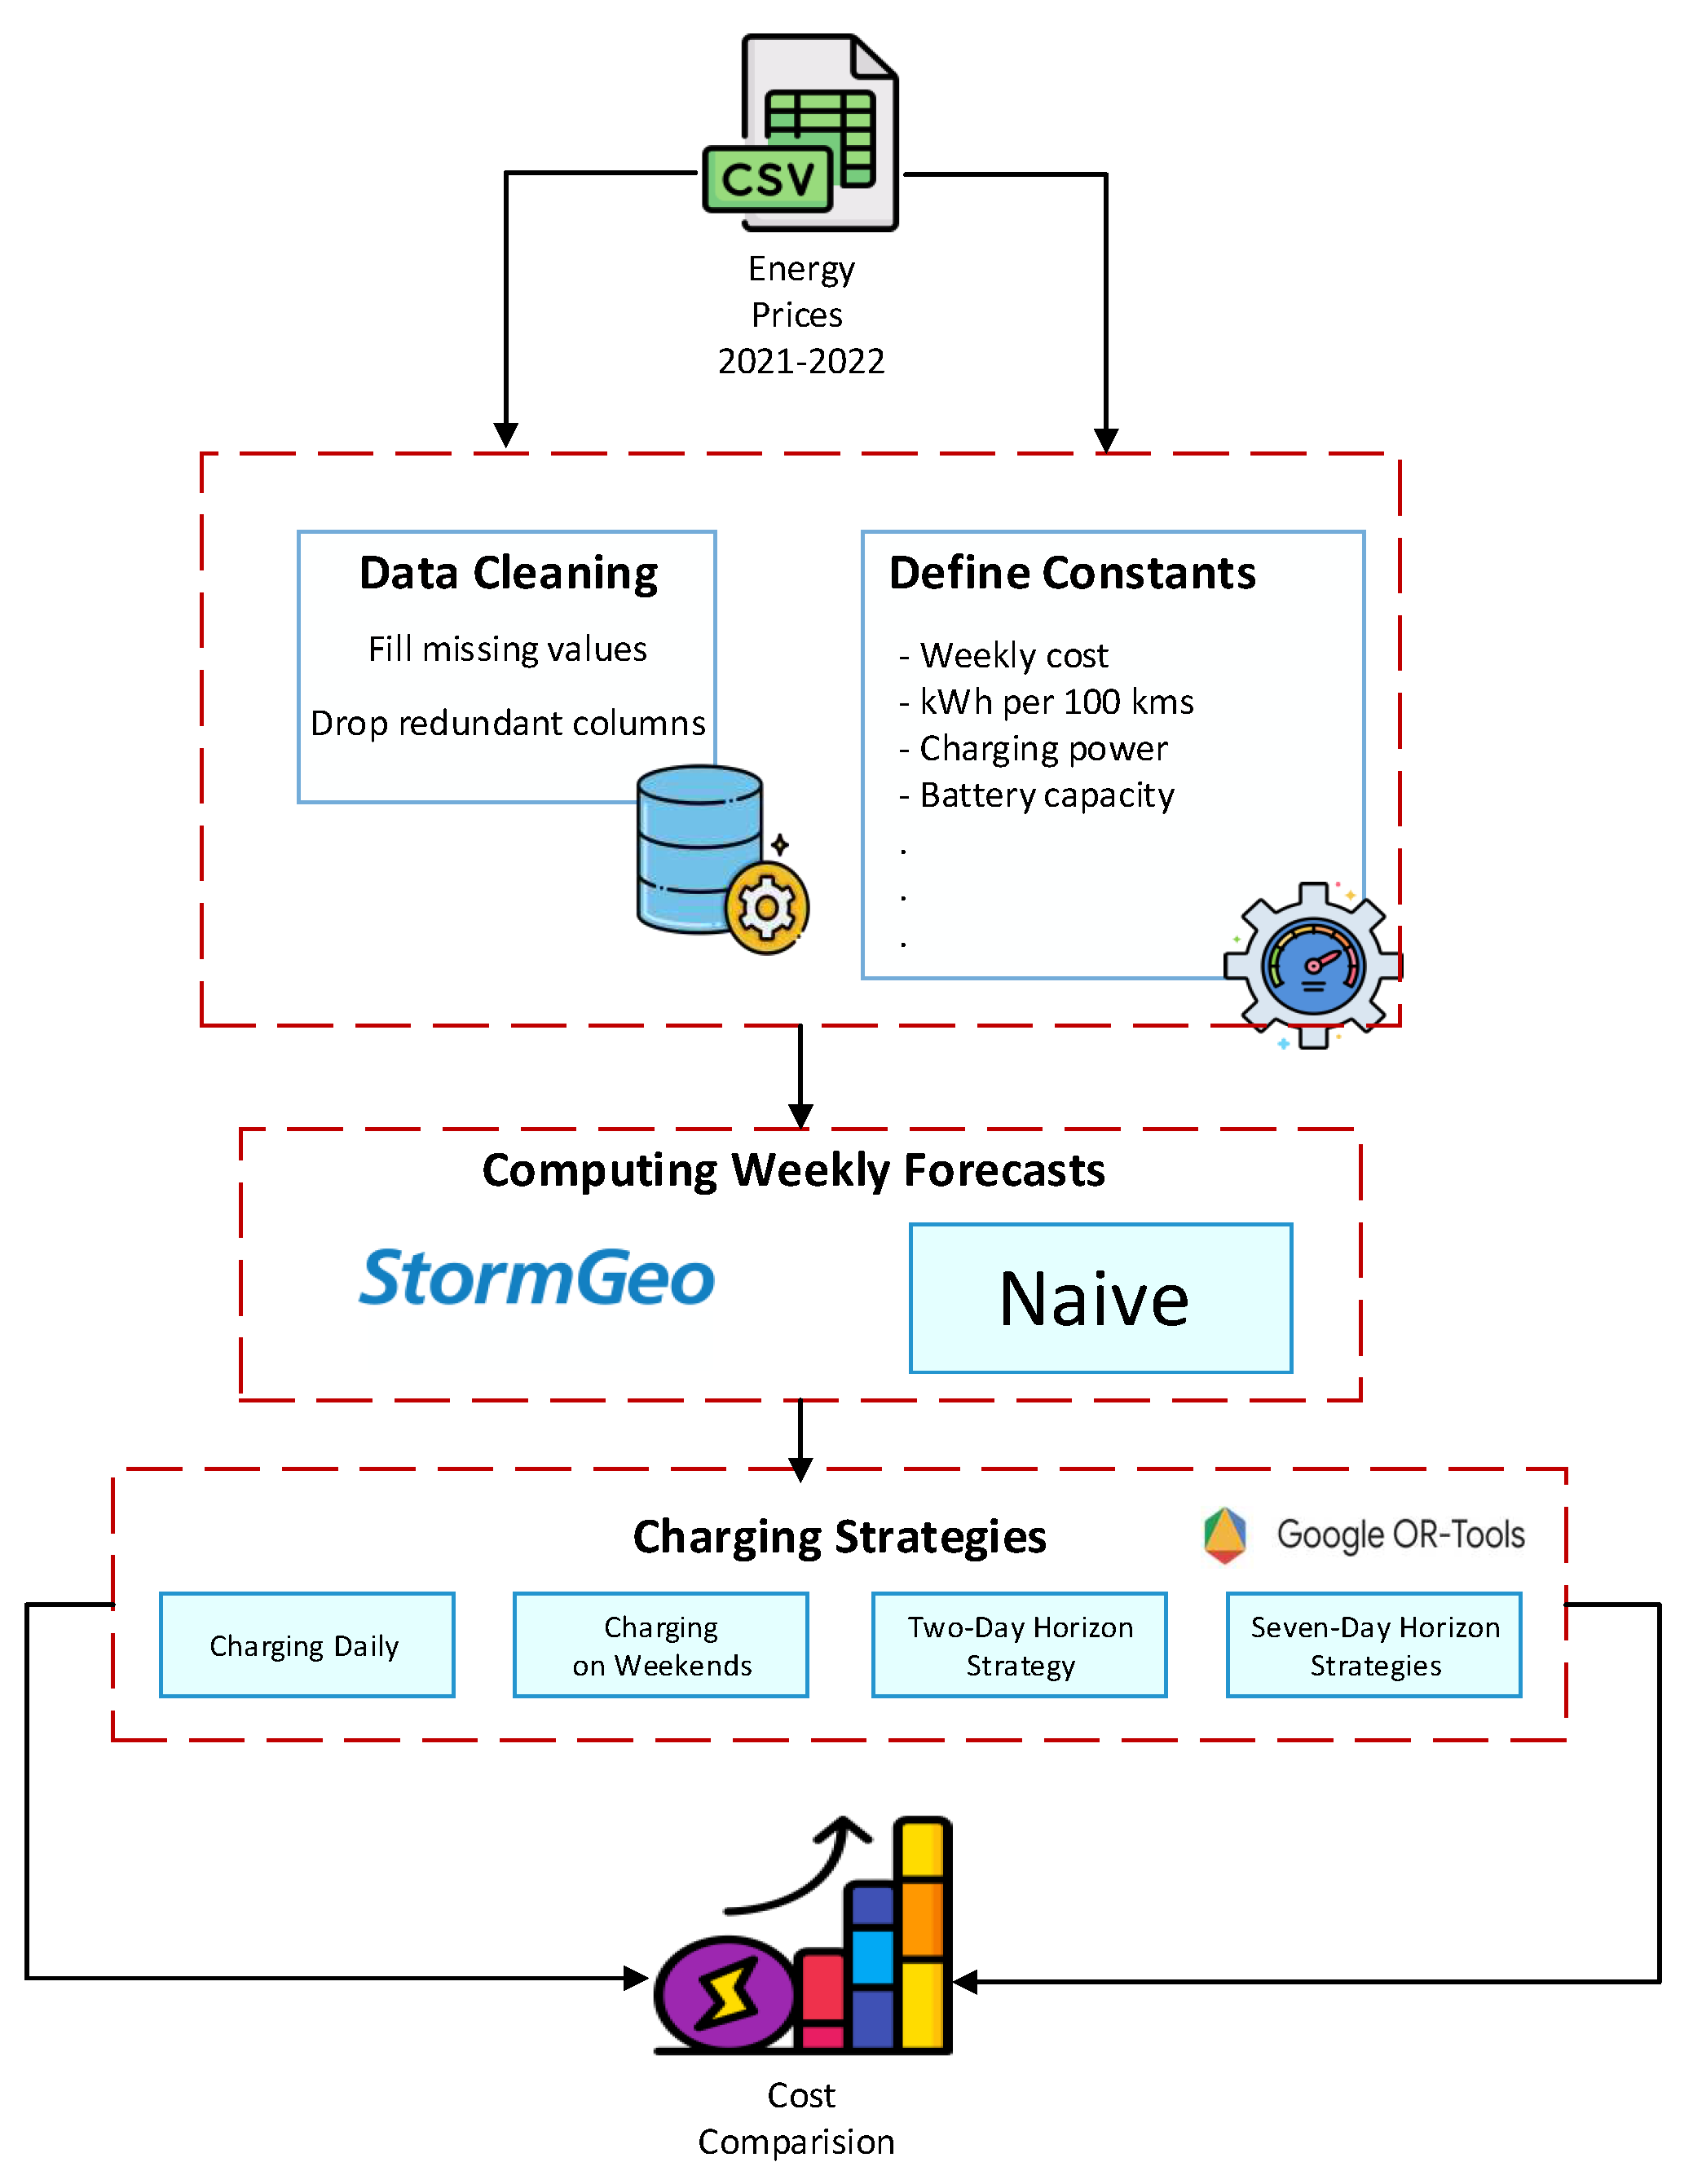
Figure 1 illustrates the process of the proposed energy price analysis methodology. The dataset under examination is sourced from the ENTSO-E Transparency Platform
1, capturing hourly energy prices spanning the time frame from 2021 to 2022, specifically within the SE3, DK2, and DE-LU regions. The initial phase of analysis commences with data cleansing procedures, for example, handling daylight saving time.
For the next step, we defined our charging strategies based on the following simple but reasonably realistic base case scenario. We assume driving 15 000 km per year (the average Swedish vehicle drives just 11 000 km per year, but many of them are not primary cars – while most electric vehicles are, which justifies a somewhat higher mileage). We consider the battery size to be 69 kWh and the energy consumption 25 kWh per 100 km, which means a theoretical range of 276 km with 100% battery.
Daily driving distances are randomly generated according to a gamma distribution (which is a reasonably good approximation of how an average car is driven in Sweden) with and , which corresponds to the yearly distance of 15 000 km. The charging strategies utilize a range between 20 to 80% of the battery. These thresholds follow manufacturers’ recommendations and are important for conserving battery health since both fully charging and fully discharging lead to a significantly shorter lifetime.
We are using the forecasts of future energy prices with a 7-day horizon, both when utilizing commercial StormGeo forecasts and the naive forecast technique, since this is the longest look-ahead in any of the evaluated strategies. The main reason for using these two forecasts is to check what benefits a more advanced forecast can provide, compared to directly implementing a naive one. The StormGeo energy analysis builds fundamental models and methods with a strong emphasis on the combination of economic theory, market models, weather impacts, and marginal cost calculations. The naive forecasts are computed with the simple idea that, for any given hour on a day in a week, the price is going to be similar to the past prices at the same time; thus, the forecast is computed as the average of the previous four weeks of prices at that hour on that day of the week. It is important to note that on any given day, the actual energy prices for the upcoming 24 hours are known and do not need to be forecasted.
The following constants are used in all charging strategies:
Battery capacity = 69 kWh
Upper charge threshold = 80% of battery capacity
Lower charge threshold = 20% of battery capacity
Charging power = 7 kW
Car usage hours (charging is blocked during these hours): 8 AM to 5 PM
The key contribution of our paper is eleven distinct charging strategies, which can be categorized into strategies with horizons of one day, two days, and seven days. One-day horizon plans include daily and weekend charging strategies. Two-day horizon plans include the current 2-day Plug&Save service provided by WirelessCar
2, which is referred to by the name ’2-day Plug & Save’ for the sake of simplicity. The seven-day horizon plans include a strategy that corresponds to an “oracle charging strategy” which treats the problem of charging for a week as a linear programming problem and solves it. The following subsections describe the strategies in more detail.
3.1. One-day horizon strategies
3.1.1. Average price, all hours
Is a baseline that we use in order to capture the expected costs without any particular charging strategy. It is the average energy price over the entire time period. Since the costs are not dependent on specific driving behavior, the results are deterministic – and therefore, in the results below, we do not report standard deviation.
3.1.2. Charging daily
This is the most basic charging strategy, which proposes charging every day at a fixed time. We utilize three versions of it – one which involves charging from 2 AM every day, one which involves charging from 5 PM every day, and one which involves charging at the cheapest hours every day. We name them “All nights, 2 AM”, “All afternoons, 5 PM” and “All nights, optimal night hours”. These strategies are characterized by their simplicity and reliability, as they minimize the risk of running out of battery power during daily commutes or errands. While these strategies are not as cost-efficient as more advanced strategies, it is a practical and widely adopted method for EV owners to ensure their vehicles are consistently ready for use. These strategies do not require forecasts of future prices, not even the optimal night hours one, because prices up to 24 hours from a given day are always available.
3.1.3. Charging on Weekends
This is similar to the strategy of charging daily, but has an added constraint – charging is done primarily on weekends. However, the constraint is lifted when an emergency top-up is needed in order to complete next-day driving. Similarly to the above, there are three variations – one which charges from 2 AM, one which charges from 5 PM, and one which charges during the cheapest hours. We name them as “Weekends, nights 2 AM”, “Weekends, afternoons 5 PM” and “Weekends, optimal night hours”. These strategies charge during weekdays only if we risk falling below the lower threshold for battery energy which has been set and also does not require forecasts of future energy prices.
3.2. Two-day horizon strategy
The “2-day plan, Plug & Save” strategy follows a very simple idea – given the electricity prices for today and tomorrow, and the number of charging hours needed, the strategy predicts whether it is more economical to charge today or hold off charging until tomorrow. As of today, the true prices of electricity are known for up to 24 hours in the future only, and we use StormGeo forecasts beyond that. An extra characteristic of this strategy is that it always picks contiguous charging blocks, to accurately reflect the current model employed by WirelessCar’s Plug&Save service.
3.3. Seven-day horizon strategies
The most advanced charging strategy uses one week’s data of electricity prices (24 hours of true prices and forecasts beyond that) to plan the best times to charge your vehicle over the course of a week by treating it as a linear optimization problem. We use the linear solver from Google’s OR tools package to find the solution. Since electricity prices change every hour, each of the 168 hourly charging slots in a week is treated as variables with values ranging from 0 to 1. A value of 0 would mean not charging during that hour, and a value of 1 would mean charging for the entire hour. Values in between mean charging only for a part of the time. We track the state of charge for the battery over time, and each individual 7-day optimization is required to end with a battery charged up to the upper threshold. Concisely, we write the variables as:
where
represents the value of charging slot
i. We define battery range
Q as the difference between charge upper threshold
and charge lower threshold
:
The constraint for the linear optimization problem is then set with the following idea – at every hour
i during the week, the amount of charging done until time
i is: (1) at most the total drive energy
(the energy consumed by the EV up to hour
i), since we assume the vehicle starts fully charged, and cannot be over-charged; and (2) at least the total drive energy minus the battery range since we never allow the battery level to drop below
. These conditions can be written as:
where
is the charging power (7.0 kW in our experiments).
The objective function consists of minimizing the cost of charging
C in the whole week. At any given hour
i, the cost of charging
is the product of the charging time
, the electricity price per kWh
, and the charging power
.
The total cost of charging is then simply the sum of all the hourly costs:
With this formulation, the solver returns the best hours to charge during a given week. For the purposes of comparison, we use three versions of this strategy – one that is based on true electricity prices, one based on StormGeo forecasts, and one based on our naively computed forecasts.
4. Results
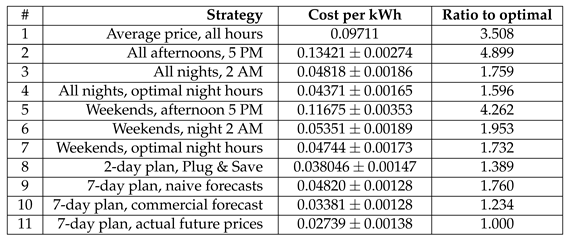
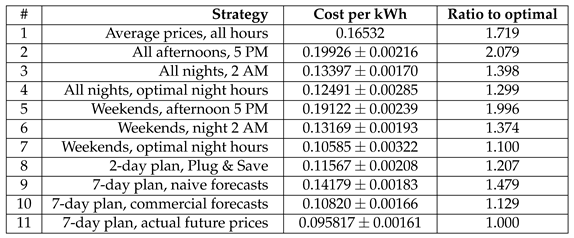
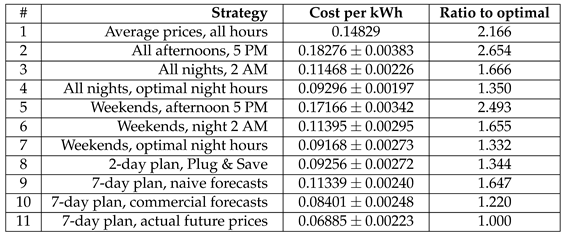
We summarized our findings of the three regions into
Table 1,
Table 2 and
Table 3, which present the comparison of eleven charging strategies using electricity prices for the years 2021 and 2022. The optimal strategy, which plans for seven days at a time by using the electricity prices, is the most economical as theoretically expected, while the optimal strategy using commercial forecasts is second best in this process. Depending on the electricity region, the most efficient “simple” strategy, in the sense of being implementable without smart infrastructure and only using basic time scheduling automation – namely the “All nights, 2 AM” strategy – achieves 40-76% worse results. The difference between using available commercial energy price forecasts and the “oracle” information is generally within 20%, greatly outperforming naive forecasts (which lead to a loss of 45-75%, depending on the region).
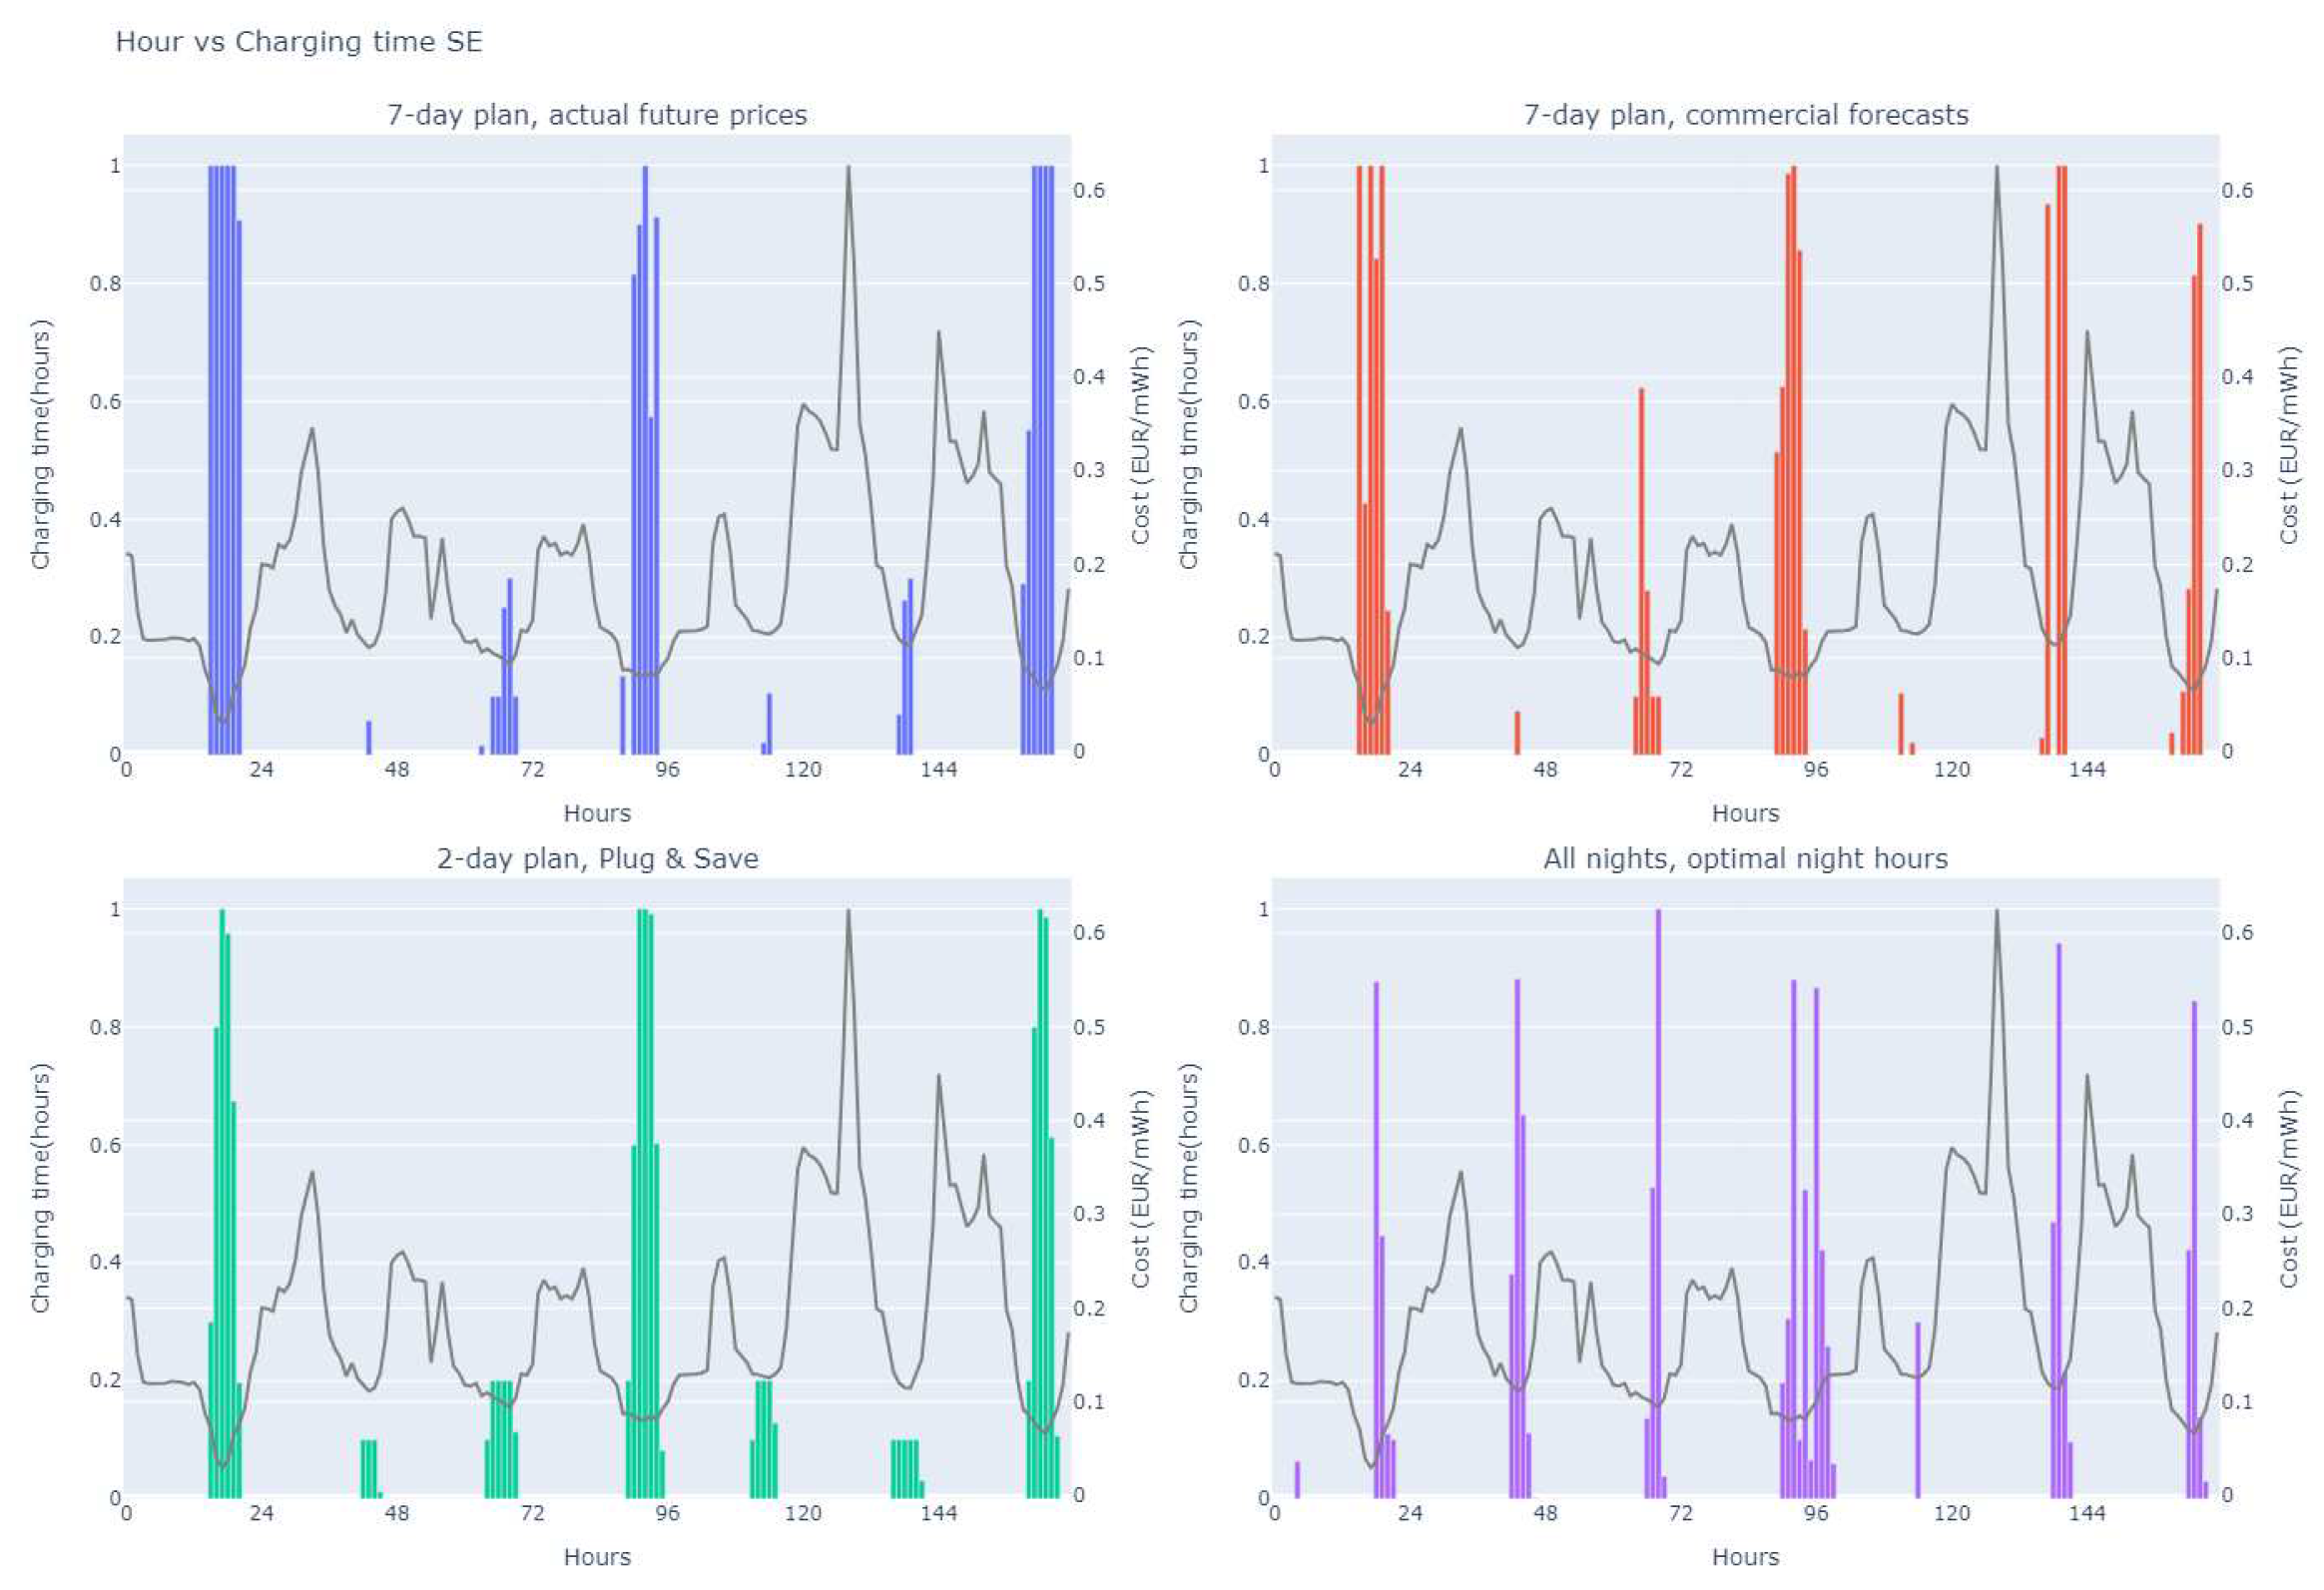
Figure 2 shows an example week from the dataset and how the four selected strategies choose different hours and different nights as charging time slots. It can be observed that the 7-day plans are similar for the forecast and the actual prices. The 2-day plan is also a reasonable approximation to the longer-term plans. The “all nights” strategy is required to charge any night after driving has taken place, and – as can be seen around hour 48 – makes sub-optimal decisions.
5. Conclusions and Future Work
This study demonstrates the efficacy of leveraging planning and electricity price forecasts and comparison of forecasting results to achieve substantial reductions in electric vehicle (EV) charging costs. Through a comparative analysis encompassing Sweden, Germany, and Denmark, the study underscores the adaptability of these strategies to diverse energy landscapes.
This work can be expanded in several different directions. One important focus can be exploring more advanced forecasting techniques. In particular, existing commercial forecasts are “general-purpose,” i.e., they need to balance many different objectives. For the specific task of EV charging, a forecast that focuses on the lowest prices, and achieves high accuracy there, at the cost of making larger errors in the most expensive periods, would be beneficial. Another direction is the broader global applicability of these strategies, specifically, understanding user behavior in a better way. All the results in this paper assume that the driving distances, and the corresponding energy consumption, are known. Accounting for different driving styles, travel times, and unexpected usage, remain a challenge for the future.
References
- Asgarian, F.; Hejazi, S.R.; Khosroshahi, H. Investigating the impact of government policies to develop sustainable transportation and promote electric cars, considering fossil fuel subsidies elimination: A case of Norway. Applied Energy 2023, 347, 121434. [Google Scholar] [CrossRef]
- Shahbazi, Z.; Nowaczyk, S. Enhancing Energy Efficiency in Connected Vehicles for Traffic Flow Optimization. Smart Cities 2023, 6, 2574–2592. [Google Scholar] [CrossRef]
- Ayyadi, S.; Bilil, H.; Maaroufi, M. Optimal charging of Electric Vehicles in residential area. Sustainable Energy, Grids and Networks 2019, 19, 100240. [Google Scholar] [CrossRef]
- Liu, K.; Gao, H.; Liang, Z.; Zhao, M.; Li, C. Optimal charging strategy for large-scale electric buses considering resource constraints. Transportation Research Part D: Transport and Environment 2021, 99, 103009. [Google Scholar] [CrossRef]
- Iversen, E.B.; Morales, J.M.; Madsen, H. Optimal charging of an electric vehicle using a Markov decision process. Applied Energy 2014, 123, 1–12. [Google Scholar] [CrossRef]
- Karbasioun, M.M.; Lambadaris, I.; Shaikhet, G.; Kranakis, E. Optimal charging strategies for electrical vehicles under real time pricing. 2014 IEEE International Conference on Smart Grid Communications (SmartGridComm). IEEE, 2014, pp. 746–751. [CrossRef]
|
Disclaimer/Publisher’s Note: The statements, opinions and data contained in all publications are solely those of the individual author(s) and contributor(s) and not of MDPI and/or the editor(s). MDPI and/or the editor(s) disclaim responsibility for any injury to people or property resulting from any ideas, methods, instructions or products referred to in the content. |
© 2024 by the authors. Licensee MDPI, Basel, Switzerland. This article is an open access article distributed under the terms and conditions of the Creative Commons Attribution (CC BY) license (http://creativecommons.org/licenses/by/4.0/).
