1. Introduction
Currently, several anticancer treatment options are available, such as chemotherapy, immunotherapy, hormone therapy, surgery, and radiation. Among those, radiation therapy (RT) may be particularly effective for treating localized or solid cancers. Approximately half of all patients with cancer receive RT as a curative or palliative treatment. Moreover, as an adjuvant, RT is frequently combined with other types of treatment such as chemotherapy and surgery. However, the side effects of RT, which originate from reactive species-driven oxidative stress injury of normal tissue, have further prompted the development of safer and targeted therapies [
1,
2,
3,
4]. Radiation paradoxically triggers various changes in the tumor microenvironment (TME) that may lead to the risks of relapse and metastasis.
The differential impact of cationic manganese-substituted pyridylporphyrins on both normal and tumor tissues has been extensively [
5,
6]. These compounds sensitize tumors to radio- and chemotreatment and simultaneously protect normal tissue via modulation of their redox status [
7]. The effect of Mn porphyrins, commonly known as superoxide dismutase (SOD) mimic, has been studied in various tumors, such as breast, head and neck, prostate, and brain [
8,
9,
10,
11]. The promising data obtained from cellular and animal studies have facilitated the progress of Mn(III)
meso-tetrakis (
N-n-butoxyethypyridinium-2-yl) porphyrin, i.e., MnTnBuOE-2-PyP
5+ (BMX-001, MnBuOE) into clinic trials. With good safety/toxicity profile MnBuOE is presently tested on normal tissue protection, while tumor growth suppression in four Phase II clinical trials on patients bearing glioma, head and neck cancer, anal cancer and multiple brain metastases [
5,
12,
13,
14,
15]. In addition, a recent glioblastoma study has shown that patients with glioblastoma have improved survival rates when combination treatment of Mn porphyrin clinical candidate, MnBuOE (BMX-001) with irradiation [
16]. The biocompatible redox properties of Mn porphyrins, their ability to interact with numerous reactive species, their bioavailability within cells and cellular compartments, and the tumor heterogeneity of immunogenic and metabolic pathways necessitate additional studies on the nature of the differential actions of Mn porphyrins within the TME. Previously, we explored the anticancer potency and metabolic pathways affected by an earlier analog, MnTnHex-2-PyP
5+ [
17,
18]. Here, considering the progress of Mn porphyrins into clinical settings, we have further explored the complex metabolic pathways that play important roles in the anticancer activities of the clinical candidate, MnBuOE (BMX-001).
Despite the evidence supporting the role of Mn porphyrins in cancer therapy, little is known about their immunomodulatory effects. Thus far, studies on these compounds have been limited to total RNA-sequencing [
19]. In a previous study, we assumed that Mn porphyrins could inhibit RT-induced epithelial-to-mesenchymal transition (EMT) in the TME by suppressing pro-survival signaling pathways, the AKT/GSK3β/Snail pathway, and NF-kB activation in a mouse 4T1 tumor in vitro or in vivo [
18]. However, our understanding of the molecular mechanisms of Mn porphyrins has been largely limited to the estimation of the average gene expression of tumor cells.
Tumors are intricate ecosystems. The TME is composed of diverse cells, including cancer cells and stromal subsets, whose specific characterization is masked by heterogeneity. Numerous studies have suggested that stromal cells, such as epithelial cells, T cells, macrophages, and fibroblasts, which are highly heterogeneous, are associated with tumors [
20,
21,
22,
23,
24]. Tumor heterogeneity governs many decisive facets of tumor pathogenesis that are driven by tumor growth, metastasis, and resistance to treatment. Therefore, it is essential to examine the gene expression patterns of individual cells.
Single-cell RNA sequencing (scRNA-seq) enables specific profiling of individual cell populations, thereby enabling unbiased distinguishing of heterogeneous stromal and cancer cells at the resolution of individual cells. Therefore, scRNA-seq techniques have emerged as promising methods for elucidating tumor pathogenesis, revealing the complexities of and differences between the molecular components [
25,
26]. Furthermore, understanding the correlation between cancer and stromal/immune cells in the TME and identifying potential targets could be particularly important for determining the synergistic effect of MnBuOE/RT. In this study, we aimed to explore how Mn porphyrin clinical candidate, MnBuOE (BMX-001) and RT affect the characteristics of tumor and stromal cells in murine mammary carcinoma using scRNA-seq.
2. Materials and Methods
2.1. Animal Models
For the establishment of the 4T1 tumor model, 6–7-week-old female BALB/c mice were purchased from Orient Bio (Gapyeong, Korea) and cells (1 x 10⁵ cells in 50 μL phosphate-buffered saline) were injected subcutaneously into the right hind leg of each mouse. Tumor volumes were measured every 3 days using calipers and calculated as volume = (width2 × length)/2. When the mean tumor volume reached 80–120 mm3, the mice were randomly divided into four groups: control group (CN), MnTnBuOE-2-PyP5+ group (MnBuOE), radiotherapy group (RT), and group receiving MnBuOE along with radiotherapy (MnBuOE/RT). MnBuOE was injected intraperitoneally (1 mg/kg) twice a week. Two hours after drug administration, irradiation was conducted on the tumor-bearing hind leg over 3 continuous days at 2 Gy X-ray for a total of 6 Gy. During irradiation, the mice were anesthetized via intraperitoneal injection of 30 mg/kg Zoletil (Virbac, Carros, France) and 10 mg/kg Rompun (Bayer, Leverkusen, Germany), as prescribed by veterinarians. Fifteen days after irradiation, all tumor tissues were isolated and excised. Some tumor tissues were prepared for scRNA-seq and flow cytometric assay. Other tumor tissues were fixed with 10% formalin and embedded in paraffin for terminal deoxynucleotidyl transferase(TdT)-mediated biotinylated dUTP nick end labeling (TUNEL) analysis. The study protocol (20220210001) was reviewed and approved by the Institutional Animal Care and Use Committee (IACUC) of the Samsung Medical Center (SMC). SMC is an Association for Assessment and Accreditation of Laboratory Animal Care International accredited facility and abides by the Institute of Laboratory Animal Resources guidelines.
2.2. Tissue Dissociation into Single-Cell Suspension
Tumor tissues were dissected from the mice and dissociated into single-cell suspensions via mechanical dissociation combined with enzymatic degradation of the extracellular matrix (ECM), which maintains the structural integrity of tissues. The tumor tissue was enzymatically digested using Tumor Dissociation Kit (Miltenyi Biotec., Bergisch Gladbach, Germany), and gentleMACS™ Dissociators (Miltenyi Biotec.) were used for mechanical dissociation. After dissociation, a filter was used to remove any remaining larger particles from the single-cell suspension.
2.3. Single-Cell RNA Sequencing Data Processing
The single-cell suspensions were washed and loaded onto a Chromium single cell system (10x Genomics, Pleasanton, CA, USA). The barcoded sequencing libraries were created using the Chromium Single Cell 5′ Reagent kits (10x Genomics) according to the manufacturer’s instructions and then sequenced on a Novaseq6000 platform (Illumina, San Diego, CA, USA). The resulting sequencing data were aligned to the mouse reference genome (GRCm38) and processed through the CellRanger 4.0.0 pipeline (10x Genomics). A stringent selection process was imposed to exclude cells that failed to reach sufficient cell quality threshold. Specifically, cells exhibiting fewer than 500 unique molecular identifier (UMI) counts, fewer than 250 detected genes, more than 30% mitochondrial gene expression, or low cell complexity (l log10GenesPerUMI l ≤ 0.8) were omitted. Ensuring the singularity of cell population and the exclusion of potential doublets, the “DoubletFinder” package (Version 2.0.3) was employed. Consequently, approximately 10 % of cells were annotated low quality of cells (4,231 of 39,585) and excluded from the subsequent analysis. Single-cell analysis was performed in Seurat R package. Specifically, the gene expression matrices were normalized and transformed to the log scale. For feature selection, the top 2,000 highly variable genes expressed in each sample were chosen.
2.4. Cluster Identification and Annotation
For clustering, the variably expressed genes were subjected to a principal component analysis (PCA). The number of principal components selected for the major cluster or subset clusters was determined by evaluating the slope of the elbow plot. Both PCA and uniform manifold approximation and projection (UMAP) dimension reduction were performed using the selected PCs. The nearest-neighbor graphs were calculated using the same PC dimensions from the PCA reduction, and clustering was performed. To determine the cell type for the major cluster or subset clusters, differentially expressed genes (DEGs) were determined using the “findmarker” function in Seurat R packages based on the Model-based Analysis of Single Cell Transcriptomics test with a minimal fraction of 25% and a log-transformed fold change threshold of 0.25 [
27,
28]. Additionally, canonical markers for scRNA-seq data from relevant literature were used. To visualize the canonical markers and DEGs, heatmaps, dot plots, and violin plots were generated to show the expression of the markers used for identifying each cell type.
2.5. Pathway Enrichment Analysis
To identify biological functions or pathways that were significantly associated with specific cell types or gene sets, we performed a gene set variation analysis (GSVA) with the hallmark gene sets from the Molecular Signatures Database (Msigdb) using the average gene expression of each cell type or group. Additionally, we conducted a gene set enrichment analysis (GSEA) by ranking the DEGs of each targeted cluster or group according to log-transformed fold change (logFC) and then utilizing this ranked list as input for the fgsea function in the fgsea R package [
29].
2.6. Trajectory Analysis
Cell lineage analysis in dendritic cells (DCs) was performed using the monocle v.2 package [
30]. We reconstructed the single-cell trajectory by creating a monocle object using the UMI count metrics and the “negbinomial.isze” parameter with default settings. To identify DEGs, we used the differentialGeneTest function to select the top 300 genes with the lowest q-values. Dimensional reduction and cell ordering were conducted using the DDRTree method and the orderCells function, respectively.
2.7. Cell–Cell Communication and Receptor–Ligand Interaction Analysis
The cell–cell interactions based on the expression of ligand-receptor pairs in different cell types were inferred using the CellChat R package [
31]. We followed the recommended workflow in CellChat and utilized the default settings to identify major signaling interactions and evaluate the coordination of cells and signals for various functions. Briefly, the normalized counts were used as a CellChat object and subjected to the preprocessing functions, including identifyOverExpressedGenes, identifyOverExpressedInteractions, and projectData with the default parameters. The strength of ligand-receptor interactions and the number of interactions were determined using the computeCommunProb, compute-CommunProbPathway, and aggregateNet functions with the default parameters applied in a stepwise manner.
2.8. TUNEL Staining
Deparaffinized and dehydrated tumor tissue sections were stained by TUNEL In Situ Cell Death Detection Kit (Roche Applied Science, Mannheim, Germany) according to the manufacturer’s protocol. Briefly, tumor tissue sections were placed in a 3% hydrogen peroxide solution with methanol to block endogenous peroxidase activity and were incubated in 0.1% sodium citrate containing 0.1% Triton X-100 to increase tissue permeability. After rinsing in PBS, 50 µl of TUNEL reaction mixture (calf thymus TdT and nucleotides) was added to each sample. After incubation at 37℃ in the dark for 60 min, these sections were rinsed with PBS and the apoptotic cells were marked by 3,3′-diaminobenzidine (DAB) through horseradish peroxidase (HRP) catalysis of biotinylated dUTP-streptavidin-HRP. Images were captured using an Aperio ScanScope AT slide scanner (Leica Biosystems, Inc., Buffalo Grove, IL). Numbers of TUNEL-positive cells were determined with ImageScope software (Leica Biosystems, Inc.).
2.9. Flow Cytometric Analysis
Harvested tumors were cut into small pieces and dissociated using a Tumor Dissociation Kit according to the manufacturer’s instructions (Miltenyi Biotec, Auburn, CA, USA). Red blood cells were lysed with BD Pharm LyseTM lysing buffer (BD Bioscience, San Jose, CA, USA). Cell suspensions were stained with PerCP-Cy5.5-conjugated anti-CD45 antibody, FITC-conjugated anti-mouse CD3 antibody, APC-Cy7-conjugated rat anti-mouse CD4 antibody, V450-conjugated rat anti-mouse CD8 antibody, APC-conjugated anti-mouse CD25 antibody, APC-Cy7-conjugated rat anti-mouse CD45 antibody, PerCP-Cy5.5-conjugated rat anti-mouse CD11b antibody, Alexa Fluor 647-conjugated rat anti-mouse F4/80 antibody, FITC-conjugated anti-CD86 antibody (BD bioscience), or PE-Cy7-conjugated anti-CD206 antibody (eBioscience, San Diego, CA, USA). For intracellular staining, cells were fixed and permeabilized with Fixation/Permeabilization buffer (eBioscience) and stained with PE-conjugated rat anti-mouse Foxp3 antibody (BD bioscience). Flow cytometric analysis was performed using a BD FACS Verse flow cytometer (BD bioscience) and FlowJo software version 10.6.1 (BD bioscience).
2.10. Statistical Analysis
GraphPad Prism 9.4.1 (GraphPad Software, San Diego, CA, USA) was used for all statistical analyses. Differences among groups were determined by Student’s t-test with Bonferroni correction for comparison between two groups or one-way analysis of variance (ANOVA) following Tukey post hoc test. Tumor growth curves were analyzed using a two-way analysis of variance (ANOVA) with Tukey’s correction for multiple comparisons. Statistical significance is presented as *P<0.05, **P<0.01, ***P<0.001, or ****P<0.0001. The statistical details of each experiment are indicated in the figure legends.
4. Discussion
RT remains the standard-of-care for cancer therapy; however, radiation-induced damage to normal tissues limits its effectiveness in tumor therapy. Here, we report for the first time a comprehensive characterization of the TME following Mn porphyrin clinical candidate, MnBuOE (BMX-001) treatment combined with irradiation using scRNA-seq, focusing on the various multifaceted tumor subpopulations. Progress in scRNA-seq technology has enabled the compositional analysis of the immune system at single-cell levels and permitted the identification and sub-clustering of major cell subsets of the TME, exploration of cell type-, molecular pathway- and etiology-specific gene signatures, and prediction of putative cell–cell interactions [
32]. Our analysis identified eight distinct cell populations with UMAP clustering of tumor tissues. Those were mapped into 4 non-immune types of epithelial cells, fibroblasts, endothelial cells, and myocytes and 4 immune clusters of macrophages, neutrophils, T cells, and DCs.
Among the epithelial cell subtypes, the unique functions of Epi1_Epcam- cells and Epi2_Epcam+ cells were strongly associated with EMT, which can invade surrounding tissues and travel through the peripheral circulation. The distribution of these epithelial subtypes enables the understanding of the metastasis hypothesis in epithelial cells. The GSEA of epithelial cells confirms that enrichment pathway scores associated with EMT, TNF-alpha signaling via NF-kB, angiogenesis, and hypoxia were significantly decreased in the MnBuOE/RT group compared to the RT group, which is consistent with our previous report [
18]. Furthermore, we divided fibroblasts into myofibroblastic, inflammatory, and cycling CAFs. CAFs have been reported as a key component of the TME [
24], and are a strong source of chemokine CXCL12 and rich in alpha-smooth muscle actin-positive cells, which promote tumor growth and angiogenesis and remodel the ECM [
33,
34,
35]. Additionally, CAFs inhibit the function of CD8+ T cells, promote Treg recruitment, and suppress their tumor cell-killing abilities by reducing T cell infiltration into the tumor, thus impeding T cell trafficking within the TME and inhibiting cytotoxic activity [
36]. In this study, we observed that treatment with MnBuOE reduces CAFs, which may substantially contribute to preventing cancer metastasis.
Subsequently, we investigated five major T cell clusters, including NKT, T naive, CD8+ effector memory T cells, CD4+ Tregs, and the remaining T cells to reveal the intrinsic structure and potential functional subtypes of the overall T cell populations. T cells within the TME are prone to either dysfunction or exhaustion, thus preventing CD8+ T cells from eliciting sufficient T cell-mediated killing of tumor cells [
22,
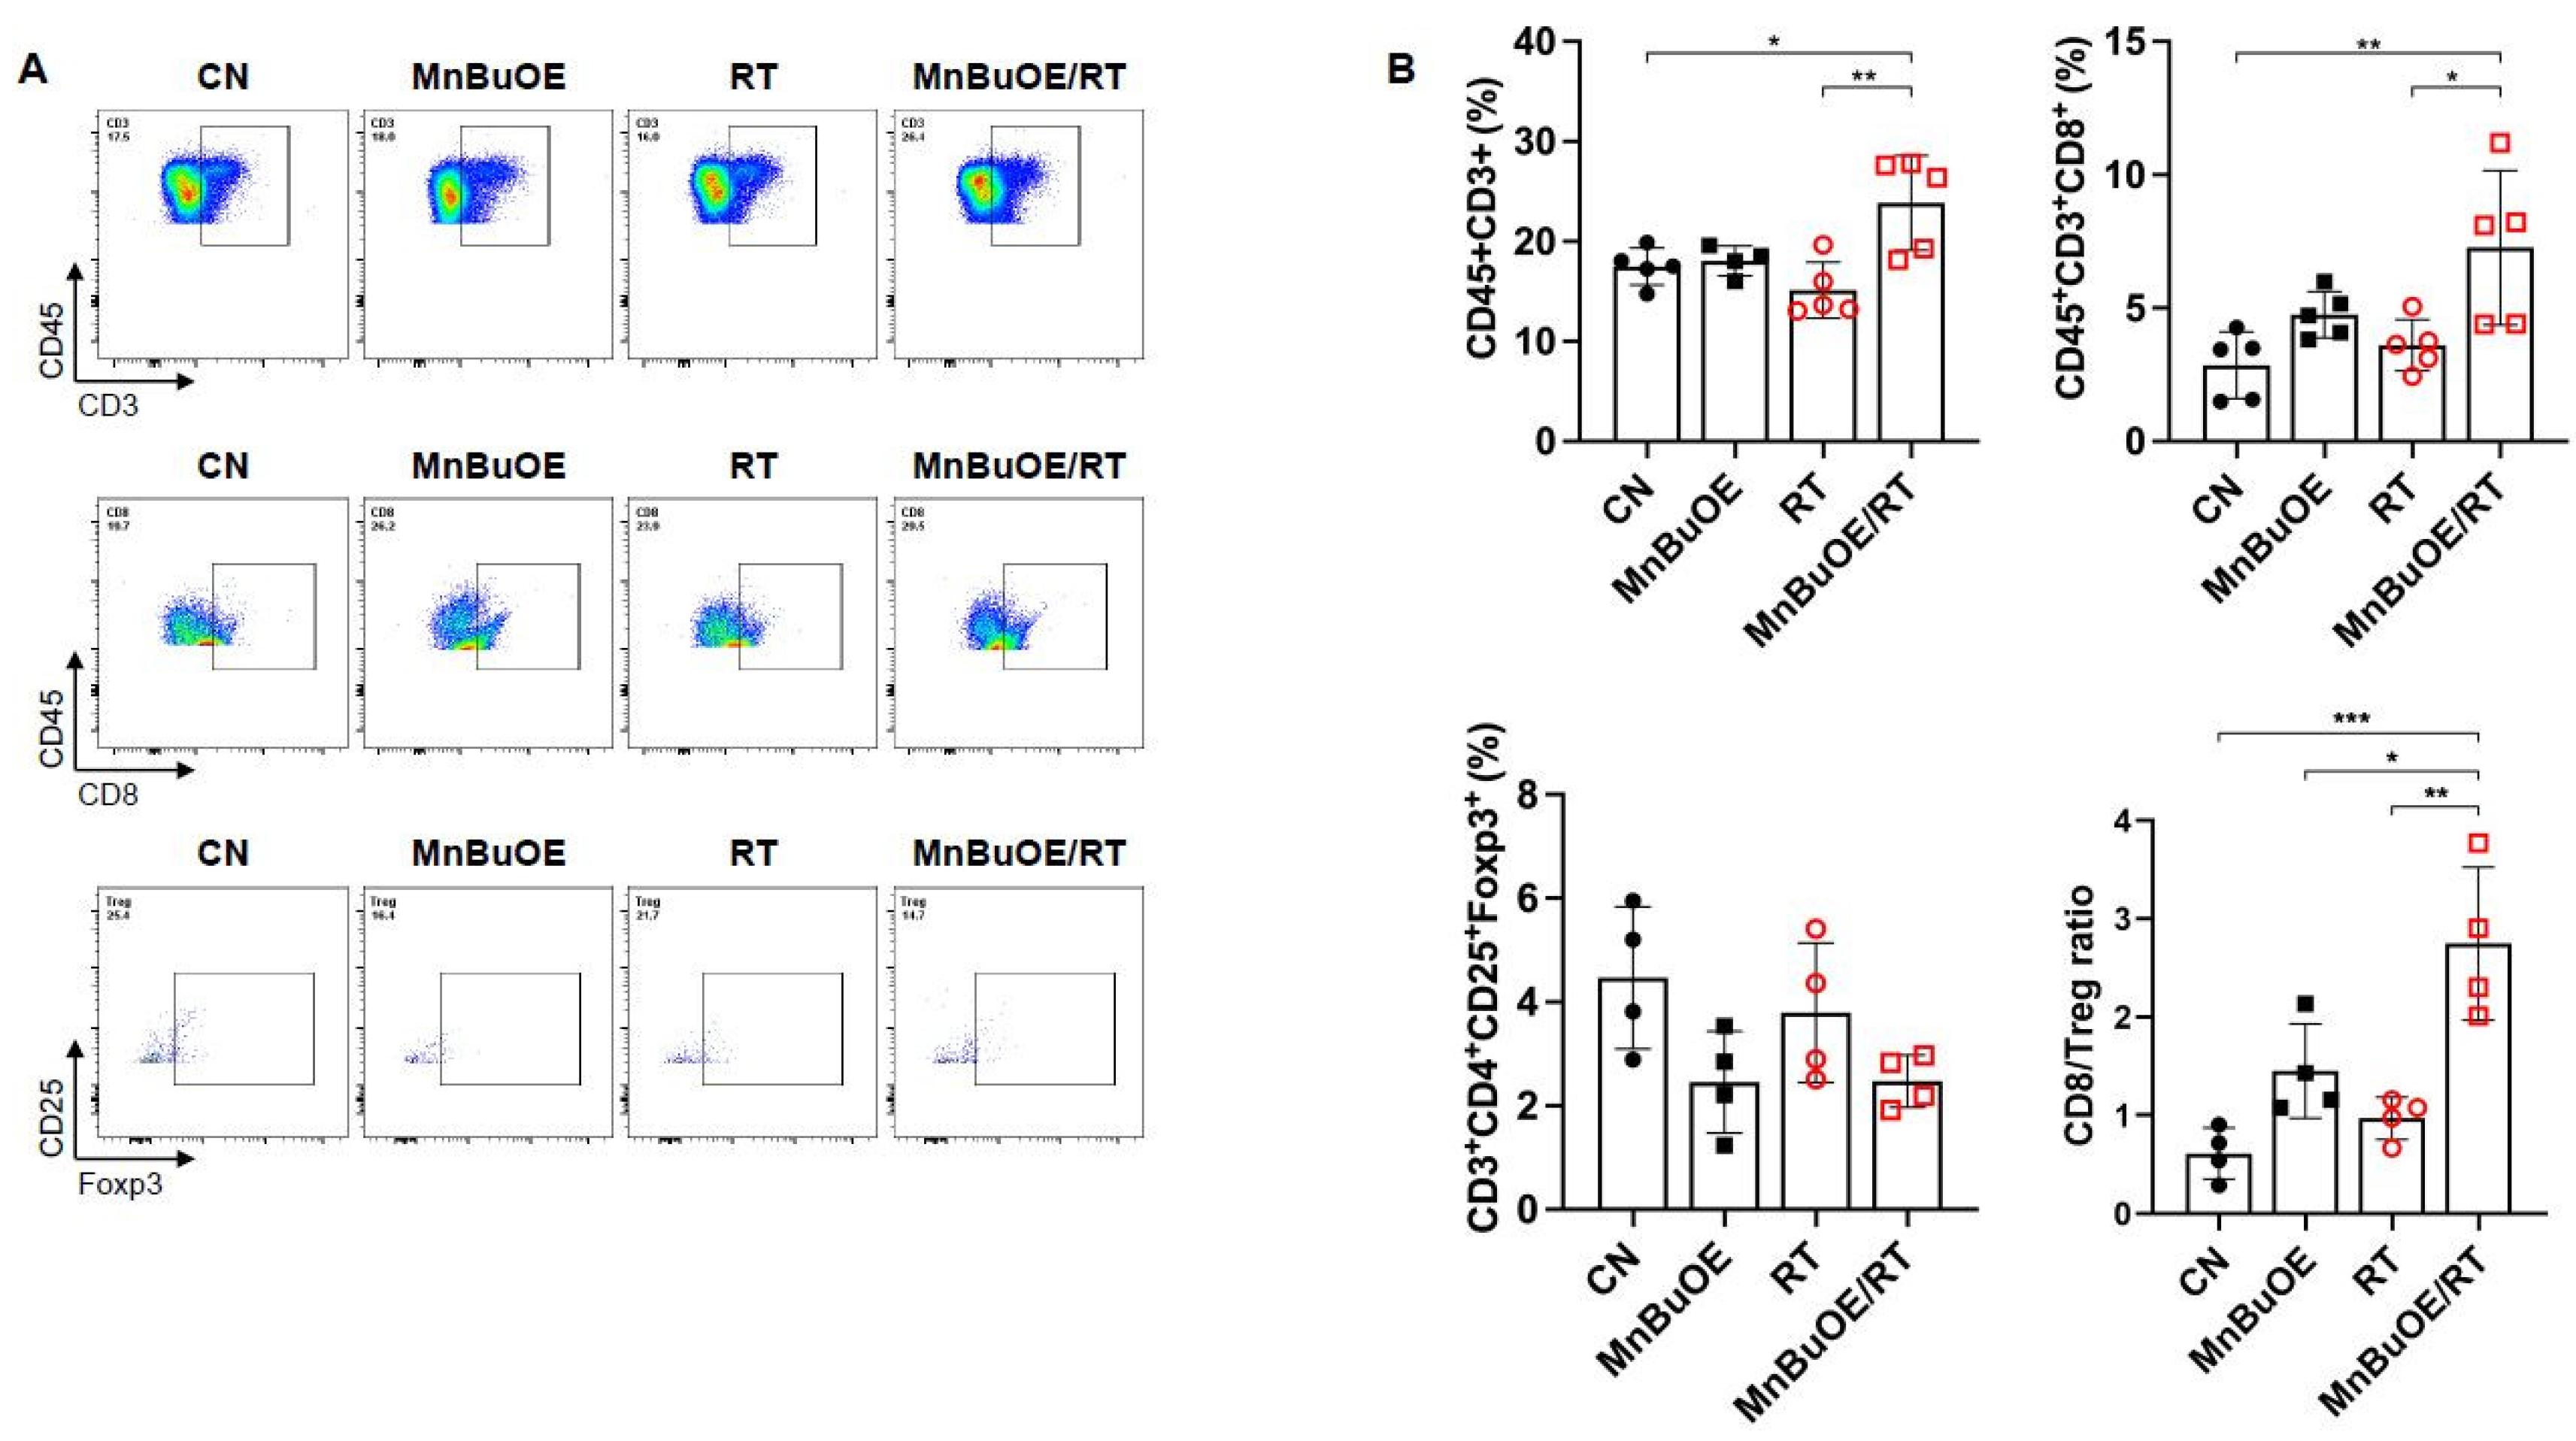
37]. Our data demonstrate that the proportion of CD8+ effector memory T cells increased, whereas CD4+ Tregs decreased when mice were treated with MnBuOE/RT compared to treatment with RT alone. CD8+ T cells, in particular, are important targets in cancer immunotherapy, making them the focus of numerous single-cell studies. Building on these studies, we recapitulated the heterogeneity of CD8+ T cells according to cytotoxic, dysfunctional, and naïve-like cell states. The expression of CD8+ T cell exhaustion markers, such as Lag3 and Tigit, was significantly lower in the MnBuOE/RT group than in the RT group, leading to alleviation of T cell dysfunction and restoration of T cell infiltration.
Additionally, intimate cell–cell communications across CAFs or epithelial cell clusters, including CD8+ T cells, were analyzed within the TME. We observed a significant decrease in coinhibitory interactions, such as those among Tigit-Pvr, Tigit-Nectin2, and Tigit-Nectin3, in the MnBuOE/RT group compared to the RT group, whereas a significant increase in costimulatory interactions, such as those between CD226-Pvr and CD226-Nectin2, was observed in the MnBuOE/RT group compared to the RT group. The correlation of high Tigit expression with a poor clinical outcome is consistent with the view that one of the functions of Tigit is the formation of an immunosuppressive TME [
38,
39,
40]. While Tigit functions as an inhibitory receptor, CD226 has been known to play important roles in T cell priming and activation. Focusing on the CD8+ T cells in these studies, MnBuOE treatment combined with irradiation may control the Tigit/CD226 imbalance by suppressing exhausted CD8+ T cells within the TME.
DCs are essential for T cell-mediated cancer immunity [
41]. In particular, the distinguishing directivity of cDCs to stimulate T cells leads to the maturation of DCs and the expression of CD40, CD80, and CD86. We identified the differentiation trajectory of three clusters of DCs, which were formed via a relative process in pseudotime. The differentiation trajectory begins with the CD103+ dominant cDC1 subtype and proceeds with the CD11B+ dominant cDC2 cluster and CD40+ dominant mature DC cluster. We observed a significant increase in the proportion of CD40+ dominant mature DCs in the MnBuOE/RT group compared to that in the other groups. Our results, along with those of previous reports, suggest that MnBuOE/RT treatment efficacy leads to DC maturation and co-stimulation between DCs and CD8+ T cells, thereby resulting in tumor regression.
Accumulating evidence suggests that TAMs are a heterogeneous group of cells with multiple mechanisms involved in promoting tumor progression [
42,
43,
44]. MDSCs are another heterogeneous population of cells that expand during cancer progression, which can also suppress T-cell responses. In our scRNA-seq analysis data, macrophages were largely separated into unpolarized M0-like macrophages and polarized M1 and M2 macrophages, including MDSCs. Studies indicate that the M1-like macrophages are pro-inflammatory and release various cytotoxic molecules that are crucial to suppressing tumorigenesis. Conversely, the predominance of M2-like macrophages causes tumor progression. We observed a clear increase in the M1/M2 ratio and a significant decrease in MDSCs in the MnBuOE/RT group compared to the other groups. We further confirmed that both inflammatory cytokines, IL-1a and IL-1b, and chemokines CCL3 and CCL4 inducing M1-polarization, which were reduced by irradiation, were significantly increased following the MnBuOE/RT treatment. Our results, along with those of previous reports [
10], suggest that MnBuOE/RT can reduce levels of M2-polarized macrophages while inhibiting MDSCs induced by irradiation of tissues.
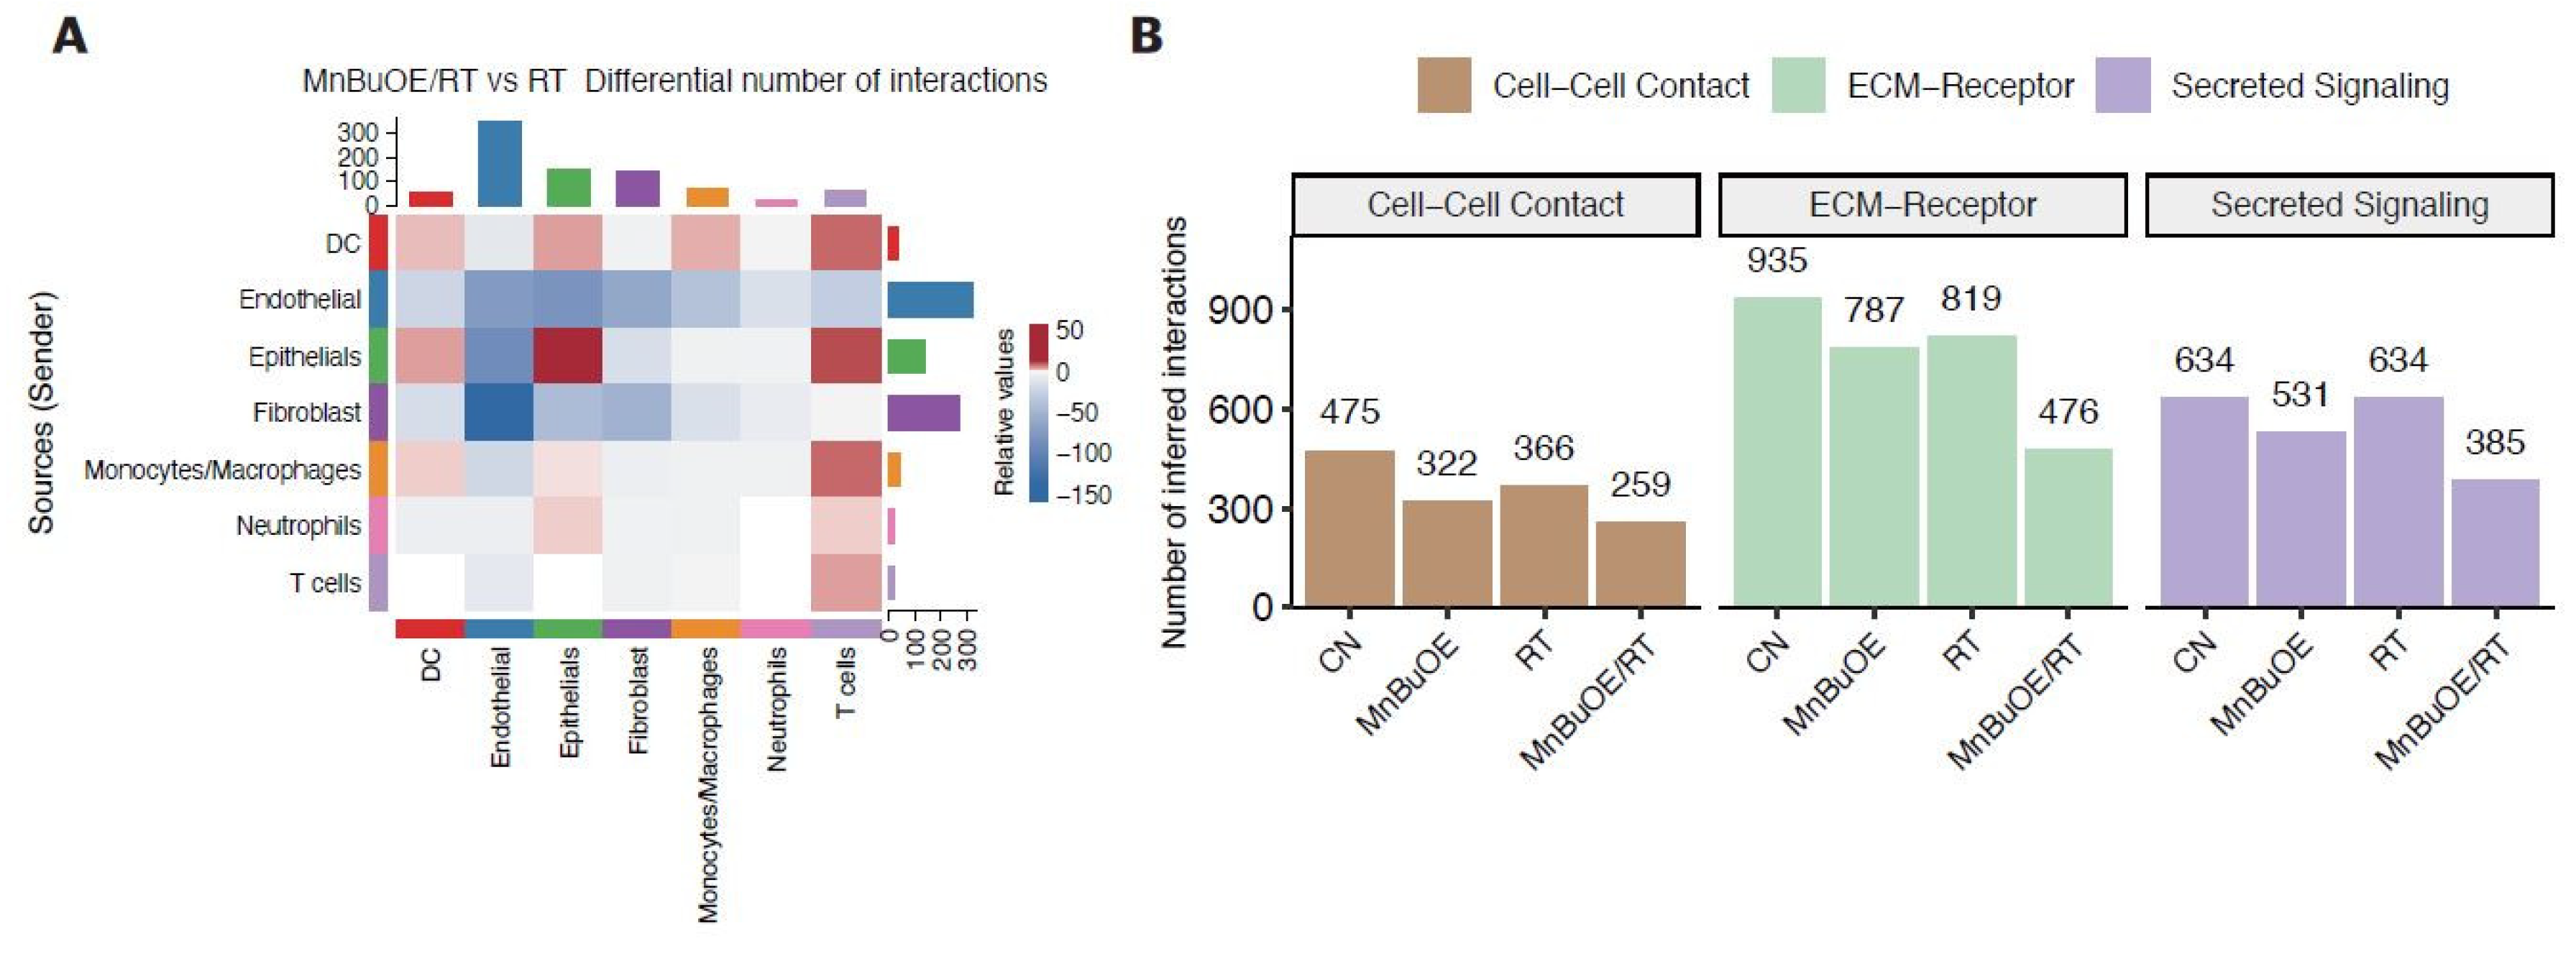
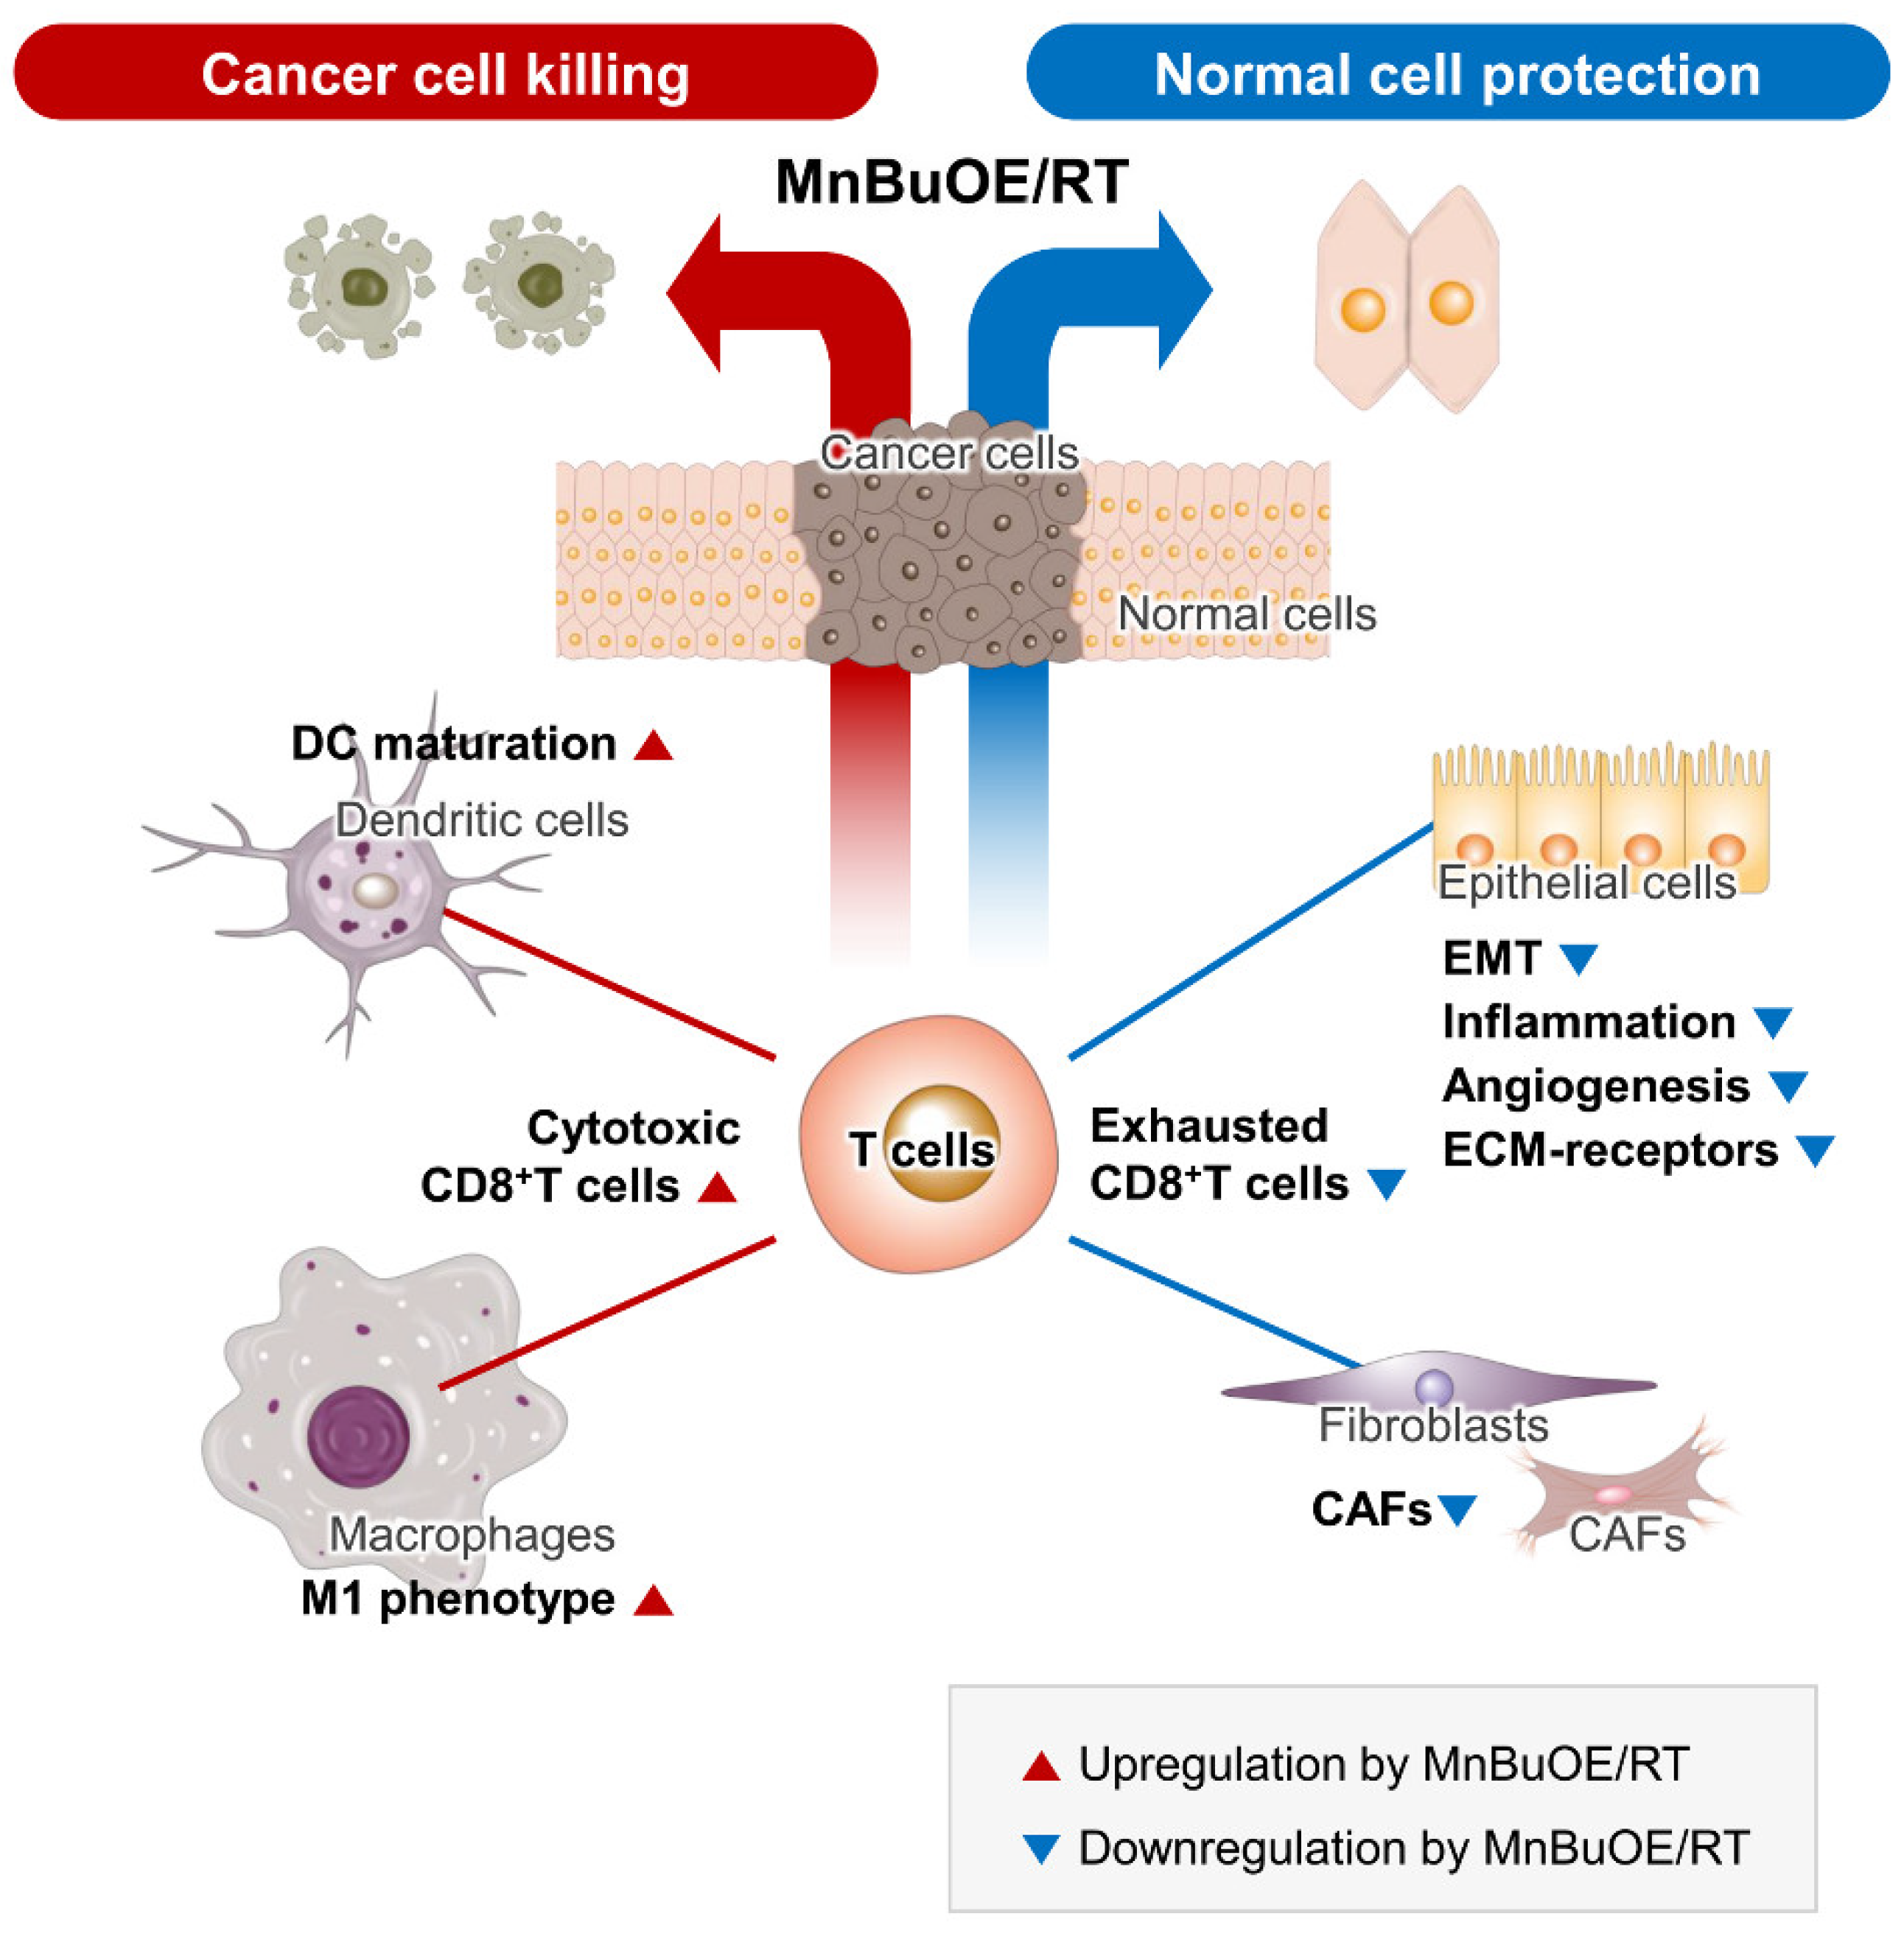
Analysis of cell–cell interactions based on the expression of ligand-receptor pairs in different cell types can aid in understanding how intimately major cell types interact. Our results showed that the number of T-cell trafficking of DCs, macrophages, and epithelial cells was higher in the MnBuOE/RT group than in the RT group, whereas the number of T-cell exchanges of fibroblasts and endothelial cells was low. In particular, the MnBuOE/RT group had fewer affected ECM receptors or activated intracellular signaling pathways than the other groups. Thus, our data have demonstrated that treatment of cancer using a combination of MnBuOE and RT could increase CD8+T cytotoxicity through DC maturation and inflammatory-like macrophages and directly kill tumor cells by lowering the interaction of exhausted CD8+ T cells with epithelial cells and fibroblasts. It could also decrease levels of CAFs and prevent epithelial cells from progressing to EMT, angiogenesis, and inflammation, resulting in protection against the damage to the surrounding normal cells (
Figure 8). However, we could not exclude the possibility that MnBuOE/RT can differentially regulate the inflammatory process according to cell types in the TME. Therefore, differential oxidative stress of certain cells may play a role in the underlying mechanism of action of Mn porphyrin in promoting tumor growth suppression and normal tissue protection. Taken together, our data provide another perspective on the anticancer effect of MnBuOE/RT using the database of genes related to the signaling pathways of each cell type within the TME.
Figure 1.
Effect of MnBuOE coupled with irradiation on major single-cell clustering in the 4T1 tumor mice model. (A,B) Tumor-bearing tissues were prepared for scRNA-seq 15 days after MnBuOE treatment and irradiation. The tumor volumes were measured once every 3 days. MnBuOE combined with radiation therapy increased tumor growth delay compared to MnBuOE monotherapy. *P<0.05, **P<0.01. (C) After PCA and UMAP analysis of the UMI counts in all 35,354 single cells sorted from each group, the hierarchical clustering distinguished 8 major clusters: macrophages, neutrophils, T cells, DCs, epithelial cells, fibroblasts, endothelial cells, myocytes. (D) According to the expression of specific marker genes for various cell types, immune cell types (Ptprc), macrophages (Lyz2, Apoe), neutrophils (Csf3r), T cells (Cd3e), DCs (Cd74), epithelial cells (Krt7), fibroblasts (Col1a1), and endothelial cells (Pecam1) were identified. (E-G) The eight main cell subtypes were divided into immune cells and non-immune cells. Blue dots represent immune cells (macrophages, neutrophils, T cells, and DCs), whereas grey dots represent non-immune cells (epithelial cells, fibroblasts, endothelial cells, and myocytes). MnBuOE treatment increased the proportion of immune cells compared to the CN group. scRNA-seq, single-cell RNA sequencing; MnBuOE, MnTnBuOE-2-PyP5+; PCA, principal component analysis; UMAP, uniform manifold approximation and projection; UMI, unique molecular identifier; DCs, dendritic cells.
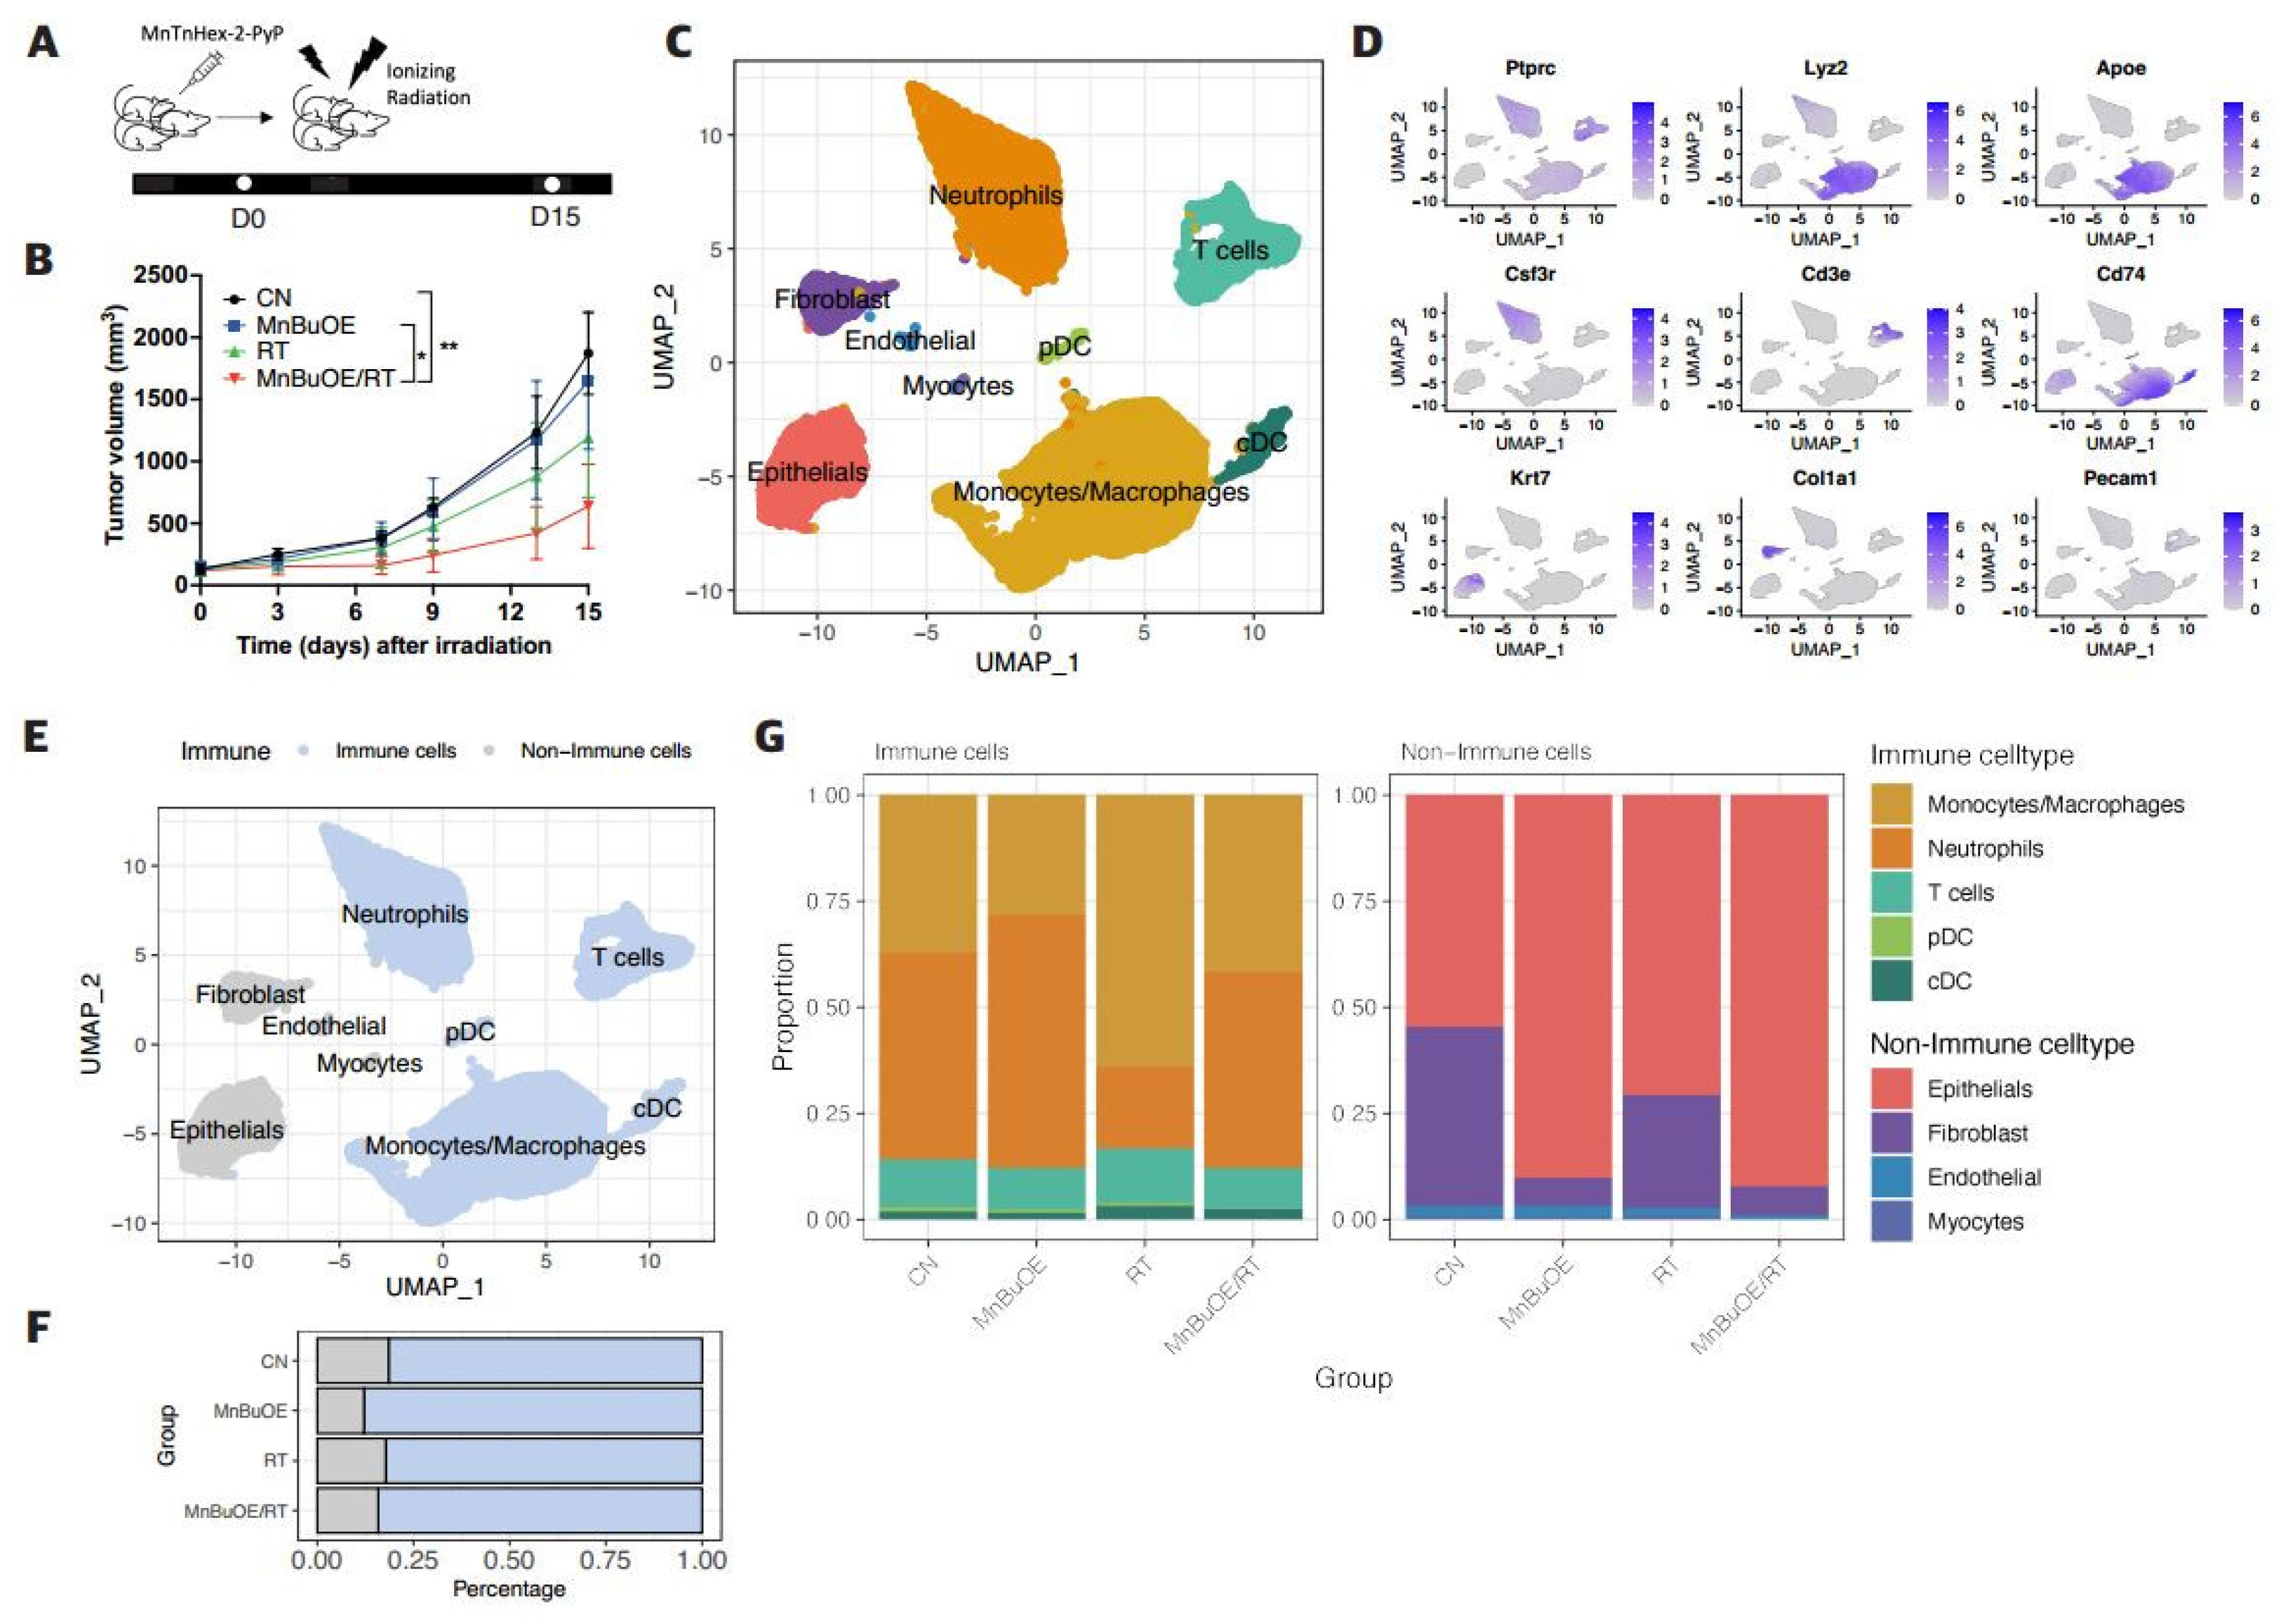
Figure 2.
Effect of MnBuOE treatment and irradiation on cancer-associated pathways in epithelial cell subtypes of 4T1 tumor mice. (A) UMAP plot of epithelial cells indicated four subtypes: Epicam-(mesenchymal bias), Epicam+ (epithelial bias), cycling (proliferation), and Rps (non-function) types (n=4,098). (B) Violin plots show that expression of specific marker genes, including epithelial bias (Epcam, Cdh1), mesenchymal bias (Twist1, Zeb2), and cell proliferation (Mki67) differed between the different epithelial cell subtypes. (C) Heatmap of GSVA scores determined using Hallmark GeneSet (EMT, TNF-alpha signaling via NF-kB, inflammatory response, angiogenesis, and hypoxia) showed increased involvement in the Epicam- and Epicam+ subtypes for each experimental group. (D) All experimental groups included the fractions of four clusters of epithelial cell subtypes. (E) Violin plots indicated differential expression of Cdh1, vegfa, Hif1, Tgfb1, Twist1, and Zeb2 between the different experimental groups. *P<0.05, ***P<0.001, ****P<0.0001. (F) Volcano plot of DEGs in the MnBuOE/RT (MnBuOE and irradiation) versus RT (irradiation only) groups. The dot color represents the upregulated or downregulated DEGs, whereas the text color represents the related Hallmark pathway. (G) GSEA enrichment plots in relevant Hallmark gene sets in the MnBuOE/RT versus RT groups showing the NES score and adjusted p-values. The positions of gene set members on the rank-ordered list indicate the level of enrichment of the genes within the gene set. These results indicate that MnBuOE combined with radiation therapy markedly declined carcinogenesis pathways such as EMT, TNF-alpha signaling via NF-kB, inflammatory response, angiogenesis, and hypoxia compared to radiation therapy only. (H,I) TUNEL analysis and DAB staining showing increased apoptosis in tumor tissue sections of the MnBuOE/RT groups compared to the other groups. **P<0.01, ***P<0.001. MnBuOE, MnTnBuOE-2-PyP5+; UMAP, uniform manifold approximation and projection; GSVA, gene set variation analysis; EMT, epithelial-to-mesenchymal transition; DEGs, differentially expressed genes; MnBuOE/RT, MnTnBuOE-2-PyP5+/radiation therapy; GSEA, gene set enrichment analysis; NES, normalized enrichment score; TUNEL, terminal deoxynucleotidyl transferase-mediated biotinylated dUTP nick end labeling; DAB, 3,3′-diaminobenzidine.

Figure 3.
Decreased Tigit expression and cell–cell interaction in CD8 effector T cells following treatment with MnBuOE and irradiation. (A) UMAP plot of T cells indicated the formation of five main clusters shown in different colors (n=3,013). (B) Dot plot of canonical T cell markers in each subtype, i.e., NK (Gzma, Tyrobp, Fcer1g), T naïve (Tcf7, Ccr7), Cd8_Tem (Cd3d, Cd3e, Cd8a, Gzmk, Lag3, Nkg7), Cd4_Treg (Cd4, Foxp3, Tnfrsf9, Ctla4), and cycling T (Pclaf, Mki67, Stmn1). Circle size represents the percentage of expressed cells in the subtypes, and color indicates the normalized expression. (C) Proportion of T cell subtypes in each experimental groups. (D) Differential expression of inhibitory receptors (Lag3 and Tigit) in Cd8_Tem among the different experimental groups. The exhausted CD8+T cell markers, Lag3 and Tigit were significantly downregulated in the MnBuOE/RT (MnBuOE and irradiation) group compared to the RT (irradiation only) group. *P<0.05, **P<0.01, ***P<0.001. (E) Violin plot showing the expression of genes related to cytotoxicity (Gzma, Prf1), dysfunction (Pdcd1, Lag3, Tigit, Havcr2, Ctla4), and naïve/memory (Tcf, Ccr7, Il7r) scores in Cd8_Tem among the different experimental groups. *P<0.05, **P<0.01, ****P<0.0001. (F) Significant inhibitory receptor-ligand pairs (Tigit and Nectin/Pvr) or stimulatory receptor-ligand pairs (Cd226 and Nectin/Pvr) sending signals from CAFs and epithelial cells to Cd8_TemCircle size represents the levels of significance, and color shows the probability of communica. tion in each pair. MnBuOE, MnTnBuOE-2-PyP5+; UMAP, uniform manifold approximation and projection; NK, natural killer; Cd8_Tem, CD8+ effector memory T cells; Cd4_Treg, CD4+ regulatory T cells; Lag3, lymphocyte-activation gene 3; Tigit, T cell immunoglobulin and immunoreceptor tyrosine-based inhibitory motif domain; MnBuOE/RT, MnTnBuOE-2-PyP5+/radiation therapy; Pvr, poliovirus receptor.
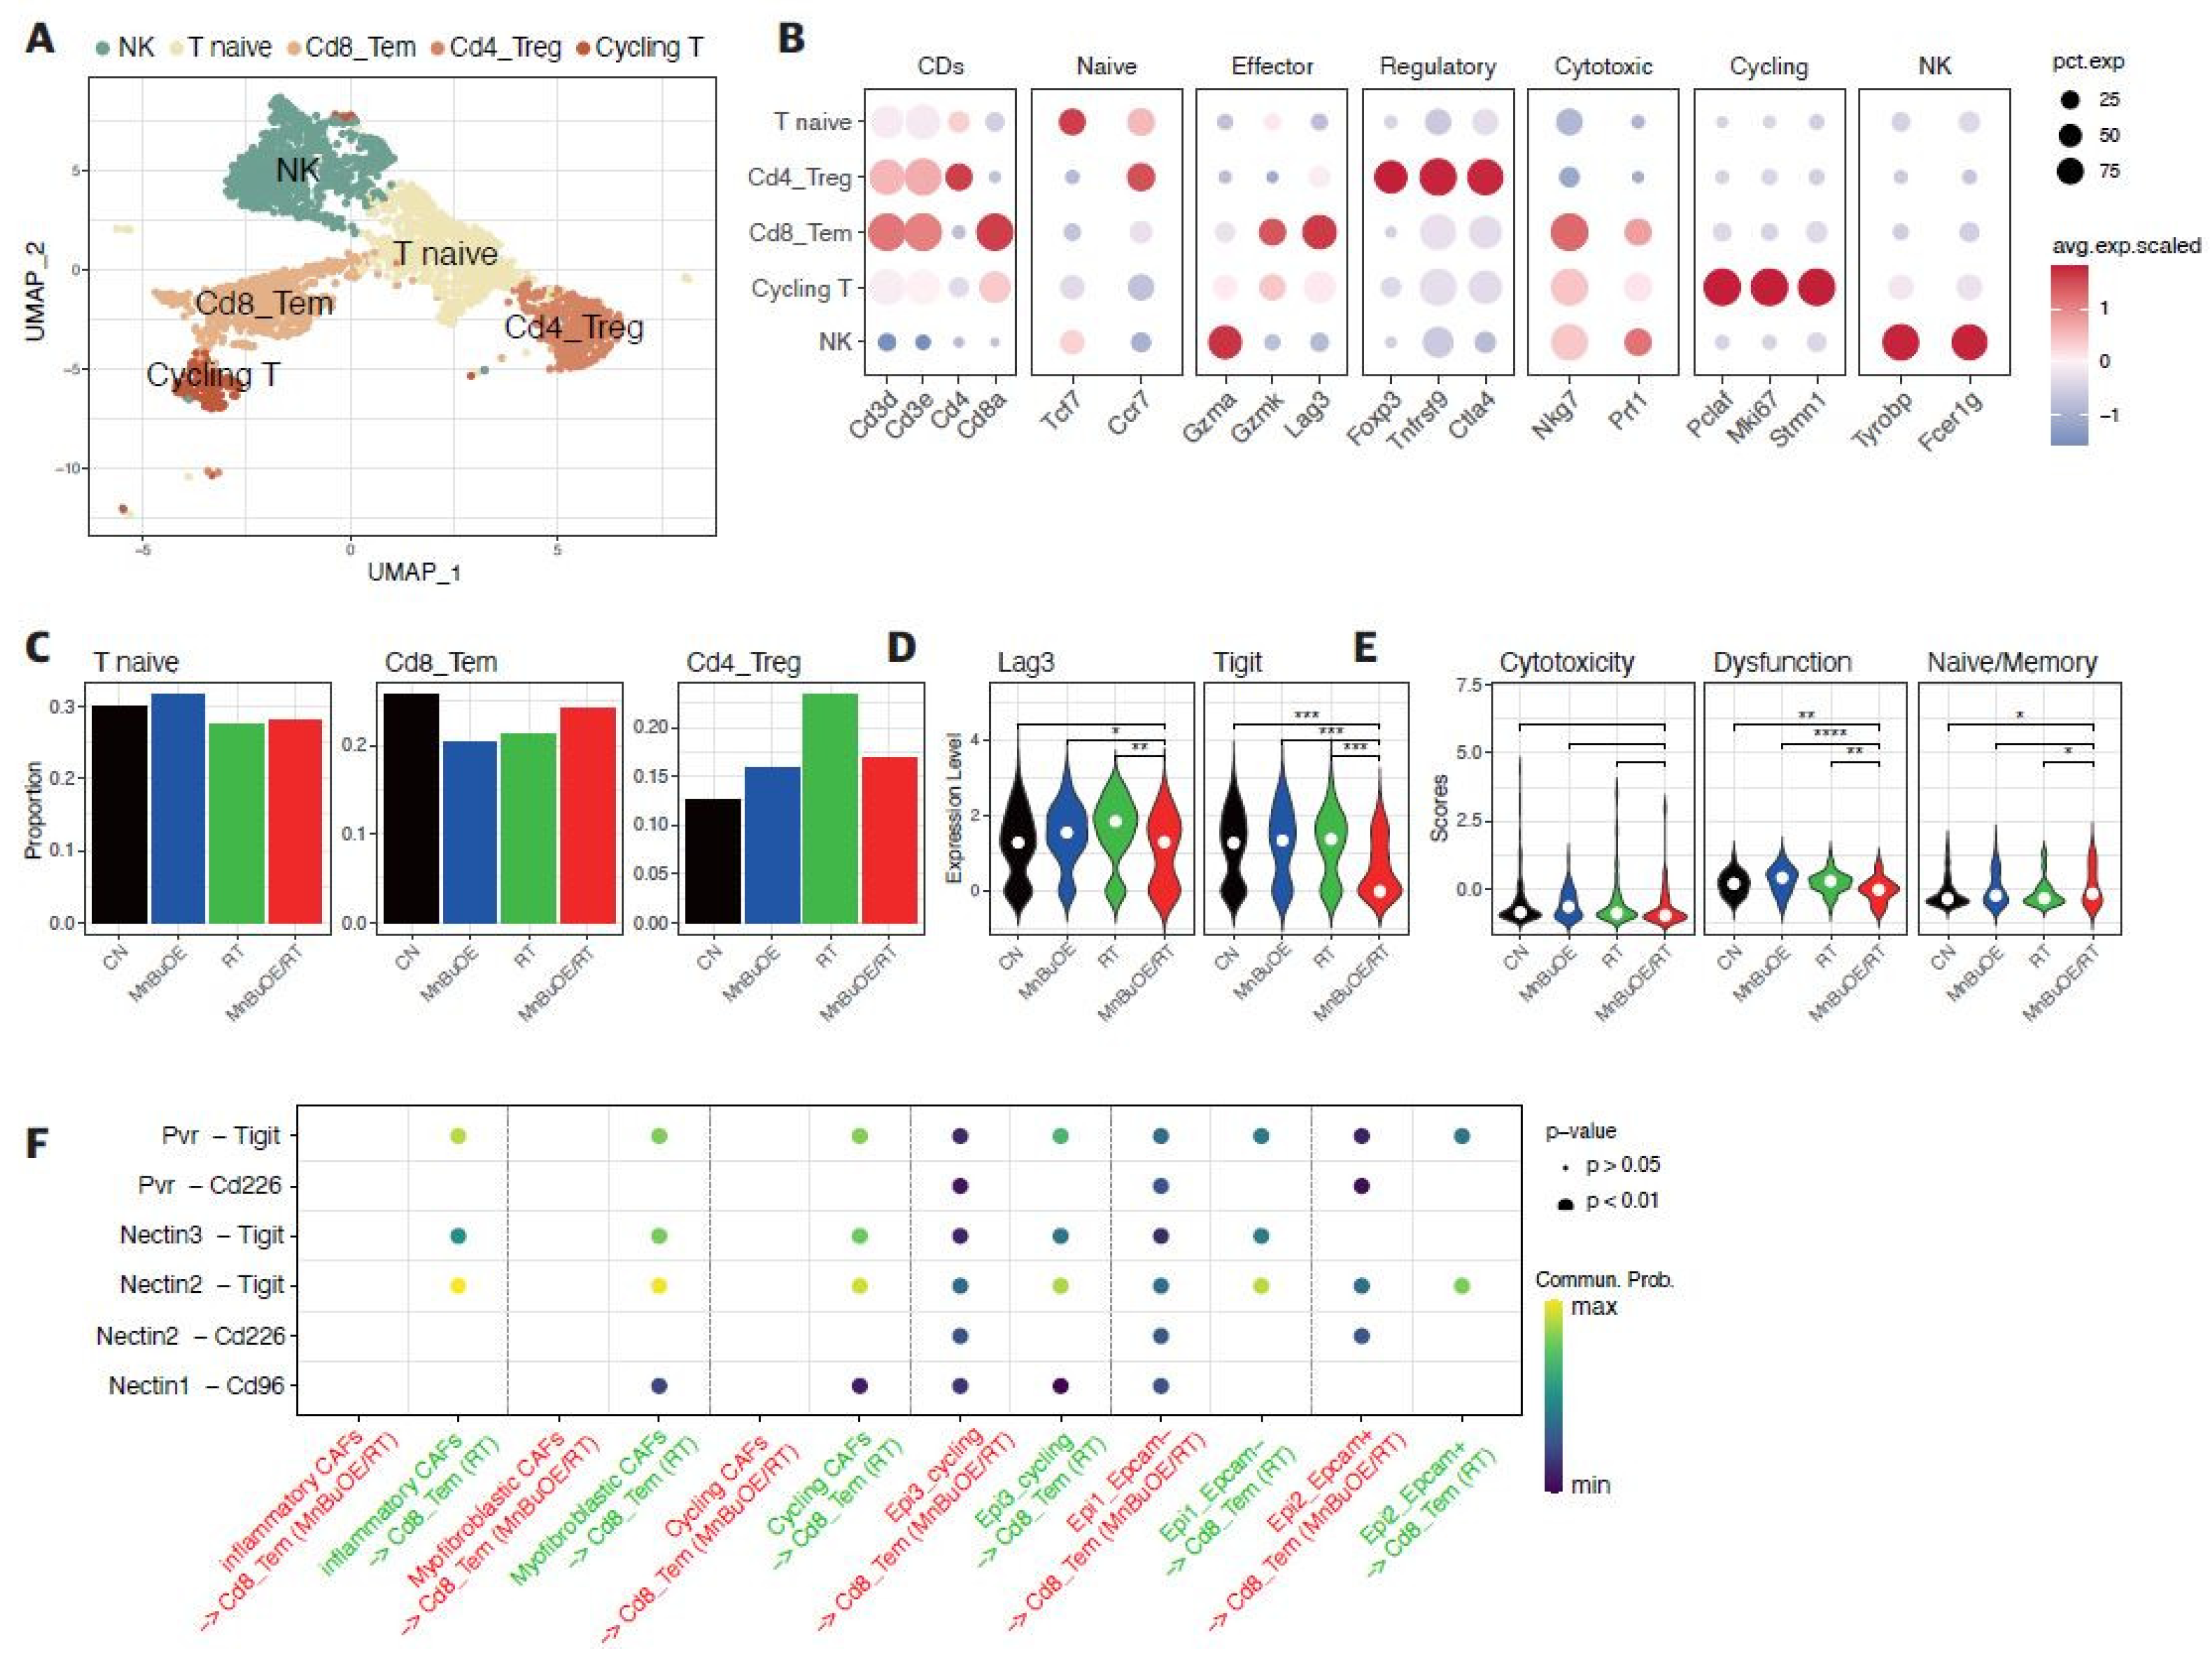
Figure 4.
Flow cytometric analysis of the effects of MnBuOE and irradiation on T cell populations. (A) Flow cytometric analysis of total T cell population, CD8+T cells, and Treg cells infiltrated into tumors in each experimental group. Representative density plots are shown. (B) The proportion of the total T cell population, CD8+T cells, and Treg cells was calculated. These results imply that the combination of MnBuOE and irradiation can lead to increased CD8+T cells and decreased Treg cells while raising total T cell population. *P<0.05, **P<0.01, ***P<0.001. MnBuOE, MnTnBuOE-2-PyP5+; Treg cells, regulatory T cells.
Figure 5.
Effect of MnBuOE and irradiation on dendritic cell activation. (A) UMAP plot of DCs. DCs clustered in four subsets: DC_Cd40+, cDC1_Cd103+, cDC2_Cd11b+, and pDC_Siglech+. (B) Inferred trajectory plot using Monocle2, which shows the color-coded subtypes of DC (left) and their corresponding pseudotime (right). (C) Violin plot showing the expression of canonical markers in each DC subtype. The cDC2_Cd11b+ dominated Itgam, the cDC1_Cd103+ dominated Itgae, the DC_Cd40+ dominated Cd86, Cd40, Ccr7, and the pDC_Siglech+ dominated Siglech. (D) Proportion of DC subtypes in each experimental group. (E) Differential expression of co-stimulator genes (Cd40, Cd80, and Cd86) and DC markers (Ccr7) among the different experimental groups. Mature DCs were identified based on the expression of marker genes such as Cd40, Cd80, Cd86, and Ccr7. MnBuOE combined with radiation therapy triggered mature DC activation compared to the other groups. MnBuOE, MnTnBuOE-2-PyP5+; UMAP, uniform manifold approximation and projection; DCs, dendritic cells; cDC, conventional dendritic cell; pDC, plasmacytoid dendritic cell.
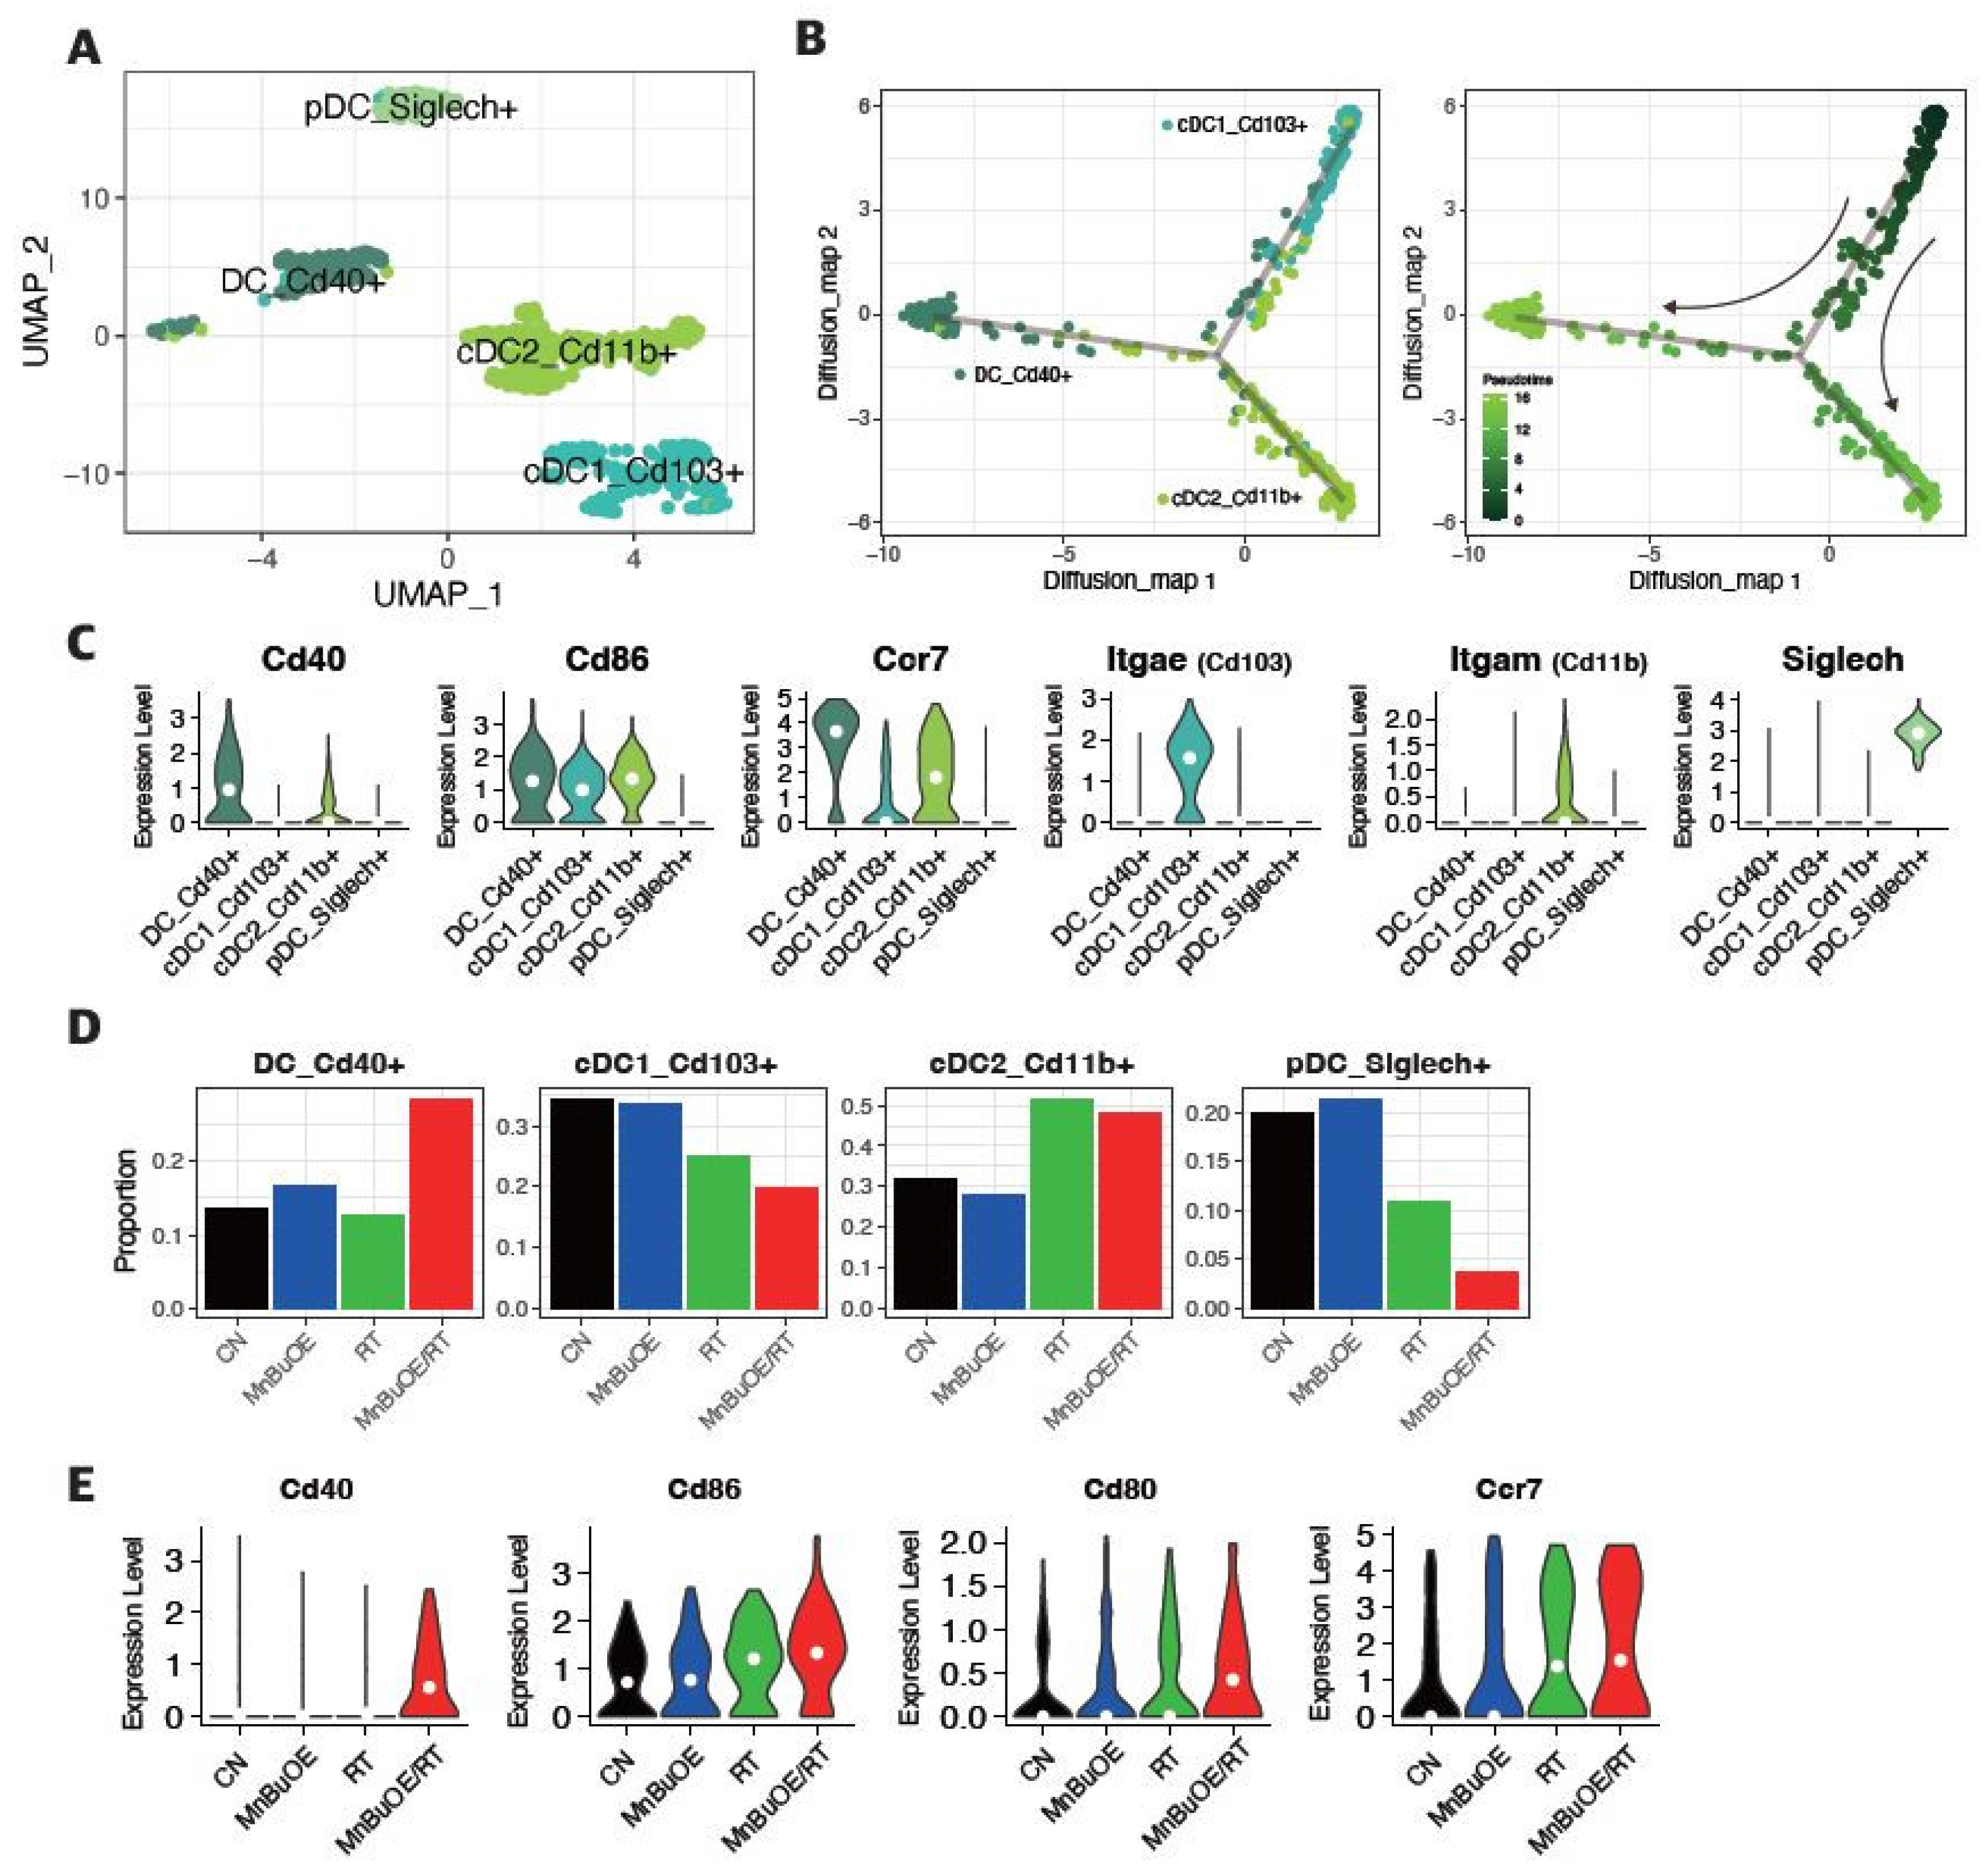
Figure 6.
Increased pro-inflammatory macrophage proportion (M1-phenotype) in response to MnBuOE treatment coupled with irradiation. (A) Macrophage subtypes based on UMAP analysis presented using individual colors (n=14,177). (B) Dot plot of macrophage markers for each subtype. Two clusters correspond to M0-like macrophages (MHC II+ type and Cx3cr1+ type), one cluster corresponds to M1-like TAMs (IL1b+, Cxcl3+, Il1a+, Mmp12+), two to M2-like TAMs (Arg1+ TAM1 type and Cd206+IL10+ TAM2 type), one to MDSCs (Ly6C+, Itgam+, Cxcl3+, Il1a+, Il1b+), and the last one to cycling macrophages (Pclaf+, Tubb5+). (C) Violin plot displaying the difference in M1, M2, and MDSC scores between the experimental groups. *P<0.05, ***P<0.001, ****P<0.0001. (D) Ratio of M1-related macrophages (M1-like TAM_Il1b+) and M2-related macrophages (M2-like TAM1_Arg1+, M2-like TAM2_Il10+) in each experimental group. MnBuOE combined with irradiation therapy significantly augmented M1/M2 ratio of macrophages and reduced MDSCs compared to the other groups. (E,F) The flow cytometric analysis of M1 or M2-biased phenotype marker (CD86, CD206, or F4/80) for macrophage phenotype infiltrated into tumors in each experimental group. Representative density plots are shown. The ratio of M1/M2 phenotype increased in the MnBuOE/RT group compared to the other groups. *P<0.05. (G) Differential expression of inflammatory-related genes (Il1a, Il1b) and M1-phenotype genes (Ccl3, Ccl4) among the different experimental groups. *P<0.05, **P<0.01, ****P<0.0001. MnBuOE, MnTnBuOE-2-PyP5+; UMAP, uniform manifold approximation and projection; TAM, tumor-associated macrophage; MDSC, myeloid-derived suppressor cells.
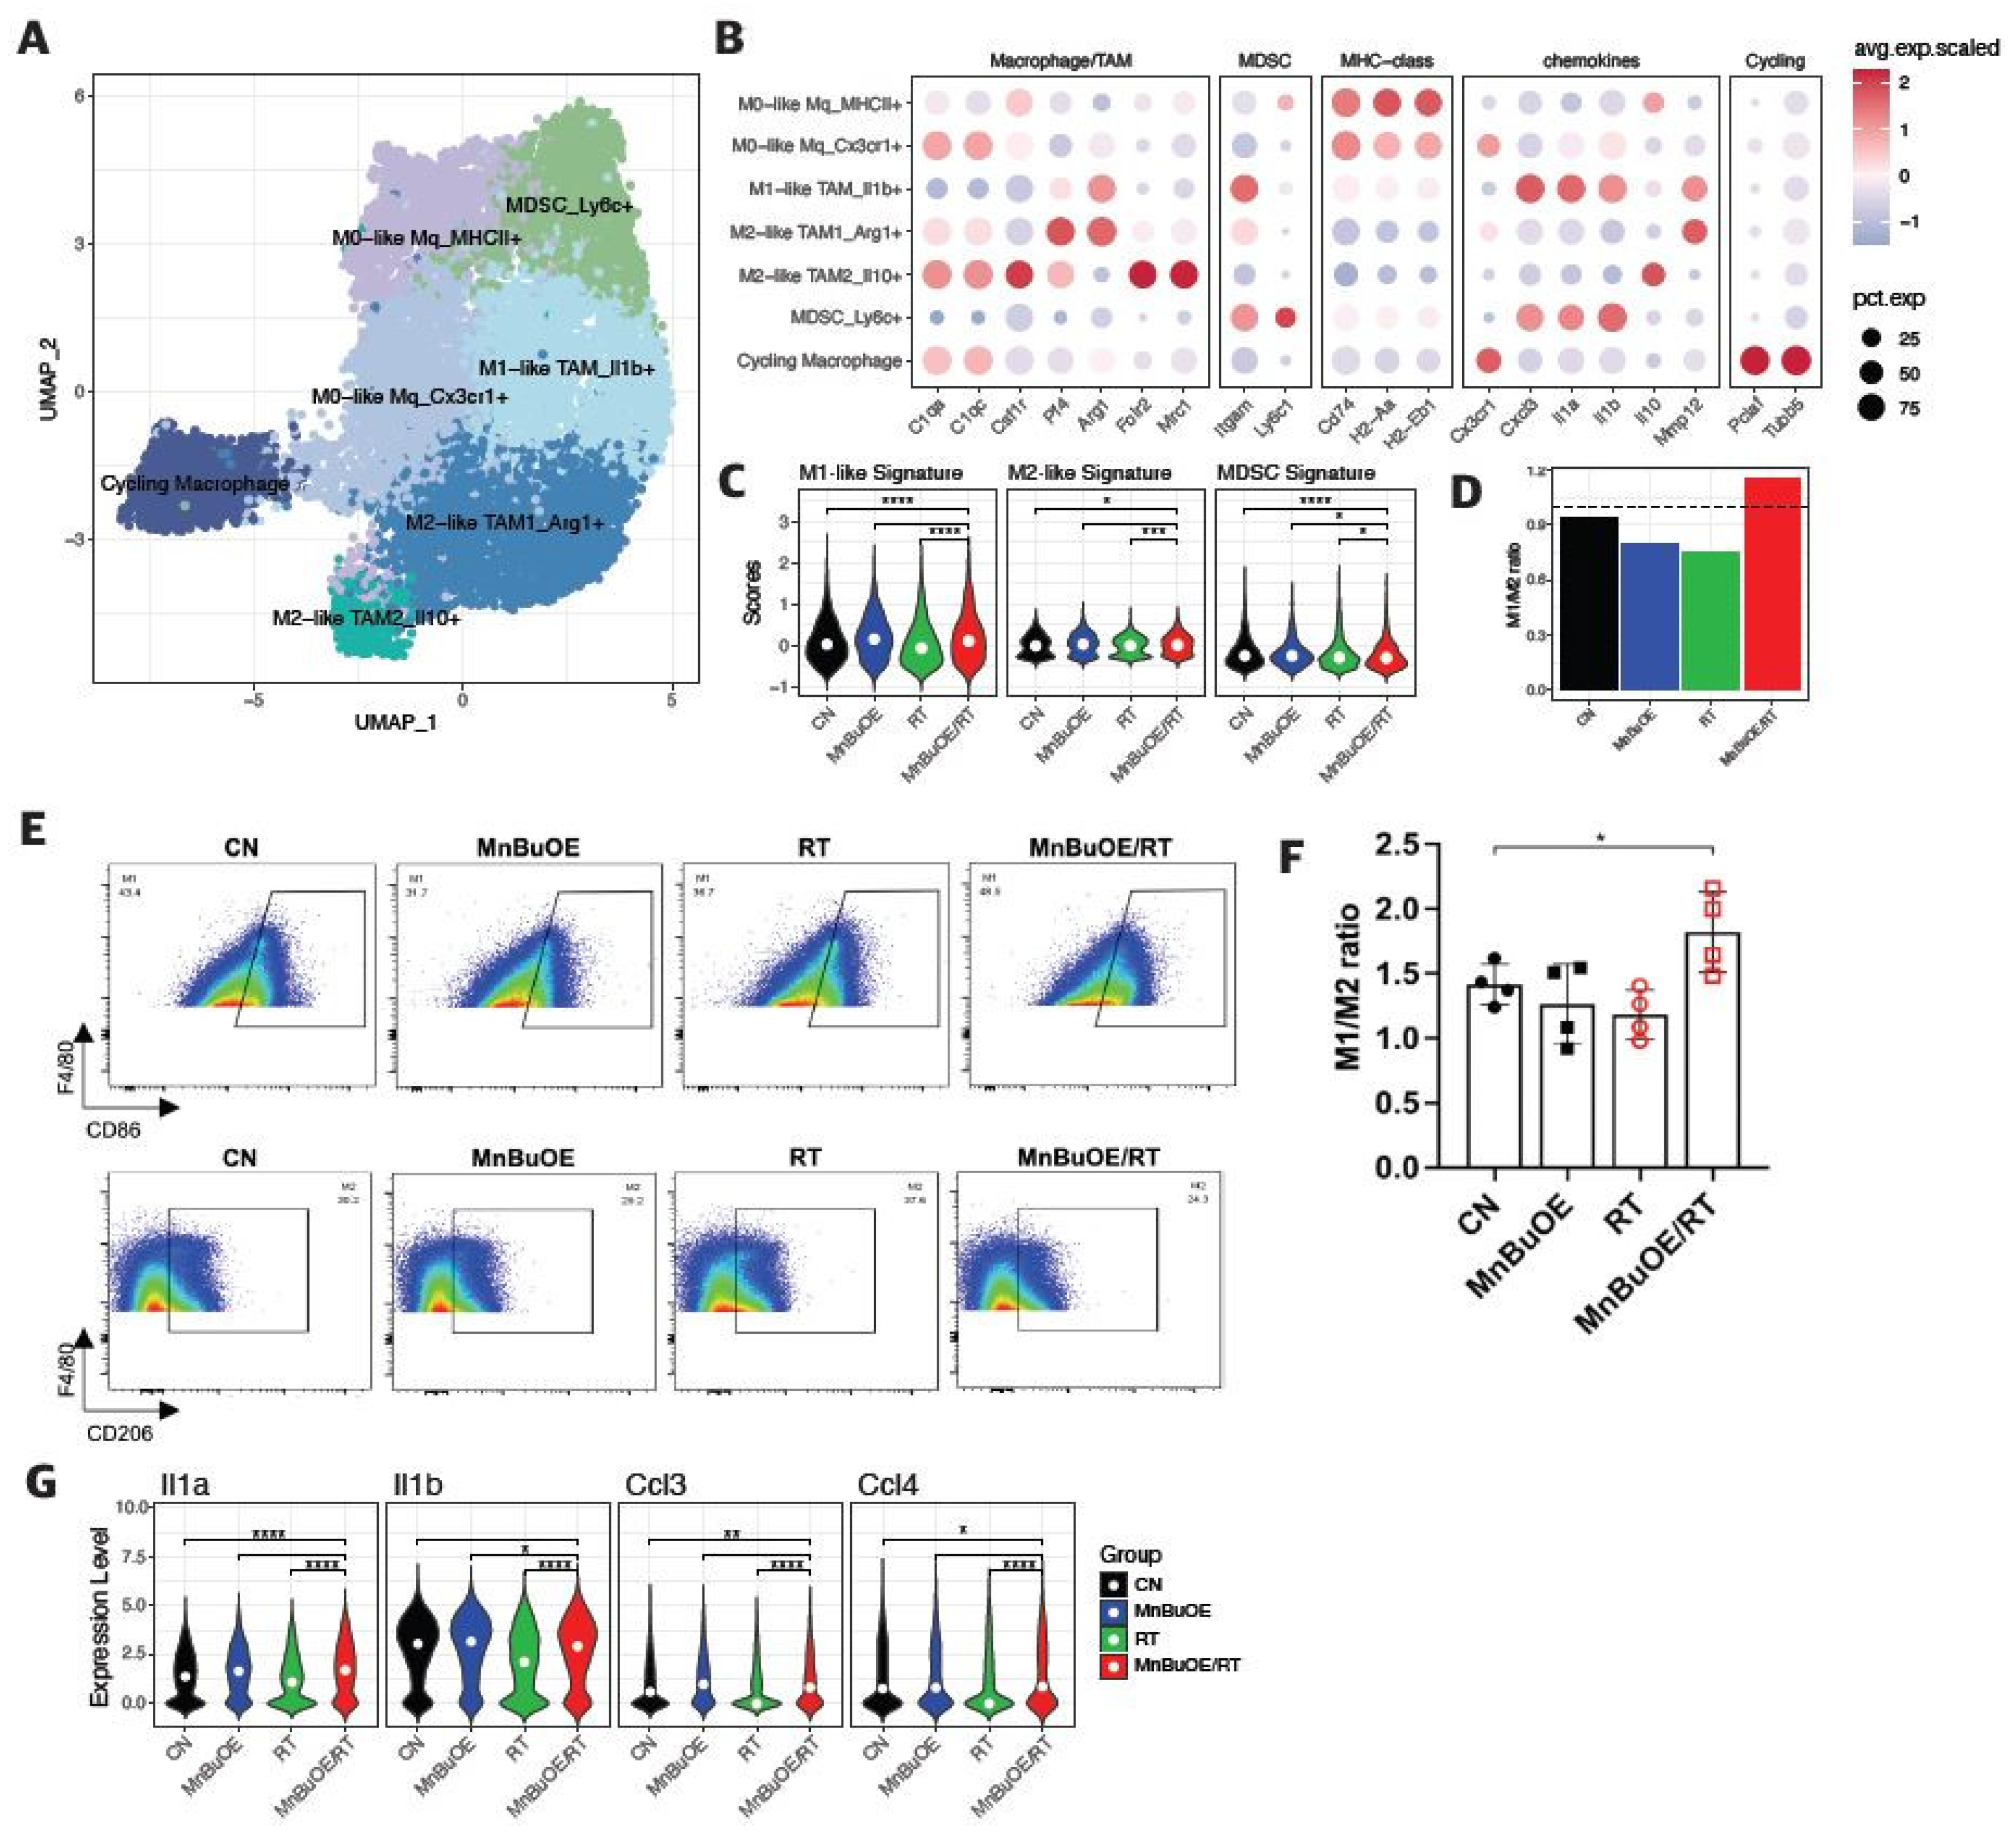
Figure 7.
Difference in cell–cell interactions of TME following treatment with MnBuOE and irradiation. (A) Heatmaps showing the differential number of interactions between MnBuOE/RT (MnBuOE and irradiation) and RT (irradiation only) groups. Red color indicates increased communication in the MnBuOE/RT group compared to the RT group, whereas blue color indicates decreased possible communication. (B) Number of significant inferred interactions in three categories: cell–cell contact, ECM–receptor, and secreted signaling in different experimental groups. TME, tumor microenvironment; MnBuOE/RT, MnTnBuOE-2-PyP5+/radiation therapy; ECM, extracellular matrix.
Figure 8.
Schematic diagram of the synergistic effect of MnBuOE/RT in cancer treatment. By analyzing the characteristics of each subtype formed by tumor and immune cells in the TME, we discussed the possibility that each cell would interact organically with other cells with cell specificity. Our data suggest that MnBuOE/RT therapy can provide a favorable environment for cancer cell removal due to M1-macrophage, DC maturation, and augmented cytotoxic CD8+T activity, which in turn prevents normal cell damage and metastasis, induced by inflammation and angiogenesis by inhibiting CAFs and EMT. MnBuOE/RT, MnTnBuOE-2-PyP5+/radiation therapy; TME, tumor microenvironment; DC, dendritic cell; CAFs, cancer-associated fibroblasts; EMT, epithelial-to-mesenchymal transition.


