Preprint
Article

A Multi-strategy Enhanced Dung Beetle Optimization Algorithm and Its Application in Engineering

Altmetrics

Downloads

229

Views

105

Comments

0

This version is not peer-reviewed

Submitted:

06 February 2024

Posted:

06 February 2024

You are already at the latest version

Alerts
Abstract
This paper introduces a novel multi-strategy enhanced dung beetle optimization (MSDBO) algorithm that is designed to address several issues identified in the standard dung beetle optimization algorithm. Specifically, the MSDBO aims to enhance convergence speed, reduce susceptibility to local optima, and increase search accuracy. By incorporating three strategies: tent chaotic mapping for population initialization, the golden sinusoidal strategy for position updating, and the Lévy flight strategy for balancing exploration and exploitation, the standard dung beetle optimization algorithm is enhanced. The MSDBO algorithm is evaluated using twelve benchmark test functions and compared against five state-of-the-art algorithms. The results consistently show that MSDBO exhibits faster convergence speeds and more accurate solutions than the other algorithms across most of the test functions. In addition, MSDBO is also applied to optimize the parameters of a valve plate, including the close angle, cross angle, triangle groove sizes, and wrap angle. The optimization outcomes reveal that MSDBO effectively minimizes pressure ripples in the piston chamber, resulting in reduced flow rate fluctuations and noise emission compared to the initial design. This study highlights the potential of the MSDBO algorithm in tackling complex nonlinear engineering optimization problems.
Keywords: 
Subject: Computer Science and Mathematics  -   Data Structures, Algorithms and Complexity

1. Introduction

The growing popularity of natural-inspired optimization algorithms in tackling intricate real-world optimization problems is driven by natural phenomena and collective animal behaviors. As a result, efficient heuristic algorithms have emerged from these algorithms, enabling exploration and exploitation within expansive search spaces [1,2]. The Dung Beetle Optimization Algorithm (DBO) is based on principles of collective intelligence through modeling behaviors of dung beetles. These small insects exhibit complex interactions in behaviors such as rolling balls of dung, performing mating dances, searching for resources, competing with others, and reproducing offspring. The wisdom derived from natural phenomena is harnessed by the DBO, which is introduced by Jiankai Xue [3]. In this algorithm, the population is divided into four categories of search agents: ball-rolling dung beetles, brood balls, small dung beetles, and thieves. Compared to well-known alternatives like Genetic Algorithm (GA) [4] and Particle Swarm Optimization (PSO) [5], the DBO algorithm demonstrates superior convergence speed, accuracy, robustness in handling complex problems, adaptability across diverse domains, and a balanced combination of exploration and exploitation. It draws biological inspiration from the efficient foraging strategies employed by dung beetles. With its ability to enhance convergence speed, accuracy, robustness, adaptability, and draw biological inspiration, the DBO algorithm offers a promising solution for optimizing real-world applications. In the field of solar and wind energy integration, Supriya et al. [6] successfully employed the DBO algorithm to minimize total generation cost while ensuring power balance and network constraints, effectively addressing the uncertainty associated with renewable energy sources. Li et al. [7] developed a multi-strategy enhanced dung beetle optimizer (MDBO) to solve the complex optimization task of three-dimensional path planning for unmanned aerial vehicles (UAVs), overcoming limitations of the standard DBO. Experimental results demonstrated that MDBO significantly improved optimization accuracy and stability, surpassing other meta-heuristic algorithms. Hu et al. [8] utilized the DBO algorithm to optimize the parameters of machine learning models in addressing the debonding failure problem in FRP-strengthened reinforced concrete beams. Studies applying the DBO algorithm yielded results confirming its effectiveness and efficiency in predicting debonding failure. However, limitations are also identified, including a lack of population diversity that reduces efficiency in iterative calculations and leads to premature convergence, limiting its ability to solve nonlinear problems [9,10,11].
Researchers have proposed and tested enhanced versions of the DBO algorithm to overcome its limitations. Zhang et al. [12] made three improvements to the original DBO algorithm. Firstly, they introduced piece-wise linear chaotic mapping (PWLCM) to generate more diverse initial dung beetle species. Secondly, an adaptive nonlinear decreasing producer ratio model was adopted to control producer numbers and accelerate convergence. Thirdly, a dimensional learning-enhanced foraging (DLF) search strategy was applied to enhance exploration and exploitation abilities. They named their improved algorithm the Improved Dung Beetle Optimizer (IDBO) and evaluated it on 29 CEC-BC-2017 test functions and two real-world problems. Experimental results showed that the IDBO algorithm outperformed the original DBO algorithm and other existing algorithms in most cases. Similarly, Zhang et al. [13] proposed the Enhanced Dung Beetle Optimization (EDBO) algorithm, incorporating four improvements: (1) using opposition-based learning (OBL) for diverse initial population; (2) employing a dynamic adjustment strategy for balancing exploration and exploitation; (3) incorporating a local search operator based on the Nelder-Mead simplex method to refine solutions; and (4) applying a mutation operator based on Gaussian distribution to escape local optima. They tested the EDBO algorithm on 23 benchmark functions and three engineering design problems, comparing it with other optimization algorithms. Results showed that the EDBO algorithm achieved comparable or better performance in solution quality, convergence speed, and robustness. Additionally, researchers have explored hybrid algorithms by combining the DBO algorithm with other optimization techniques. For example, Liu et al. [14] proposed the Hybrid Arithmetic Optimization (HAO) and Golden Sine (GS) algorithm, integrating the arithmetic crossover operator of arithmetic optimization (AO) into the DBO algorithm and using the GS algorithm to update the best solution in each iteration. To enhance exploration and exploitation capabilities respectively, they employed a Levy flight strategy and Brownian mutation strategy. Their hybrid algorithm, HAO-GS-DBO, was evaluated on 23 benchmark functions and two real-world problems, demonstrating superior performance compared to DBO and other existing algorithms in most cases.
Indeed, the DBO algorithm has shown improved performance through modifications and hybridization, as evidenced by its success on benchmark functions and specific engineering problems. However, it is important to note that the direct application of the DBO algorithm to real-world nonlinear problems with multiple constraints is relatively limited. While the algorithm has demonstrated efficacy in various domains, its adaptation and utilization for complex real-world scenarios involving nonlinear problems and multiple constraints continue to present ongoing challenges that require further research. In the field of hydraulic systems, hydraulic transmissions pose a particular challenge due to their complex dynamics and nonlinear characteristics [15]. One key component of hydraulic systems is the axial piston pump, which consists of a cylinder block with multiple pistons arranged in an annular array. These pumps can function as standalone pumps, hydraulic motors, or automotive air conditioning compressors, offering advantages in terms of efficiency, compactness, and reliability [16]. However, they also have drawbacks such as elevated noise levels, significant friction loss, and susceptibility to cavitation [17]. Noise reduction is a major challenge in the design and operation of axial piston pumps, as it affects the system’s performance, safety, comfort, and environmental quality [18]. Axial piston pumps generate noise from three sources: structure-borne noise, fluid-borne noise, and airborne noise [19]. Discrete-frequency tones at integral multiples of the pumping frequency are the main contributors to noise generation [20]. The valve plate, particularly in the regions where the outlet and inlet ports transition, has a significant influence on the noise level. Various methods have been employed to investigate noise reduction in axial piston pumps [21,22,23], and one effective approach is optimizing the design of the valve plate [24]. The design of the valve plate affects the pressure and flow characteristics within the piston chamber and ports, which are directly related to the sources of noise [25]. Axial piston pumps commonly use two types of valve plates: those with pressure relief grooves and those with damping holes. Pressure relief grooves facilitate smooth pressure transitions but may lead to air-release and cavitation near the grooves [26]. Damping holes, on the other hand, can prevent air-release and cavitation but may result in increased pressure overshoot and undershoot within the piston chamber [27].
The preceding analysis underscores the practical applicability of valve plate optimization in improving pump displacement, efficiency, noise and vibration reduction, and service life extension. However, existing optimization methods have limitations such as single approaches, slow convergence of algorithms, and poor reliability, making them insufficient for addressing complex nonlinear optimization problems. In light of the innovative nature of the DBO algorithm, this paper proposes a mixed strategy improved DBO (MSDBO) to investigate its feasibility in solving practical nonlinear engineering problems, specifically focusing on valve plate optimization. The main enhancements and contributions of this approach are as follows:
1)Utilization of Tent chaotic mapping for initializing the dung beetle population, ensuring an even distribution of individuals and guaranteeing diversity within the initial population.
2)Introduction of the golden sine position update strategy in the dung beetles’ foraging and reproduction position update formulas, accelerating the convergence speed of the algorithm and enhancing its search capability.
3)Incorporation of an adaptive dynamic weight parameter update strategy in the position update of the thieving dung beetles, balancing the exploration and exploitation abilities of the algorithm.
The remainder of this paper is organized as follows: Section 2 clarifies the principle and mathematical model of the standard DBO algorithm, presents the proposed MSDBO algorithm, and discusses its advantages over the standard version. Section 3 evaluates the performance of MSDBO on benchmark functions and compares it with other state-of-the-art algorithms. Additionally, the performance of MSDBO is validated through an engineering experiment focusing on the valve plate optimization of an axial piston pump. In Section 4, the main contributions of this paper are summarized, the limitations of the methodology are pointed out, and potential directions for future research are suggested.

2. Methodology

2.1. The Standard DBO Algorithm

The Dung Beetle Optimization (DBO) algorithm is a bio-inspired heuristic approach inspired by the foraging behaviors of dung beetles in nature. These remarkable insects can form and transport dung balls larger than their own body size and relocate them to a safe location for consumption. The guiding principle for dung beetles to maintain a straight trajectory is celestial cues when a light source is available [28]. However, deviations from the optimal path can occur in the absence of light or due to disruptions in the light source caused by natural factors. Additionally, dung beetles allocate the dung balls for their survival, using some for egg-laying and nurturing their offspring while consuming the rest. Drawing inspiration from dung beetle behavior, the DBO algorithm replicates five fundamental behaviors: ball-rolling, dancing, foraging, stealing, and breeding. The DBO algorithm categorizes the dung beetle population into four distinct subgroups based on their foraging behaviors: ball-rolling beetles, breeding beetles, smaller foraging beetles, and beetles that steal from others. Each subpopulation employs a specific search method to pursue the optimal solution.

2.1.1. Ball-Rolling Behavior

A ball is formed from a portion of dung by ball-rolling dung beetles, and subsequently, the dung ball is rolled away from the original dung pile by them. Dances involving rotations and pauses on their dung balls are performed by these beetles, enabling the selection and adjustment of their rolling direction. Celestial cues, such as the sun, the moon, and polarized light, are relied upon by ball-rolling dung beetles in their navigation, allowing them to maintain a straight line in the presence of a light source. However, when a light source is absent or disturbed by natural factors such as wind or uneven ground, deviations from the optimal path occur.
In order to replicate the behavior of a ball-rolling dung beetle, the DBO algorithm integrates an iterative procedure that involves updating the position of a dung beetle in a ball-rolling manner. This updating mechanism considers various factors, including the beetle’s current and previous positions, the global worst position, and a random coefficient that represents the deflection factor. The formula used for updating the position can be expressed as follows:
Preprints 98319 i001
The position information of the i-th dung beetle at the t-th iteration is denoted as xi(t) in this equation, where t represents the current iteration number. The deflection coefficient, k, is a constant value within the range (0, 0.2], determining the degree of deflection. The constant value b, which belongs to the range (0, 1), influences the impact of the global worst position, Xω, on the position update. The natural coefficient α is assigned either -1 or 1, indicating the direction of movement. Finally, Δx is introduced to simulate variations in light intensity.

2.1.2. Dancing Behavior

When confronted with an obstacle that impedes its forward movement, the dung beetle undergoes a reorientation process that involves employing dancing behavior. The significance of dance behavior in ball-rolling dung beetles has been well-documented [29,30]. To emulate this behavior, the new rolling direction is determined using the tangent function. Specifically, the focus is placed on the values of the tangent function within the defined interval [0, π]. Subsequently, after establishing a new orientation, the dung beetle proceeds to roll the ball in a backward direction. Consequently, the update of the position of the ball-rolling dung beetle can be described as follows:
Preprints 98319 i002
where θ represents the deflection angle within the interval [0, π].

2.1.3. Foraging Behavior

The emergence of adult dung beetles from the ground for the purpose of locating food is observed. These dung beetles, referred to as small dung beetles, require guidance in establishing the optimal foraging area [31]. The boundary of this optimal foraging area is defined as follows:
Preprints 98319 i003
The global best position is denoted as Xb in the equation, while the lower and upper bounds of the optimal foraging area are represented by Lb and Ub, respectively. Furthermore, (1-t)/Tmax defines the value of R, where Tmax denotes the maximum iteration number. The lower and upper bounds of the optimization problem are indicated as Lbb and Ubb, respectively.
Once the optimal foraging area has been identified, food search within this designated region is carried out by the small dung beetles. The update of the small dung beetle’s position can be described as follows:
Preprints 98319 i004
The position information of the i small dung beetle at the t-th iteration is denoted as xi(t). The random number C1 is drawn from a normal distribution, whereas C2 is a random vector ranging between 0 and 1.

2.1.4. Stealing Behavior

A kleptoparasitic behavior, characterized by the act of stealing dung balls from other beetles instead of creating their own, is observed in certain dung beetle species. This behavior is prevalent in nature, particularly among insects. The region surrounding Xb is considered the prime location for food competition, as it offers the highest quality and quantity of dung. The update of the thief’s position follows the equation below:
Preprints 98319 i005
The position information of the i-th thief at the t-th iteration is represented as xi(t), whereby g is a randomly generated vector of size 1×D following a normal distribution. The stealing behavior’s intensity is regulated by a constant value denoted as S.

2.1.5. Breeding Behavior

The breeding dung beetles utilize specific dung balls as brood balls in order to lay eggs and care for their offspring. A strategy known as boundary selection is employed by these particular beetles to determine the areas where the female insects deposit their eggs. The description of this strategy is outlined as follows:
Preprints 98319 i006
The current local best position is represented by X*, whereas the lower and upper bounds of the spawning area are denoted as Lb and Ub, respectively. The definitions of the remaining parameters can be located in Eq. (3).
After the spawning area has been identified, the brood balls within this region are selected by the female dung beetles for the purpose of laying eggs. It should be noted that each female dung beetle lays a single egg during each iteration. The boundary range of the spawning area undergoes dynamic modifications, primarily influenced by the R value. Moreover, the position of the brood ball displays dynamism throughout the iteration process and is defined as follows:
Preprints 98319 i007
The position information of the i-th brood ball at the t-th iteration is denoted as Bi(t), where b1 and b2 are two independent random vectors of size 1×D. Here, D represents the dimension of the optimization problem.

2.2. Multi-Strategy Improved DBO Algorithm

2.2.1. Tent Chaotic Mapping

The initialization of the population plays a critical role in optimization algorithms, as it directly influences the convergence rate and solution quality [32,33]. Typically, population initialization is carried out in a random manner, where individuals are randomly chosen from the search space. Although this approach is straightforward, it can result in an uneven distribution of the population or cause the algorithm to become trapped in local optima.
To address the limitations associated with random initialization, some researchers have adopted the utilization of chaotic maps for population initialization [34,35]. Chaotic maps are nonlinear dynamical systems known for their sensitivity to initial conditions, unpredictability, and wide distribution. By employing chaotic maps for population initialization, the algorithm can enhance the diversity and uniformity of the population, thereby improving its global optimization capabilities and mitigating premature convergence to local optima. Among the various chaotic maps, the Tent map is a concise and versatile nonlinear mapping that generates chaotic sequences characterized by complex dynamics and uncertain behavior [36,37]. It finds extensive applications in cryptography, communication, optimization, image processing, and numerous other domains. The mathematical representation of the Tent map is presented below:
Preprints 98319 i008
The state variable at discrete time n is represented by xn, and the mapping function is denoted as f (xn). The control parameter is μ, and the initial value x0 is referred to as the seed of the map. The map possesses a fixed point at x* = 0, which becomes unstable for μ > 1. When μ = 2, the map demonstrates chaotic behavior, representing the maximum value of μ that guarantees the map’s well-defined nature within the interval [0, 1].
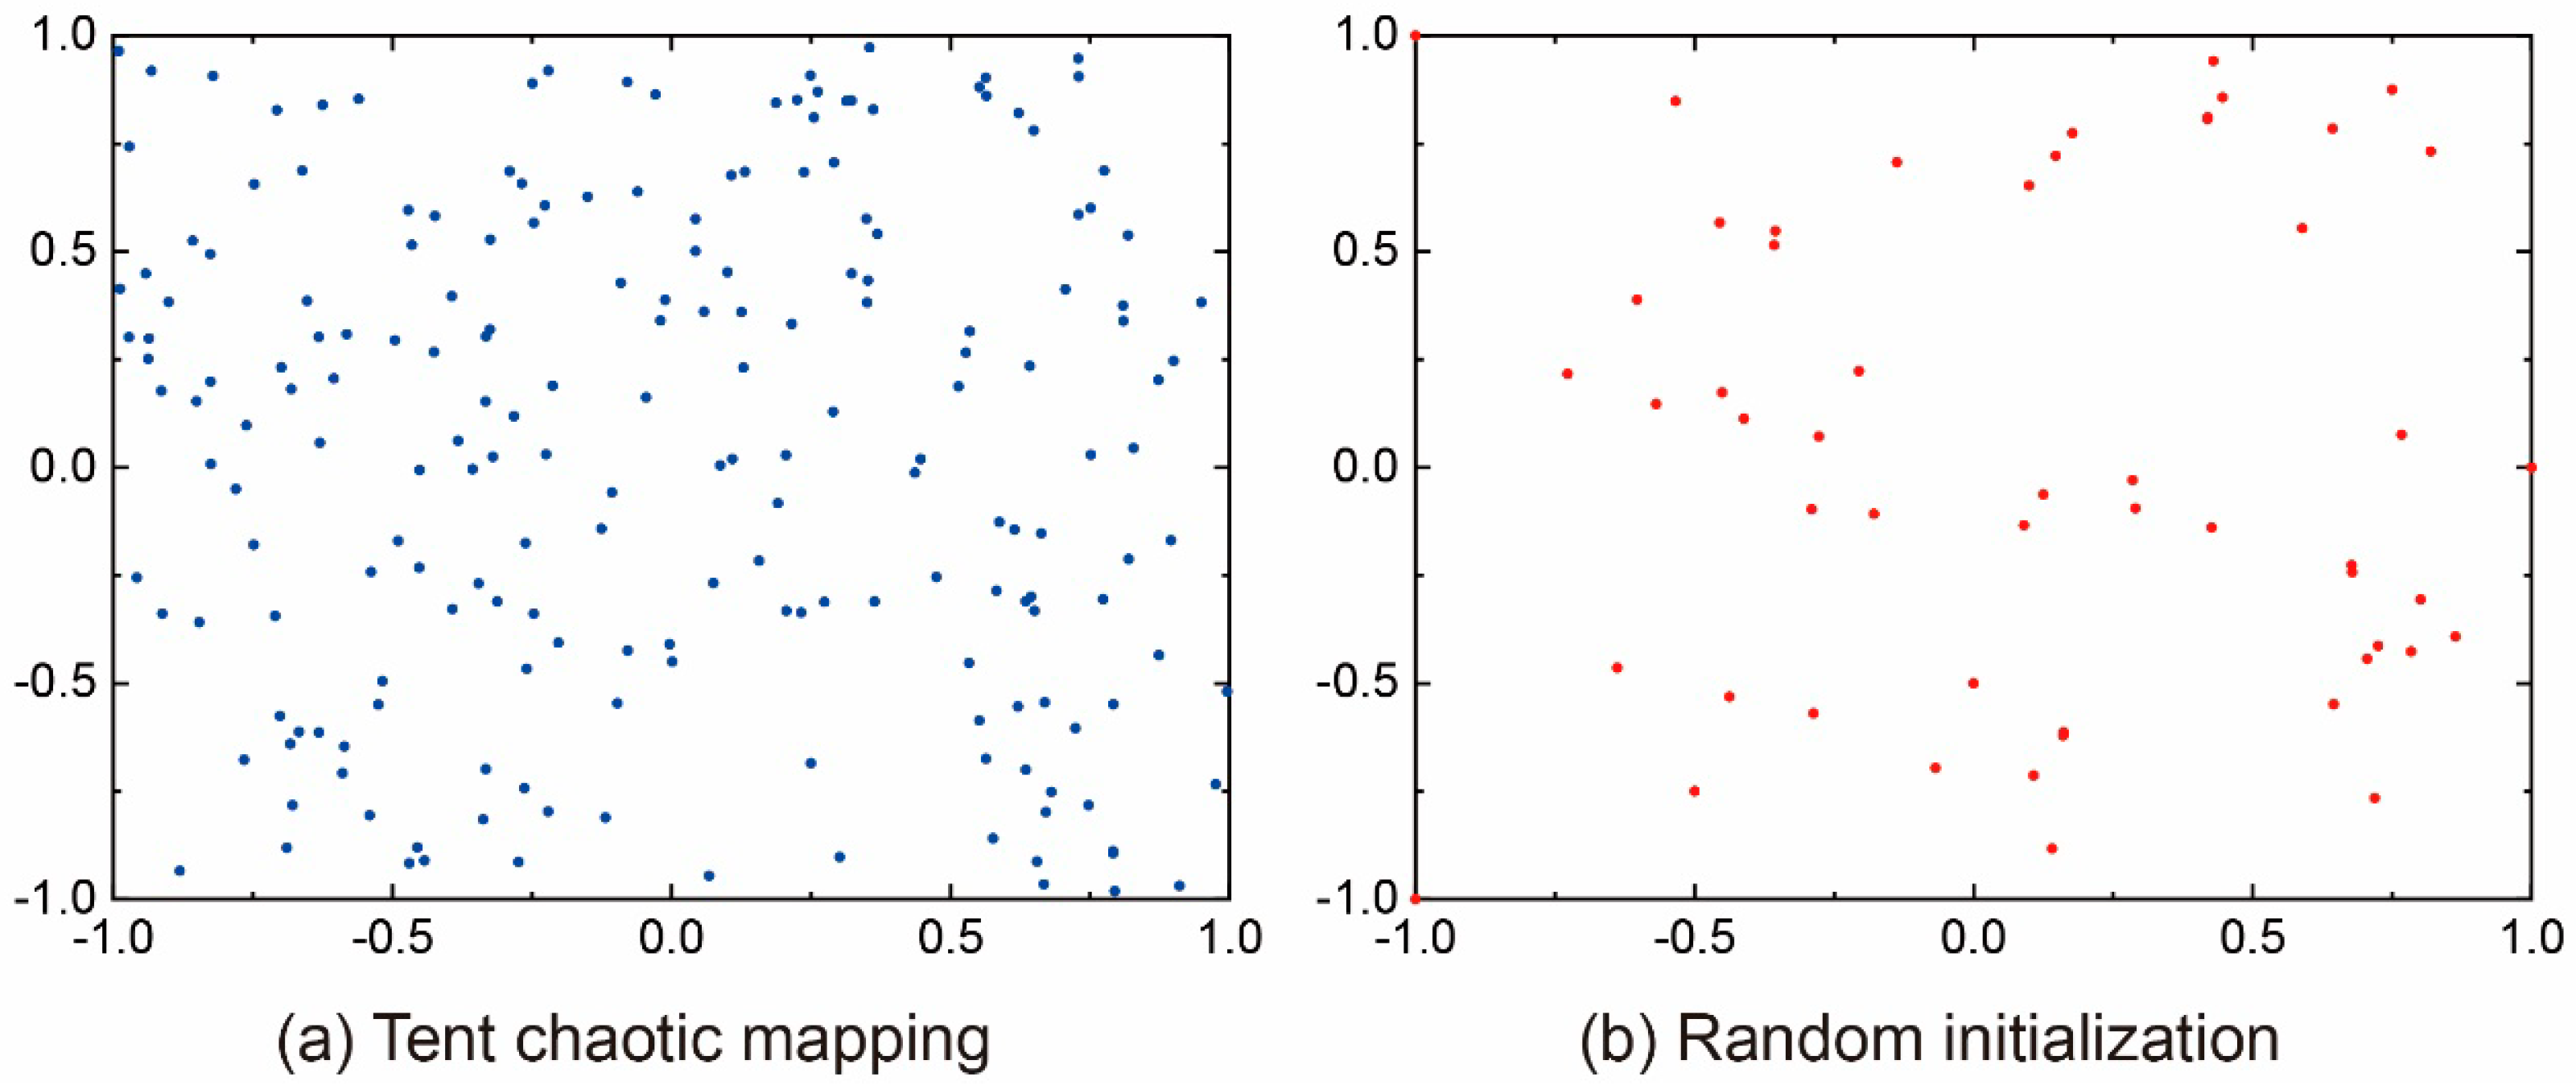
The two-dimensional distribution of the initial population, consisting of 300 individuals with a dimension of 10, is illustrated in Figure 1. The population is generated using both random initialization and the Tent chaotic map method. As depicted in the figure, it is evident that the population distribution obtained through the Tent chaotic map method exhibits greater uniformity. This enhanced uniformity results in an increased diversity within the population, facilitating the avoidance of local optima by the dung beetle population.

2.2.2. Gold Sine Strategy

The rolling behavior, which draws inspiration from the dung beetle’s dung ball rolling mechanism, holds significant importance within the dung beetle optimization algorithm. It consists of two distinct phases: the ball-rolling phase and the dancing phase [38]. In the ball-rolling phase, each dung beetle rolls its dung ball in a straight line, employing a predetermined step size determined by a scaling factor and a random number. The primary objective of this rolling behavior is to enhance search diversity by utilizing environmental cues to ascertain the forward direction.
Nonetheless, the rolling behavior is not exempt from limitations that can potentially affect the algorithm’s performance. One drawback is the susceptibility to premature convergence or stagnation when dung beetles become ensnared in local optima or flat regions. This is attributed to the fixed step size and scaling factor employed consistently throughout the search process, upon which the rolling behavior heavily depends. Another drawback arises when applying the rolling behavior to tackle complex optimization problems characterized by high dimensions, multimodality, or constraints. The rolling behavior assumes a smooth and continuous search space, disregarding the diversity and feasibility of potential solutions.
The golden sine strategy is a novel mathematical algorithm that utilizes the sine function and the golden section to optimize a single unimodal function [39,40]. By leveraging the periodic oscillations generated by the sine function, and the narrowing effect provided by the golden section, this strategy aims to explore the solution space and converge towards the optimal solution. The golden sine strategy offers several advantages, such as a reduced number of parameters and operators in comparison to other metaheuristic algorithms, as well as the potential for faster convergence and higher accuracy. The mathematical formulation of the golden sine strategy is presented as:
Preprints 98319 i009
where p1 represents a random value within the range [0, 2π], and p2 is a random value within the range [0, π]. The coefficients, d1 and d2, are determined using the following equation:
Preprints 98319 i010
where a and b are the initial values, which are set to −π and π, respectively. τ denotes the golden ratio, which is approximately equal to 1.618.
Incorporating a golden sine strategy into the rolling behavior of the dung beetle optimization algorithm introduces a means to update the positions of dung beetles, enabling them to explore the search space sinusoidally. This strategy enhances the search capability of dung beetles in unfamiliar domains and achieves a balance between improving local exploitation. By increasing population diversity and enhancing local search capability, dung beetles are better equipped to discover suitable positions. Figure 2 illustrates a schematic diagram showcasing the enhanced position search of dung beetles utilizing the golden sine algorithm.

2.2.3. Lévy Flight Strategy

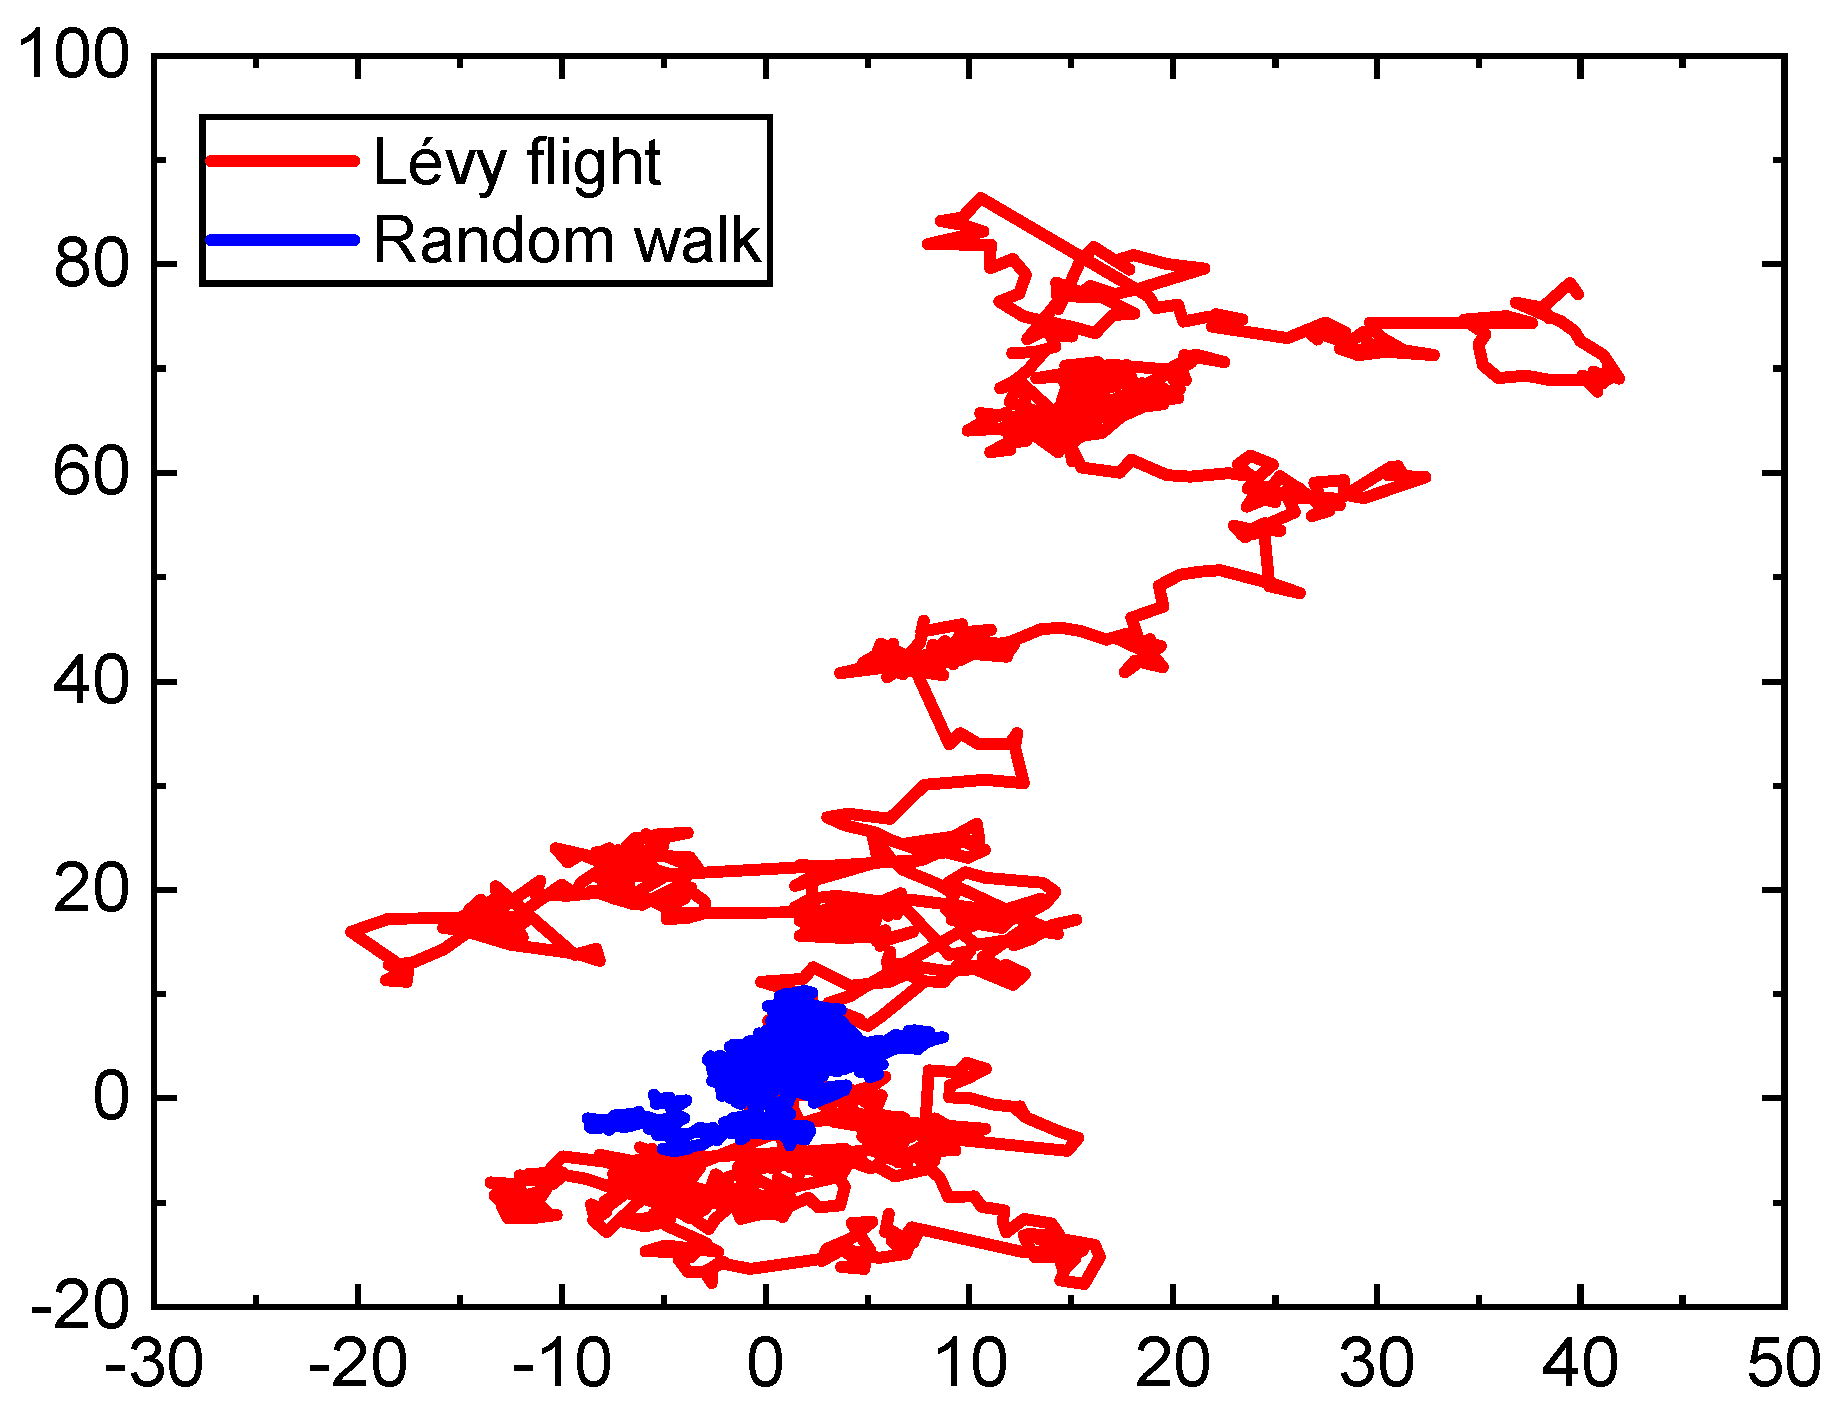
In the DBO algorithm, the act of stealing refers to the ability of a dung beetle to seize the ball of another dung beetle if it is deemed superior. This feature assists in avoiding local optima and enhancing population diversity. However, stealing also presents certain drawbacks, including reduced exploration capacity, increased computational complexity, and the risk of premature convergence. To tackle these issues, the introduction of the Lévy flight strategy is proposed[41,42,43]. This strategy mimics the foraging behavior observed in animals like albatrosses, sharks, and tuna in sparse environments through a random walk approach. The fundamental concept behind the Lévy flight strategy involves utilizing a heavy-tailed distribution, such as the Lévy distribution, to generate step sizes for the random walk. As a result, the random walker occasionally takes long jumps to explore new regions or short jumps to exploit the current region. By striking a balance between exploration and exploitation capabilities in the optimization algorithm, the Lévy flight strategy facilitates the escape from local optima and enables the discovery of the global optimum.
Broadly speaking, Levy flights are characterized as a form of random walk where the length of each step is determined by the Levy distribution, often described using a simple power-law formula L(s)~|s|-1-β, where 0<β≤2 represents an index. In the algorithm proposed by Mantegna, the step length, denoted as s, can be calculated using a specific method.
Preprints 98319 i011
where u and v are drawn from normal distributions. That is:
Preprints 98319 i012
Preprints 98319 i013
where Г is a standard gamma function and β usually takes the value of 1.5.
In the standard DBO algorithm, the step size of the theft behavior is regulated by the constant S. When S is excessively large, there is a risk that the thief dung beetle may venture beyond the promising region, thereby overlooking the optimal solution. Conversely, if S is too small, the thief dung beetle may become trapped in a locally optimal state, resulting in a loss of population diversity. To tackle this issue, a dynamically changing weight coefficient is introduced to replace the fixed weight parameter. This coefficient varies with the number of iterations and aims to enhance the dung beetle’s search capability for the global optimal region. The enhancement is represented as follows:
Preprints 98319 i014
The formula for updating the position of the stealing dung beetle is based on the Lévy flight and the dynamic adaptive weight parameter adjustment strategy, as follows:
Preprints 98319 i015
Preprints 98319 i016
where ξLevy denotes the step size in the search space, α denotes the step control factor, and η ∈ (0,1) denotes a random number.
The simulation results of the random wandering strategy and the Lévy flight strategy were conducted using MATLAB R2017b over 1000 steps, as depicted in Figure 3. The red curve represents the Lévy flight strategy, while the blue curve represents the random wandering strategy. The simulation results indicate that, within the same range of search space, the Lévy flight strategy enables a wider distribution of individuals, thereby enhancing the global search capability and avoiding local optima.
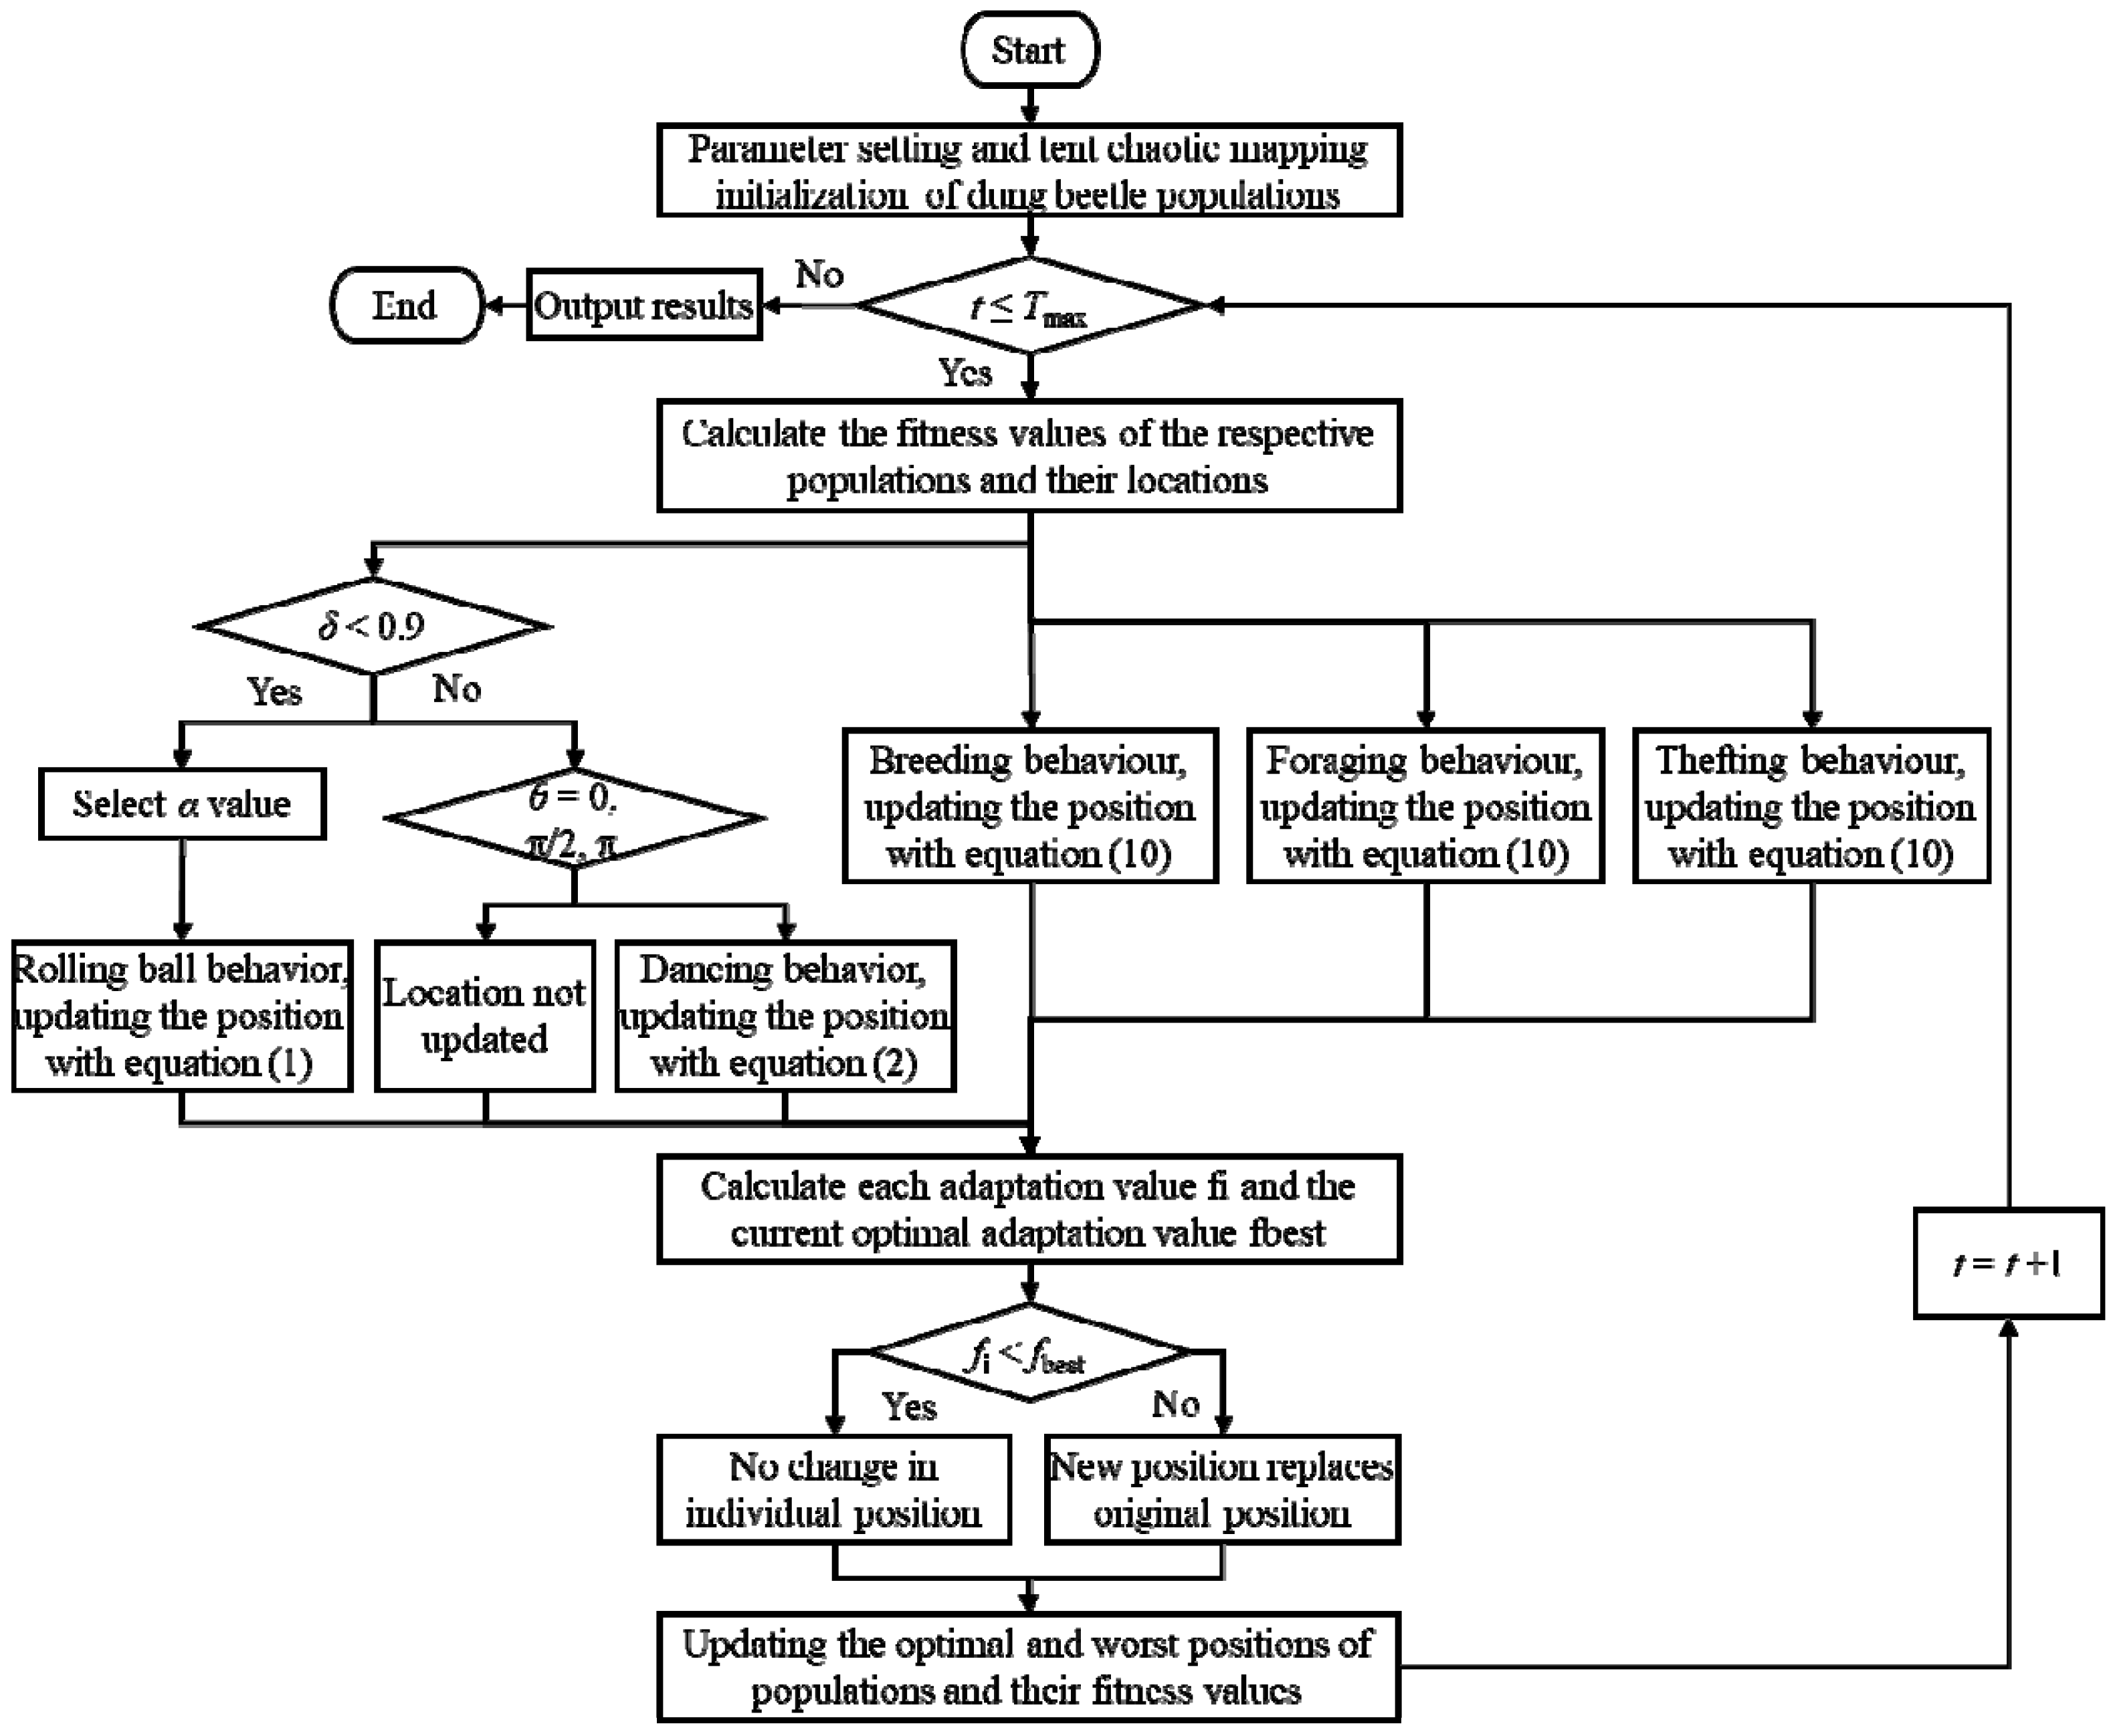
The flow chart illustrates the process of the MSDBO algorithm is shown in Figure 4.

3. Experiment Results and Discussions

3.1. Numerical Experiment

3.1.1. Environment of Experimental

In order to maintain the rigor and impartiality of the experiments, a consistent experimental environment is maintained throughout the simulation experiments conducted in this paper. The simulations are conducted using MATLAB R2017b software on a computer system running Microsoft Windows 10 (64-bit). The system is equipped with an Intel Core i7-11700F processor operating at 2.50 GHz with integrated Radeon graphics and 16 GB of RAM.

3.1.2. Parameter Configurations

For the purpose of this study, five particle swarm optimization algorithms of high caliber are chosen to be compared with the proposed MSDBO algorithm. The algorithms considered for comparison are the Grey Wolf Optimizer (GWO) [44], Sparrow Search Algorithm (SSA) [45], Whale Optimization Algorithm (WOA) [46], Particle Swarm Optimization (PSO), and Harris Hawk Optimization (HHO) [47]. In order to ensure a fair and equitable comparison in terms of numerical experiments, the population size is uniformly fixed at 30 for all the aforementioned algorithms, and the maximum number of iterations is set at 500. The remaining key parameters are established based on pertinent literature and are detailed in Table 1.

3.1.3. Benchmark Functions

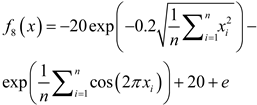
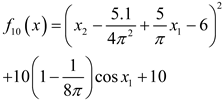
To evaluate the efficacy of MSDBO, twelve benchmark test functions outlined in Table 2 were utilized [48]. Among this set of test functions, F1 to F5 represent high-dimensional single-peaked functions, each possessing a solitary global optimal solution. These particular functions serve as an evaluation metric for the algorithm’s capacity for local exploitation. Conversely, F6 to F9 correspond to high-dimensional multi-peaked functions, characterized by the presence of multiple locally optimal solutions. These functions are utilized to gauge the algorithm’s ability to evade local optima. Finally, functions F10 through F12 represent low-dimensional multi-peaked problems containing multiple local optima. They are employed to analyze the algorithm’s proficiency in circumventing local optima from a low-dimensional standpoint.

3.1.4. Comparation and Analysis

The 12 benchmark functions were subjected to independent runs of the proposed MSDBO algorithm and the comparison algorithms, namely GWO, SSA, WOA, PSO, and HHO, each executed 30 times. The performance of these algorithms was subsequently evaluated based on their search performance and stability performance, with the results summarized in Table 3. Within the table, the terms “Best,” “Mean,” and “Std” correspond to the best value, average function error, and standard deviation, respectively, for each algorithm.
The performance of the proposed MSDBO algorithm is evaluated on 12 benchmark test functions and compared to other algorithms. As shown in Table 3, MSDBO achieves superior results for high-dimensional single-peak functions F1-F4, reaching the optimal value with a mean and standard deviation of zero. Only SSA matched MSDBO’s ability to optimally solve F3, while MSDBO significantly outperformes other algorithms on this problem. For F5, MSDBO and HHO have comparable top performance. On the high-dimensional multi-peak F6, MSDBO rankes second behind HHO. Notably, MSDBO solves high-dimensional multi-peak problems F7-F9 with 100% success locating optimal solutions, retaining the optimal search ability of DBO. For low-dimensional multi-peak functions F10-F12, MSDBO successfully determines theoretical optima. On F10, SSA and DBO also achieves 100% optimal solutions while MSDBO closely matches DBO with a slightly lower deviation. On F11, MSDBO outrankes GWO, WOA and PSO but falls behind leading algorithms SSA and HHO. For F12, MSDBO and GWO exhibite similar search performance, trailing PSO and SSA but surpassing WOA and HHO. In summary, MSDBO demonstrates significantly superior results versus other algorithms on high-dimensional single-peak and multi-peak tests. On low-dimensional multi-peak problems, MSDBO performance alignes with top algorithms.
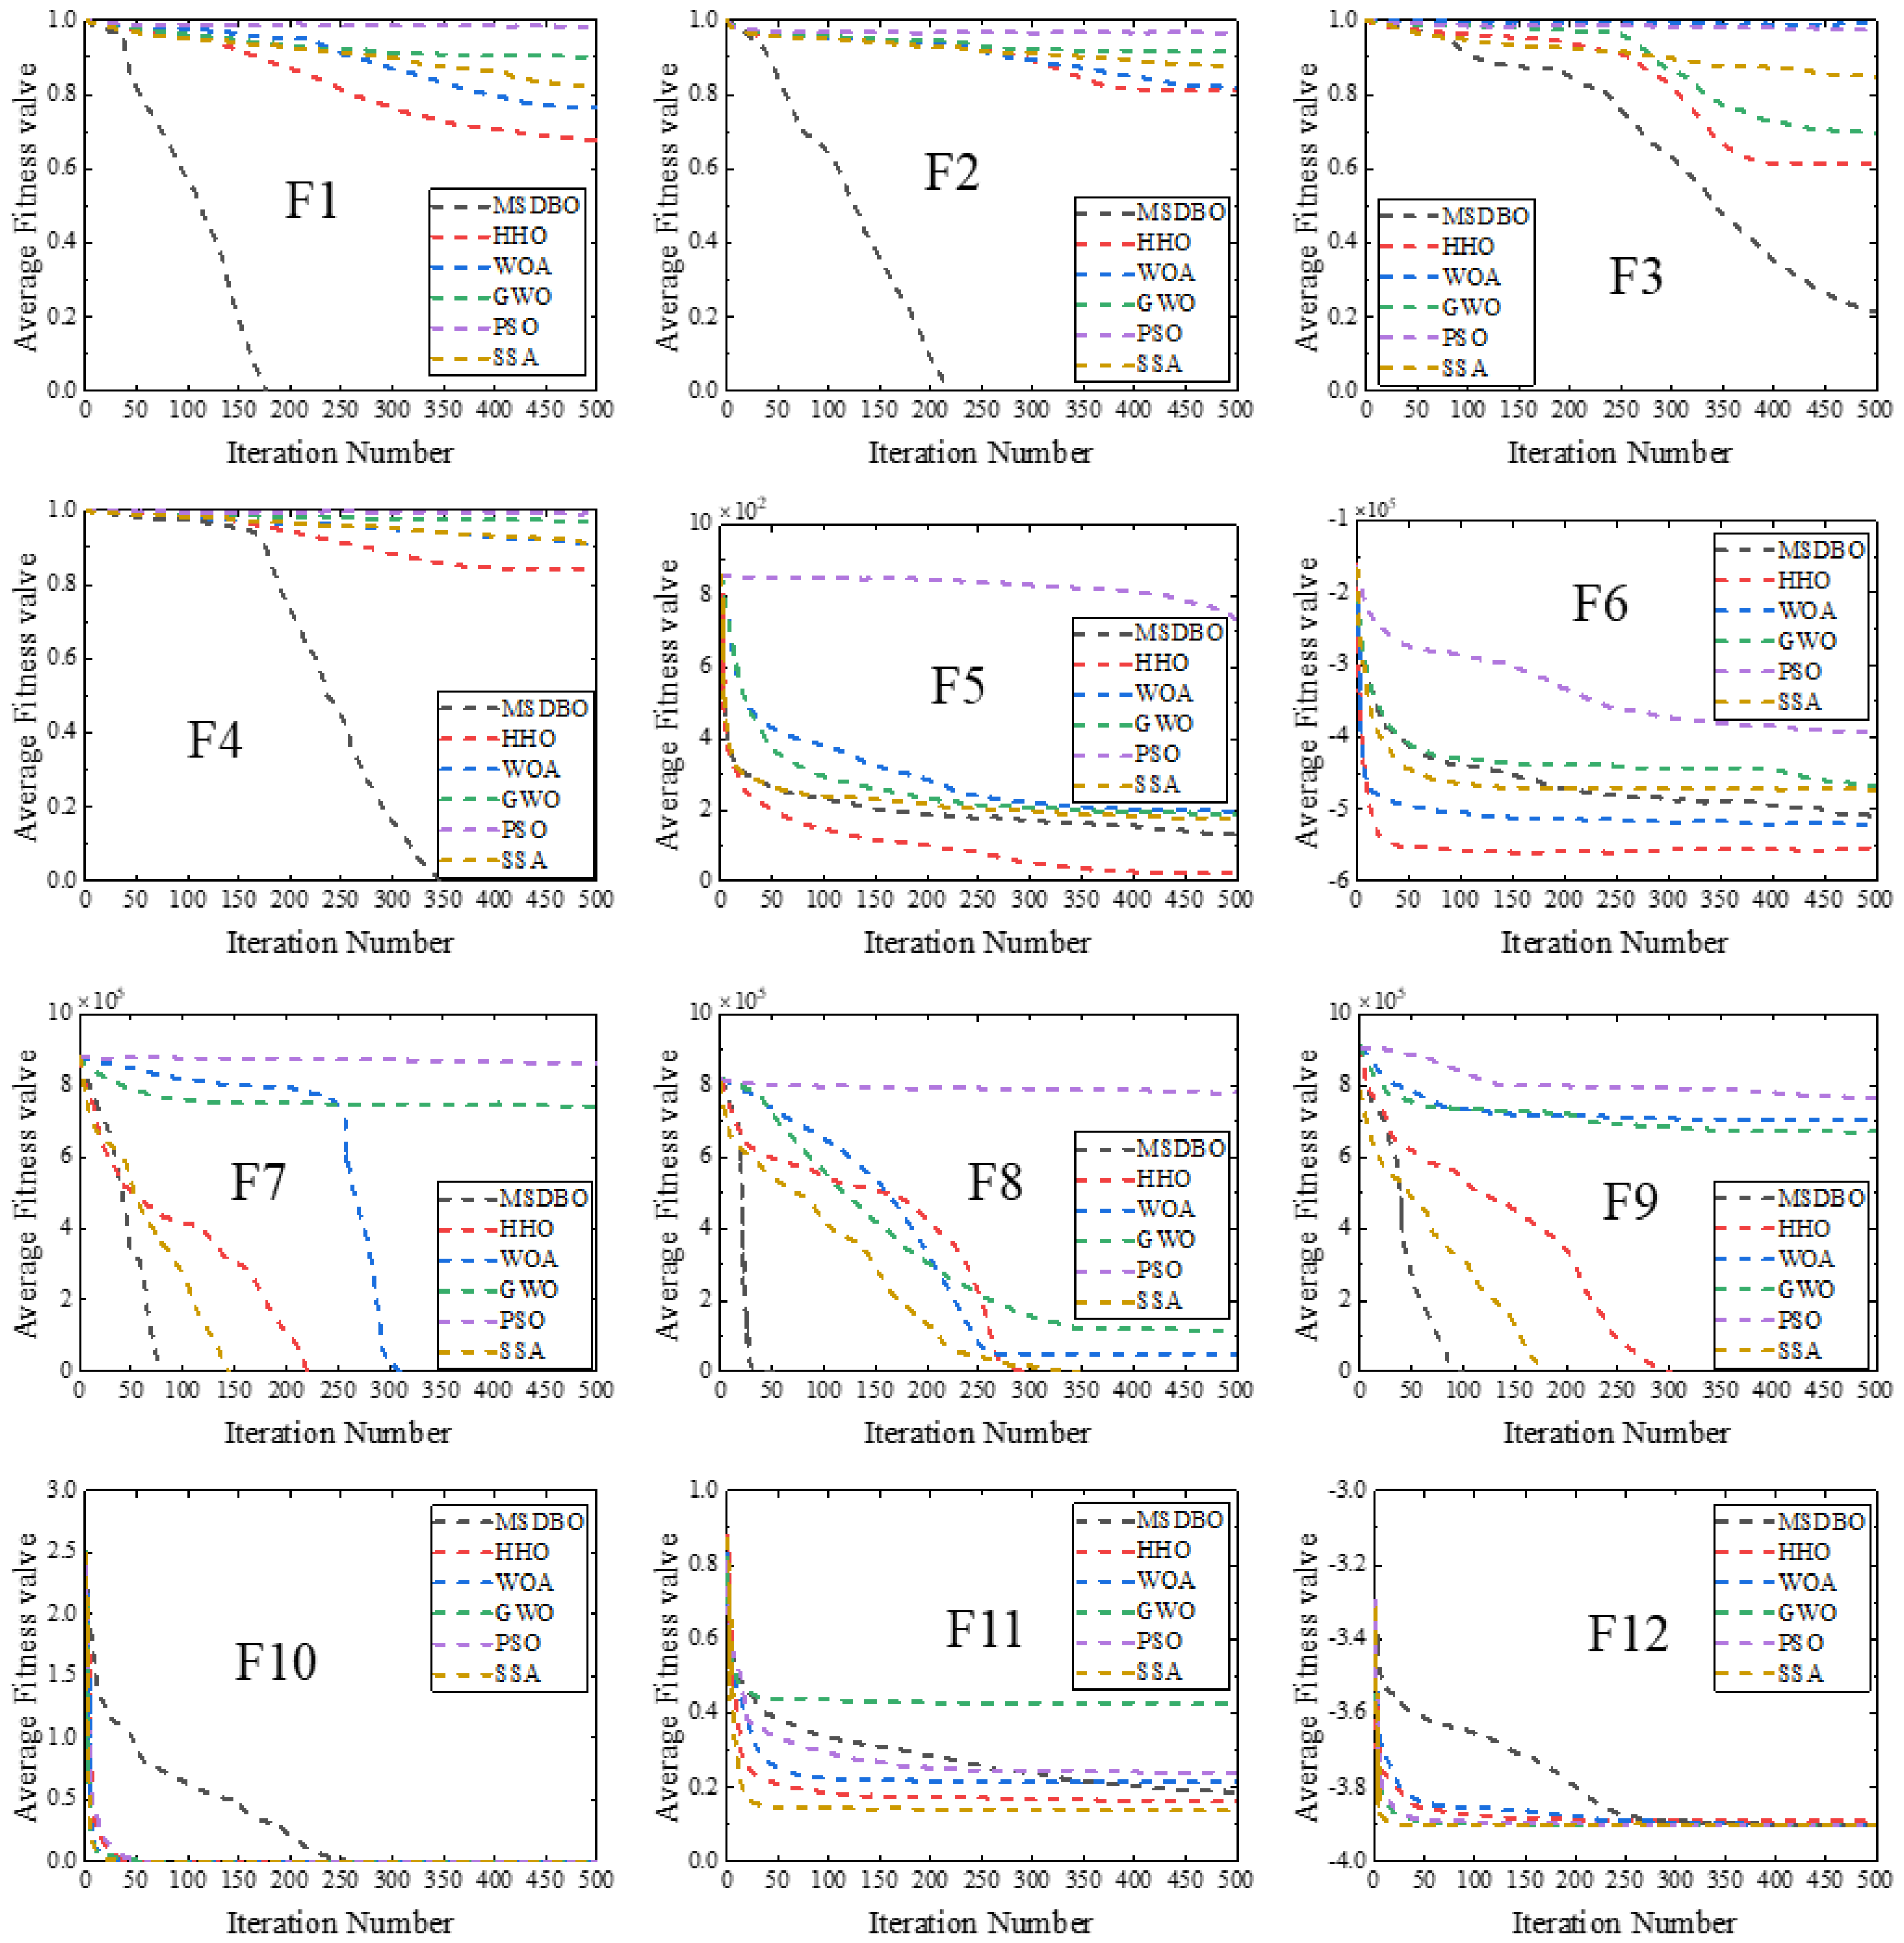
The convergence of the tested functions is assessed more intuitively through convergence curves illustrated in Figure 5 based on iteration numbers and fitness values. The curves demonstrate that MSDBO generally exhibits faster convergence than algorithms like GWO, SSA, WOA, PSO, and HHO according to iteration numbers. MSDBO shows particular convergence speed and accuracy superiority for functions F1 through F4, ranking second only to the top-performing HHO on F5. On F6, MSDBO surpasses GWO, SSA, and PSO in convergence speed and accuracy. Additionally, MSDBO significantly outperforms other algorithms in convergence speed for high-dimensional multi-peak problems F7 through F9. Finally, while MSDBO convergence decreases versus others on low-dimensional multi-peak F10 through F12, it still ensures accuracy. Collectively, these results indicate that the proposed MSDBO algorithm possesses strong global search capabilities and the ability to avoid local optima.
While the proposed MSDBO algorithm demonstrates better results on benchmarks and average convergence, further statistical analysis is needed to comprehensively assess optimization performance. A Wilcoxon signed-rank test, a non-parametric method, compares the medians of related samples. This test does not assume data distribution and suits non-normal or outlier cases. Rejecting the null hypothesis requires the Wilcoxon statistic below the critical value or a p-value below typical significance levels (0.05), indicating significantly different medians. Table 4 shows individual MSDBO comparisons to other algorithms using “N/A” for indistinguishable performance. Most p-values are below 0.05, signifying that MSDBO’s search performance differs significantly from others except for comparable results with HHO and SSA on F8. Similarly, MSDBO shows no significant difference versus HHO and SSA on F6 and F9, indicating equivalent search ability in those cases.

3.2. Engineering Experiment

3.2.1. Theoretical Modeling of Axial Piston Pump

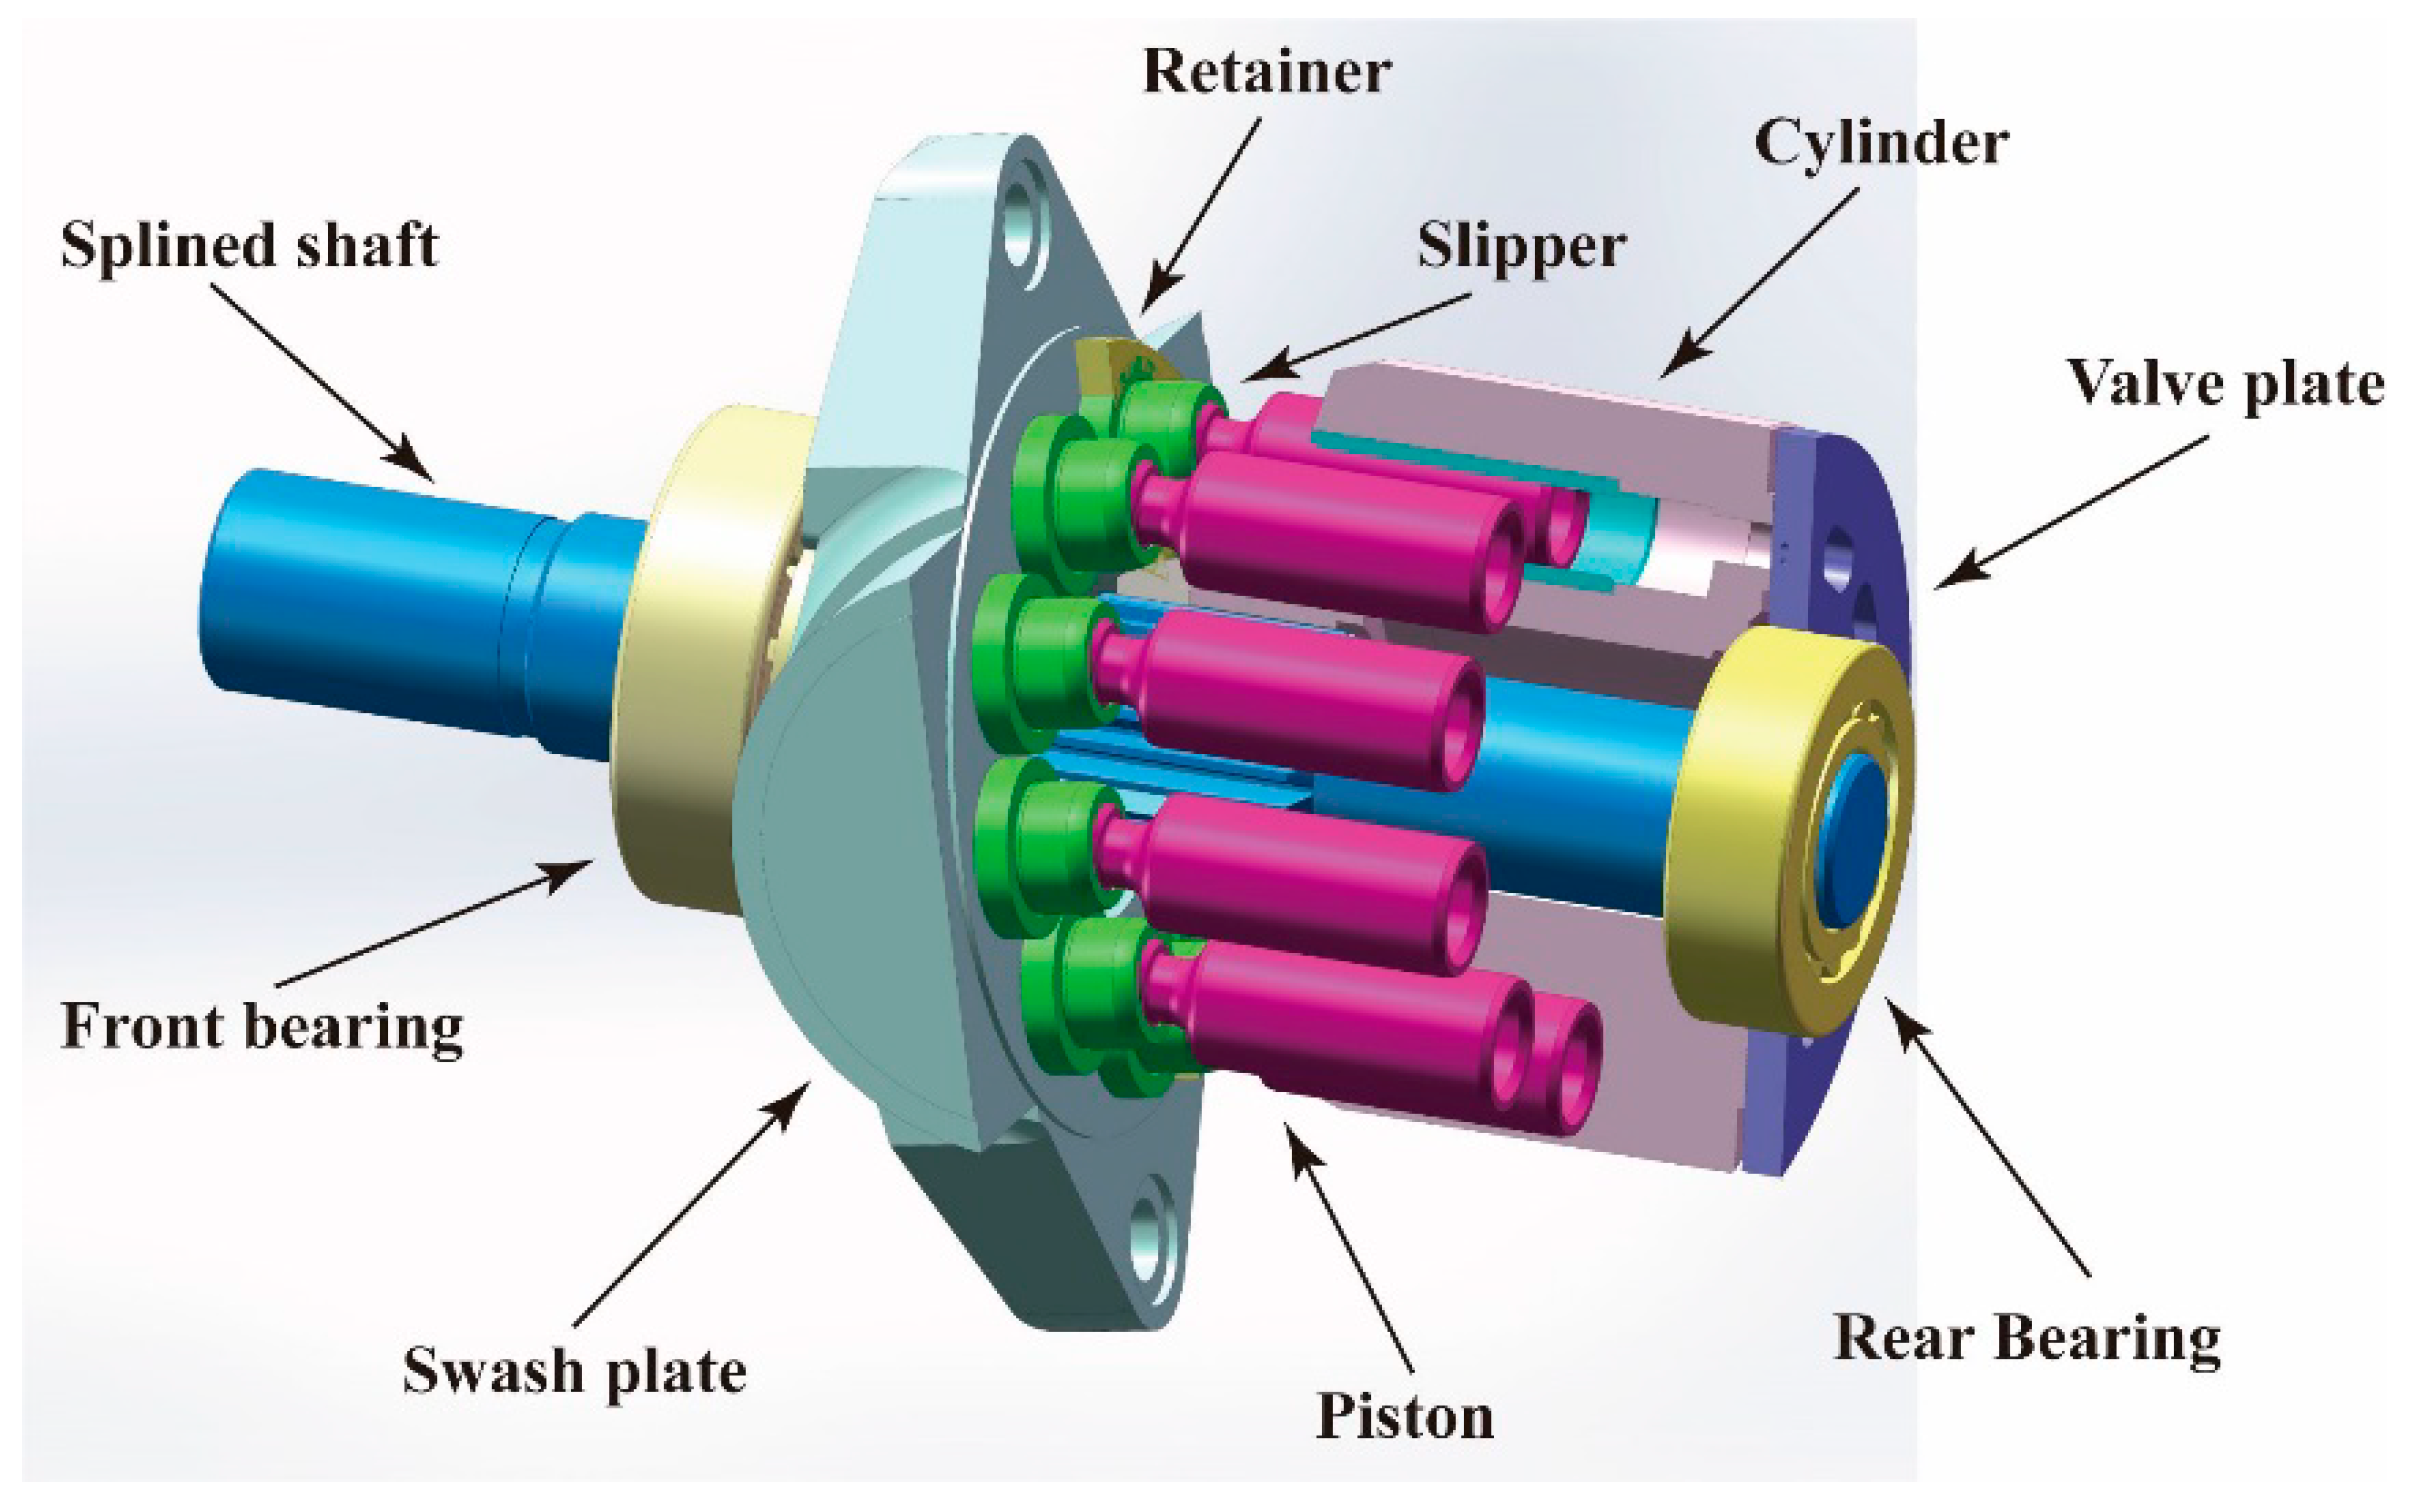
Axial piston pumps are widely used in industries like manufacturing, aerospace, and mobility due to their ability to provide high power density and easy flow control [49]. To ensure high reliability and longevity, manufacturers must deeply understand axial piston pump internal structures and operating principles. A typical design contains a rotating group including a splined shaft, cylinder, nine piston-slipper assemblies, and retainer, as depicted in Figure 6. A compression spring in the central bore pushes the cylinder against a fixed valve plate attached to the pump casing. Concurrently, slippers contact an inclined swash plate pad. The splined shaft rotates the cylinder, reciprocating each piston in its chamber. This reciprocation alternately suctions oil from the low-pressure side and discharges it to the high-pressure side through the valve plate ports. In addition to rotation, the cylinder performs a tilting motion for solid contact with the valve plate [50]. This tilting motion of the cylinder body is influenced by factors such as periodic eccentric load, multi-degree of freedom, spline transmission clearance, and shaft bending. As a result, the cylinder body and the valve plate maintain a secure contact [51]. In addition to the previously discussed components, axial piston pumps may incorporate additional features, including a pressure relief valve, a case drain line, and a charge pump. The pressure relief valve regulates the pump’s pressure, preventing system damage and ensuring consistent performance. The case drain line removes any excess fluid that may accumulate in the pump case, while the charge pump supplies oil to the pump during start-up.
A.
Kinematic model
The motion of the piston in an axial piston pump is influenced by the shaft rotation and the swashplate angle, resulting in a sinusoidal, harmonic, or oscillatory displacement along the cylinder axis. The piston’s velocity and acceleration are determined by the angular velocity and displacement of the shaft, along with the inclination of the swashplate. As the piston moves, it generates a periodic variation in the cylinder volume, leading to fluid flow through the valve plate ports.
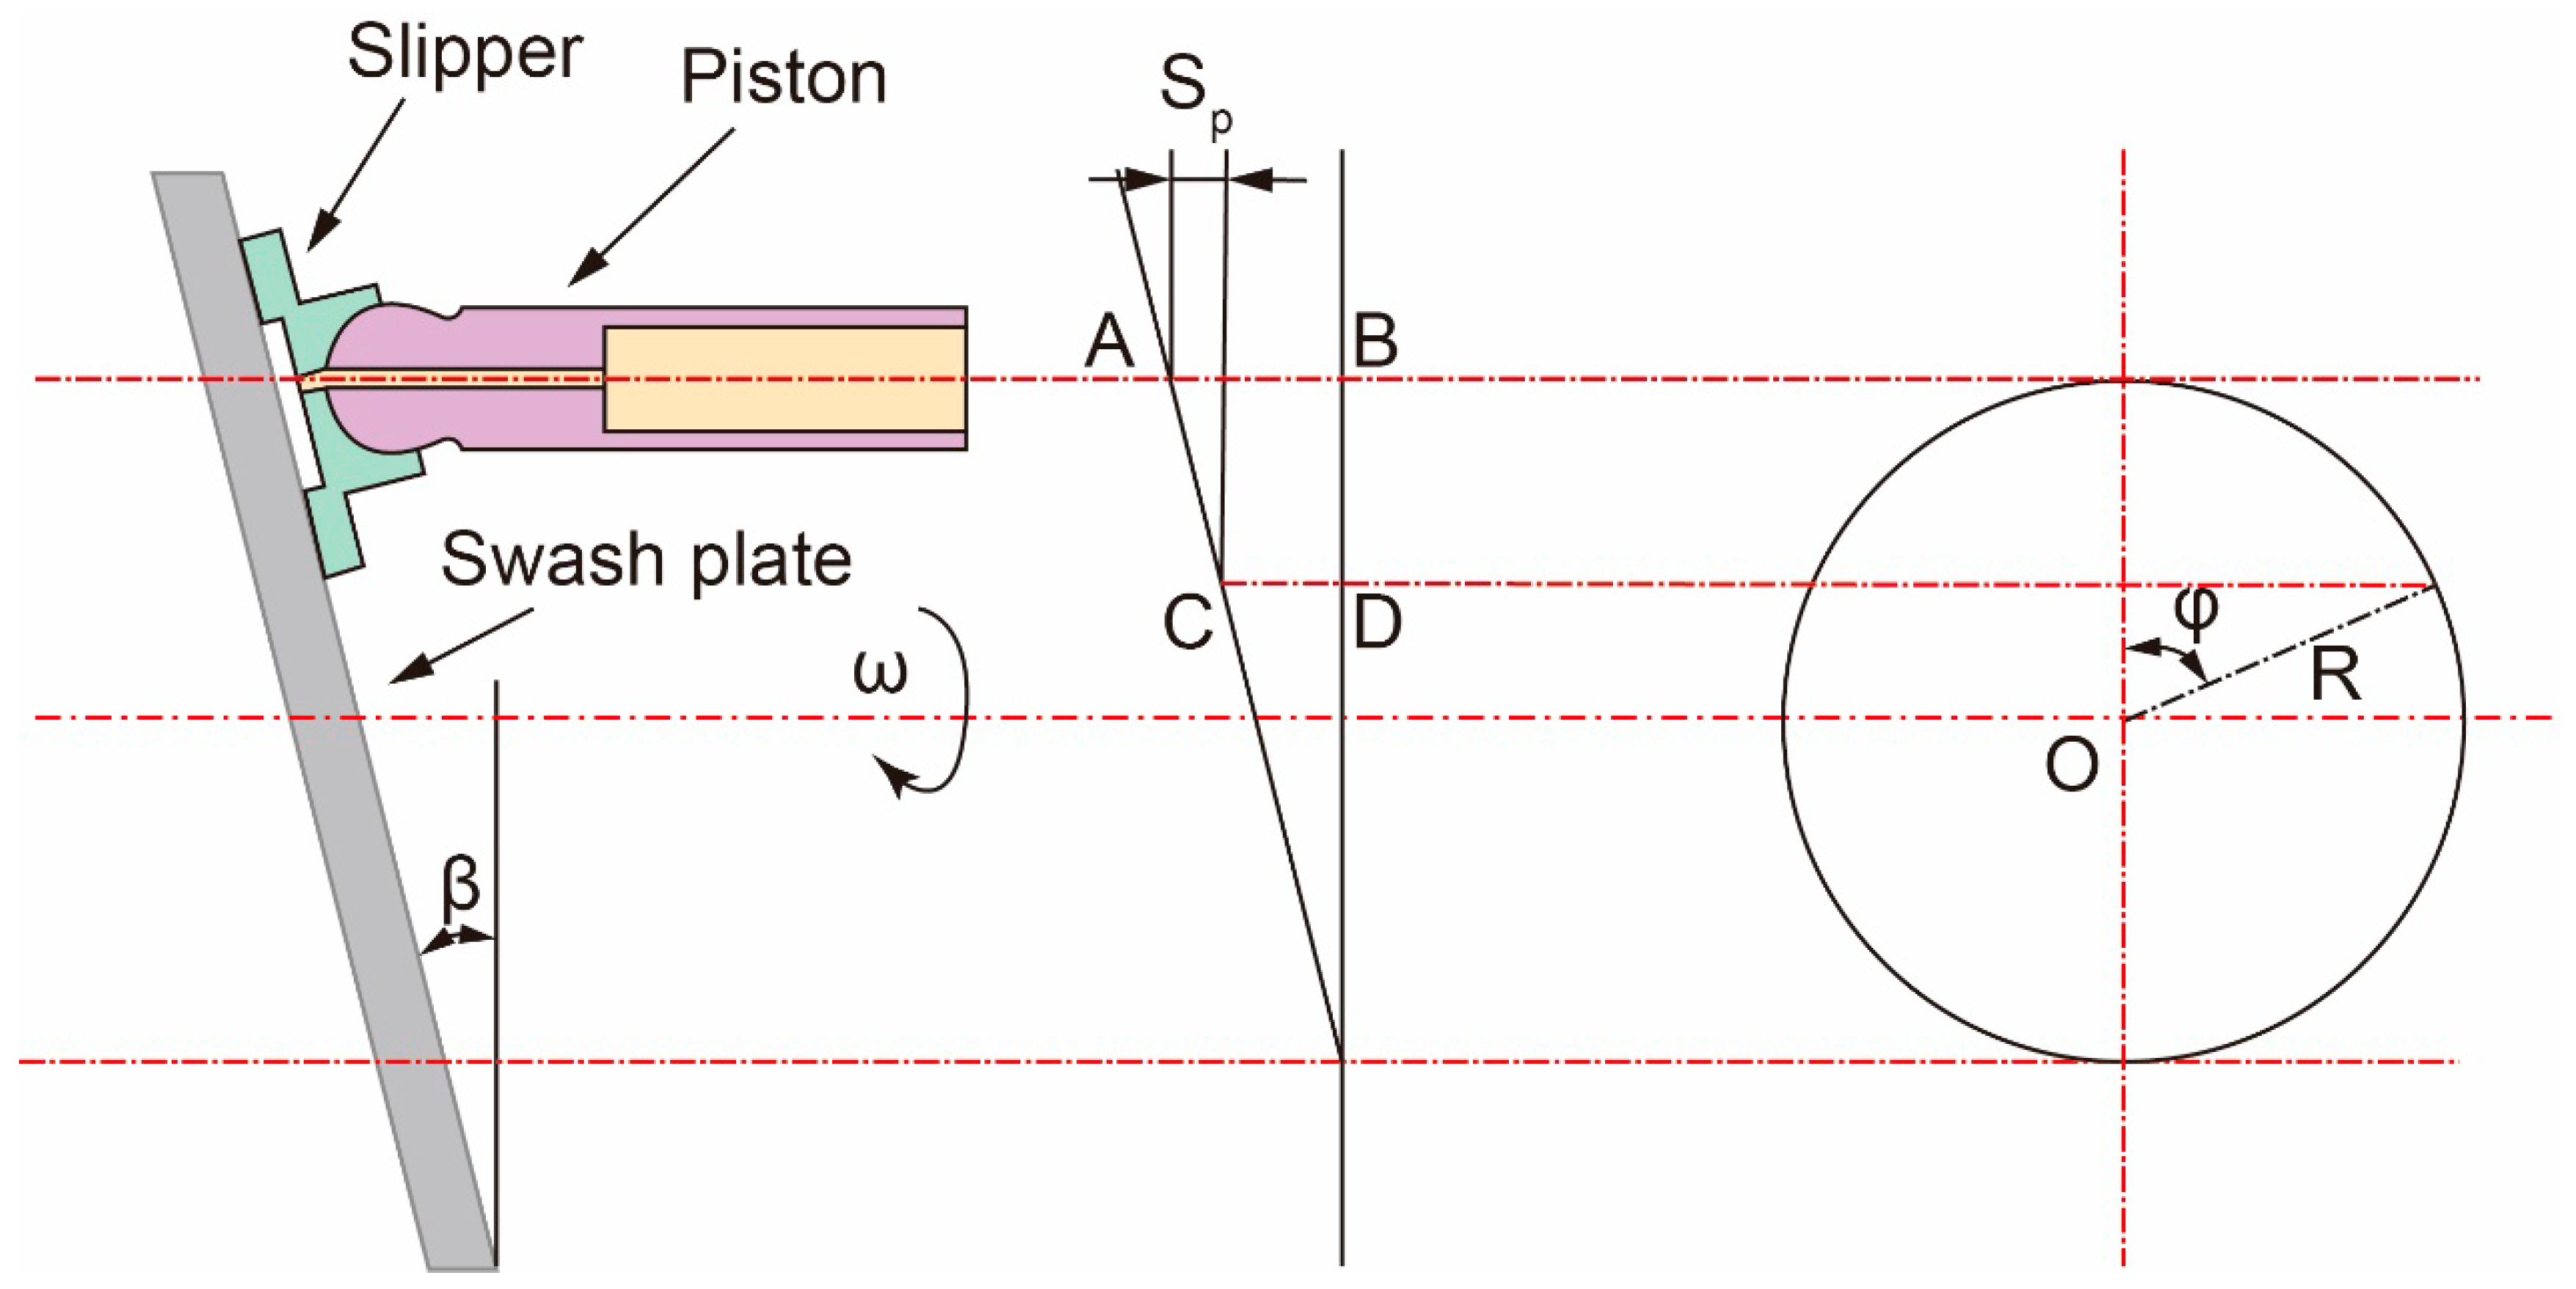
As shown in Figure 7, the displacement along the axial direction can be expressed as follows when the piston moves from point A to point C:
Preprints 98319 i041
where R is radius of pitch circle, β is the swashplate angle, φ is the rotational angle of cylinder block.
The velocity of the piston is obtained by differentiating the displacement of the piston with respect to time:
Preprints 98319 i042
The piston’s position affects the volume within its chamber, expressed as:
Preprints 98319 i043
where V0 is the fluid volume of the piston chamber in the inner dead center (IDC), dp is the piston diameter.
B.
Leakage flow
The major components of leakage in a piston pump encompass internal leakage, external leakage, and flow loss resulting from fluid compression. Among these, external leakage constitutes the largest portion. External leakage comprises piston-slipper leakage, shoe-slipper leakage, and valve plate leakage, all of which are primarily influenced by the oil film thickness between the moving pairs. Additionally, the Reynolds numbers associated with the three leakage gap flows are small, enabling the calculation of friction pair leakage in the piston pump based on laminar flow theory.
(1)
Piston/cylinder pair
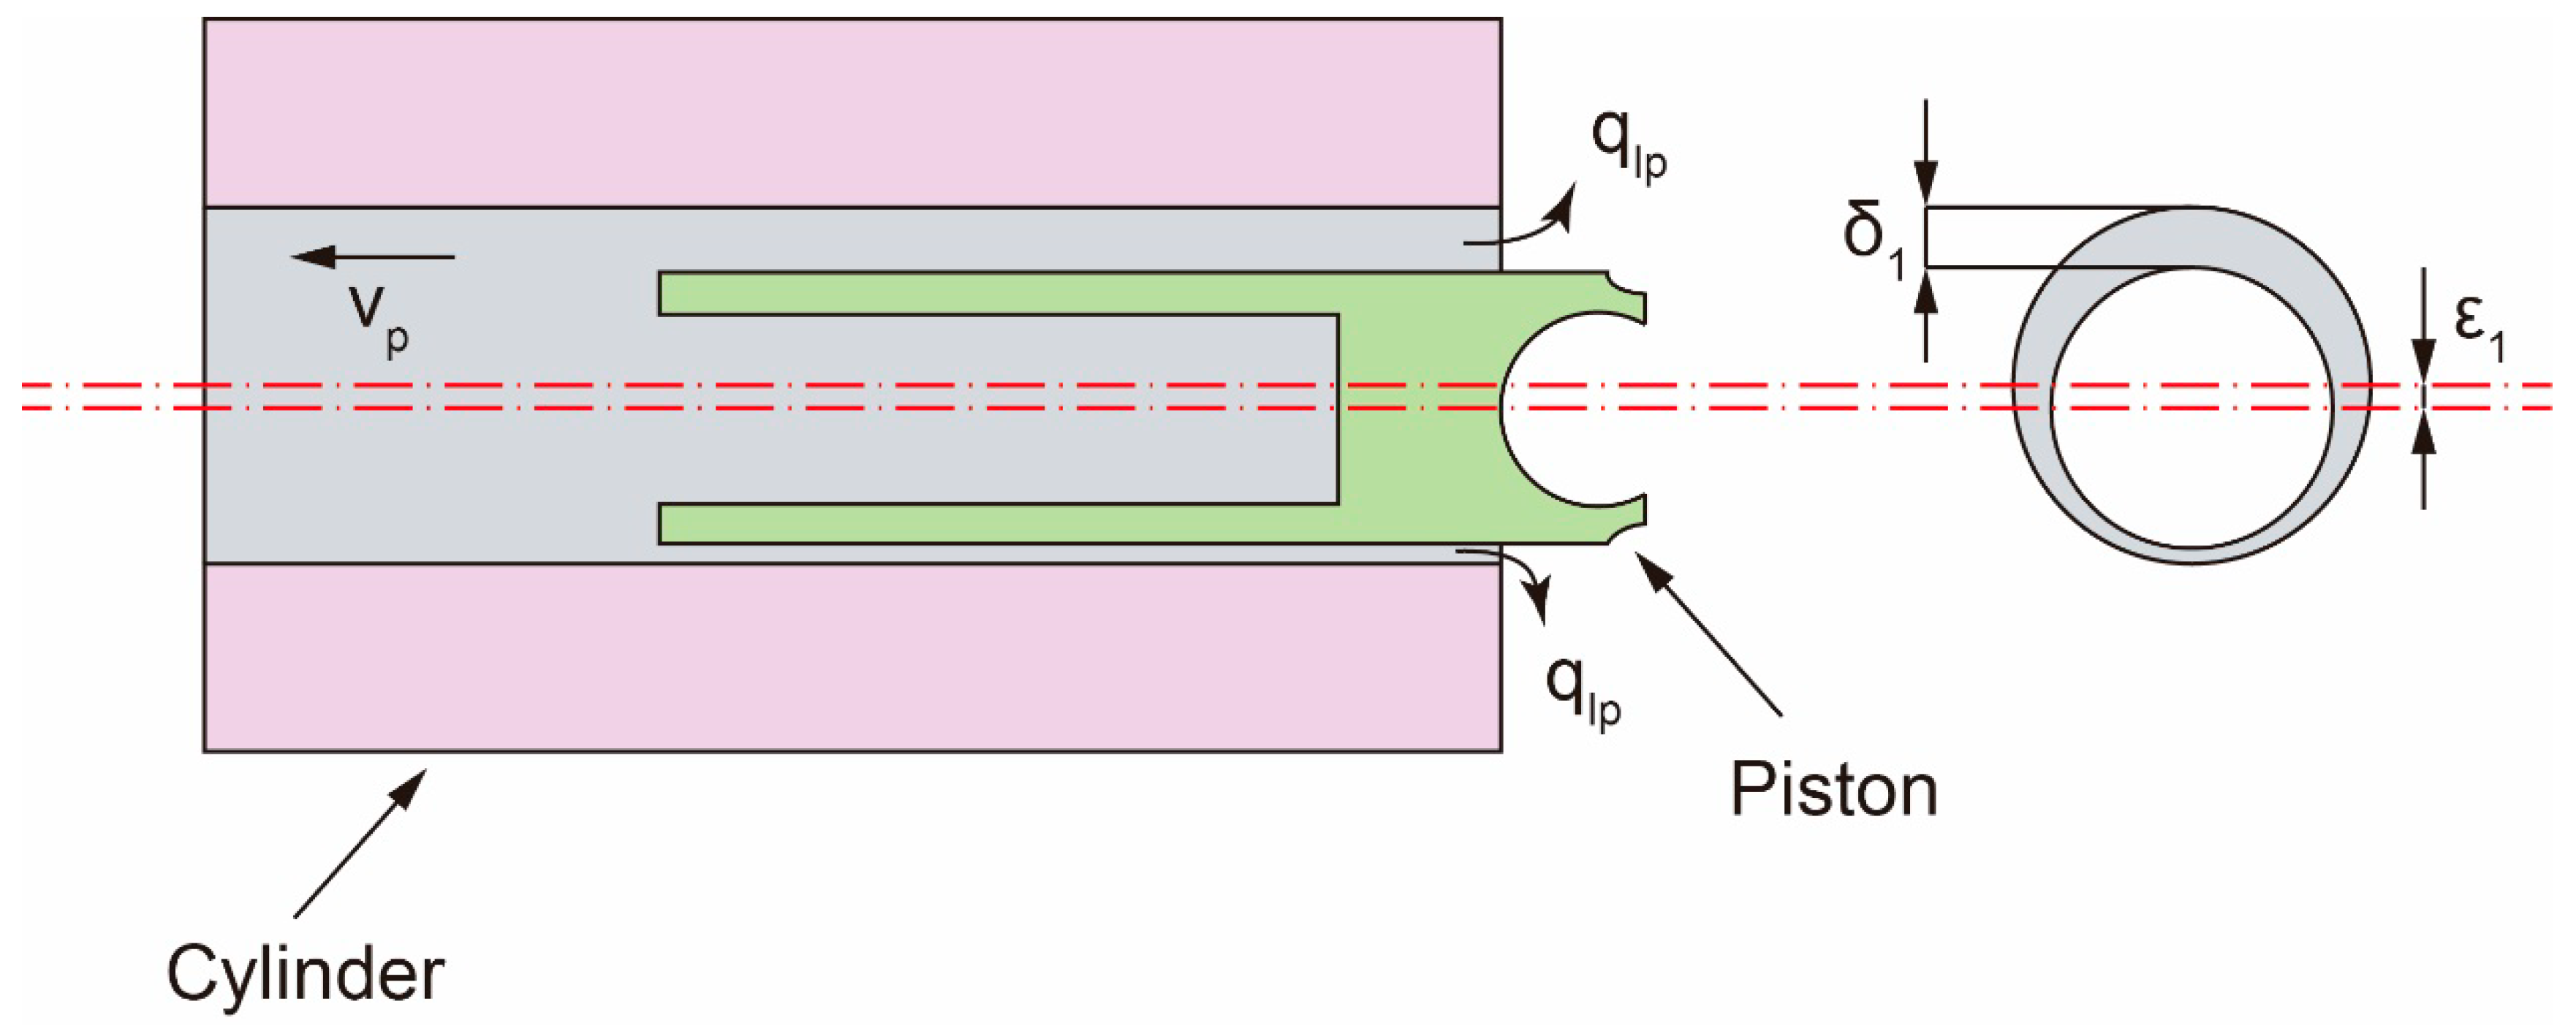
As shown in Figure 8, throughout the operational cycle of the axial piston pump, the piston experiences a centrifugal force, resulting in the formation of an eccentric annular gap with the center of the cylinder bore. This pressure difference gives rise to Poiseuille flow within the gap. Simultaneously, the axial displacement of the piston within the cylinder bore induces Couette flow in the opposite direction to the Poiseuille flow. As a result of the combined effect of these flows, the leakage of the piston pair can be mathematically expressed as follows:
Preprints 98319 i044
where d is the piston diameter; δ1 is the oil film thickness of the piston/cylinder pair; μ is the dynamic viscosity of the hydraulic oil; L is the contact length of the piston and the cylinder; e is the eccentricity of the piston; p0 is the tank pressure.
(2)
Piston/slipper pair
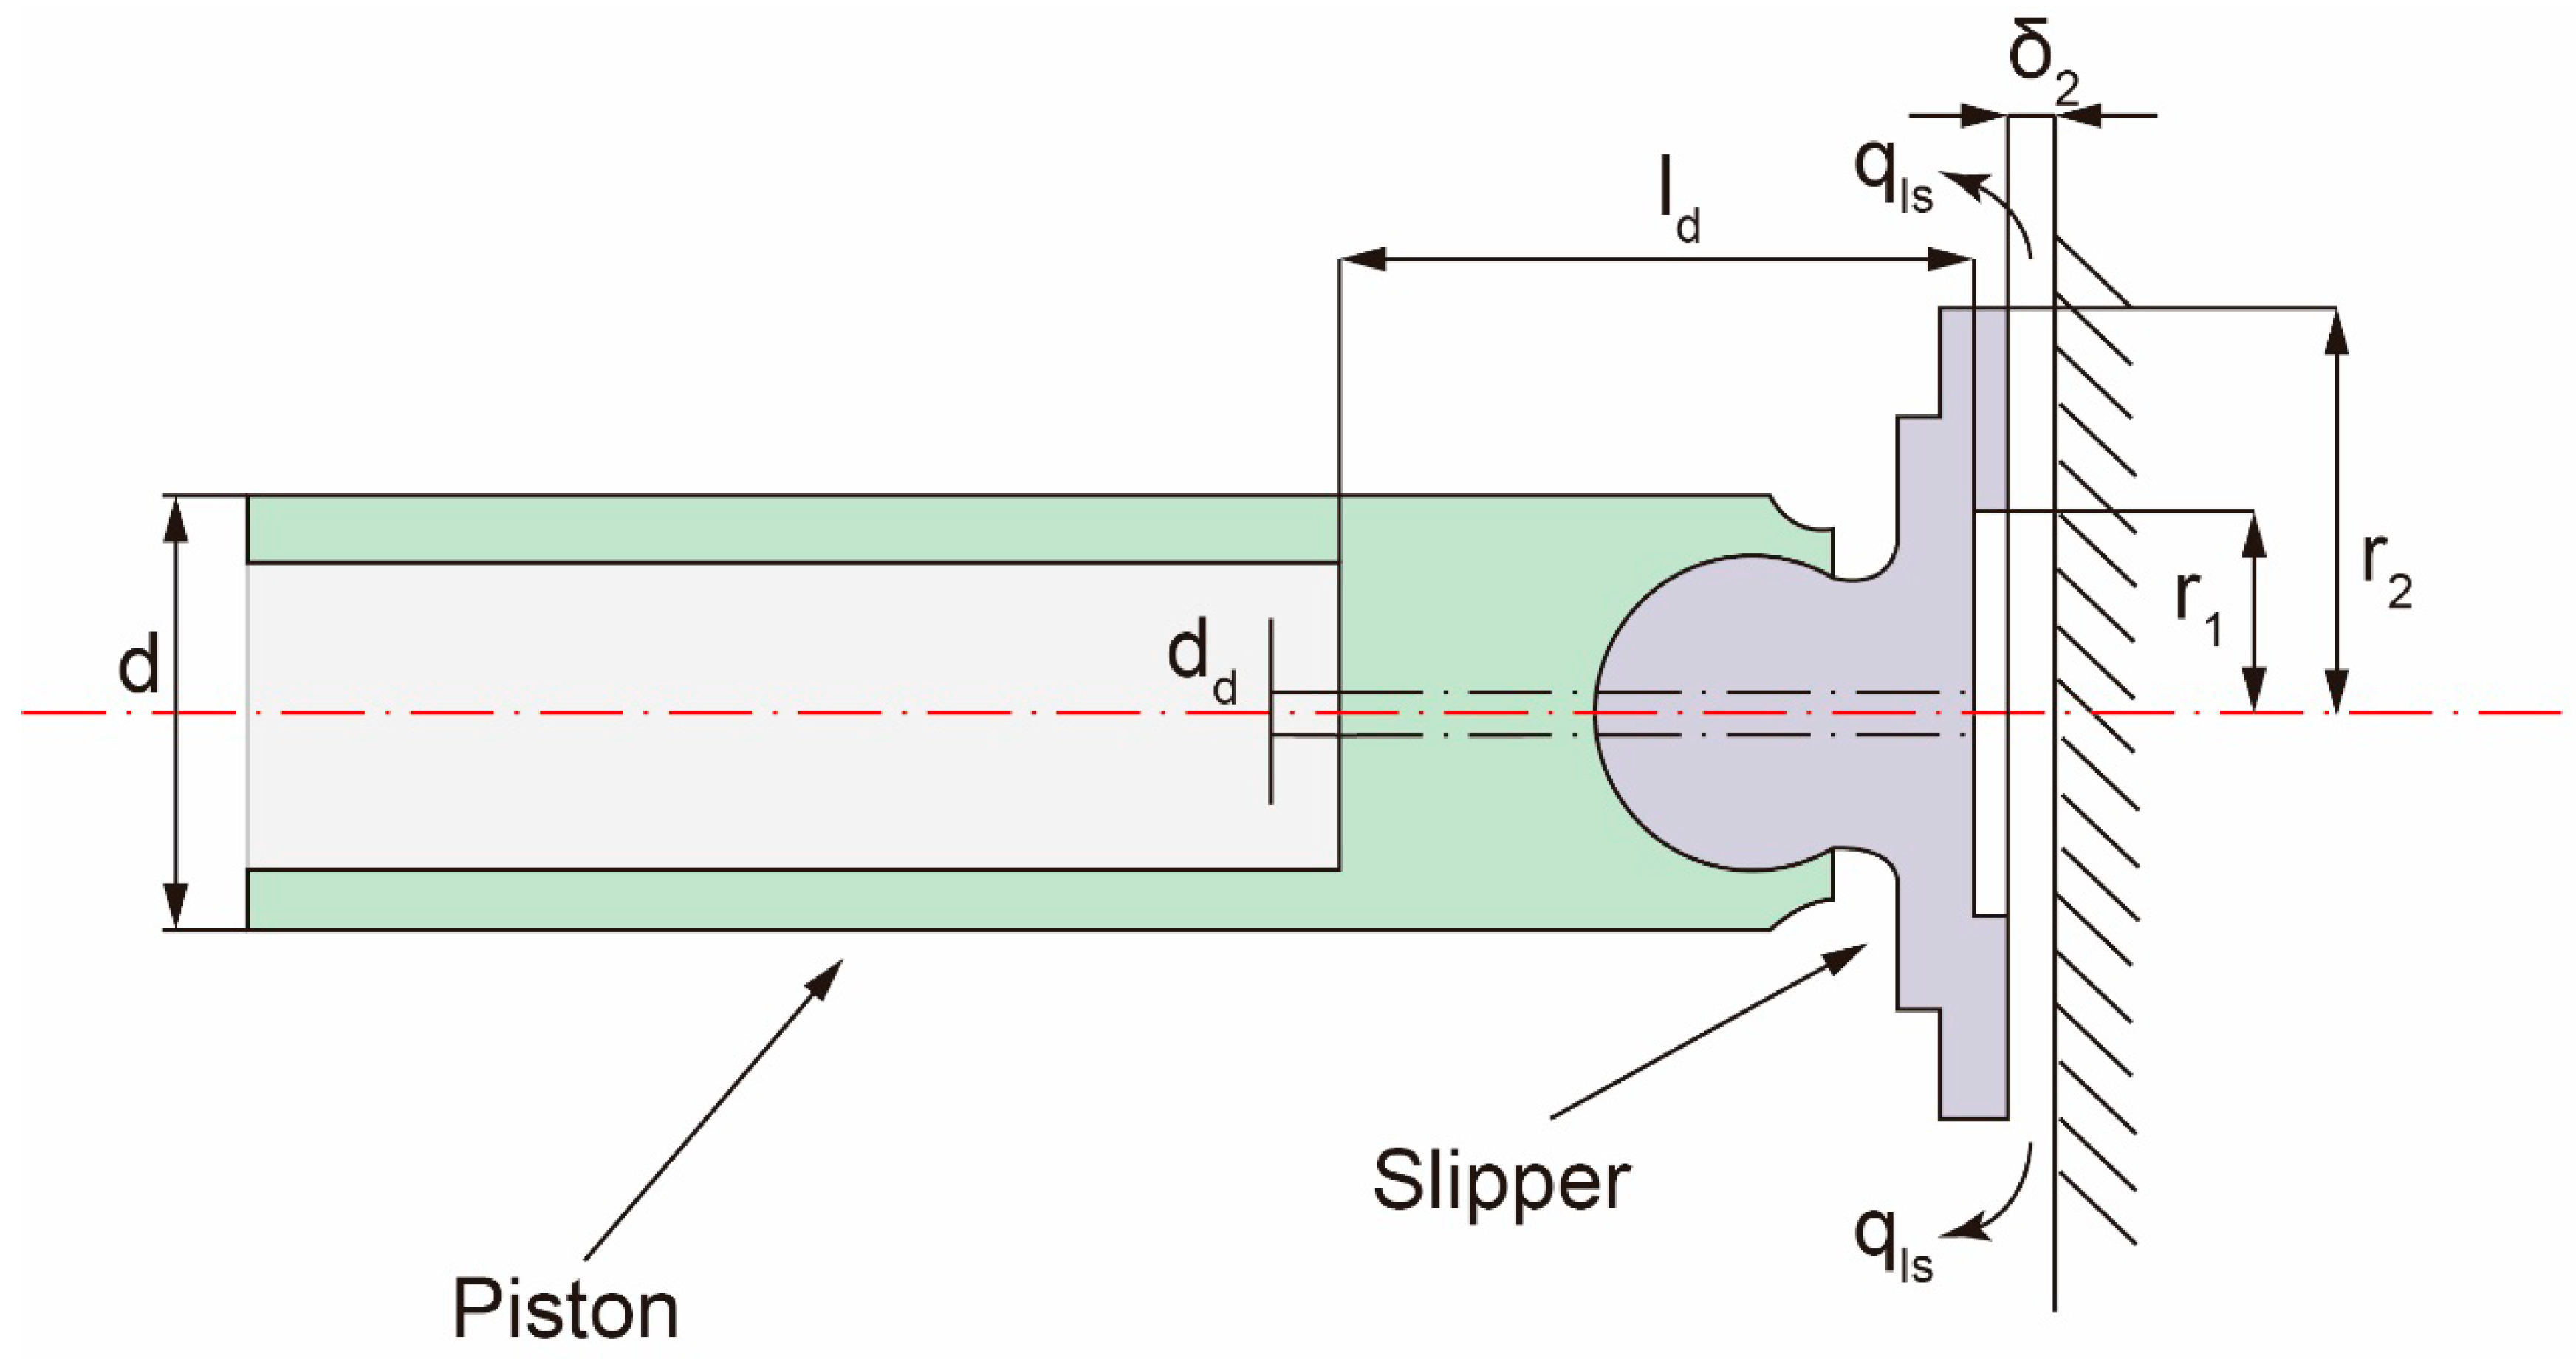
The amount of fluid that escapes from the gap between the slipper and the swash plate, as depicted in Figure 9, constitutes the leakage of the piston/slipper pairs. This leakage is a significant contributor to power loss in an axial piston pump, which can be represented as follows:
Preprints 98319 i045
where h is the thickness of the oil film of the piston/slipper pair; r1 is the inner radius of the slipper sealing ring; r0 is the outer radius of the slipper sealing ring; ld is the length of the piston chamber.
(3)
Cylinder/Valve Plate Pairs
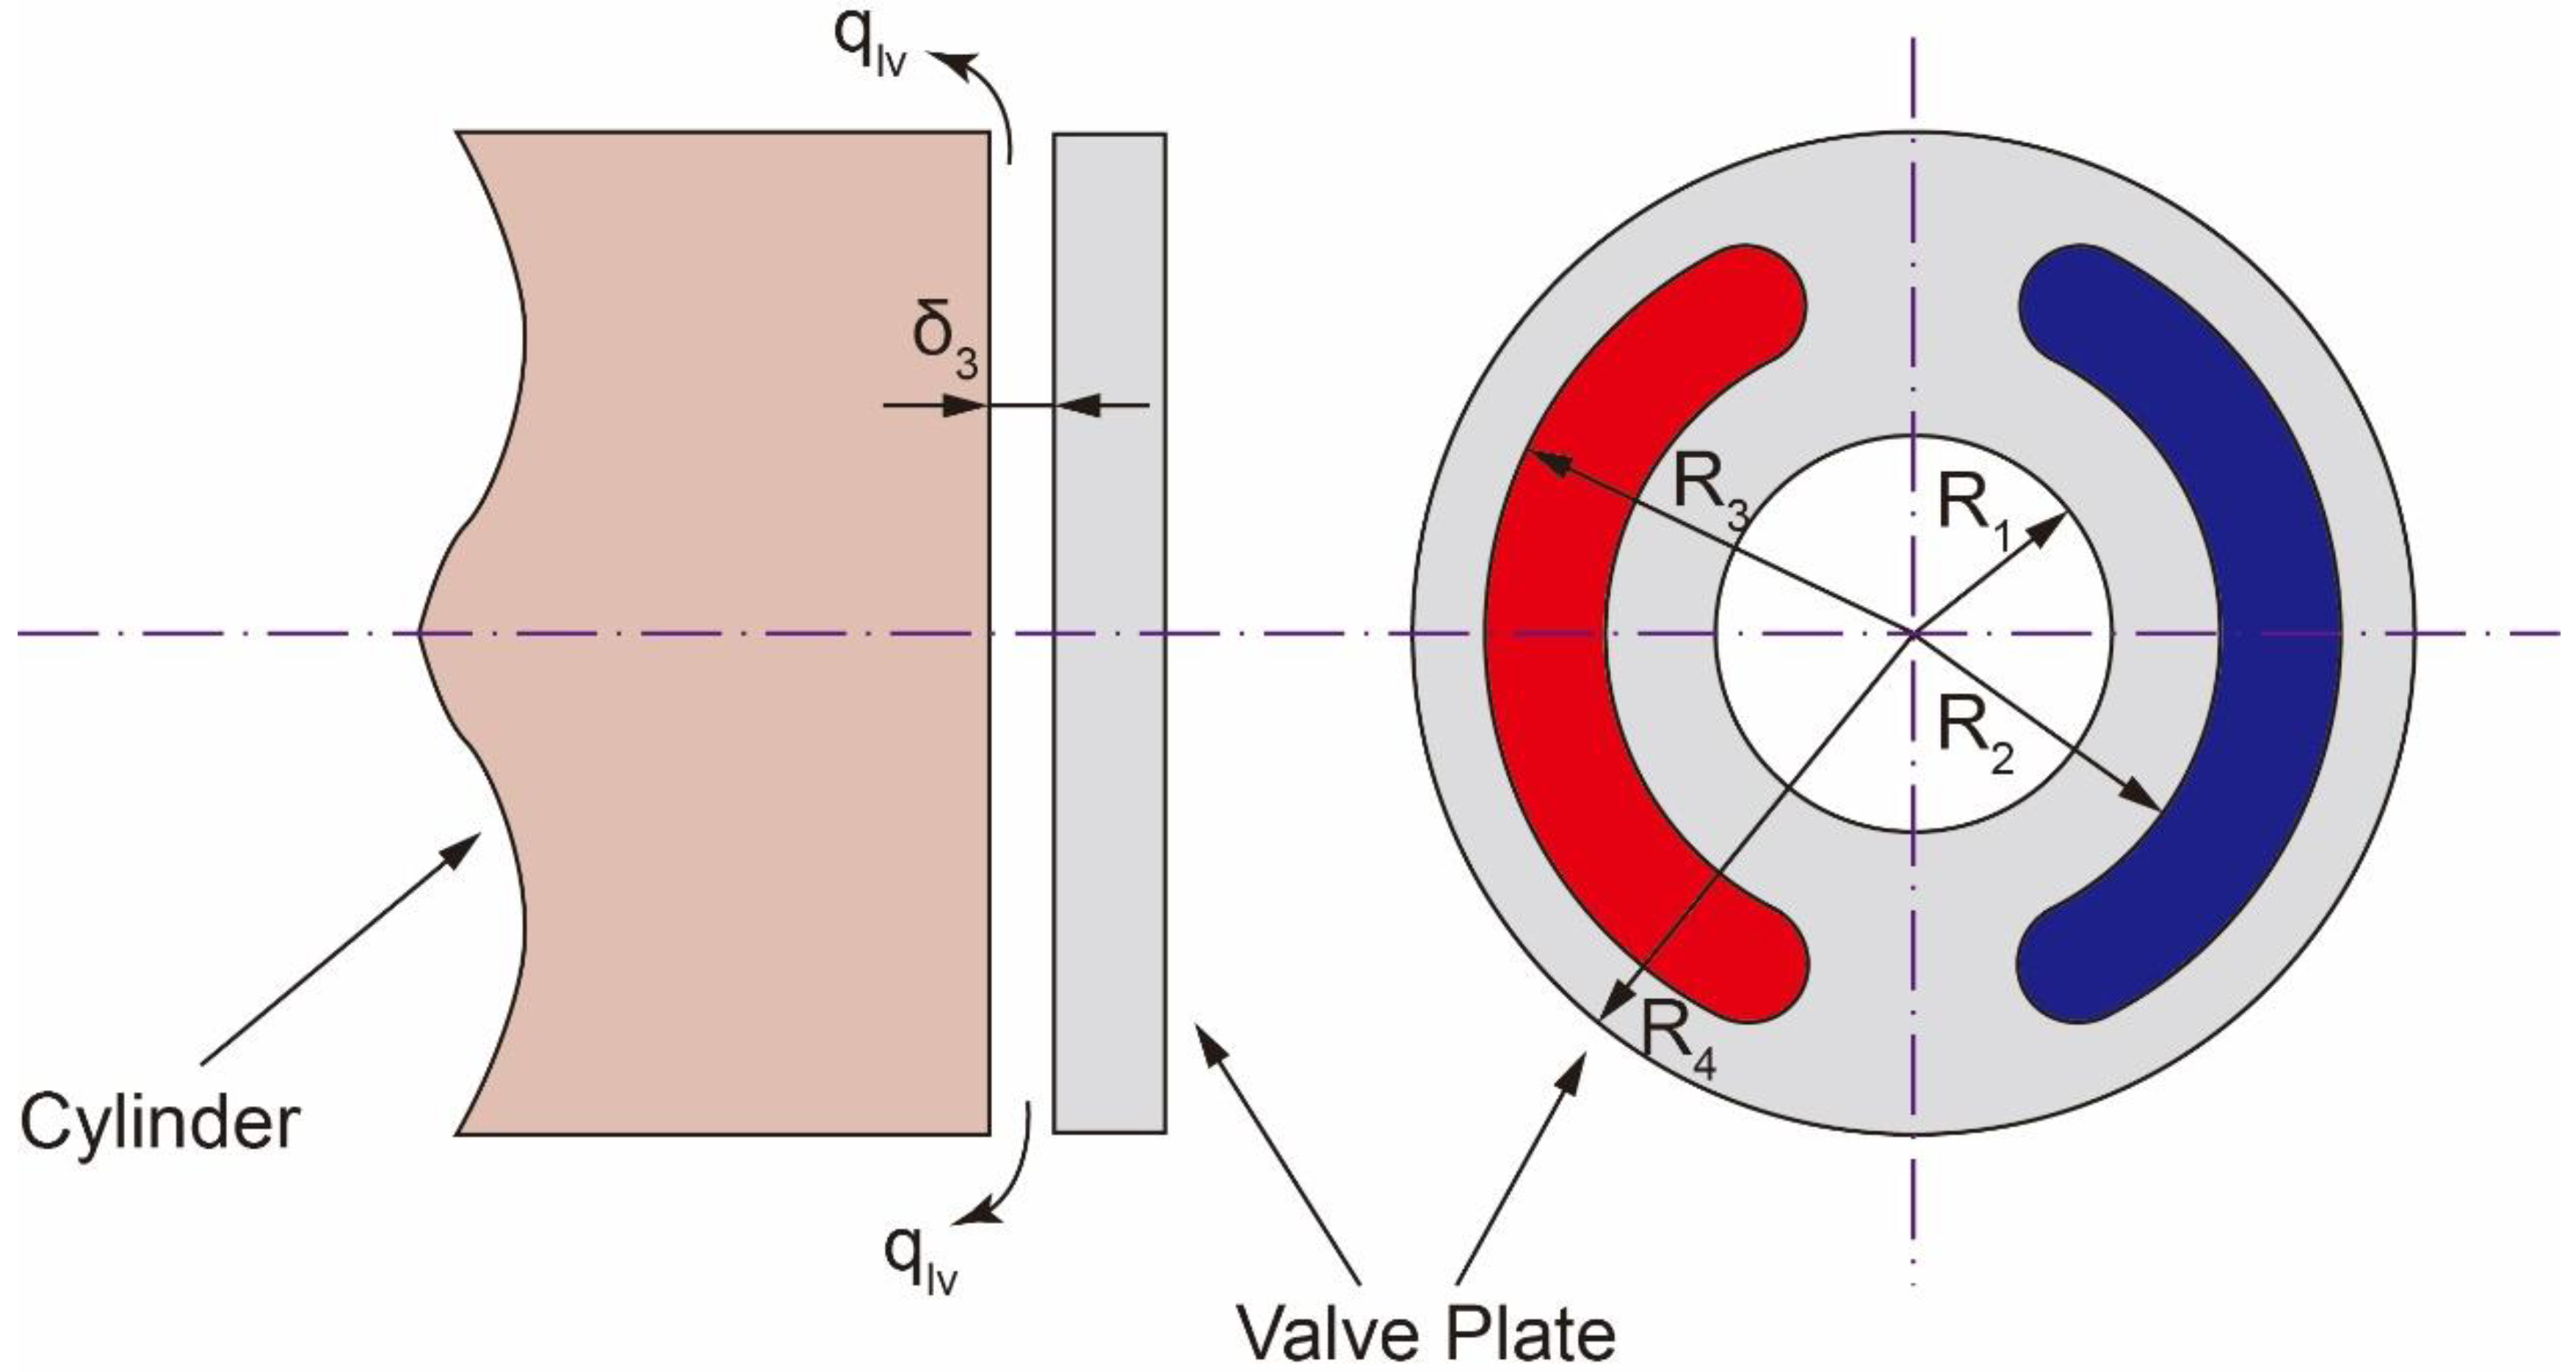
The leakage of the cylinder/valve plate pairs is caused by the hydrostatic support of the oil during the flowing process. As shown in Figure 10, based on the laminar flow theory of parallel circular disk gaps, the leakage is calculated as follows:
Preprints 98319 i046
where α is the length angle of the kidney port; δ3 is the thickness of the oil film between cylinder and valve plate; R1, R2, R3 and R4 are the radius of the valve plate, respectively.
C.
Valve plate
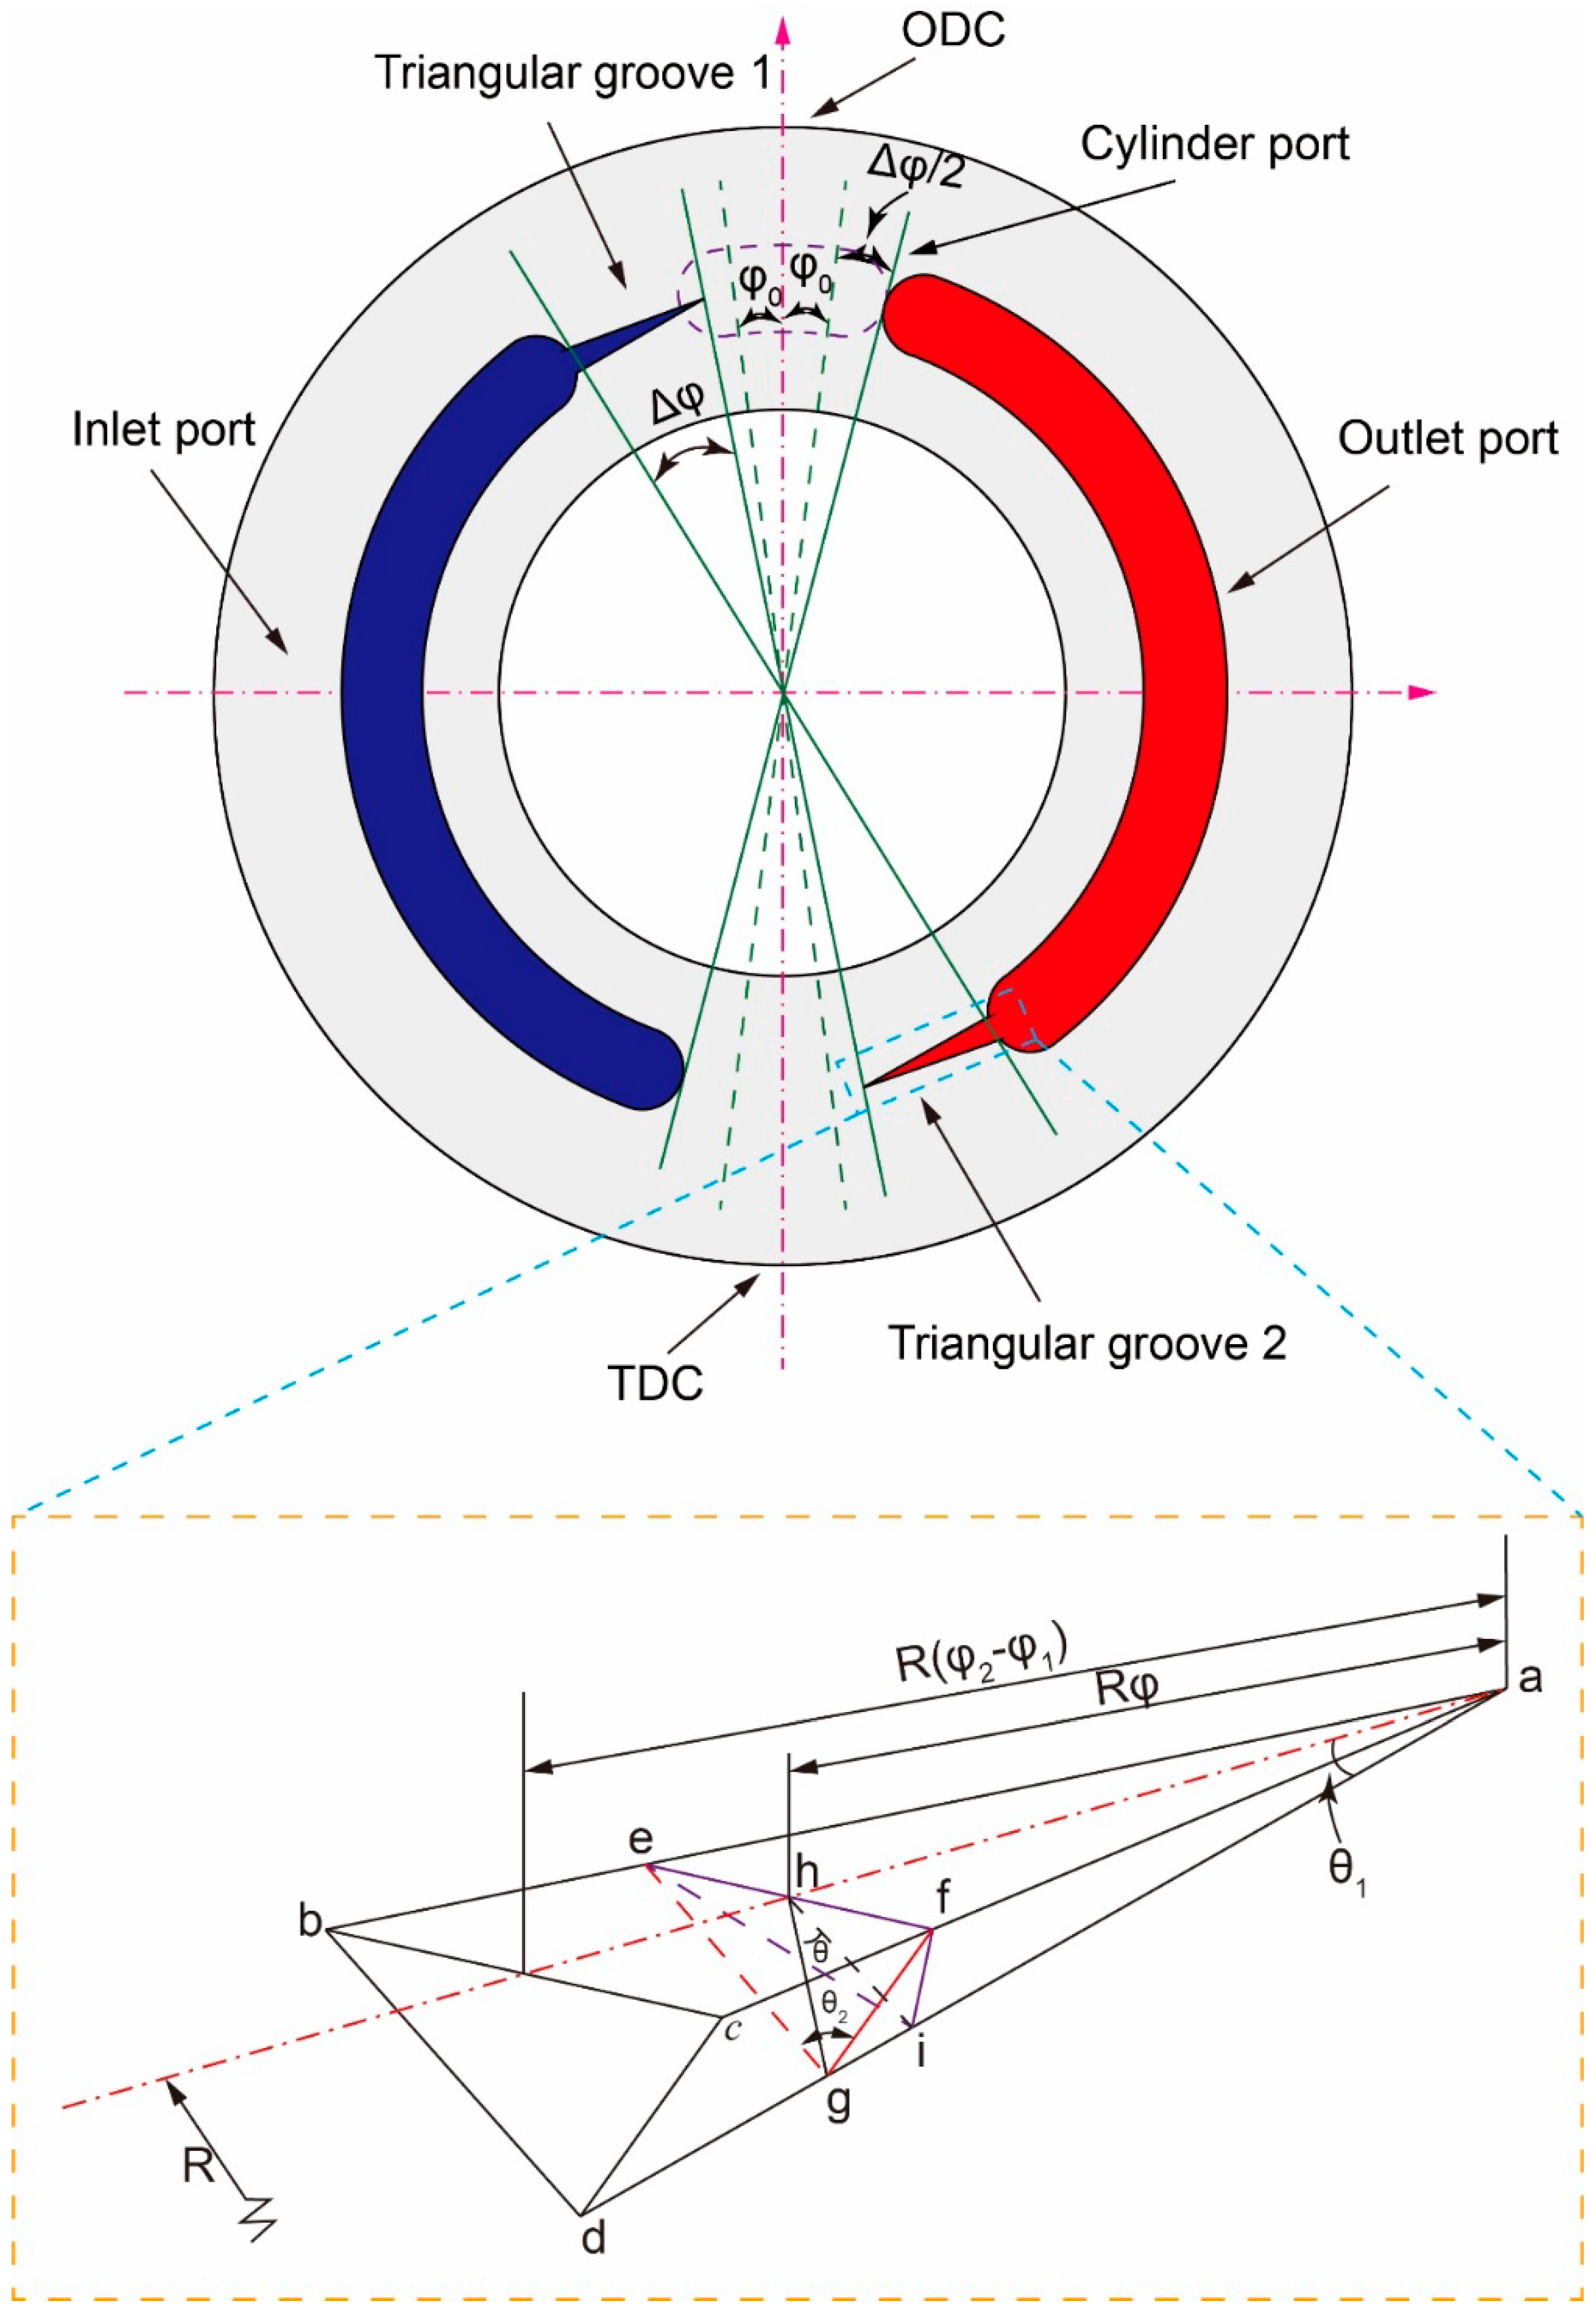
In a swashplate axial piston pump, the housing holds the swashplate in a fixed position, while the valve plate remains attached to the housing. The pistons, however, are pressed against the swashplate by the retainer. As the shaft rotates the cylinder block, each piston chamber establishes a connection with the suction port and the discharge port through the valve plate. This connection determines how long each piston chamber communicates with the inlet and outlet ports, based on its unique structure. The size of the kidney port on the valve plate is typically kept smaller than the cylinder block port to ensure maximum oil sucked and discharge from the piston chamber. Precise design of the sizes of the inlet and outlet kidney ports, as well as the cylinder block port, is crucial to ensure that the cylinder block port exclusively communicates with either the inlet or the outlet at any given time. Figure 11 demonstrates the addition of pressure relief grooves at the beginning and end of the kidney-shaped holes, which facilitate smooth flow transitions when entering or leaving the piston chamber through the suction or discharge port. By adjusting the position and size of the pressure relief groove, it is possible to significantly influence the suction and discharge flow, thereby reducing fluid fluctuations and minimizing vibration noise. These optimizations of the valve plate align with our primary objectives.
The dynamics of the pump are indeed influenced by the valve plate, as it plays a crucial role in determining the communication area between the piston chamber and the inlet and outlet ports. The positional relationship between the piston chamber and the kidney port is key in establishing this communication area when the piston chamber connects to the triangular groove. In previous studies, this area can be calculated as follows [52]:
Preprints 98319 i047
where R is the radius of the cylinder port, θ1 and θ2 are the width angle and depth angle of the triangle groove, respectively.
D.
Piston chamber pressure
The piston chamber undergoes periodic changes in its enclosed volume. As the cylinder rotates, the piston reciprocates axially within the cylinder, causing compression or expansion of the oil volume within the piston chamber. Simultaneously, the piston chamber establishes a connection with the valve plate, allowing oil to flow in or out during the distribution process. By analyzing the pressure change characteristics within the piston chamber, the following information can be derived:
Preprints 98319 i048
where dp and dV is the increment of pressure and volume in the piston chamber, E is the volume modulus of the fluid.
Taking the process of oil suction from the piston chamber, leaving the IDC as an example, two parts can be identified in the volume change, namely dVf and dV2. dVf represents the volume from the discharge port to the piston chamber, dV2 refers to the volume obtained through mechanical compression. By considering these two components, the flow rate into the triangle groove can be calculated as follows:
Preprints 98319 i049
Preprints 98319 i050
where Cq is flow coefficient, Δp is the pressure difference between piston chamber and inlet or outlet port, ρ is the oil density.
In this study, the valve plate, as shown in Figure 11, is positioned at a cross angle Δφ between the axes of the Inlet Dead Center (IDC) and Outlet Dead Center (ODC). The angle formed by the adjacent ends of the inlet and outlet ports and the central angle of the plunger rotor window is defined as the close angle Δφ. The magnitude of the cross angle determines the initial placement of the cylinder when it enters the closed dead zone. As the cylinder port rotates, the piston chamber gradually enters the closed dead zone, leading to compression or expansion of the enclosed volume. The behavior of the piston chamber differs significantly when transitioning into the closed dead zone from the IDC and ODC. At the ODC, the piston chamber experiences closed dead compression, while at the IDC, it undergoes closed dead expansion. By employing Δφ - φ0/2, the initial contact position of the piston chamber and the closed dead zone can be expressed when considering the same close angle.
With the assumption that the closed dead zone initially holds a position of zero, the entry of the piston chamber into the closed dead zone occurs when it reaches the inter dead center. As the cylinder port rotates through an angle φ, the volume alteration of the piston chamber can be expressed as follows:
Preprints 98319 i051
The pressure characteristic relationship of the piston chamber can be derived by incorporating Eqs. (17)-(23) and Eqs. (25)-(27) into Eq. (24), as follows:
Preprints 98319 i052
The pressure change inside the piston chamber is strongly nonlinearly dependent on several parameters, as indicated by Eq. (28). These parameters include the size of the triangle grooves θ1 and θ2, the swash plate angle γ, the volume of the piston chamber Vf, the close angle φ0 and cross angle Δφ. In order to minimize the amplitude of pressure ripples in the piston chamber, leading to a reduction in both flow ripples and noise at the outlet port of pump, the utilization of an advanced optimization algorithm is imperative for determining the optimal parameter values.

3.2.2. Model Validation and Parametric Study

A.
Measurement and validation
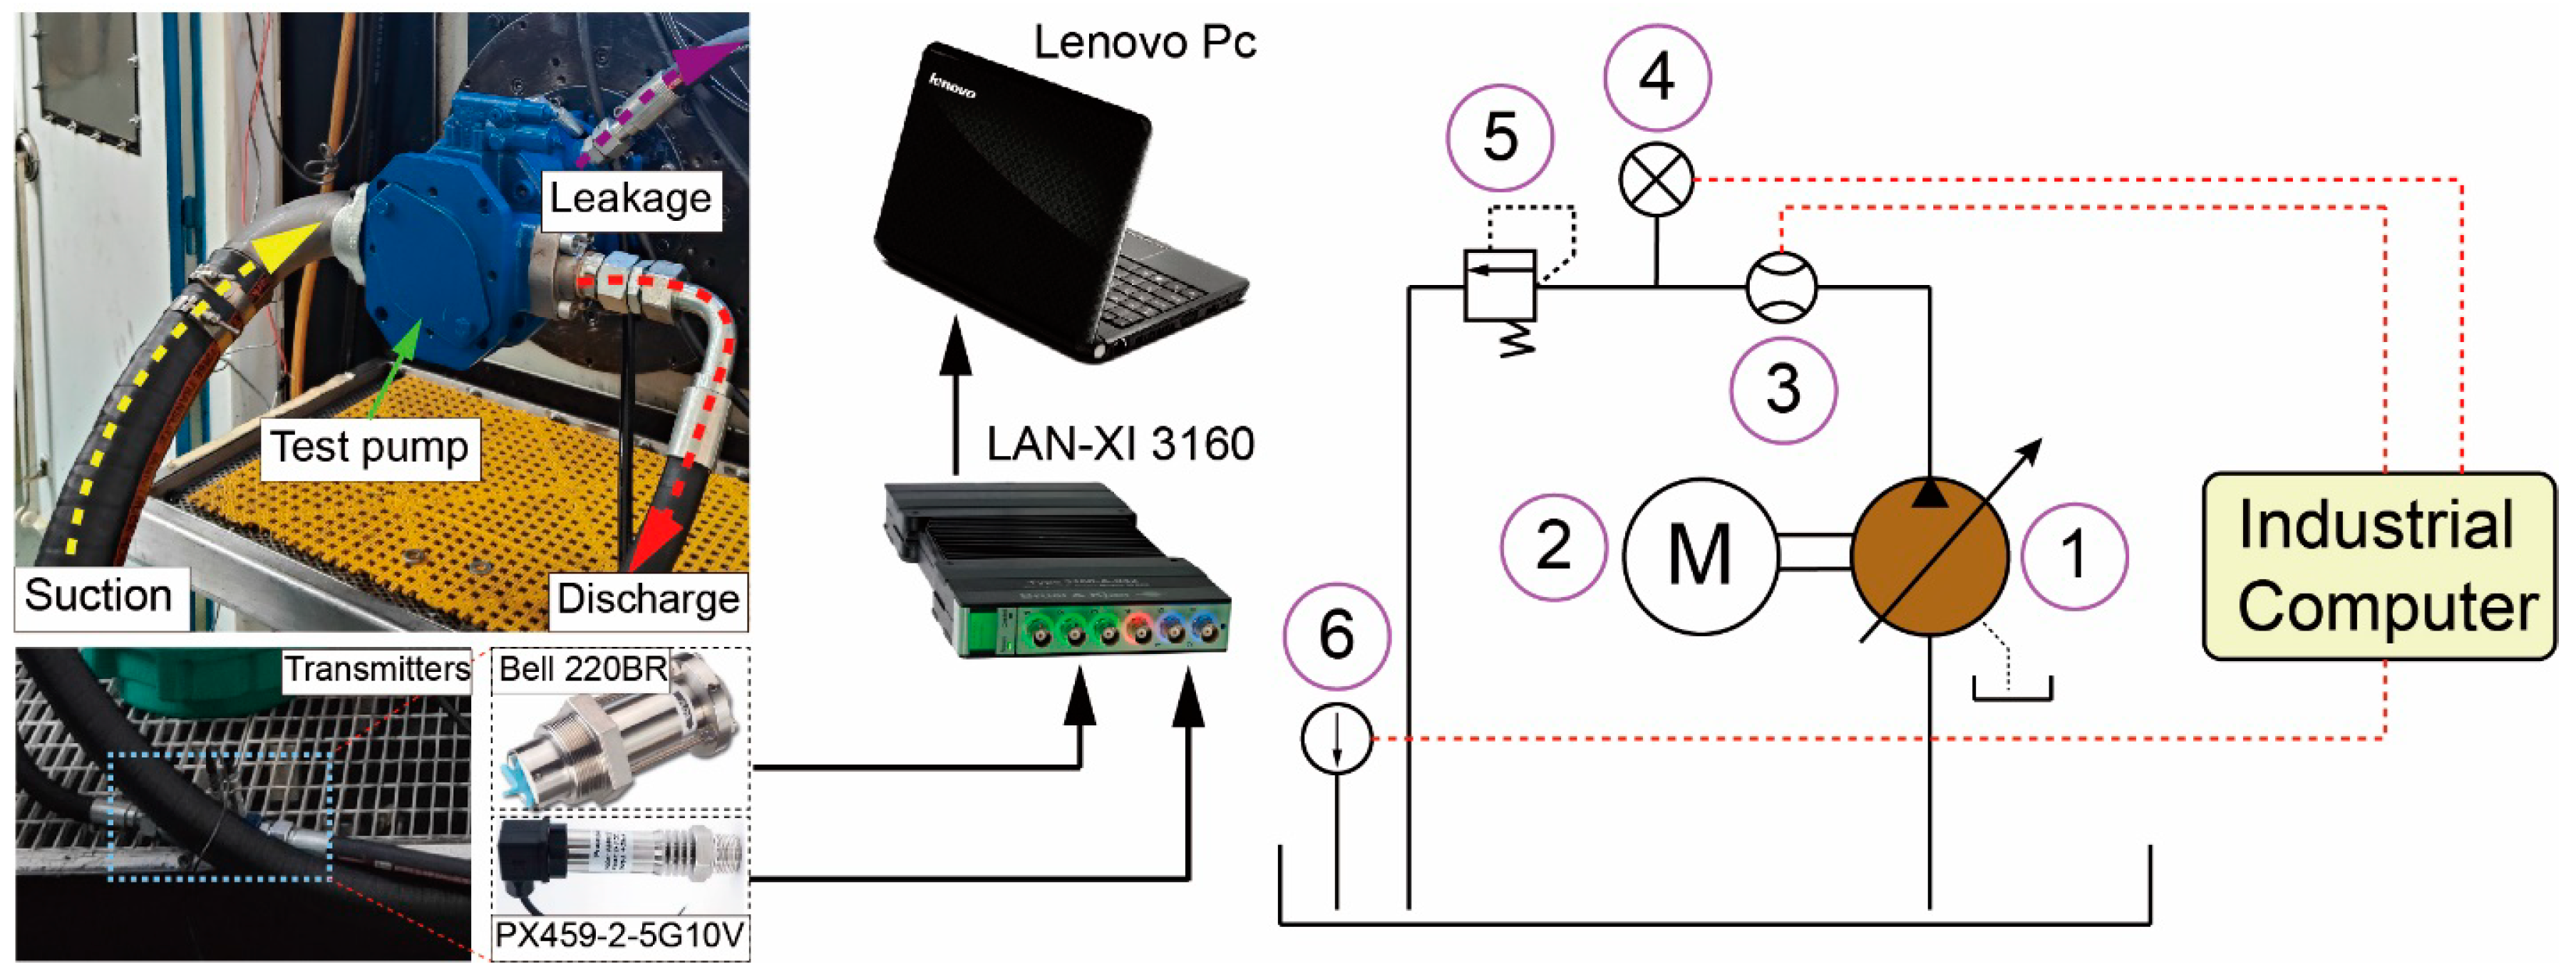
In order to validate the theoretical model of axial piston pump, the measurement of pump outlet pressure ripples was conducted on a pump-valve integrated test rig. The setup and arrangement of instrumentation can be observed in Figure 12. A motor with a rated power of 35 kW drove the pump under test, maintaining a stable speed of 2000 r/min. The pump had a displacement of 71 cm3/r and a rated pressure of 27.5 MPa. However, due to power constraints of the driving motor, the outlet pressure during testing was limited to approximately 20 MPa. A relief valve was installed at the end of the outlet pipeline to regulate the discharge pressure. Positioned between the pump outlet and the overflow valve, a flow sensor integrated with a PX-459 pressure transducer was utilized to measure the discharge flow rate and pressure ripples. The transmission medium employed was aviation hydraulic oil, while a cooler and temperature sensor control system maintained a stable temperature in the tank.
Before initiating the testing, the entire test system underwent a stable operation for a minimum duration of half an hour. This was done to eliminate any air from the pipelines and maintain the stability of system variables. The testing process consisted of two steps. In the first step, the driving motor was started, and the supply current was adjusted to stabilize the speed at 2000 r/min by rotating a knob. Multiple tests indicated a slight decrease in the rotational speed of the driving motor as the pump outlet discharge pressure increased. Therefore, the initial rotational speed was set slightly above 2000 r/min when the overflow pressure was at 0 MPa. In the second step, the opening of the overflow valve was adjusted to stabilize the pump outlet pressure at 20 MPa. For data collection, a LANXI-3160 data acquisition system with six channels was utilized, with two channels dedicated to acquiring the pump outlet pressure data during the test. The sampling frequency was set at 1000 Hz to meet specific requirements.
The comparison of simulation and measurement results for the discharge flow rate ripples and variations is depicted in Figure 13. The outlet discharge pressure was set at either 10 MPa or 20 MPa, while maintaining a rotational speed of 2000 r/min or 2200 r/min and the maximum swash plate angle. The obtained comparative results demonstrate a strong agreement between the simulation and measurement outcomes for both the highest and lowest pressure ripples. As the discharge pressure is directly linked to the piston chamber, it mirrors the variations in pressure occurring within the chamber.
B.
The effect of close angle
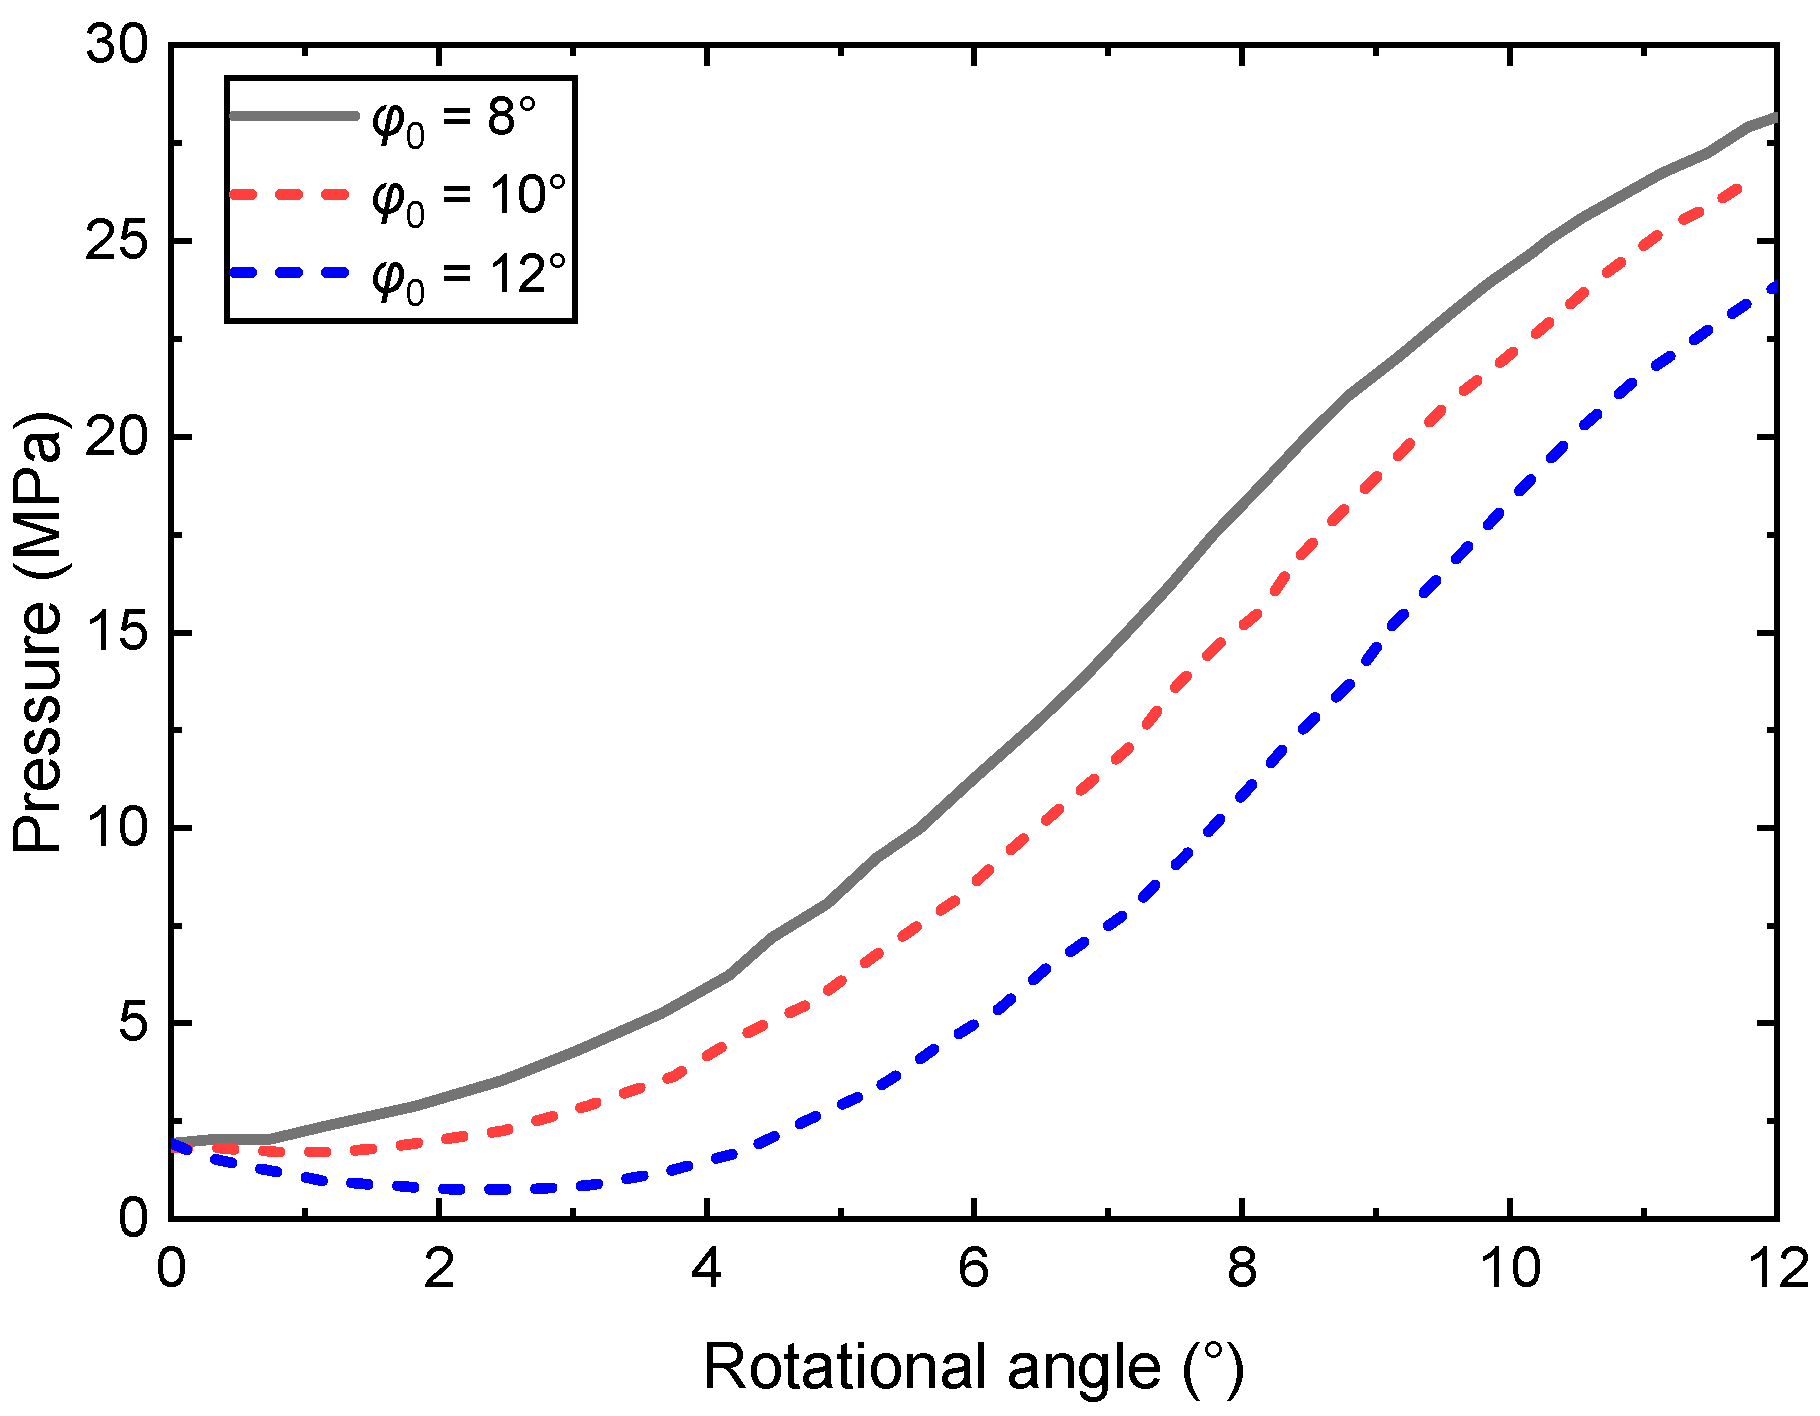
The data in Figure 14 shows three distinct values of φ0 that occur as the piston chamber expands its volume while maintaining a near constant angle of approximately 12°. Simultaneously, the pressure inside the piston chamber decreases from 23.5 MPa to 0.75 MPa. At angles closer to 8° or 10°, compression of the piston chamber is initiated as it moves away from the suction port. Discharge from the triangular groove takes place once the maximum pressure is achieved inside the piston chamber, which subsequently leads to a reduction in pressure within the chamber.
C.
The effect of cross angle
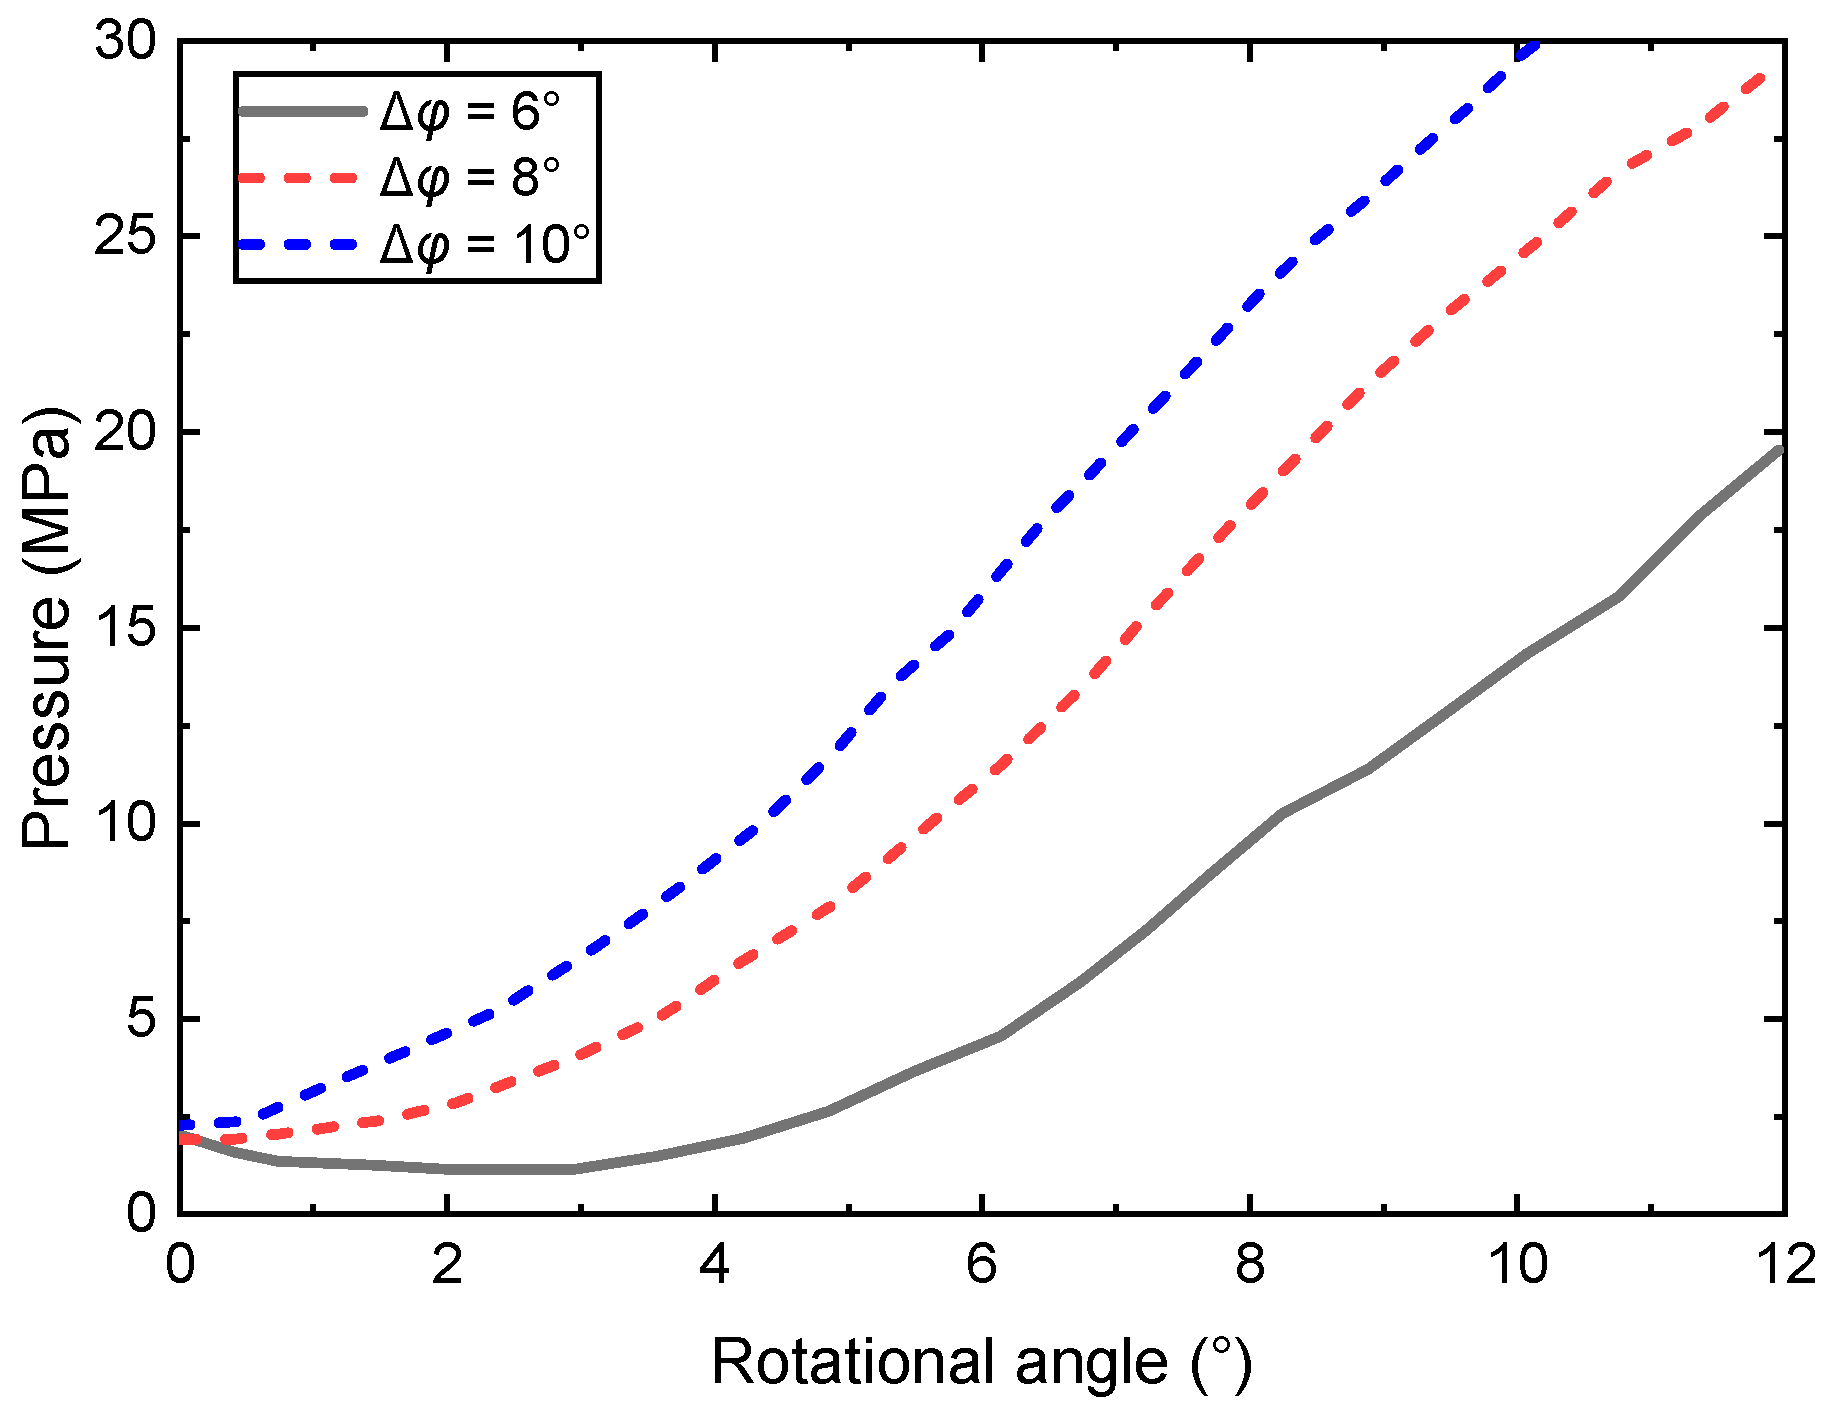
Figure 15 illustrates that the compressing area expands as the cross angle increases, leading to a faster increase in pressure. Conversely, a small cross angle causes an increase in the volume of the piston chamber, resulting in a decrease in pressure during the initial phase.
D.
The effect of the triangular groove size
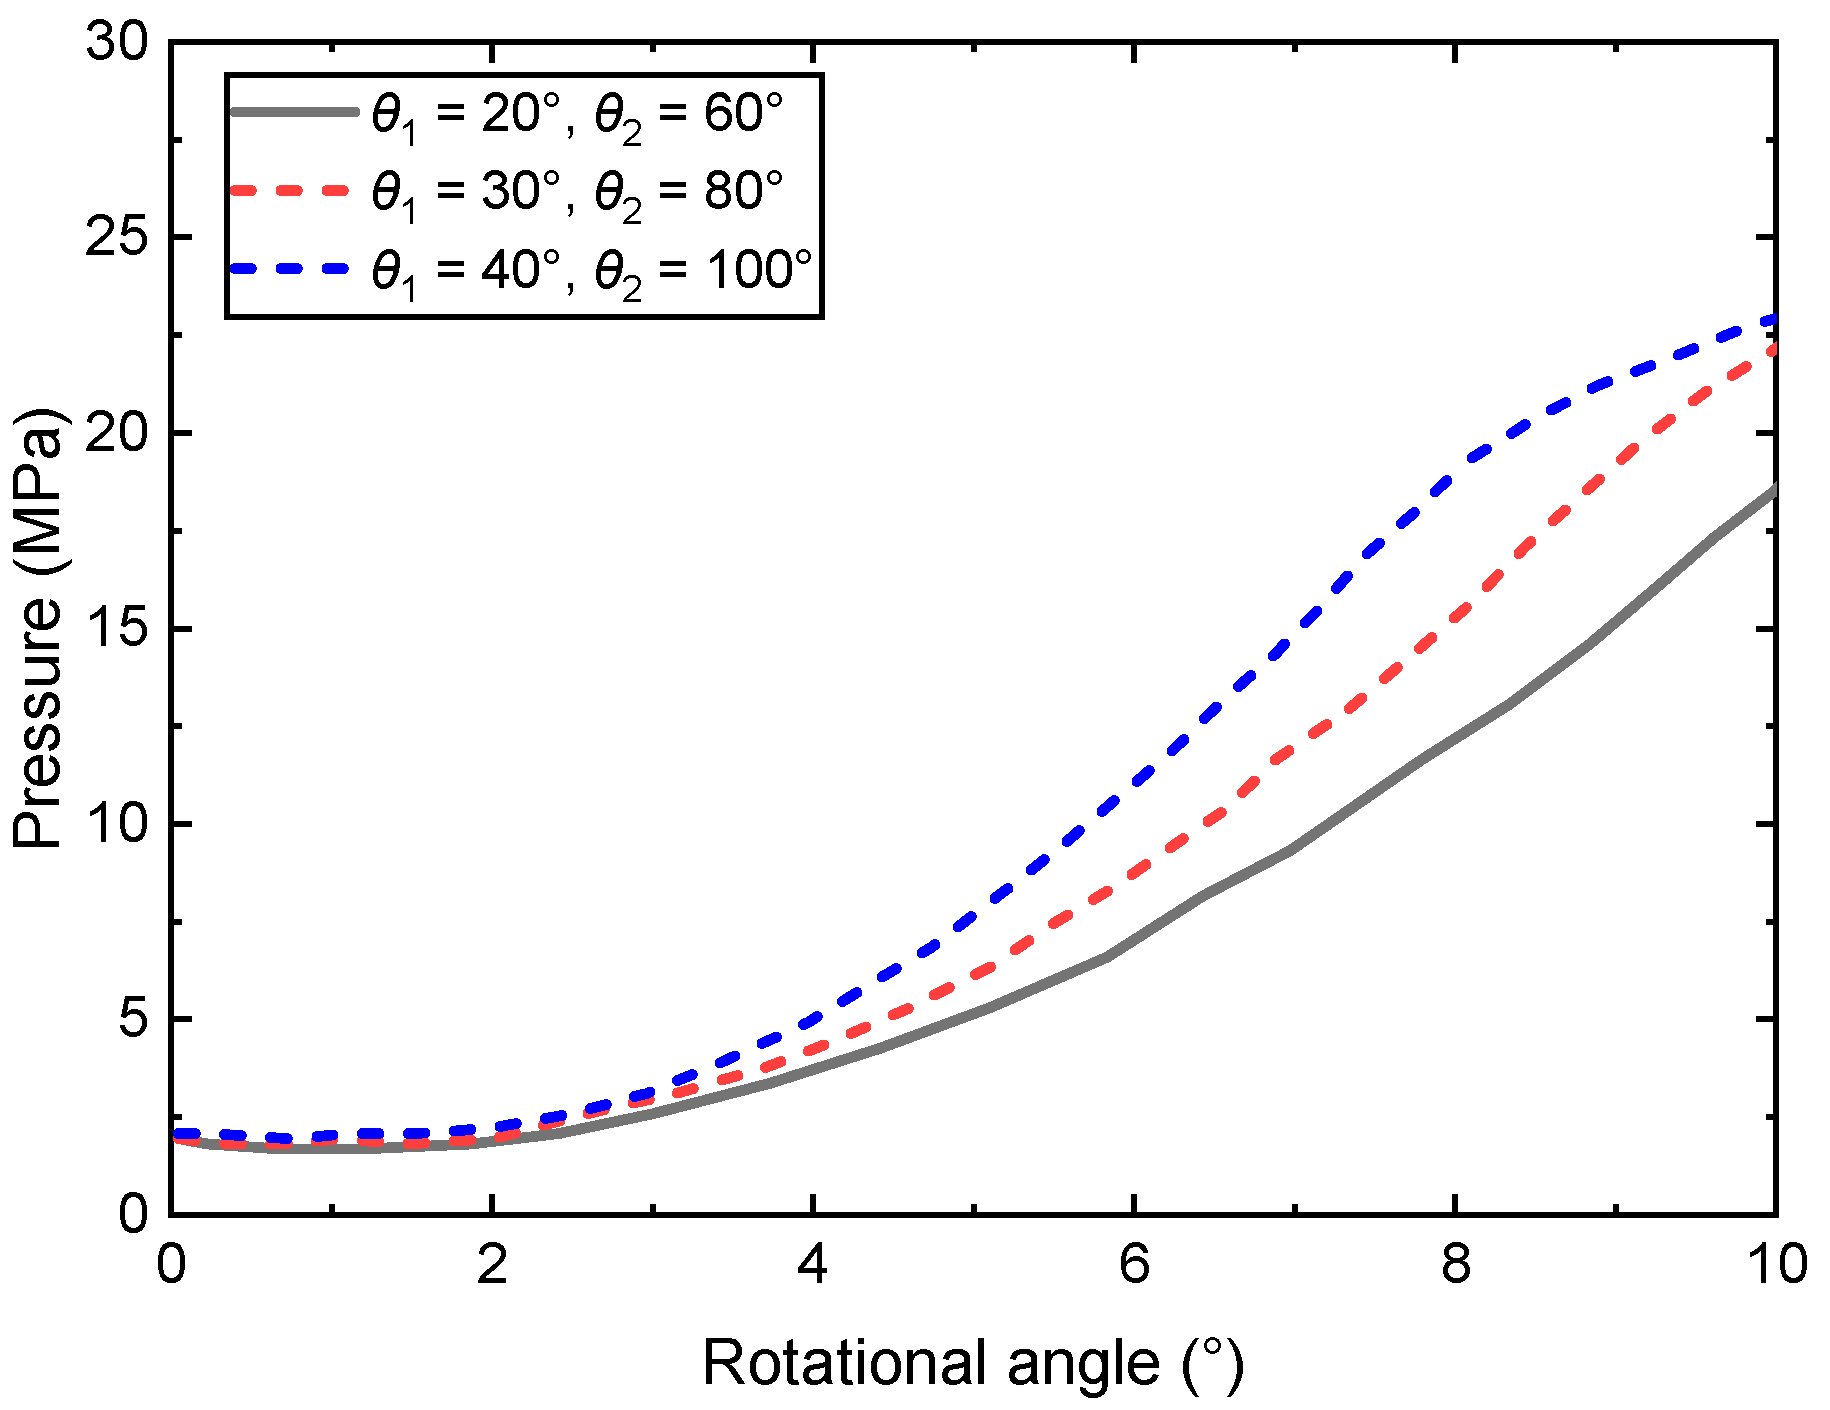
Figure 16 presents the pressure variation in the piston chamber, considering different sizes of the triangle groove at φ0 = 12°. It is observed that when θ1 is set at 20° and θ2 at 60°, the pressure continues to rise, but only a minimal amount of fluid passes through the triangle groove. As the open angle of the triangle groove increases, the fluid flow back into the piston chamber intensifies, leading to a faster amplification of the piston chamber pressure. However, it is worth noting that the piston chamber pressure with a larger open angle experiences a rapid decline once it exceeds 22 MPa.
E.
The effect of wrap angle
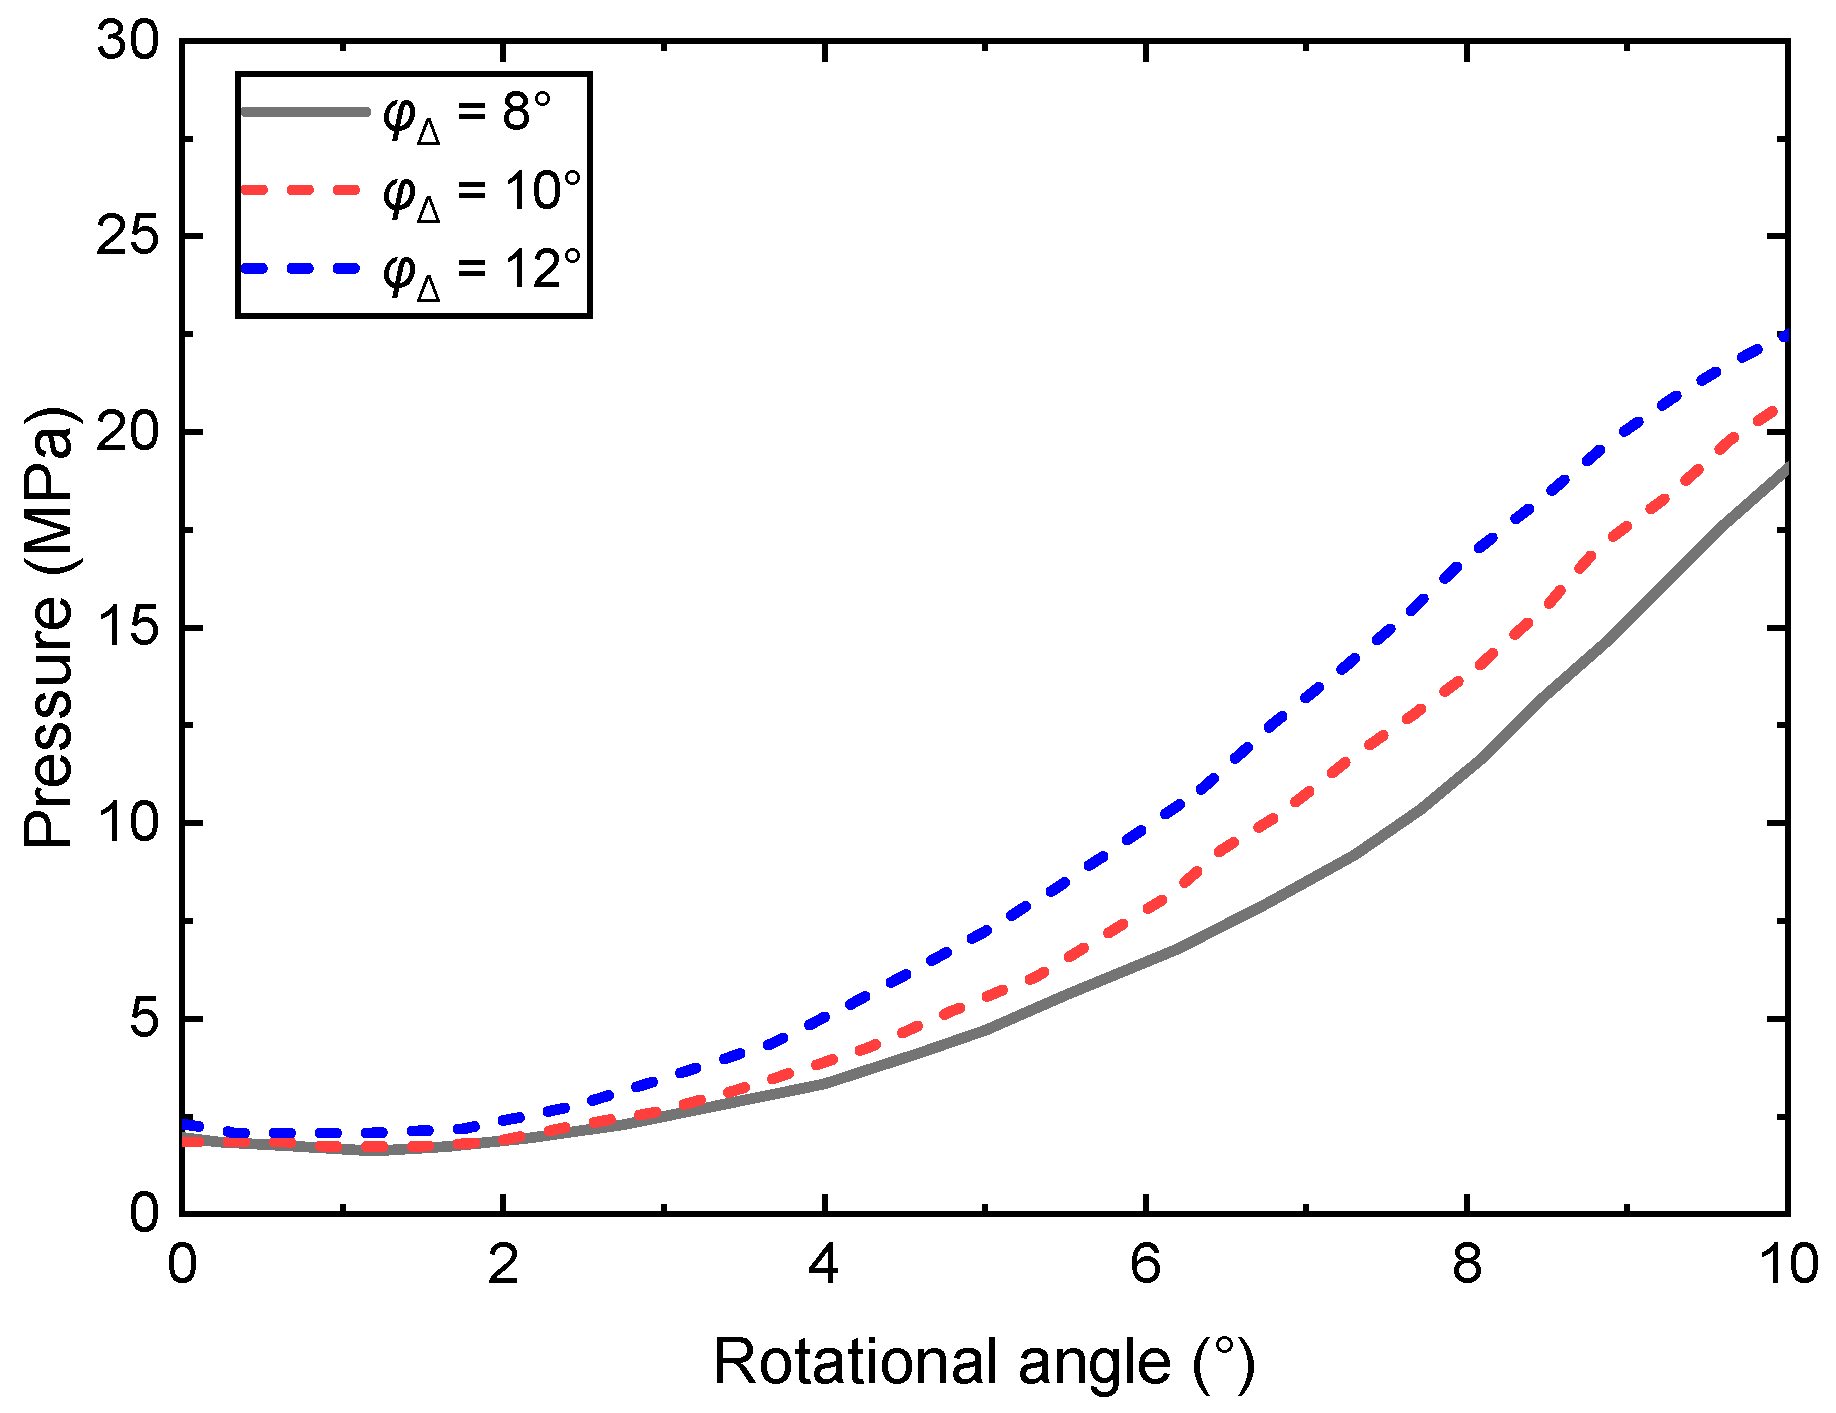
The data shown in Figure 17 indicates that the initial phase exhibits the highest pressure when the angle φΔ is 12°. This high pressure level is mainly due to fluid flowing back into the piston chamber as the piston moves away from the suction port for the first time. In contrast, the initial phase shows the lowest pressure when φΔ is 8°. Once the pressure inside the piston chamber surpasses 20 MPa, the pressure declines most rapidly for φΔ of 12°, primarily because of the larger area available for fluid to exit through the triangular groove. Conversely, when φΔ is 8°, the pressure remains the highest even after exceeding 20 MPa within the piston chamber.

3.3. Valve Plate Optimization Based on MSDBO

3.3.1. Optimization Procedure

In order to achieve the desired outcome of preventing fluid shock and maintaining consistent piston chamber pressure, the consideration of certain factors becomes crucial. It is also important to formulate the objective function in a way that promotes a stable pressure gradient. Eq. (28) refers to the integral of the difference between the ideal pressure and the actual pressure of the piston chamber, representing the area enclosed by the two pressure curves within the narrow angle. This contributes to a nearly steady pressure gradient. The optimization process should focus on determining the optimal values for various parameters, including the close angle φ0, cross angle Δφ, wrap angle φΔ, width angle 𝜃1, and depth angle 𝜃2.
The adjustment of the original dimensional parameters is performed to optimize the variables, as shown in Table 5. This optimization process is carried out under a rated pressure of 32 MPa. It is crucial to ensure that the value of Δp remains below 5% of the rated pressure, which is equivalent to 1.6 MPa, in order for the plunger pump to operate smoothly without significant pressure variations. To ensure the reliability of the optimization results, constraints on the maximum and minimum pressures within the plunger chamber are essential. These constraints effectively prevent excessive pressure fluctuations (above 34 MPa or below 0.03 MPa), thereby facilitating the achievement of an optimal optimization solution while effectively addressing the possibility of cavitation.

3.3.2. Optimization Results

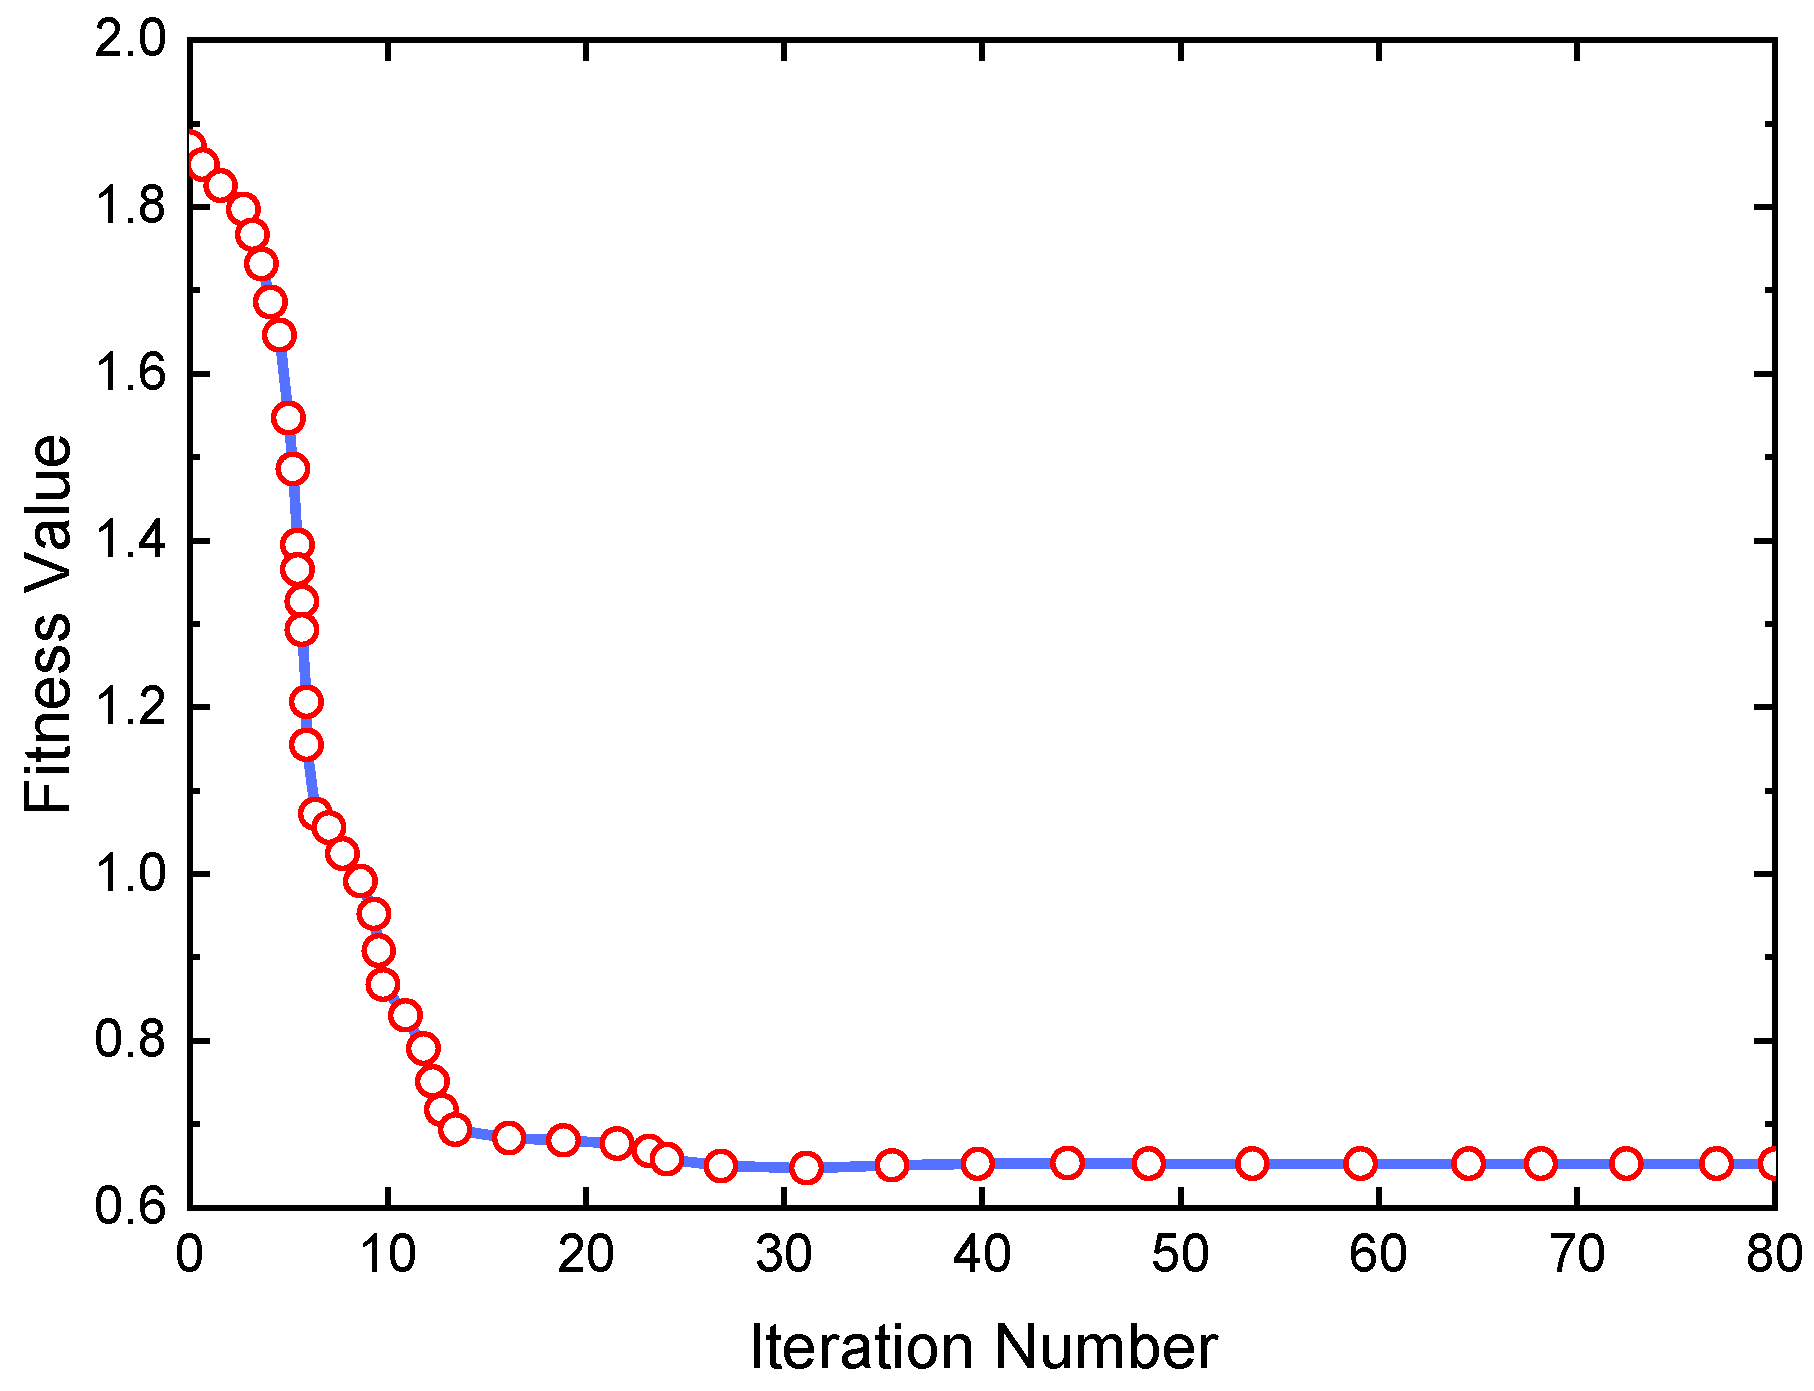
The population size and number of iterations play crucial roles in the optimization algorithm. A larger population size promotes improved diversity and higher precision in the optimization results, but it also requires more computational time. Conversely, too few iterations result in premature convergence, preventing the achievement of the optimal solution. However, an excessively high number of iterations consumes more time without proportional gains in accuracy. By comparing convergence time and fitness values across different parameter configurations, it is concluded that a population size of 80 and 200 iterations effectively meet the optimization requirements. Once the optimization process is completed, the fitness curve is obtained, as shown in Figure 18. Each data point represents a single iteration of the optimization algorithm. From the graph, it can be observed that the fitness values rapidly decrease from the highest value to the lowest within the first 30 iterations and then remain constant until the end of the optimization. This clearly demonstrates the algorithm’s impressive search capacity, speed, and stability.
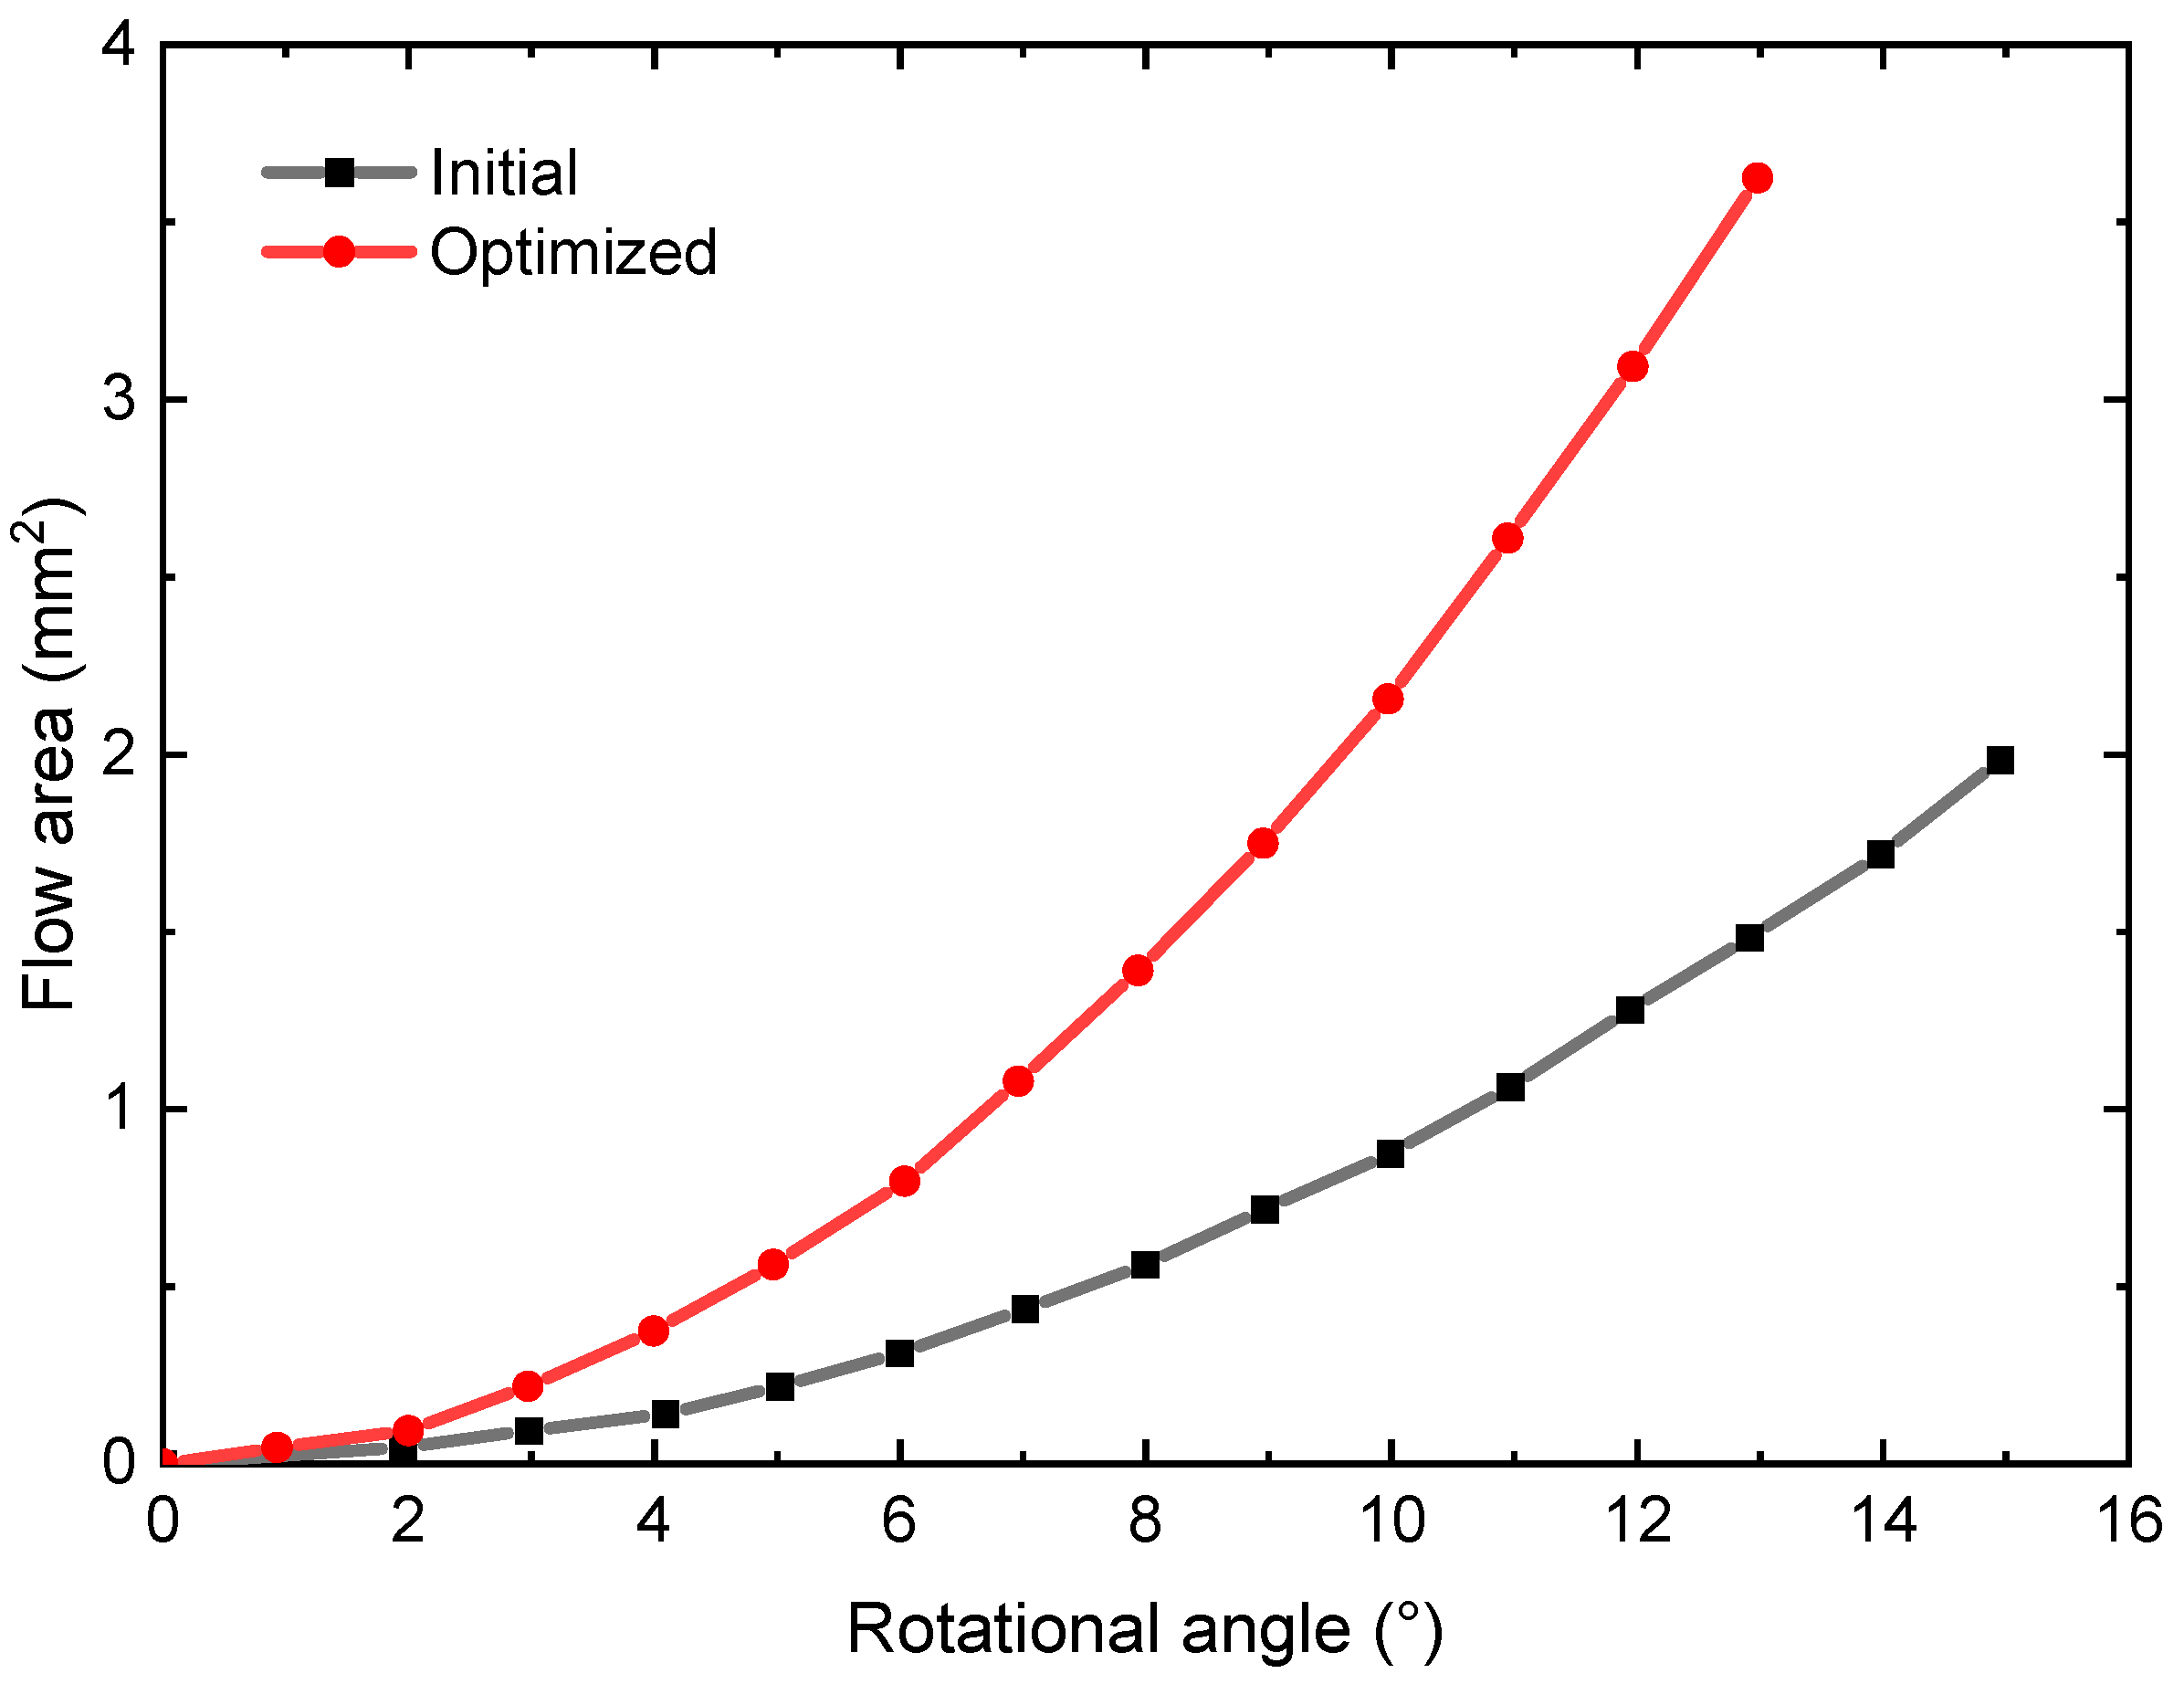
The Figure 19 presents the calculation of cross-sectional area for both the original and optimized triangle grooves using Eq. (23). A noticeable quadratic relationship between the area and cylinder block rotational angle is observed for both types of grooves. Comparing the two designs, the optimized triangular groove outperforms the original one in terms of cross-sectional area under the same cylinder block rotational angle. This improvement stems from the increased width and depth angles in the optimized design. Moreover, the optimized triangular groove demonstrates enhanced flow passage capacity with higher cylinder block rotation angles.
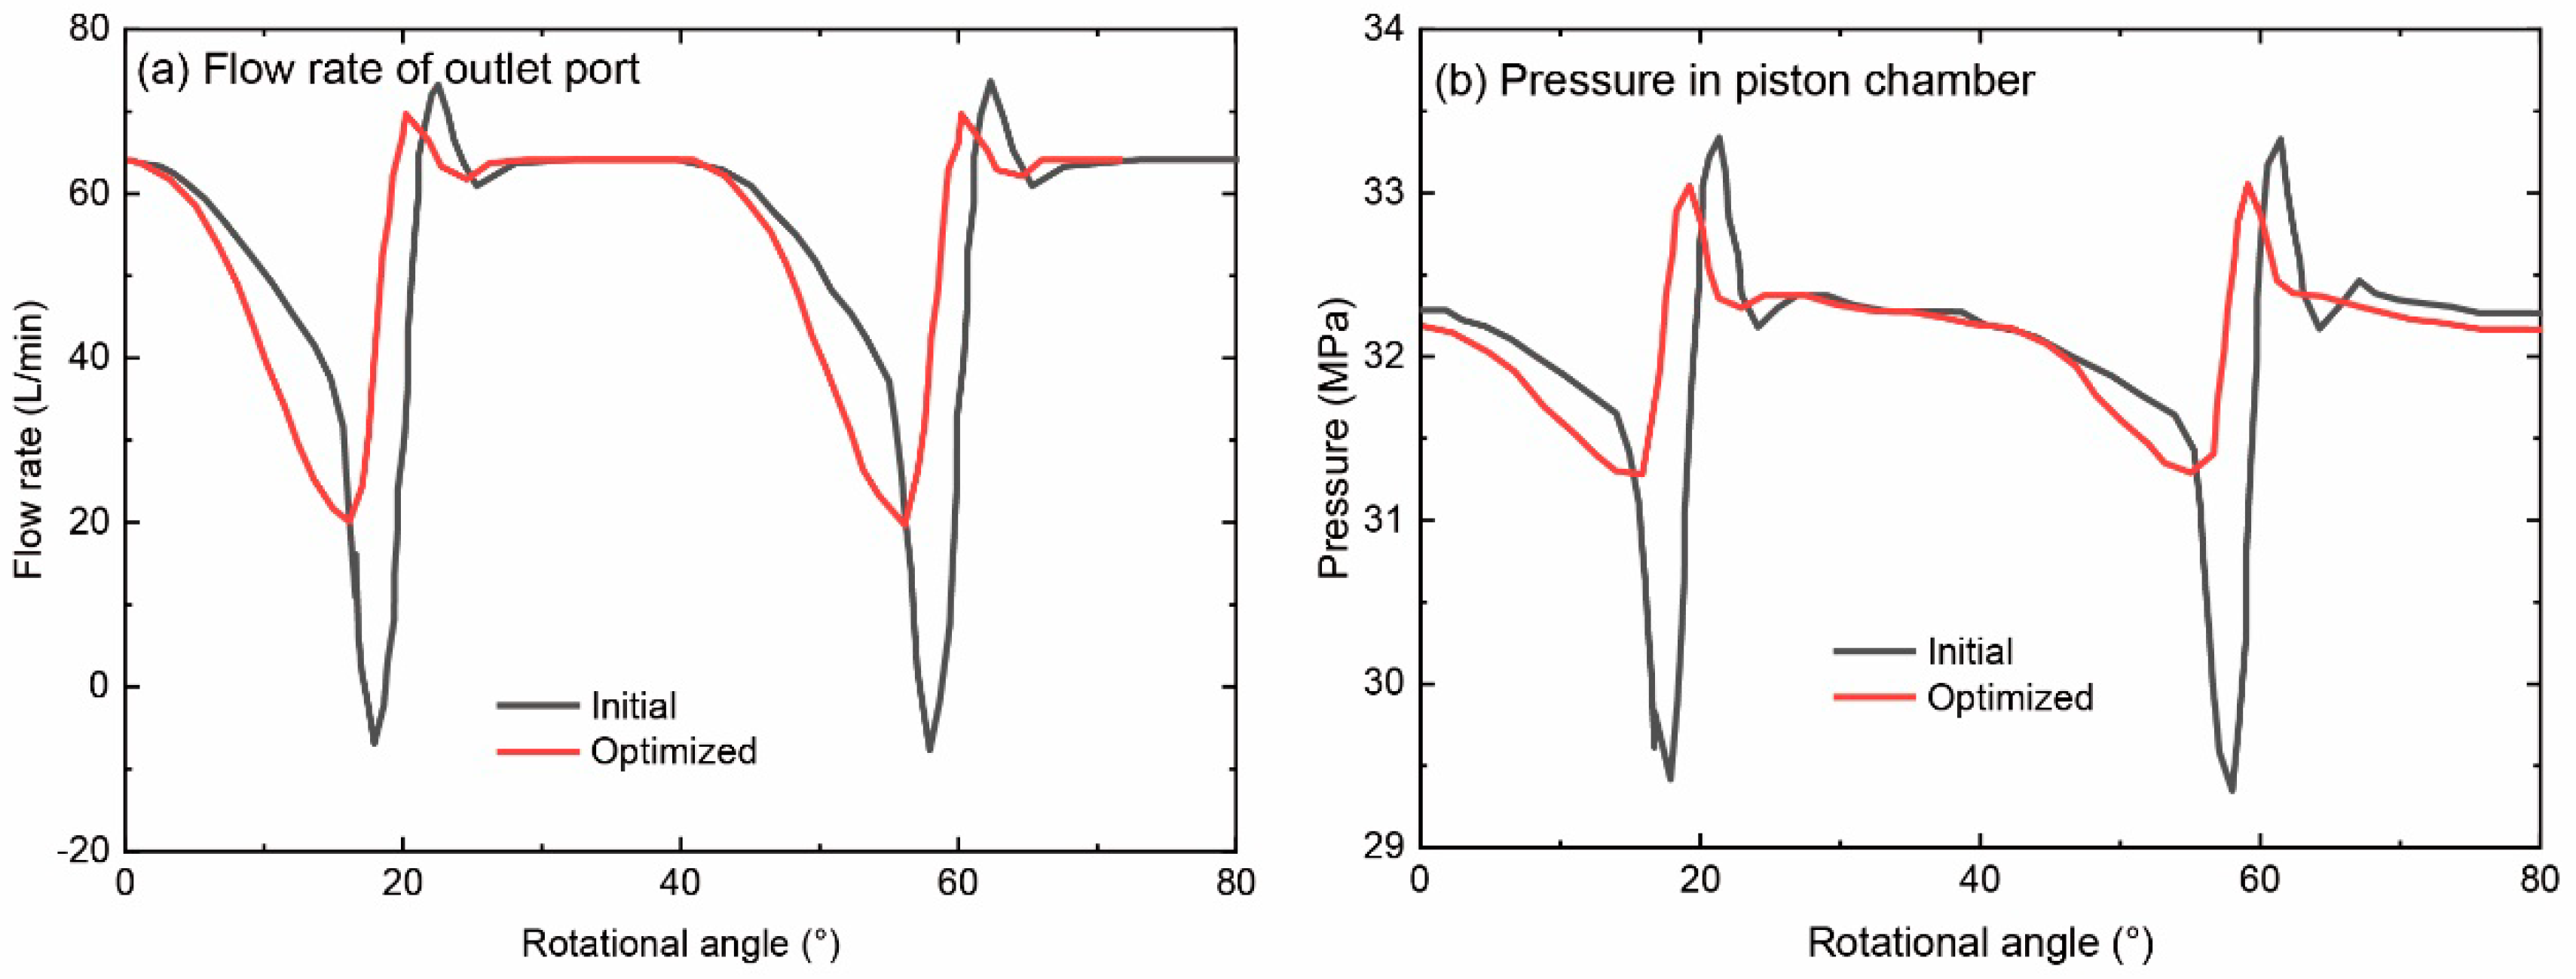
In order to validate the optimization results, a comparison is conducted between the initial and optimized designs of the psiton pump, focusing on fluctuations in piston chamber pressure and flow rate under identical discharge pressure conditions. The suction pressure is set at 0.3 MPa, discharge pressure at 32 MPa, and rotational speed at 1400 rpm, as illustrated in Figure 20. The graph demonstrates that the optimized model exhibits smaller fluctuations in flow rate when compared to the initial model. Moreover, even during the onset of flow rate decrease, the optimized model experiences a greater rate of decline than the initial model. This can be attributed to the enlarged cross-sectional area of the triangle groove in the optimized design, which facilitates a larger backflow of fluid, resulting in a more substantial decrease in flow rate. Consequently, a greater amount of high-pressure fluid is injected into the chamber, leading to a quicker pressure increase and an earlier termination of backflow. Consequently, the minimum flow rate in the optimized model surpasses that in the initial model. Additionally, the overshoot and fluctuations in chamber pressure are significantly reduced in the optimized model compared to the original model. This reduction mitigates the impact caused by pressure fluctuations, alleviates pump vibrations, and contributes to the attenuation of discharge noise.
The ripple rate of the discharge flow rate is determined by calculating the ratio between the difference of the maximum and minimum flow rates and the average flow rate:
Preprints 98319 i053
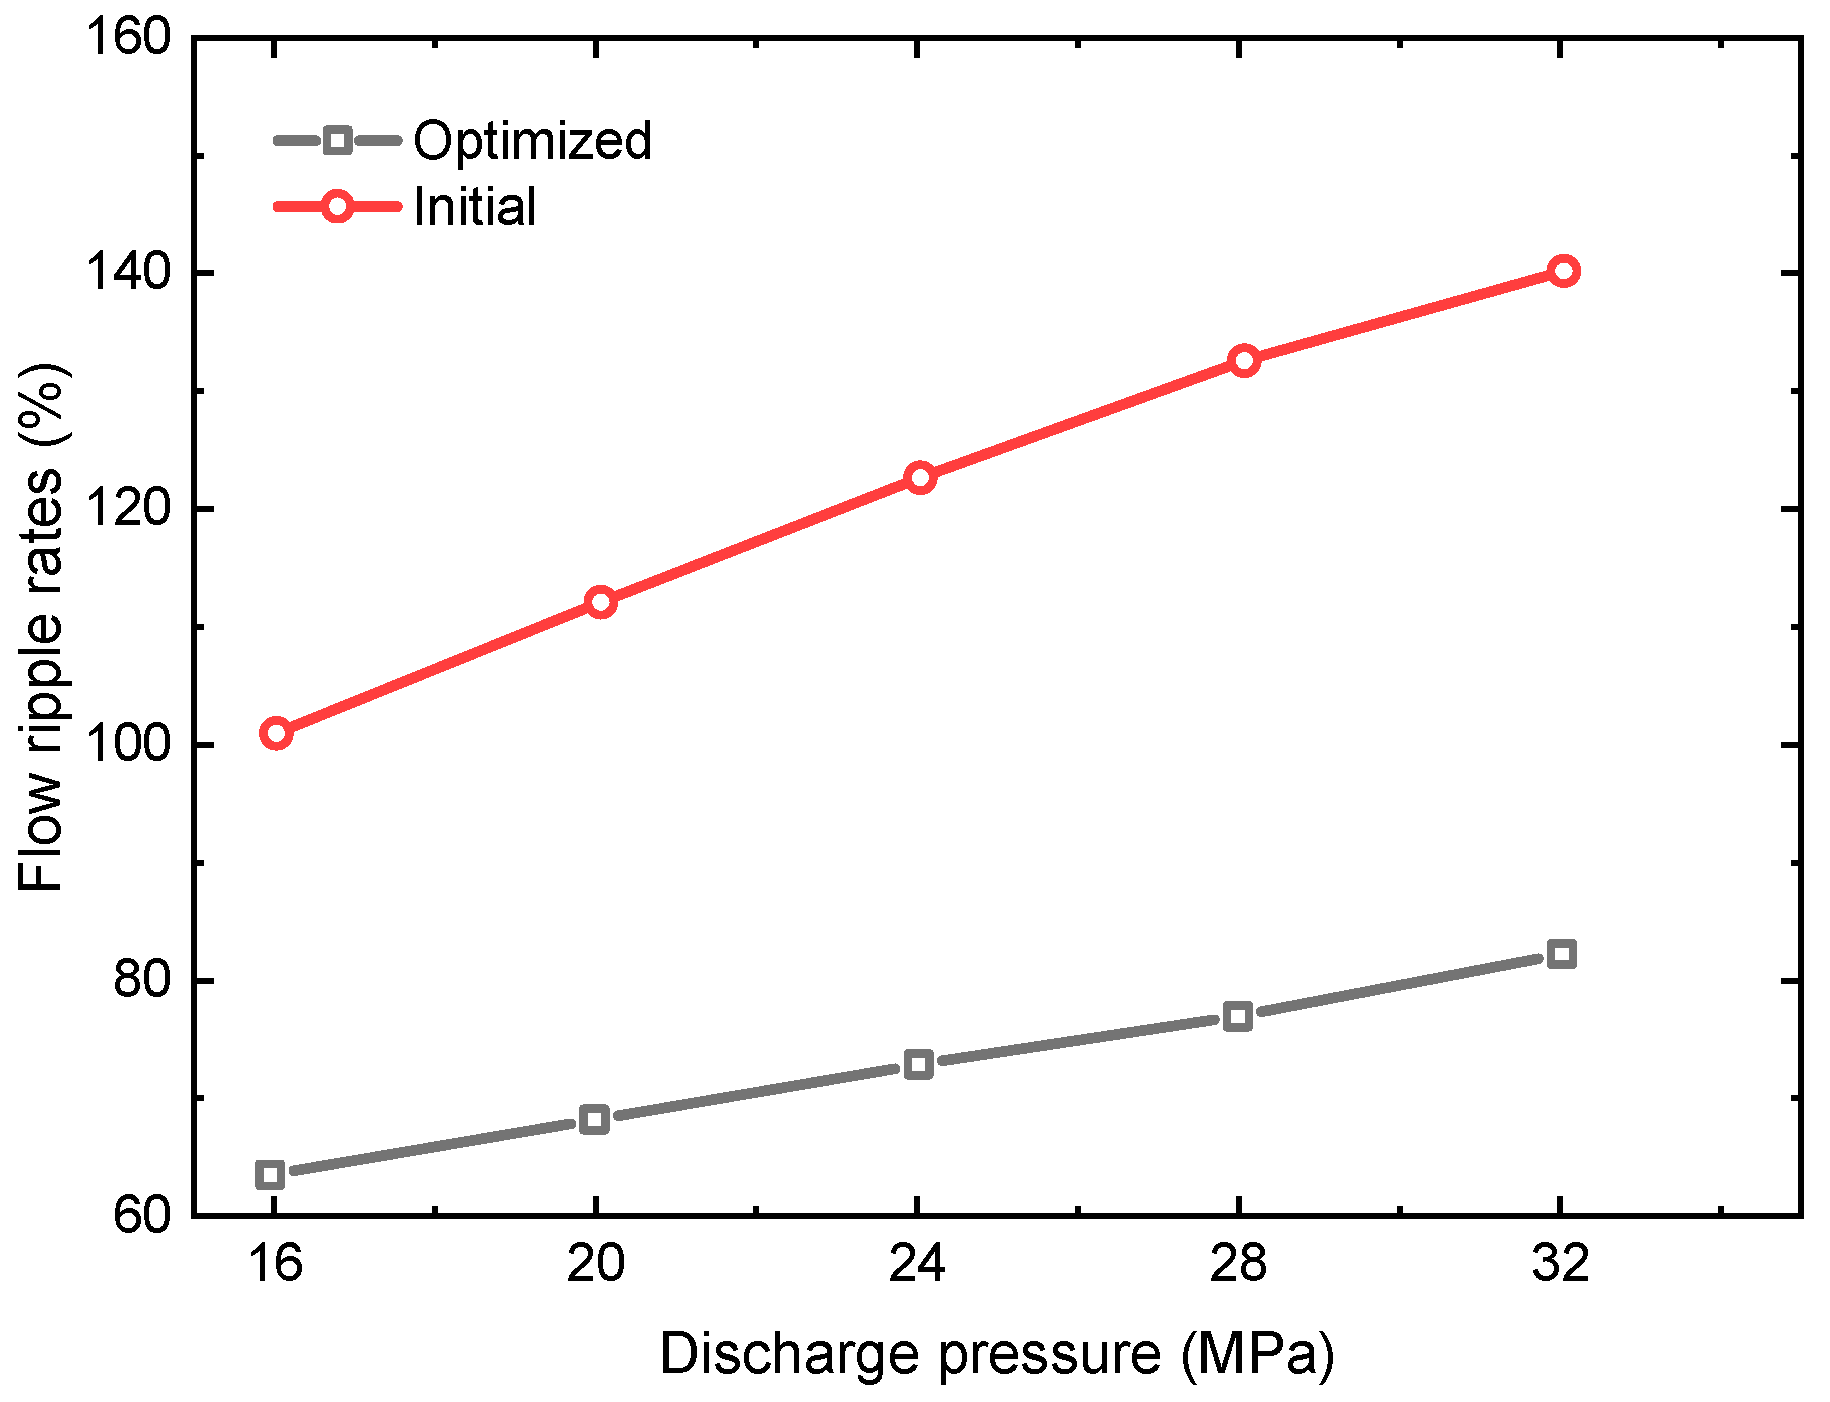
Under the given operating conditions of a suction pressure of 0.1 MPa and a rotational speed of 1400 rpm, discharge pressures of 16 MPa, 20 MPa, 24 MPa, 28 MPa, and 32 MPa are employed. The flow ripple rates corresponding to various operating conditions are depicted in Figure 21. Notably, the optimized design consistently exhibits lower flow ripple rates compared to the original design at different load pressures, indicating a reduction in fluid noise. This compelling evidence underscores the effective resolution of nonlinear engineering challenges achieved through the proposed MSDBO.

4. Conclusions

A novel algorithm, called the multi-strategy improved dung beetle optimization (MSDBO) algorithm, is created to enhance the global search capability and mitigate the risk of becoming trapped in local optima within the standard dung beetle optimization (DBO) algorithm. This innovative approach combines three strategies: the tent chaotic mapping strategy, golden sinusoidal strategy, and Levy flight strategy. The effectiveness of the algorithm is evaluated by comparing its performance to five widely used optimization algorithms on 12 benchmark functions, each with distinct characteristics. Experimental results on the benchmark functions demonstrate that MSDBO achieves faster convergence speeds, improved stability, and higher solution accuracy compared to the other optimization algorithms. Furthermore, when applied to optimize the valve plate of an axial piston pump, the algorithm’s results are consistent with expected outcomes for practical engineering applications. However, it is important to note that a direct comparison of MSDBO optimization results with other algorithms for this specific engineering application is not conducted. The primary objective of our study is to present engineers with a viable research method rather than definitively establishing the superiority of a specific algorithm. The optimal choice of algorithm may vary depending on different operating environments and specific user requirements. Thus, future research should focus on two main aspects. Firstly, applying MSDBO to a wider range of practical engineering problems can provide further evaluation of its performance in real-world scenarios. This exploration will enable a better understanding of the algorithm’s strengths and weaknesses across various domains. Secondly, conducting comparative studies between MSDBO and commonly used optimization algorithms in engineering applications under the same assumed environmental conditions can uncover additional possibilities for improvement. Such analyses will facilitate a comprehensive assessment of the algorithm’s competitiveness and potential for enhancements in practical engineering contexts.

Funding

This research was funded by Fund for Education Reform Projects of Fujian Provincial University Engineering Research Center for Pan Home Intelligent Lighting (Min Jiao Ke [2018] No. 89), 2020 Provincial New Engineering Research and Reform Practice Project (Min Jiao Gao [2020] No. 4), Fujian Province Pan Home Intelligent Lighting Public Training Base, and Quanzhou Xingu Semiconductor Modern Industry College (MKCYXY-2023-01).

Data Availability Statement

Data will be made available on request.

Conflicts of Interest

The authors declare no conflicts of interest. The funders had no role in the design of the study; in the collection, analyses, or interpretation of data; in the writing of the manuscript; or in the decision to publish the results.

References

  1. Kumar A, Nadeem M, Banka H. Nature inspired optimization algorithms: a comprehensive overview[J]. Evolving Systems, 2023, 14(1): 141-156. [CrossRef]
  2. Sachan R, Singh K. Nature-Inspired Optimization Algorithms: Research Direction and Survey[M]. 2021. [CrossRef]
  3. Xue J, Shen B. Dung beetle optimizer: a new meta-heuristic algorithm for global optimization[J]. The Journal of Supercomputing, 2023, 79(7): 7305-7336. [CrossRef]
  4. Heryanto, A. Priyadi, A. Soeprijanto, et al. Optimization of DG Placement in Real Distribution System as a Solution for Increasing the Quality of the System Using GA Algorithms[C]//2021 6th IEEE International Conference on Recent Advances and Innovations in Engineering (ICRAIE): Vol. 6. 2021: 1-4. [CrossRef]
  5. Gad A G. Particle Swarm Optimization Algorithm and Its Applications: A Systematic Review[J]. Archives of Computational Methods in Engineering, 2022, 29(5): 2531-2561. [CrossRef]
  6. S. Jaiswal, Y. R. Sood, A. Maheshwari, et al. Dung Beetle Optimizer Algorithm Based OPF Solution considering Renewable Energy Sources[C]//2023 International Conference on Computer, Electronics & Electrical Engineering & their Applications (IC2E3). 2023: 1-6. [CrossRef]
  7. Shen Q, Zhang D, Xie M, et al. Multi-Strategy Enhanced Dung Beetle Optimizer and Its Application in Three-Dimensional UAV Path Planning[J]. Symmetry, 2023, 15(7). [CrossRef]
  8. Hu T, Zhang H, Zhou J. Prediction of the Debonding Failure of Beams Strengthened with FRP through Machine Learning Models[J]. Buildings, 2023, 13(3). [CrossRef]
  9. W. Zilong, S. Peng. A Multi-Strategy Dung Beetle Optimization Algorithm for Optimizing Constrained Engineering Problems[J]. IEEE Access, 2023, 11: 98805-98817. [CrossRef]
  10. Lu Z, Zhang J. An Enhanced Dung Beetle Optimization Algorithm for Global Optimization[J]. Current Journal of Applied Science and Technology, 2023, 42: 9-22. [CrossRef]
  11. S. Li, J. Li. Chaotic dung beetle optimization algorithm based on adaptive t-Distribution[C]//2023 IEEE 3rd International Conference on Information Technology, Big Data and Artificial Intelligence (ICIBA): Vol. 3. 2023: 925-933. [CrossRef]
  12. Zhang R, Zhu Y. Predicting the Mechanical Properties of Heat-Treated Woods Using Optimization-Algorithm-Based BPNN[J]. Forests, 2023, 14(5). [CrossRef]
  13. Lu Z, Zhang J. An Enhanced Dung Beetle Optimization Algorithm for Global Optimization[J]. Current Journal of Applied Science and Technology, 2023, 42: 9-22. [CrossRef]
  14. Liu Q, Li N, Jia H, et al. A Hybrid Arithmetic Optimization and Golden Sine Algorithm for Solving Industrial Engineering Design Problems[J]. Mathematics, 2022, 10(9). [CrossRef]
  15. Noah D. Manring. Fluid Power Pumps and Motors: Analysis, Design and Control[M]. McGraw-Hill Professional, 2013.
  16. Tang S, Zhu Y, Yuan S, et al. Intelligent Diagnosis towards Hydraulic Axial Piston Pump Using a Novel Integrated CNN Model[J]. Sensors, 2020, 20(24). [CrossRef]
  17. Xu B, Ye S, Zhang J, et al. Flow ripple reduction of an axial piston pump by a combination of cross-angle and pressure relief grooves: Analysis and optimization[J]. Journal of Mechanical Science and Technology, 2016, 30(6): 2531-2545. [CrossRef]
  18. Ye S G, Zhang J H, Xu B. Noise Reduction of an Axial Piston Pump by Valve Plate Optimization[J]. Chinese Journal of Mechanical Engineering, 2018, 31(1): 57. [CrossRef]
  19. Lyu F, Ye S, Zhang J, et al. Theoretical and Simulation Investigations on Flow Ripple Reduction of Axial Piston Pumps Using Nonuniform Distribution of Pistons[J]. Journal of Dynamic Systems, Measurement, and Control, 2020, 143(041008). [CrossRef]
  20. Zhang J, Xia S, Ye S, et al. Experimental investigation on the noise reduction of an axial piston pump using free-layer damping material treatment[J]. Applied Acoustics, 2018, 139: 1-7. [CrossRef]
  21. Danes L, Vacca A. A Tandem Axial-Piston Unit Based Strategy for the Reduction of Noise Sources in Hydraulic Systems[J]. Energies, 2020, 13(20). [CrossRef]
  22. Fiebig W. NOISE CONTROL OF FLUID POWER UNITS[M]. 2016.
  23. Fiebig W, Rosikowski P. Reduction of Noise Emission of Hydraulic Power Units[C]//STRYCZEK J, WARZYŃSKA U. Advances in Hydraulic and Pneumatic Drives and Control 2020. Cham: Springer International Publishing, 2021: 241-251. [CrossRef]
  24. Xu B, Sun Y hui, Zhang J hui, et al. A new design method for the transition region of the valve plate for an axial piston pump[J]. Journal of Zhejiang University-SCIENCE A, 2015, 16(3): 229-240. [CrossRef]
  25. Zhou J, Jing C, Bao Q, et al. Novel study on the pressure pulsation of the axial piston machines with even number of pistons[J]. The Journal of Engineering, 2020, 2020: 932-935. [CrossRef]
  26. Pan Y, Li Y, Liang D. The influence of dynamic swash plate vibration on outlet flow ripple in constant power variable-displacement piston pump[J]. Proceedings of the Institution of Mechanical Engineers, Part C: Journal of Mechanical Engineering Science, 2019, 233(14): 4914-4933. [CrossRef]
  27. Ye S G, Zhang J H, Xu B. Noise Reduction of an Axial Piston Pump by Valve Plate Optimization[J]. Chinese Journal of Mechanical Engineering, 2018, 31(1): 57. [CrossRef]
  28. Dacke M, Baird E, Byrne M, et al. Dung Beetles Use the Milky Way for Orientation[J]. Current Biology, 2013, 23(4): 298-300. [CrossRef]
  29. Byrne M, Dacke M, Nordström P, et al. Visual cues used by ball-rolling dung beetles for orientation[J]. Journal of Comparative Physiology A, 2003, 189(6): 411-418.
  30. Baird E, Byrne M, Smolka J, et al. The Dung Beetle Dance: An Orientation Behaviour?[J]. PloS one, 2012, 7: e30211. [CrossRef]
  31. Chang Z, Luo J, Zhang Y, et al. A mixed strategy improved dung beetle optimization algorithm and its application[M]. 2023. [CrossRef]
  32. Pervaiz S, Bangyal W, Ashraf A, et al. Comparative Research Directions of Population Initialization Techniques using PSO Algorithm[J]. Intelligent Automation & Soft Computing, 2022, 32: 1427-1444. [CrossRef]
  33. Agushaka J O, Ezugwu A E, Abualigah L, et al. Efficient Initialization Methods for Population-Based Metaheuristic Algorithms: A Comparative Study[J]. Archives of Computational Methods in Engineering, 2023, 30(3): 1727-1787. [CrossRef]
  34. Rauf H T, Gao J, Almadhor A, et al. Multi population-based chaotic differential evolution for multi-modal and multi-objective optimization problems[J]. Applied Soft Computing, 2023, 132: 109909. [CrossRef]
  35. L. Shen, L. Xu, R. Wei, et al. Multi-swarm Optimization with Chaotic Mapping for Dynamic Optimization Problems[C]//2015 8th International Symposium on Computational Intelligence and Design (ISCID): Vol. 2. 2015: 132-137. [CrossRef]
  36. Li Y, He Y, Yu W. A hybrid control strategy based on CSA and ELM for uncertain nonlinear chaotic system[J]. Journal of Algorithms & Computational Technology, 2020, 14: 1748302620922500. [CrossRef]
  37. Naskar P K, Bhattacharyya S, Nandy D, et al. A robust image encryption scheme using chaotic tent map and cellular automata[J]. Nonlinear Dynamics, 2020, 100(3): 2877-2898. [CrossRef]
  38. Zhu F, Li G, Tang H, et al. Dung beetle optimization algorithm based on quantum computing and multi-strategy fusion for solving engineering problems[J]. Expert Systems with Applications, 2024, 236: 121219. [CrossRef]
  39. Han M, Du Z, Zhu H, et al. Golden-Sine dynamic marine predator algorithm for addressing engineering design optimization[J]. Expert Systems with Applications, 2022, 210: 118460. [CrossRef]
  40. J. Zhang, J. S. Wang. Improved Whale Optimization Algorithm Based on Nonlinear Adaptive Weight and Golden Sine Operator[J]. IEEE Access, 2020, 8: 77013-77048. [CrossRef]
  41. Cui Y, Shi R, Dong J. CLTSA: A Novel Tunicate Swarm Algorithm Based on Chaotic-Lévy Flight Strategy for Solving Optimization Problems[J]. Mathematics, 2022, 10(18): 3405. [CrossRef]
  42. Kaidi W, Khishe M, Mohammadi M. Dynamic Levy Flight Chimp Optimization[J]. Knowledge-Based Systems, 2022, 235: 107625. [CrossRef]
  43. Lu X li, He G. QPSO algorithm based on Lévy flight and its application in fuzzy portfolio[J]. Applied Soft Computing, 2021, 99: 106894. [CrossRef]
  44. Rezaei H, Bozorg-Haddad O, Chu X. Grey wolf optimization (GWO) algorithm[J]. Advanced optimization by nature-inspired algorithms, 2018: 81-91. [CrossRef]
  45. Xue J, Shen B. A novel swarm intelligence optimization approach: sparrow search algorithm[J]. Systems science & control engineering, 2020, 8(1): 22-34. [CrossRef]
  46. Kaur G, Arora S. Chaotic whale optimization algorithm[J]. Journal of Computational Design and Engineering, 2018, 5(3): 275-284. [CrossRef]
  47. Heidari A A, Mirjalili S, Faris H, et al. Harris hawks optimization: Algorithm and applications[J]. Future generation computer systems, 2019, 97: 849-872. [CrossRef]
  48. Abualigah L, Diabat A, Mirjalili S, et al. The Arithmetic Optimization Algorithm[J]. Computer Methods in Applied Mechanics and Engineering, 2021, 376: 113609. [CrossRef]
  49. Guo S, Chen J, Lu Y, et al. Hydraulic piston pump in civil aircraft: Current status, future directions and critical technologies[J]. Chinese Journal of Aeronautics, 2020, 33(1): 16-30. [CrossRef]
  50. Chao Q, Xu Z, Tao J, et al. Capped piston: A promising design to reduce compressibility effects, pressure ripple and cavitation for high-speed and high-pressure axial piston pumps[J]. Alexandria Engineering Journal, 2023, 62: 509-521. [CrossRef]
  51. Chen Y, Zhang J, Xu B, et al. Multi-objective optimization of micron-scale surface textures for the cylinder/valve plate interface in axial piston pumps[J]. Tribology International, 2019, 138: 316-329. [CrossRef]
  52. Pan Y, Li Y, Liang D. The influence of dynamic swash plate vibration on outlet flow ripple in constant power variable-displacement piston pump[J]. Proceedings of the Institution of Mechanical Engineers, Part C: Journal of Mechanical Engineering Science, 2019, 233(14): 4914-4933. [CrossRef]
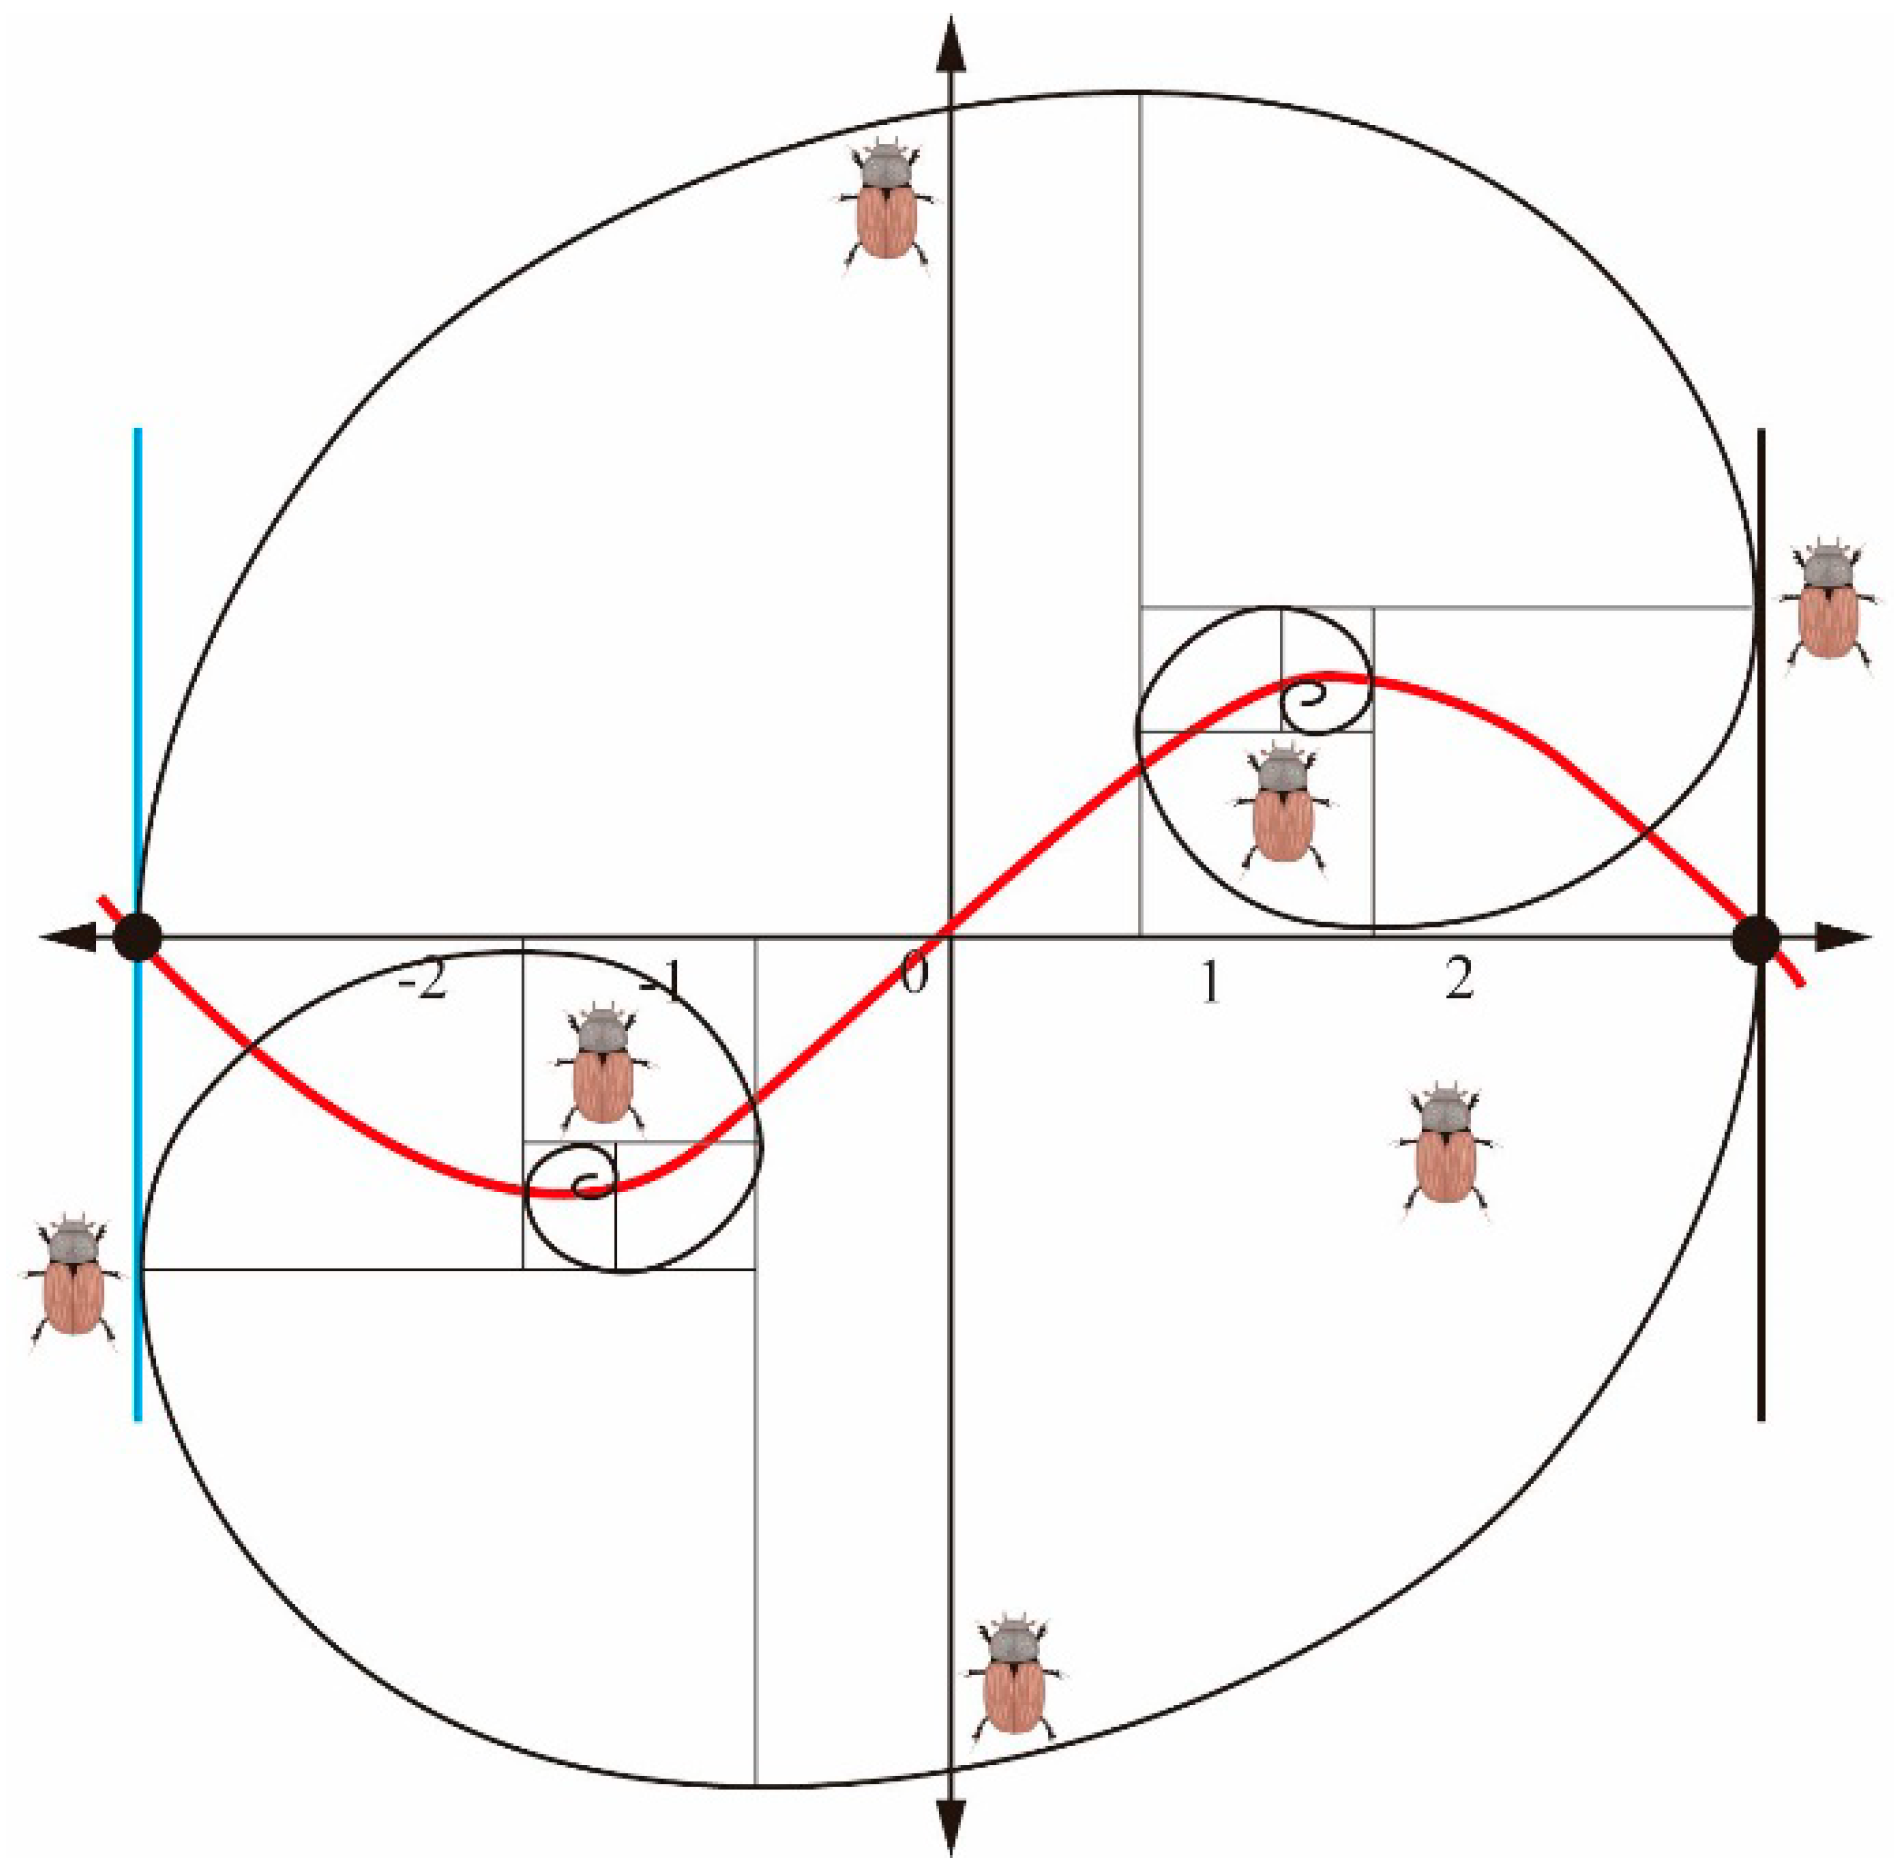
Figure 1. A comparison between a random generation method and a tent map chaotic mapping method.
Preprints 98319 g001
Figure 2. The process of renewal position of rolling behavior dung beetles.
Preprints 98319 g002
Figure 3. Levi’s flight and random wandering strategy simulation.
Preprints 98319 g003
Figure 4. Flow chart of the MSDBO algorithm.
Preprints 98319 g004
Figure 5. Average fitness curve of the benchmark function.
Preprints 98319 g005
Figure 6. Schematic diagram of the axial piston pump.
Preprints 98319 g006
Figure 7. Schematic diagram of axial piston pump motion.
Preprints 98319 g007
Figure 8. Schematic diagram of piston/cylinder pair leakage.
Preprints 98319 g008
Figure 9. Schematic diagram of slipper/swash plate pairs leakage.
Preprints 98319 g009
Figure 10. Schematic diagram of cylinder/valve plate pairs leakage.
Preprints 98319 g010
Figure 11. The schematic diagram of valve plate.
Preprints 98319 g011
Figure 12. Test rig used to measure the flow ripples.
Preprints 98319 g012
Figure 13. Comparisons of simulated and measured flow ripples.
Preprints 98319 g013
Figure 14. Pressure variation under different close angles.
Preprints 98319 g014
Figure 15. Pressure variation under different cross angles.
Preprints 98319 g015
Figure 16. Pressure variation under different open angles.
Preprints 98319 g016
Figure 17. Pressure variation of the piston chamber under different warp angles.
Preprints 98319 g017
Figure 18. Fitness value results.
Preprints 98319 g018
Figure 19. Comparison of initial and optimized cross-sectional areas.
Preprints 98319 g019
Figure 20. Results comparison between initial and optimized.
Preprints 98319 g020
Figure 21. Flow ripple rates under different discharge pressures.
Preprints 98319 g021
Table 1. Parameters of each algorithm.
Algorithm Parameters
PSO C1 = C2 = 1.8, ωmax = 0.95, ωmin = 0.6
GWO amax = 1.8, amin = 0.5
WOA b = 1.2
HHO P = 0.8, J ∈ [0,2]
SSA ST = 0.9, PD = 0.3, SD = 0.3
MSDBO K = λ = 0.1, b = 0.5, S=0.7
Table 2. Benchmark functions.
Name Functions Dimensionality Range Optimum value
F1 Preprints 98319 i017 30 [-100,100] 0
F2 Preprints 98319 i018 30 [-10,10] 0
F3 Preprints 98319 i019 30 [-100,100] 0
F4 Preprints 98319 i020 30 [-100,100] 0
F5 Preprints 98319 i021 30 [1.28,1.28] 0
F6 Preprints 98319 i022 30 [-500,500] -419n
F7 Preprints 98319 i023 30 [5.12,5.12] 0
F8 Preprints 98319 i024 30 [-32,32] 0
F9 Preprints 98319 i025 30 [-600,600] 0
F10 Preprints 98319 i026 2 [-5,5] 0.398
F11 Preprints 98319 i027 4 [-5,5] 0.000307
F12 Preprints 98319 i028 3 [0,1] -3.86
Table 3. Optimization search results of different intelligent algorithms.
Algorithm F1 F2
Best Mean Std Best Mean Std
PSO 1.234E+00 3.821E+00 2.109E+00 5.672E+00 6.327E+00 1.219E+00
GWO 2.568E-28 1.921E-26 2.334E-26 3.421E-17 1.295E-16 9.781E-17
WOA 1.793E-84 3.921E-72 1.498E-71 3.245E-57 3.796E-51 1.831E-50
HHO 1.962E-112 9.281E-90 6.553E-89 1.184E-59 4.762E-50 2.038E-49
SSA 3.827E-161 6.724E-54 4.276E-53 2.731E-52 8.294E-31 4.104E-30
MSDBO 0.000E+00 0.000E+00 0.000E+00 0.000E+00 0.000E+00 0.000E+00
Algorithm F3 F4
Best Mean Std Best Mean Std
PSO 2.543E+01 4.448E+02 1.977E+02 4.638E+00 6.024E+00 7.941E-01
GWO 9.549E-09 2.991E-05 7.416E-05 3.306E-07 2.178E-06 2.093E-06
WOA 5.223E+04 1.282E+05 3.942E+04 7.404E-01 1.489E+02 8.970E+01
HHO 9.276E-98 8.346E-74 4.236E-73 1.311E-56 4.614E-48 2.149E-47
SSA 0.000E+00 4.002E-27 2.244E-26 7.161E-83 5.424E-28 2.613E-27
MSDBO 0.000E+00 1.488E-176 0.000E+00 0.000E+00 0.000E+00 0.000E+00
Algorithm F5 F6
Best Mean Std Best Mean Std
PSO 4.086E+00 4.959E+01 3.918E+01 2.300E+03 1.759E+03 4.146E+02
GWO 5.766E-04 6.546E-03 3.513E-03 2.368E+03 1.833E+03 2.787E+02
WOA 5.421E-04 7.473E-03 9.186E-03 3.771E+03 3.195E+03 5.493E+02
HHO 1.646E-05 4.419E-04 4.890E-04 3.771E+03 3.759E+03 5.622E+01
SSA 1.267E-04 5.031E-03 4.179E-03 2.958E+03 2.538E+03 1.799E+02
MSDBO 8.136E-05 2.505E-03 1.601E-03 3.708E+03 3.081E+03 5.943E+02
Algorithm F7 F8
Best Mean Std Best Mean Std
PSO 2.708E+01 4.857E+01 1.106E+01 5.619E-01 8.193E-01 1.120E-01
GWO 0.000E+00 7.470E+00 1.104E+01 2.251E-13 3.000E-13 5.112E-14
WOA 0.000E+00 8.526E-15 5.394E-14 4.398E-14 1.332E-15 1.252E-14
HHO 0.000E+00 0.000E+00 0.000E+00 1.332E-15 1.332E-15 0.000E+00
SSA 0.000E+00 0.000E+00 0.000E+00 1.332E-15 1.332E-15 0.000E+00
MSDBO 0.000E+00 0.000E+00 0.000E+00 1.332E-15 1.332E-15 0.000E+00
Algorithm F9 F10
Best Mean Std Best Mean Std
PSO 1.632E-01 3.645E-01 1.330E-01 3.979E-01 3.979E-01 0.000E+00
GWO 0.000E+00 1.445E-02 2.182E-02 3.979E-01 3.979E-01 2.923E-06
WOA 0.000E+00 3.327E-02 1.277E-01 3.979E-01 3.979E-01 2.912E-05
HHO 0.000E+00 0.000E+00 0.000E+00 3.979E-01 3.979E-01 1.975E-05
SSA 0.000E+00 0.000E+00 0.000E+00 3.979E-01 3.979E-01 0.000E+00
MSDBO 0.000E+00 0.000E+00 0.000E+00 3.979E-01 3.979E-01 2.215E-05
Algorithm F11 F12
Best Mean Std Best Mean Std
PSO 2.011E-03 2.721E-03 3.327E-04 3.863E+00 3.863E+00 6.120E-15
GWO 9.225E-04 1.516E-02 2.509E-02 3.863E+00 3.862E+00 6.219E-03
WOA 9.396E-04 2.168E-03 1.359E-03 3.863E+00 3.853E+00 5.175E-02
HHO 9.261E-04 1.326E-03 1.013E-03 3.863E+00 3.858E+00 9.003E-03
SSA 9.225E-04 1.059E-03 4.731E-04 3.863E+00 3.863E+00 6.912E-15
MSDBO 9.225E-04 1.629E-03 1.002E-03 3.863E+00 3.858E+00 7.797E-03
Table 4. Wilcoxon signed rank test P-values.
Function PSO GWO WOA HHO SSA DBO
Preprints 98319 i029 2.012E-16 2.012E-16 2.012E-16 2.012E-16 2.012E-16 2.012E-16
Preprints 98319 i030 2.012E-16 2.012E-16 2.012E-16 2.012E-16 2.012E-16 2.012E-16
Preprints 98319 i031 5.476E-16 5.476E-16 5.476E-16 5.476E-16 5.476E-16 5.476E-16
Preprints 98319 i032 2.012E-16 2.012E-16 2.012E-16 2.012E-16 2.012E-16 2.012E-16
Preprints 98319 i033 1.462E-14 1.022E-08 1.408E-03 8.216E-11 6.509E-03 1.028E-01
Preprints 98319 i034 3.959E-13 1.447E-13 9.160E-02 7.529E-14 2.213E-04 1.692E-04
Preprints 98319 i035 2.012E-16 7.337E-16 3.378E-01 N/A N/A 8.376E-02
Preprints 98319 i036 2.012E-16 1.888E-16 1.965E-10 N/A N/A N/A
Preprints 98319 i037 2.012E-16 1.040E-04 8.376E-02 N/A N/A 3.378E-01
Preprints 98319 i038 2.012E-16 4.372E-07 1.689E-02 9.821E-03 2.012E-16 2.012E-16
Preprints 98319 i039 5.843E-09 3.492E-02 4.468E-03 2.877E-01 3.594E-11 1.342E-04
Preprints 98319 i040 2.012E-16 1.427E-06 1.665E-03 3.423E-01 2.012E-16 4.046E-05
W/L/E 12/0/0 12/0/0 9/3/0 7/2/3 9/0/3 8/3/1
Table 5. Parameters of the piston pump.
Parameter Valve
Volume modulus E 1.1×10⁹ Pa
Flow coefficient Cq 0.7
Fluid density ρ 875 kg/m3
Diameter of the piston d 18 mm
Radius of the pitch circle R 34 mm
Close angle φ0 14.9°
Rotational speed ω 178 rad/s
Dead volume V0s 0.74×10⁻⁵ m2
Swashplate angle γ???Width angle θ1 13°
Depth angle θ2 50°
Cross angle Δφ 15°
Warp angle φΔ
Disclaimer/Publisher’s Note: The statements, opinions and data contained in all publications are solely those of the individual author(s) and contributor(s) and not of MDPI and/or the editor(s). MDPI and/or the editor(s) disclaim responsibility for any injury to people or property resulting from any ideas, methods, instructions or products referred to in the content.
Copyright: This open access article is published under a Creative Commons CC BY 4.0 license, which permit the free download, distribution, and reuse, provided that the author and preprint are cited in any reuse.
Prerpints.org logo

Preprints.org is a free preprint server supported by MDPI in Basel, Switzerland.

Subscribe

© 2024 MDPI (Basel, Switzerland) unless otherwise stated