1. Introduction
The practice of mindfulness meditation is deeply rooted in Buddhist philosophy and is aimed at promoting greater awareness and non-judgmental observation of one's thoughts, emotions, and bodily sensations. This approach has been shown to have numerous benefits for mental and physical health, include reducing stress, improved attention and cognitive function, and increased emotional regulation. And the approach has become increasingly popular in secular settings, such as healthcare and education. However, there is a lack of understanding about the underlying neural mechanisms of these benefits.
Electroencephalography (EEG) is a non-invasive method for recording the electrical activity of the brain and can provide insight into the neural processes involved in mindfulness meditation practice. To gain insight into the underlying neural mechanisms underlying the mental and physical health benefits of mindfulness meditation, this proposal suggests using electroencephalography (EEG) to investigate the impact of a one-month consecutive vipassana mindfulness practice on beginner's physiological and neurological responses. The EEG signals would be analyzed to investigate changes in physiological and neurological responses, such as changes in brainwave activity, heart rate variability, and skin conductance.
In this study, we propose to use EEG to investigate the potential benefits of mindfulness practice. The study would contribute to the existing literature on mindfulness meditation by providing insights into the underlying neural mechanisms of vipassana meditation practice, and provide insights into how to improve mental and physical well-being assisted by EEG.
2. Methods
2.1. Research Design and Data Collection Approach
The study design includes the recruitment of participants, vipassana mindfulness practice, and EEG recordings. Inclusion criteria for participants will include age between 18 and 65 years old, no history of neurological or psychiatric disorders, and no prior experience with meditation practices. The recordings will last for 30 minutes, first 5 minutes for relax status, 20 minutes for meditation and the last 5 minutes for relax. A self-assessment report will be conducted immediately after the practice. EEG data analysis will include the measurement of theta, alpha and beta frequency, as well as other EEG parameters such as power spectral density and coherence.
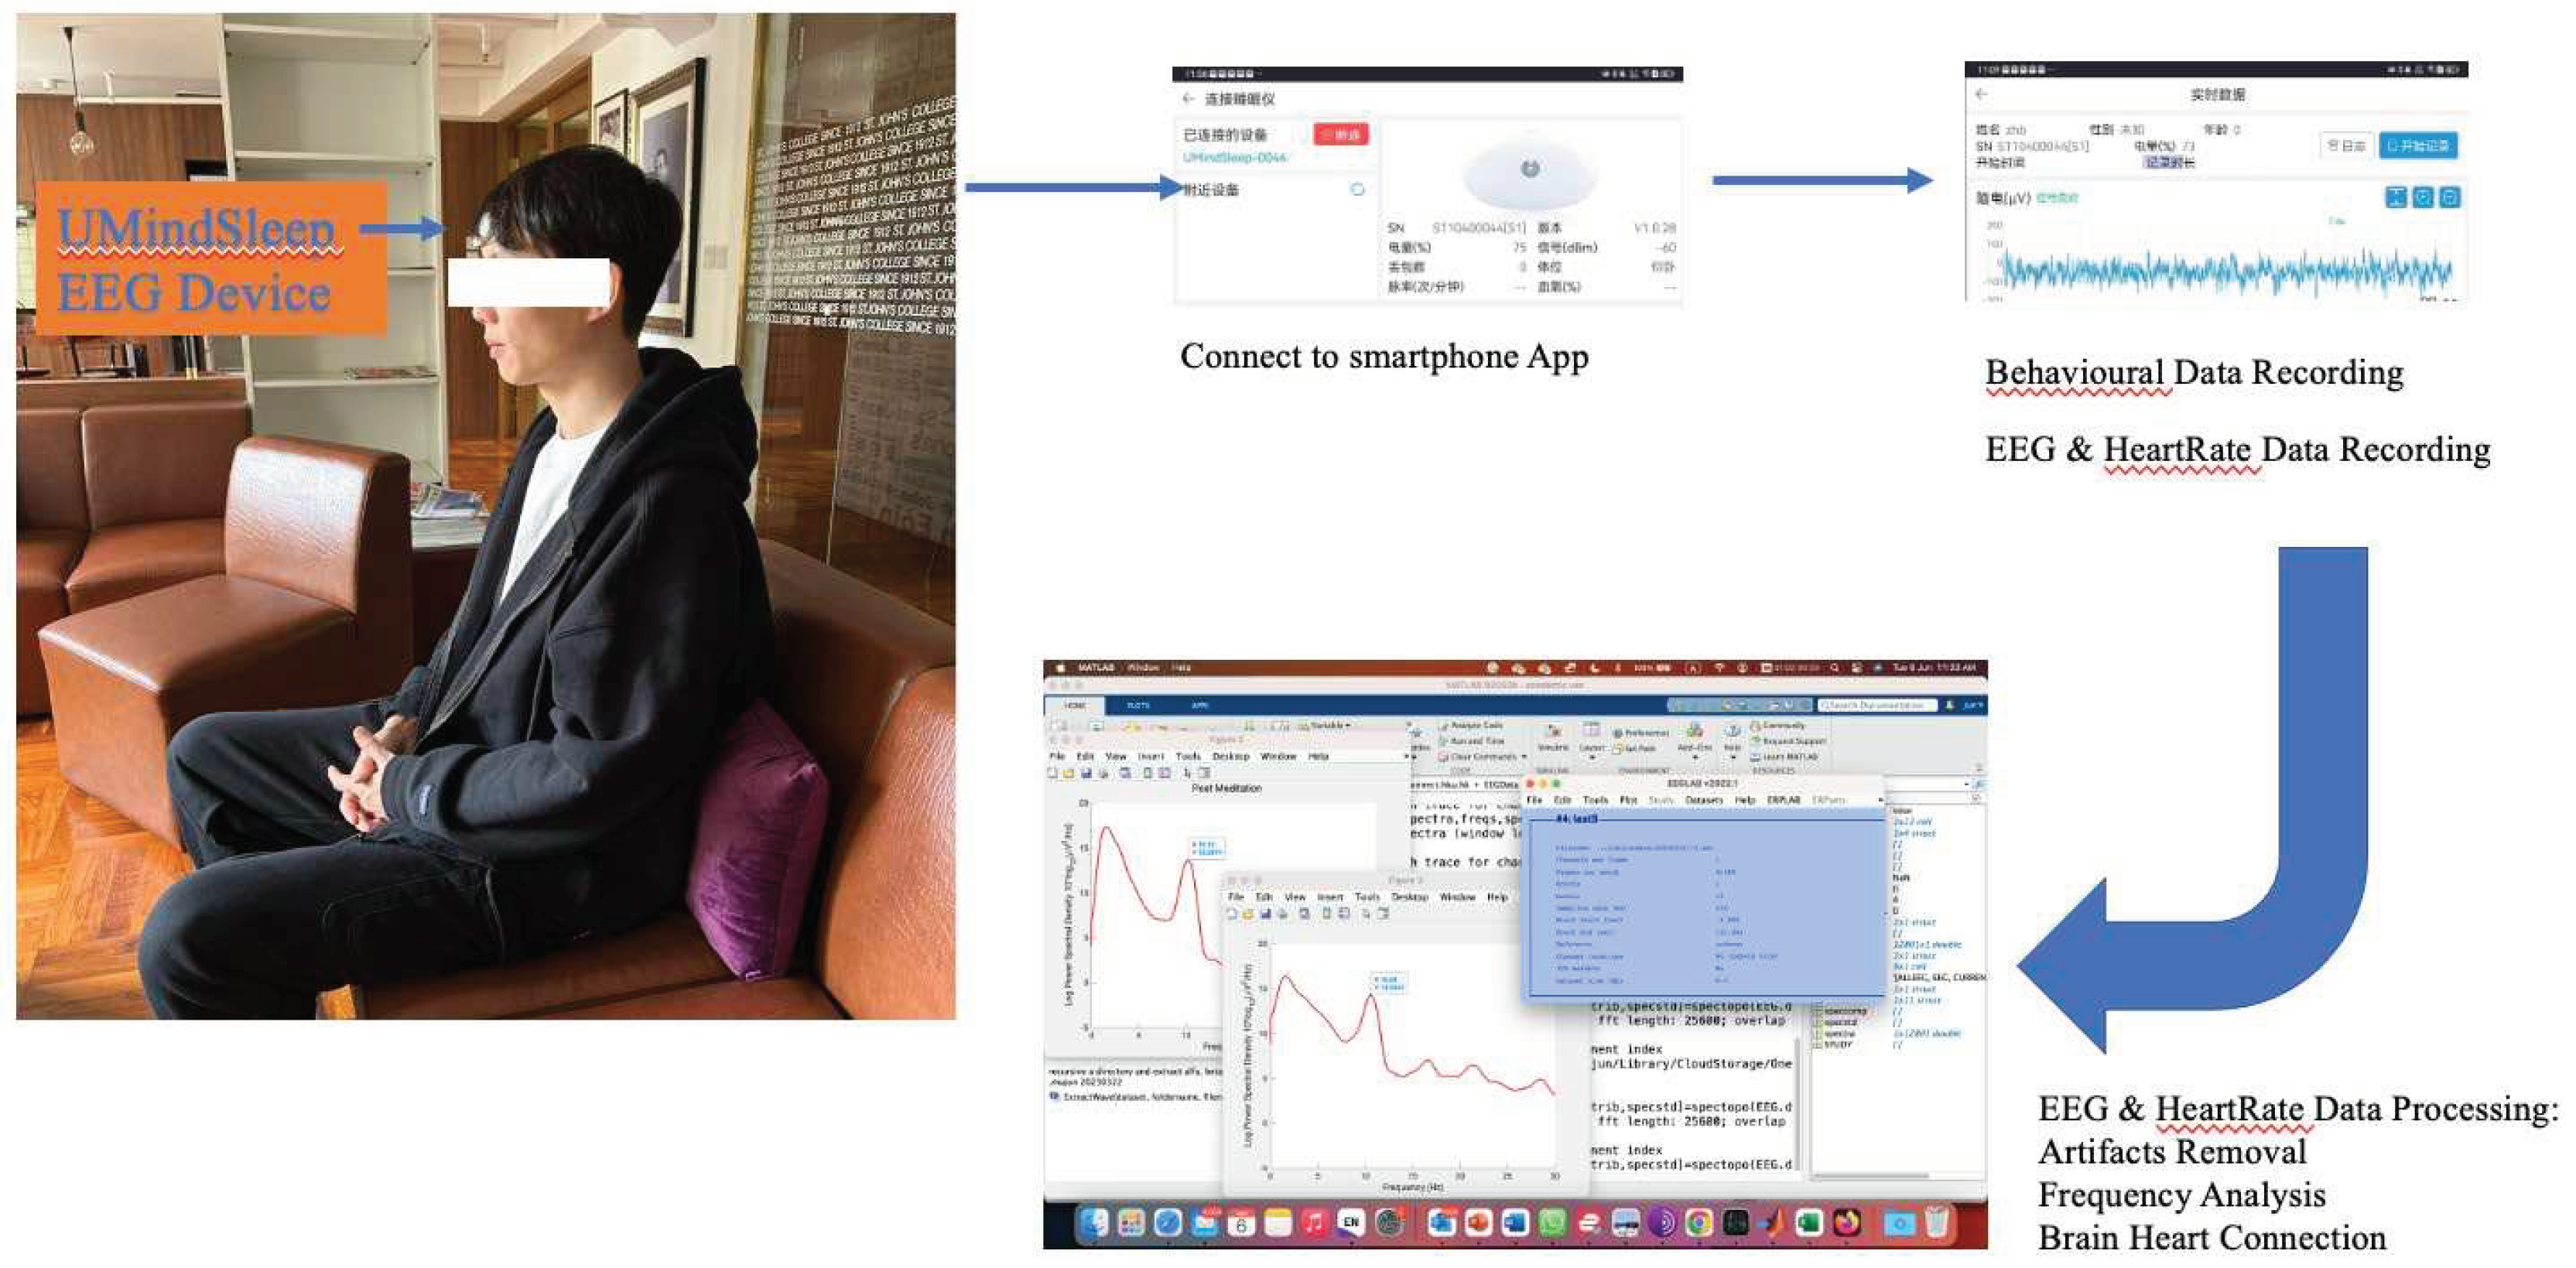
Figure 1.
Illustration of data collection and analysis process.
Figure 1.
Illustration of data collection and analysis process.
2.2. Offline EEG Data Processing
The data processing software used in this experiment was EEGLab V2022.1 based on Matlab R2002.b academic version running on MacBook Pro (1. 4GHZ intel Core I5, 8G 2133Mhz, MacOS Ventura 13.3.1. version (a). The first step is to store the extracted EEG data in the cloud to facilitate the import of the EDF file in EEGlab. A 47 Hz trap filter was used in the import data setup to reduce contamination caused by power line interference and the sampling rate was always kept at 256 Hz. The artefacts were then cleaned up, where major artefacts were manually removed from the interfering data, including head movements and eye movements. After data cleaning, the data should be manually cut and segmented into the first 5 minutes, 20 minutes and the last 5 minutes correspond to the three stages of Pre, meditation and post respectively. The frequency power in this experiment was defined as theta (0-5 Hz), alpha (9-11 Hz) and beta (20-25 Hz). It should be noted that in order to improve the accuracy of the alpha band, instead of using the more common 8-12 HZ, the narrow band 9-11 Hz was used in this experiment.
2.3. Null Hypothesis
Each meditation session is independent of the other, and multiple consecutive sessions with timely feedback will not help to improve brain health. Mindfulness practice will not help reduce feelings of depression and anxiety during the pandemic. As the number of meditation sessions increased there was no clear correlation with the peak frequency of alpha waves, peaks power, or physiological indicators such as heart rate. There was no correlation between the alpha, beta, and theta waves and other physiological parameters during the Pre, middle, and post stages of meditation.
2.4. Statistical Analysis
We would use IBM SPSS software (SPSS Inc., Chicago, Illinois, USA) test hypotheses or explore relationships between different variables, such as ANOVA, Pearson correction, etc. Meanwhile, we will we will also use T-value test to analyze the data. We will measure physiological and neurological responses at baseline, after four weeks of vipassana mindfulness practice. The repeated-measures ANOVA will be used to examine changes in brainwave activity (frequency and power of alpha, beta, and theta wave) and heart rate before, during and after meditation, and self-assessment report after meditation. Electroencephalography (EEG) will be used to measure brainwave activity, including the frequency and power of alpha, beta, and theta wave. We will also explore potential interactions between these parameters.
3. Results
3.1. Results of a Single EEG Recording Experiment
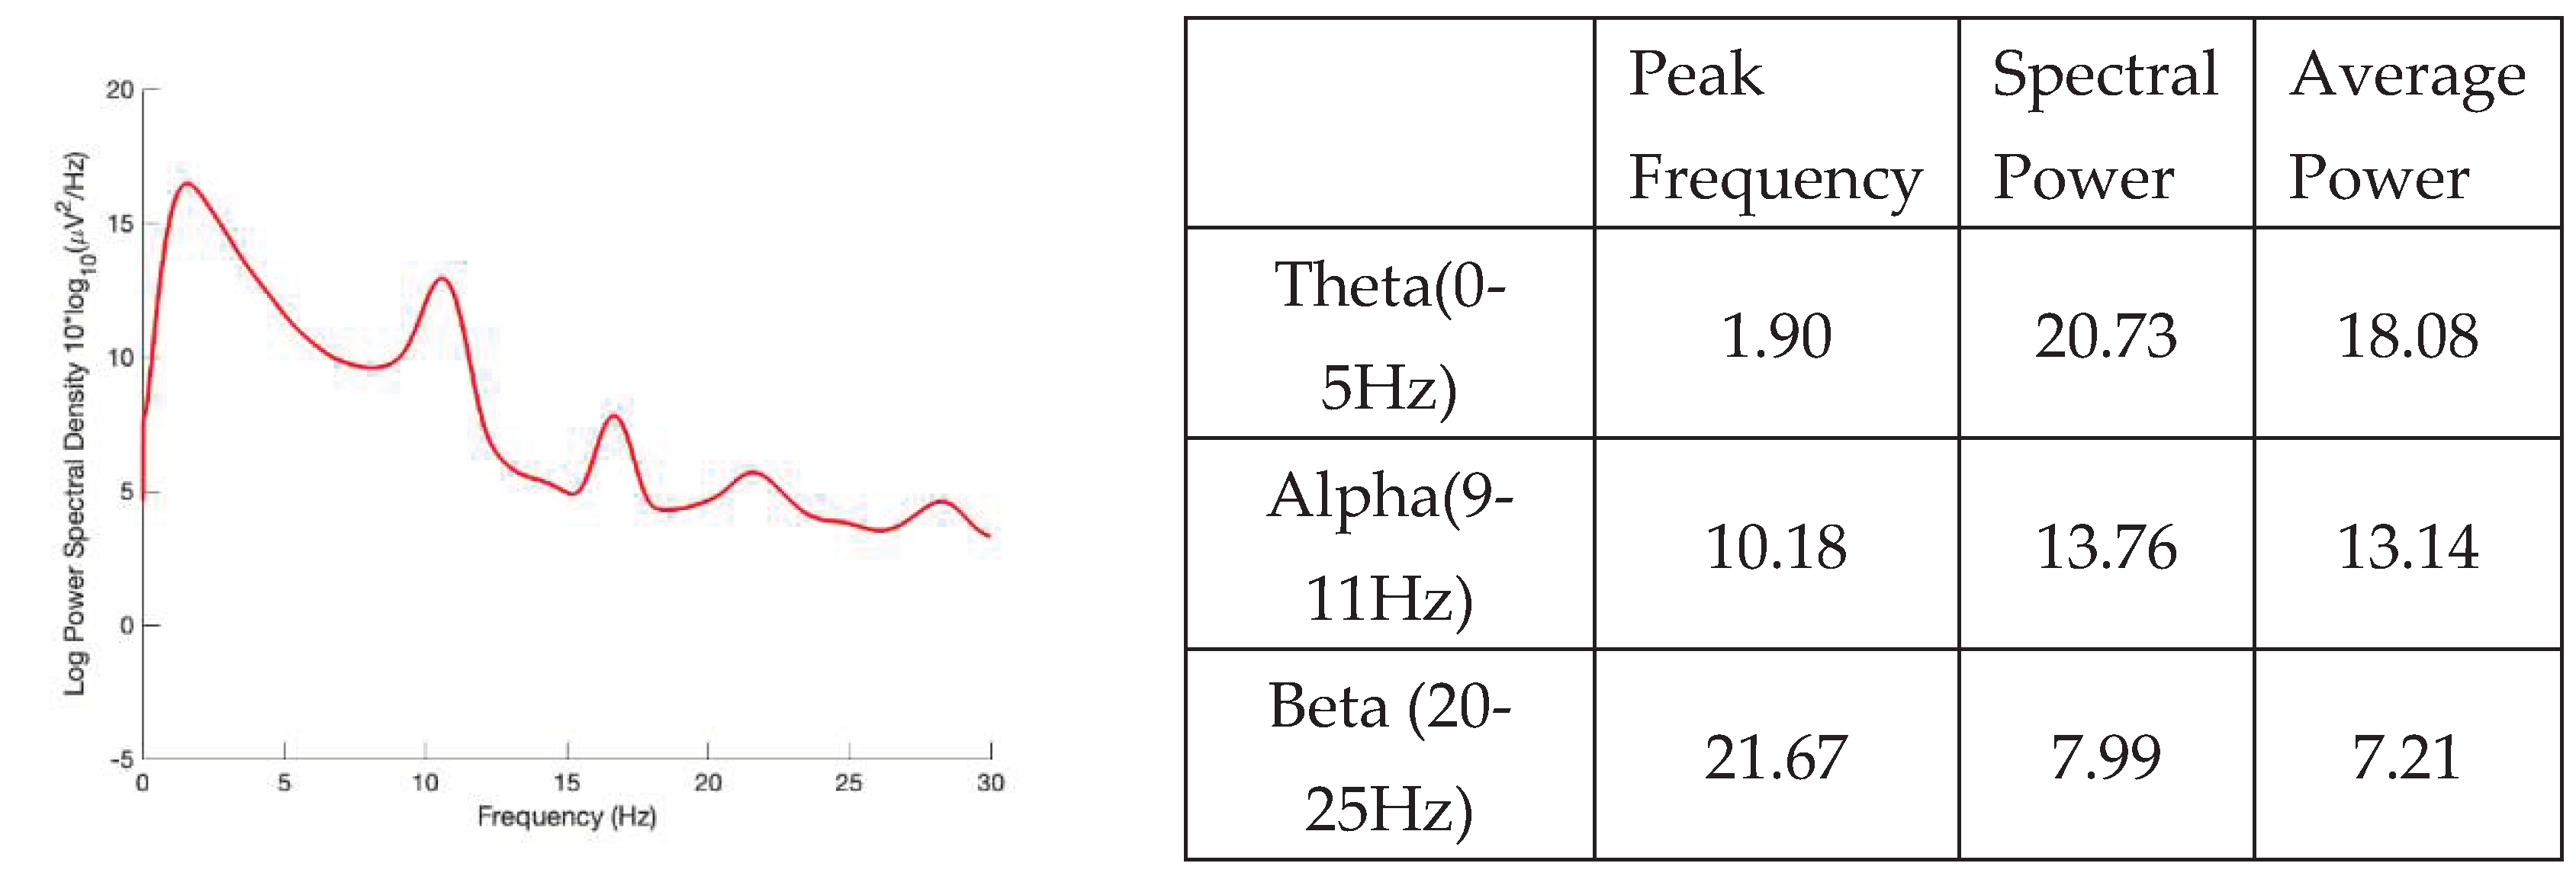
Figure 2,
Figure 3 and
Figure 4 are the results of the EEG recording experiment before, during and after meditation respectively. At the first 5 minutes before meditation, the peak frequency of theta, alpha, and beta wave is 1.9, 10.18, 21.67 respectively. The spectral power of theta, alpha, and beta wave is 20.73, 13.76, 7.99 respectively. And the average power of theta, alpha, and beta wave is 18.08, 13.14, 7.21 respectively. The first wave peak is the Theta wave, the second wave is the alpha wave, and the fourth wave is the Beta wave which can be seen from
Figure 2.
The peak frequency of theta, alpha, and beta wave is 1.58, 10.59, 21.58, the spectral power of theta, alpha, and beta wave is 16.48, 12.94, 5.71, and the average power of theta, alpha, and beta wave is 13.82, 11.73, 4.74 respectively, at the 20 minutes during meditation. Thus, the first wave peak is the Theta wave, the second wave is the alpha wave, and the fourth wave is the Beta wave in
Figure 3.
Meanwhile, the peak frequency of theta, alpha, and beta wave is 1.6, 10.58, 21.38, the spectral power of theta, alpha, and beta wave is 16.39, 14.25, 6.49, and the average power of theta, alpha, and beta wave is 14.33, 12.6, 5.28 respectively, at the last 5 minutes after meditation. Therefore, in
Figure 4, the Theta wave is also the first peak, the alpha wave is the second peak, and the Beta wave is the fourth peak.
Figure 2.
Power spectral density of brainwave at the first 5 minutes before meditation.
Figure 2.
Power spectral density of brainwave at the first 5 minutes before meditation.
Figure 3.
Power spectral density of brainwave at the 20 minutes during meditation.
Figure 3.
Power spectral density of brainwave at the 20 minutes during meditation.
Figure 4.
Power spectral density of brainwave at the last 5 minutes after meditation.
Figure 4.
Power spectral density of brainwave at the last 5 minutes after meditation.
3.2. The Change of Brain Wave Frequency and Brain Wave Power Before, During and After Meditation
3.2.1. The Change of Brain Wave Frequency Before, During and After Meditation
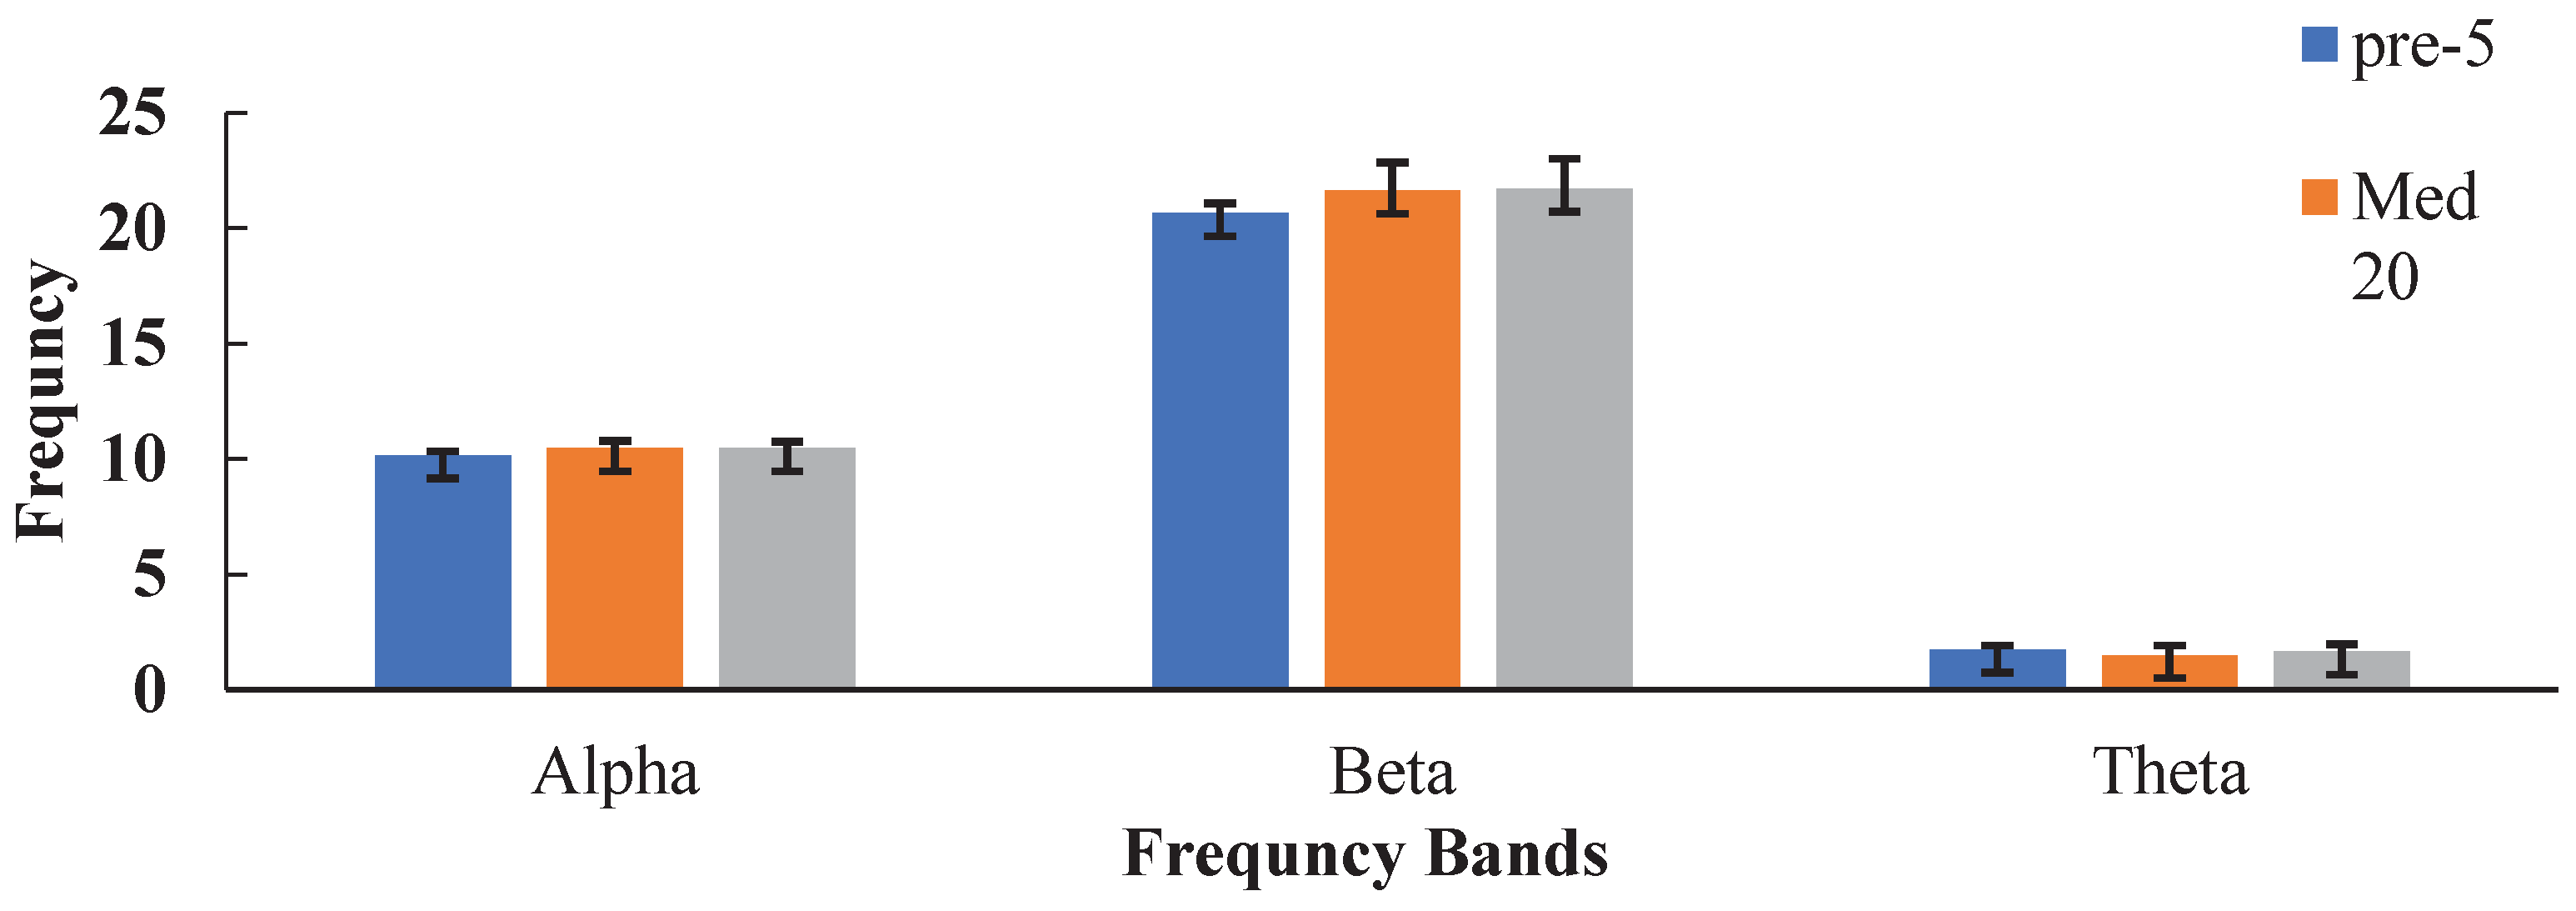
The different frequency of brain wave before, during and after meditation is shown in
Table 1 and
Figure 5. The results showed that the frequency of alpha-peak and beta-peak increased at the meditation time and post time. While, the frequency of theta-peak decreased at the meditation time, whereafter increased at the post time. In addition, we can obtain the significance of the frequency changes of each wave by the test and analysis of t-values of alpha, beta and theta waves before, during and after meditation, as shown in
Table 1. The frequency of alpha and beta waves changes significantly before and during meditation (t pre-med<0.05), as well as before and after meditation (t pre-post<0.05). The frequency of Theta waves changes significantly before and during meditation (t pre-med<0.05), as well as during and after meditation (t post-med<0.05).
3.2.2. The Change of Brain Wave Power Before, During and After Meditation
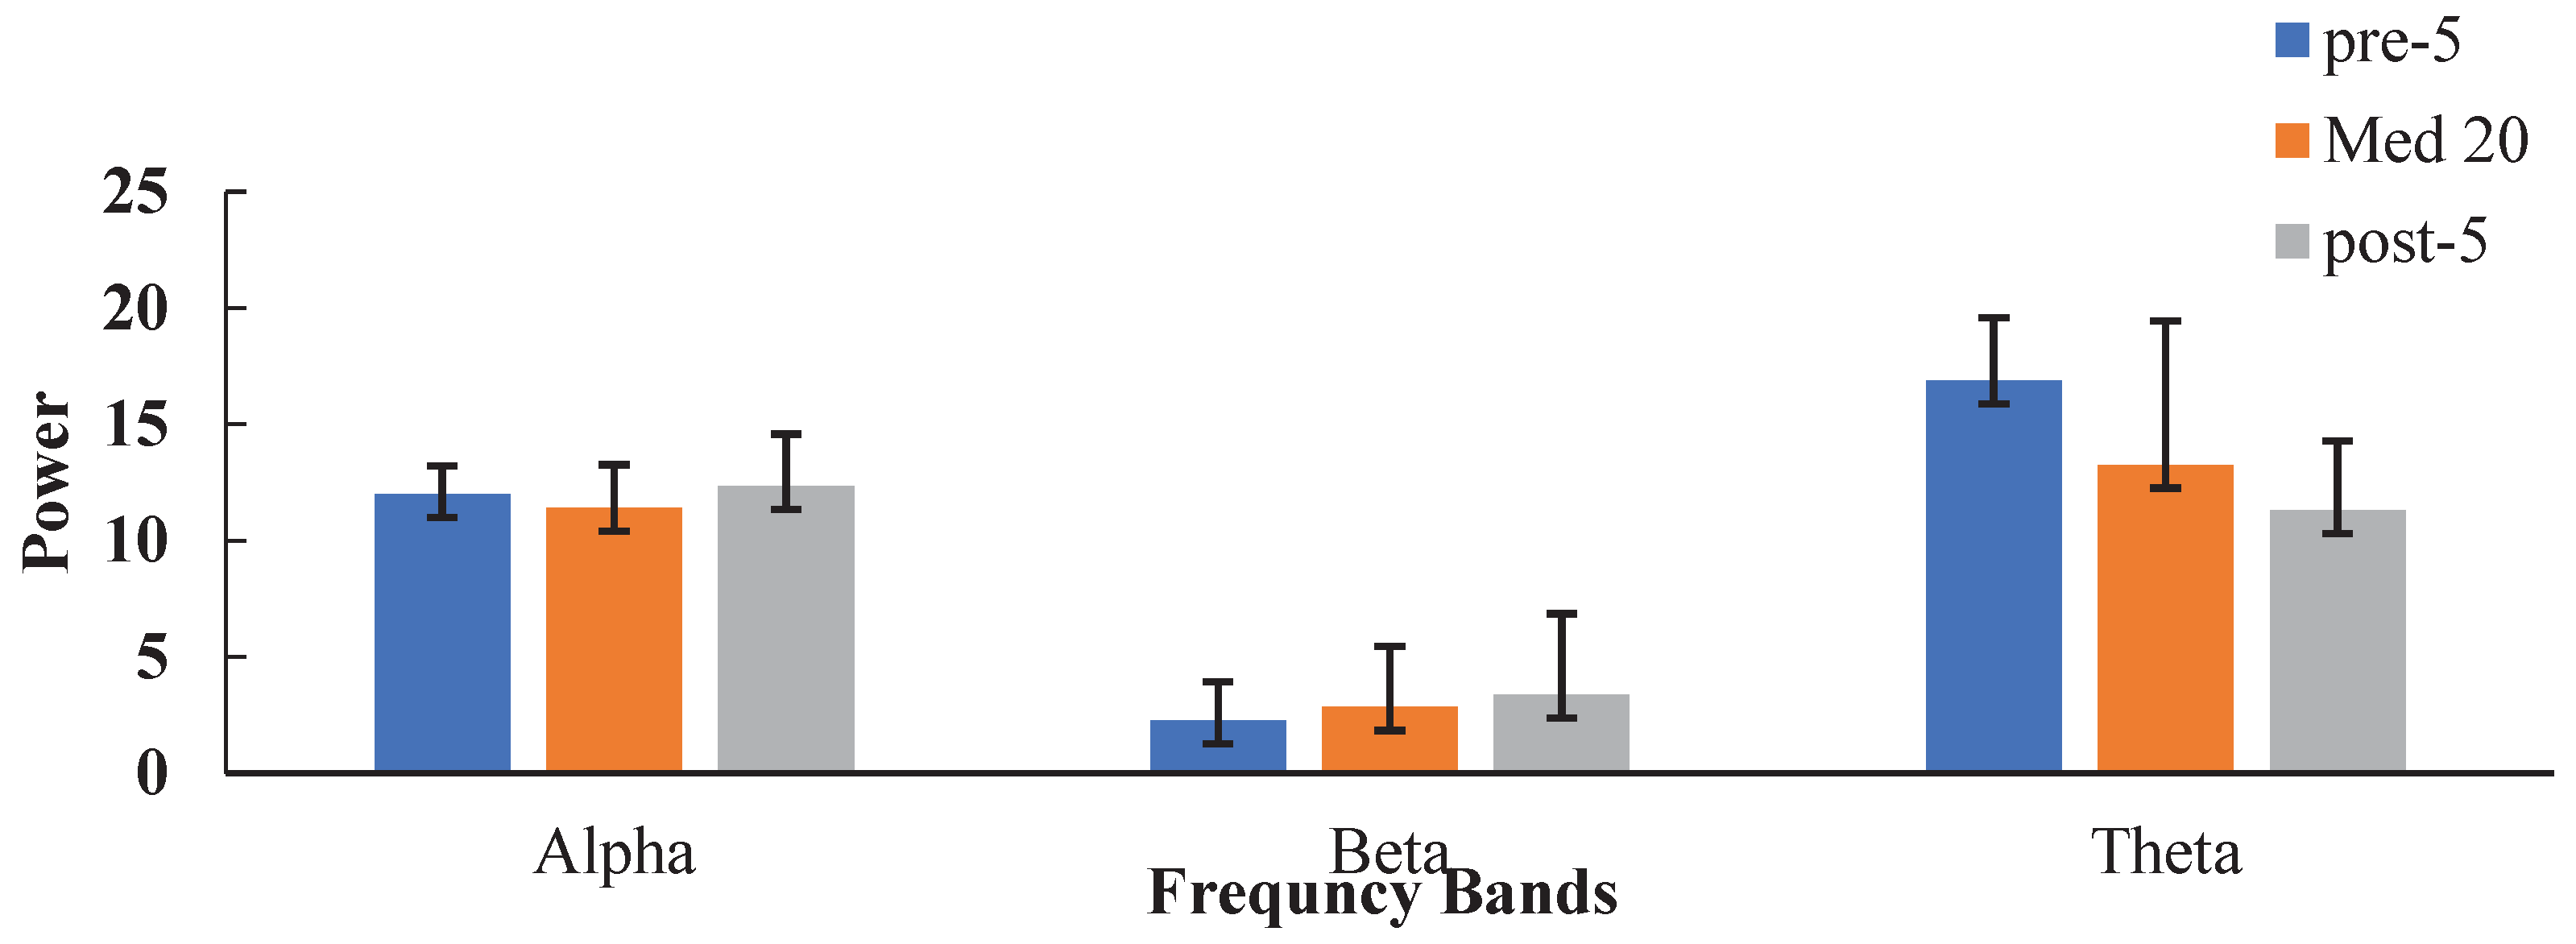
Table 2 and
Figure 6 shows the power of alpha wave first decreased and then increased, before, during and after meditation. The power of beta wave increased throughout the meditation period. However, the power of theta wave decreased throughout the meditation period. According to the data of t-value test in
Table 2, it can be concluded that the power of alpha wave changes significantly during and after meditation (t post-med<0.05). The power of theta waves changes significantly before and during meditation (t pre-med<0.05), as well as before and after meditation (t pre-post<0.05). Thus, through meditation, the power of the alpha and theta waves increases, and the power of the beta waves decreases.
3.3. The Change of Heart-Mean and Heart-Std at the Different States Before, During and After Meditation
The average of the 27 data tested before, during and after meditation is calculated by using EXCLE, and the t-value is calculated from the TTEST function in EXCLE to obtain the data in
Table 3. According to the data in
Table 3, the mean and standard deviation of heart rate decreased first and then increased, before, during and after meditation. We can conclude that the heart rate, theta-peak-frequency and alpha wave power showed the same change trend before, during and after meditation, from the
Table 3,
Figure 5 and
Figure 6.
3.4. Self-Assessment Report After Meditation
The Self-assessment report data (with a score of 1-9 for each index) shows that the scores of body-comfort (Mean-value:7.07), mind-comfort (Mean-value:7.22) and mindfulness breathing (Mean-value:6.37) are higher than the scores of body-movement (Mean-value:1.81), wandering-mind (Mean-value:3.3) and fall-asleep (Mean-value:2.07). We can tentatively assume that meditation contributes to the comfort of the body and mind, and positive to mindfulness breathing. Meanwhile, meditation may help reduce body movement and wandering thoughts.
3.5. SPSS Analysis
At the first 5 minutes before meditation, the time of meditation exercises was significantly negatively correlated with alpha wave frequency (p<0.05), beta wave (p<0.01) and theta wave power (p<0.05), respectively. Meanwhile, there was a significant positive correlation between heart rate and alpha wave frequency. The frequency and power of alpha and beta wave showed significant correlation, and the correlation coefficient of the frequency and power of alpha and beta wave was 0.40 and 0.65, respectively, indicating a positive correlation between them at the first 5 minutes before meditation. During the 20 minutes of meditation, the time of meditation exercises was significantly negatively correlated with beta wave (p<0.05) and theta wave power (p<0.01), during the 20 minutes of meditation. The alpha wave frequency is negatively correlated with the alpha wave power (p<0.05), beta wave power (p<0.01)and theta wave frequency (p<0.05), respectively. Alpha wave power is negatively correlated with beta wave frequency, but positively correlated with beta wave power. Meanwhile, the theta wave frequency is negatively correlated with beta wave frequency (p<0.05) and theta wave power (p<0.01).
The correlation between the time of meditation exercises and alpha wave frequency (p<0.05), and theta wave power (p<0.01) were significant negatively, at the last 5 minutes after meditation. Heart rate was positively correlated with the frequency and power of alpha wave, but negatively correlated with beta wave frequency. Meanwhile, the alpha wave frequency is positively correlated with the alpha wave power, but negatively correlated with the beta wave frequency. Moreover, the power of beta and theta wave showed significant correlation (p<0.05), and the correlation coefficient of beta and theta wave was 0.38, indicating a positive correlation between them, at the last 5 minutes after meditation.
4. Discussion
In this study, the EEG was used to record the data of the frequency and the power of brain waves and heart rate before, during and after meditation for 27 trials and we only use theta, alpha and beta bands. A notable result was that frequency spikes were negatively correlated with training days, both pre- and post-meditation. That is, as the number of training increases, even in just one month, the meditator's brain waves will change significantly, and it will be more and more able to flatten at a low frequency.
The changes of the frequency and the power of brain waves and heart rate before and after meditation were explored by taking the average value, and it was concluded that the frequency of alpha-peak and beta-peak increases before and after meditation, and the frequency of the theta-peak decreases at the meditation time, whereafter increased at the post time. The power of alpha wave decreases first and then increases, the power of beta wave increases, and the power of theta wave decreases, before and after meditation. Alpha waves are associated with a state of relaxation and calmness, while beta waves are associated with active cognitive processing and attention. The changes in the frequency and power of these waves may provide insight into the effects of vipassana mindfulness practice on cognitive and emotional regulation.
During meditation, the decrease of the power of alpha wave has been previously linked to various aspects of meditation practice. It has been proposed that the state of focused attention and present-moment awareness cultivated during meditation may lead to changes in neural oscillatory patterns. These changes, may including a decrease in the power of alpha wave, are thought to reflect a state of deep relaxation, heightened concentration, and enhanced cognitive flexibility [
1,
2]. This association suggests that regular and sustained engagement in mindfulness meditation may contribute to the modulation of alpha wave patterns, potentially leading to a more adaptive and efficient cognitive processing.
The T-value test showed that the power of Theta wave changed most significantly before and after meditation. This is consistent with previous studies showing that the power of Theta wave is the most sensitive index for loving-kindness meditation (LKM) training [
3]. The mean and standard deviation of heart rate decreased first and then increased, before, during and after meditation. We can find that the frequency of Theta wave, the power of alpha wave, and the heart rate change in the same trend before and after meditation.
The Pearson correlation analysis of the data of 27 trials by SPSS showed that the time of meditation exercises was significantly negatively correlated with alpha wave frequency before and after meditation, which suggests that increasing the frequency of meditation practice is helpful in reducing the alpha wave frequency. Meanwhile, the correlation between heart rate and alpha wave frequency was significant positively at the last 5 minutes after meditation. There was no significant correlation between heart rate and the power of beta and theta waves before and during meditation. This conclusion was inconsistent with the previous studies, such as the significant correlation between theta wave power and heart rate mentioned [
3], and theta wave power was positively correlated with meditation training experience during meditation [
4,
5]. Among the brain waves, there was a significant and positive correlation between the power of alpha and beta wave before and during meditation, and beta and theta wave power after meditation. In conclusion, although the changes of theta wave frequency, alpha wave power and heart rate showed the same trend before and after meditation, both decreased first and then increased, but there was no significant correlation between heart rate and the power of theta wave and alpha wave.
The physical and mental comfort is a key indicator for deeper meditation, according to traditional Buddhism meditation documents [
6]. We also conducted the pearson correlation analysis of these indexes in the self-assessment report. From the scores of the indexes in the 27 self-assessment reports, we can conclude that meditation is conducive to physical and mental comfort, and when the physical and mental comfort is high, the mindfulness breathing is better, and body-movement and wandering mind are less frequent.
5. Conclusions
The study provides insights into the underlying neurophysiological mechanisms of mindfulness meditation using wearable EEG devices. It demonstrates that in term of EEG measurement, spectrum frequency can be more sensitive than spectrum power, and heart rate variability as measured by SD is more sensitive than the mean. Furthermore, mindfulness meditation can regulate brain wave frequency, help us regulate our emotions and reduce stress, multiple consecutive meditations with timely feedback helps to improve brain health as evidenced by traits analysis, a significant reduction in peak frequency of alpha waves with increasing number of meditations as well as correlations with numerous other physiological indicators. Mindfulness meditation practice can cause changes in the frequency and power of brain waves, induces a more relaxed state, improves attention and cognitive processing, and enhances autonomic nervous system function [
7]. The findings support the idea that mindfulness meditation can induce a meditative state and improve cognitive and emotional regulation. Moreover, the proposed study contributes to the literature by using wearable EEG devices to collect data in a more accessible and convenient manner. The use of EEG recordings provides a more objective and detailed measure of the physiological and neurological changes induced by mindfulness meditation practice, which may facilitate a better understanding of the neural mechanisms underlying the benefits of mindfulness meditation.
Author Contributions
Method selection and data analysis, Jun Mu; thesis Supervision, Tony Chui and Hinhung Sik; writing—original draft preparation, Manli Zhong; writing—review and editing, Junling Gao. All authors have read and agreed to the published version of the manuscript.
References
- Baijal, S., & Srinivasan, N. Theta activity and meditative states: Spectral changes during concentrative meditation. Cognitive processing 2010, 11(1), 31-38.
- Cahn, B. R., & Polich, J. Meditation (Vipassana) and the P3a event-related brain potential. International Journal of Psychophysiology 2009, 72(1), 51-60.
- Wong, G., Sun, R., Adler, J., Yeung, K. W., Yu, S., & Gao, J. Loving-kindness meditation (LKM) modulates brain-heart connection: An EEG case study [Case Report]. Frontiers in Human Neuroscience 2022, 16.
- Harne, B. P., and Hiwale, A. S. EEG Spectral analysis on ommantra meditation: A pilot study. Appl. Psychophysiol 2018, 123–129.
- Nyhus, E., Engel, W. A., Pitfield, T. D., and Vakkur, I. M. W. Increases in theta oscillatory activity during episodic memory retrieval following mindfulness meditation training. Front. Hum. Neurosci 2019, 13.
- Nanamoli, B. The path of purification (Visuddhimagga) by Bhadantacariya Buddhaghosa. Kandy: Buddhist Publication Society 1991.
- Thayer, J. F., & Lane, R. D. Claude Bernard and the heart-brain connection: Further elaboration of a model of neurovisceral integration. Neuroscience & Biobehavioral Reviews 2009, 33(2), 81-88.
|
Disclaimer/Publisher’s Note: The statements, opinions and data contained in all publications are solely those of the individual author(s) and contributor(s) and not of MDPI and/or the editor(s). MDPI and/or the editor(s) disclaim responsibility for any injury to people or property resulting from any ideas, methods, instructions or products referred to in the content. |
© 2024 by the authors. Licensee MDPI, Basel, Switzerland. This article is an open access article distributed under the terms and conditions of the Creative Commons Attribution (CC BY) license (http://creativecommons.org/licenses/by/4.0/).


