Submitted:
06 February 2024
Posted:
06 February 2024
Read the latest preprint version here
Abstract
Keywords:
1. Introduction
2. Materials and Methods
2.1. The volcanic activity
2.2. Model and data assimilation descriptions
2.2.1. Flux adjusting surface data assimilation system (FASDAS)
2.2.2. Model scenarios configuration
3. Results
3.1. Impact of Data Assimilation on Meteorological Fields
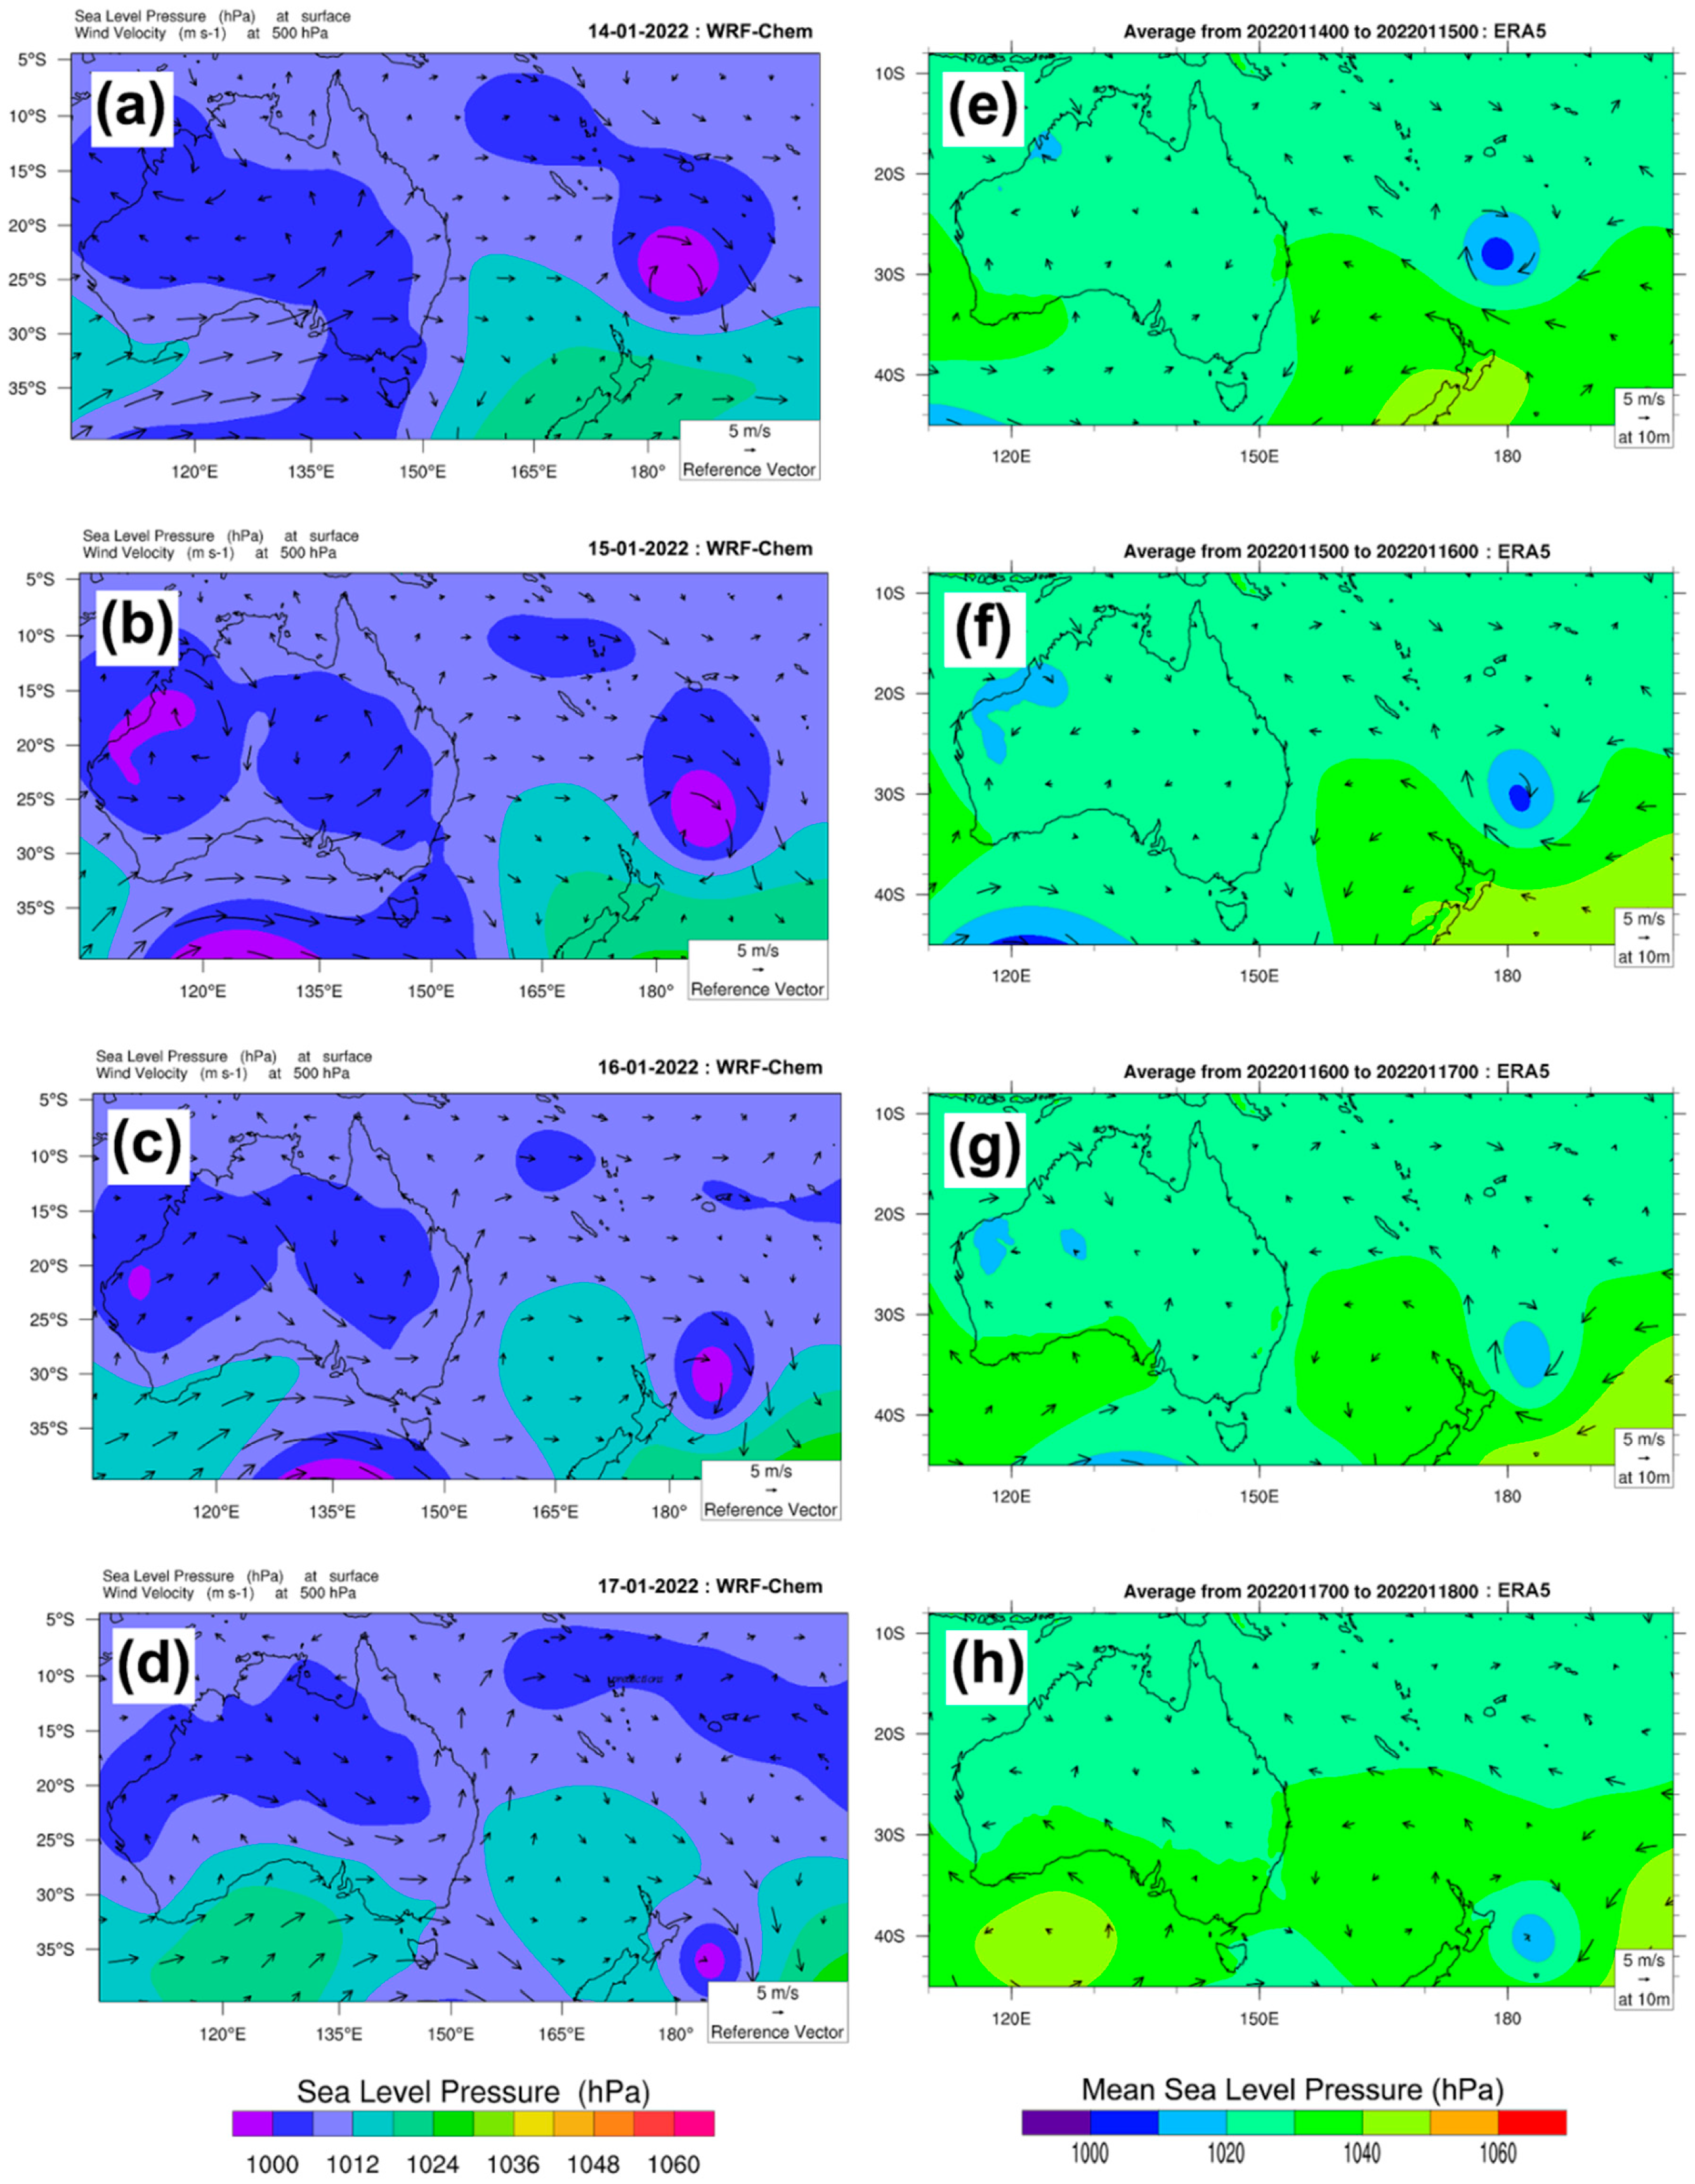
1.2. FASDAS effect on volcanic ash and concentrations
1.3. Analysis of Sulfur dioxides transport using TROPOMI/S5P
4. Discussion
5. Conclusions
Supplementary Materials
Author Contributions
Funding
Institutional Review Board Statement
Informed Consent Statement
Data Availability Statement
Acknowledgments
Conflicts of Interest
References
- Adam, D., 2022. Tonga volcano eruption created puzzling ripples in Earth’s atmosphere. Nature 601, 497. [CrossRef]
- Alapaty, K., Niyogi, D., Chen, F., Pyle, P., Chandrasekar, A., Seaman, N., 2008. Development of the Flux-Adjusting Surface Data Assimilation System for Mesoscale Models. J. Appl. Meteorol. Climatol. 47, 2331–2350. [CrossRef]
- Amores, A., Monserrat, S., Marcos, M., Argüeso, D., Villalonga, J., Jordà, G., Gomis, D., 2022. Numerical Simulation of Atmospheric Lamb Waves Generated by the 2022 Hunga-Tonga Volcanic Eruption. Geophys. Res. Lett. 49. [CrossRef]
- Astafyeva, E., Maletckii, B., Mikesell, T.D., Munaibari, E., Ravanelli, M., Coisson, P., Manta, F., Rolland, L., 2022. The 15 January 2022 Hunga Tonga Eruption History as Inferred From Ionospheric Observations. Geophys. Res. Lett. 49, e2022GL098827. [CrossRef]
- Briggs, M.S., Lesage, S., Schultz, C., Mailyan, B., Holzworth, R.H., 2022. A Terrestrial Gamma-Ray Flash From the 2022 Hunga Tonga–Hunga Ha’apai Volcanic Eruption. Geophys. Res. Lett. 49, e2022GL099660. [CrossRef]
- Bullock, O.R., Alapaty, K., Herwehe, J.A., Mallard, M.S., Otte, T.L., Gilliam, R.C., Nolte, C.G., 2014. An observation-based investigation of nudging in WRF for downscaling surface climate information to 12-km grid spacing. J. Appl. Meteorol. Climatol. 53, 20–33. [CrossRef]
- Burt, S., 2022. Multiple airwaves crossing Britain and Ireland following the eruption of Hunga Tonga–Hunga Ha’apai on 15 January 2022. Weather 77, 76–81. [CrossRef]
- Chen, F., Dudhia, J., 2001. Coupling an Advanced Land Surface–Hydrology Model with the Penn State–NCAR MM5 Modeling System. Part I: Model Implementation and Sensitivity. Mon. Weather Rev. 129, 569–585. [CrossRef]
- D’Arcangelo, S., Bonforte, A., Santis, A. De, Maugeri, S.R., Perrone, L., Soldani, M., Arena, G., Brogi, F., Calcara, M., Campuzano, S.A., Cianchini, G., Corpo, A. Del, Mauro, D. Di, Fidani, C., Ippolito, A., Lepidi, S., Marchetti, D., Nardi, A., Orlando, M., Piscini, A., Regi, M., Sabbagh, D., Zhima, Z., Yan, R., 2022. A Multi-Parametric and Multi-Layer Study to Investigate the Largest 2022 Hunga Tonga–Hunga Ha’apai Eruptions. Remote Sens. 2022, Vol. 14, Page 3649 14, 3649. [CrossRef]
- Díaz, J.S., Rigby, S.E., 2022. Energetic output of the 2022 Hunga Tonga–Hunga Ha‘apai volcanic eruption from pressure measurements. Shock Waves 32, 553–561. [CrossRef]
- Fast, J.D., Gustafson, W.I., Easter, R.C., Zaveri, R.A., Barnard, J.C., Chapman, E.G., Grell, G.A., Peckham, S.E., 2006. Evolution of ozone, particulates, and aerosol direct radiative forcing in the vicinity of Houston using a fully coupled meteorology-chemistry-aerosol model. J. Geophys. Res. Atmos. 111. [CrossRef]
- Gilliam, R.C., Herwehe, J.A., Bullock, O.R., Pleim, J.E., Ran, L., Campbell, P.C., Foroutan, H., 2021. Establishing the Suitability of the Model for Prediction Across Scales for Global Retrospective Air Quality Modeling. J. Geophys. Res. Atmos. 126, e2020JD033588. [CrossRef]
- Grell, G.A., Dévényi, D., 2002. A generalized approach to parameterizing convection combining ensemble and data assimilation techniques. Geophys. Res. Lett. 29, 38–1. [CrossRef]
- Grell, G.A., Peckham, S.E., Schmitz, R., McKeen, S.A., Frost, G., Skamarock, W.C., Eder, B., 2005. Fully coupled “online” chemistry within the WRF model. Atmos. Environ. 39, 6957–6975. [CrossRef]
- GVP, 2022. Global Volcanism Program | Report on Hunga Tonga-Hunga Ha’apai (Tonga) — 12 January- 18 January 2022 [WWW Document]. URL https://volcano.si.edu/showreport.cfm?doi=GVP.WVAR20220112-243040 (accessed 2.1.22).
- Harrison, G., 2022. Pressure anomalies from the January 2022 Hunga Tonga-Hunga Ha’apai eruption. Weather 77, 87–90. [CrossRef]
- Hatheway, W., Snoun, H., ur Rehman, H. et al. WRF-MOSIT: a modular and cross-platform tool for configuring and installing the WRF model. Earth Sci Inform 16, 4327–4336 (2023). [CrossRef]
- He, J., Glotfelty, T., Yahya, K., Alapaty, K., Yu, S., 2017. Does temperature nudging overwhelm aerosol radiative effects in regional integrated climate models? Atmos. Environ. 154, 42–52. [CrossRef]
- Hirtl, M., Stuefer, M., Arnold, D., Grell, G., Maurer, C., Natali, S., Scherllin-Pirscher, B., Webley, P., 2019. The effects of simulating volcanic aerosol radiative feedbacks with WRF-Chem during the Eyjafjallajökull eruption, April and May 2010. Atmos. Environ. 198, 194–206. [CrossRef]
- Hong, S.-Y., Noh, Y., Dudhia, J., 2006. A new vertical diffusion package with an explicit treatment of entrainment processes. Mon. Weather Rev. 134, 2318–2341. [CrossRef]
- Iacono, M.J., Delamere, J.S., Mlawer, E.J., Shephard, M.W., Clough, S.A., Collins, W.D., 2008. Radiative forcing by long-lived greenhouse gases: Calculations with the AER radiative transfer models. J. Geophys. Res. Atmos. 113, 13103. [CrossRef]
- Jiménez, P. a., Dudhia, J., González-Rouco, J.F., Navarro, J., Montávez, J.P., García-Bustamante, E., 2012. A Revised Scheme for the WRF Surface Layer Formulation. Mon. Weather Rev. 140, 898–918. [CrossRef]
- Kloss, C., Sellitto, P., Renard, J.B., Baron, A., Bègue, N., Legras, B., Berthet, G., Briaud, E., Carboni, E., Duchamp, C., Duflot, V., Jacquet, P., Marquestaut, N., Metzger, J.M., Payen, G., Ranaivombola, M., Roberts, T., Siddans, R., Jégou, F., 2022. Aerosol Characterization of the Stratospheric Plume From the Volcanic Eruption at Hunga Tonga 15 January 2022. Geophys. Res. Lett. 49, e2022GL099394. [CrossRef]
- Kremser, S., Thomason, L.W., von Hobe, M., Hermann, M., Deshler, T., Timmreck, C., Toohey, M., Stenke, A., Schwarz, J.P., Weigel, R., Fueglistaler, S., Prata, F.J., Vernier, J.P., Schlager, H., Barnes, J.E., Antuña-Marrero, J.C., Fairlie, D., Palm, M., Mahieu, E., Notholt, J., Rex, M., Bingen, C., Vanhellemont, F., Bourassa, A., Plane, J.M.C., Klocke, D., Carn, S.A., Clarisse, L., Trickl, T., Neely, R., James, A.D., Rieger, L., Wilson, J.C., Meland, B., 2016. Stratospheric aerosol—Observations, processes, and impact on climate. Rev. Geophys. 54, 278–335. [CrossRef]
- Legras, B., Duchamp, C., Sellitto, P., Podglajen, A., Carboni, E., Siddans, R., Grooß, J.-U., Khaykin, S., Ploeger, F., 2022. The evolution and dynamics of the Hunga Tonga–Hunga Ha’apai sulfate aerosol plume in the stratosphere. Atmos. Chem. Phys. 22, 14957–14970. [CrossRef]
- Li, X., Choi, Y., Czader, B., Roy, A., Kim, H., Lefer, B., Pan, S., 2016. The impact of observation nudging on simulated meteorology and ozone concentrations during DISCOVER-AQ 2013 Texas campaign. Atmos. Chem. Phys. 16, 3127–3144. [CrossRef]
- Lin, J.T., Rajesh, P.K., Lin, C.C.H., Chou, M.Y., Liu, J.Y., Yue, J., Hsiao, T.Y., Tsai, H.F., Chao, H.M., Kung, M.M., 2022. Rapid Conjugate Appearance of the Giant Ionospheric Lamb Wave Signatures in the Northern Hemisphere After Hunga-Tonga Volcano Eruptions. Geophys. Res. Lett. 49, e2022GL098222. [CrossRef]
- Millán, L., Santee, M.L., Lambert, A., Livesey, N.J., Werner, F., Schwartz, M.J., Pumphrey, H.C., Manney, G.L., Wang, Y., Su, H., Wu, L., Read, W.G., Froidevaux, L., 2022. The Hunga Tonga-Hunga Ha’apai Hydration of the Stratosphere. Geophys. Res. Lett. 49, e2022GL099381. [CrossRef]
- Morrison, H., Thompson, G., Tatarskii, V., 2009. Impact of Cloud Microphysics on the Development of Trailing Stratiform Precipitation in a Simulated Squall Line: Comparison of One- and Two-Moment Schemes. Mon. Weather Rev. 137, 991–1007. [CrossRef]
- Nikfal, A., 2023. PostWRF: Interactive tools for the visualization of the WRF and ERA5 model outputs. Environ. Model. Softw. 160, 105591. [CrossRef]
- Osuri, K.K., Nadimpalli, R., Ankur, K., Nayak, H.P., Mohanty, U.C., Das, A.K., Niyogi, D., 2020. Improved Simulation of Monsoon Depressions and Heavy Rains From Direct and Indirect Initialization of Soil Moisture Over India. J. Geophys. Res. Atmos. 125, e2020JD032400. [CrossRef]
- Park, S.H., Skamarock, W.C., Klemp, J.B., Fowler, L.D., Duda, M.G., 2013. Evaluation of global atmospheric solvers using extensions of the jablonowski and williamson baroclinic wave test case. Mon. Weather Rev. [CrossRef]
- Proud, S.R., Prata, A.T., Schmauß, S., 2022. The January 2022 eruption of Hunga Tonga-Hunga Ha’apai volcano reached the mesosphere. Science (80-. ). 378, 554–557. [CrossRef]
- Reen, B.P., 2015. Improving Weather Research and Forecasting Model Initial Conditions via Surface Pressure Analysis [WWW Document]. URL https://apps.dtic.mil/sti/citations/ADA621305 (accessed 12.20.22).
- Reen, B.P., Dumais, R.E., Passner, J.E., 2016. Mitigating Excessive Drying from the Use of Observations in Mesoscale Modeling. J. Appl. Meteorol. Climatol. 55, 365–388. [CrossRef]
- Robock, A., 2000. Volcanic eruptions and climate. Rev. Geophys. 38, 191–219. [CrossRef]
- Schoeberl, M.R., Wang, Y., Ueyama, R., Taha, G., Jensen, E., Yu, W., 2022. Analysis and Impact of the Hunga Tonga-Hunga Ha’apai Stratospheric Water Vapor Plume. Geophys. Res. Lett. 49, e2022GL100248. [CrossRef]
- Sellitto, P., Podglajen, A., Belhadji, R., Boichu, M., Carboni, E., Cuesta, J., Duchamp, C., Kloss, C., Siddans, R., Bègue, N., Blarel, L., Jegou, F., Khaykin, S., Renard, J.-B., Legras, B., 2022. The unexpected radiative impact of the Hunga Tonga eruption of 15th January 2022. Commun. Earth Environ. 2022 31 3, 1–10. [CrossRef]
- Snoun, H., Bellakhal, G., Kanfoudi, H., Zhang, X., Chahed, J., 2019b. One-way coupling of WRF with a Gaussian dispersion model: a focused fine-scale air pollution assessment on southern Mediterranean. Environ. Sci. Pollut. Res. 26, 22892–22906. [CrossRef]
- Snoun, H., Kanfoudi, H., Bellakhal, G., Chahed, J., 2021. Hazardous Materials Prediction Using an Artificial Neural Network and Meteorological FASDAS Data Assimilation. Environ. Sci. Eng. 2045–2049. [CrossRef]
- Snoun, H., Kanfoudi, H., Bellakhal, G., Chahed, J., 2019a. Validation and sensitivity analysis of the WRF mesoscale model PBL schemes over Tunisia using dynamical downscaling approach. Euro-Mediterranean J. Environ. Integr. 4, 1–10. [CrossRef]
- Stauffer, D.R., Seaman, N.L., 1994. Multiscale four-dimensional data assimilation. J. Appl. Meteorol. [CrossRef]
- Stauffer, D.R., Seaman, N.L., 1990. Use of four-dimensional data assimilation in a limited-area mesoscale model. Part I: experiments with synoptic-scale data. Mon. Weather Rev. 118, 1250–1277. [CrossRef]
- Stuefer, M., Freitas, S.R., Grell, G., Webley, P., Peckham, S., McKeen, S.A., Egan, S.D., 2013. Inclusion of ash and SO<sub>2</sub> emissions from volcanic eruptions in WRF-Chem: development and some applications. Geosci. Model Dev. 6, 457–468. [CrossRef]
- Taha, G., Loughman, R., Colarco, P.R., Zhu, T., Thomason, L.W., Jaross, G., 2022. Tracking the 2022 Hunga Tonga-Hunga Ha’apai Aerosol Cloud in the Upper and Middle Stratosphere Using Space-Based Observations. Geophys. Res. Lett. 49, e2022GL100091. [CrossRef]
- Tong, P., Zhang, Q., Lin, H., Jian, X., Wang, X., 2020. Simulation of the impact of the emergency control measures on the reduction of air pollutants: a case study of APEC blue. Environ. Monit. Assess. 2020 1922 192, 1–11. [CrossRef]
- Xu, J., Li, D., Bai, Z., Tao, M., Bian, J., 2022. Large Amounts of Water Vapor Were Injected into the Stratosphere by the Hunga Tonga–Hunga Ha’apai Volcano Eruption. Atmos. 2022, Vol. 13, Page 912 13, 912. [CrossRef]
- Yahya, K., Wang, K., Gudoshava, M., Glotfelty, T., Zhang, Y., 2015. Application of WRF/Chem over North America under the AQMEII Phase 2: Part I. Comprehensive evaluation of 2006 simulation. Atmos. Environ. 115, 733–755. [CrossRef]
- Yuen, D.A., Scruggs, M.A., Spera, F.J., Zheng, Y., Hu, H., McNutt, S.R., Thompson, G., Mandli, K., Keller, B.R., Wei, S.S., Peng, Z., Zhou, Z., Mulargia, F., Tanioka, Y., 2022. Under the surface: Pressure-induced planetary-scale waves, volcanic lightning, and gaseous clouds caused by the submarine eruption of Hunga Tonga-Hunga Ha’apai volcano. Earthq. Res. Adv. 2, 100134. [CrossRef]
- Zhang, B., Wang, Y., Hao, J., 2015. Simulating aerosol-radiation-cloud feedbacks on meteorology and air quality over eastern China under severe haze conditionsin winter. Atmos. Chem. Phys. 15, 2387–2404. [CrossRef]
- Zhu, Y., Bardeen, C.G., Tilmes, S., Mills, M.J., Wang, X., Harvey, V.L., Taha, G., Kinnison, D., Portmann, R.W., Yu, P., Rosenlof, K.H., Avery, M., Kloss, C., Li, C., Glanville, A.S., Millán, L., Deshler, T., Krotkov, N., Toon, O.B., 2022. Perturbations in stratospheric aerosol evolution due to the water-rich plume of the 2022 Hunga-Tonga eruption. Commun. Earth Environ. 2022 31 3, 1–7. [CrossRef]
- Zuo, M., Zhou, T., Man, W., Chen, X., Liu, J., Liu, F., Gao, C., 2022. Volcanoes and Climate: Sizing up the Impact of the Recent Hunga Tonga-Hunga Ha’apai Volcanic Eruption from a Historical Perspective. Adv. Atmos. Sci. 39, 1986–1993. [CrossRef]

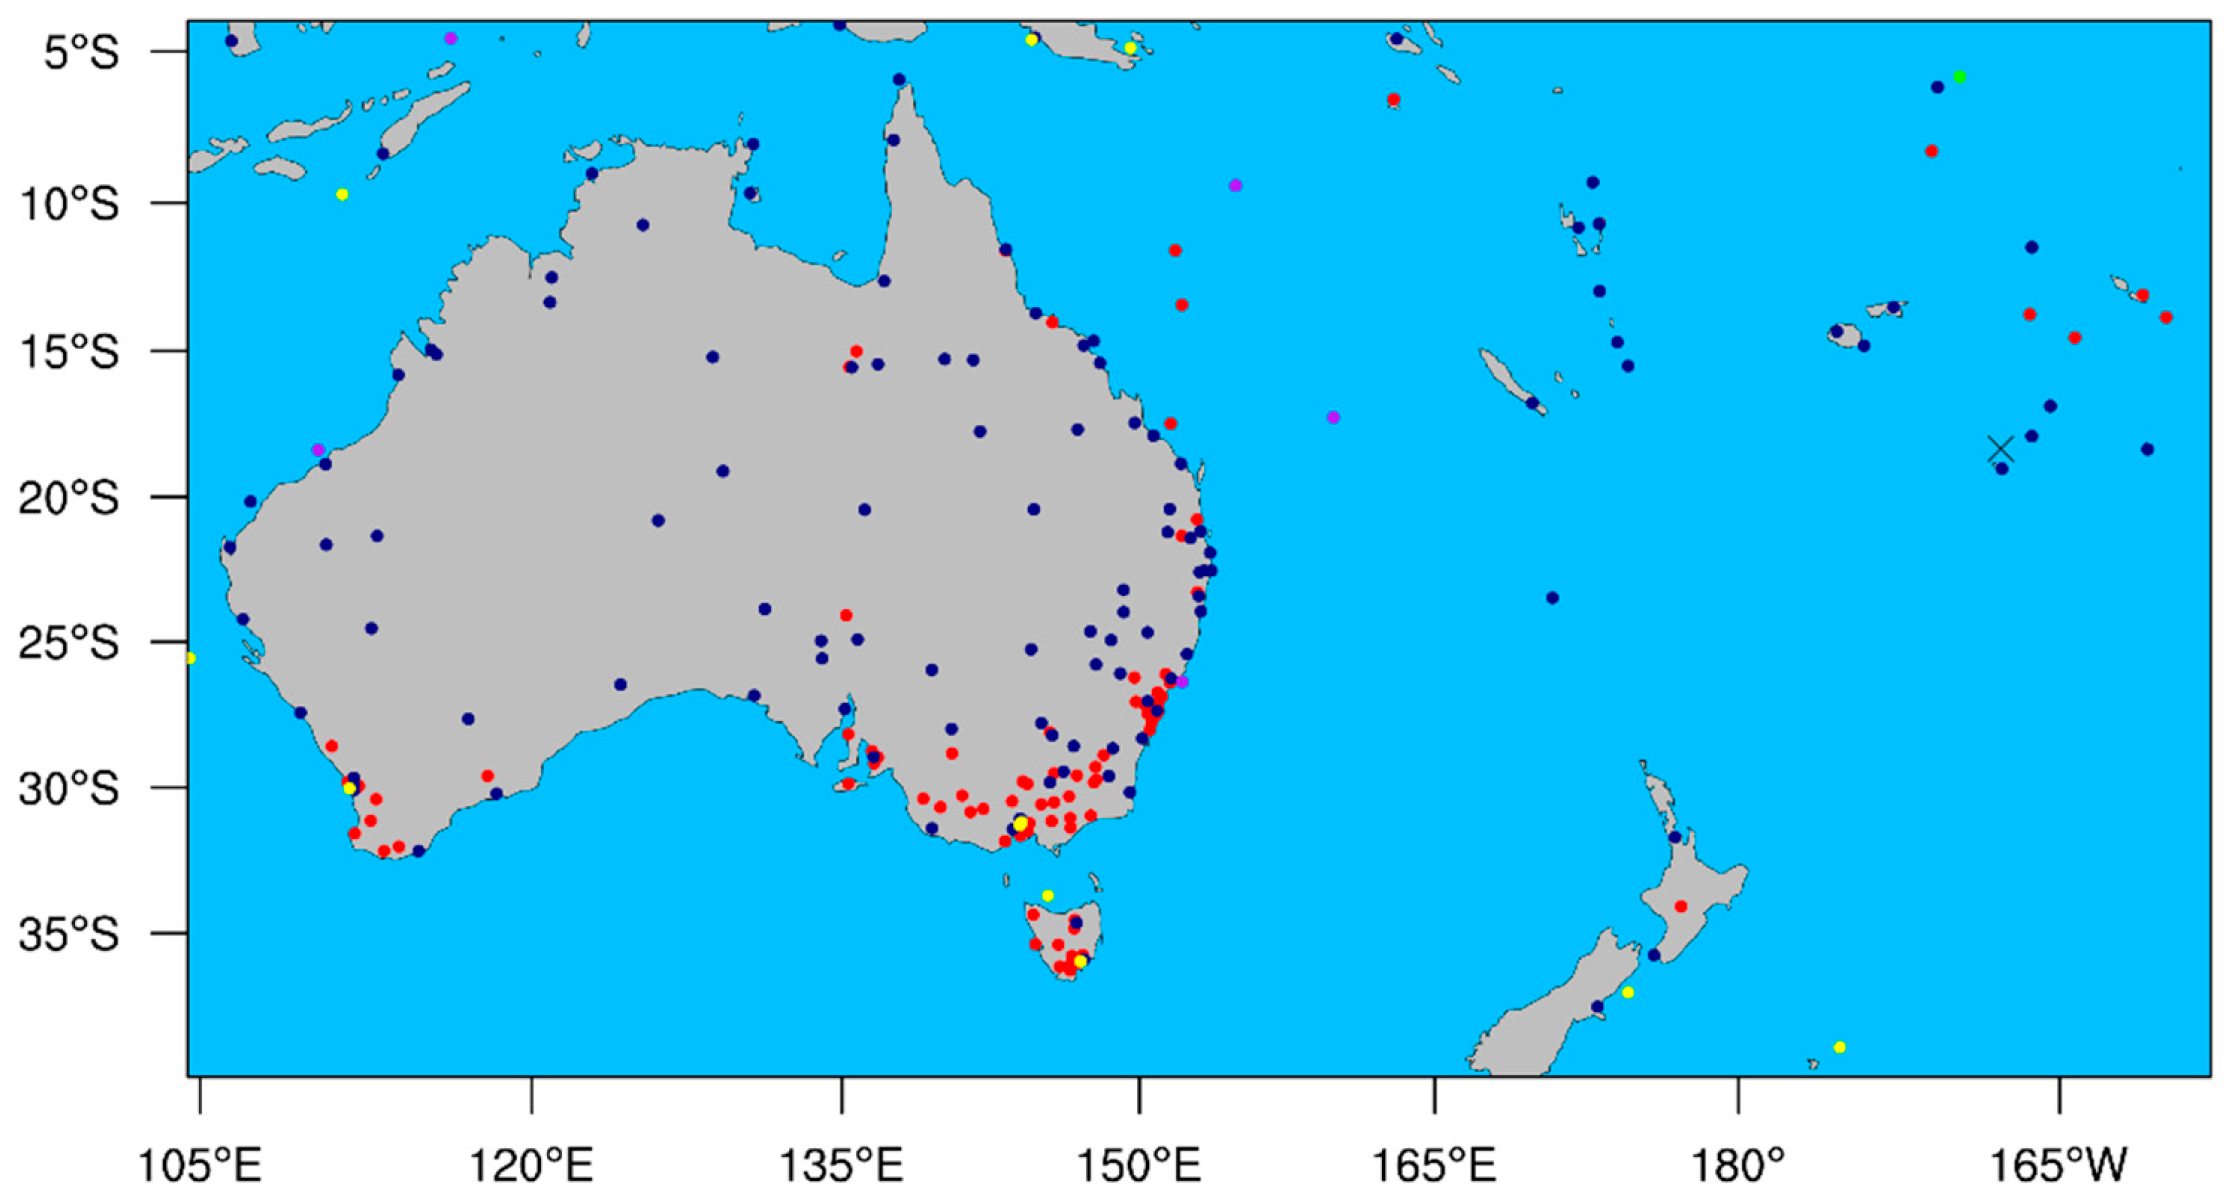
| Color | Observation type |
|---|---|
| Red | SYNOP |
| Navy blue | METAR |
| Green | DBUOY |
| Yellow | MBUOY |
| Purple | SHIPS |
| Bin | Particle size diameter (µm) | S2 |
|---|---|---|
| 1 | 1000-2000 | 22 |
| 2 | 500-1000 | 5 |
| 3 | 250-500 | 4 |
| 4 | 125-250 | 5 |
| 5 | 62.5-125 | 24.5 |
| 6 | 31.25-62.5 | 12 |
| 7 | 15.62-31.25 | 11 |
| 8 | 7.81-15.62 | 8 |
| 9 | 3.91-7.81 | 5 |
| 10 | < 3.91 | 3.5 |
| Parameter-Run type | FAC2 | MB | NMB | RMSE | r | IOA |
|---|---|---|---|---|---|---|
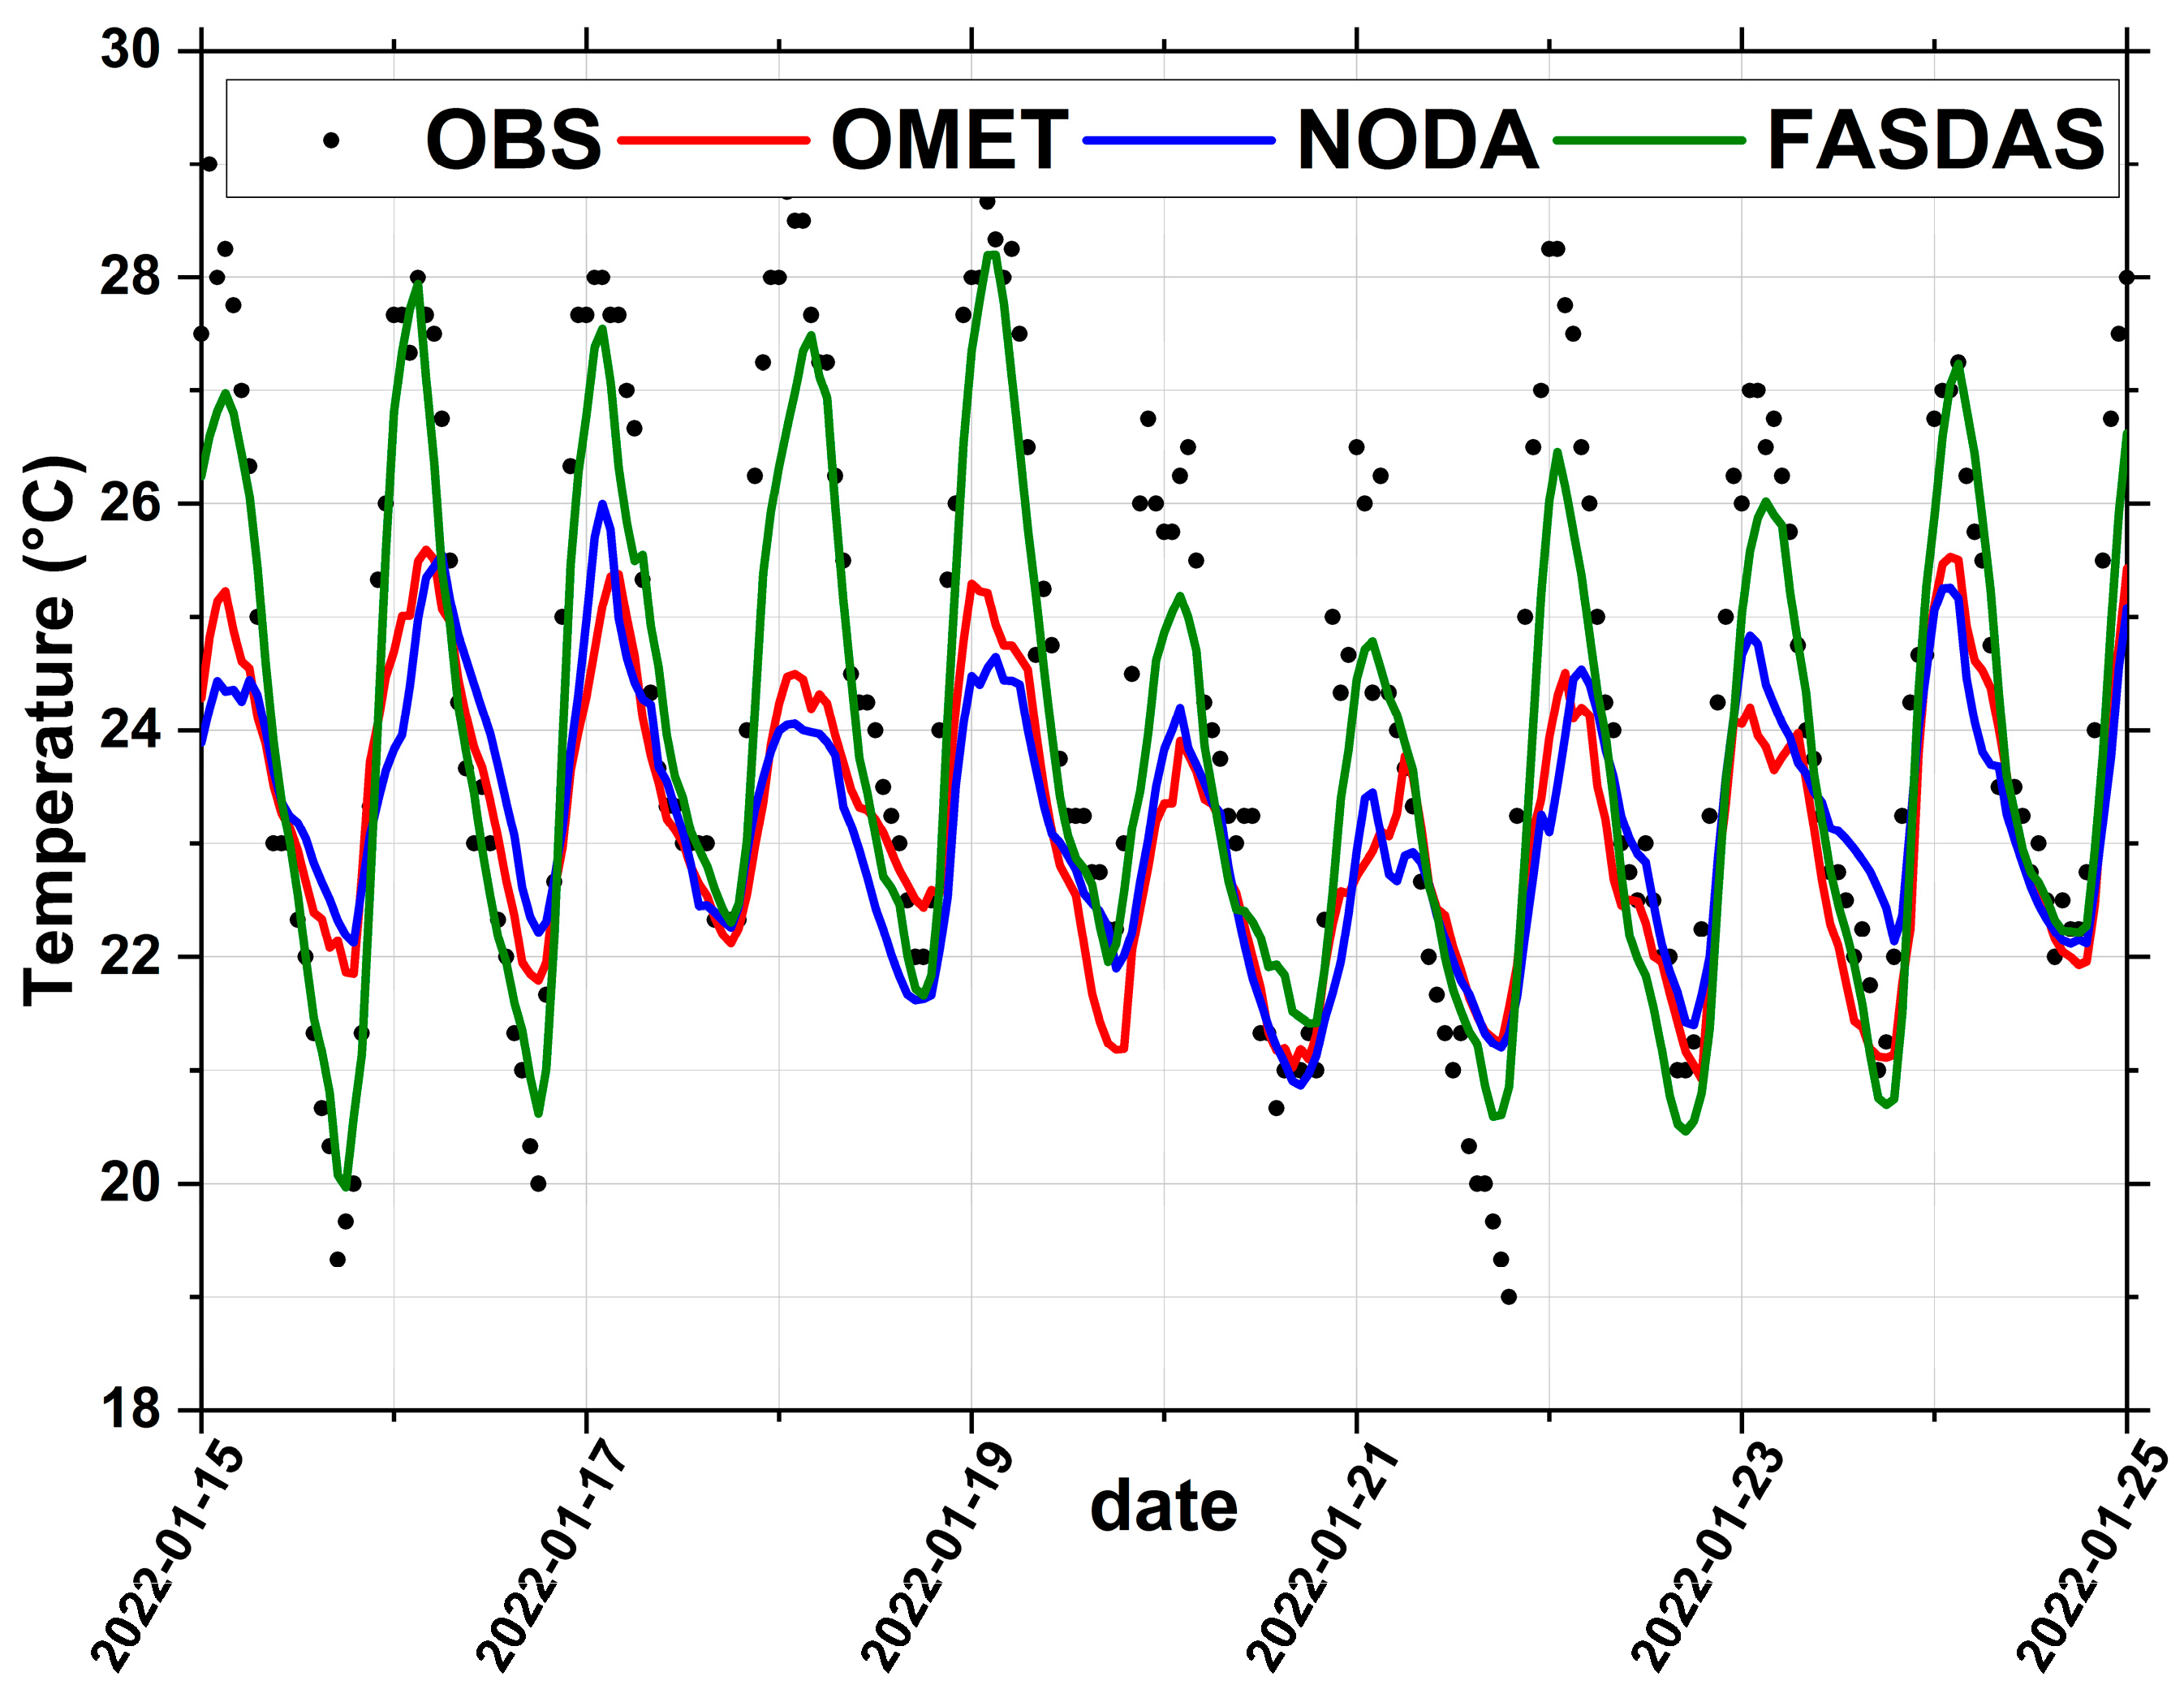
| T2- OMET | 1 | -1.12 | -0.05 | 1.89 | 0.86 | 0.64 |
| T2- NODA | 1 | -1.09 | -0.04 | 2.01 | 0.80 | 0.62 |
| T2- FASDAS | 1 | -0.49 | -0.02 | 0.96 | 0.95 | 0.82 |
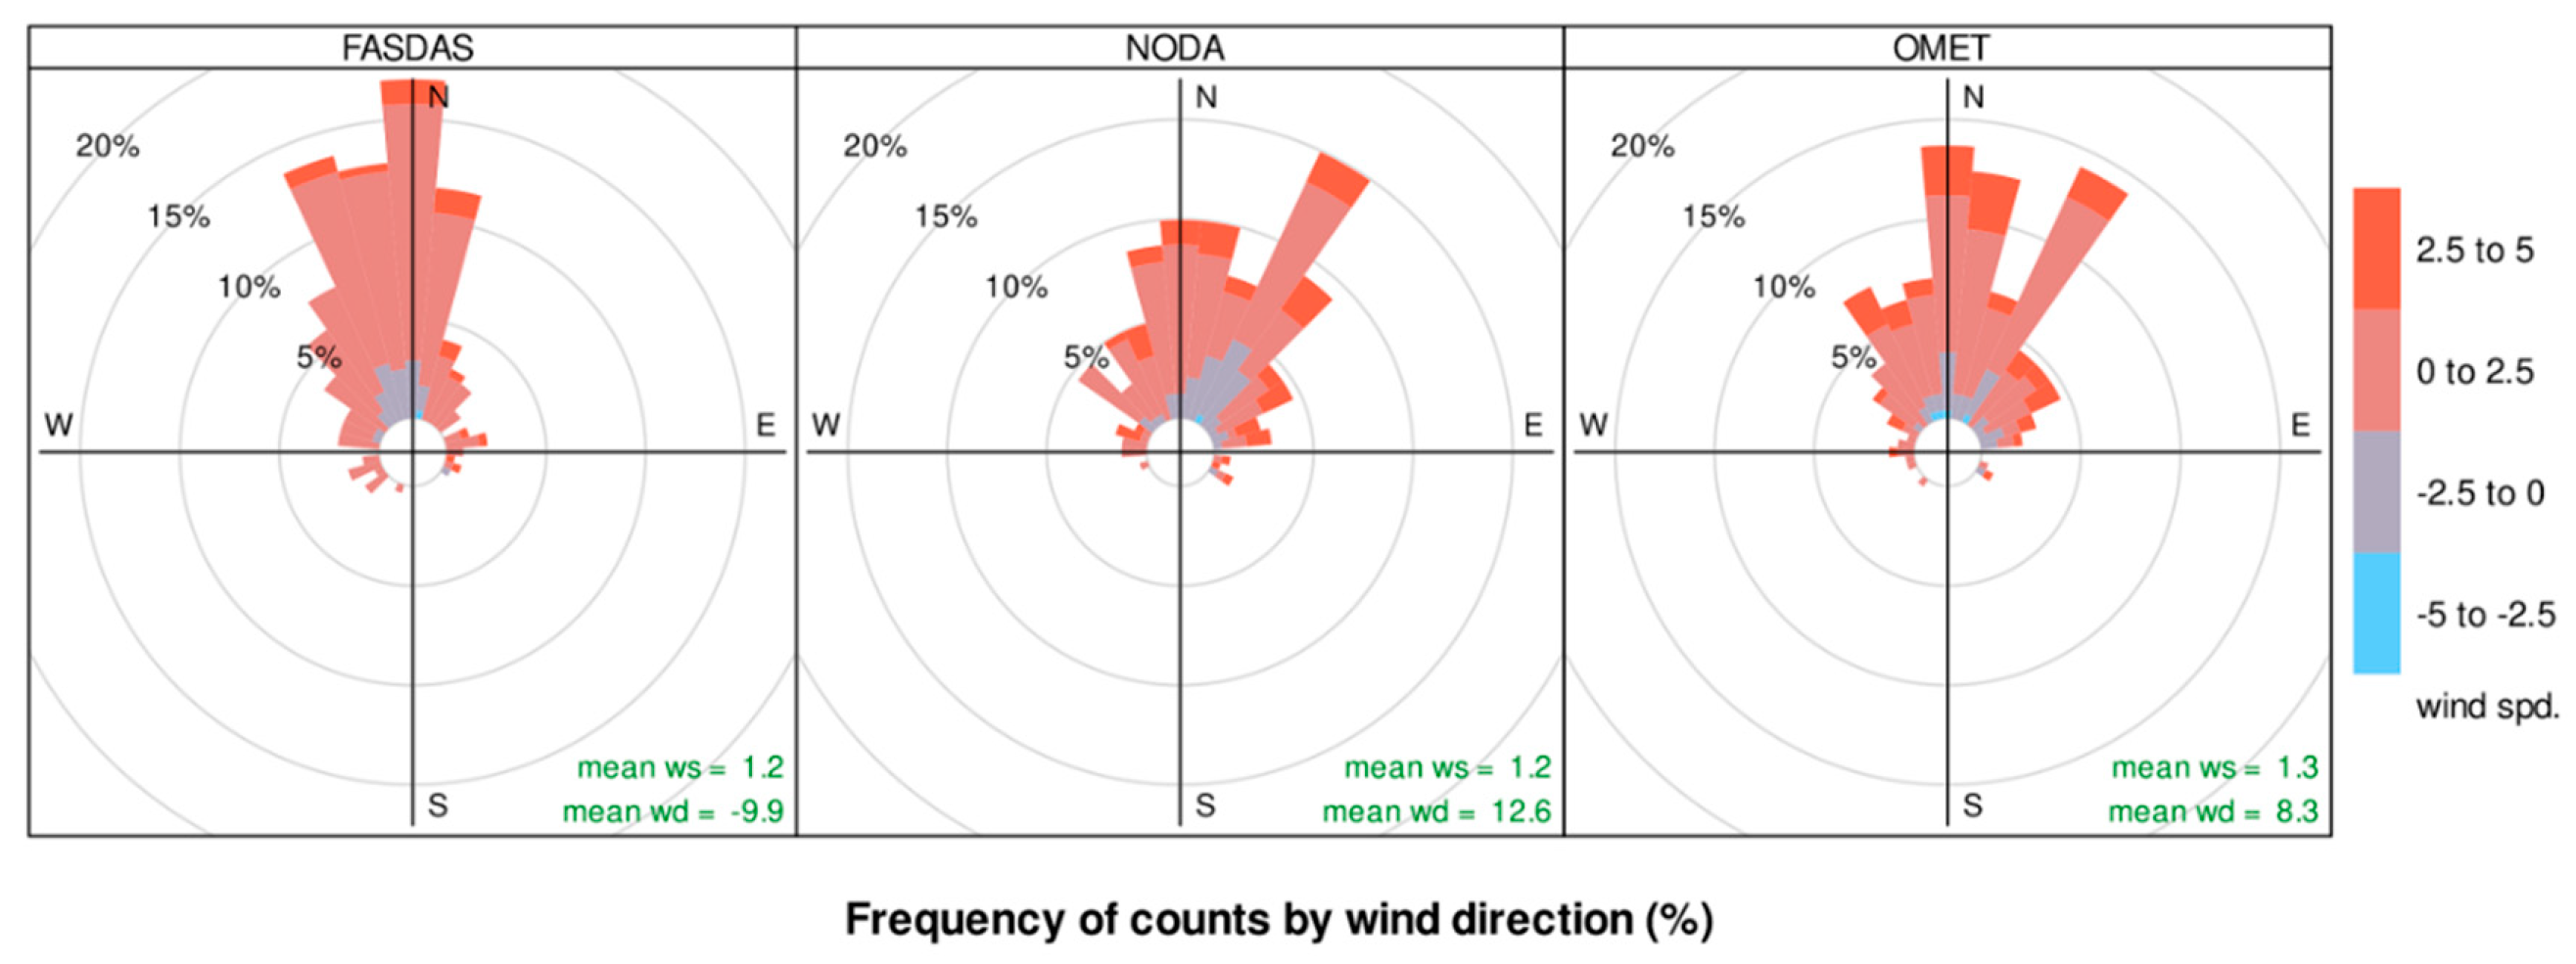
| WS- OMET | 0.84 | 1.31 | 0.33 | 1.99 | 0.38 | 0.33 |
| WS- NODA | 0.83 | 1.23 | 0.32 | 1.93 | 0.35 | 0.36 |
| WS- FASDAS | 0.90 | 1.15 | 0.29 | 1.55 | 0.74 | 0.48 |
| WD- OMET | 0.96 | 7.34 | 0.05 | 39.96 | 0.44 | 0.51 |
| WD- NODA | 0.95 | 11.62 | 0.08 | 42.29 | 0.42 | 0.47 |
| WD- FASDAS | 0.92 | -11.06 | -0.08 | 43.26 | 0.32 | 0.52 |
Disclaimer/Publisher’s Note: The statements, opinions and data contained in all publications are solely those of the individual author(s) and contributor(s) and not of MDPI and/or the editor(s). MDPI and/or the editor(s) disclaim responsibility for any injury to people or property resulting from any ideas, methods, instructions or products referred to in the content. |
© 2024 by the authors. Licensee MDPI, Basel, Switzerland. This article is an open access article distributed under the terms and conditions of the Creative Commons Attribution (CC BY) license (http://creativecommons.org/licenses/by/4.0/).


