Introduction
Volcanic eruptions, because of the large amounts of gases and particles emitted into the atmosphere, exert a significant impact on the climate and the environment. A volcanic eruption is a geological phenomenon during which a volcano emits various materials, such as lava, tephras, gases, or ashes. Sulfur dioxide (), oxidized by oxyhydryl to produce sulfate aerosols in the atmosphere, is the most abundant gas produced during volcanic eruptions. When released in large quantities, it can irritate mucous membranes, skin, and respiratory tract. The other intriguing property of is when this gas is oxidized, as it generates submicron sulfate particles with a lifespan of several years if they reach the upper troposphere or the lower stratosphere (Kampouri et al., 2020). By its usage also as a proxy for volcanic ash, can get quite dangerous to aircraft engines. During eruptive as well as quiescent phases, the flux gives volcanologists an idea about magmatic processes controlling volcanic activities (Corradini et al., 2021). It yields also insights into magma pressure, magma-gas separation depths, and conduit structure (Edmonds et al., 2003). The importance of retrieval of rates manifests in risk attenuation, giving insights into eruption causality mechanisms and aviation safety. In addition, the variation of over time can be regarded as a precursor of volcanic eruptions (Inguaggiato et al., 2011).
A multitude of satellite sensors capable of detecting volcanic plumes has been employed in recent years, among which is the TROPOspheric Monitoring Instrument onboard the Sentinel-5 Precursor satellite ( TROPOMI/S5P; Veefkind et al, 2012). The equipped imaging spectrometer can monitor from space the gases in four spectral regions. Thus, it can produce high-resolution vertical column density maps of , used in turn to follow precisely the transport of plumes. Using this monitoring instrument, a volcanic emission investigation in the Mediterranean was carried out (Kampouri et al., 2020). They validated with the help of the FLEXible PARTicle Lagrangian Model (FLEXPART; Stohl et al., 2005) that the plume traveled from the Etna volcano towards Antikythera station located in Greece. The extensive verification made has the objective to validate the Copernicus Atmospheric Monitoring Service (CAMS). (Hedelt et al., 2019) conceived the Full-Physics Inverse Learning machine (FP_ILM) algorithm to accurately retrieve the layer height. The model was then validated against some volcanic eruptions measured by TROPOMI/S5P and depicted pertinent results. (Inness et al., 2021) used the CAMS forecasting system operated by the European Centre for Medium-Range weather forecasts (ECMWF) combined with the FP_ILM model to accurately represent the height of the volcanic plumes during the assimilation process. An analysis of properties of TROPOMI/S5P cloud heights of the 2018 Sinabung volcano eruption in Indonesia was established by (De Laat et al., 2020), and the instrument, along with the Himawari-8 satellite data, provided accurate information about the volcanic ashes produced during this event. (Queißer et al., 2019) showed that TROPOMI enabled highly unprecedented flux observations of three datasets from Mt. Etna Volcano (Italy), and suggested that these flux data must be validated with ground-based observations. Throughout global monitoring of volcanic degassing, (Theys et al., 2019) reported that TROPOMI/S5P data could be employed to better understand volcanic impacts and processes. detections can also be performed with a combination of satellite sensing data To characterize pre and post-eruptive behavior (McKee et al., 2021; Cofano et al., 2021). TROPOMI plume height and flux time series could also be retrieved and analyzed to give insights into magmatic processes (Burton et al., 2021). Given the findings above, we deduce that has particular importance to follow near real-time the behavior of volcanic eruptions. Despite the numerous efforts to analyze the crucial impact of this eruption using various techniques (Amores et al., 2022; Astafyeva et al., 2022; Briggs et al., 2022; D’Arcangelo et al., 2022; J.Wright et al., 2022; Lin et al., 2022; Pandey, 2022; Poli and Shapiro, 2022; Yuen et al., 2022; Zuo et al., 2022), the recent unfortunate Hunga-Tonga Ha’apai volcanic eruption showed that there is a need to obtain sophisticated regional model results to complete the ongoing measurement analyses conducted in the above-mentioned studies. Unlike December 2021 Honga Tonga volcanic activities, the impact of the January 15th eruption was concentrated on a regional scale, despite the ash release period being shorter than a day. Though the exact composition and amount of ejected material are unknown, new state-of-the-art Chemical Transport Models (CTMs) can estimate the volcanic ash’s spatial distribution based on meteorological data inherited from global models at regular time steps covering the release time. A possible solution could include incorporating the ash cloud’s height and preparing the emission inventory for the model run. We conducted simulations in this study using the WRF-Chem model (Grell et al., 2005; Fast et al., 2006) to investigate the causality of radiative feedback effects on the meteorology and volcanic ash clouds results. The volcano module within the WRF-Chem model (Stuefer et al., 2013) has shown good agreement with the available measurements like ground-based lidar as well as satellite data when conducted for typical volcanic eruptions (e.g. Mount Redoubt, 1989 and Eyjafjallajökull, 2010). Thus, the influence of activating aerosol feedback effects on principal meteorological patterns (winds, geopotential height, boundary layer height) and volcanic ash distribution is investigated during the Hunga-Tonga Ha’apai volcanic eruption, in January 2022.
To our knowledge, this is the first mesoscale modeling study to summarize the current state of the art of this gigantic eruption. The manuscript is organized as follows: section 1 depicts the submarine volcanic eruption that occurred on January 15, 2022, and the model setup. The results and discussions section is divided into three subparts: subsections 2.1-2.2 analyze the meteorological fields and volcanic ash based on WRF-Chem forecasts and derived observational data, and subsection 2.3 describes the evolution of the emitted plume from the TROPOMI Sentinel5-P observations. Conclusions are then summarized in the last section.
1. The case of the 15 January 2022 Hunga Tonga-Hunga Ha’apai volcanic eruption
1.1. The volcanic activity
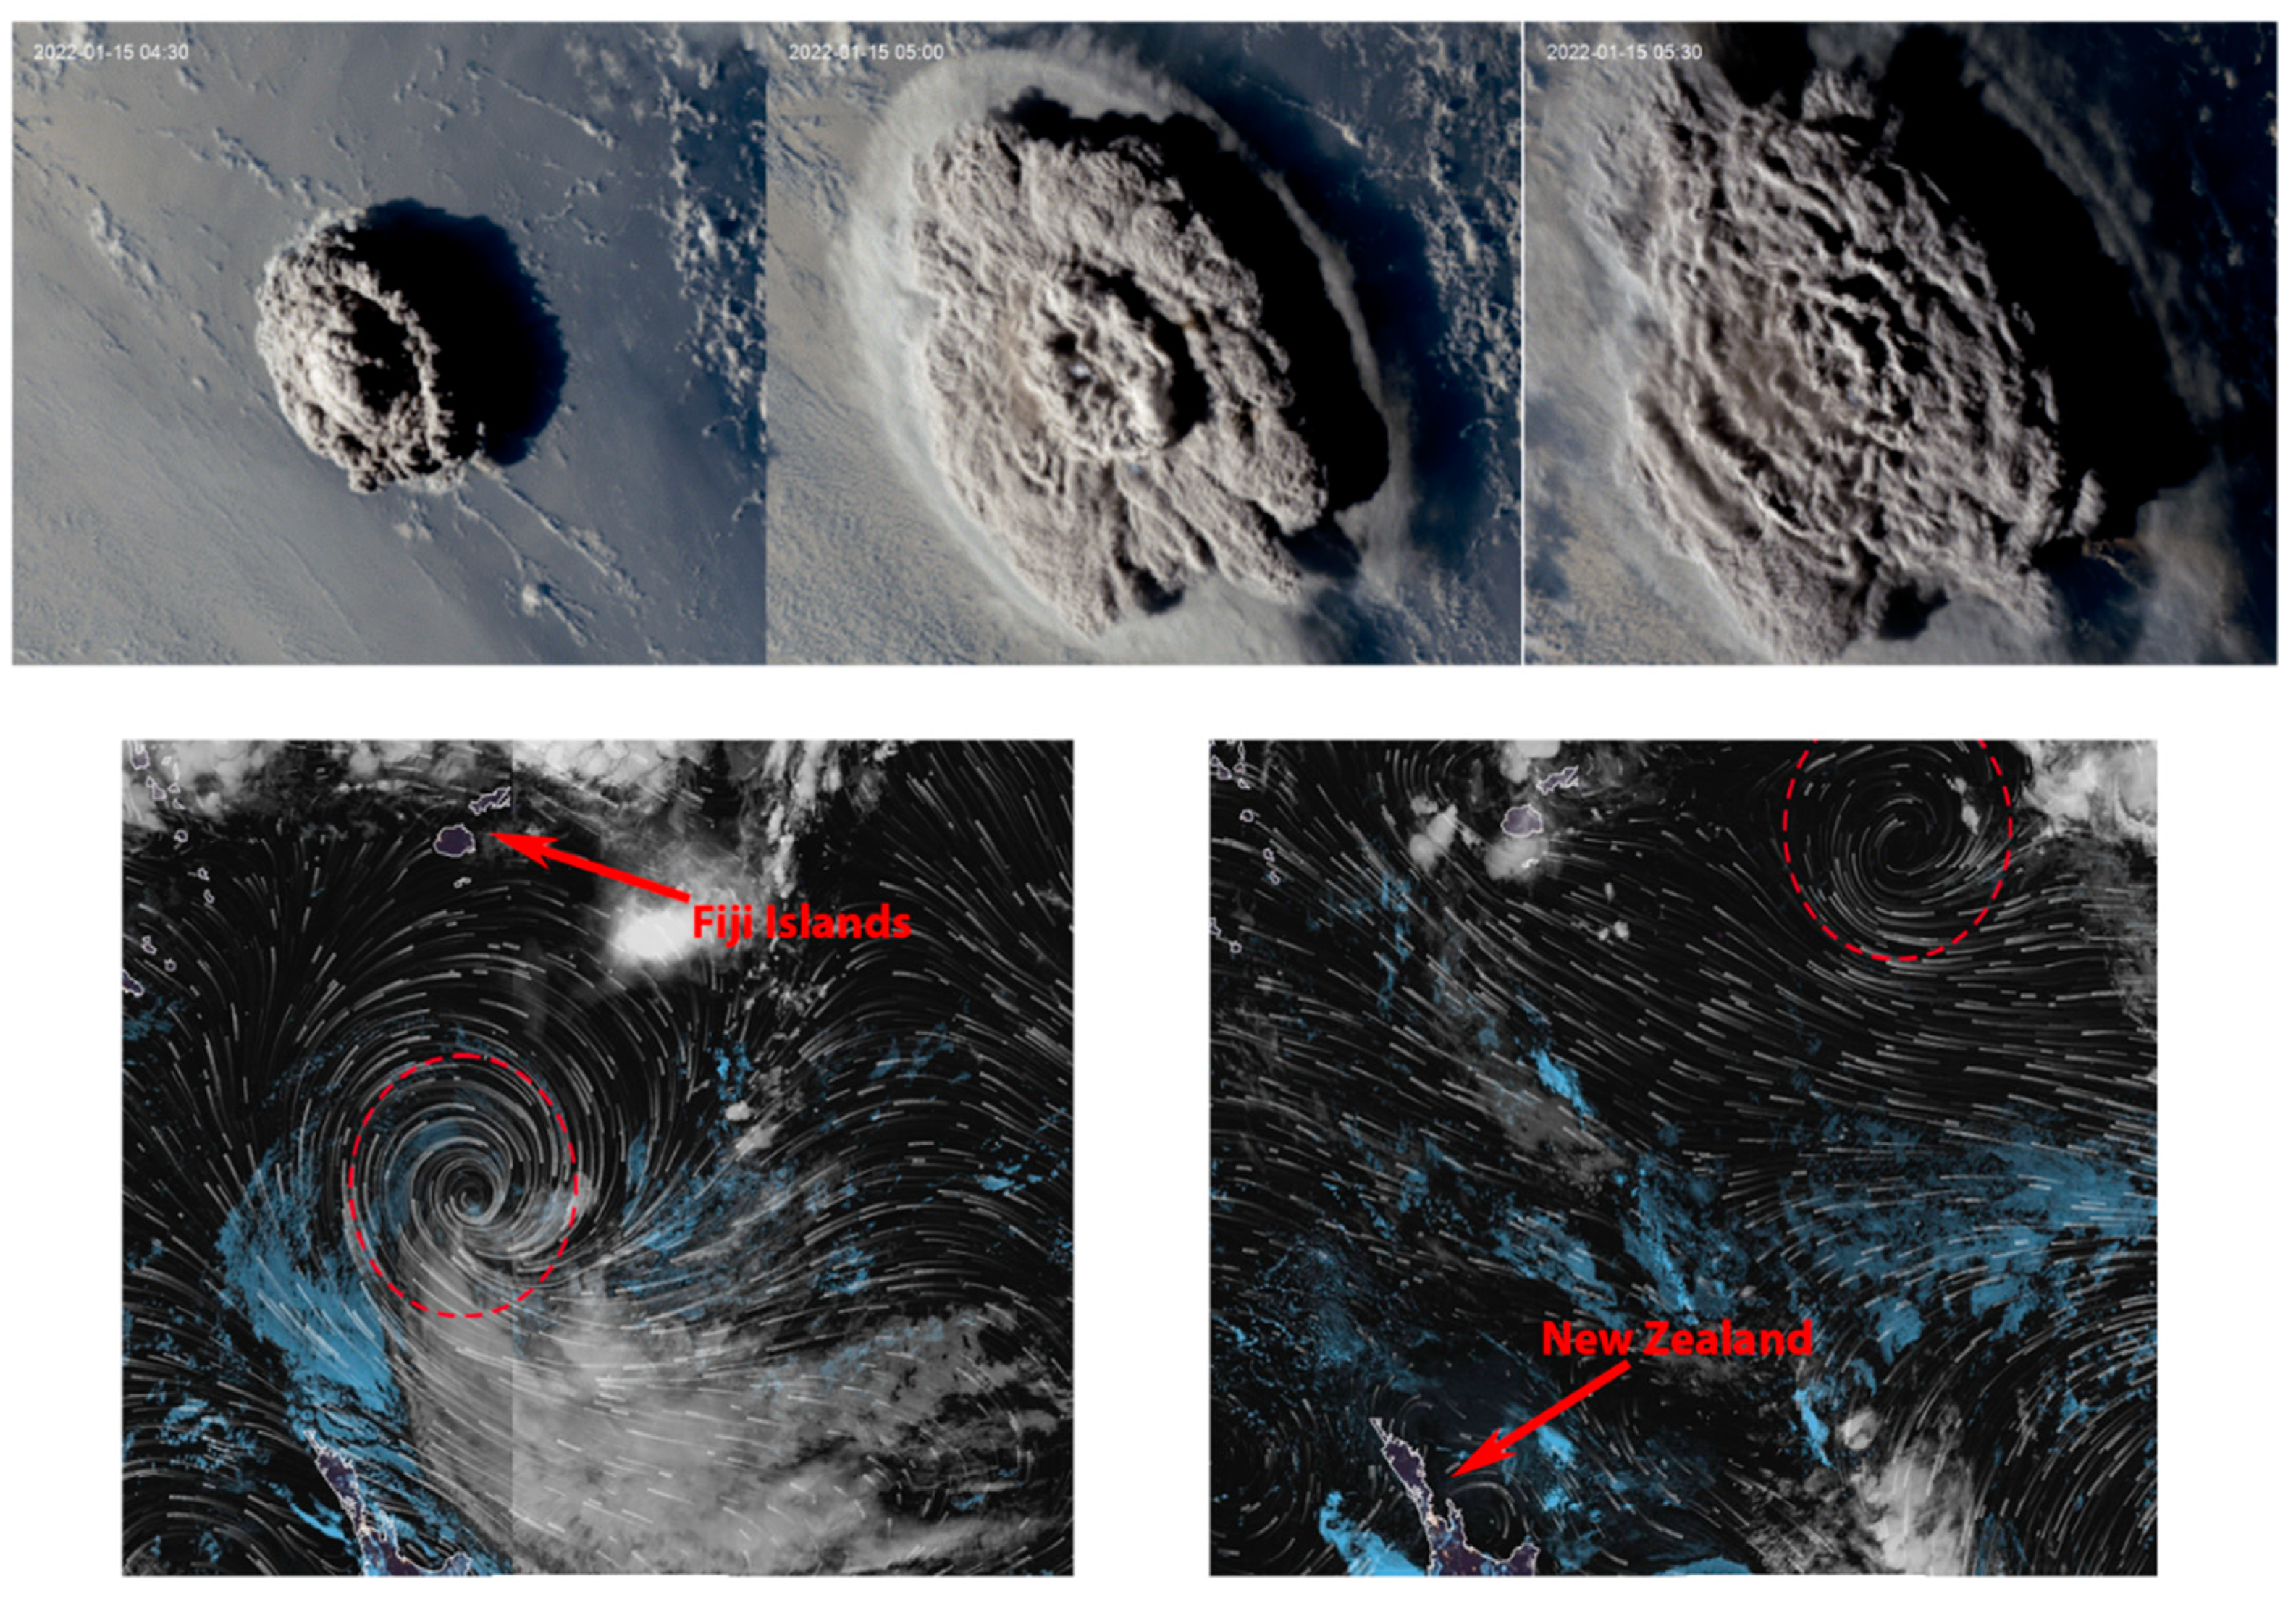
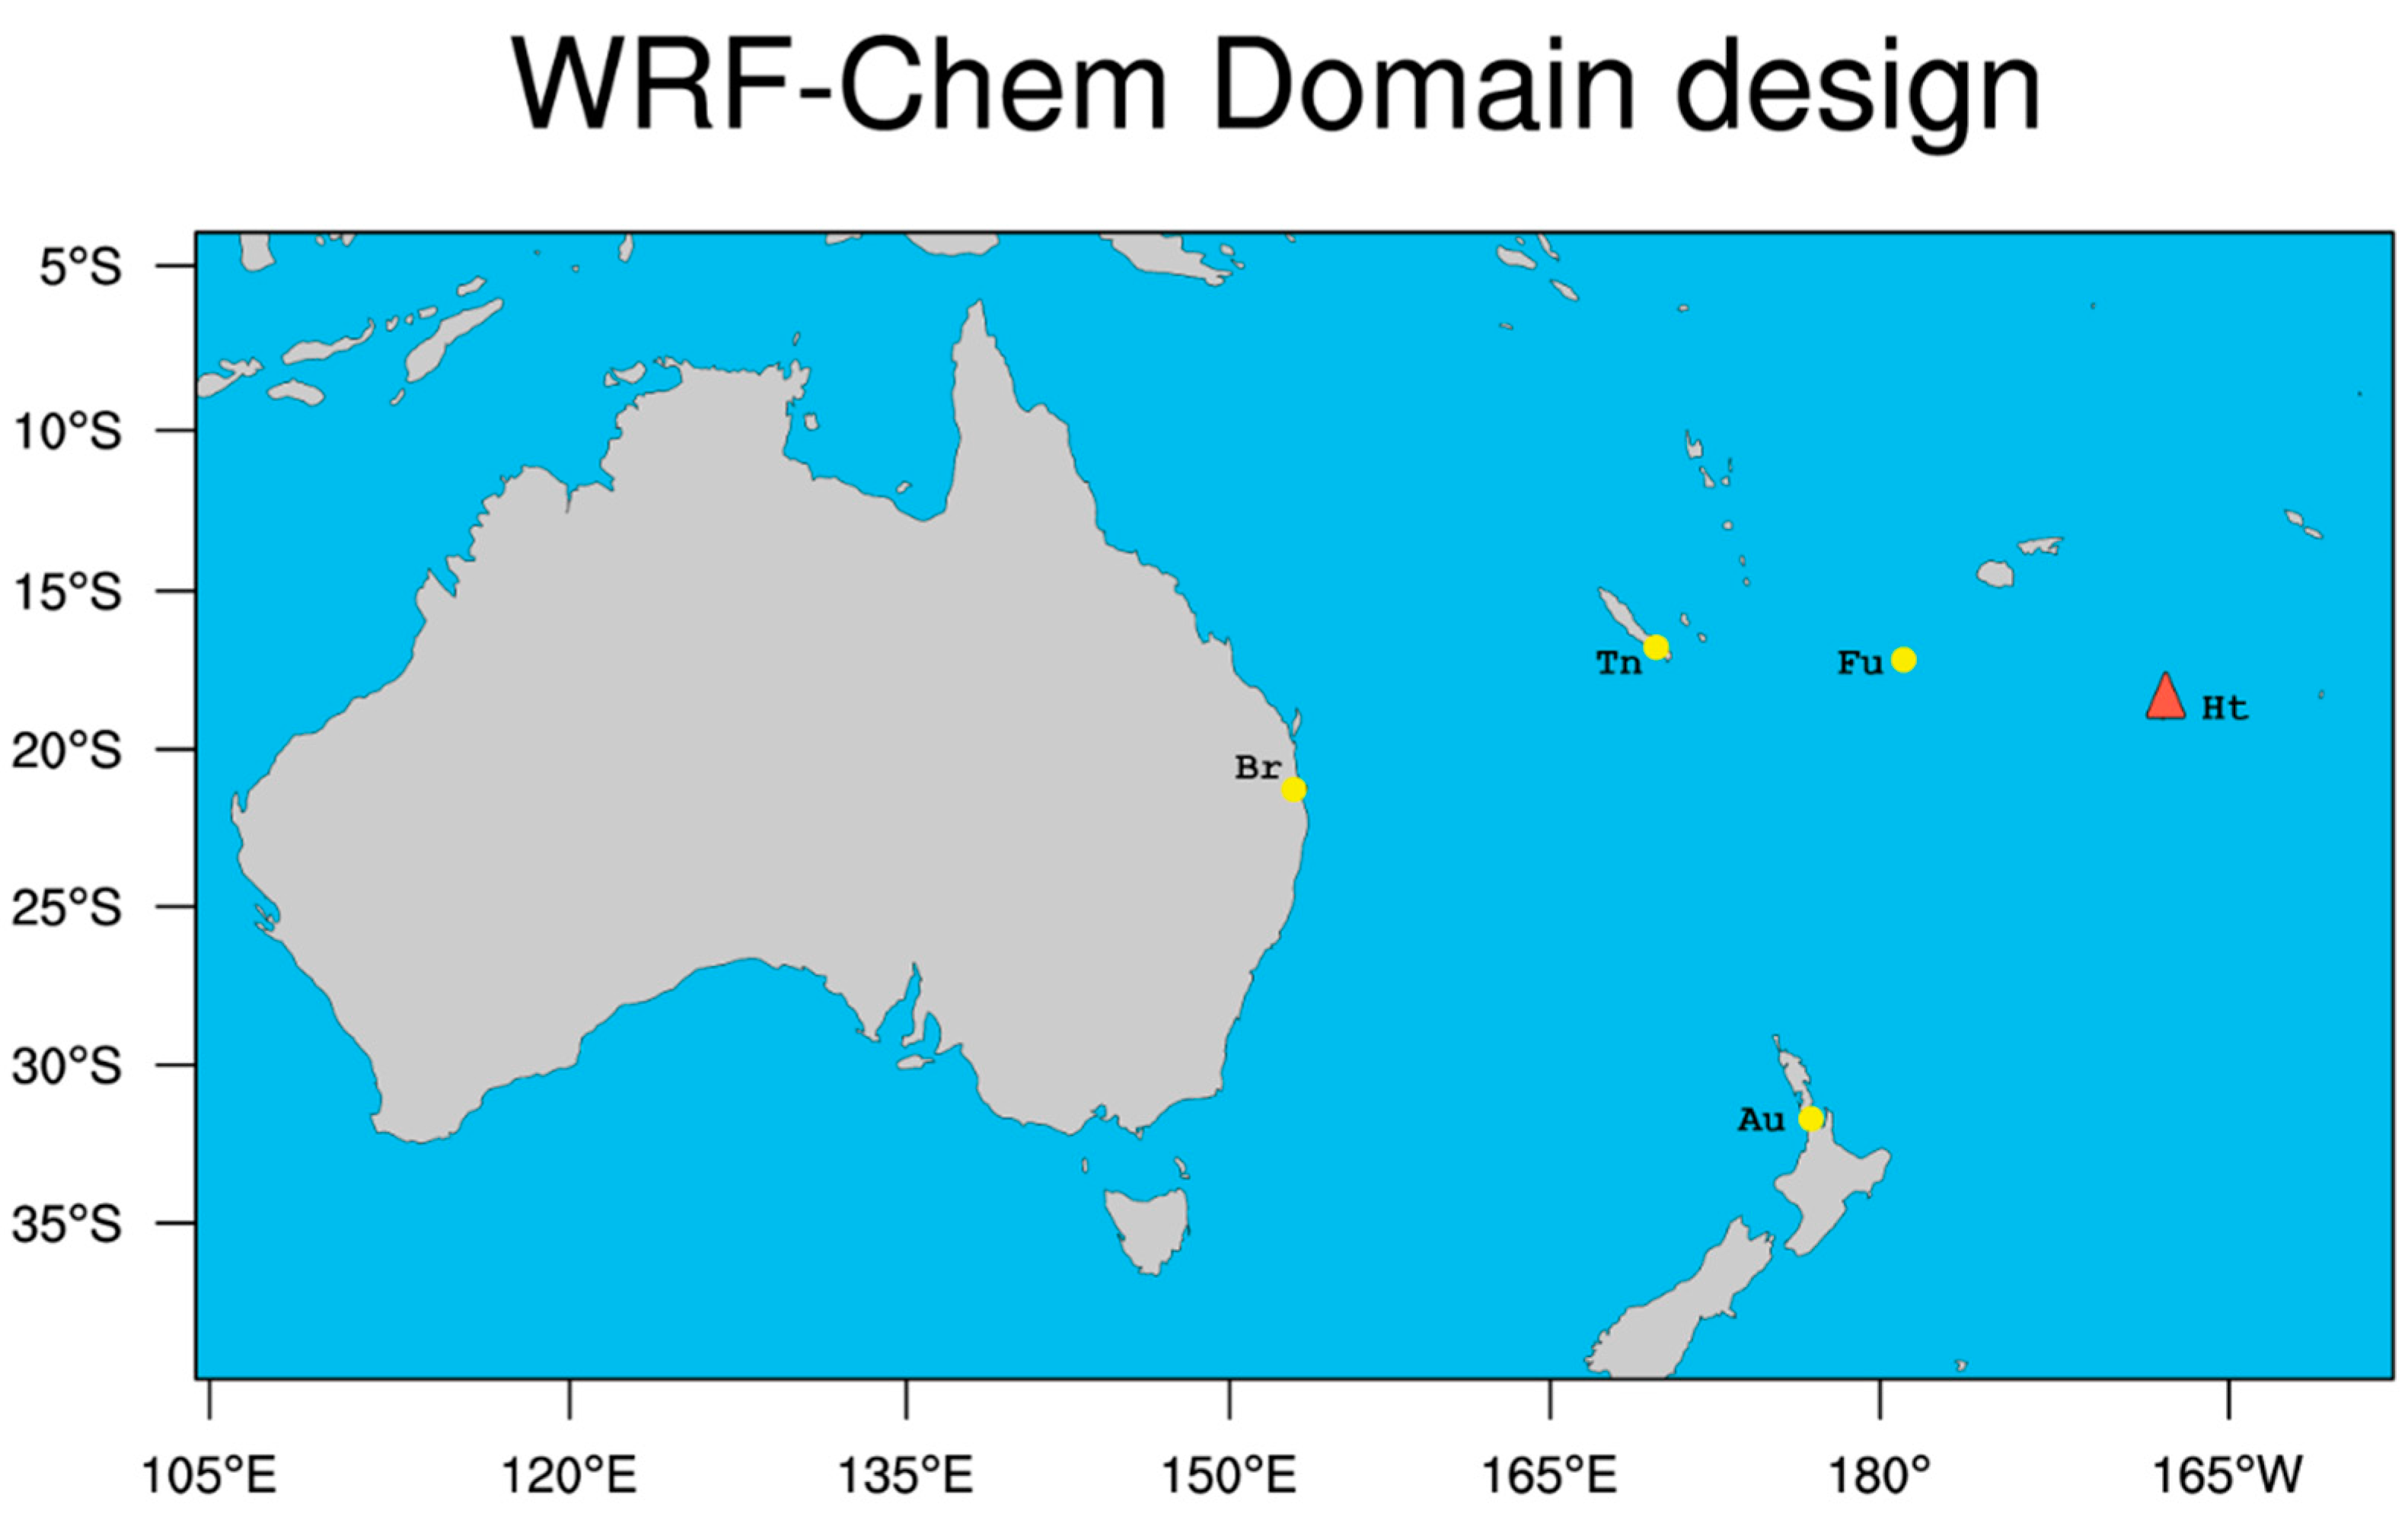
The Hunga Tonga-Hunga Ha’apai volcano (20,55°S; 175.385°W) is located in the south Pacific Ocean and is 65 Km distant from Tongatapu, the main island of Tonga republic (Red triangle on Figure 2). Since 2014, it has remained relatively inactive till December 20th, 2021, when a multitude of volcanic eruptions has been recorded for the volcano. Interestingly, the large blast that rocked the volcano on January 15th and seen by the NOAA’s Geostationary Operational Environmental Satellite 17 (GOES-17;
Figure 1 and video supplement), show the biggest explosion captured on camera. It’s clear from the Figure that the submarine volcano violently exploded beginning from 04:30 (UTC) (
Figure 1, top left panel). The mushroom-shaped ash produced at 05:00 (UTC) sent pressure waves across the atmosphere (
Figure 1, top middle panel), tsunami waves, and sonic booms. After the plume expended radially at the top of the plume and reached its maximum extent (umbrella cloud of roughly 500km), the volcanic plume expanded upward and outward over the south Pacific (NASA, 2022), and began traveling westerly following the wind direction near 05:30 (UTC) (
Figure 1, top right panel). The plum topmost, as captured by satellite images, was at least 600 km in diameter by 19:03 (GVP, 2022). The explosion was so huge that it obliterated the inhabited island of Hunga Tonga-Hunga Ha’apai. Remember that for more than a decade, this volcano erupted many times near Tonga and as a result, a new island connecting the two islands of Hunga Ha’apai and Hunga Tonga was born. But inevitably, the early 2022 eruption wiped out that island. In addition, according to the satellite images of the period January 14-19, the formation of a storm (a well dug depression) was observed just above New Zealand on the day of January 14, 2022 (
Figure 1, bottom left panel), and a second storm was formed at north of Hunga Tonga and east of Fiji Islands on January 18, 2022 (
Figure 1, bottom right panel) more precisely about ten km from these two islands the 3 days following the eruption start. With this context, it will be very relevant to study the link between the atmospheric waves formed during the eruption of the Hunga Tonga volcano and the circulation of the atmosphere in this place and its environment. Surely the eruption of this volcano strongly influenced the movement of these two tornadoes formed during two close periods. For example, a major snowstorm hit North America and a heat wave appeared in Argentina on January 17, which clearly shows a link of this appearance following the eruption of the Hunga Tonga volcano.
1.2. Model setup and configurations
The inline coupled WRF-Chem mesoscale model v4.4 is used to provide volcanic ash predictions for the regional applications at a countrywide scale or less. For the present study, there is a single computational domain having 88 km Horizontal resolution extending over the Western Pacific, the Islands of Tonga, New Zealand, and Australia (
Figure 2). The grid size for the designed domain is 95×50 pts (E-W by N-S). Further, to account for hybrid vertical coordinate (Park et al., 2013), which removes faster the influence of the terrain on coordinate surfaces with rising height, the ARW core v4.4 configuration differs greatly from the traditional terrain following (TF) method by relaxing the eta levels towards an isobaric surface aloft, whilst it is TF near the surface (Snoun et al., 2019a, b; 2021). The projection adopted method is the Lambert Conic Conformal (LCC). At 0.25°× 0.25° horizontal resolution and hourly time step, the meteorological forecasts were initialized by the ECMWF’s Fifth generation Reanalysis (ERA5) lateral boundary data. The integration period included a 12 hours model spinup to make the model physics and dynamics more consistent. It begins at 00:00 UTC, on 15 January, and ends at 00:00 UTC, on 23 January 2022. In the vertical, the model involves 45 pressure levels, with the top one at 5000 Pa. Hourly WRF-Chem ground level meteorological wind speeds and directions outputs are collected at 4 surface stations (Yellow dots in
Figure 2) for the comparative study. To investigate the impact of aerosol feedback effects on the predicted meteorology and volcanic ash, two WRF-Chem runs were conducted and faced. The base case scenario (No feedback) only considers the information on the meteorology and volcanic eruption along with the Goddard Chemistry Aerosol Radiation and Transport (GOCART) background data. The second scenario (Feedback) takes into effect aerosol as well as gas phase chemistry using natural, biogenic, and anthropogenic emissions in addition to the volcanic eruption report.
Major physical parameterizations settings involve the WRF single moment 3 class microphysics scheme (Hong et al., 2004), the surface physics option from the NOAH Land Surface Model (LSM; Chen and Dudhia, 2001), the revised similarity theory of Monin-Obukhov for surface layer (Jiménez et al., 2012), the Rapid Radiative Transfer Model (RTTMG) parameterization for shortwave and longwave radiations (Iacono et al., 2008), , the Grell-3D cumulus scheme (Grell and Dévényi, 2002) and the Yonsei University (YSU) planetary boundary layer (Hong et al., 2006). Moreover, if the data does not contain (or has only coarse resolution) emission inventory for a particular area, the latter will be estimated in the modeling phase. In addition, the pollutant emissions numerical
prep_chem tool is used to create data on volcanic ash emissions for the Hunga Tonga volcano. The software preprocessor provides information on the volcano’s location, the precise moment of the eruption (January 15th, 16:15 UTC), and ash height (58Km). We used the latter plume height concerning investigation work by NASA scientists
1 By combining GOES-17 and Himawari-8 Satellites estimated that Hunga Tonga’s ash plume reached 36 miles (~58 Km) height into the mesosphere’s third atmospheric layer. The biogenic emissions, covering soil-based nitrogen, monoterpenes, and isoprene were computed online using the Guenther scheme (Guenther et al., 2006) while considering dust and sea salt emissions. The aerosol-radiation feedback was activated by enabling these parameters in the chemistry section (
aer_ra_feedback,
aer_op_opt, and
opt_pars_out), options allowing moreover the addition of the Particulate Matter variables (
and
) to the ash, which in turn enables the inclusion of interactions between volcanic aerosol, cloud microphysics, and radiation. Additionally, the No feedback and Feedback forecasts employed a volcanic ash and
emission scheme (
emiss_opt_vol=2) and a simple dust treatment that considers volcanic ash fall and
concentrations distributed over 5 particle size bins (
chem_opt=402) to better simulate the atmospheric transport as well as ash fall concerning different sizes. An 8 days forecast period from January 15 till January 23, 2022, was performed on a four-day time slice sequences rolling basis, both for Feedback and No Feedback runs which will be used later for comparisons. Considering that ERA5 is a reanalysis data that is built upon 4D-VARiational data assimilation (4D-VAR) systems, the assimilation of the meteorological fields is considered an influential factor on the results of the WRF-Chem model domain, as the implicit impaction of aerosol impacts will directly affect the ECMWF analyses since these last are much finer than the model domain itself, and high-resolution input data is always recommended for providing more accurate and detailed information on dynamics and topography.
The simulations were conducted on a personal Linux workstation equipped with an AMD Ryzen 9 5950x 16 cores/32 threads CPU (3.4-4.9 GHz frequency) and 32 Gb of RAM. Using this system, each model run took near ten minutes to complete. In addition, we computed six model performance statistical metrics for wind speed and direction evaluations (with and without Feedback) including the FAC2 (fraction of model in a factor of two of actual observations), the RMSE (root mean squared error), the MB (mean bias), the normalized mean bias (NMB), the index of agreement (IOA) and Pearson correlation (r). The metric indexes are expressed as:
The above simulated and observed values are denoted as and , respectively.
2. Results and discussions
2.1. Meteorological fields
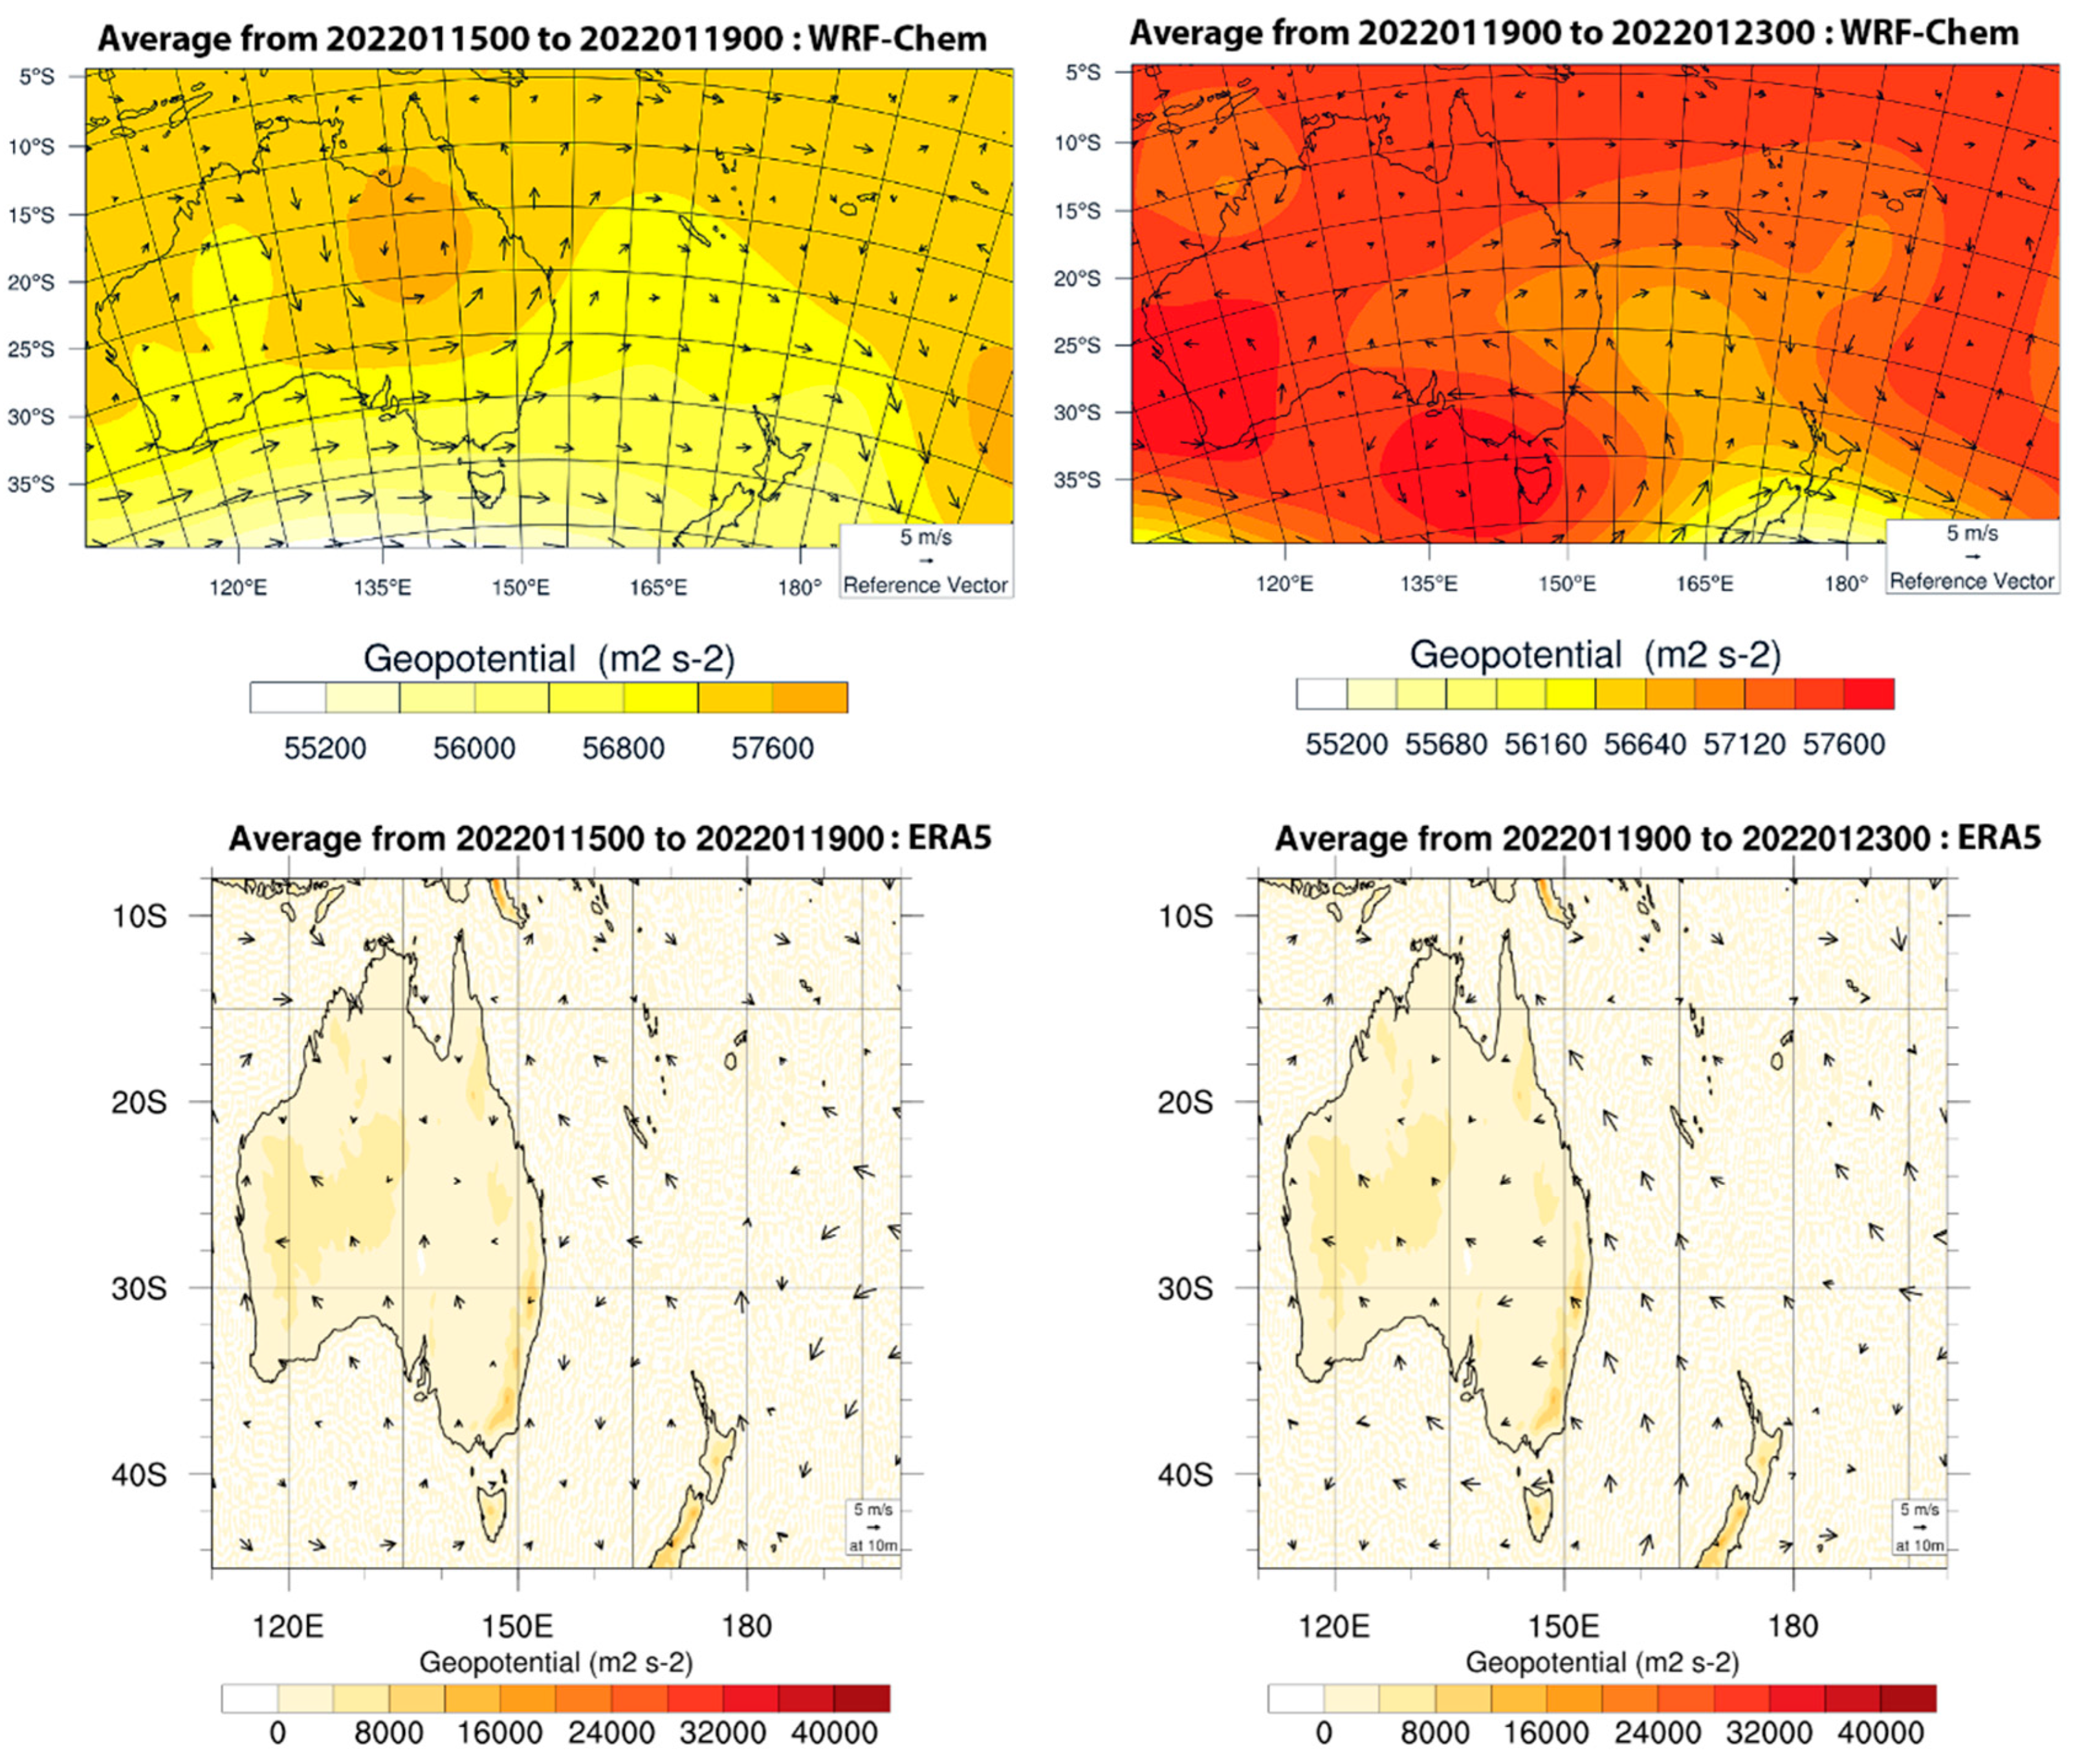
Meteorological conditions with the WRF-Chem as compared to ECMWF’s ERA5 data for the eruption analyzed from 4-day predictions averages in January 2022 are presented in
Figure 3. We depict only the geopotential heights for the Feedback runs at 500 hPa atmospheric pressure. During 15-19 January (
Figure 3, top right panel), WRF-Chem forecasts of wind flow and pressure patterns suggest the presence of prevailing tropical westerly wave motion, which is combined by the movement of two air masses : (i) A tropical warmer air mass moving from higher latitudes (57200-57600
) and (ii) cold polar air masses coming from lower latitudes (54800-57200
). Under the influence of this situation, the flow field shows anticyclonic vorticity localized in northern Australia and the south-eastern part of Tonga(maximum ~57600
), which fosters northerly and easterly circulations in the domain. Associated with these vorticities, movement and formation of cyclonic (i.e. low pressure) systems are noted in the southern part of Australia and New Zealand, in agreement with the data reported in the ERA5 reanalysis (
Figure 3, bottom left panel). Under the influence of localized high pressures, the 500 hPa flow field On 19-23 January (
Figure 3, top right panel) produced north-easterly winds nearby the Hunga Tonga volcano, and we notice also a deepening of the high-pressure systems. The ERA5 data (
Figure 3, bottom right panel), though it favors the representation of low-level wind fields and the western flow circulation at 500 hPa, show lower maximum pressures than those produced with WRF-Chem not exceeding 40000
. This demonstrates that the flow field at this level does not practice a topographic influence, and consequently follows the ERA5 circulation.
The geopotential biases could impact the results through mitigating the close agreement between the observations and the regional model simulations of wind speeds and directions, which will in turn affect the eruptive plume’s dispersion pattern.
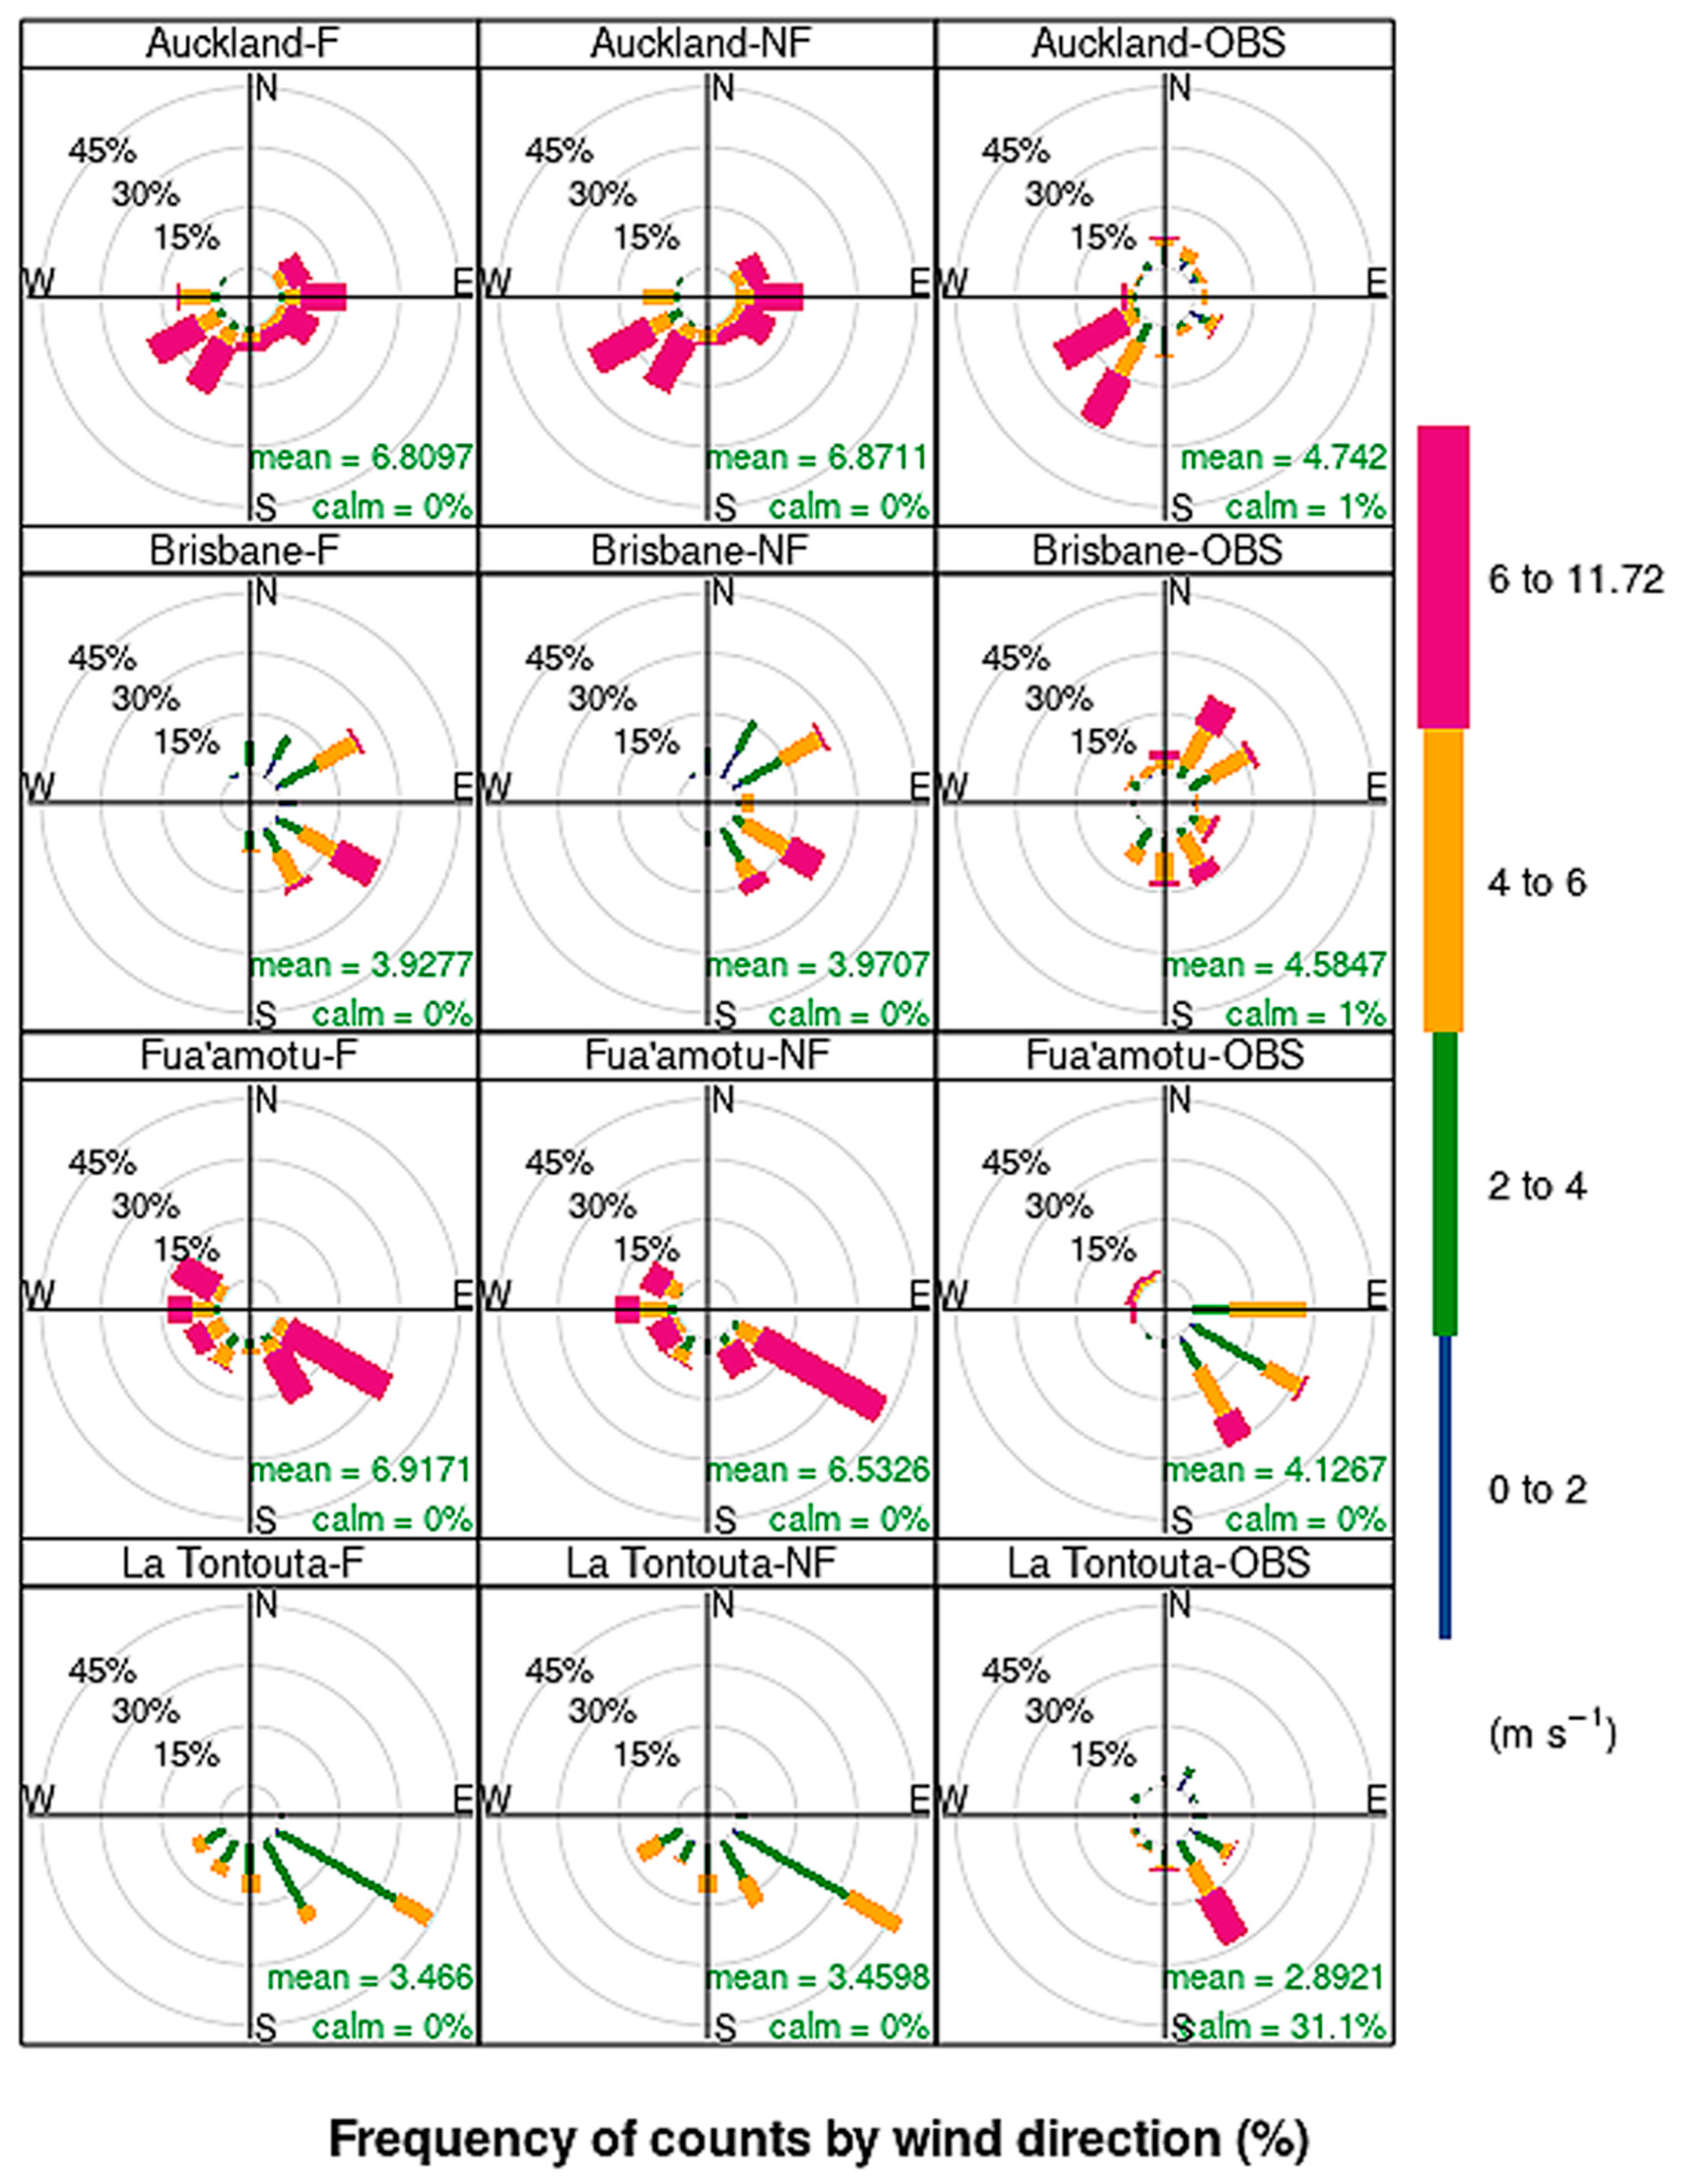
Figure 4 examines the contribution of wind speeds and directions at 10m and clearly shows that the wind roses reported from the measurements at the studied sites, except for Auckland, are dominated by easterly/northeasterly and easterly/south-easterly winds (
Figure 4, right panels). The WRF-Chem predictions for both No Feedback (
Figure 4, middle panels) and Feedback (
Figure 4, left panels) revealed good agreement in incoming off-shore wind directions for most stations, with dominating inland south-easterly winds. Their frequencies of occurrence are 25-30% for Brisbane, 45-30% for Fua’amotu, and 47-45% for La Tontouta, respectively.
According to
Table 2 and
Table 3 though, the Feedback simulations surprisingly fail to some extent to better retrieve the measurements. For instance, we recorded for wind speeds, as compared to No Feedback, decreases in performance of 1.5% in FAC2, 5.5% in MB, 6.45% in NMB, ~4% in RMSE, 14.3 % in r and IOA across all the stations, respectively. Similar behaviors are noted yet less apparent in wind direction predictions. Wind patterns are responsible for influencing the volcanic plume trajectory, removal processes, and boundary layer mixing. Despite the wind discouraging results, our assessment is found to be comparable with previous modeling studies using WRF-Chem for coarse resolution domains, where the feedback effects failed to enhance predictions of a few meteorological fields (Brunner et al., 2015; Hirtl et al., 2018).
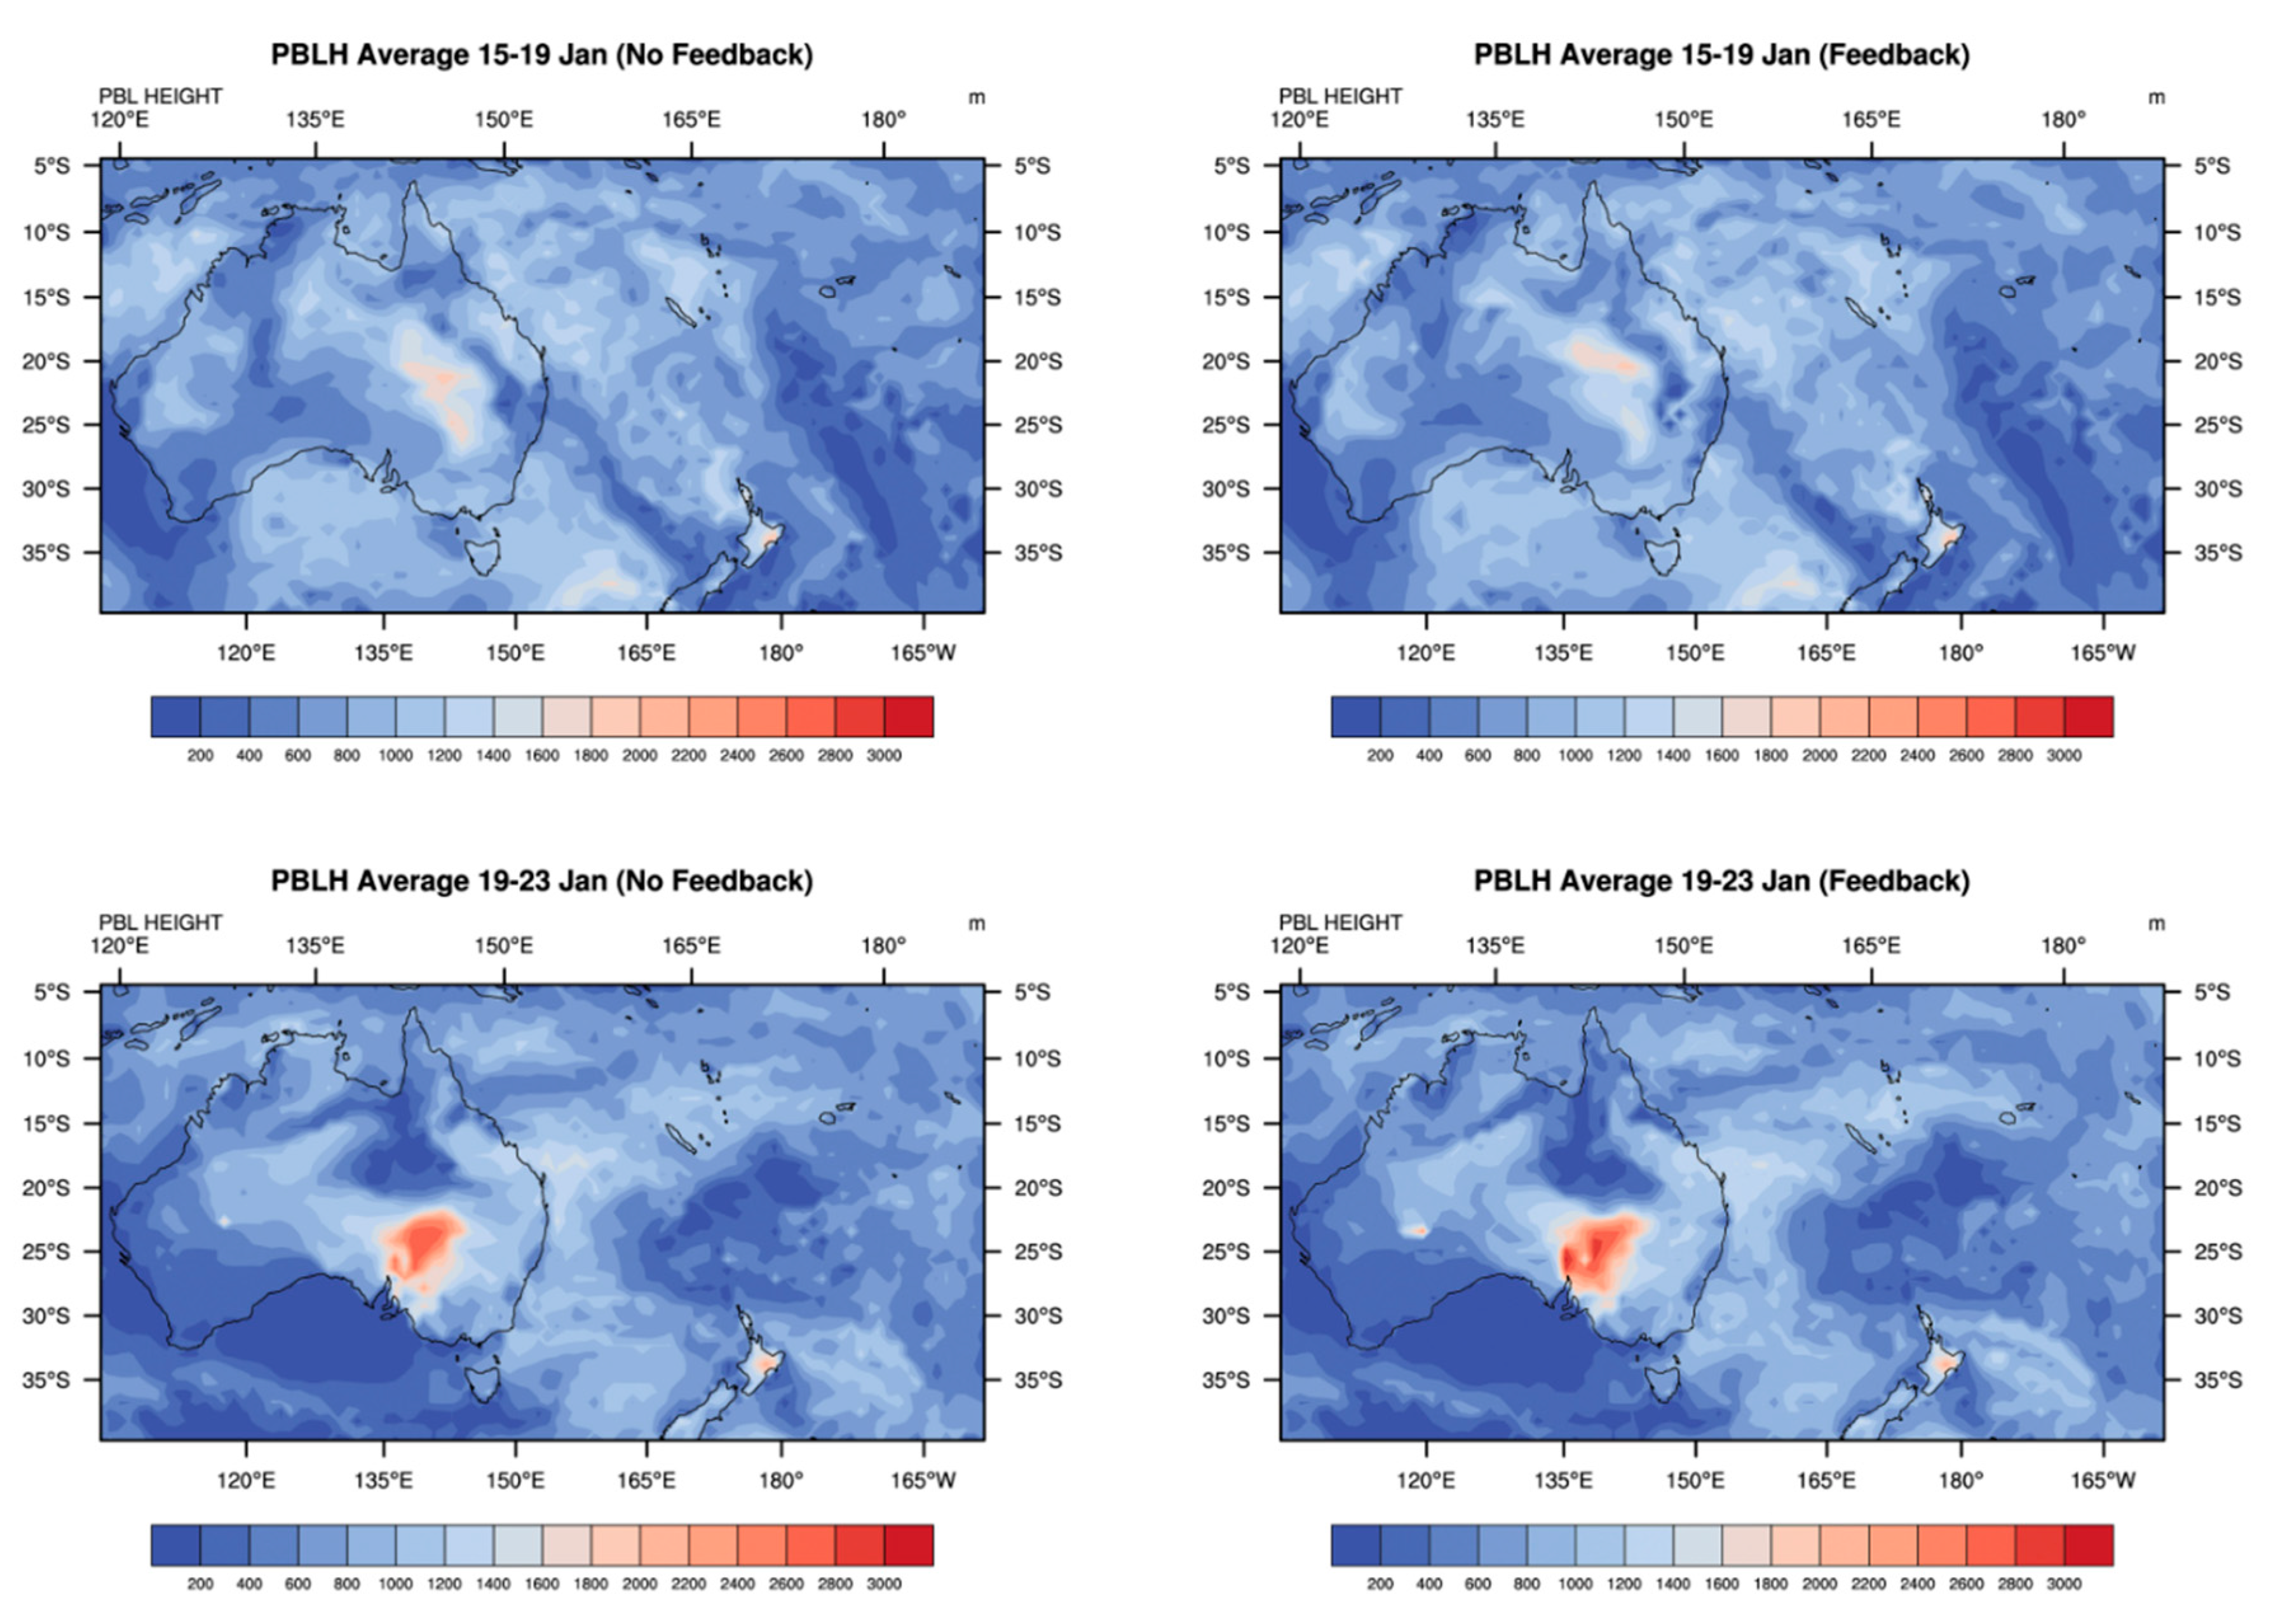
Contour plots of predicted mixed layer depths (m) across the WRF-Chem domain with and without radiative feedback effects are presented in
Figure 5. The spatial patterns of Planetary boundary layer heights (PBLH) on 15-19 January (
Figure 4, top panels) would suggest that around and on the southern side of the volcano, the mixing depths are relatively lower over the pacific ocean as compared to the domain land portions when the eruptive maximum emission occurred, which could be attributed to the prevalence of relatively cooler air masses above the pacific sea. This would favor poor dispersion conditions with the inherent lower volume of air that the ash plume will be mixed into, and consequently more ground concentrations over Tonga and New Caledonia islands during the mentioned period. The simulated period of 19-23 January (
Figure 4, bottom panels) reveals shallow boundary layer depths ranging between 200-1400 m at most monitoring stations. The maximum boundary layer heights are about 1600-3000 m and are located over the southern part of Australia and the northern island of New Zealand, places associated with relatively higher air temperatures. Thus, With the seen resemblance between the predicted PBLH with or without Feedback effects, the simulated variable by WRF-Chem is largely forced by the air masses’ movement and forcing inherited from ERA5 lateral boundary data.
2.2. Volcanic ash transport
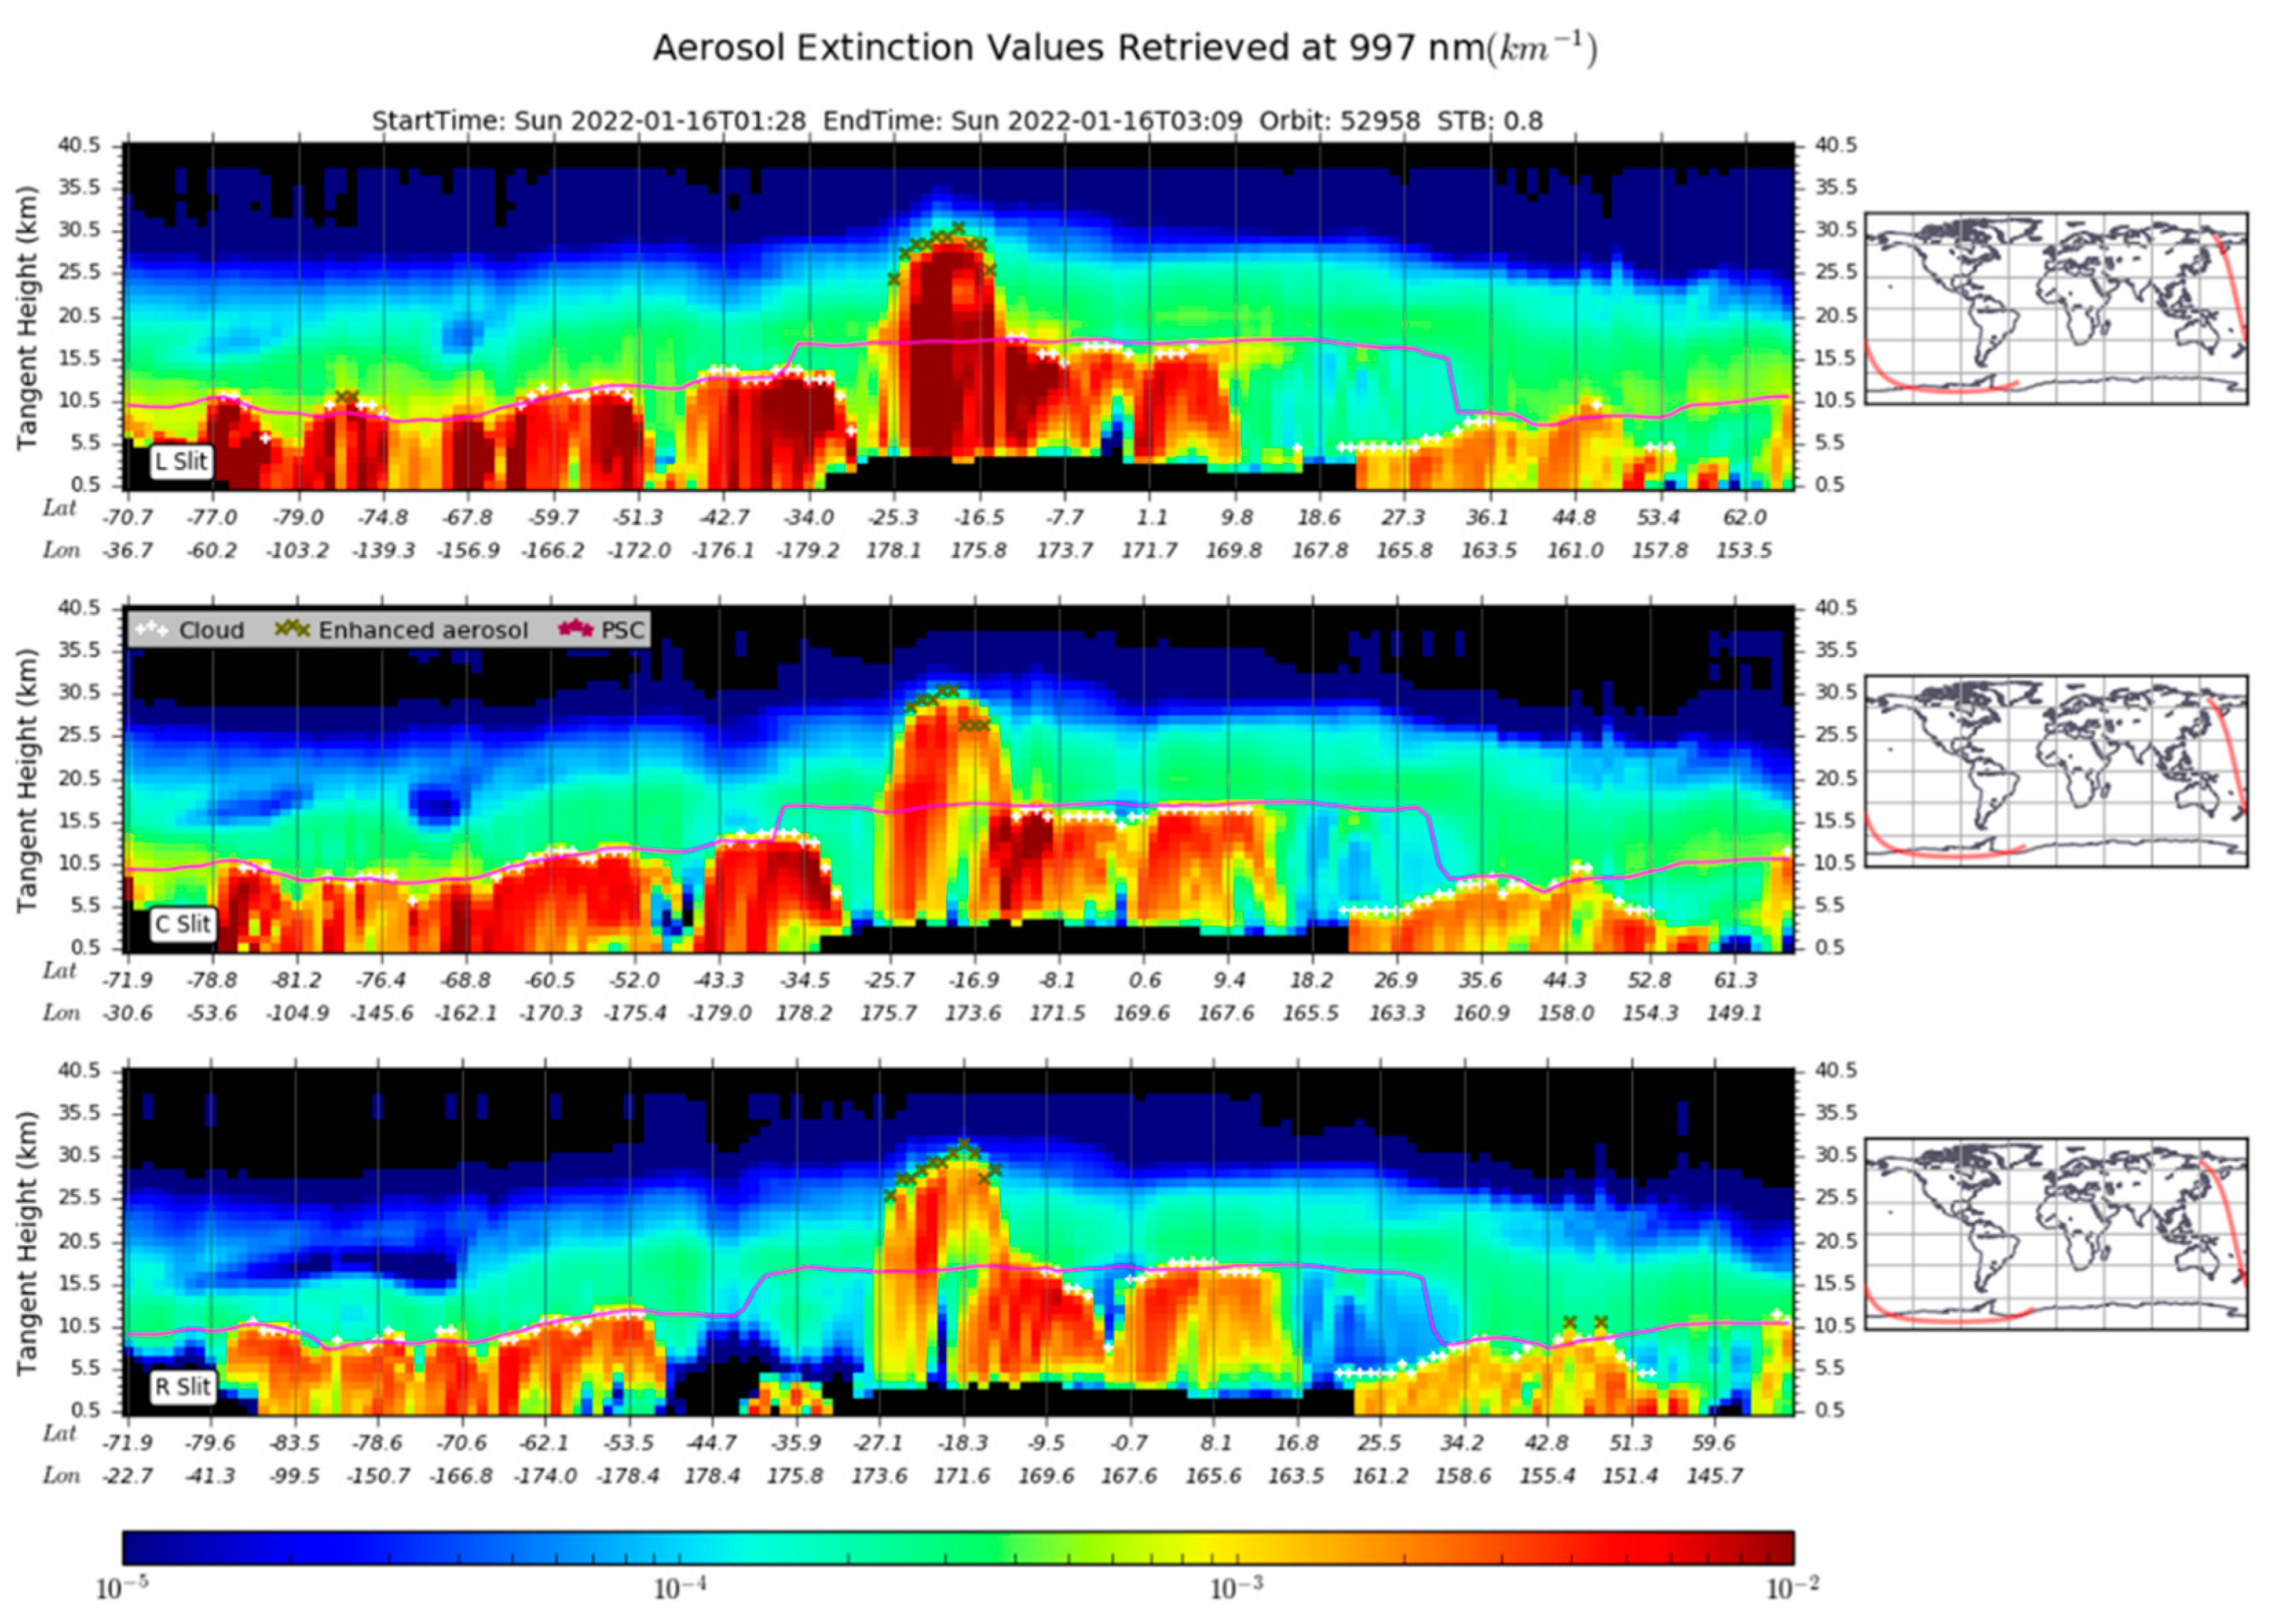
As mentioned previously, the eruption of the Hunga Tonga-Hunga Ha’apai volcano ejected ash and smoke in the air, which was the principal cause of fresh water supplies contamination and difficulty breathing on populated islands of Tonga. It also caused flights to be canceled and prevented marine transportation from and towards the Republic of Tonga. The panel plot of
Figure 6 shows the aerosol vertical profiles recorded by the Suomi National Polar-orbiting Partnership/ Ozone mapping and Profiler Suite S-NPP/OMPS limb profiler (OMPS-LP) from January 16 (01:28 to 03:09 am; UTC). The zonal mean stratospheric conditions within a 0.5-40.5 Km and 72°S-51°N latitudinal domain are associated with an easterly band, and the maximum speed is about 1.8°/0.5h at 32 Km and 27°S.
Figure 6 reveals also, that with the dominant latitudinal dispersion, the enhanced aerosol cloud mostly remains confined within the 25.3-7.7°S band at the first retrieval moment (
Figure 6, top panel), and then evolves unhurriedly in the zonal mean.
The shown plots additionally captured the stratospheric volcanic aerosol cloud reaching altitudes up to 31 Km (in the same location as the highest columns). Meanwhile, the aerosol extinction values retrieved at 997 nm decrease rapidly in time and reach values in-between - during the sensing period and the orbit N°: 52958, suggesting a particle growth.
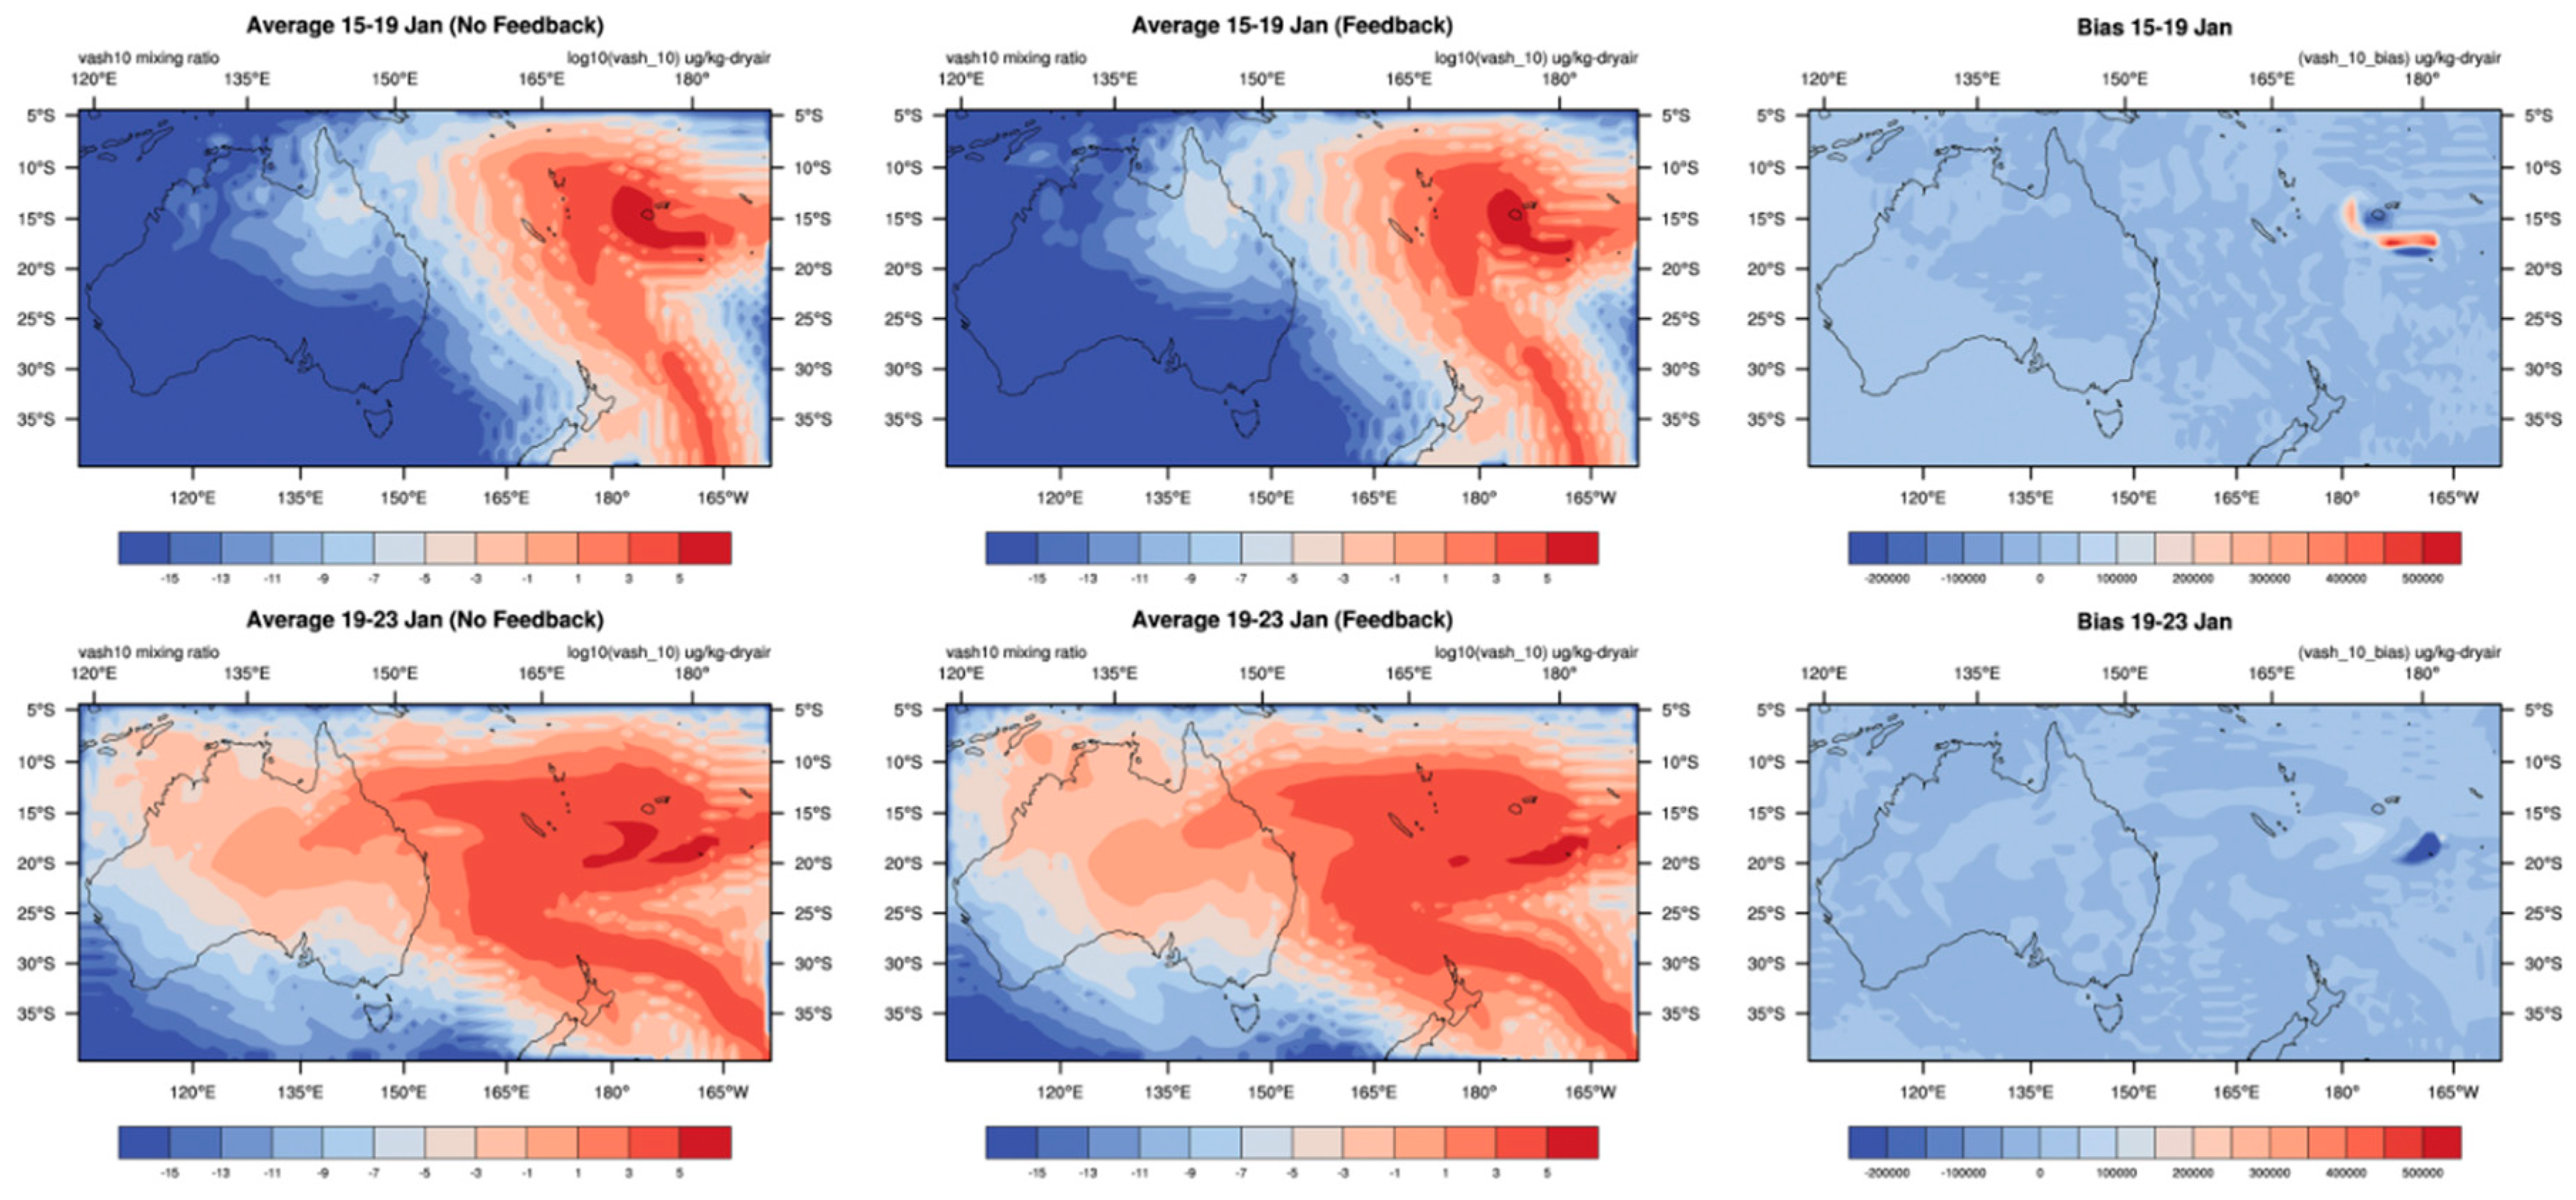
To quantify the effectiveness of the aerosol radiative feedback effects,
Figure 7 presents the comparison between the ash transport of vash_10 particles (assumed to be the one with the finest vash size range) for the earlier studied periods. As depicted in the first two columns, the transport fields of ash cloud particles reconstructed by Feedback and No Feedback runs are consistent for most parts of the domain. In the third column, the bias fields (No Feedback- Feedback) reveal the rates of volcanic ash location differences. There is an apparent small bias in most areas across the study domain. Nevertheless, the presence of a drastic combination of positive and negative biases around the location of the volcano is underlined for the period of 15-19 January (
Figure 7, top right contour). The elongated form of the positively biased plume shape (red color reaching 500000
) in the above period means that the ash cloud concentration is highly overestimated with No feedback, but the situation is reversed on the plume’s flanks. The overestimation tendency is caused by the lower concentration plume predicted with Feedback effects on, which attracts the predicted ash particles to accumulate in this area and favors the positive bias. Another factor that could be associated with the positive bias is the simulation of lower wind speed and PBLH, which limit the movement of air masses and promotes the formation of pollution peaks. The ash cloud was transported towards Australia in the 4 following days (
Figure 7, left and middle panels), which is in total agreement with the wind rose results reported in the synoptic analysis of
Figure 4. The remarkable negative bias nearby the Hunga Tunga volcano is attributed to the production of more ash clouds in the vicinity of the volcano with Feedback effects. In summary, the difference between the results of Feedback and No feedback scenarios is rather at the level of the plume itself. For instance, the plume of 15-19 January was more elongated due to greater stability of the atmosphere limiting dispersion, and its shorter residence time gave a faster propagation due to a higher wind speed.
2.2. Analysis of Sulfur dioxides transport using TROPOMI/S5P
To understand the state of the plume of volcanic ash from the days following the explosion, a spatial analysis of TROPOMI/S5P standard level 2 (L2)
column patterns (
) is presented. This is important because in addition to the volcanic ash emitted, a large quantity of
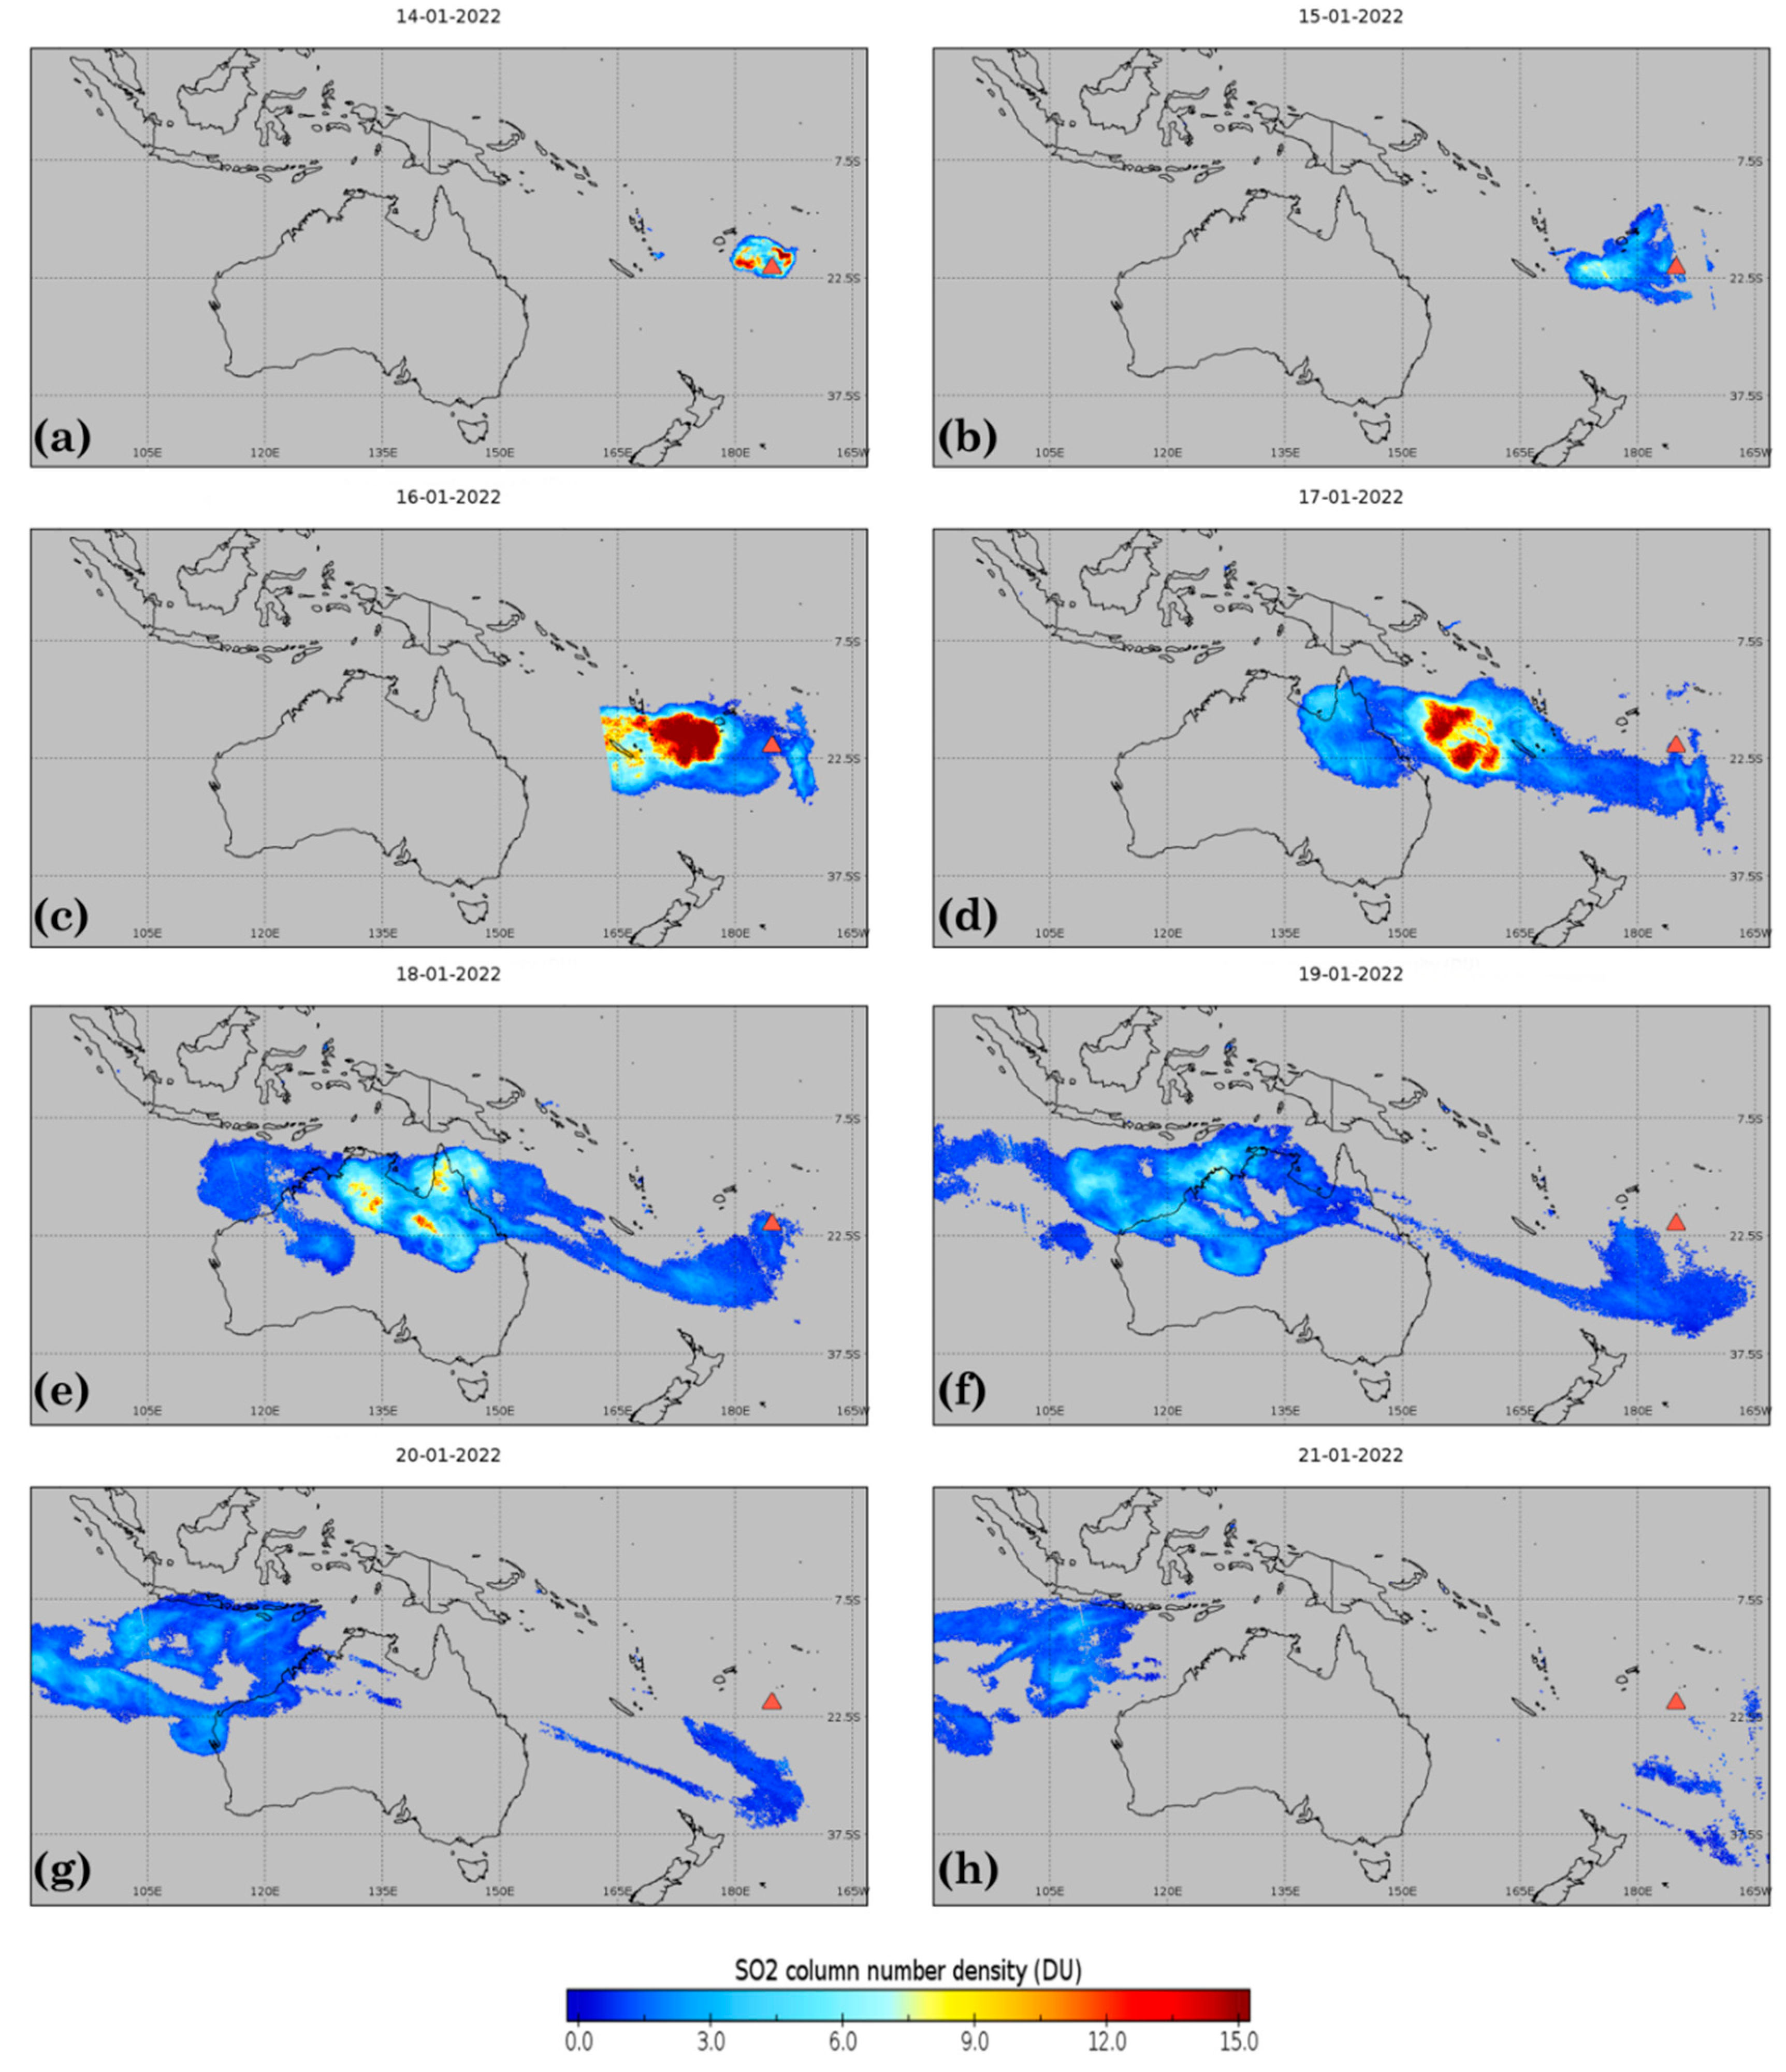
is released into the atmosphere at the time of the eruption. The input dataset for this analysis is mainly the high-resolution record of the instrument data acquired over the study period of 14-21 January 2022, at a daily revisiting interval. The investigated areas include the whole Tonga archipelago and Australia for the sulfur dioxide plume. The contour plots of
Figure 8 summarize the satellite’s daily measurements available for cross-comparison. Because of the less significant sub-aerial eruption that occurred on January 14, 2022 (
Figure 8a), there is evidence of
volcanic plumes in the Northern direction of the volcano. In fact, before the major eruption of January 15th, a paroxysm with a slightly lower amplitude occurred the previous day (January 14, 2022). The submarine larger eruption that occurred the following day (
Figure 8b) produced expanding eruption plume that started to cover nearby Tongan islands with
. The apparent rates were supposed to be greater than that plotted on the figure, but the amounts do not appear to be as extensive as expected. This is due to the moment of the sensing time (00:05 am, UTC) of the TROPOMI/S5P on January, 15th that preceded the detected massive blast. Indeed,
cloud ejections became more apparent on January, 16th (
Figure 8c) hitting the islands of Fiji, Vanuatu, and New Caledonia, and the thresholds reported in the plume center reached 15 DU. Monitored column concentration of sulfur dioxides in the following days shows that the plume was moving with the westerly wind direction (
Figure 8d) and penetrating the Queensland region across the far northeast of Australia, before reaching Australia’s Northern Territory, Queensland, and Western Australia on January 18th (
Figure 8e). In particular, on January 17th, the intense
plume center which lies in the pacific sea near the east coast of Australia continued to spread westward, resulting in crossing the coast of Australia until it is transported towards the above-mentioned locations in the country. During the period 19-20 January, the maps report a lightening in the intensity of the plume and continuation of the propagation in the westerly direction (
Figure 8f and
Figure 8g). The plume has still covered north and northwestern parts of Australia, whilst it entirely shifted in destination to the east and central Java parts of the Indonesian country (
Figure 8h). The recorded plume column density values are fluctuating between 1-4 DU. Thus, while Tonga copes with the aftermath, the images show the huge plume of sulfur dioxide on January 16 over Nouméa, and on January 18 over Australia, more than 7000 km west of the eruption. Finally, because there is no record of extra eruptions in the days following January 15th, the atmospheric circulation has played the role of dispersing the
plume while attenuating its intensity over space and time.
3. Conclusions
Volcanic ash emissions can remarkably impact the environment and the air we breathe at different atmospheric scales, depending on the event’s extent. Among the Hunga Tonga-Hunga Ha’apai volcano’s recent eruption history, the massive blast that rocked the island on January 15th was likely the largest one that caught the eye. The eruption was so violent that caused a tsunami that spread across the Pacific Ocean and whose shock wave circled the earth several times. Through the application of the WRF-Chem model, we have depicted a systematic study of the Hunga Tonga-Hunga Ha’apai eruption recorded in the middle of January 2022, along with its role in volcanic ash and pollutants transport in the pacific area. As far as the concerned case study, the prediction model has demonstrated excellent skills in reproducing the flow field, regional meteorological circulation, anthropogenic and natural aerosols as well as the ash cloud transport emitted during the extreme event. In addition, since meteorological parameters (and consequently pollutant concentrations) can change in distribution because of the presence of aerosols in the atmosphere, we investigated in this study an implemented aerosol feedback parameterization widely used within WRF-Chem v4.4 dynamical core. An ultimate objective from the experiments was to effectively comprehend the direct effects that can exert the usage of radiative feedbacks on near-surface wind patterns (as they are considered to be the driving force for air pollutant dispersion ) and geopotential height at 500 hPa and on the results of the simulated volcanic ash. The major eruption of the underwater Hunga Tonga-Hunga Ha’apai volcano dispersed a massive ash cloud on January 15. During that episode, the ash cloud moved toward Australia and the pacific close islands. The online coupled model prediction scenarios were performed for 8 days, a sufficient duration to follow closely the evolution of the volcanic ash cloud in the studied area. The "No-Feedback" prediction using minimum information on the volcanic eruption, meteorology, and background data was conducted as a control run, where its results have been compared to the scenario obtained from a "Feedback" model simulation taking into account aerosol and gas-chemistry, in addition to direct aerosol feedbacks. The direct comparison between geopotential heights at 500 hPa level pressure derived from ERA5 versus WRF-Chem forecasts did show some discrepancies in their magnitudes when averaged over a 4-day interval period. This in relation slightly affected the vorticities and the wind circulation with WRF-Chem compared to the reanalysis data and shifted the position of the concentrated ash cloud in the surroundings of the volcano. The biases in the latter-mentioned region reflected also the importance of the impaction of radiative aerosol feedback effects. Evaluation of model results with surface weather station measurements gave more biased results in wind speed with Feedback (overall NMB=134%) than No Feedback (overall NMB=127%). WRF-Chem produced reduced differences for wind direction (NMB=7% with No Feedback against 9% with Feedback). Thus the wind speed differences with and without direct feedback effects were more pronounced when averaged over the 8-day predicted period than those of wind directions. Furthermore, the comparison of the volcanic ash cloud diffusion with and without Feedback revealed average 4-day differences near the eruption site, mainly because of the predominant wind speed overestimation rates by the two model runs. The finest particles expelled during the rash (vash_10) traveled as far as the Australian territory. The larger biases (underestimations up to and overestimations up to µg.) in the first 4days after the eruption began to suggest the more intensive role that the aerosol feedback effect causes in the spreading out of Hunga Tonga-Hunga Ha’apai volcanic ash until the New Caledonia islands. We show in our investigation that the CALIPSO and OMPS-LP-derived observations confirm an ash altitude of more than 30 km, indicating the entrance of the plume into the stratospheric layer. The study also encompasses a spatial sampling analysis step, which is aimed to follow the plume’s movement in the days following the eruption. Our study, with the help of TROPOMI/S5P column data, suggested that the volcanic ash plume drifted from the main eruption site and the circulation underwent the Western direction to reach Australia. Eventually, it’s worth noting that, even though the volcano has not detected additional eruptive events since January 15, the complex interactions between meteorology, gas, and aerosol species-oriented research needs to be intensified in this direction. Eventually, it is worth mentioning the study’s limitations: the work represented in this WRF-Chem modeling case has contemplated several discipline areas (weather prediction, volcanic eruption, and observational data analysis), whilst each area has its degree of uncertainty. For instance, the largely coarse grid used in this test case (81 km) is not often a great choice for comparing point observations with fine model output results. Finally, we underline the relative uncertainties of transport processes that occur in regional modeling, because meteorological parameters and atmospheric aerosols mutually interact, compensate or accumulate over time. The future research study will undergo the modeling and assessment of the atmospheric dispersion of the volcanic plume, profit from the available ground-based and satellite observations through applying data assimilation, and imply Artificial Intelligence (AI) models to effectively amend the volcanic ash fluxes prediction of the cloud generated from the Hunga Tonga-Hunga Ha’apai eruption.
References
- Amores, A., Monserrat, S., Marcos, M., Argüeso, D., Villalonga, J., Jordà, G., Gomis, D., 2022. Numerical Simulation of Atmospheric Lamb Waves Generated by the 2022 Hunga-Tonga Volcanic Eruption. Geophys. Res. Lett. 49. [CrossRef]
- Astafyeva, E., Maletckii, B., Mikesell, T.D., Munaibari, E., Ravanelli, M., Coisson, P., Manta, F., Rolland, L., 2022. The 15 January 2022 Hunga Tonga Eruption History as Inferred From Ionospheric Observations. Geophys. Res. Lett. 49, e2022GL098827. [CrossRef]
- Briggs, M.S., Lesage, S., Schultz, C., Mailyan, B., Holzworth, R.H., 2022. A Terrestrial Gamma-Ray Flash From the 2022 Hunga Tonga–Hunga Ha’apai Volcanic Eruption. Geophys. Res. Lett. 49, e2022GL099660. [CrossRef]
- Brunner, D., Savage, N., Jorba, O., Eder, B., Giordano, L., Badia, A., Balzarini, A., Baró, R., Bianconi, R., Chemel, C., Curci, G., Forkel, R., Jiménez-Guerrero, P., Hirtl, M., Hodzic, A., Honzak, L., Im, U., Knote, C., Makar, P., Manders-Groot, A., van Meijgaard, E., Neal, L., Pérez, J.L., Pirovano, G., San Jose, R., Schröder, W., Sokhi, R.S., Syrakov, D., Torian, A., Tuccella, P., Werhahn, J., Wolke, R., Yahya, K., Zabkar, R., Zhang, Y., Hogrefe, C., Galmarini, S., 2015. Comparative analysis of meteorological performance of coupled chemistry-meteorology models in the context of AQMEII phase 2. Atmos. Environ. 115, 470–498. [CrossRef]
- Burton, M., Hayer, C., Miller, C., Christenson, B., 2021. Insights into the 9 December 2019 eruption of Whakaari/White Island from analysis of TROPOMI SO2 imagery. Sci. Adv. 7. [CrossRef]
- Chen, F., Dudhia, J., 2001. Coupling an Advanced Land Surface–Hydrology Model with the Penn State–NCAR MM5 Modeling System. Part I: Model Implementation and Sensitivity. Mon. Weather Rev. 129, 569–585. [CrossRef]
- Cofano, A., Cigna, F., Amato, L.S., de Cumis, M.S., Tapete, D., 2021. Exploiting Sentinel-5P TROPOMI and Ground Sensor Data for the Detection of Volcanic SO2 Plumes and Activity in 2018–2021 at Stromboli, Italy. Sensors 2021, Vol. 21, Page 6991 21, 6991. [CrossRef]
- Corradini, S., Guerrieri, L., Brenot, H., Clarisse, L., Merucci, L., Pardini, F., Prata, A.J., Realmuto, V.J., Stelitano, D., Theys, N., 2021. Tropospheric Volcanic SO2 Mass and Flux Retrievals from Satellite. The Etna December 2018 Eruption. Remote Sens. 2021, Vol. 13, Page 2225 13, 2225. [CrossRef]
- D’Arcangelo, S., Bonforte, A., Santis, A. De, Maugeri, S.R., Perrone, L., Soldani, M., Arena, G., Brogi, F., Calcara, M., Campuzano, S.A., Cianchini, G., Corpo, A. Del, Mauro, D. Di, Fidani, C., Ippolito, A., Lepidi, S., Marchetti, D., Nardi, A., Orlando, M., Piscini, A., Regi, M., Sabbagh, D., Zhima, Z., Yan, R., 2022. A Multi-Parametric and Multi-Layer Study to Investigate the Largest 2022 Hunga Tonga–Hunga Ha’apai Eruptions. Remote Sens. 2022, Vol. 14, Page 3649 14, 3649. [CrossRef]
- De Laat, A., Vazquez-Navarro, M., Theys, N., Stammes, P., 2020. Analysis of properties of the 19 February 2018 volcanic eruption of Mount Sinabung in S5P/TROPOMI and Himawari-8 satellite data. Nat. Hazards Earth Syst. Sci. 20, 1203–1217. [CrossRef]
- Edmonds, M., Oppenheimer, C., Pyle, D.M., Herd, R.A., Thompson, G., 2003. SO2 emissions from Soufrière Hills Volcano and their relationship to conduit permeability, hydrothermal interaction and degassing regime. J. Volcanol. Geotherm. Res. 124, 23–43. [CrossRef]
- Fast, J.D., Gustafson, W.I., Easter, R.C., Zaveri, R.A., Barnard, J.C., Chapman, E.G., Grell, G.A., Peckham, S.E., 2006. Evolution of ozone, particulates, and aerosol direct radiative forcing in the vicinity of Houston using a fully coupled meteorology-chemistry-aerosol model. J. Geophys. Res. Atmos. 111. [CrossRef]
- Garvin, J.B., Slayback, D.A., Ferrini, V., Frawley, J., Giguere, C., Asrar, G.R., Andersen, K., 2018. Monitoring and Modeling the Rapid Evolution of Earth’s Newest Volcanic Island: Hunga Tonga Hunga Ha’apai (Tonga) Using High Spatial Resolution Satellite Observations. Geophys. Res. Lett. 45, 3445–3452. [CrossRef]
- Global Volcanism Program | Report on Hunga Tonga-Hunga Ha’apai (Tonga) — 12 January-18 January 2022 [WWW Document], n.d. URL https://volcano.si.edu/showreport.cfm?doi=GVP.WVAR20220112-243040 (accessed 2.1.22).
- Grell, G.A., Dévényi, D., 2002. A generalized approach to parameterizing convection combining ensemble and data assimilation techniques. Geophys. Res. Lett. 29, 38–1. [CrossRef]
- Grell, G.A., Peckham, S.E., Schmitz, R., McKeen, S.A., Frost, G., Skamarock, W.C., Eder, B., 2005. Fully coupled “online” chemistry within the WRF model. Atmos. Environ. 39, 6957–6975. [CrossRef]
- Guenther, A., Karl, T., Harley, P., Wiedinmyer, C., Palmer, P.I., Geron, C., 2006. Estimates of global terrestrial isoprene emissions using MEGAN (Model of Emissions of Gases and Aerosols from Nature). Atmos. Chem. Phys. 6, 3181–3210. [CrossRef]
- Hedelt, P., Efremenko, D.S., Loyola, D.G., Spurr, R., Clarisse, L., 2019. Sulfur dioxide layer height retrieval from Sentinel-5 Precursor/TROPOMI using FP_ILM. Atmos. Meas. Tech. 12, 5503–5517. [CrossRef]
- Hirtl, M., Stuefer, M., Arnold, D., Grell, G., Maurer, C., Natali, S., Scherllin-Pirscher, B., Webley, P., 2019. The effects of simulating volcanic aerosol radiative feedbacks with WRF-Chem during the Eyjafjallajökull eruption, April and May 2010. Atmos. Environ. 198, 194–206. [CrossRef]
- Hong, S.-Y., Dudhia, J., Chen, S.-H., 2004. A Revised Approach to Ice Microphysical Processes for the Bulk Parameterization of Clouds and Precipitation. Mon. Weather Rev. 132, 103–120. [CrossRef]
- Hong, S.-Y., Noh, Y., Dudhia, J., 2006. A New Vertical Diffusion Package with an Explicit Treatment of Entrainment Processes. Mon. Weather Rev. 134, 2318–2341. [CrossRef]
- Hunga Tonga-Hunga Ha‘apai Erupts [WWW Document], n.d. URL https://earthobservatory.nasa.gov/images/149347/hunga-tonga-hunga-haapai-erupts (accessed 2.1.22).
- Iacono, M.J., Delamere, J.S., Mlawer, E.J., Shephard, M.W., Clough, S.A., Collins, W.D., 2008. Radiative forcing by long-lived greenhouse gases: Calculations with the AER radiative transfer models. J. Geophys. Res. Atmos. 113, 13103. [CrossRef]
- Inguaggiato, S., Vita, F., Rouwet, D., Bobrowski, N., Morici, S., Sollami, A., 2011. Geochemical evidence of the renewal of volcanic activity inferred from CO2 soil and SO2 plume fluxes: the 2007 Stromboli eruption (Italy). Bull. Volcanol. 2011 734 73, 443–456. [CrossRef]
- Inness, A., Ades, M., Balis, D., Efremenko, D., Flemming, J., Hedelt, P., Koukouli, M.-E., Loyola, D., Ribas, R., 2021. The CAMS volcanic forecasting system utilizing near-real time data assimilation of S5P/TROPOMI SO2 retrievals. Geosci. Model Dev. Discuss. 1–28. [CrossRef]
- Jiménez, P.A., Dudhia, J., González-Rouco, J.F., Navarro, J., Montávez, J.P., García-Bustamante, E., 2012. A Revised Scheme for the WRF Surface Layer Formulation. Mon. Weather Rev. 140, 898–918. [CrossRef]
- Kampouri, A., Amiridis, V., Solomos, S., Gialitaki, A., Marinou, E., Spyrou, C., Georgoulias, A.K., Akritidis, D., Papagiannopoulos, N., Mona, L., Scollo, S., Tsichla, M., Tsikoudi, I., Pytharoulis, I., Karacostas, T., Zanis, P., 2020. Investigation of Volcanic Emissions in the Mediterranean: “The Etna–Antikythera Connection.” Atmos. 2021, Vol. 12, Page 40 12, 40. [CrossRef]
- Lin, J.T., Rajesh, P.K., Lin, C.C.H., Chou, M.Y., Liu, J.Y., Yue, J., Hsiao, T.Y., Tsai, H.F., Chao, H.M., Kung, M.M., 2022. Rapid Conjugate Appearance of the Giant Ionospheric Lamb Wave Signatures in the Northern Hemisphere After Hunga-Tonga Volcano Eruptions. Geophys. Res. Lett. 49, e2022GL098222. [CrossRef]
- Maria-Elissavet Koukouli, Konstantinos Michailidis, Pascal Hedelt, Isabelle A. Taylor, Antje Inness, Lieven Clarisse, Dimitris Balis, Dmitry Efremenko, Diego Loyola, Roy G. Grainger, and C.R., n.d. ACPD - Volcanic SO2 Layer Height by TROPOMI/S5P; validation against IASI/MetOp and CALIOP/CALIPSO observations.
- McKee, K., Smith, C.M., Reath, K., Snee, E., Maher, S., Matoza, R.S., Carn, S., Roman, D.C., Mastin, L., Anderson, K., Damby, D., Itikarai, I., Mulina, K., Saunders, S., Assink, J.D., de Negri Leiva, R., Perttu, A., 2021. Evaluating the state-of-the-art in remote volcanic eruption characterization Part II: Ulawun volcano, Papua New Guinea. J. Volcanol. Geotherm. Res. 420, 107381. [CrossRef]
- Pandey, P.C., 2022. Highlighting the role of earth observation Sentinel5P TROPOMI in monitoring volcanic eruptions: a report on Hunga Tonga, a Submarine Volcano. 13, 912-923. [CrossRef]
- Park, S.H., Skamarock, W.C., Klemp, J.B., Fowler, L.D., Duda, M.G., 2013. Evaluation of global atmospheric solvers using extensions of the jablonowski and williamson baroclinic wave test case. Mon. Weather Rev. [CrossRef]
- Poli, P., Shapiro, N.M., 2022. Rapid Characterization of Large Volcanic Eruptions: Measuring the Impulse of the Hunga Tonga Ha’apai Explosion From Teleseismic Waves. Geophys. Res. Lett. 49, e2022GL098123. [CrossRef]
- Queißer, M., Burton, M., Theys, N., Pardini, F., Salerno, G., Caltabiano, T., Varnam, M., Esse, B., Kazahaya, R., 2019. TROPOMI enables high resolution SO2 flux observations from Mt. Etna, Italy, and beyond. Sci. Reports 2019 91 9, 1–12. [CrossRef]
- Snoun, H., Bellakhal, G., Kanfoudi, H., Zhang, X., Chahed, J., 2019a. One-way coupling of WRF with a Gaussian dispersion model: a focused fine-scale air pollution assessment on southern Mediterranean. Environ. Sci. Pollut. Res. [CrossRef]
- Snoun, H., Kanfoudi, H., Bellakhal, G., Chahed, J., 2021. Hazardous Materials Prediction Using an Artificial Neural Network and Meteorological FASDAS Data Assimilation. Environ. Sci. Eng. 2045–2049. [CrossRef]
- Snoun, H., Kanfoudi, H., Bellakhal, G., Chahed, J., 2019b. Validation and sensitivity analysis of the WRF mesoscale model PBL schemes over Tunisia using dynamical downscaling approach. Euro-Mediterranean J. Environ. Integr. 2019 41 4, 1–10. [CrossRef]
- Stohl, A., Forster, C., Frank, A., Seibert, P., Wotawa, G., 2005. Technical note: The Lagrangian particle dispersion model FLEXPART version 6.2. Atmos. Chem. Phys. 5, 2461–2474. [CrossRef]
- Stuefer, M., Freitas, S.R., Grell, G., Webley, P., Peckham, S., McKeen, S.A., Egan, S.D., 2013. Inclusion of ash and SO2 emissions from volcanic eruptions in WRF-Chem: development and some applications. Geosci. Model Dev. 6, 457–468. [CrossRef]
- Theys, N., Hedelt, P., De Smedt, I., Lerot, C., Yu, H., Vlietinck, J., Pedergnana, M., Arellano, S., Galle, B., Fernandez, D., Carlito, C.J.M., Barrington, C., Taisne, B., Delgado-Granados, H., Loyola, D., Van Roozendael, M., 2019. Global monitoring of volcanic SO2 degassing with unprecedented resolution from TROPOMI onboard Sentinel-5 Precursor. Sci. Reports 2019 91 9, 1–10. [CrossRef]
- Veefkind, J.P., Aben, I., McMullan, K., Förster, H., de Vries, J., Otter, G., Claas, J., Eskes, H.J., de Haan, J.F., Kleipool, Q., van Weele, M., Hasekamp, O., Hoogeveen, R., Landgraf, J., Snel, R., Tol, P., Ingmann, P., Voors, R., Kruizinga, B., Vink, R., Visser, H., Levelt, P.F., 2012. TROPOMI on the ESA Sentinel-5 Precursor: A GMES mission for global observations of the atmospheric composition for climate, air quality and ozone layer applications. Remote Sens. Environ. 120, 70–83. [CrossRef]
- Wright, C.J., Hindley, N.P., Alexander, M.J., Barlow, M., Hoffmann, L., Mitchell, C.N., Prata, F., Bouillon, M., Carstens, J., Clerbaux, C., Osprey, S.M., Powell, N., Randall, C.E., Yue, J., 2022a. Surface-to-space atmospheric waves from Hunga Tonga-Hunga Ha’apai eruption. Nat. 2022 1–3. [CrossRef]
- Yuen, D.A., Scruggs, M.A., Spera, F.J., Zheng, Y., Hu, H., McNutt, S.R., Thompson, G., Mandli, K., Keller, B.R., Wei, S.S., Peng, Z., Zhou, Z., Mulargia, F., Tanioka, Y., 2022. Under the surface: Pressure-induced planetary-scale waves, volcanic lightning, and gaseous clouds caused by the submarine eruption of Hunga Tonga-Hunga Ha’apai volcano. Earthq. Res. Adv. 2, 100134. [CrossRef]
- Zuo, M., Zhou, T., Man, W., Chen, X., Liu, J., Liu, F., Gao, C., 2022. Volcanoes and Climate: Sizing up the Impact of the Recent Hunga Tonga-Hunga Ha’apai Volcanic Eruption from a Historical Perspective. Adv. Atmos. Sci. 2022 1–8. [CrossRef]
|
Disclaimer/Publisher’s Note: The statements, opinions and data contained in all publications are solely those of the individual author(s) and contributor(s) and not of MDPI and/or the editor(s). MDPI and/or the editor(s) disclaim responsibility for any injury to people or property resulting from any ideas, methods, instructions or products referred to in the content. |
© 2024 by the authors. Licensee MDPI, Basel, Switzerland. This article is an open access article distributed under the terms and conditions of the Creative Commons Attribution (CC BY) license (http://creativecommons.org/licenses/by/4.0/).
