Submitted:
06 February 2024
Posted:
07 February 2024
You are already at the latest version
Abstract
Keywords:
1. Introduction
2. Material and methods
2.1. Samples preparation
2.2. Phase and microstructural characterization
2.3. Tensile test
3. Results
3.1. Phase and microstructure analysis
3.2. Mechanical properties
4. Discussions
4.1. Microstructure evolution
4.2. Strengthening mechanism
5. Conclusions
Acknowledgments
Conflicts of Interest
References
- Miracle, D.B.; Senkov, O.N. A critical review of high entropy alloys and related concepts. Acta Materia 2017, 122, 448–511. [Google Scholar] [CrossRef]
- Li, Z.; Pradeep, K.G.; Deng, Y.; Raabe, D.; Tasan, C.C. Metastable high-entropy dual-phase alloys overcome the strength–ductility trade-off. Nature 2016, 534, 227–230. [Google Scholar] [CrossRef] [PubMed]
- Huang, X.L.; Huang, L.P.; Peng, H.L.; Liu, Y.; Liu, B.; Li, S. Enhancing strength-ductility synergy in a casting non-equiatomic NiCoCr-based high-entropy alloy by Al and Ti combination addition. Scr. Mater. 2021, 203, 114046. [Google Scholar] [CrossRef]
- Xie, Y.; Liang, J.; Zhang, D.; Luo, Y.; Zhang, Z.; Liu, Y.; Wang, J. Sustaining strength–ductility synergy of CoCrFeNiMn high entropy alloy by a multilevel heterogeneity associated with nanoparticles. Scr. Mater. 2020, 187, 390–394. [Google Scholar] [CrossRef]
- Han, C.; Fang, Q.; Shi, Y.; Tor, S.B.; Chua, C.K.; Zhou, K. Recent Advances on High-Entropy Alloys for 3D Printing. Adv. Mater. 2020, 32, e1903855. [Google Scholar] [CrossRef] [PubMed]
- Li, R.; Niu, P.; Yuan, T.; Cao, P.; Chen, C.; Zhou, K. Selective laser melting of an equiatomic CoCrFeMnNi high-entropy alloy: Processability, non-equilibrium microstructure and mechanical property. J. Alloy. Compd. 2018, 746, 125–134. [Google Scholar] [CrossRef]
- Brif, Y.; Thomas, M.; Todd, I. The use of high-entropy alloys in additive manufacturing. Scr. Mater. 2015, 99, 93–96. [Google Scholar] [CrossRef]
- Moghaddam, A.O.; Shaburova, N.A.; Samodurova, M.N.; Abdollahzadeh, A.; Trofimov, E.A. Additive manufacturing of high entropy alloys: A practical review. J. Mater. Sci. Technol. 2020, 77, 131–162. [Google Scholar] [CrossRef]
- Zhu, Z.; Nguyen, Q.; Ng, F.; An, X.; Liao, X.; Liaw, P.; Nai, S.; Wei, J. Hierarchical microstructure and strengthening mechanisms of a CoCrFeNiMn high entropy alloy additively manufactured by selective laser melting. Scr. Mater. 2018, 154, 20–24. [Google Scholar] [CrossRef]
- Fu, Z.; Yang, B.; Gan, K.; Yan, D.; Li, Z.; Gou, G.; Chen, H.; Wang, Z. Improving the hydrogen embrittlement resistance of a selective laser melted high-entropy alloy via modifying the cellular structures. Corros. Sci. 2021, 190, 109695. [Google Scholar] [CrossRef]
- Lin, D.; Xu, L.; Jing, H.; Han, Y.; Zhao, L.; Minami, F. Effects of annealing on the structure and mechanical properties of FeCoCrNi high-entropy alloy fabricated via selective laser melting. Addit. Manuf. 2020, 32, 101058. [Google Scholar] [CrossRef]
- Yang, F.; Wang, L.; Wang, Z.; Wu, Q.; Zhou, K.; Lin, X.; Huang, W. Ultra strong and ductile eutectic high entropy alloy fabricated by selective laser melting. J. Mater. Sci. Technol. 2022, 106, 128–132. [Google Scholar] [CrossRef]
- Vogiatzief, D.; Evirgen, A.; Pedersen, M.; Hecht, U. Laser powder bed fusion of an Al-Cr-Fe-Ni high-entropy alloy produced by blending of pre-alloyed and elemental powder: Process parameters, microstructures, and mechanical properties. J. Alloys Compd 2022, 918, 165658. [Google Scholar]
- Zhang, M.; Zhou, X.; Wang, D.; Zhu, W.; Li, J.; Zhao, Y.F. AlCoCuFeNi high-entropy alloy with tailored microstructure and outstanding compressive properties fabricated via selective laser melting with heat treatment. MAT SCI ENG A-STRUCT 2019, 743, 773–784. [Google Scholar] [CrossRef]
- Tan, X.; Chen, D.; Xu, J.; Chen, H.; Peng, X.; Guo, L.; Xiao, H.; Zhang, Q. High strength Fe32Cr33Ni29Al3Ti3 manufactured by selective laser melting. J MATER RES TECHNOL 2023, 27, 3701–3711. [Google Scholar] [CrossRef]
- Miller, M.; Burke, M. An APFIM/AEM characterization of alloy X750. Appl. Surf. Sci. 1993, 67, 292–298. [Google Scholar] [CrossRef]
- Fu, Z.; Yang, B.; Gan, K.; Yan, D.; Li, Z.; Gou, G.; Chen, H.; Wang, Z. Improving the hydrogen embrittlement resistance of a selective laser melted high-entropy alloy via modifying the cellular structures. Corros. Sci. 2021, 190, 109695. [Google Scholar] [CrossRef]
- E08 Committee, E1820-11E2 Standard Test Methods for Measurement of Fracture Toughness, ASTM International, USA, 2011.
- Wang, L.; Kong, D.; Zhang, Y.; Xiao, L.; Lu, Y.; Chen, Z.; Zhang, Z.; Zou, J.; Zhu, T.; Han, X. Mechanically Driven Grain Boundary Formation in Nickel Nanowires. ACS Nano 2017, 11, 12500–12508. [Google Scholar] [CrossRef]
- Li, N.; Jia, C.-L.; Wang, Z.-W.; Wu, L.-H.; Ni, D.-R.; Li, Z.-K.; Fu, H.-M.; Xue, P.; Xiao, B.-L.; Ma, Z.-Y.; et al. Achieving a High-Strength CoCrFeNiCu High-Entropy Alloy with an Ultrafine-Grained Structure via Friction Stir Processing. Acta Met. Sin. (English Lett. 2020, 33, 947–956. [Google Scholar] [CrossRef]
- Dong, Y.; Zhang, D.; Li, D.; Jia, H.; Qin, W. Control of Ostwald ripening. Sci. China Mater. 2022, 66, 1249–1255. [Google Scholar] [CrossRef]
- Oikawa, T.; Enomoto, M. Pinning Effects on Grain Growth of Ferrite in an Fe-C-B Alloy. TETSU TO HAGANE-JOURNAL OF THE IRON AND STEEL INSTITUTE OF JAPAN 2011, 97, 584–591. [Google Scholar] [CrossRef]
- Li, K.; Shen, Y.; Li, D.Y.; Peng, Y.H. Phase Field Study of Second Phase Particles-Pinning on Strain Induced Grain Boundary Migration. Mater. Sci. Forum 2020, 993, 967–975. [Google Scholar] [CrossRef]
- Panda, J.P.; Arya, P.; Guruvidyathri, K.; Ravikirana; Murty, B. S. Studies on Kinetics of BCC to FCC Phase Transformation in AlCoCrFeNi Equiatomic High Entropy Alloy. Met. Mater. Trans. A 2021, 52, 1679–1688. [Google Scholar] [CrossRef]
- Zhang, X.; Mu, W.; Li, J. Microstructure evolution of TRIP-assisted lean duplex stainless steel 2101 during in-situ tensile test after a thermomechanical treatment. Mater. Sci. Eng. A 2022, 143037, 20. [Google Scholar] [CrossRef]
- Zhou, R.; Liu, Y.; Liu, B.; Li, J.; Fang, Q. Precipitation behavior of selective laser melted FeCoCrNiC0.05 high entropy alloy. Intermetallics 2018, 106, 20–25. [Google Scholar] [CrossRef]
- Zhao, Y.L.; Yang, T.; Tong, Y.; Wang, J.; Luan, J.H.; Jiao, Z.B.; Chen, D.; Yang, Y.; Hu, A.; Liu, C.T.; Kai, J.J. Heterogeneous precipitation behavior and stacking-fault-mediated deformation in a CoCrNi-based medium-entropy alloy. Acta Mater 2017, 138, 72–82. [Google Scholar] [CrossRef]
- Guo, Y.; Li, M.; Li, P.; Chen, C.; Zhan, Q.; Chang, Y.; Zhang, Y. Microstructure and mechanical properties of oxide dispersion strengthened FeCoNi concentrated solid solution alloys. J. Alloy. Compd. 2019, 820, 153104. [Google Scholar] [CrossRef]
- Mohanty, S.; Kothari, A.; Raghavan, R.; Sahu, V.K.; Gurao, N.P.; Sahu, K.K.; Dhindaw, B.K.; Zeng, L.; Xia, M.; Gollapudi, S. Microstructure and Mechanical Properties of High-Carbon-Containing Fe-Ni-Mn-Al-Cr High-Entropy Alloy: Effect of Thermomechanical Treatment. Front. Mater. 2022, 9, 915278. [Google Scholar] [CrossRef]
- Wang, Y.M.; Voisin, T.; Mckeown, T.; et al. Additively tailorable hierarchical stainless steels with high strength and ductility. Nat Mater 2018, 17, 63–70. [Google Scholar] [CrossRef]
- Yim, D.; Sathiyamoorthi, P.; Hong, S.J.; et al. Fabrication and mechanical properties of TiC reinforced CoCr-FeMnNi high-entropy alloy composite by water atomization and spark plasma sintering. J Alloys Compd 2019, 781, 389–396. [Google Scholar] [CrossRef]
- Ren, J.; Zhang, Y.; Zhao, D.; Chen, Y.; Guan, S.; Liu, Y.; Liu, L.; Peng, S.; Kong, F.; Poplawsky, J.D.; et al. Strong yet ductile nanolamellar high-entropy alloys by additive manufacturing. Nature 2022, 608, 62–68. [Google Scholar] [CrossRef] [PubMed]
- Williamson, G.K.; Smallman, R.E., III. Dislocation densities in some annealed and cold-worked metals from measurements on the X-ray debye-scherrer spectrum. Philos. Mag. 1956, 1, 34–46. [Google Scholar] [CrossRef]
- Williamson, G.K.; Hall, W.H. X-ray line broadening from filed aluminium and wolfram. Acta Metallurgica 1953, 1, 22–31. [Google Scholar] [CrossRef]
- Huang, T.; Shuai, L.; Wakeel, A.; Wu, G.; Hansen, N.; Huang, X. Strengthening mechanisms and Hall-Petch stress of ultrafine grained Al-0.3%Cu. Acta Mater. 2018, 156, 369–378. [Google Scholar] [CrossRef]
- Liu, H.; Shen, Y.; Ma, J.; Zheng, P.; Zhang, L. Grain Size Dependence of Uniform Elongation in Single-Phase FCC/BCC Metals. J. Mater. Eng. Perform. 2016, 25, 3599–3605. [Google Scholar] [CrossRef]
- Furui, M.; Iishiro, A.; Saji, S. Effect of grain size on the elongation for 3004 aluminum alloy. J. Jpn. Inst. Light Met. 2001, 51, 409–413. [Google Scholar] [CrossRef]
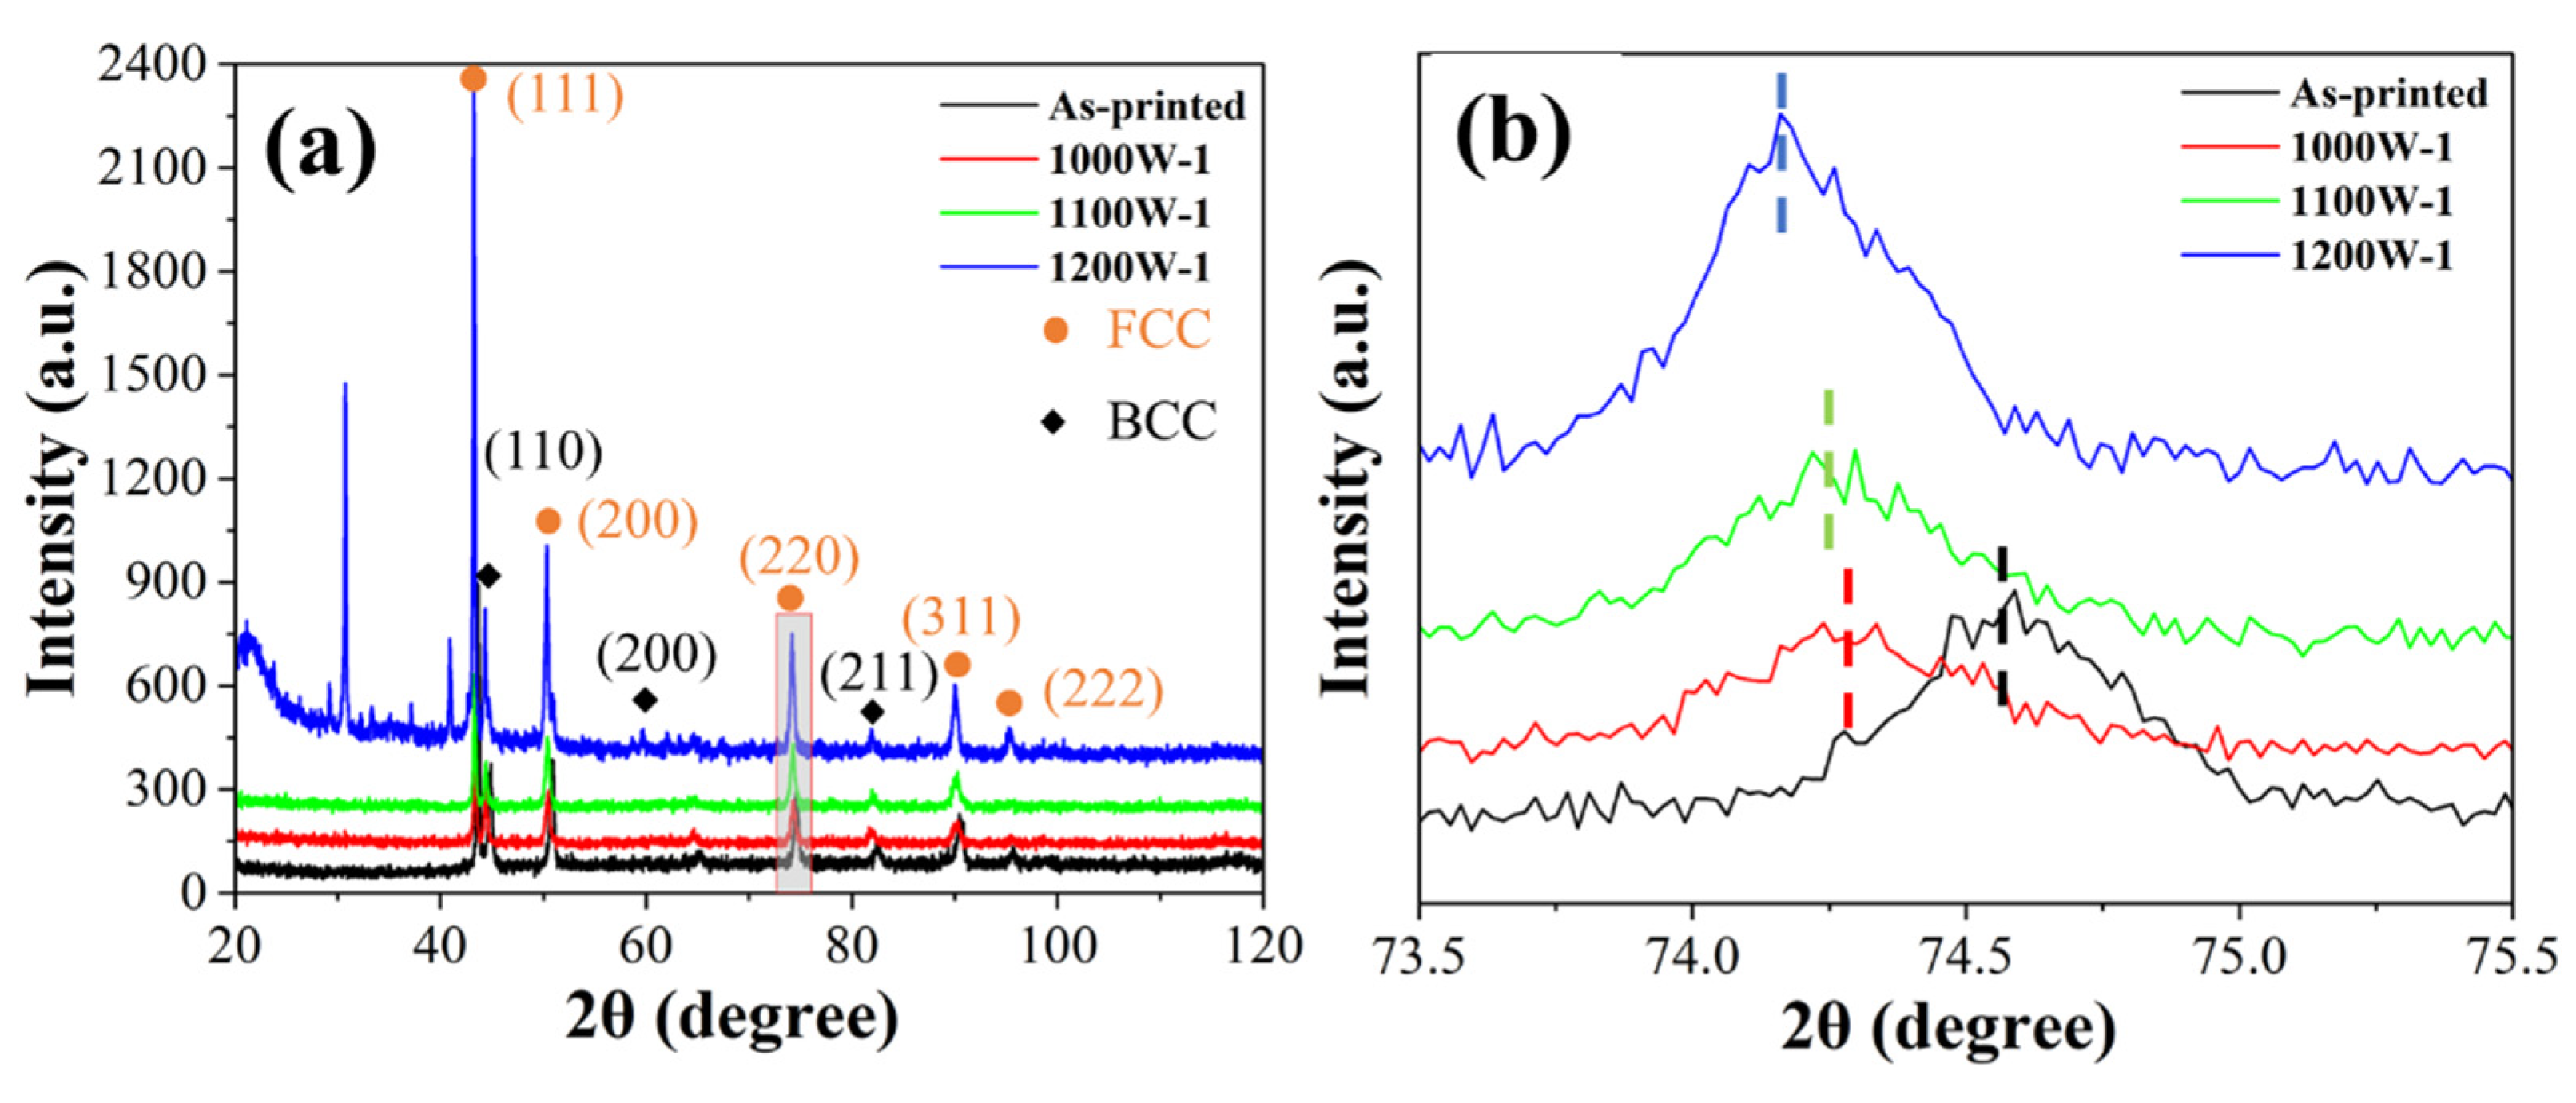
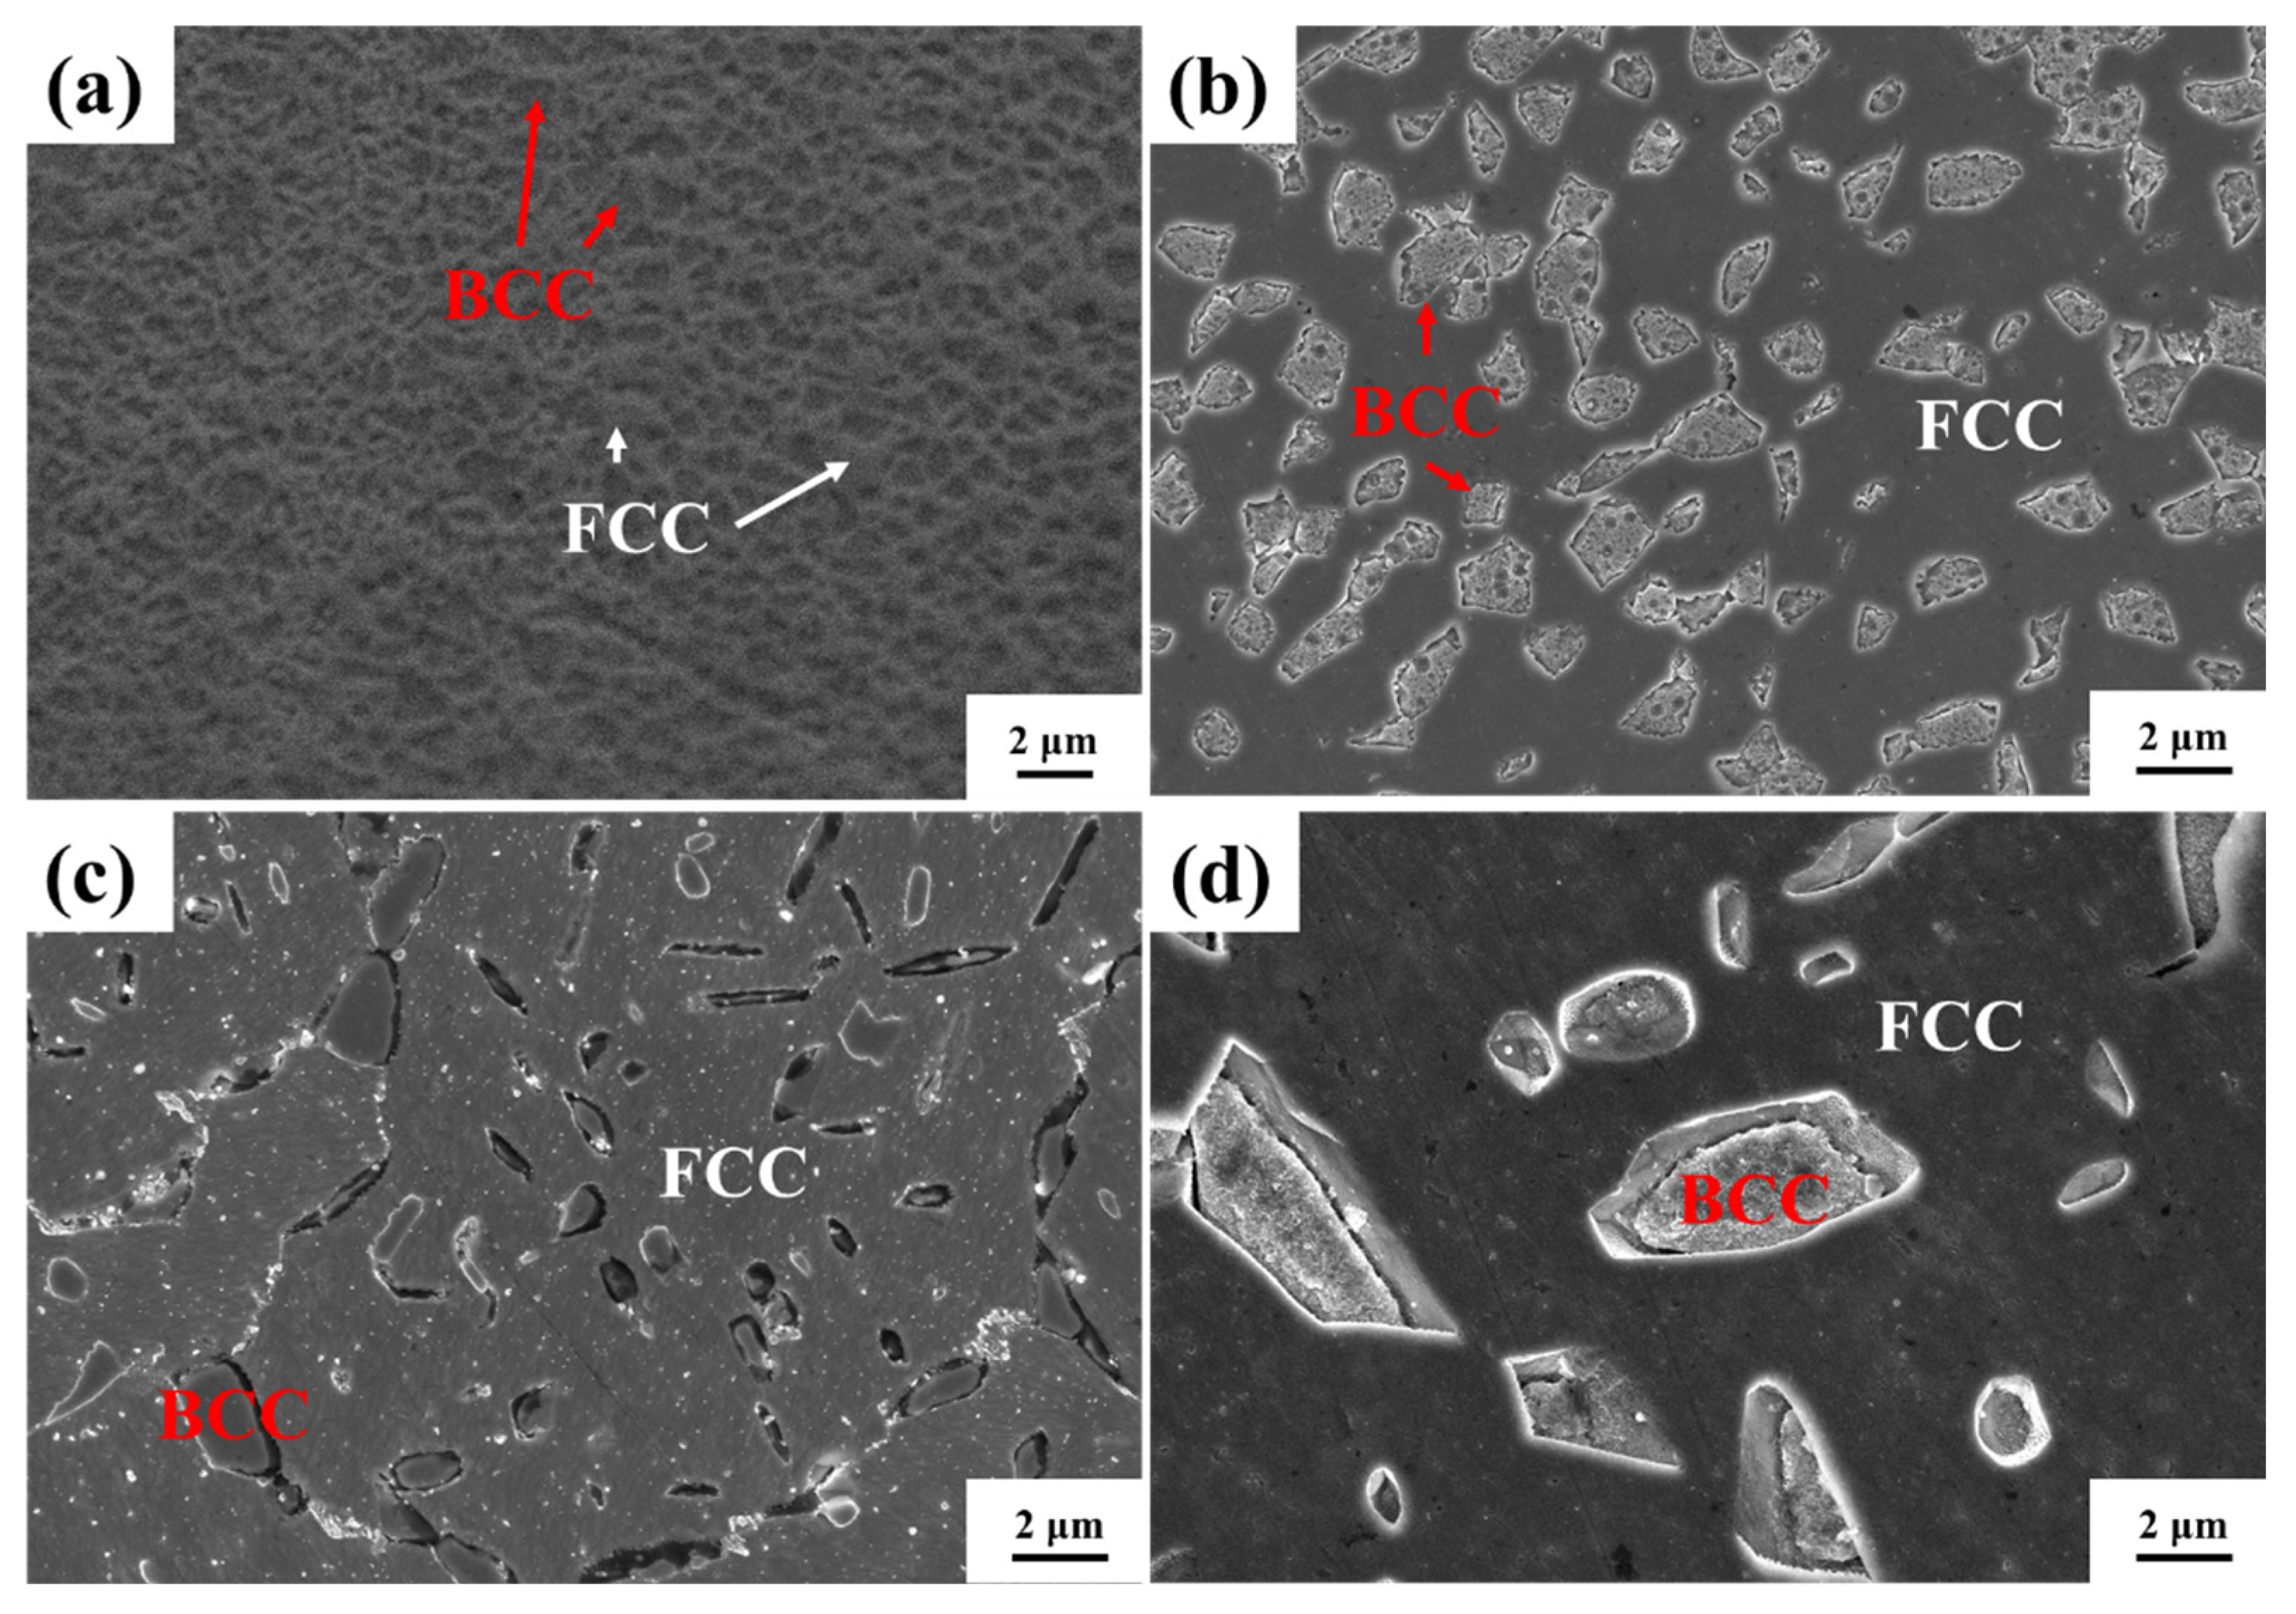
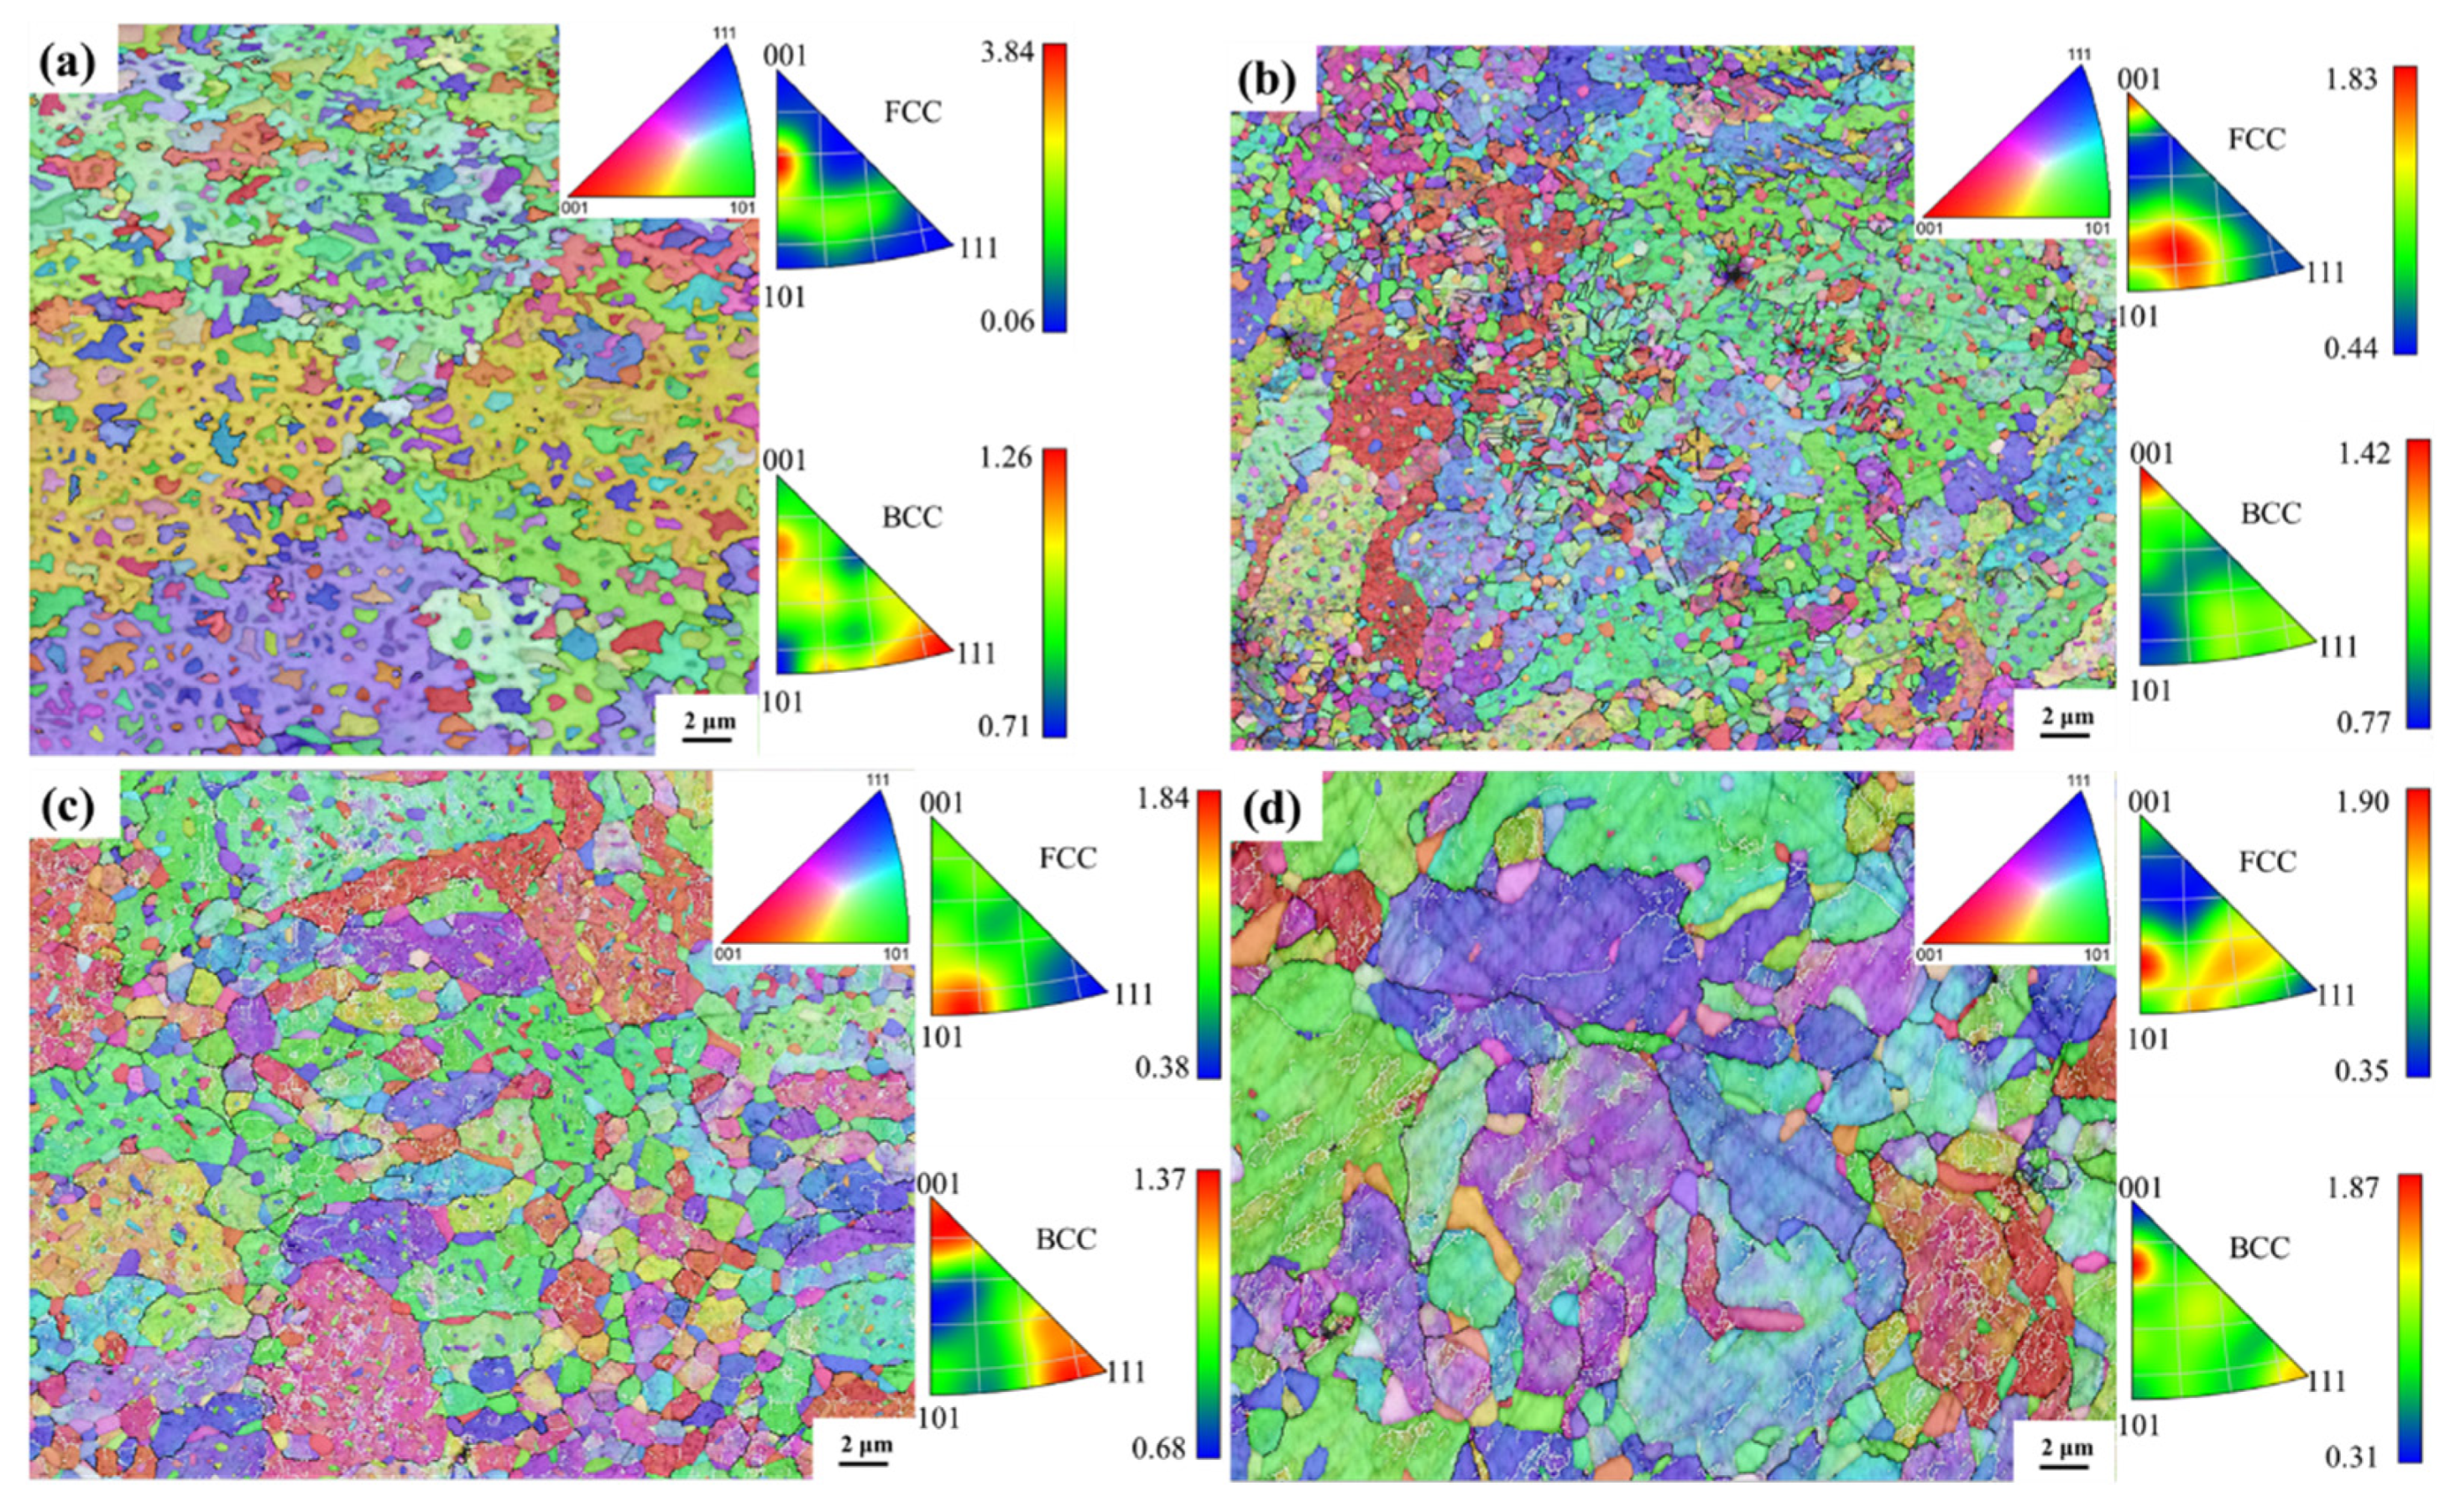
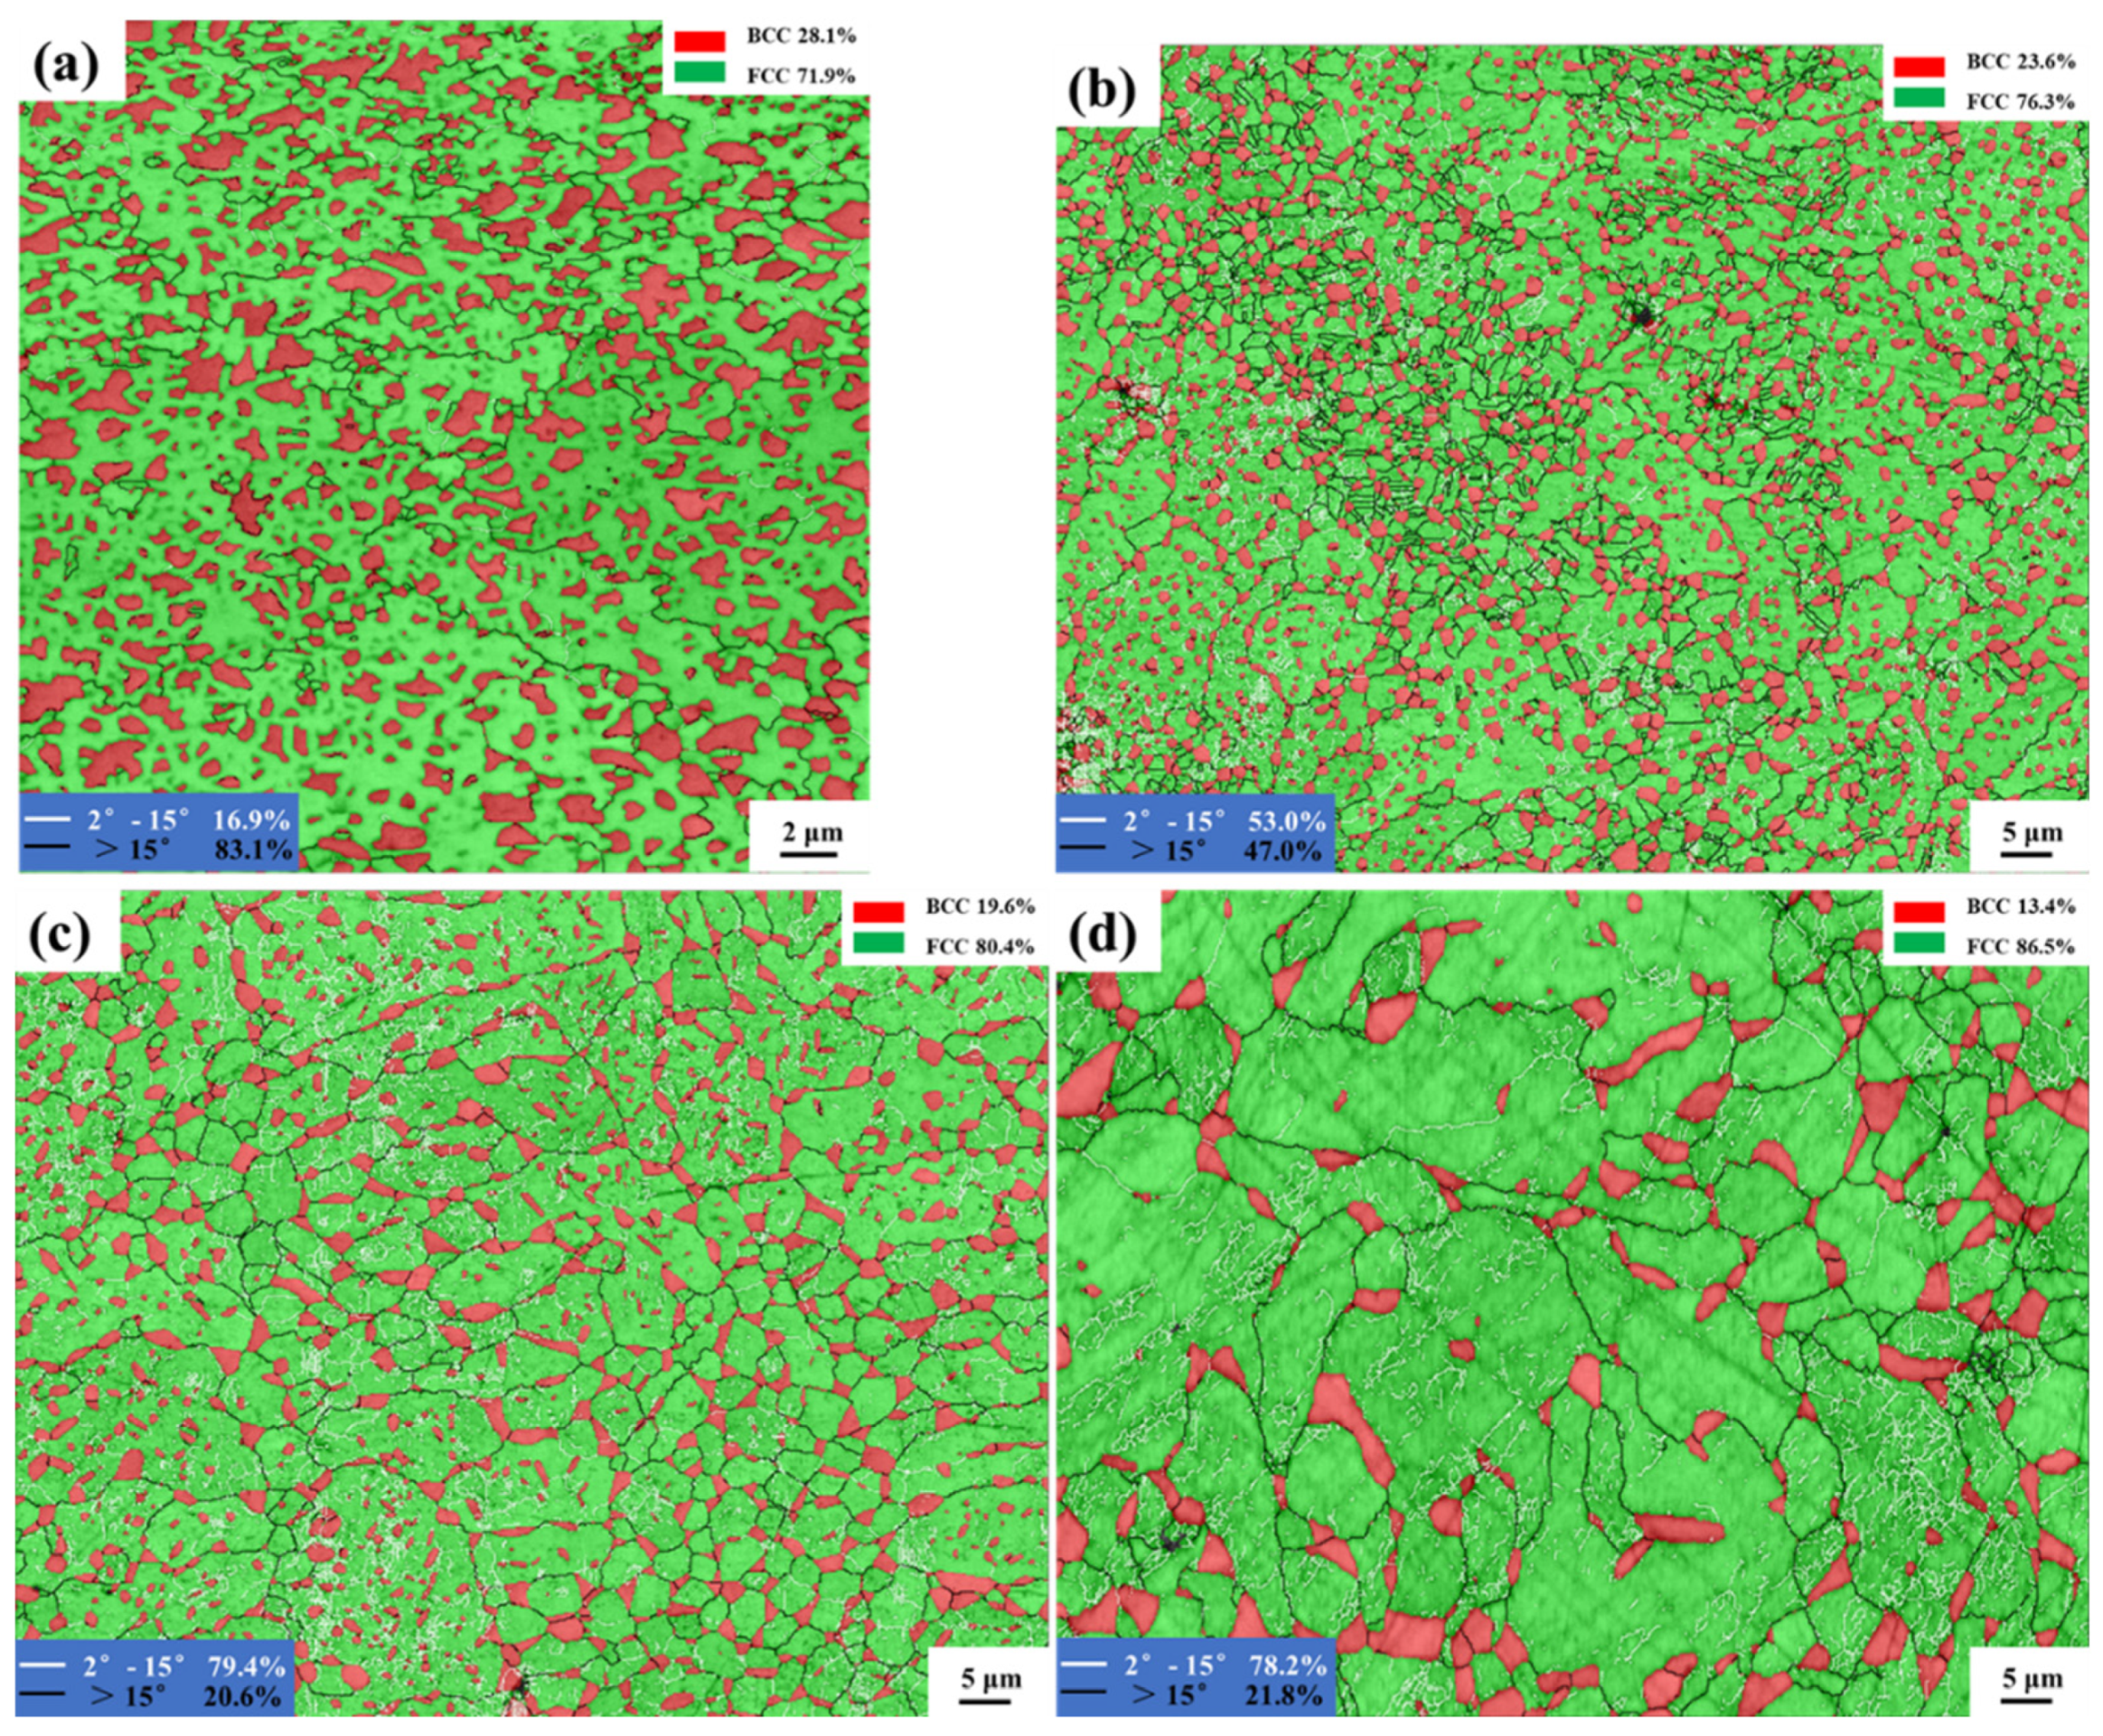
| Sample | Temperature | Heat preservation time | Cooling method |
|---|---|---|---|
| 1000W-1 | 1000 °C | 1 hour | Water-cooled |
| 1100W-1 | 1100 °C | 1 hour | Water-cooled |
| 1200W-1 | 1200 °C | 1 hour | Water-cooled |
| Sample | ||||
|---|---|---|---|---|
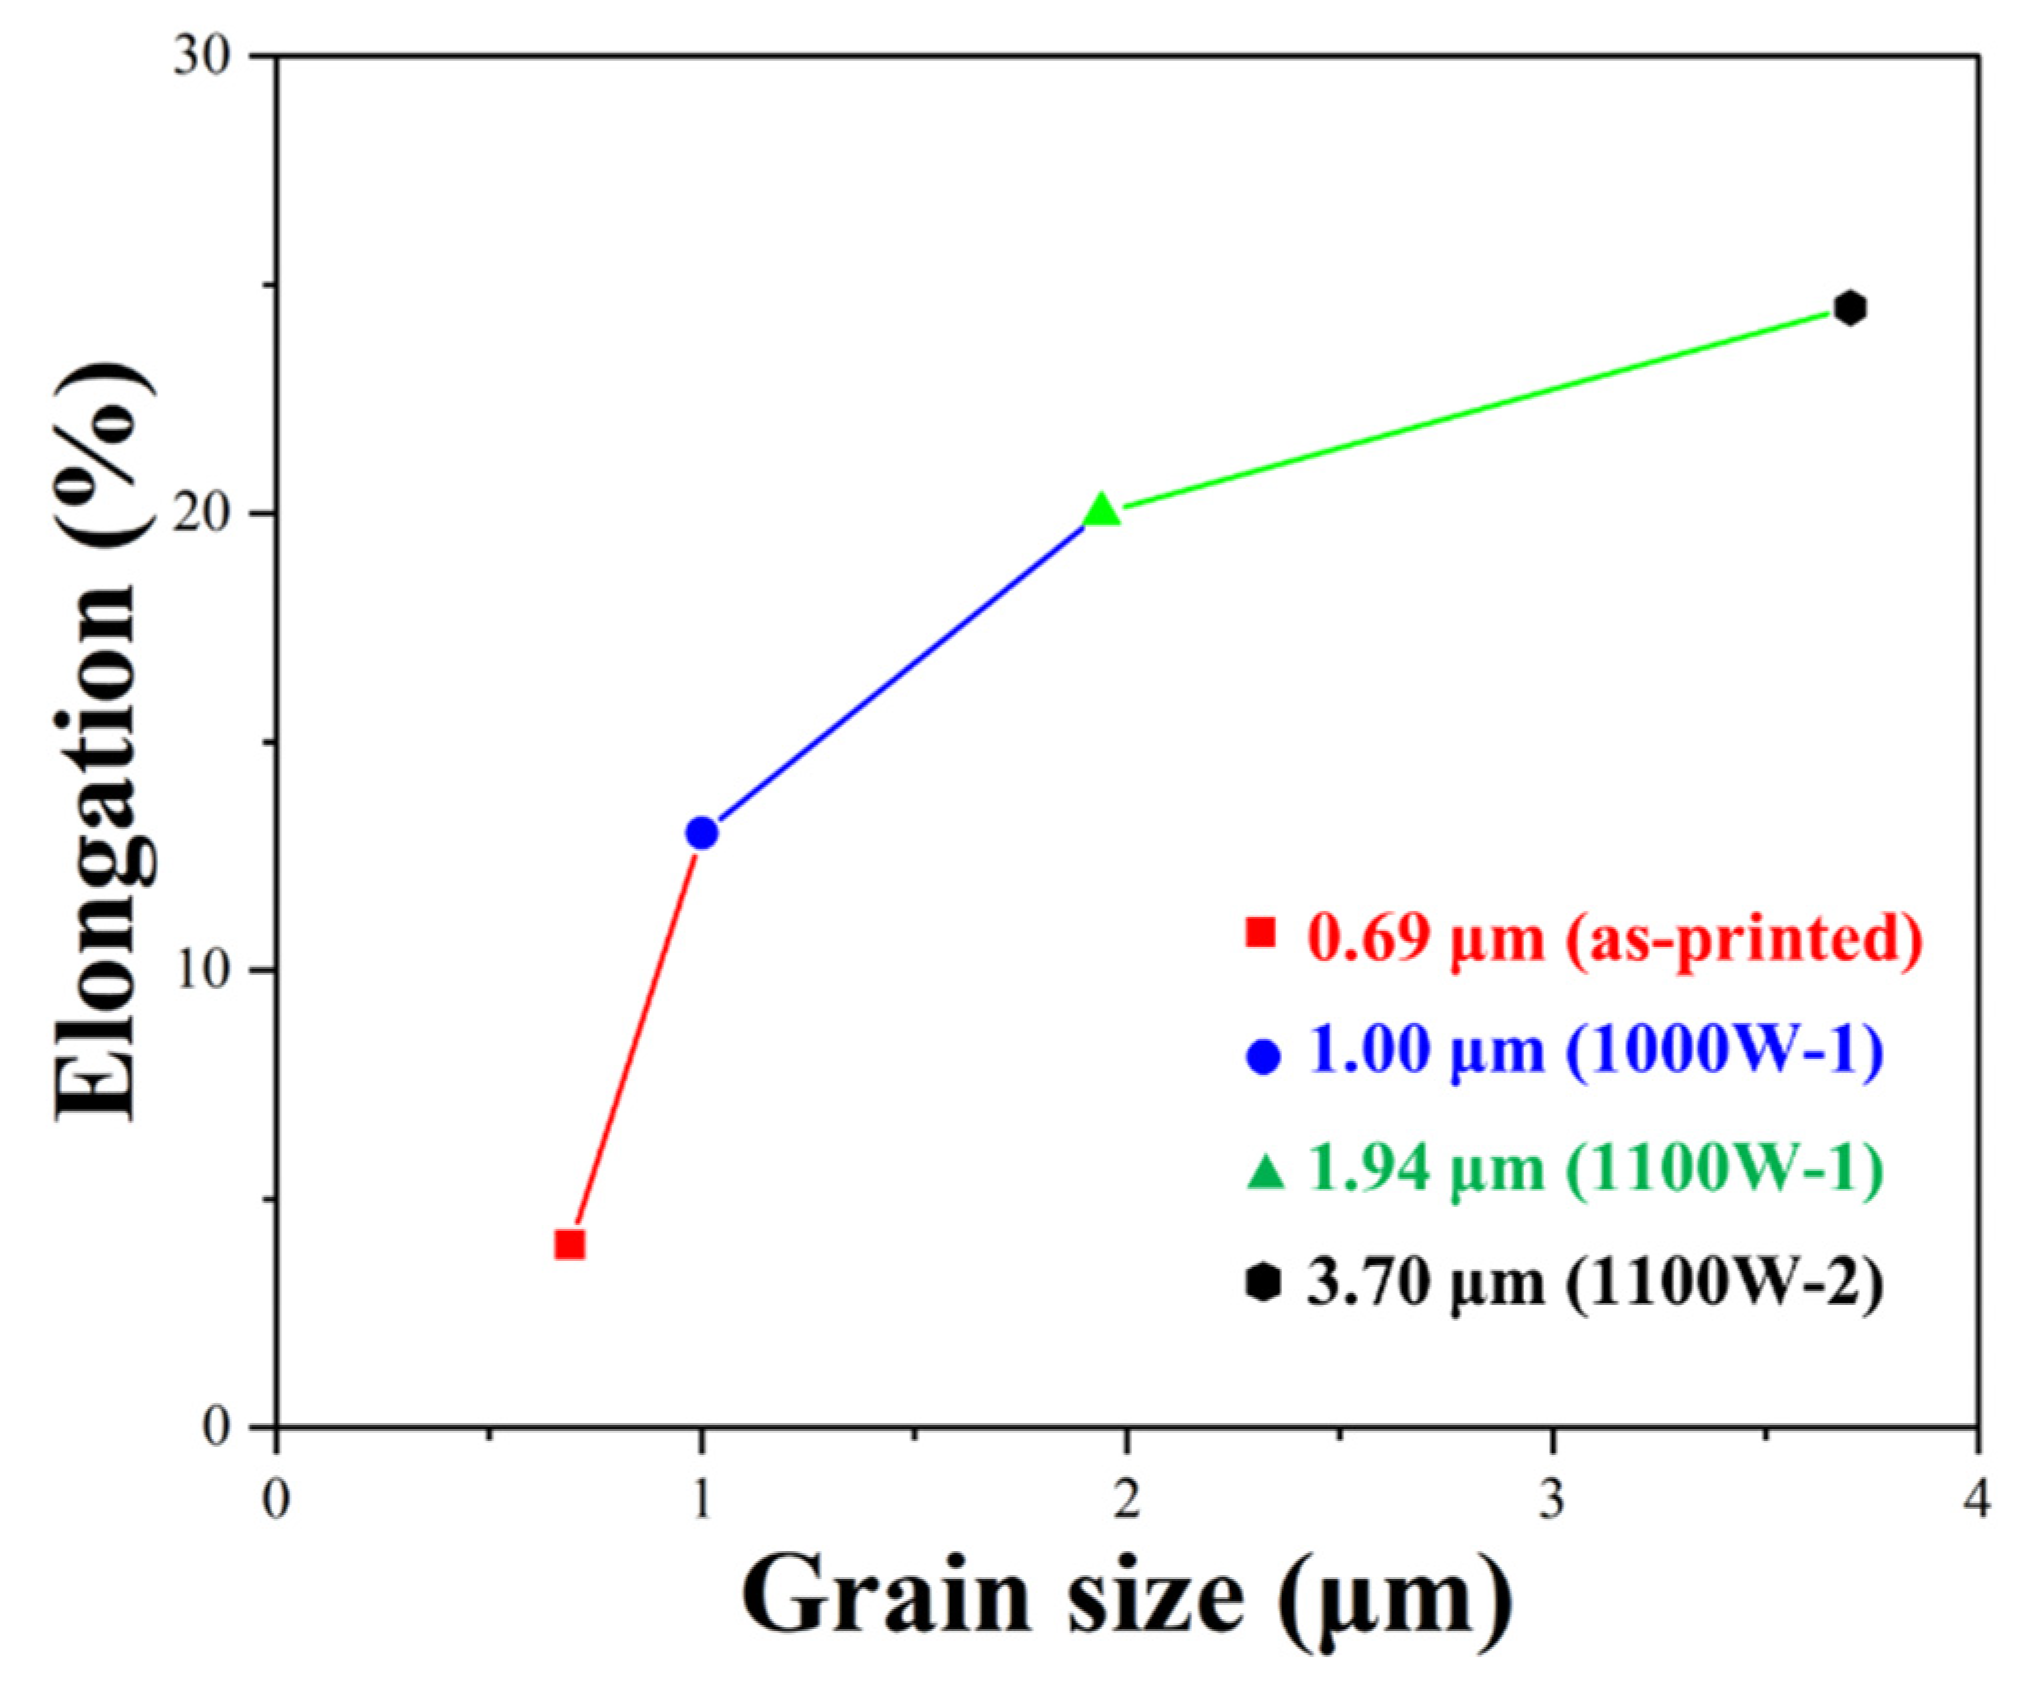
| As-printed | 28.1% | 1.20 μm | 0.56 μm | 83.1% |
| 1000W-1 | 23.6% | 1.33 μm | 0.82 μm | 47.0% |
| 1100W-1 | 19.6% | 4.33 μm | 1.29 μm | 20.6% |
| 1200W-1 | 13.4% | 5.8 μm | 2.32 μm | 21.8% |
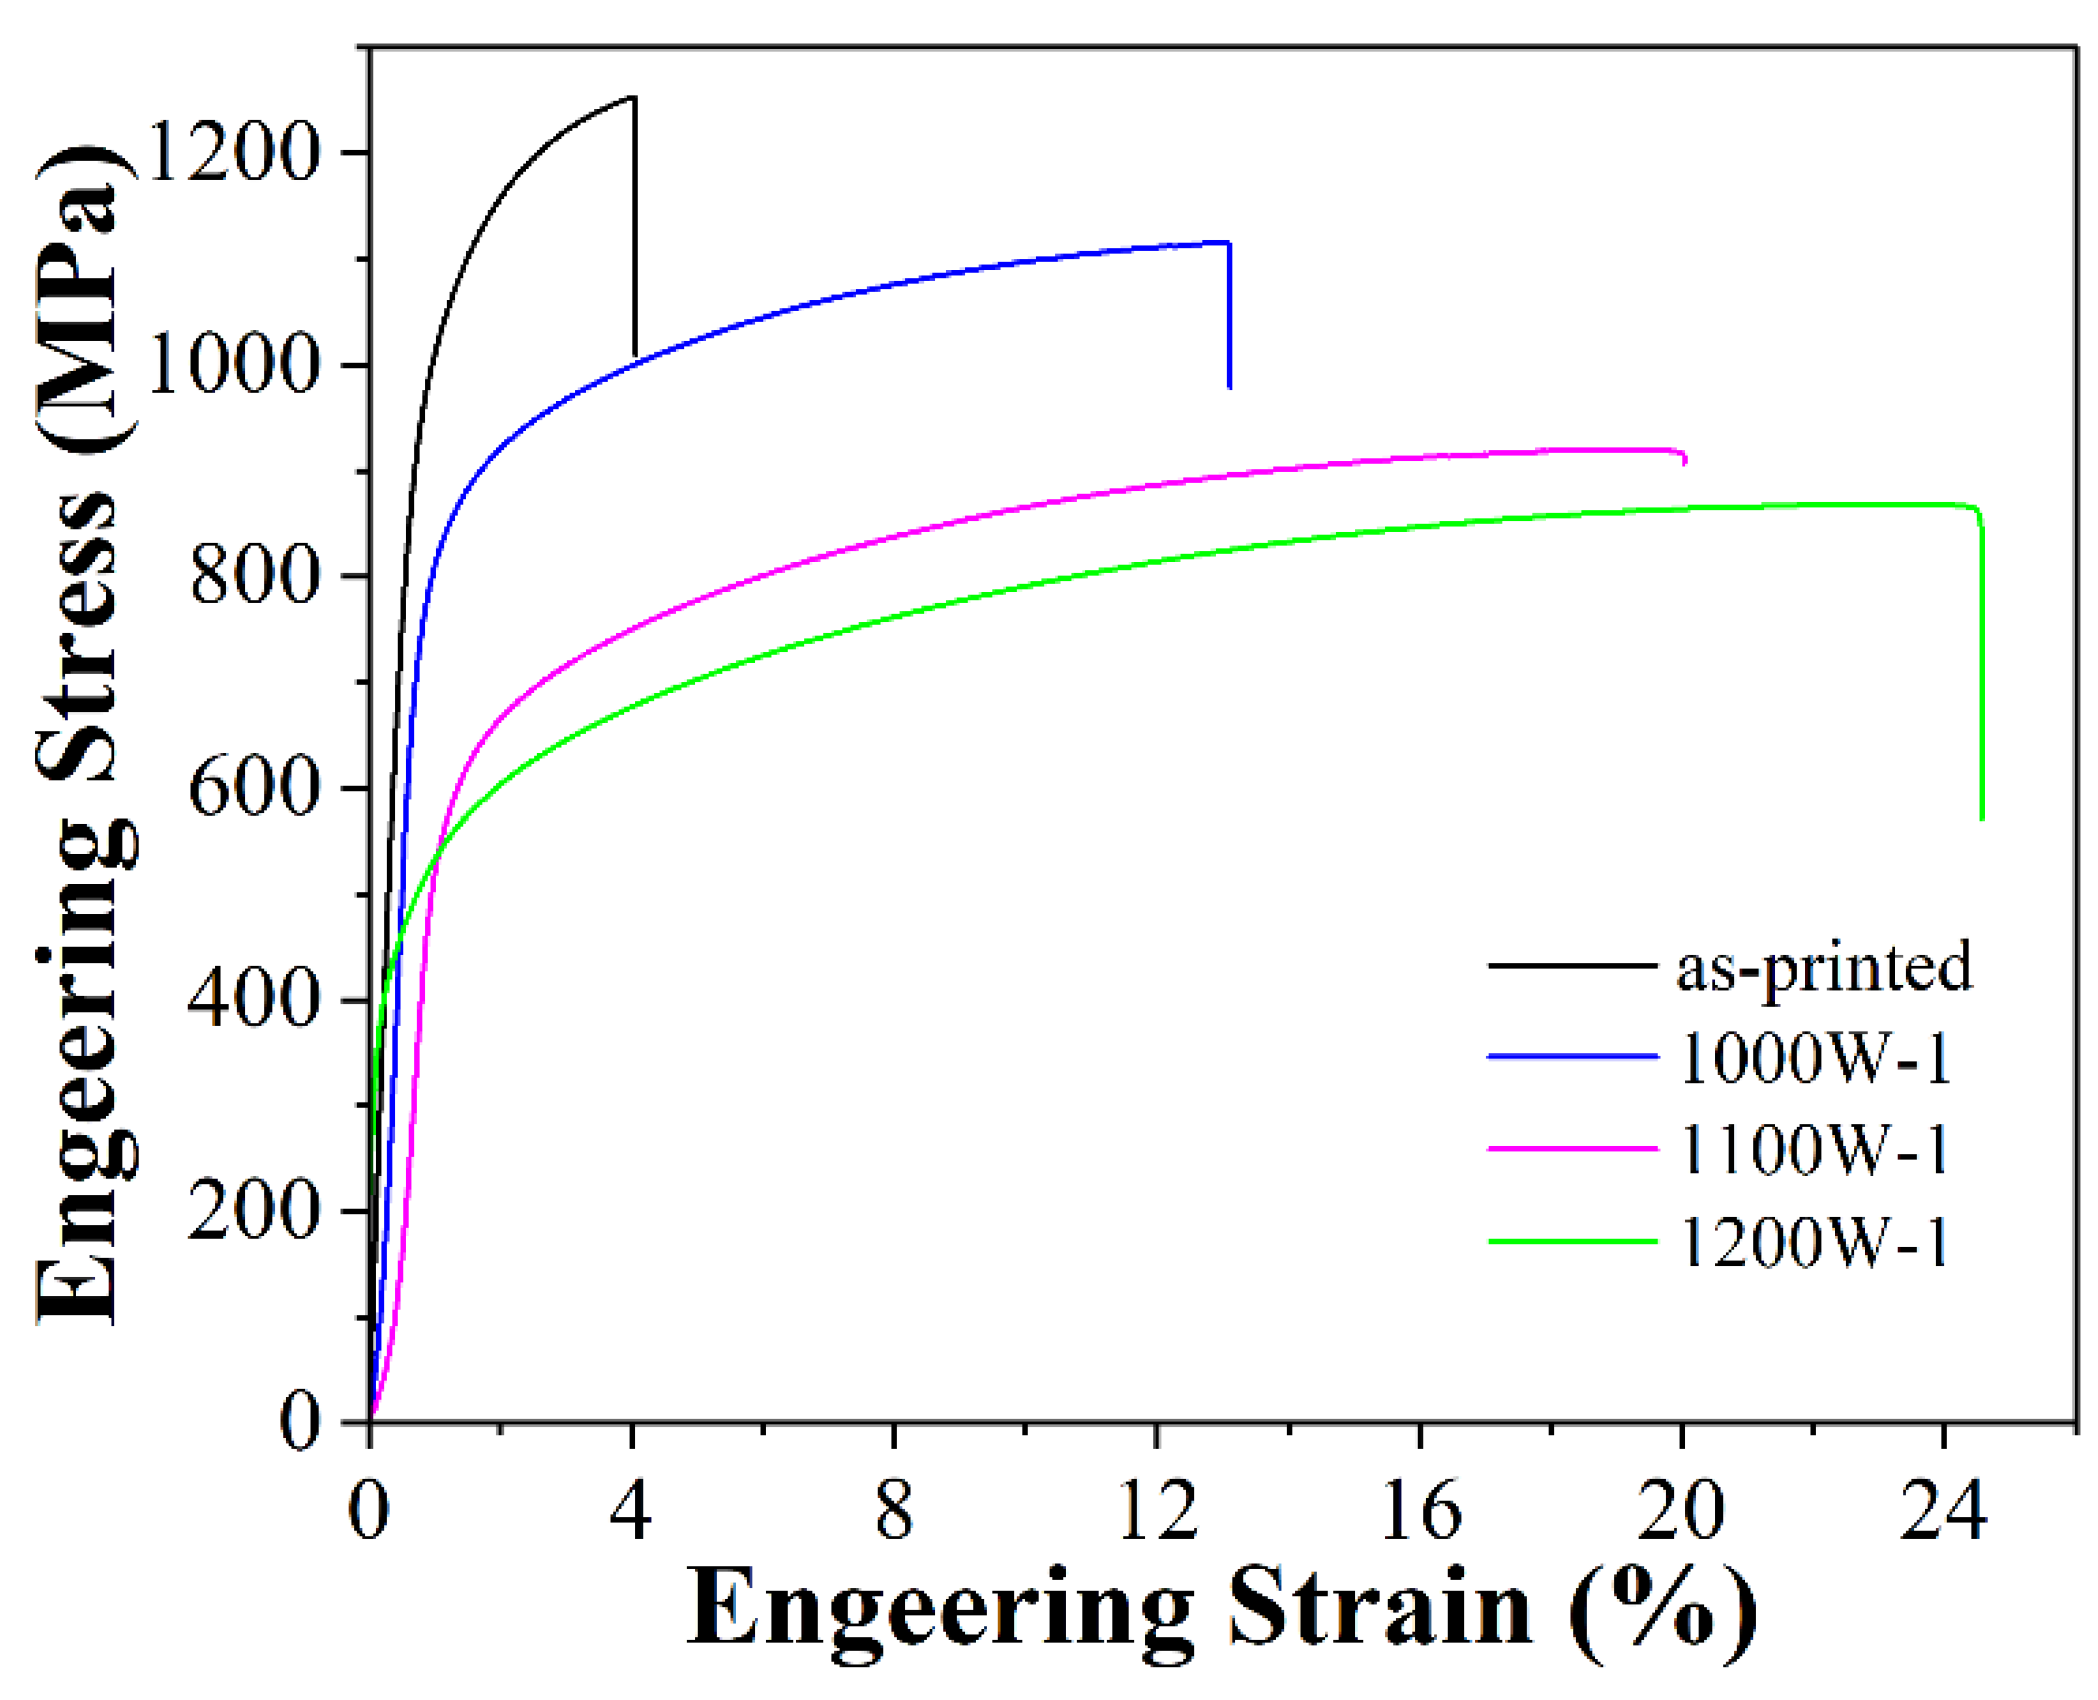
| Sample | Yield strength (MPa) | Tensile Strength (MPa) | Elongation (%) |
|---|---|---|---|
| As-printed | 913 | 1239 | 4.0 |
| 1000W-1 | 790 | 1115 | 13.0 |
| 1100W-1 | 571 | 920 | 20.0 |
| 1200W-1 | 430 | 868 | 24.5 |
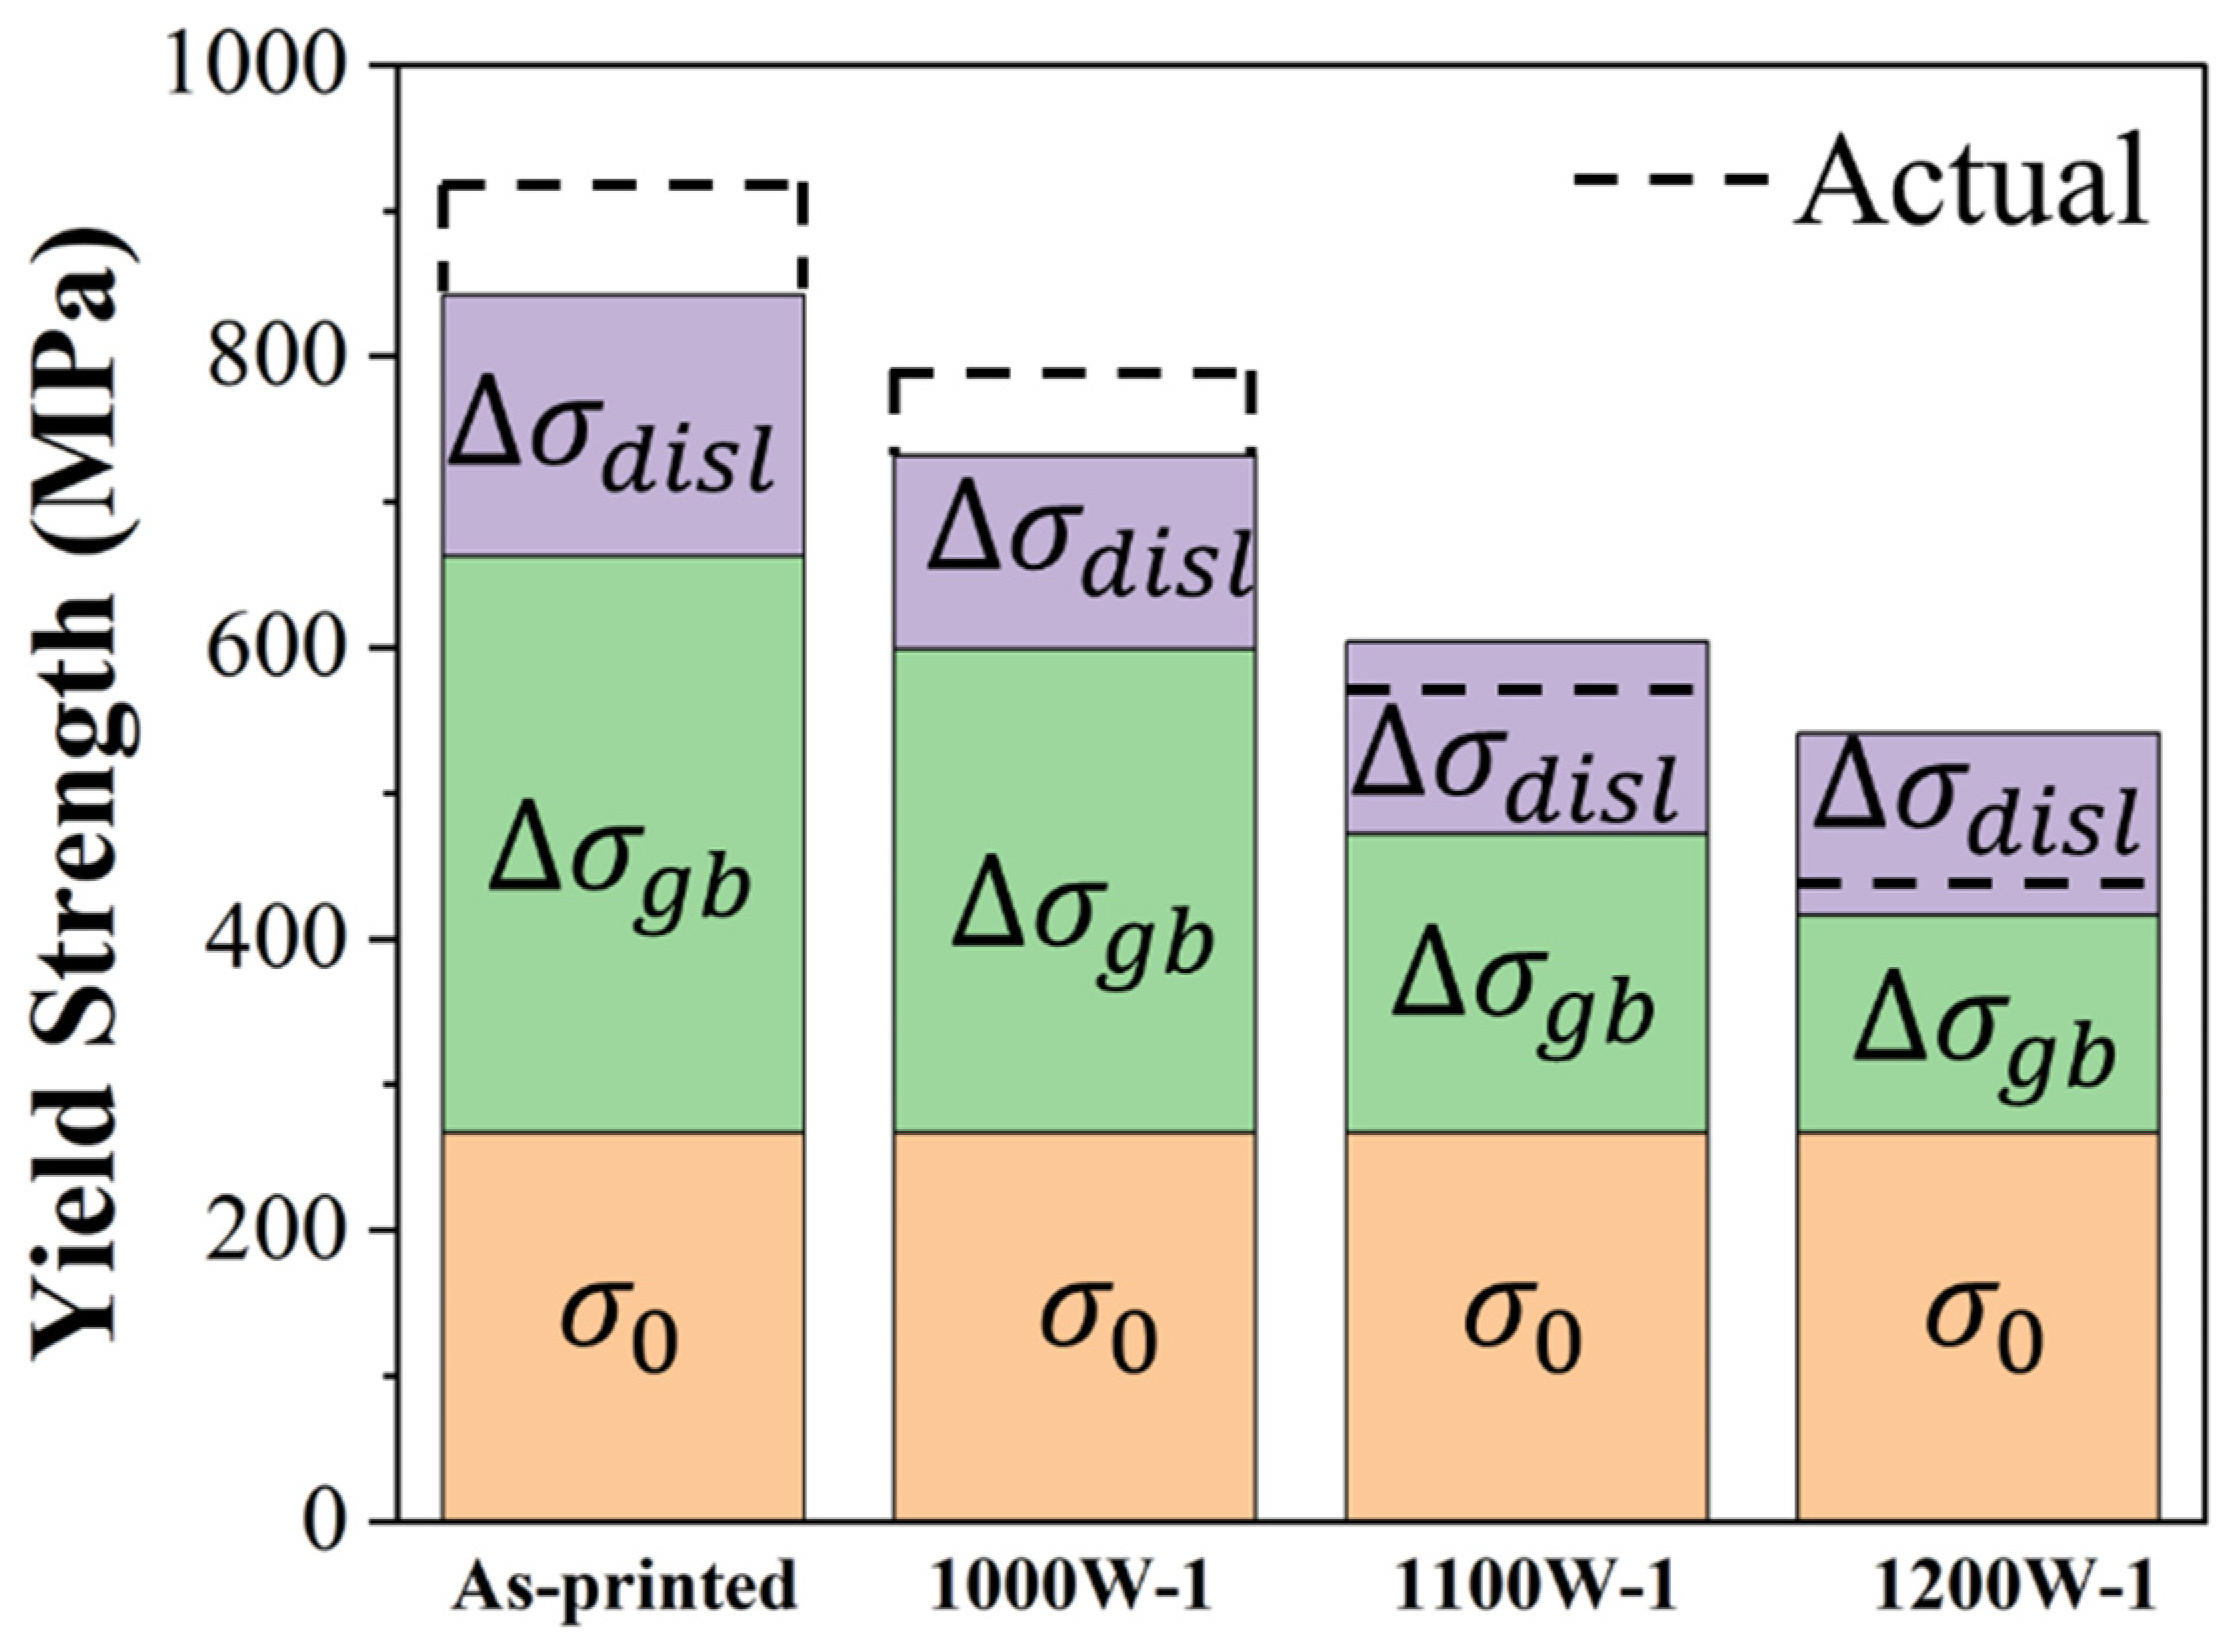
| Sample | (×1014 m−2) | (×1014 m−2) | |
|---|---|---|---|
| As-printed | 215 | 306 | 179 |
| 1000W-1 | 137 | 86 | 133 |
| 1100W-1 | 130 | 77 | 132 |
| 1200W-1 | 111 | 67 | 125 |
Disclaimer/Publisher’s Note: The statements, opinions and data contained in all publications are solely those of the individual author(s) and contributor(s) and not of MDPI and/or the editor(s). MDPI and/or the editor(s) disclaim responsibility for any injury to people or property resulting from any ideas, methods, instructions or products referred to in the content. |
© 2024 by the authors. Licensee MDPI, Basel, Switzerland. This article is an open access article distributed under the terms and conditions of the Creative Commons Attribution (CC BY) license (http://creativecommons.org/licenses/by/4.0/).


