Preprint
Article

CXCL1/CXCR2 and CCL5/CCR1/CCR5 Promote Radiation-Induced Reprogramming of Breast Non-cancer Stem Cells into Cancer Stem Cells and Predict Patient Clinical Outcome

Altmetrics

Downloads

203

Views

97

Comments

0

Submitted:

06 February 2024

Posted:

07 February 2024

You are already at the latest version

Alerts
Abstract
Cancer stem cell (CSC) has paved the way to many fundamental and translational studies. Recent studies have highlighted differentiated breast cancer cells (non-CSCs) switching phenotype to CSCs in response to various stimuli, depicting the existence of cancer stem cell plasticity. Although strategies to reduce the phenotypic plasticity of non-CSCs into CSCs are likely to prevent treatment-resilient cancer cells driving recurrence, most phenotypic plasticity mechanisms involve Notch, Wnt or MAPK signaling pathways. In this study, breast cancer cells were irradiated to identify soluble reprogramming factors. Using conditioned medias, protein arrays analyses, flow cytometry and in cellulo/in vivo functional assays, we demonstrated, for the first time, that radiation-induced chemokine expression, especially CXCL1 and CCL5 and their receptors CXCR2, CCR1 and CCR5, stimulates reprogramming of breast non-CSCs into CSCs. Treatment of non-CSCs with recombinant CXCL1 and CCL5 is sufficient to induce cell reprogramming, while their inhibition can be used to prevent reprogramming and sensitize tumor to radiation. Moreover, analysis of gene expression profiles from 38 public merged databases demonstrated that combined over-expression of CXCL1/CXCR2, CCL5/CCR1 or CCL5/CCR5 has a poorer prognosis in patients treated with radiotherapy, suggesting a promising way for patient stratification, where individuals with elevated cytokine levels could benefit from radiotherapy in conjunction with cytokine inhibitors. Taken together, our findings provide a rationale to consider these axes as potential targets and predictive biomarkers in breast cancer patients.
Keywords: 
Subject: Biology and Life Sciences  -   Cell and Developmental Biology

1. Introduction

Cancer stem cells (CSCs), distinguished by their ability for self-renewal, multipotency, involvement in tumorigenesis, and resistance to therapies, present intriguing prospects for novel treatment approaches. According to the hierarchical model of tumor development, eradicating CSCs could result in tumor regression or even complete elimination [1]. However, further investigations have unveiled the concept of cancer cell plasticity. In this context, fully differentiated breast cancer cells (non-CSCs) can transform into CSCs when exposed to various stimuli [2,3]. This phenomenon, termed "phenotypic plasticity", "conversion", or “reprogramming” can occur under diverse conditions. For instance, Heddleston and colleagues demonstrated that hypoxic conditions can activate HIF2α, leading to the re-expression of pluripotency factors in glioma [4]. Similarly, HDAC inhibitors have the capacity to induce the Wnt/ß-catenin pathway and confer a stem cell-like phenotype to breast cancer cell lines depleted of CSCs [5]. Also, the Lin28B/let7 axis was found to induce CSCs in prostate carcinoma cells [6]. Interestingly, common cancer therapies, such as radiotherapy, can also trigger this phenotypic plasticity process. We observed that ionizing radiation treatment of CSC-depleted breast cancer cell lines induced a stem-like phenotype, and this was associated with Notch signaling [7]. This phenotypic plasticity mechanism may contribute to tumor heterogeneity [8] and the development of tumor resistance [9], suggesting that targeting CSCs alone may not suffice for complete tumor eradication. Currently, the exact mechanisms underlying radiation-induced phenotypic plasticity remain unknown, and strategies to mitigate the conversion of non-CSCs into CSCs following treatment may help to prevent treatment-resistant cancer cell recurrences.
Concurrently, multiple studies have established a connection between inflammation and cancer stem cells, with a particular emphasis on cytokines and chemokines. Treatment of breast cancer cell lines with Chemokine (C-C motif) ligand 5 (CCL5) leads to an enrichment of CD44high/CD24low/- CSCs [10]. Chen et al. identified CCL20 as an inflammatory factor that increases both ALDH+ and CD44high/CD24low/- breast CSC frequencies in a population treated with taxanes [11]. This enrichment is mediated through the p65 nuclear factor kappa B (NF-κB) pathway, activated via mitogen-activated protein kinase (MAPK) or protein kinase Cζ (PKCζ). In prostate cancer cell lines, C-X-C motif chemokine ligands such as CXCL1 and CXCL8 can modulate tumorigenicity [12]. Interleukin-6 (IL6) has been shown to generate CSCs from non-CSCs in breast and prostate tumor cells, as well as in breast cancer patient samples [13]. Additionally, chemokine receptors present promising therapeutic targets, as evidenced by studies examining the impact of CXCR1 and CXCR2 inhibition on CSC biology [14,15]. In our study, we faced the challenge of investigating the molecular mechanisms of phenotypic plasticity by depleting the CSC population and then regenerating it to the original level using ionizing radiation. In our findings, we demonstrate that CXCL1 and CCL5 are specifically secreted after ionizing radiation (IR) treatment of non-CSCs. Treatment of non-CSCs with recombinant hCXCL1 and hCCL5 induces a CSC-like phenotype, while their inhibition reduces radiation-induced CSCs and enhances radiation sensitivity in vitro and in vivo, leading to improved survival in xenografted mice. Moreover, analysis of transcription databases from breast cancer patients reveals a strong correlation between the expression of chemokines and CSC profiles in breast cancer patients. Furthermore, the combined expression of CXCL1/CXCR2 or CCL5/CCR1 appears to have prognostic value in overall survival among patients treated with radiotherapy. This study represents an important effort in identifying new potential therapeutic targets through specific inhibition of phenotypic plasticity, especially when combined with radiotherapy.

2. Materials and Methods

Cell culture
The human SUM159PT breast cancer cell line was purchased from Asterand Biosceince (BioIVT, Hicksville, USA), MDA MB 231 and HCC70 cells were purchased from ATCC (Manassas, USA), and cultured in the recommended media at 37°C with 5% CO2.
Irradiation
Cells were irradiated as monolayers at room temperature and at a density of approximately 5500 cells/cm2. The irradiation was performed in the radiotherapy department of Centre Oscar Lambret de Lille using a low-energy electron accelerator (DARPAC 2000 X-Ray) at a dose rate of 0.95 Gy/min. Analysis of CSCs was performed 5 days after irradiation.
Aldefluor assay
Breast cancer stem cells were identified based on their high aldehyde dehydrogenase (ALDH) activity, as described before by Ginestier et al. [16], using the Aldefluor® kit (StemCell Technologies, Vancouver, Canada). Only 30% of the most negative cells were collected as ALDH- cells. Flow cytometry data were acquired on CyAnTMADP cytometer (Beckman Coulter, Brea, USA) with Summit software. All analyses were performed with FlowJo (v10.4.1, BD, Franklin Lakes, USA).
RNA extraction, reverse transcription, and Real-Time RT-PCR
Total RNA from the cell lines was isolated using the RNeasy kit (Qiagen, Venlo, The Netherlands). cDNA synthesis was performed using the SuperScript III First-Strand Synthesis System for RT (Invitrogen, Carlsbad, USA). Quantitative PCR was carried out using the CFX96 Real-Time System (Bio-Rad, Hercules, USA) with Quantification SyBR Green master mix (Qiagen, Venlo, The Netherlands). All primers were synthesized by Eurogentech (Sox2 5’-3’: AACCCCAAGATGCACAACTC; Sox2 3’-5’: CGGGGCCGGTATTTATAATC; Oct4 5’-3’: GAAGGATGTGGTCCGAGTGT; Oct4 3’-5’: GTGAAGTGAGGGCTCCCATA; Nanog 5’-3’: TTCAGTCTGGACACTGGCTG; Nanog 3’-5’: CTCGCTGATTAGGCTCCAAC; GAPDH 5’-3’: AGCCACATCGCTCAGACAC; GAPDH 3’-5’: GCCCAATACGACCAAATCC). The Ct for each gene was determined after normalization to GAPDH (ΔCt). We then obtained ΔΔCt by subtracting the ΔCt of the sample from the ΔCt of the control condition, and 2-ΔΔCt was used to calculate the ratio of expression differences.
Conditioned medium preparation and treatments
Conditioned medium (CM) was withdrawn from the cell culture 5 days after irradiation and centrifuged at 300 g for 10 min to eliminate dead cells and debris. CM treatments consisted of replacing 50% of the culture medium with CM freshly obtained from irradiated cells.
Cytokine & chemokine arrays
Protein arrays were performed with CM following the manufacturers’ instructions (Cytokine array panel A ARY005, Chemokine array ARY017, Biotechne, Minneapolis, USA). The signal was detected using a LAS-4000 camera (Fujifilm, Tokyo, Japan). Control samples were performed with fresh medium incubated without cells for 6 days at 37°C and 5% CO2 and were used to normalize and compare each sample.
Enzyme-linked immunosorbent array (ELISA)
ELISA assays for CXCL1 (Duoset CXCL1, DY275, Biotechne), CCL5 (Duoset CCL5, DY278, Biotechne) and CCL19 (DuoSet CCL19, DY361, Biotechne) were performed in non-diluted CM following the fabricant instructions. The plates were read with Multiskan FC (Thermo Scientific, Waltham, USA) at 450 nm and 540 nm for blank correction. The average of each duplicate was calculated after blank correction. Each optical density was plotted on the standard curve to determine the chemokine concentrations.
Treatment of cells with human recombinant cytokines
Cells were treated with recombinant cytokines from Bio-Techne. The concentrations used were equal to 10 times the ED50 indicated by the manufacture datasheet: CXCL12 (2 ng/ml), CCL19, CCL20 (5 ng/ml), CXCL1, CCL4, CCL5, MIF (10 ng/ml), CCL3 (30 ng/ml) and CXCL9 (1 μg/ml). All cytokines were reconstituted in PBS containing 0.1% BSA. For dose effect treatments, the chosen concentrations were 1, 10, or 100 times the ED50.
Sphere-forming capacity (SFC) and sphere generations
Cells were trypsinized and cultured in sphere medium consisting of phenol red-free DMEM-F12, 0.4% BSA (Sigma, St. Louis, USA), 10 ml B27 additive (Invitrogen) per 500 ml medium, 5 μg/ml insulin (Sigma), 4 μg/ml heparin, and 20 ng/ml epidermal growth factor (EGF) and fibroblast growth factor (FGF) (Biotechne). Cells were plated in 96-well low adhesion plates, ranging from 1024 cells to 1 cell. The number of spheres per well was assessed 7 days later. Cells were also cultured as spheres in the same medium, at 10,000 cells/ml in low adhesion flasks for 10 days, to perform sphere generations. Spheres were then dissociated with Accutase (Invitrogen) and re-cultured for secondary SFC tests.
Antibody staining for flow cytometry
For the chemokine receptors studies, receptors were stained with coupled antibodies from Miltenyi (Bergisch Gladbach, Germany) targeting CCR1 (130100371, PE-Vio770), CCR3 (130097068, VioBlue), CCR4 (13010395, Biotin and anti-Biotin, 130097022, VioGreen), CCR5 (130106224, APC), CCR6 (130100375, PE), CCR7 (130099153, Biotin), CXCR2 (130100908, APC-Vio770), and CXCR3 (130101377, APC or 130107463, PE-Vio615). Antibodies at a dilution of 1/50 were incubated for 10 min on ice in the dark in a staining buffer (PBS, 0.5% BSA, 2 mM EDTA), centrifuged, and washed with a staining buffer. If necessary, cells were first stained using the Aldefluor assay, and 50 μM Verapamil was added to the staining buffer to limit the loss of ALDH staining. REA controls (REAfinity Recombinant Antibody, Miltenyi) were performed at the same concentrations as those of corresponding specific antibodies.
For ALDH1, NANOG, SOX2, and OCT4 analysis on tumor cells, tumors were dissociated using enzymatic digestion (Tumor dissociation kit, Miltenyi 130-095-929) and mechanical dissociation (gentle MACS Dissociator). Fresh samples were then stained for ALDH activity (as previously described). Part of the samples was fixed with 4% paraformaldehyde solution and stored at 4°C before SOX2 and OCT2 immunostaining. Cells were incubated in PBS 0.1% Triton X100 for 15 min and rinsed in PBS. Cells (1x10⁶) were then incubated with Biolegend antibodies targeting NANOG (2.5μg/ml, BLE653706, AF488), SOX2 (10 μg/mL, BLE656112, Pacific Blue), or OCT4 (BLE653706, AF488), or corresponding isotypes, for 30 min at RT. Cells were rinsed and analyzed by flow cytometry.
All samples were acquired on CyanTMADP (Beckman Coulter) and data were analyzed using FlowJo 10.
Cytokine treatment and inhibition
Cells were treated with recombinant cytokines from Bio-Techne. The concentrations used were equal to 10 times the indicated ED50: CXCL12 (2 ng/ml), CCL19, CCL20 (5 ng/ml), CXCL1, CCL4, CCL5, MIF (10 ng/ml), CCL3 (30 ng/ml) and CXCL9 (1 μg/ml). All cytokines were reconstituted in PBS containing 0.1% BSA. For dose effect treatments, the chosen concentrations were 1, 10, or 100 times the ED50. Cytokine inhibitions were performed using neutralizing antibodies from Bio-Techne. Different concentrations were tested, and the most effective one was chosen anti-CXCL1 (MAB275, 2 μg/ml), and anti-CCL5 (MAB278, 0.1 μg/ml). Corresponding isotype controls were used at the same concentrations as that of corresponding specific antibodies. Antibody treatments were carried out using ALDH- cells before radiotherapy. Cytokine depletion in the CM was performed by incubating CM with neutralizing antibodies at the concentrations cited above for 1h. Then, 50% of the cell medium was replaced with this mixture of CM and antibodies.
Receptor inhibition
To assess the chemokine receptor involvement in phenotypic plasticity, ALDH- cells were treated one time, 1 h before radiotherapy, with pharmacological inhibitors of, CXCR2 (SB225002), CCR1 (BX471), and CCR5 (Maraviroc) purchased from Biotechne. Different concentrations were tested, and the least toxic one was chosen (100 nM). Inhibitors were reconstituted in DMSO, and the control treatment consisted of DMSO alone.
In vivo study
Animal experiments were approved by the French Animal Experiment Ethics Committee (authorization #5935076 and project #01989.02). Female SCID mice (8 weeks) were purchased from Pasteur Institute, Lille, and maintained under pathogen-free conditions. SUM159PT cells were suspended in PBS (106 cells/ 100 μL) and subcutaneously injected in both flanks of each mouse. Tumor volumes were monitored every week by measuring the length (l) and width (w), and calculating the volume with the following formula: (π*l*w2)/6.
Treatments
Once the tumor volumes reached approximately 200 mm3, the mice were treated with neutralizing antibodies (Biotechne) and/or radiotherapy (Oncovet, Villeneuve d’Ascq, France). Mice were divided into different groups: “isotype controls” (IgG2B, 80 μg/mouse, MAB004; IgG1, 32 μg/mouse, MAB002), “antiCXCL1” (antiCXCL1, 80 μg/mouse, MAB275; IgG1), “antiCCL5” (antiCCL5, 32 μg/mouse, MAB278; IgG2B), and “antiCXCL1 + antiCCL5” (antiCXCL1; antiCCL5). Concentrations were determined according to the literature. Each group was subdivided into 2 subgroups: one was not irradiated (“0 Gy”) and the second subgroup received 5*3 Gy radiotherapy (“5*3 Gy”). The treatment protocol consisted of 6 intraperitoneal antibody injections over 2 weeks (3 injections per week, every 2 days) and 5 irradiations (5*3 Gy) daily during the first week. Mice were euthanized when the tumor volume reached an ethical limit or when the welfare score was too low.
Irradiation procedure
A Precise (Elekta, Stockholm, Sweden) linear accelerator was used for irradiation. A 6 MV photons (X-ray) beam was selected to permit the treatment of a large field, at a standard treatment distance (100 cm), through the cover of the container (thin plastic). The beam was delivered at a rate of 200 cGy/min.
The mice were placed by 6 in a sterile isolation container under 3% Isoflurane / O2 (0.9 L/min). Each container was placed on 5 cm PMMA plates to allow for radiation back-scatter. A 20 cm x 3 cm field was designed to have all mice from one group aligned under anesthesia, under the beam. Once under anesthesia, the mice were positioned in line along the long axis of the container with their hind limbs under the field light centered on the masses.
The point of prescription was located 0.5 cm in depth from the skin. A 1 cm tissue equivalent material (sterile water-soaked gauze) was placed over and around the hind limbs between each mouse to allow for dose build-up and lateral radiation scatter (and avoid the skin-sparing effect of megavoltage irradiation). Dose calculations were made by hand (2 cm in depth at a standard 100 cm SAD (Source Axis Distance).
Gene expression analysis from public databases and clinicopathological correlations
Analysis of gene expression profiles of clinical samples collected from 38 public data sets (Supplementary Table 1-2) required pre-analytic processing. The first step was to normalize each data set separately: we used quantile normalization for the available processed data from non-Affymetrix-based sets (Agilent, SweGene, and Illumina), and Robust Multichip Average (RMA) with the non-parametric quantile algorithm for the raw data from the Affymetrix-based data sets. Normalization was done in R using Bioconductor and associated packages. The probes were then mapped based on their EntrezGeneID. When multiple probes were mapped to the same GeneID, we retained the one with the highest variance in a particular dataset. We log2-transformed the available TCGA RNAseq data that were already normalized. We applied different multigene classifiers in each data set separately, including several cancer stem cells (CSC) signatures: Prat’s claudin-low, Creighton’s CD44+/CD24-, Prat’s subpopulation transition signature, Lim’s signature, and Charafe’s ALDH1 [17,18,19,20,21]. Estrogen receptor (ER), progesterone receptor (PR), and ERBB2 expressions (negative/positive) were defined at the transcriptional level using gene expression data of ESR1, PGR, and ERBB2 respectively, as previously described [22]. Expression levels of CXCL1, CCL5, and their receptors were extracted from each of the 38 normalized data sets. Before analysis, gene expression data were standardized within each data set using the PAM50 luminal A population as a reference [23]. This allowed us to exclude biases due to laboratory-specific variations and population heterogeneity and to make data comparable across all sets. Metastasis-free survival (MFS) was calculated from the date of diagnosis until the date of distant relapse. Follow-up was measured from the date of diagnosis to the date of last news for event-free patients. Survivals were calculated using the Kaplan-Meier method and curves were compared with the log-rank test. All statistical tests were two-sided at the 5% level of significance. Statistical analysis was done using the survival package (version 2.30) in the R software (version 2.15.2; http://www.cran.r-project.org/). We followed the reporting REcommendations for tumor MARKer prognostic studies (REMARK criteria) [24].
Statistical analysis
All results are expressed as the means of at least 3 independent biological replicates. Data were analyzed using Prism (GraphPad) software. A difference with a p-value of 0.05 or less was considered statistically significant with the two-sided Student’s t-test and two-way ANOVA. Error bars are presented as SEM. The log-rank (Mantel-Cox) test was performed for survival analysis. A difference with a p-value of 0.05 or less was considered statistically significant. All Figures of the articles have been composed using Adobe Illustrator.

3. Results

3.1. Radiation-induced cytokines drive CSC plasticity

3.1.1. Ionizing radiation induces soluble factor secretion, which reprograms non-CSCs into CSCs

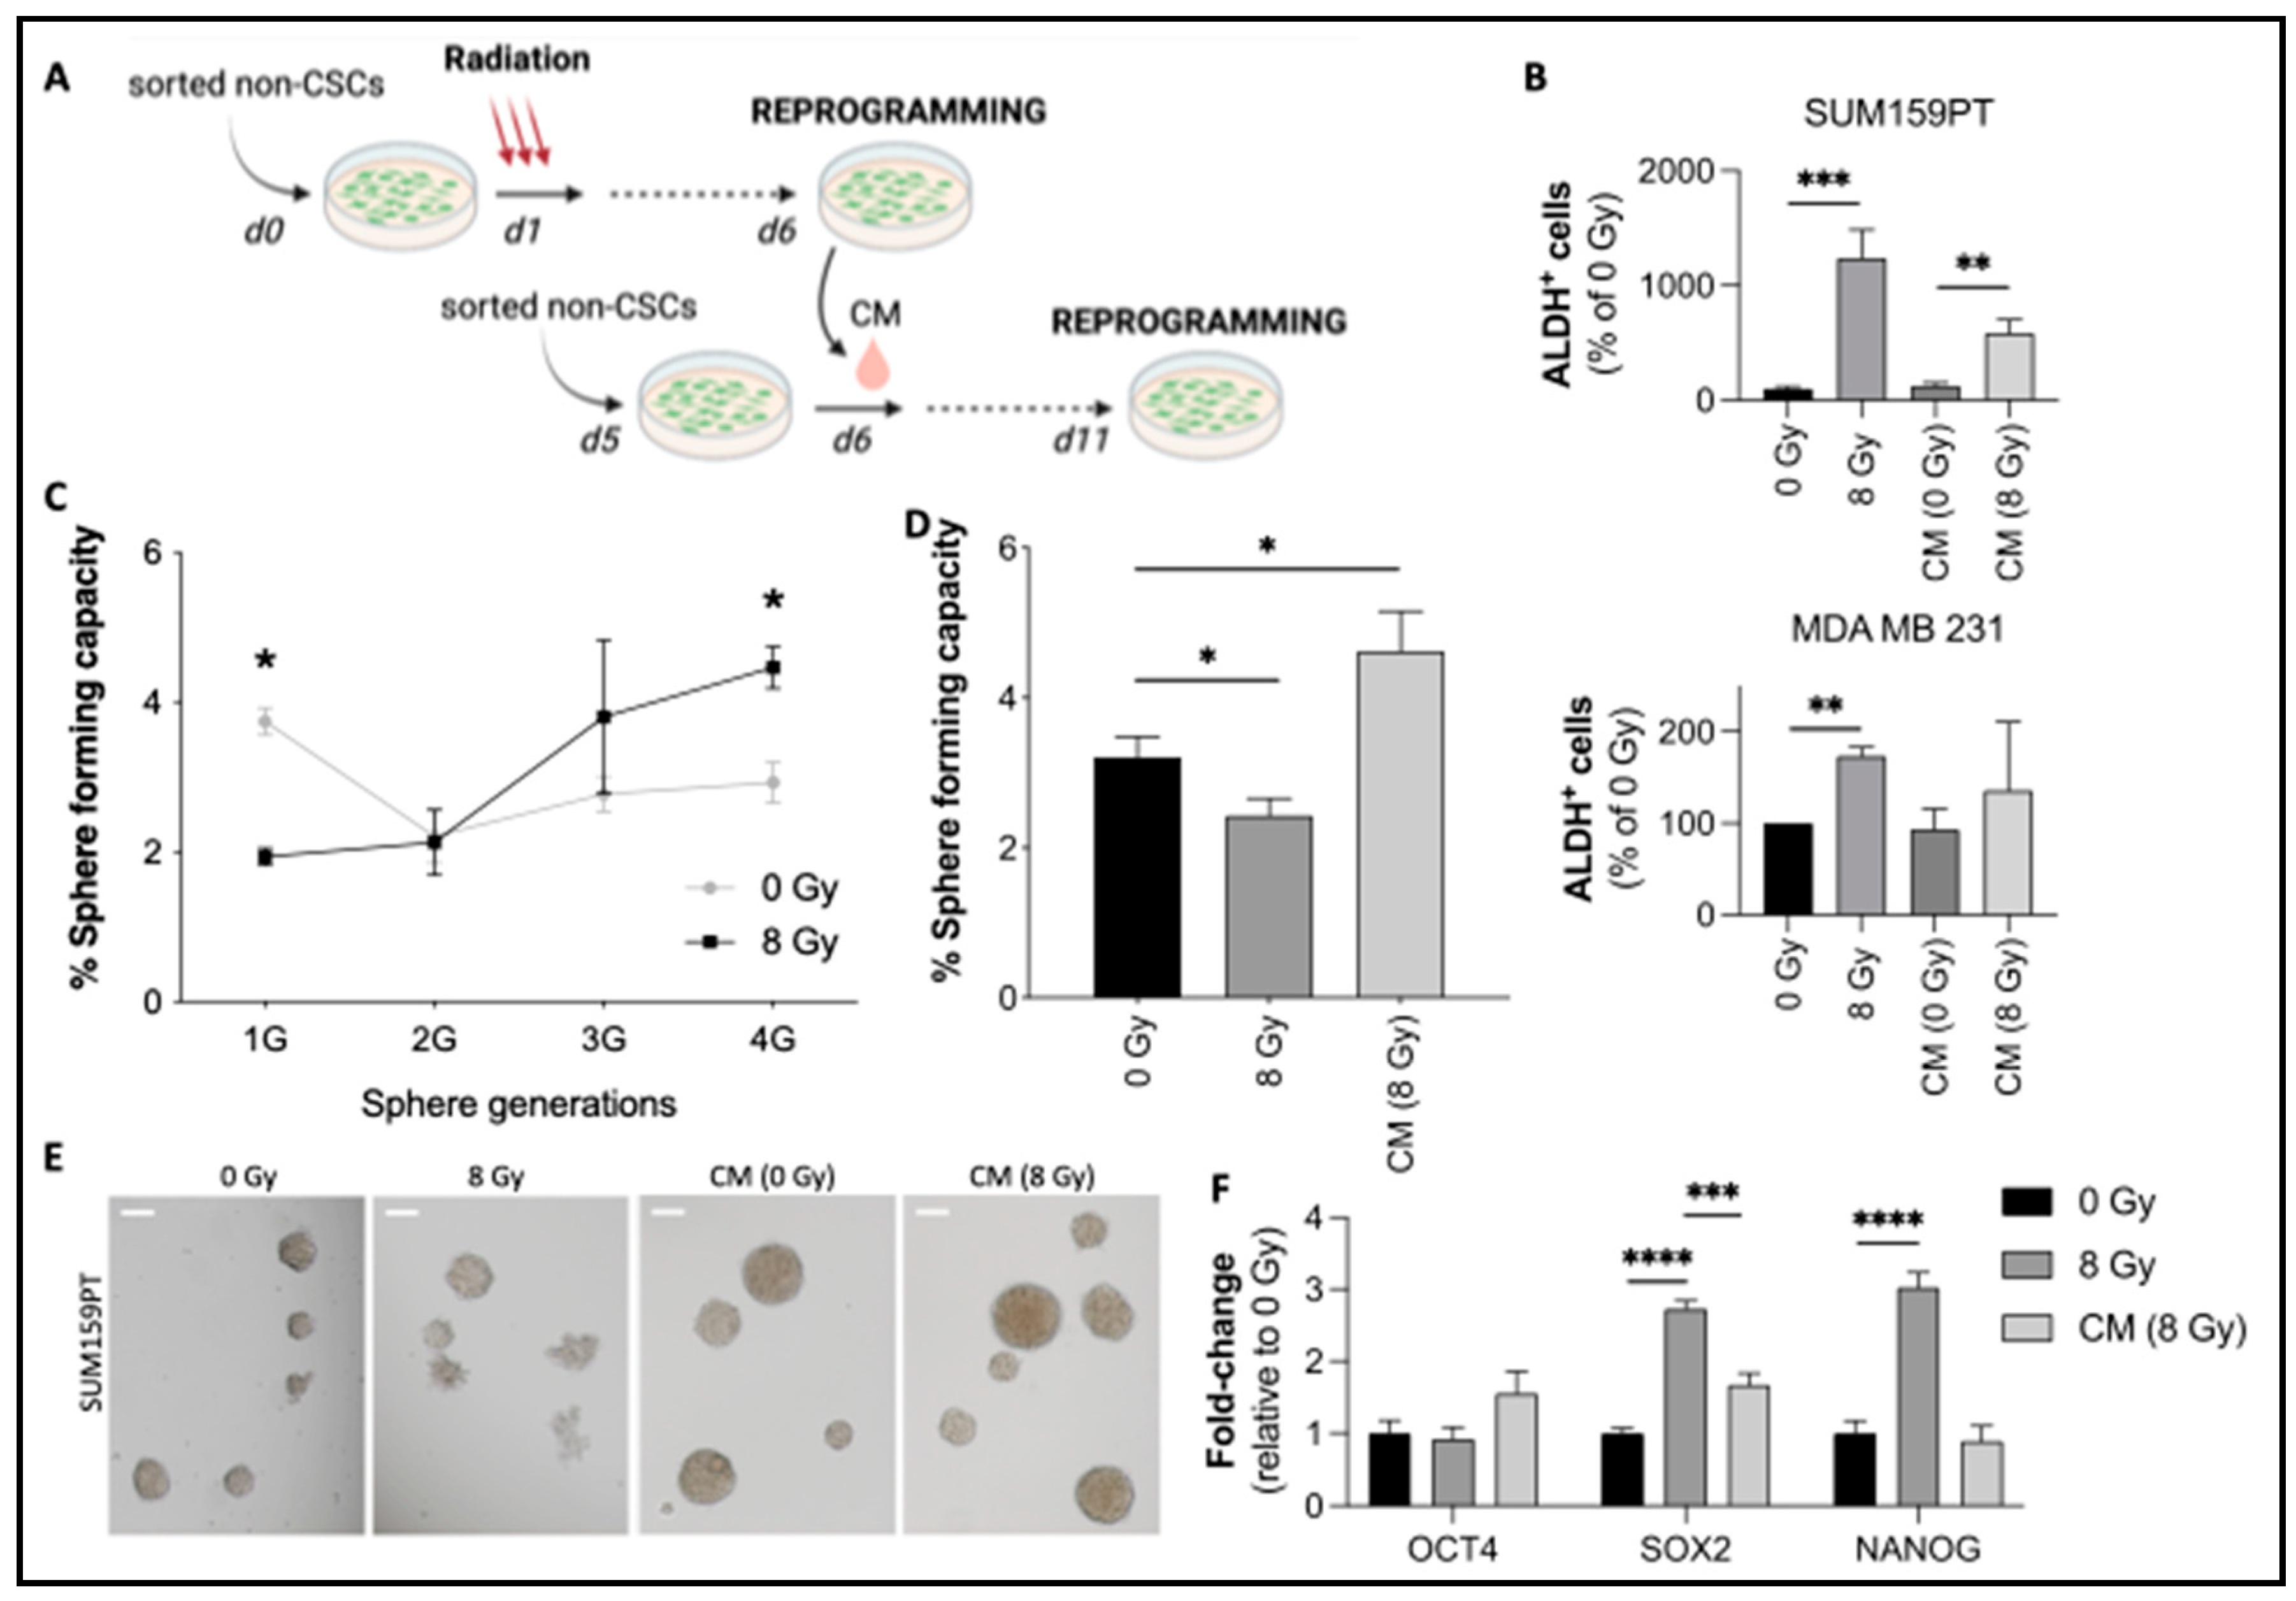
To investigate the mechanism behind CSC reprogramming, we collected conditioned medium (CM) from irradiated sorted non-CSCs from SUM159PT and MDA-MB-231 cells and tested it for its reprogramming potential on non-CSCs (Figures 1A and S1). We used 50% fresh medium and 50% CM to avoid nutrient depletion. As shown in Figure 1B, treatment with CM from irradiated non-CSCs was able to induce stemness (ALDH activity) both in SUM159PT (Figure 1B, upper panel) and MDA-MB-231 cells (Figure 1B, lower panel). CM-induced reprogramming was slightly lower than IR-induced reprogramming (Radiation: 3.2% (+/-0.6, p=0.0002) vs. CM: 1.5% (+/-0.3, p=0.0065). We then validated the complete reprogramming of non-CSCs by IR and/or CM via sphere-forming capacity assay (SFC), which selects for progenitor and CSCs. While radiation-induced reprogramming was affected by cell killing, requiring several generations of spheres to be increased (Figure 1C), the effect of CM was immediately visible and significant, as soon as the first generation (Figure 1D and 1E). Additionally, irradiated non-CSCs displayed a significant increase in pluripotency factor gene expression, such as SOX2 and NANOG (Figure 1F). SOX2 expression was also increased in CM (8 Gy)-treated cells compared to control cells. Interestingly, OCT4 expression did not significantly change either in irradiated cells or CM (8 Gy)-treated cells, which could be explained by the relatively high basal expression of OCT4 in our cell line compared with SOX2 and NANOG expression. Overall, our data suggest that CSC reprogramming is induced by soluble factors, secreted by irradiated non-CSCs, in a paracrine manner.

3.1.2. Radiation-induced CXCL1 and CCL5 are involved in reprogramming

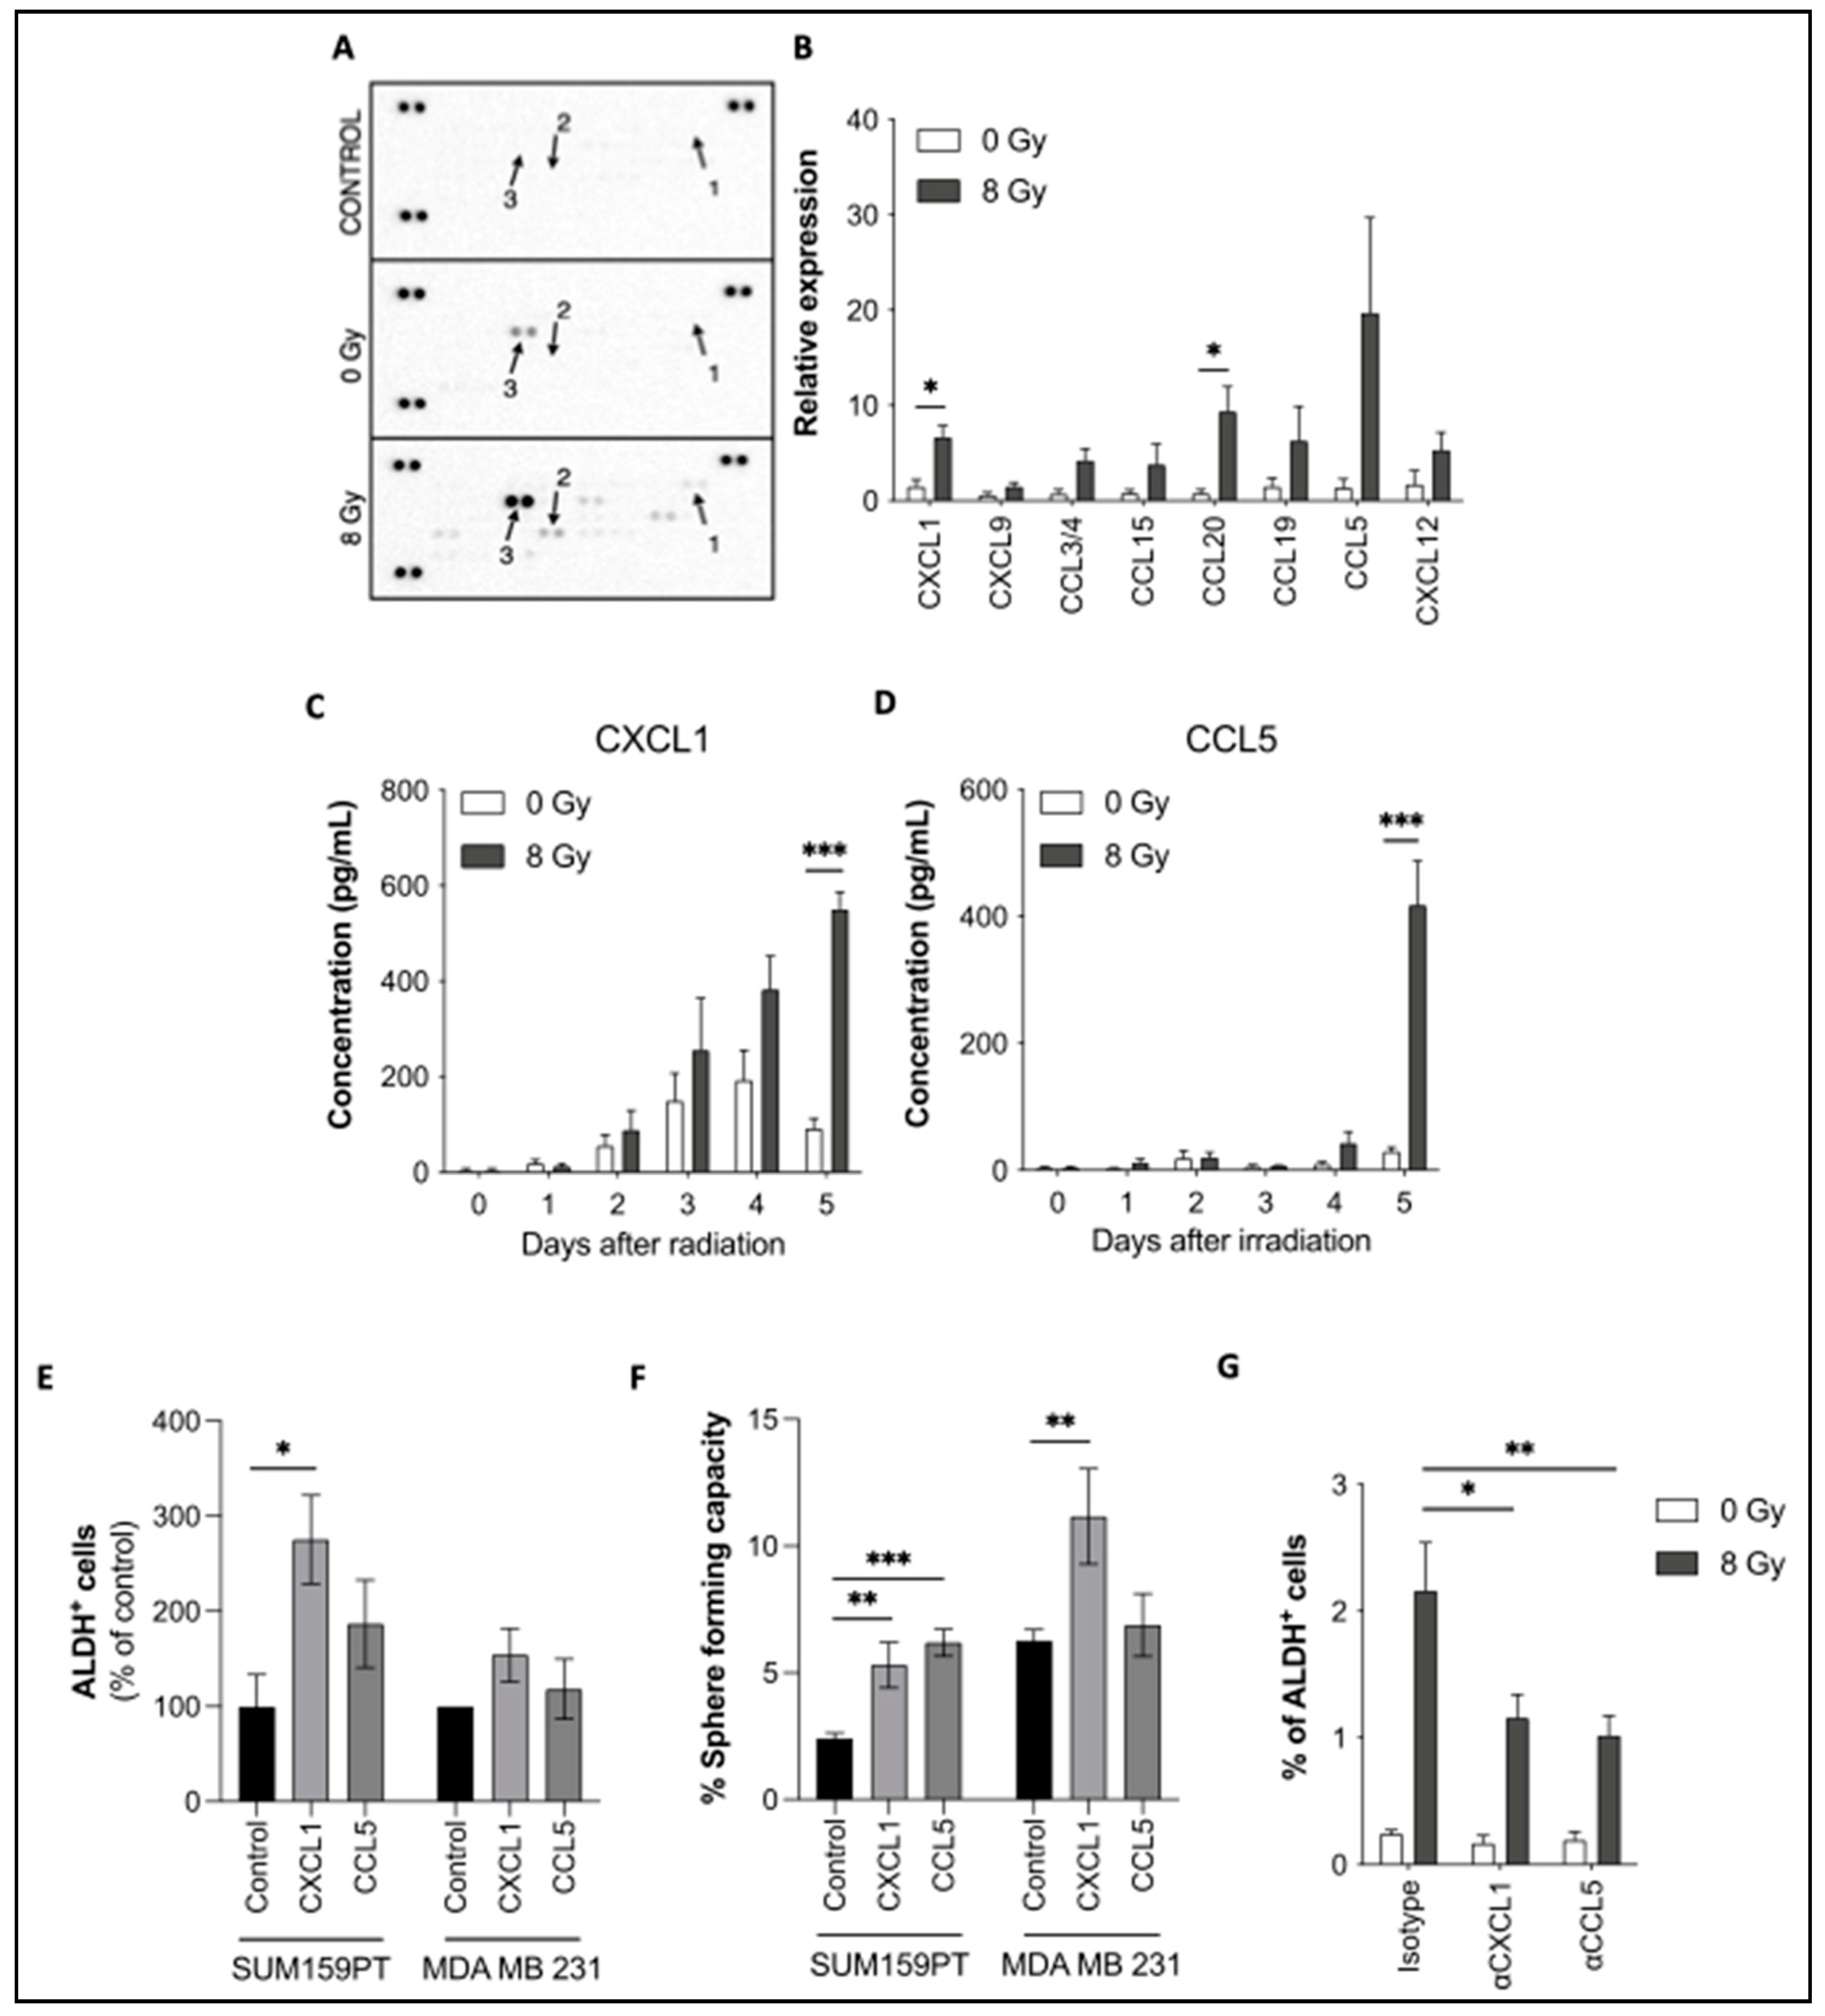
We next aimed to investigate what factors are secreted by irradiated non-CSCs. Interestingly, cytokines, well-known secreted, chemotactic proteins, have been associated with CSC chemoresistance and enrichment in breast cancer [11,25]. We therefore performed chemokine and cytokine arrays on irradiated non-CSCs CM. We compared the levels of chemokines and cytokines in a 6-day-old medium without cells, a 6-day-old medium with non-irradiated cells, and 6-day-old medium with irradiated cells (8 Gy). The chemokine array presented in Figure 2A shows an increased secretion of various chemokines in CM after IR. Every detectable spot was quantified (Figure 2B). We found an increased secretion of CXC- chemokines such as CXCL1, CXCL9, and CXCL12, and CC- chemokines such as CCL3/4, CCL5, CCL19/20, and CCL15. However, only CXCL1 and CCL20 were significantly higher. Additionally, cytokine arrays were performed and revealed increased expression of CXCL1 and MIF (Figures S2A and S2B). It is also important to note that there was no decrease in any protein after IR.
We validated the increased secretion of CXCL1 and CCL5 after IR by ELISA (Figure 2C and 2D). CCL4 and CCL19 were not significantly modified when detected by ELISA (Figure S1C). These results demonstrate that the secretion of (at least) 2 chemokines, CXCL1 and CCL5, is induced by IR. Interestingly, CXCL1 and CCL5 secretions constantly increase, coinciding with the constant increase of reprogramming in SUM159PT breast cancer cells, through the 5 days post-IR [7].
Several studies suggest the involvement of chemokines in CSC biology, but none of them has mentioned the potential role of chemokines in reprogramming. CCL5 treatment in breast cancer cell lines is notably responsible for the enrichment of CD44high/CD24low/- cells [10]. In prostate cancer, CXCL1 mediates cancer cell tumorigenicity [12]. In breast cancer, tumorigenicity seems also to be regulated by CXCL12 and its receptor CXCR4 [26,27]. For these reasons, we investigated the direct effects of chemokines on reprogramming. Sorted non-CSCs were treated with the recombinant chemokines CXCL1 and CCL5 (100 ng/mL). As shown in Figure 2E (and Figures S2A and S2B), in both SUM159PT and MDA-MB-231, treatment with CXCL1 or CCL5 increases induced ALDH+ cell frequency. Additionally, SFC was significantly increased by both chemokines, especially in SUM159PT (Figure 2F). Only CXCL1 treatment was able to induce reprogramming in MDA-MB-231, as shown by the SFC experiment (Figure 2F). Interestingly, almost all cytokines tested were able to induce reprogramming of non-CSC into CSC (Figures S2C/D), while no enrichment could be observed in unsorted bulk population (Figure S2E).
We next studied the effect of inhibiting CXCL1 and CCL5. Non-CSCs were irradiated and/or treated with neutralizing antibodies directed against CXCL1 and CCL5. Their inhibitions led to a significant decrease in the induction of ALDH+ cells after IR compared with the isotype control treatment (Figure 2G). We also investigated the effects of neutralizing CXCL1 and CCL5 in the conditioned media (CM-8Gy).
Taken together, these data show, for the first time, the involvement of CXCL1 and CCL5 in reprogramming in TNBC cell lines.

3.2. Cytokine receptor activity drives CSC plasticity prior to the activation of NOTCH signaling

3.2.1. CXCR2, CCR1, and CCR5 chemokine receptors participate in reprogramming

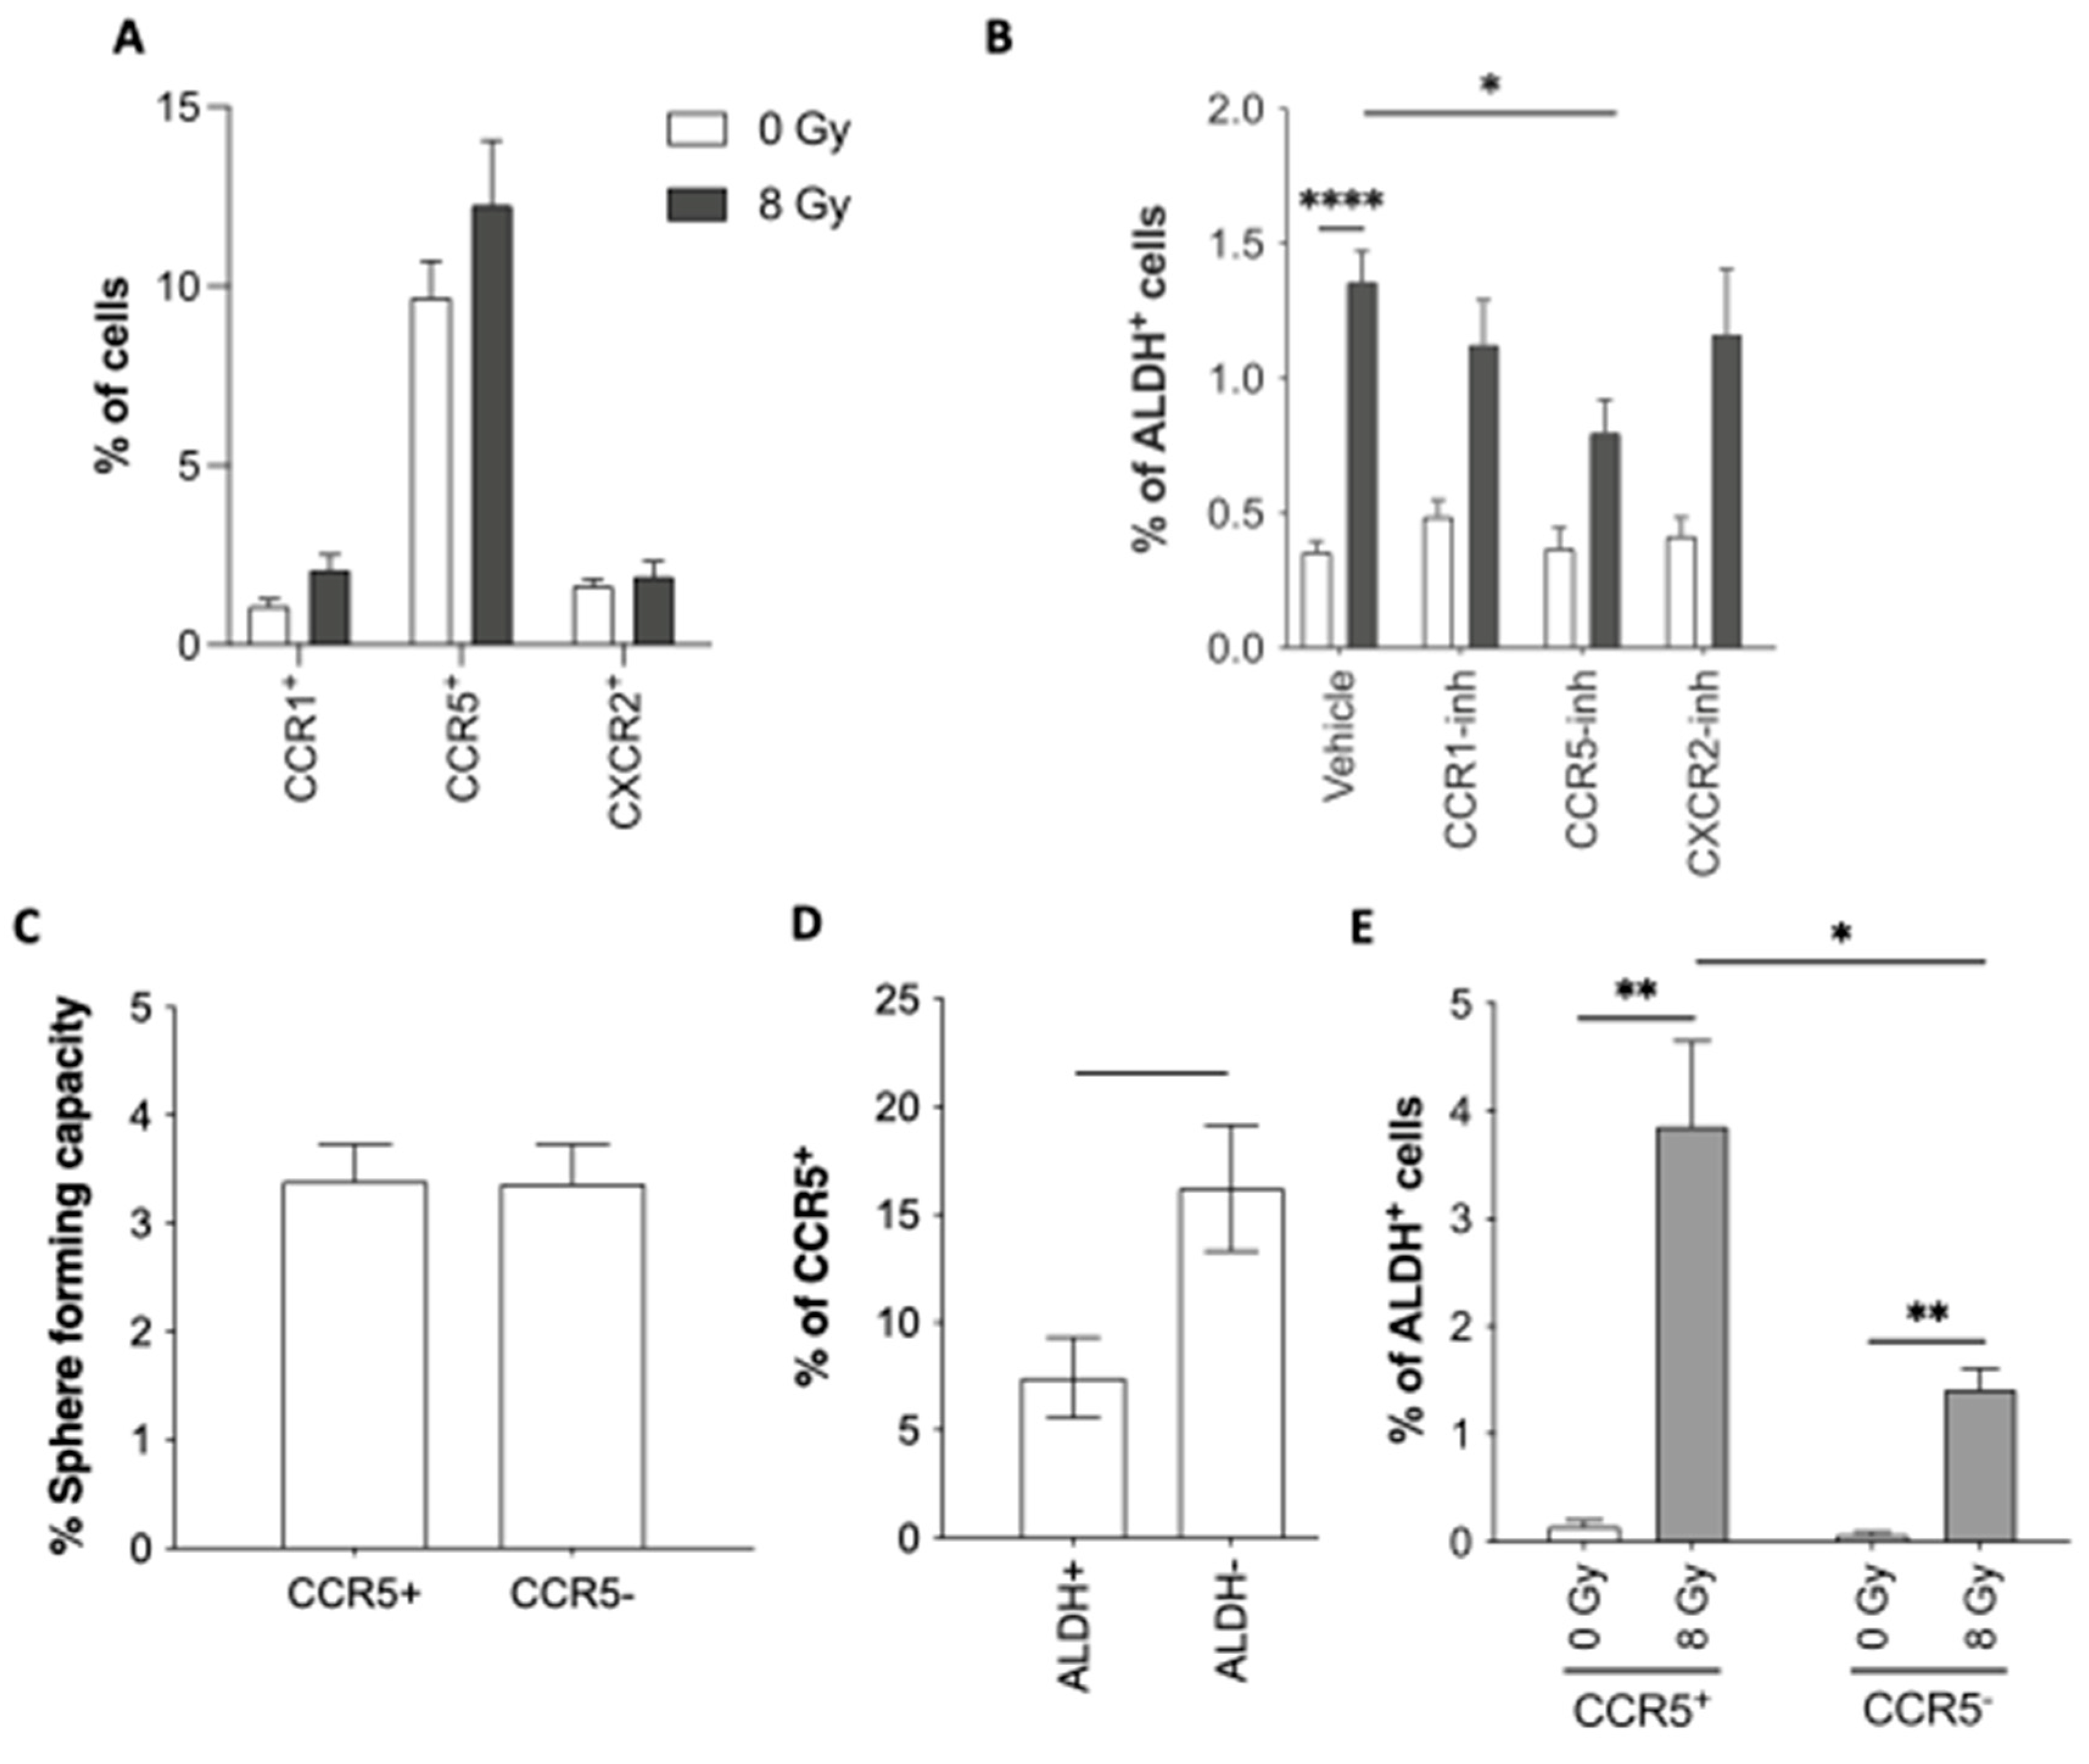
CXCL1 and CCL5 exert their action by binding their receptors. While CXCL1 mostly binds to CXCR2, CCL5 binds a larger array of receptors, including CCR1, CCR3, CCR4, and CCR5. We evaluated the expression of several receptors in SUM159PT and MDA-MB-231 cells, by flow cytometry (Figures 3A and S3). The expression of CCR3 and CCR4 was barely or not detectable, whereas CCR1, CCR5, and CXCR2 showed higher expression levels. CCR5 has the highest expression (up to 10%, Figure 3A, (Supplemental Table 5). Interestingly, CCR or CXCR expression and Aldefluor activity are mainly exclusive (Figure S4). Cells expressing the receptors are negative for Aldefluor and the other way around.
Based on this result, we decided to evaluate the reprogramming potential of cells expressing or not the receptors. For this purpose, we used native SUM159PT cells and SUM159PT Stb+ cells constitutively expressing the fluorescent protein Strawberry, to track the behaviors of both populations, positive or negative for the receptors. By cell sorting, we collected and then mixed, at 2 proportions (1:1 or 98:2 as an initial proportion Figure S5C). The reprogramming capacity of each population was evaluated (Figure S5D). Only the population derived from SUM159PT ALDH- CCR/CXCR + cells showed a significant increase in ALDH+ cells. It’s worth noticing that sorted CCR/CXCR- ALDH- non-CSCs could still be reprogrammed by radiation which could be explained by a rapid re-expression of CCR/CXCR within 24h (Figure S5B). Then, when we examined the composition of the spheres over generations, we observed that the Stb- cells (CCR/CXCR+ ALDH- non-CSCs) overcame the Stb+ cells (CCR/CXCR- ALDH- non-CSCs) (Figure S5E-F). This finding indicated that the population derived from CCR/CXCR+ cells was more able to form spheres than the other population. Interestingly, we observed the same phenomenon at the 98:2 ratio (Figure S5G-H). To validate this effect, we compared both populations (SUM159PT native and SUM159PT Stb+), with no sorting. We could not find any differences in proliferation or in SFC (Figure S6).
We then investigated the role of these receptors (CXCR2, CCR1, and CCR5) in radiation-induced reprogramming via pharmacological inhibition (Maraviroc, BX471, and SB225002, respectively) (Figure 3B). Among all decreases, CCR5 inhibition was particularly efficient in preventing reprogramming, as its targeting drug prevented the induction of ALDH+ cells after IR (Figure 3B).
Based on these results, we further investigated the role of CCR5 in CSC reprogramming. CCR5+ and CCR5- cells were sorted and tested for their SFC. Both populations had similar sphere-forming capacity (Figure 3C). Moreover, when doing a co-staining for CCR5 and Aldefluor®, we noted that the ALDH-, non-CSC population, was significantly enriched in CCR5+ cells compared to the ALDH+, CSC population (Figure 3D). These two experiments point to the fact that CCR5 is not a CSC marker in breast cancer cells. However, after sorting CCR5+ ALDH- non-CSCs and CCR5- ALDH- non-CSCs, we evaluated reprogramming in both populations after IR (Figure 3E). The results show that reprogramming is significantly higher in cells that express CCR5 at the time of IR. While it is likely that the membrane expression of these receptors is very labile (data not shown), these results indicate that CCR5 is involved in radiation-induced reprogramming and that targeting its membrane expression could partially prevent reprogramming.

3.2.2. NOTCH involvement in chemokines-induced reprogramming

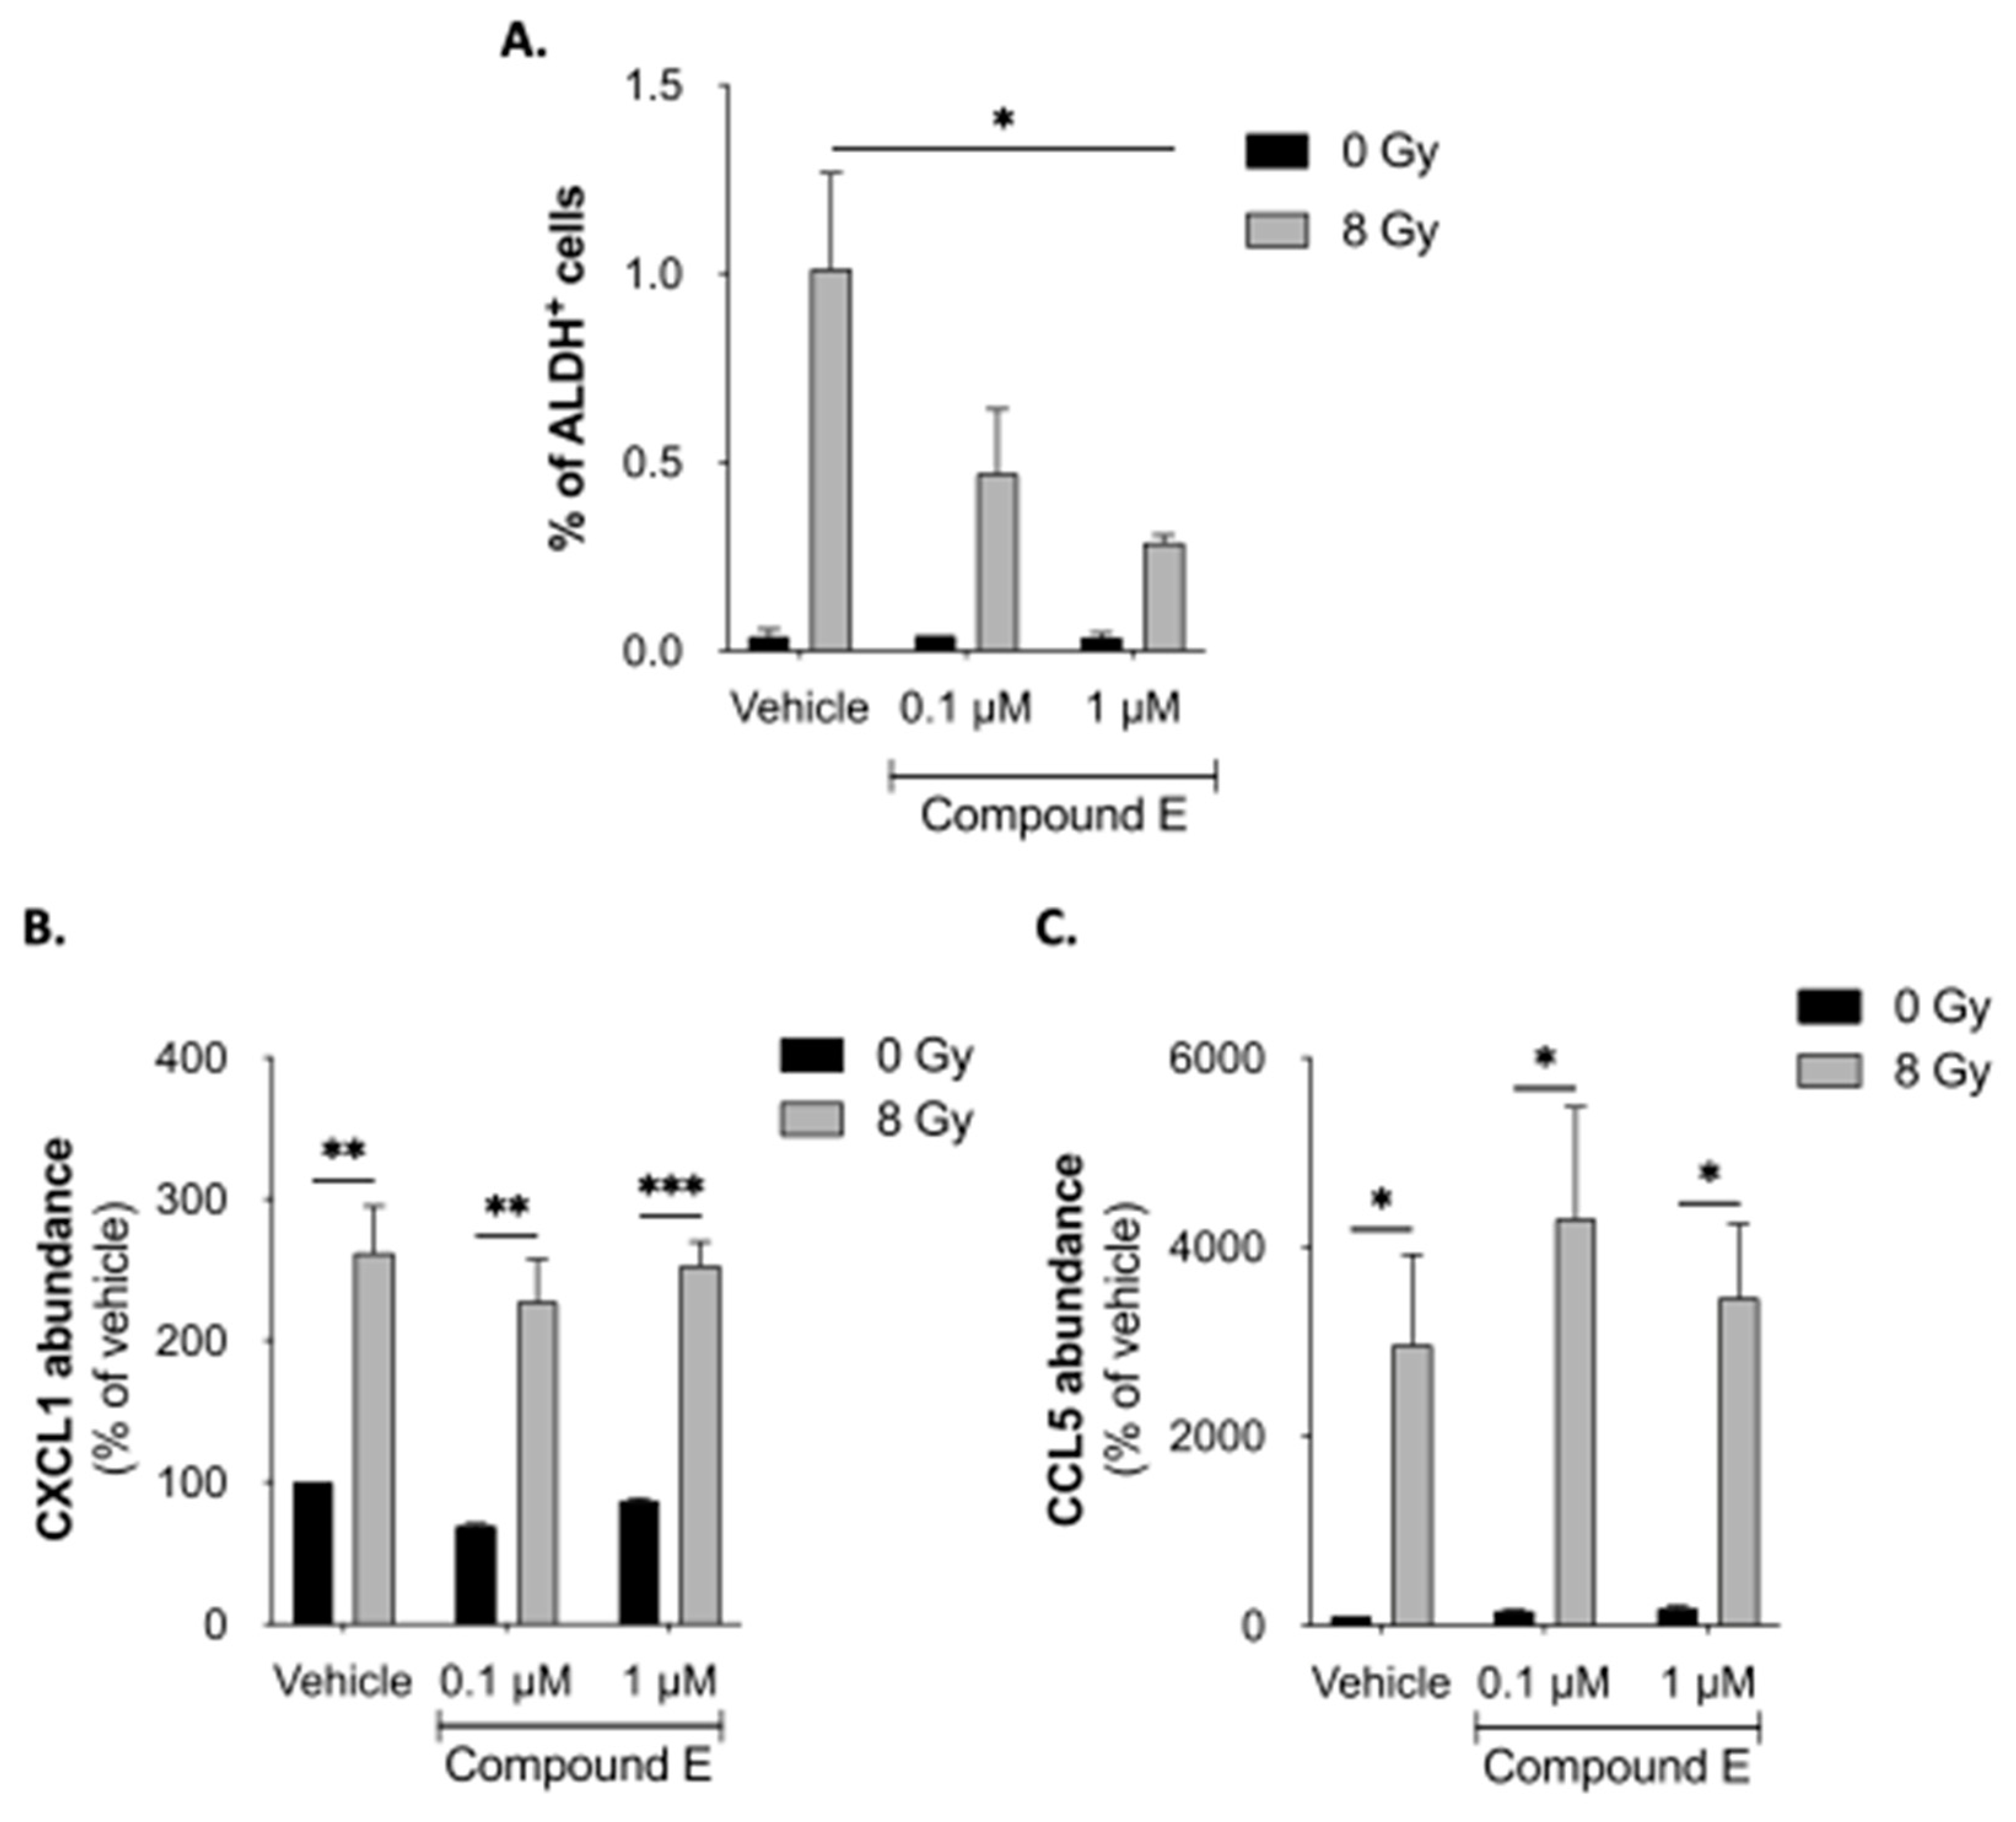
It was previously described that the inhibition of the Notch pathway by γ-secretase inhibitors (GSI) induced a decrease of radiation-induced reprogramming in breast cancer [7]. Also, chemokines, like CCL2/CCR2 [28] or CCL19/CCL21/CCR7 [29], can also modulate the Notch pathway. We wondered if the secretion of chemokines after IR was linked to ther Notch pathway activation. Therefore, SUM159PT ALDH- non-CSCs were seeded and treated with GSI (Compound E) or DMSO 1h before IR. We validated the significant decrease in radiation-induced reprogramming after inhibition of the NOTCH pathway with GSI (Figure 4A). We collected conditioned media from GSI-treated and control cells and performed ELISA to analyze the secretion of CXCL1 and CCL5. Interestingly, GSI did not modulate the chemokine secretion induced by radiation (Figure 4C-D). This result suggests that Notch signaling is not responsible for the secretion of chemokines after radiotherapy and cytokines activities might precede Notch activities.

3.3. Cytokines-induced reprogramming impact in in vivo survival

3.3.1. Reprogramming inhibition extends survival of xenografted mice

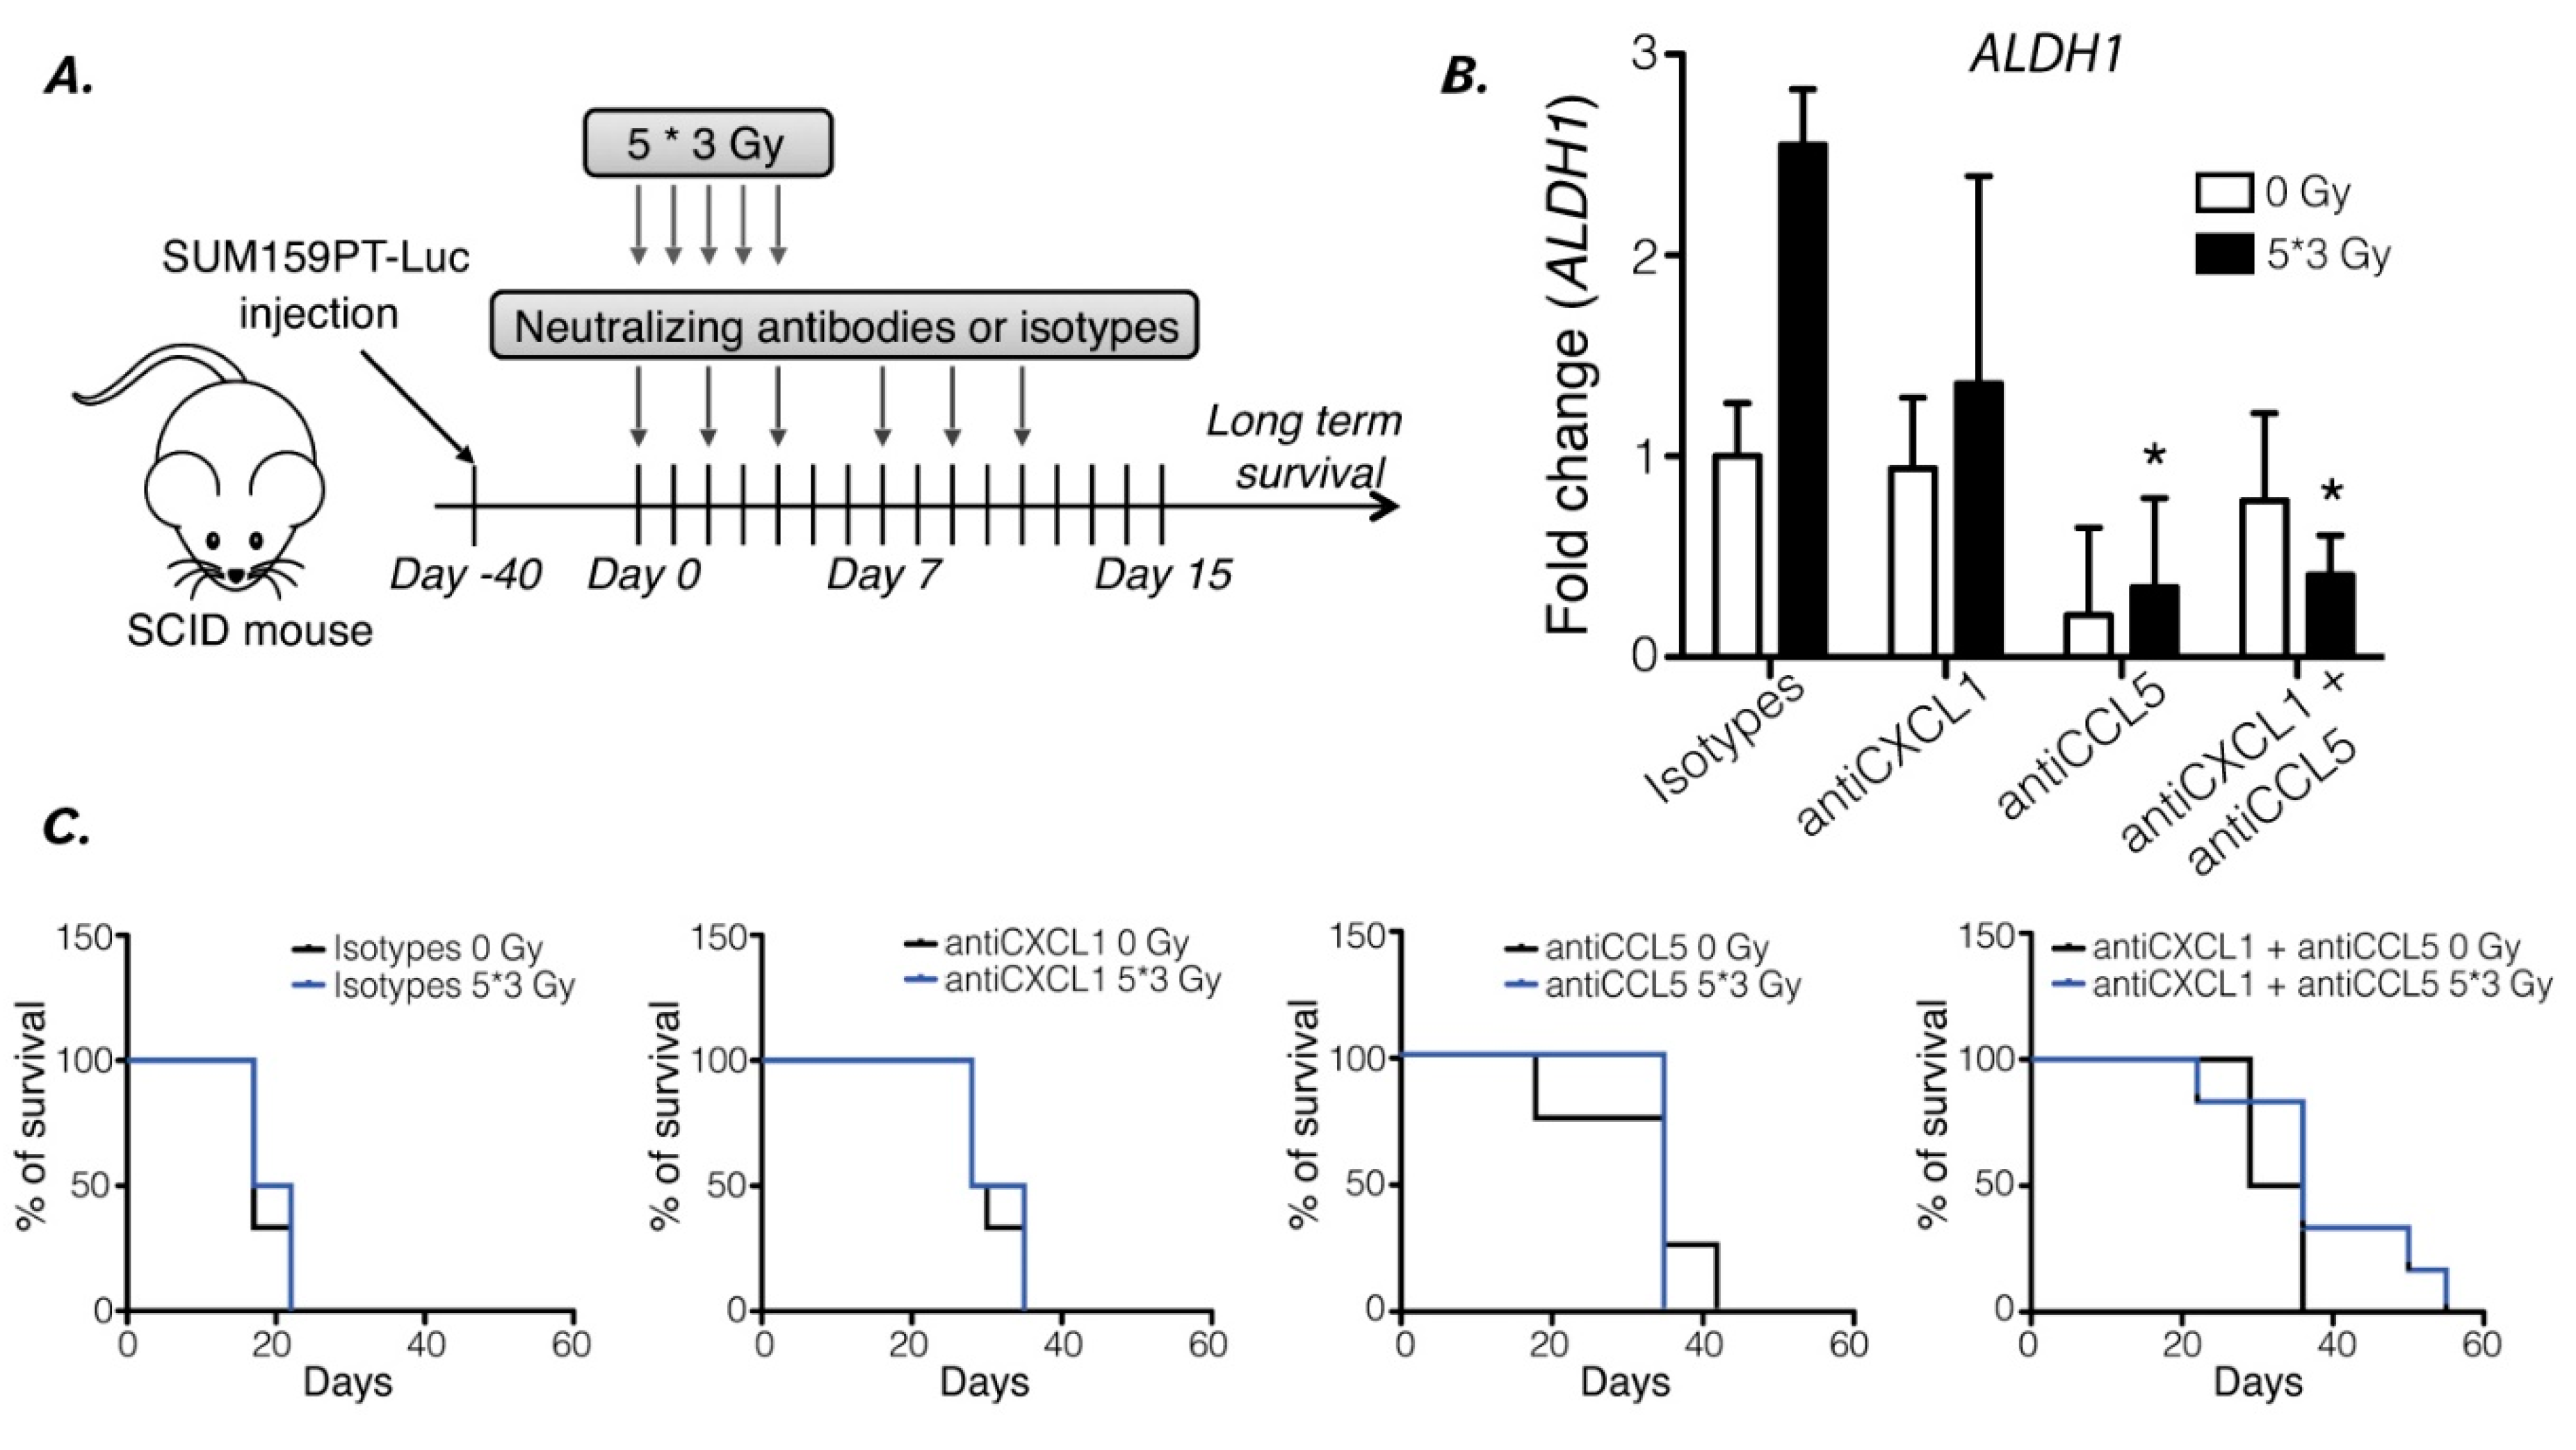
To understand how reprogramming affects radiation treatment and participates in tumor resistance, we used xenografted mice and treated them with neutralizing antibodies in combination with radiation (Figure 5A). Tumor size and mice survival were followed, and mice were sacrificed after reaching a defined ethical limit. Tumor volumes were not affected by either neutralizing treatment nor radiation but were decreased by double inhibition treatment (Figure 5C). Tumors drastically shrunk after 20 days within the “5x3 Gy/anti-CXCL1/anti-CCL5” sub-group (Figure 5C). Therefore, mouse survival was extended by 14.6% by radiation only (21 days with 0 Gy to 35 days with the 5x3 Gy/isotypes) and by 152.4% with 5x3 Gy/anti-CXCL1/anti-CCL5 (53 days, p=0.0028) (Figure 5D). Additionally, we analyzed the mRNA level of ALDH1 and detected an increase in tumors that received RT, while it was prevented (diminished) in tumors treated with anti-CCL5 or the co-treatment, with or without RT (Figure 5B). This result suggests that radiation leads to a CSC enrichment in vivo in breast cancer. Altogether, our results show that inhibition of CXCL1 and/or CCL5 is a strategy to decrease in vivo CSC induction and increase mice survival in TNBC.

3.3.2. C(X)C expression correlates with poor outcomes in breast cancer patients treated with radiotherapy

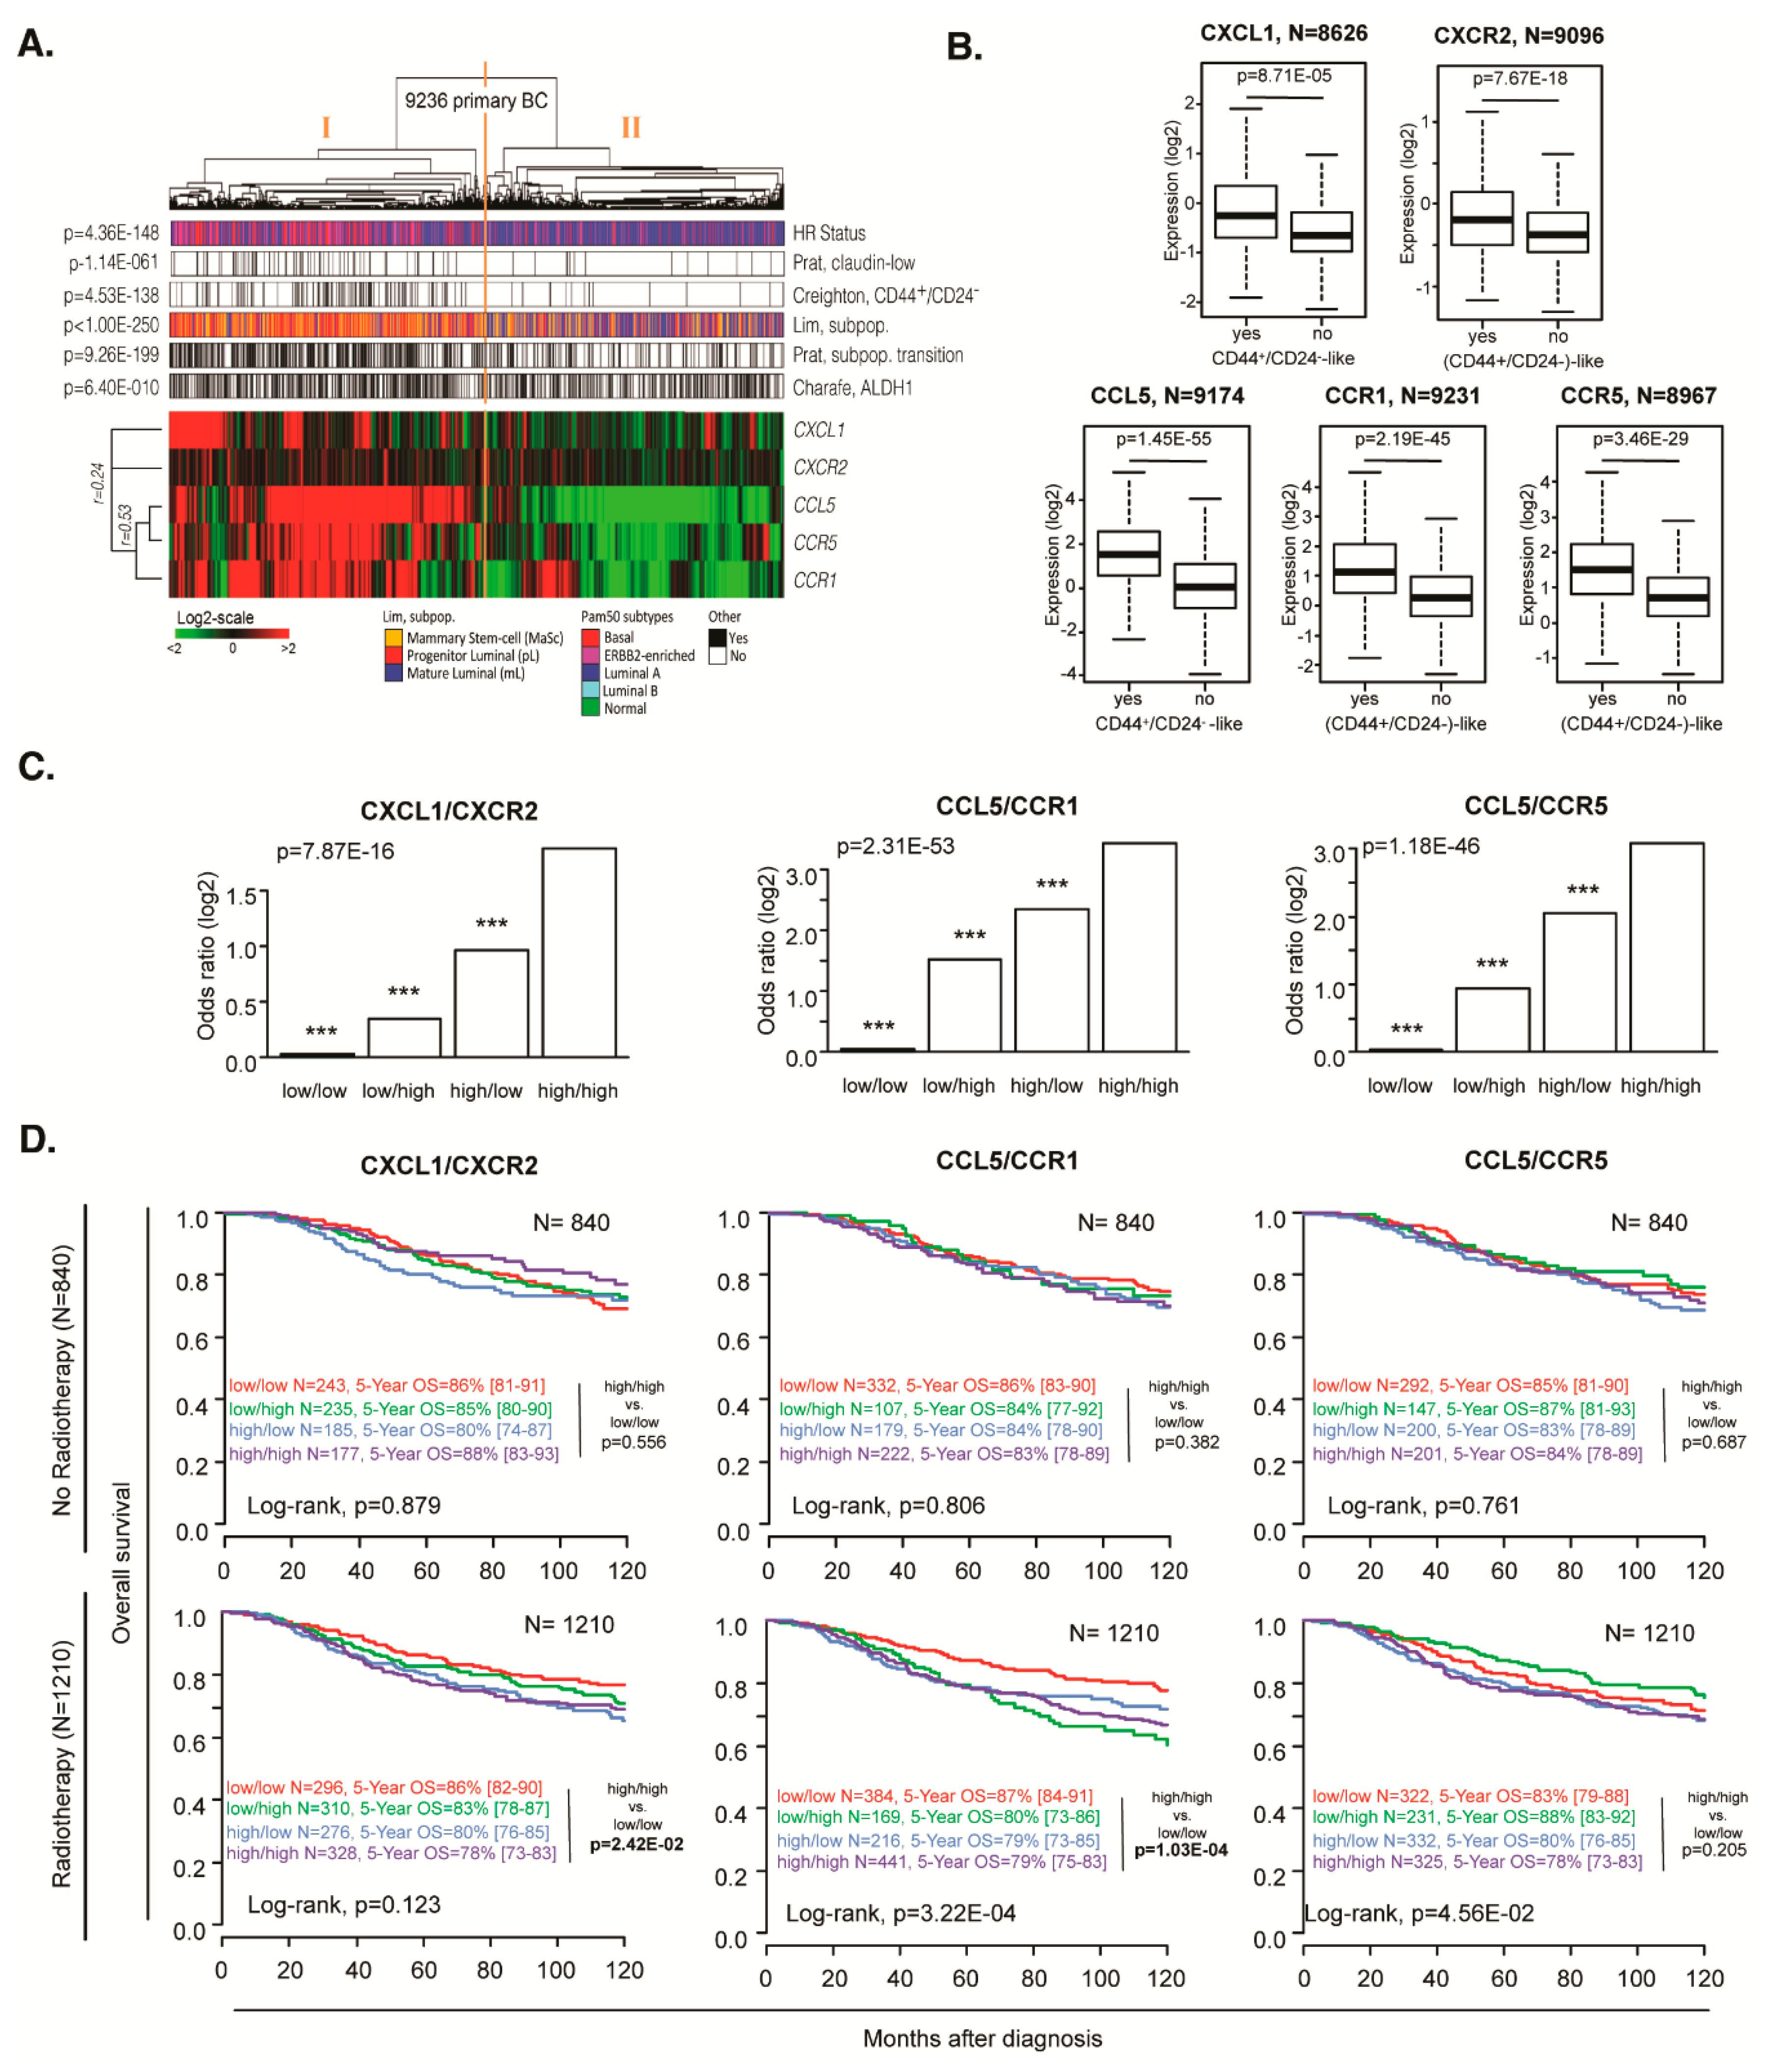
Finally, we investigated the importance of CXCL1/CXCR2, and CCL5/CCR1 or CCR5 expression on breast cancer patient survival and the correlation with stem cell signatures. We analyzed the mRNA expression of those six genes among 9236 characterized primary breast cancer samples (Supplemental Table 2-3).
Hierarchical clustering of all samples based on the expression level of six genes is shown in Figure 6A. There was a positive correlation between all genes (Pearson, minimum r=0.24); the samples were split into two main groups: group I is associated with high gene expression and group II with low expression. These two groups were correlated with different molecular classifications. Group I (high expression) samples were more frequently triple-negative and less frequently HR+/HER2- when compared with group II samples (Fisher exact t-test, p=4.36E-148). Within a univariate analysis, Group I showed more frequently CSC-associated expression profiles than group II samples (Fisher exact t-test): claudin-low profile (p=7.60E-52), CD44+/CD24- profile (p=1.56E-98), profile of mammary stem cells and progenitor luminal (p=2.80E-288), profile of transition mammary stem cells-progenitor luminal (p=2.136E-188), and ALDH1+ profile (p=6.45E-10) (Supplementary Table 4). Multivariate analysis also showed a strong correlation between Group I and CSC-associated expression profiles (p=7.95E-03, p=4.25E-20, p=5.26E-43, p=3.57E-19, respectively), except for ALDH1+ profile (p=0.959) (Supplementary Table 4). Thus we selected Creighton’s CD44+/CD24- classification as an example of a CSC-associated profile and demonstrated that the expression level of each individual ligand and each individual receptor strongly correlated with this profile (UV/MV: CXCL1 p=6.76E-25/8.71E-05, CXCR2 p=1.71E-29/7.67E-18, CCL5 p=1.31E-145/1.45E-55, CCR1 p=1.87E-89/2.19E-45 and CCR5 p=1.01E-89/3.46E-29, Figure 6B).
By using logistic regression, we then analyzed the correlation between the co-expression of each C(X)C-receptor and the associated ligand with the CSC profile. Thus, for each ligand/receptor couple, four levels of expression were used: high/high, high/low, low/high, and low/low, this later being used as the reference. The CSC classification was used as a variable to explain and aggregate of median discretized expression of C(X)C gene pair as an explicative variable. Using an ANOVA statistical test, and Tukey's range test to compare modalities, we showed that high expression of both ligand and receptor for the CXCL1/CXCR2, CCL5/CCR1, and CCL5/CCR5 couples in tumors, were highly correlated with the CSC profile (UV/MV: p=1.06E-48/7.87E-16, p=4.59E-139/2.31E-53, and p=1.29E-127/1.18E-46, respectively; Figure 6C). Similar results were found when the analysis was repeated per molecular subtype (HR+/HER2-, HER2+, and triple-negative; Figure S7).
We then analyzed the prognostic value of each C(X)C gene on the overall survival. We found only CCR1 with a significant difference in the total samples (p=6.52E-06) (Figure S8). Still, after stratification and selection of the patients receiving radiotherapy treatment, we observed that CXCL1/CXCR2 and CCL5/CCR1 could be used as poor prognostic markers (log-rank test p=2.42E-02, p=1.03E-04, respectively, Figures 6D and S9).

4. Discussion

In breast cancer, therapies resistance and recurrence drastically affect the long-term survival of patients. While tremendous efforts have been made to target resistant populations, including the CSC population, recent studies have disrupted the hierarchical dogma by demonstrating that non-CSCs can reacquire a CSC phenotype. Those studies have shown that ionizing radiation significantly induces expression of the embryonic transcription factors OCT3/4, SOX2 and NANOG, and enriches for CSC [7,30,31]. Interestingly, considering the absolute number of CSCs post-treatment, these increases are not easily explained by selective killing of non-CSCs and their proliferation activation. Indeed, we have previously demonstrated that radiation, which induces the expression of these factors, reprograms non-CSCs into CSCs with the acquisition of the in vivo functional CSC fate [7]. While phenotypic plasticity has also been demonstrated in other conditions such as hypoxia or chemotherapies [5,6], only molecular mechanisms involved in pluripotency-associated signaling pathways have been identified. Although these pathways are necessary for CSC maintenance, they might not be involved in the process of regenerating them. Therefore, the underlying molecular pathways remain to be elucidated. This plasticity is thought to be responsible for enriching much of the CSC pool and increasing tumor resistance. In the current study, we used in vitro and in vivo models combined with clinical data to investigate the molecular mechanisms of reprogramming. Our findings demonstrate that irradiated non-CSCs secrete soluble factors that can activate NOTCH pathway and induce reprogramming of non-CSCs into CSCs.
We next aimed to investigate what factors are secreted by irradiated non-CSCs. Interestingly, cytokines, well-known secreted, chemotactic proteins have been associated with CSCs chemoresistance and enrichment in breast cancer [11,52]. We demonstrated that non-CSCs express basal levels of chemokine receptors, and that radiation can increase their expression, but most importantly, ionizing radiation also induces the release of chemokines, such as CXCL1 and CCL5, confirming the pro-inflammatory effect of radiation [32]. As observed, CXCL1 expression seems to occur earlier that CCL5 expression, which might indicate the sequential role of each other. Also, we identified several other radiation-induced cytokines. Levels of induction can differ from cell types but could drive to the same phenotype switch due to cytokine signaling redundancy [33]. While CXCL1 has been associated with a poor patient outcome [34] and resistance through the recruitment of CD11b+Gr1+ myeloid cells into the tumor [35], we demonstrated herein, for the first time, the direct role of CXCL1 in generating CSCs from non-CSCs. Interestingly, some molecules, such as curcumin, which is known to target CSC [36], can sensitize breast cancer therapies by reducing CXCL1 expression [37].
Like CXCL1, CCL5 has been shown to be associated with high-grade breast cancer [38]. Moreover, Norton et al. recently demonstrated that breast cancer stem cells and CCR5+ cells affect the overall growth and morphology of breast tumors [39]. Interestingly, similarly to our group, Norton et al. only observed a slight reduction in tumor growth under CCR5 inhibition conditions. Similar results, i.e., decreases in tumor growth and CSC frequency, have been observed using the CXCR1 inhibitor reparixin conjugated to docetaxel [40]. However, these studies only focused on global enrichment instead of reprogramming; Herein, we observed that CXCL1 and CCL5 affected a non-CSC population and not an unsorted population. In a xenograft tumor mouse model derived from SUM159PT cells, the cells are usually fast growing and relatively resistant to anti-cancer treatments, as expected for a triple-negative breast cancer model. In this study, we demonstrated, for the first time, that targeting CXCL1 and CCL5 prevents radiation-induced reprogramming of non-CSCs into CSCs and CSC enrichment in vivo, leading to an increase of the radiosensitivity of the tumor and mice survival.
Assuming that chemokines are involved in the reprogramming process, we wondered if we could identify a “reprogrammable” population, i.e., a non-CSC subpopulation that responds to chemokines and is preferentially able to re-acquire a CSC phenotype. According to this hypothesis, this specific population could be the one expressing the receptors for the identified chemokines. Chemokines and their receptors are connected in a complex network: chemokines can be ligands of various receptors and receptors can link several chemokines [41]. Therefore, we studied several receptors as a whole instead of individually. While isolated CCR+/CXCR+ cells were not able to undergo reprogramming at a higher rate, we observed that sorted CCR-/CXCR- cells re-exposed CCR and CXCR at the membrane within 24h, resulting in a new population of non-CSCs with reprogramming potential. Surprisingly, individual receptor inhibition was not able to induce a significant decrease in reprogramming, while CCR/CXCR combined inhibitions do. This might be due to the CXCR/CCR signaling redundancy [42]. Indeed, chemokines and their receptors may induce several common pathways that could be involved in the process, including JAK/STAT3 or NF-kB. As Notch was the first pathway demonstrated to be involved in reprogramming [7], we studied the link between Notch signaling and CXCL1/CCL5 signaling. Using different inhibitors, we demonstrated that CXCL1/CCL5 signaling activation occurs before Notch one, as Notch inhibition fails to prevent CXCL1/CCL5 secretion and CXCL1/CCL5 treatment induces the expression of Notch and activation of the Notch pathway. Hsu et al. recently demonstrated that IL6 could induce the Notch pathway through the activation of the 𝛾-Secretase to regulate stemness [43]. Also, CCL2 has been shown to induce NOTCH1 expression and the CSC features in breast cancer cells with crosstalk between stromal cells and cancer cells [28].
By analyzing a database of 9236 breast cancer patients, we identified that expression of CXCL1, CCL5, and their receptors as well as combined C(X)CL/R gene pairs were highly correlated with CSC-associated profiles, indicating an implication of those C(X)C axes in CSC phenotype. It is worth noting that Creighton’s CD44high/CD24-/low classification matches with the cytokine/receptor expression profile, the lack of correlation with the ALDH1+ profile could be explained by the technique of detection (global mRNA) which can’t distinguish between expression in cancer cells and stromal cells. Indeed, Bednarz-Knoll et al. recently demonstrated that stroma expression of ALDH1 indicates reduced tumor progression [44]. Their implication could be performed through direct enrichment or as we investigated through a permissive environment allowing reprogramming of non-CSC into CSC. As CXCL1 [35,36,45,46,47] and CCL5 [48,49,50] have been shown to be associated with therapy resistance and poor prognosis, we confirmed these observations, adding that CXCL1 and CCL5 are especially valuable for prognosis in patients receiving radiation treatment. Moreover, we evaluated the influence of the C(X)C paired gene, CXCL1/CXCR2, and CCL5/CCR1 or CCR5 axes on patient overall survival.
Interestingly, overexpression of the C(X)C gene pairs was only associated with poor prognosis in the case of radiotherapy treatment. These results are in step with enrichment by reprogramming of non-CSC into CSC during radiation treatment. While C(X)C axes could be involved in cancer stromal cell recruitments [51,52], we highlighted the potential role of reprogramming in the process of tumor progression. Thus, while the activation of CCL5/CCR1/CCR5 axes in tumor cells could promote tumor growth through the recruitment of immunosuppressive myeloid cells [53] or angiogenesis [54], C(X)C axes could also directly generate, by reprogramming resistant CSC from non-CSC within specific contexts and distant environments, and so affect patient prognosis (reduced OS). This observation completes recent data demonstrating that the inflammatory cytokine CXCL8 can stimulate dormant disseminated tumor cells in the liver to induce metastasis [55].

5. Conclusions

In conclusion, we demonstrated that radiation treatment induces secretion of CXCL1 and CCL5 and over-expression of CXCR2, CCR1, and CCR5. This paracrine loop in non-CSC could directly or indirectly induce signal transduction to drive the re-expression of pluripotency transcription factors and allow the reprogramming of non-CSCs into CSCs, which enriches for resistant cells, ready-to-repopulate cells. Our data provide a rationale to consider CCL5/CCR1/CCR5 axes as potential targets and predictive biomarkers in breast cancer patients.

Supplementary Materials

The following supporting information can be downloaded at the website of this paper posted on Preprints.org.

Author Contributions

JBD, XLB, and CL coordinated and designed the project; JBD, NB, MD, RMA, and SC performed the experiments; JBD, CL, EB, JB, and EA performed the animal experiments; FB, PF, DB analyzed the data from patient samples databank; RAT, XLB, and CL contributed to the critical early stages of the project.

Funding

Our research is supported by the INCa (French Cancer National Institute), Grant number ARC_INCa_LNCC_8068, by Ligue contre le Cancer - Septentrion Comity, by the SIRIC ONCOLille, by “Ruban Rose!” charity award, by Institut pour la Recherche sur le Cancer de Lille (IRCL), by Centre Oscar Lambret and by GEFLUC Charity.

Availability of data and material

All data in our study are available upon request. All transcriptomics data are available online.

Acknowledgments

We thank the Small Animal Facility and the Small Animal Imaging Facility, which are shared resources of Pasteur Institute of Lille. We thank the Flow Cytometry Core facility, which is a shared resource of INSERM/CHRU of Lille. J. Bailleul-Dubois is supported by a grant fellowship from the ARC and IRCL charities. Mathilde Brulé is supported by a grant fellowship from The Ligue contre le cancer. We would like to thank the cytometry platform of the Bio Imaging Center of Lille (BICeL) and particularly Nathalie Jouy for her help with the FACS experiments.

Conflicts of Interest

We disclose that no potential conflicts of interest were disclosed by any of the authors.

Ethics approval and consent to participate

Animal experiments were approved by the French Animal Experiment Ethics Committee (authorization #5935076 and project #01989.02). All treatments were carried out according to the “Guide for the Care and Use of Laboratory Animals”. All animal procedures were conducted under isofluorane anesthesia to minimize animal stress.

Consent for publication

All authors agree to the publication of our work entitled “CXCL1/CXCR2 and CCL5/CCR1/CCR5 promote radiation-induced reprogramming of non-cancer stem cells into resistant cancer stem cells and predict patient clinical outcome” to “Cancers”.

References

  1. Vlashi, E.; Lagadec, C.; Chan, M.; Frohnen, P.; McDonald, A.; Pajonk, F. Targeted elimination of breast cancer cells with low proteasome activity is sufficient for tumor regression. Breast Cancer Res Treat 2013, 141, 197–203. [Google Scholar] [CrossRef]
  2. Chaffer CL, Brueckmann I, Scheel C, Kaestli AJ, Wiggins PA, Rodrigues LO, Brooks M, Reinhardt F, Su Y, Polyak K, Arendt LM, Kuperwasser C; et al. Normal and neoplastic nonstem cells can spontaneously convert to a stem-like state. Proc Natl Acad Sci USA 2011, 108, 7950–7955.
  3. Iliopoulos, D.; Hirsch, H.A.; Wang, G.; Struhl, K. Inducible formation of breast cancer stem cells and their dynamic equilibrium with non-stem cancer cells via IL6 secretion. Proc Natl Acad Sci USA 2011, 108, 1397–1402. [Google Scholar] [CrossRef] [PubMed]
  4. Heddleston, J.M.; Li, Z.; McLendon, R.E.; Hjelmeland, A.B.; Rich, J.N. The hypoxic microenvironment maintains glioblastoma stem cells and promotes reprogramming towards a cancer stem cell phenotype. Cell Cycle 2009, 8, 3274–3284. [Google Scholar] [CrossRef] [PubMed]
  5. Debeb, B.G.; Lacerda, L.; Xu, W.; Larson, R.; Solley, T.; Atkinson, R.; Sulman, E.P.; Ueno, N.T.; Krishnamurthy, S.; Reuben, J.M.; Buchholz, T.A.; Woodward, W.A. Histone deacetylase inhibitors stimulate dedifferentiation of human breast cancer cells through WNT/β-catenin signaling. Stem Cells 2012, 30, 2366–2377. [Google Scholar] [CrossRef]
  6. Albino, D.; Civenni, G.; Dallavalle, C.; Roos, M.; Jahns, H.; Curti, L.; Rossi, S.; Pinton, S.; D'Ambrosio, G.; Sessa, F.; Hall, J.; Catapano, C.V.; Carbone, G.M. Activation of the Lin28/let-7 Axis by Loss of ESE3/EHF Promotes a Tumorigenic and Stem-like Phenotype in Prostate Cancer. Cancer Res. 2016, 76, 3629–3643. [Google Scholar] [CrossRef] [PubMed]
  7. Lagadec, C.; Vlashi, E.; Della Donna, L.; Dekmezian, C.; Pajonk, F. Radiation-induced reprogramming of breast cancer cells. Stem Cells 2012, 30, 833–844. [Google Scholar] [CrossRef]
  8. Van Keymeulen A, Lee MY, Ousset M, Brohée S, Rorive S, Giraddi RR, Wuidart A, Bouvencourt G, Dubois C, Salmon I, Sotiriou C, Phillips WA; et al. Reactivation of multipotency by oncogenic PIK3CA induces breast tumour heterogeneity. Nature 2015, 525, 119–123.
  9. Nishi, M.; Sakai, Y.; Akutsu, H.; Nagashima, Y.; Quinn, G.; Masui, S.; Kimura, H.; Perrem, K.; Umezawa, A.; Yamamoto, N.; Lee, S.W.; Ryo, A. Induction of cells with cancer stem cell properties from nontumorigenic human mammary epithelial cells by defined reprogramming factors. Oncogene 2014, 33, 643–652. [Google Scholar] [CrossRef]
  10. Zhang, Y.; Yao, F.; Yao, X.; Yi, C.; Tan, C.; Wei, L.; Sun, S. Role of CCL5 in invasion, proliferation and proportion of CD44+/CD24- phenotype of MCF-7 cells and correlation of CCL5 and CCR5 expression with breast cancer progression. Oncol Rep 2009, 21, 1113–1121. [Google Scholar]
  11. Chen, W.; Qin, Y.; Liu, S. Cytokines, breast cancer stem cells (BCSCs) and chemoresistance. Clin Transl Med. 2018, 7, 27. [Google Scholar] [CrossRef] [PubMed]
  12. Moore BB, Arenberg DA, Stoy K, Morgan T, Addison CL, Morris SB, Glass M, Wilke C, Xue YY, Sitterding S, Kunkel SL, Burdick MD; et al. Distinct CXC chemokines mediate tumorigenicity of prostate cancer cells. Am J Pathol 1999, 154, 1503–1512.
  13. Iliopoulos, D.; Hirsch, H.A.; Wang, G.; Struhl, K. Inducible formation of breast cancer stem cells and their dynamic equilibrium with non-stem cancer cells via IL6 secretion. Proc Natl Acad Sci USA 2011, 108, 1397–1402. [Google Scholar] [CrossRef] [PubMed]
  14. Ginestier C, Liu S, Diebel ME, Korkaya H, Luo M, Brown M, Wicinski J, Cabaud O, Charafe-Jauffret E, Birnbaum D, Guan J-LL, Dontu G; et al. CXCR1 blockade selectively targets human breast cancer stem cells in vitro and in xenografts. J Clin Invest 2010, 120, 485–497.
  15. Singh, J.; Farnie, G.; Bundred, N.; Simões, B.; Shergill, A.; Landberg, G.; Howell, S.; Clarke, R. Targeting CXCR1/2 significantly reduces breast cancer stem cell activity and increases the efficacy of inhibiting HER2 via HER2-dependent and -independent mechanisms. Clin Cancer Res 2012, 19, 643–656. [Google Scholar] [CrossRef] [PubMed]
  16. Ginestier C, Hur MH, Charafe-Jauffret E, Monville F, Dutcher J, Brown M, Jacquemier J, Viens P, Kleer CG, Liu S, Schott A, Hayes D; et al. ALDH1 is a marker of normal and malignant human mammary stem cells and a predictor of poor clinical outcome. Cell Stem Cell 2007, 1, 555–567.
  17. Ginestier C, Hur MH, Charafe-Jauffret E, Monville F, Dutcher J, Brown M, Jacquemier J, Viens P, Kleer CG, Liu S, Schott A, Hayes D; et al. ALDH1 is a marker of normal and malignant human mammary stem cells and a predictor of poor clinical outcome. Cell Stem Cell 2007, 1, 555–567.
  18. Prat, A.; Parker, J.S.; Karginova, O.; Fan, C.; Livasy, C.; Herschkowitz, J.I.; He, X.; Perou, C.M. Phenotypic and molecular characterization of the claudin-low intrinsic subtype of breast cancer. Breast Cancer Res 2010, 12, R68. [Google Scholar] [CrossRef] [PubMed]
  19. Creighton CJ, Li X, Landis M, Dixon JM, Neumeister VM, Sjolund A, Rimm DL, Wong H, Rodriguez A, Herschkowitz JI, Fan C, Zhang X; et al. Residual breast cancers after conventional therapy display mesenchymal as well as tumor-initiating features. Proc Natl Acad Sci USA 2009, 106, 13820–13825.
  20. Prat, A.; Karginova, O.; Parker, J.S.; Fan, C.; He, X.; Bixby, L.; Harrell, J.C.; Roman, E.; Adamo, B.; Troester, M.; Perou, C.M. Characterization of cell lines derived from breast cancers and normal mammary tissues for the study of the intrinsic molecular subtypes. Breast Cancer Res Treat 2013, 142, 237–255. [Google Scholar] [CrossRef]
  21. Lim, E.; Wu, D.; Pal, B.; Bouras, T.; Asselin-Labat, M.-L.L.; Vaillant, F.; Yagita, H.; Lindeman, G.J.; Smyth, G.K.; Visvader, J.E. Transcriptome analyses of mouse and human mammary cell subpopulations reveal multiple conserved genes and pathways. Breast Cancer Res 2010, 12, R21. [Google Scholar] [CrossRef] [PubMed]
  22. Lehmann, B.; Bauer, J.; Chen, X.; Sanders, M.; Chakravarthy, A.; Shyr, Y.; Pietenpol, J. Identification of human triple-negative breast cancer subtypes and preclinical models for selection of targeted therapies. J Clin Invest 2011, 121, 2750–2767. [Google Scholar] [CrossRef]
  23. Parker J, Mullins M, Cheang M, Leung S, Voduc D, Vickery T, Davies S, Fauron C, He X, Hu Z, Quackenbush J, Stijleman I; et al. Supervised Risk Predictor of Breast Cancer Based on Intrinsic Subtypes. J Clin Oncol 2009, 27, 1160–1167.
  24. McShane, L.; Altman, D.; Sauerbrei, W.; Taube, S.; Gion, M.; Clark, G. Reporting Recommendations for Tumor Marker Prognostic Studies (REMARK). Jnci J National Cancer Inst 2005, 97, 1180–1184. [Google Scholar] [CrossRef] [PubMed]
  25. Morein, D.; Rubinstein-Achiasaf, L.; Brayer, H.; Dorot, O.; Pichinuk, E.; Ben-Yaakov, H.; Meshel, T.; Pasmanik-Chor, M.; Ben-Baruch, A. Continuous Inflammatory Stimulation Leads via Metabolic Plasticity to a Prometastatic Phenotype in Triple-Negative Breast Cancer Cells. Cells 2021, 10, 1356. [Google Scholar] [CrossRef] [PubMed]
  26. Krohn A, Song Y-HH, Muehlberg F, Droll L, Beckmann C, Alt E. CXCR4 receptor positive spheroid forming cells are responsible for tumor invasion in vitro. Cancer Lett 2009, 280, 65–71.
  27. Zhang, M.; Tsimelzon, A.; Chang, C.-H.H.; Fan, C.; Wolff, A.; Perou, C.M.; Hilsenbeck, S.G.; Rosen, J.M. Intratumoral heterogeneity in a Trp53-null mouse model of human breast cancer. Cancer Discov 2015, 5, 520–533. [Google Scholar] [CrossRef] [PubMed]
  28. Tsuyada A, Chow A, Wu J, Somlo G, Chu P, Loera S, Luu T, Li AX, Wu X, Ye W, Chen S, Zhou W, Yu Y, Wang YZ, Ren X, Li H, Scherle P, Kuroki Y, Wang SE. CCL2 mediates cross-talk between cancer cells and stromal fibroblasts that regulates breast cancer stem cells. Cancer Res. 2012, 72, 2768–2779.
  29. Boyle, S.; Gieniec, K.; Gregor, C.; Faulkner, J.; McColl, S.; Kochetkova, M. Interplay between CCR7 and Notch1 axes promotes stemness in MMTV-PyMT mammary cancer cells. Mol Cancer 2017, 16, 19. [Google Scholar] [CrossRef] [PubMed]
  30. Salmina, K.; Jankevics, E.; Hunan, A.; Perminov, D.; Radovica, I.; Klymenko, T.; Ivanov, A.; Jascenko, E.; Scherthan, H.; Cragg, M.; Erenpreisa, J. Up-regulation of the embryonic self-renewal network through reversible polyploidy in irradiated p53-mutant tumour cells. Exp Cell Res 2010, 316, 2099–2112. [Google Scholar] [CrossRef]
  31. Ghisolfi, L.; Keates, A.; Hu, X.; Lee, D.; Li, C. Ionizing radiation induces stemness in cancer cells. PLoS ONE 2012, 7, e43628. [Google Scholar] [CrossRef]
  32. Di Maggio F, Minafra L, Forte G; et al. Portrait of inflammatory response to ionizing radiation treatment. J Inflamm 2015, 12, 1–11.
  33. Morel, P.A.; Lee, R.E.C.; Faeder, J.R. Demystifying the cytokine network: Mathematical models point the way. Cytokine. 2017, 98, 115–123. [Google Scholar] [CrossRef] [PubMed]
  34. Zou, A.; Lambert, D.; Yeh, H.; Yasukawa, K.; Behbod, F.; Fan, F.; Cheng, N. Elevated CXCL1 expression in breast cancer stroma predicts poor prognosis and is inversely associated with expression of TGF-β signaling proteins. BMC Cancer 2014, 14, 781. [Google Scholar] [CrossRef]
  35. Acharyya S, Oskarsson T, Vanharanta S, Malladi S, Kim J, Morris PG, Manova-Todorova K, Leversha M, Hogg N, Seshan VE, Norton L, Brogi E; et al. A CXCL1 paracrine network links cancer chemoresistance and metastasis. Cell 2012, 150, 165–178.
  36. Mukherjee, S.; Mazumdar, M.; Chakraborty, S.; Manna, A.; Saha, S.; Khan, P.; Bhattacharjee, P.; Guha, D.; Adhikary, A.; Mukhjerjee, S.; Das, T. Curcumin inhibits breast cancer stem cell migration by amplifying the E-cadherin/β-catenin negative feedback loop. Stem Cell Res Ther 2014, 5, 116. [Google Scholar] [CrossRef] [PubMed]
  37. Bachmeier, B.; Mohrenz, I.; Mirisola, V.; Schleicher, E.; Romeo, F.; Höhneke, C.; Jochum, M.; Nerlich, A.; Pfeffer, U. Curcumin downregulates the inflammatory cytokines CXCL1 and -2 in breast cancer cells via NFκB. Carcinogenesis 2008, 29, 779–789. [Google Scholar] [CrossRef] [PubMed]
  38. Zhang, Y.; Yao, F.; Yao, X.; Yi, C.; Tan, C.; Wei, L.; Sun, S. Role of CCL5 in invasion, proliferation and proportion of CD44+/CD24- phenotype of MCF-7 cells and correlation of CCL5 and CCR5 expression with breast cancer progression. Oncol Rep 2009, 21, 1113–1121. [Google Scholar] [PubMed]
  39. Norton, K.-A.; Wallace, T.; Pandey, N.; Popel, A. An agent-based model of triple-negative breast cancer: The interplay between chemokine receptor CCR5 expression, cancer stem cells, and hypoxia. Bmc Syst Biol 2017, 11, 68. [Google Scholar] [CrossRef]
  40. Brandolini L, Cristiano L, Fidoamore A, De Pizzol M, Di Giacomo E, Florio TM, Confalone G, Galante A, Cinque B, Benedetti E, Ruffini PA, Cifone MG; et al. Targeting CXCR1 on breast cancer stem cells: Signaling pathways and clinical application modelling. Oncotarget 2015, 6, 43375–43394.
  41. Balkwill, F. The chemokine system and cancer. J Pathology 2012, 226, 148–157. [Google Scholar] [CrossRef] [PubMed]
  42. Rajagopal, S.; Bassoni, D.L.; Campbell, J.J.; Gerard, N.P.; Gerard, C.; Wehrman, T.S. Biased agonism as a mechanism for differential signaling by chemokine receptors. J Biol Chem 2013, 288, 35039–35048. [Google Scholar] [CrossRef] [PubMed]
  43. Hsu, E.C.; Kulp, S.K.; Huang, H.L.; Tu, H.J.; Salunke, S.B.; Sullivan, N.J.; Sun, D.; Wicha, M.S.; Shapiro, C.L.; Chen, C.S. Function of Integrin-Linked Kinase in Modulating the Stemness of IL-6-Abundant Breast Cancer Cells by Regulating γ-Secretase-Mediated Notch1 Activation in Caveolae. Neoplasia 2015, 17, 497–508. [Google Scholar] [CrossRef] [PubMed]
  44. Bednarz-Knoll, N.; Nastały, P.; Żaczek, A.; Stoupiec, M.G.; Riethdorf, S.; Wikman, H.; Müller, V.; Skokowski, J.; Szade, J.; Sejda, A.; Wełnicka-Jaśkiewicz, M.; Pantel, K. Stromal expression of ALDH1 in human breast carcinomas indicates reduced tumor progression. Oncotarget, 2015; 6, 26789–26803. [Google Scholar]
  45. Zhang H, Yue J, Jiang Z, Zhou R, Xie R, Xu Y, Wu S. CAF-secreted CXCL1 conferred radioresistance by regulating DNA damage response in a ROS-dependent manner in esophageal squamous cell carcinoma. Cell Death Dis 2017, 8, e2790.
  46. Oladipo, O.; Conlon, S.; O’Grady, A.; Purcell, C.; Wilson, C.; Maxwell, P.J.; Johnston, P.G.; Stevenson, M.; Kay, E.W.; Wilson, R.H.; Waugh, D.J.J. The expression and prognostic impact of CXC-chemokines in stage II and III colorectal cancer epithelial and stromal tissue. Br J Cancer 2011, 104, 480–487. [Google Scholar] [CrossRef]
  47. Jia, D.; Li, L.; Andrew, S.; Allan, D.; Li, X.; Lee, J.; Ji, G.; Yao, Z.; Gadde, S.; Figeys, D.; Wang, L. An autocrine inflammatory forward-feedback loop after chemotherapy withdrawal facilitates the repopulation of drug-resistant breast cancer cells. Cell Death Dis 2017, 8, e2932. [Google Scholar] [CrossRef]
  48. D’Esposito V, Liguoro D, Ambrosio MR, Collina F, Cantile M, Spinelli R, Raciti GA, Miele C, Valentino R, Campiglia P, De Laurentiis M, Di Bonito M; et al. Adipose microenvironment promotes triple negative breast cancer cell invasiveness and dissemination by producing CCL5. Oncotarget 2016, 7, 24495–24509.
  49. Yi EH, Lee CS, Lee J-KK, Lee YJ, Shin MK, Cho C-HH, Kang KW, Lee JW, Han W, Noh D-YY, Kim Y-NN, Cho I-HH; et al. STAT3-RANTES autocrine signaling is essential for tamoxifen resistance in human breast cancer cells. Mol Cancer Res 2013, 11, 31–42.
  50. Yaal-Hahoshen, N.; Shina, S.; Leider-Trejo, L.; Barnea, I.; Shabtai, E.L.; Azenshtein, E.; Greenberg, I.; Keydar, I.; Ben-Baruch, A. The chemokine CCL5 as a potential prognostic factor predicting disease progression in stage II breast cancer patients. Clin Cancer Res 2006, 12, 4474–4480. [Google Scholar] [CrossRef] [PubMed]
  51. Lv M, Xu Y, Tang R, Ren J, Shen S, Chen Y, Liu B, Hou Y, Wang T. miR141-CXCL1-CXCR2 signaling-induced Treg recruitment regulates metastases and survival of non-small cell lung cancer. Mol Cancer Ther 2014, 13, 3152–3162.
  52. Kasashima H, Yashiro M, Nakamae H, Kitayama K, Masuda G, Kinoshita H, Fukuoka T, Hasegawa T, Nakane T, Hino M, Hirakawa K, Ohira M. CXCL1-Chemokine (C-X-C Motif) Receptor 2 Signaling Stimulates the Recruitment of Bone Marrow-Derived Mesenchymal Cells into Diffuse-Type Gastric Cancer Stroma. Am J Pathol 2016, 186, 3028–3039.
  53. Ban, Y.; Mai, J.; Li, X.; Mitchell-Flack, M.; Zhang, T.; Zhang, L.; Chouchane, L.; Ferrari, M.; Shen, H.; Ma, X. Targeting Autocrine CCL5-CCR5 Axis Reprograms Immunosuppressive Myeloid Cells and Reinvigorates Antitumor Immunity. Cancer Res 2017, 77, 2857–2868. [Google Scholar] [CrossRef] [PubMed]
  54. Sax MJ, Gasch C, Athota VR, Freeman R, Rasighaemi P, Westcott DE, Day CJ, Nikolic I, Elsworth B, Wei M, Rogers K, Swarbrick A; et al. Cancer cell CCL5 mediates bone marrow independent angiogenesis in breast cancer. Oncotarget 2016, 7, 85437–85449.
  55. Khazali, A.S.; Clark, A.M.; Wells, A. Inflammatory cytokine IL-8/CXCL8 promotes tumour escape from hepatocyte-induced dormancy. Br J Cancer 2017. [CrossRef] [PubMed]
Figure 1. CSC induction after ionizing radiation and CM treatments. (A) Experimental procedure for testing the conditioned medium effect on reprogramming: cells were stained with the Aldefluor© assay, and ALDH-/low non-CSCs were sorted and seeded as monolayers. The cells were irradiated with 0 or 8 Gy. Five days after radiation, conditioned medium (CM) was withdrawn from irradiated cultures and applied to treat freshly sorted non-CSCs. (B) Reprogramming was analyzed 5 days after CM treatment or IR by performing an Aldefluor© assay in SUM159PT and MDA MB 231 cells. (C) CM-treated non-CSCs from SUM159PT cells were seeded in low-adhesion 96-well plates 5 days post-radiation. The number of primary spheres was counted 10 days later. In parallel, CM-treated non-CSCs were seeded in low-adhesion flasks 5 days after treatment and allowed to grow for 10 days. After 10 days, the spheres were dissociated and reseeded for secondary sphere-forming capacity tests. The sphere-forming capacity (SFC) of the cells was evaluated up to 4 generations (4G). (D) SFC of CM-treated non-CSCs SUM159PT after 10 days of culture. (E) Representative images of SUM159PT primary spheres at 10 days. Photos were obtained with a Nikon Eclipse Ti microscope, 10x lens (scale = 100 µm). (F) Expression of OCT4, SOX2, and NANOG by qRT-PCR in irradiated or CM-treated non-CSCs 5 days post-IR in SUM159PT. Gene expression was normalized to GAPDH expression. All data are represented by means ± SEM. *p<0.05, **p<0.001, ***p<0.0001, ****p<0.00001, t test, n ≥ 3.
Preprints 98374 g001
Figure 2. Radiation-induced expression of chemokines and their effects on reprogramming. (A) CM from irradiated ALDH-/low non-CSCs SUM159PT was collected and analyzed by chemokine array. The control condition consists of a fresh medium incubated for 6 days without cells at 37°C and 5% CO2. Black arrows indicate CXCL1 (1), CCL5 (2), and CXCL8 (3). (B) Relative expression of chemokines post-IR. The expression was normalized to the internal positive controls. (C, D) Relative quantification of CXCL1 (C) and CCL5 (D) by ELISA for 5 days post-IR. (E, F) Freshly sorted non-CSCs were seeded and treated 24 hours later with CXCL1 or CCL5 (concentrations are indicated in Materials and Methods). The control condition consisted of PBS 0.1% BSA. (E) Aldefluor flow cytometry analysis at 5 days post-treatment. (F) Sphere-forming capacity of treated cells. (G) Freshly sorted non-CSCs were treated 24 hours after sorting with radiation and/or neutralizing antibodies against CXCL1 and CCL5 (or isotype controls). ALDH+ cells were analyzed by flow cytometry 5 days after treatment. All data are represented by means ± SEM. *p<0.05, **p<0.001, ***p<0.0001, ****p<0.00001, t test, n ≥ 3.
Preprints 98374 g002
Figure 3. Chemokine receptor expression and their role in reprogramming. (A) Immunostaining of CCR1, CCR5, and CXCR2 was performed in SUM159PT and analyzed by flow cytometry, with or without radiation. (B) Sorted ALDH- non-CSCs were treated with BX471 (CCR1-inhibitor), Maraviroc (CCR5-inhibitor), or SB225002 (CXCR2-inhibitor), followed by radiation. Reprogramming (ALDH+ cells) was analyzed by flow cytometry. (C) CCR5+ and CCR5- SUM159PT cells were sorted and plated in low-adhesion plates to measure their sphere-forming capacity. (D) Co-staining of ALDH and CCR5 was performed and the percentage of CCR5+ cells was determined in ALDH+ and ALDH- SUM159PT cells. (E) ALDH-, CCR5+, and CCR5- SUM159PT cells were sorted and treated with radiation 24 hours later. The reprogramming capacity was assessed 5 days later by flow cytometry (ALDH+ cells). All data are represented by means ± SEM. *p<0.05, **p<0.001, ***p<0.0001, ****p<0.00001, t test, n ≥ 3.
Preprints 98374 g003
Figure 4. Notch pathway is involved in reprogramming. (A) Sorted ALDH- non-CSCs were treated with Compound E (Notch-inhibitor), followed by radiation. Reprogramming (ALDH+ cells) was analyzed by flow cytometry. (B, C) Relative quantification of CXCL1 (B) and CCL5 (C) by ELISA for 5 days post-treatment. All data are represented by means ± SEM. *p<0.05, **p<0.001, ***p<0.0001, ****p<0.00001, t-test, n ≥ 3.
Preprints 98374 g004
Figure 5. Reprogramming inhibition increases xenografted mouse survival. (A) In vivo experiment protocol: mice were injected with 106 SUM159PT-Luc cells in both flanks. When tumors were detectable, the mice were either irradiated or not and then treated with either or both antiCXCL1 and antiCCL5 neutralizing antibodies or isotypes controls. (B) RNA extraction from xenografted tumors was performed, and ALDH1 expression was evaluated by qPCR. Human ß2-microglobulin expression was used as a control. t-test, n=6 mice per group, *, p<0.05. (C) Kaplan-Meier survival curves of xenografted SCID mice irradiated or not, treated with isotype controls, antiCXCL1, antiCCL5 or both. Survival medians are 17 days, 29 days, 35 days, and 32.5 days at 0 Gy (Log-rank (Mantel-Cox), p=0.0031), and 19.5 days, 31.5 days, 35 days, and 36 days at 5*3 Gy (Log-rank (Mantel-Cox), p=0.0028) in “isotypes", "antiCXCL1", "antiCCL5" and “antiCXCL1+antiCCL5" groups, respectively, n=6 mice per group.
Preprints 98374 g005
Figure 6. Breast cancer patient analyses to determine the correlation of C(X)CR and C(X)CL expression. (A) Hierarchical clustering of 9236 samples and 5 genes with the Cluster program (53) using complete linkage and uncentered Pearson correlation as parameters. Results were displayed using TreeView program. Below the dendrogram are indicated from top to bottom as colored bars the molecular subtypes (blue: HR+/HER2-, magenta: HER2+, red: TN), Prat’s claudin-low (black: claudin-low, white: non claudin-low), Creighton’s CD44high/CD24-/low (black: CD44high/CD24-/low-like, white: non CD44high/CD24-/low-like), Prat’s subpopulation transition signature (black: mammary stem cell to progenitor Luminal, white: progenitor Luminal to mature Luminal), Lim’s signature (orange: mammary stem cell, red: progenitor Luminal, blue: mature Luminal) and Charafe’s ALDH1 (black: ALDH1-like positive, white: ALDH1-like negative). (B) Box plot of expression level of each ligand and receptor according to the Creighton’s CD44high/CD24-/low CSC profile. (C) Bar plot of Creighton’s CD44high/CD24-/low CSC signature correlation with each ligand/receptor couple, where each bar represents the logistic regression coefficient of each expression modality. (D) Overall survival with or without radiotherapy, in CXCL1/CXCR2, CCL5/CCR1 or CCL5/CCR5-expressing tumors.
Preprints 98374 g006
Disclaimer/Publisher’s Note: The statements, opinions and data contained in all publications are solely those of the individual author(s) and contributor(s) and not of MDPI and/or the editor(s). MDPI and/or the editor(s) disclaim responsibility for any injury to people or property resulting from any ideas, methods, instructions or products referred to in the content.
Copyright: This open access article is published under a Creative Commons CC BY 4.0 license, which permit the free download, distribution, and reuse, provided that the author and preprint are cited in any reuse.
Prerpints.org logo

Preprints.org is a free preprint server supported by MDPI in Basel, Switzerland.

Subscribe

© 2024 MDPI (Basel, Switzerland) unless otherwise stated