1. Introduction
Over the North Indian Ocean (NIO), the intensity and frequency of intense tropical cyclones (TCs) are increasing [
1,
2,
3,
4,
5,
6], and the population density near the coastal belts has also increased [
7,
8]. Hence, the risk associated with land-falling TCs over coastal regions in terms of coastal vulnerability will increase [
9]. Studies suggest that the Indian subcontinent is highly vulnerable compared to other regions due to TCs, and the forecast accuracy is lower compared to the North Atlantic and Pacific Ocean [
10,
11]. Therefore, there is a need to improve the forecast skill of intense TCs over the NIO. In the last two decades, the forecast accuracy of TCs has increased by using high-resolution regional and global numerical weather prediction models [
12,
13,
14,
15,
16] and improved and proper representations of physical parameterization schemes [
17,
18,
19,
20,
21,
22]. Additionally, TC forecast accuracy has improved by using advanced data assimilation techniques such as 3D/4D variational techniques, hybrid, and ensemble methods [
5,
23,
24,
25,
26,
27,
28,
29,
30,
31,
32,
33,
34,
35,
36,
37,
38,
39]. Previous studies have indicated that track forecasts improved, but intensity forecasts are still limited. It is important to test the performance of a modeling system in the forecast of intense land-falling TC intensity as a special interest with a number of cases that developed over the Bay of Bengal region in a high-resolution modeling system. [
40] suggested that increasing the horizontal resolution in the HWRF model has a larger impact on intense cyclones compared to low-intensity cyclones. Additionally, increased horizontal resolution provides a better forecast of warm core structures and secondary circulations. Several studies have also documented that increasing model horizontal resolutions have a positive impact on the forecast of track and intensity [
41,
42].
From the above, it is clear and expected that using a high-resolution modeling system provides a better forecast of the track, structure, and intensity of TCs. However, in most of these studies, the initial conditions and boundary conditions are derived mainly from NCEP Final analysis (FNL; 1.0° x 1.0° resolution), Global Forecast System (GFS; 0.5° x 0.5° resolution), ECMWF Reanalysis Interim/ERA5 (0.25° x 0.25° resolution) datasets. Due to the availability of a very high-resolution regional reanalysis dataset, namely Indian Monsoon Data Assimilation and Analysis (IMDAA), it is necessary to test the performance of this regional dataset in the forecast of intense tropical cyclones over the Bay of Bengal region.
It is expected that a customized high-resolution ARW modeling system, utilizing the high-resolution IMDAA reanalysis dataset, will provide a more accurate forecast for various TCs, instilling confidence in the model’s predictability. Hence, there is a scope to test the performance of IMDAA datasets in a high-resolution ARW model to forecast five different land-falling TCs over the region under varying environmental conditions. The purpose of the study is to evaluate the model’s efficiency in simulating five extremely severe cyclonic storms (ESCSs; wind speed exceeding 90 knots) using IMDAA datasets under diverse environmental conditions. These storms developed over the Bay of Bengal region and made landfall in different parts of the Indian subcontinent.
The structure of the study is well-organized as follows: the first section covers a brief introduction on tropical cyclone forecast skills in regional and global models. This is followed by the methodology, datasets used in the study, and numerical experiments in
Section 2. The results from the finer 4 km domain are presented and discussed in
Section 3. The last section provides a brief discussion on the study’s conclusions.
2. Methodology and Data
This study utilizes the Advanced Research version of the Weather Research and Forecasting (WRF) model, specifically ARW (V 4.2). This model consists of non-hydrostatic, terrain-following sigma coordinates as vertical levels, a time integration scheme using the Runge-Kutta 3rd order, and various choices for dynamics, numeric, and physics components [
43]. The ARW model is configured with two nesting domains: an outer domain with a resolution of 12 km (355 × 430 grid points, covering approximately 65°E - 110°E and 10°S - 40°N) and an inner domain with a resolution of about 4 km (523 × 682 grid points, covering approximately 78.42 °E – 100.06°E and 0.11°N – 27.07°N). This setup encompasses the Bay of Bengal and its neighboring regions. The model has 51 unequal vertical levels with a model top at 10 hPa. Physics settings for the study are selected from previous modeling studies over the Bay of Bengal region, demonstrating improved forecasts of tropical cyclones [
18,
19,
25,
44,
45,
46]. These selected physics include microphysics, cumulus, planetary boundary layer, long/short-wave radiations, and land surface models, as listed in
Table 1, providing details of the selected model configuration used in the study.
Table 2 presents information on five Extremely Severe Cyclonic Storms (ESCSs) selected for simulations, including details on formation, landfall position, and initialization time. Notably, each experiment has a forecast length of 96 hours. The model’s initial and lateral boundary conditions for simulating ESCSs over the Bay of Bengal region are derived from the Indian Monsoon Data Assimilation and Analysis reanalysis (IMDAA). This reanalysis dataset has a horizontal resolution of approximately 0.12° × 0.12° over the Indian subcontinent [
47,
48,
49], covering the region between 30° to 120° E and 15° S to 45° N over the North Indian Ocean. To assess the ARW modeling system’s capability using IMDAA reanalysis datasets as initial and boundary conditions, five ESCSs—Sidr-2007, Phailin-2013, Hudhud-2014, Fani-2019, and Amphan-2020—are selected for simulations.
Table 2 provides the initialization times for each cyclone, and the forecast length for each simulation is 96 hours.
The study presents simulated results, including cyclone movement, intensity (maximum surface wind and minimum central pressure), 24-hour wind changes, daily accumulated rainfall, maximum reflectivity, and discussion on derived parameters like time series of warm core structure and frozen hydrometeors for the ESCSs. To validate the rainfall pattern and distribution, the simulated results are compared with IMD-best fit-track, Doppler weather radar from IMD, and rainfall data from the Tropical Rainfall Measuring Mission (TRMM; Daily accumulated precipitation combined microwave-IR (GPM_3IMERGDF v06)), with a spatial resolution of about 0.1º × 0.1º. Additionally, the model’s forecasted warm core structure is compared to AMSU satellite-derived analysis [
50].
3. Results and Discussions
This section elaborates on the role of IMDAA datasets in forecasting five Extremely Severe Cyclonic Storms (ESCSs) that developed over the Bay of Bengal region and made landfall along different parts of the eastern coast of India and the coast of Bangladesh. The results primarily focus on the forecasted track, Maximum Surface Wind (MSW), Minimum Central Pressure (MCP), storm structures, rainfall during the simulation period, and the warm core structure of the storms.
3.1. Performance of Model Forecast
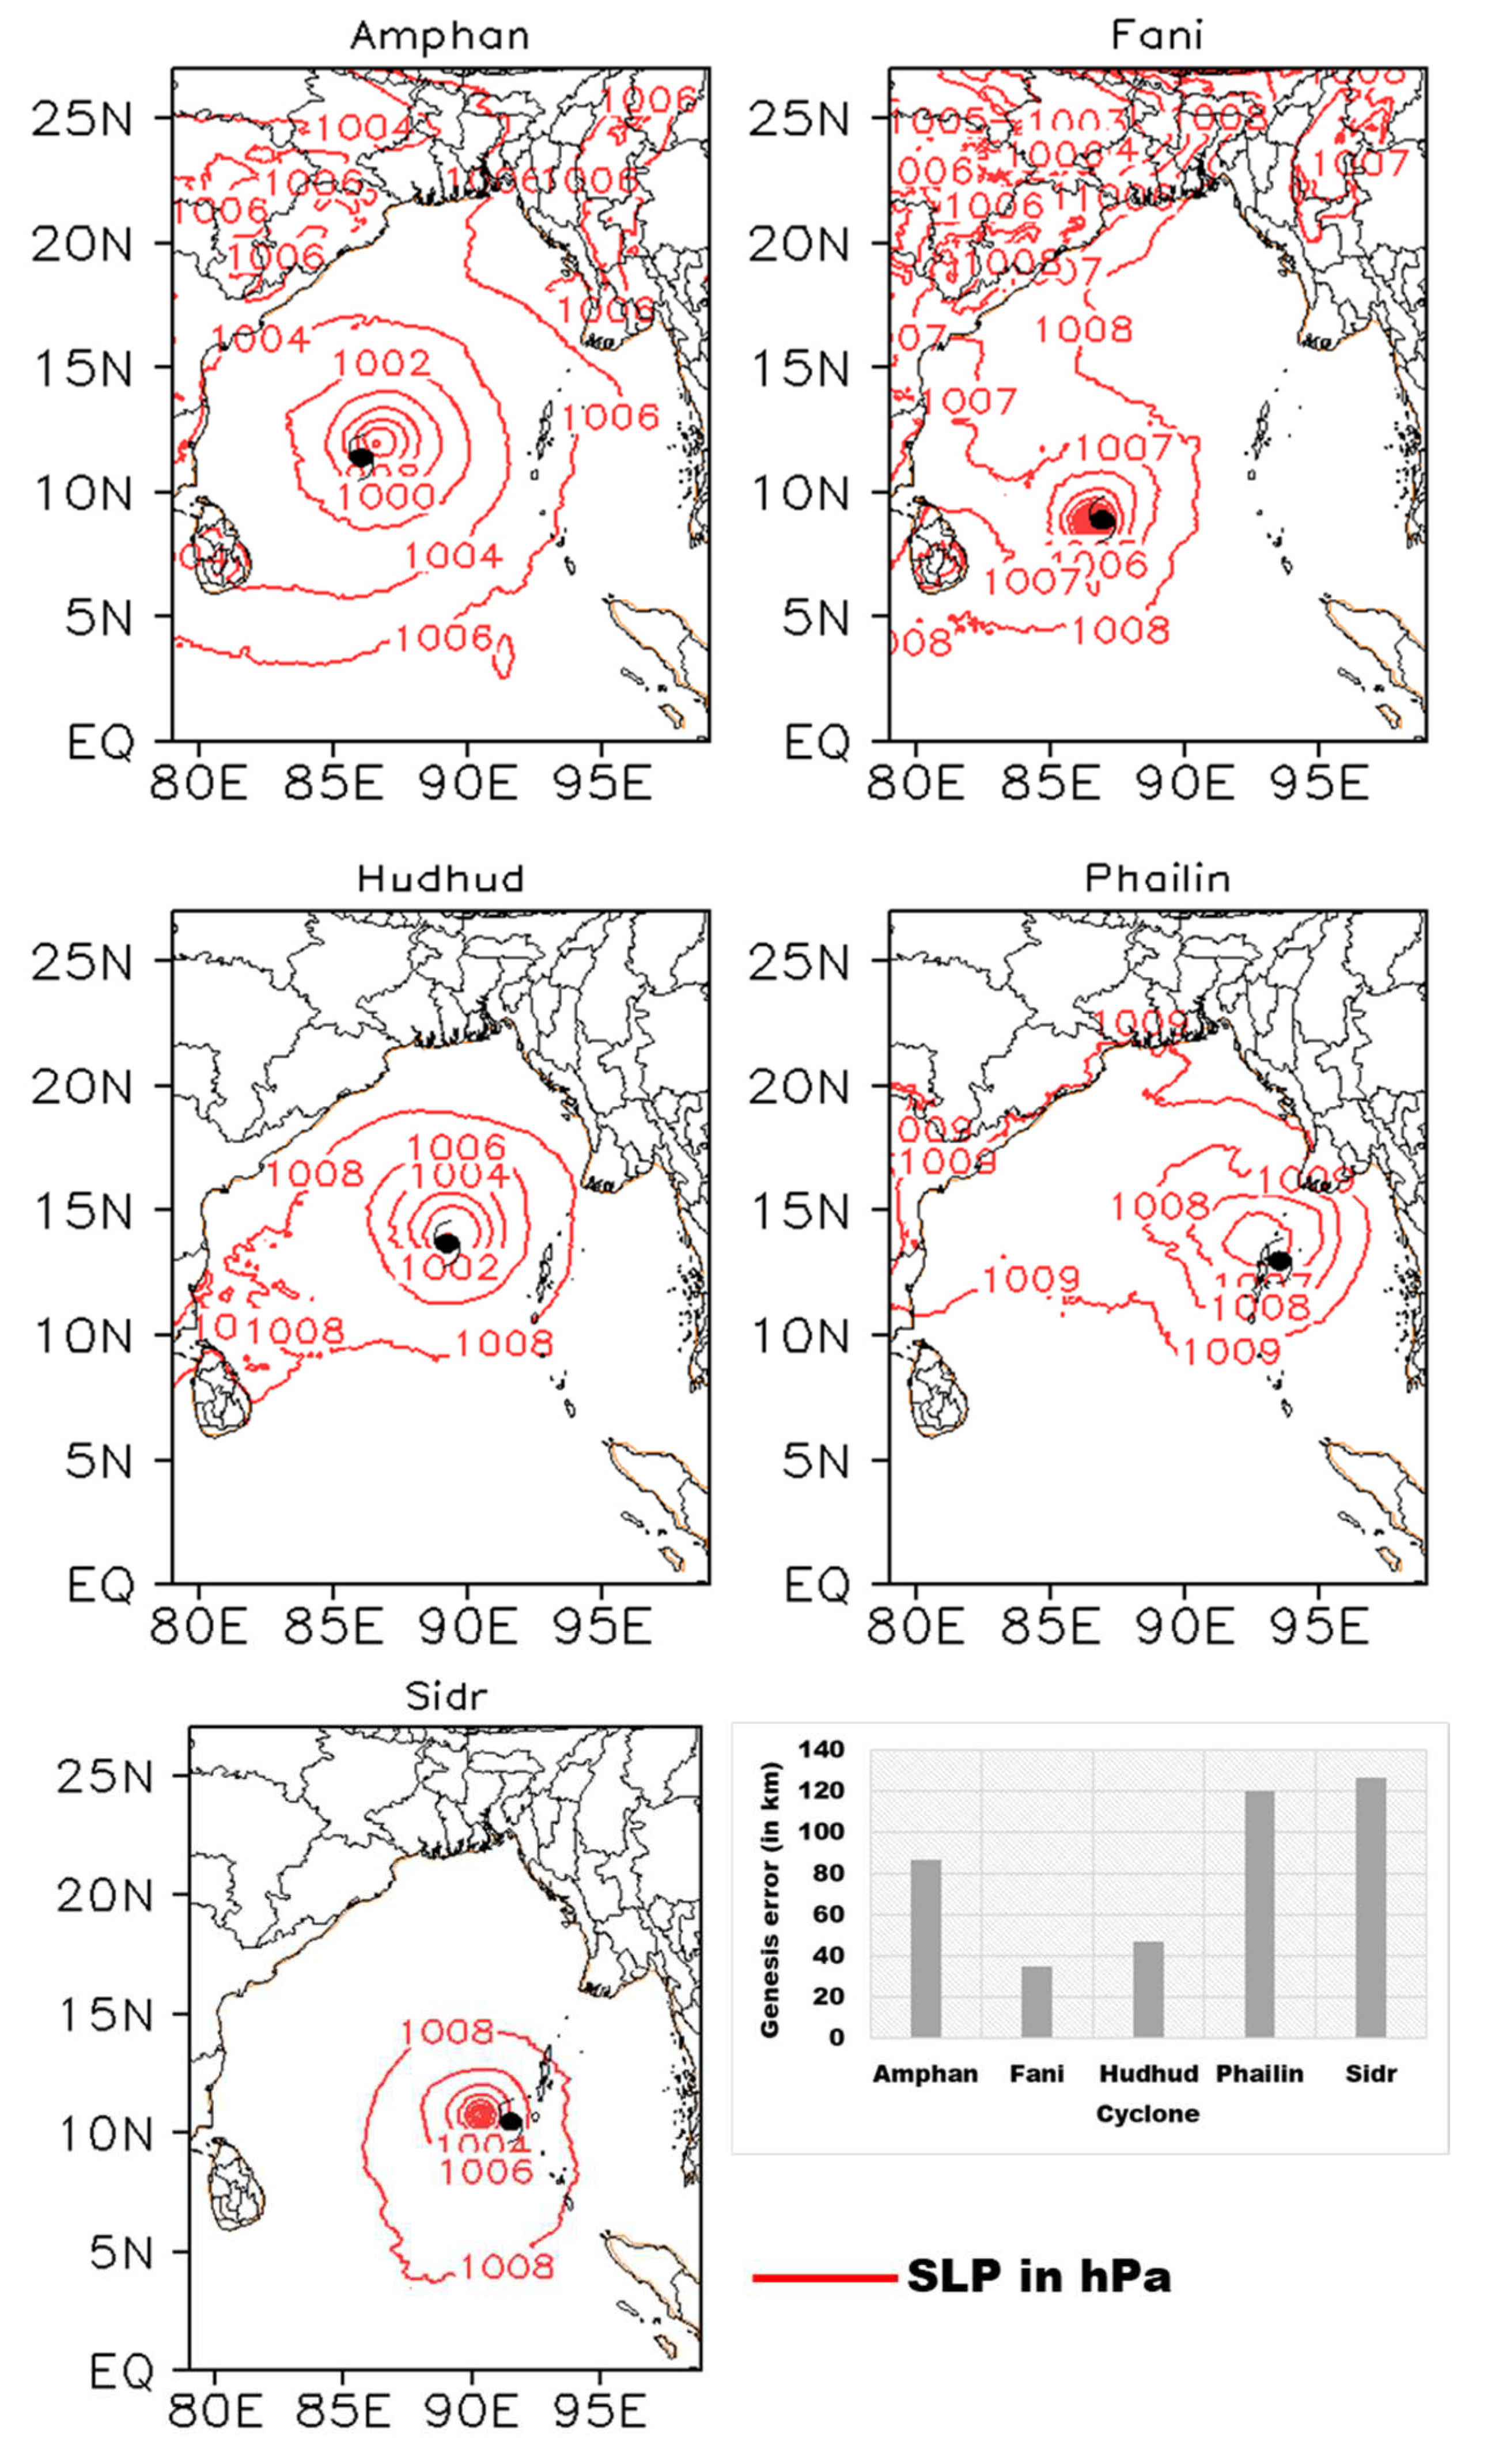
Figure 1 displays the initial low-pressure vortex of five ESCSs, namely Amphan, Fani, Hudhud, Phailin, and Sidr. It is derived from the IMDAA dataset and compared with the IMD best-fit track data, with the location indicated by a weather symbol. Additionally, initial positional errors were calculated and are represented in the bar graph (
Figure 1). The study revealed that errors in predicting the low-pressure vortex locations of storms such as Amphan, Fani, and Hudhud were small, but the errors for Phailin and Sidr were larger. Low-pressure vortex position (Genesis) errors of Amphan, Fani, and Hudhud were significantly lower at 86.6 km, 35 km, and 47 km with respect to IMD data, respectively.
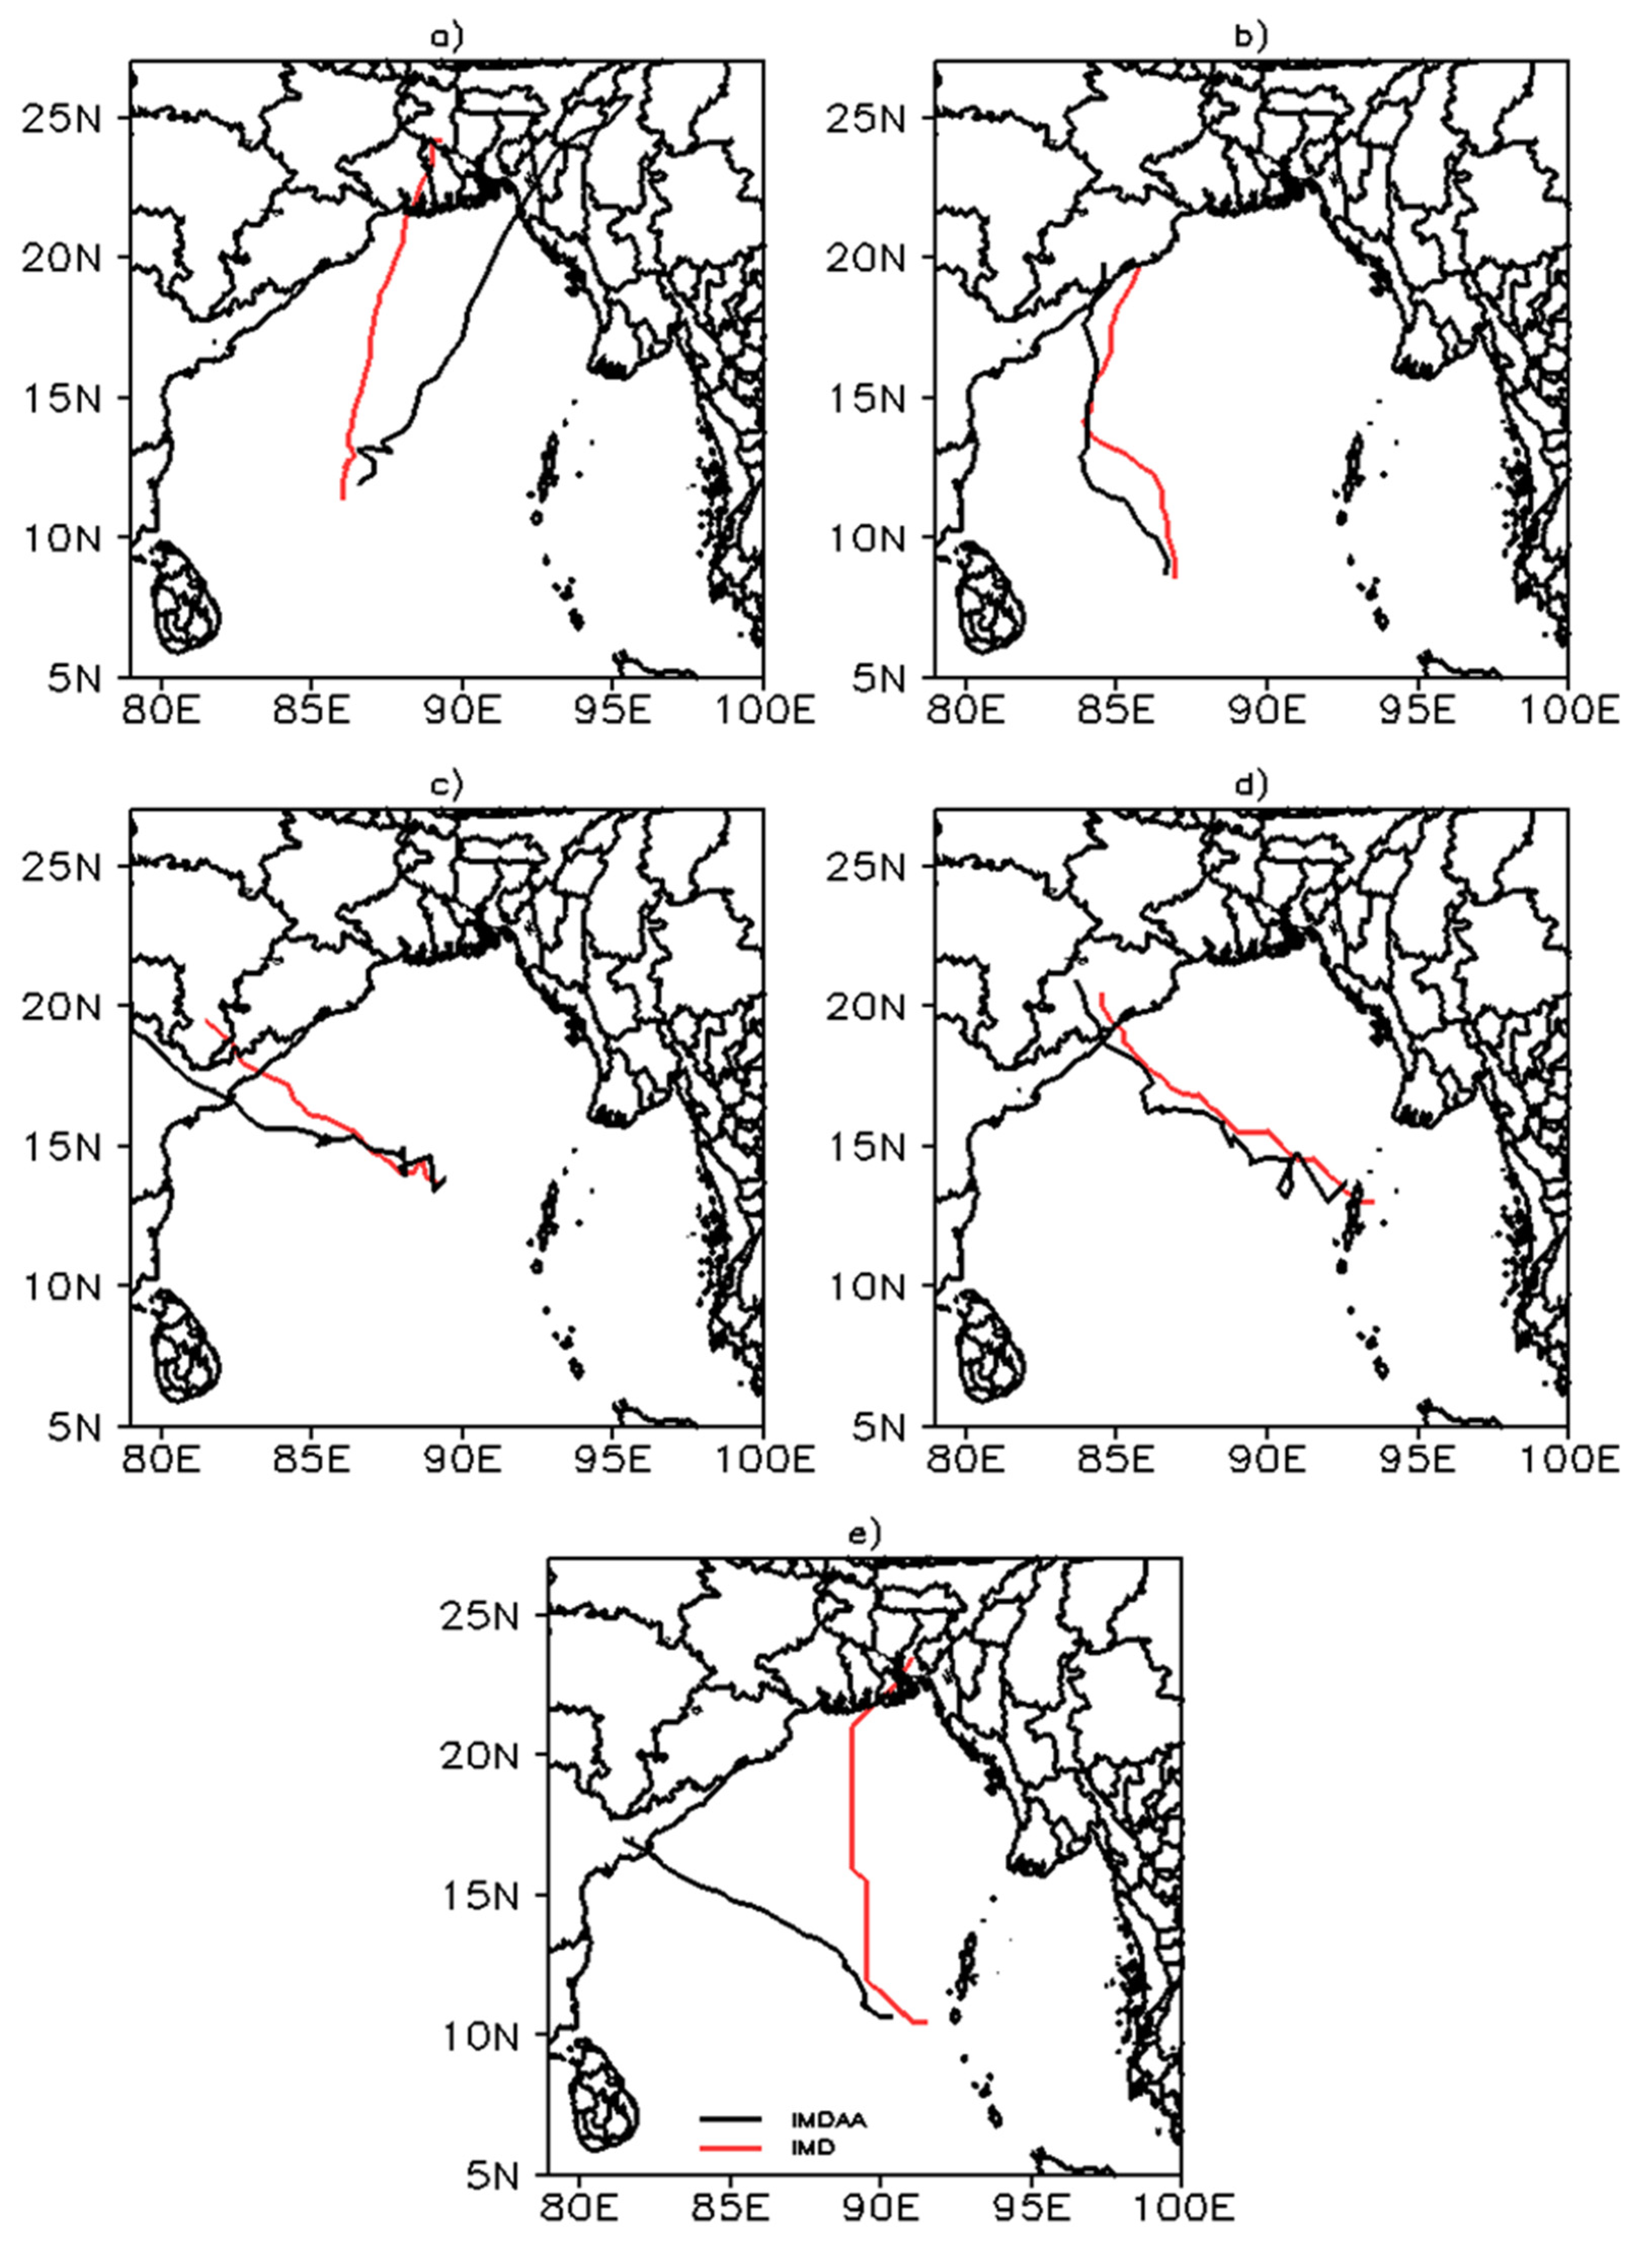
Figure 2 presents the model’s simulated tracks of the five ESCSs using the IMDAA dataset compared with the IMD best-fit track. The results showed that the forecasted tracks of Hudhud, Phailin, and Fani, using the IMDAA dataset, were well captured and comparable to the IMD best track data throughout the forecast period. In contrast, the simulated track of Amphan with the IMDAA dataset deviated to the right of the IMD track as it moved toward the northeast. Similarly, in the case of Cyclone Sidr, the model’s predicted forecast track for 96 h using the IMDAA datasets deviated more than other cyclones compared to the observational data. This deviation may be due to an initial positional error of the low-pressure vortex. Overall, results from these five ESCSs with the IMDAA dataset suggest that the model provided a better forecast in all cases with the least error. This better performance is at-tributed to the better initial conditions in terms of the initial low-pressure vortex positional errors of about 35 km, 47 km, and 120 km for Hudhud, Phailin, and Fani cyclones, respectively, whereas other cyclones such as Amphan and Sidr showed higher track forecast errors.
Figure 3 represents the temporal evolution of the model-simulated maximum sustained sur-face wind speed (MSW) using the IMDAA dataset for the five ESCSs and their comparison with the IMD best-fit track dataset. In the case of Cyclone Amphan, predicted MSW showed an underestimation of Cyclone Amphan intensity for periods between 0–48 h and 72–96 h. It also overestimated the peak intensity of the storm during the forecast period of 48–72 h. Similarly, in the Fani storm, simulated MSW initially over-predicted the intensity for the first 72 hours and subsequently under-predicted it until its dissipation. For Cyclone Hudhud, the forecasted MSW followed a similar pattern to the IMD up to 72 h. In the case of Cy-clone Phailin, the predicted intensity well followed the IMD track data for the first 24 hours. Thereafter, it showed an under-prediction of the cyclone intensity. Finally, during Cyclone Sidr, the model-simulated MSW well matched with the IMD throughout its fore-cast period compared to the other cyclones. In summary, it was concluded that the model provided a reasonably better intensity forecast in the majority of cases.
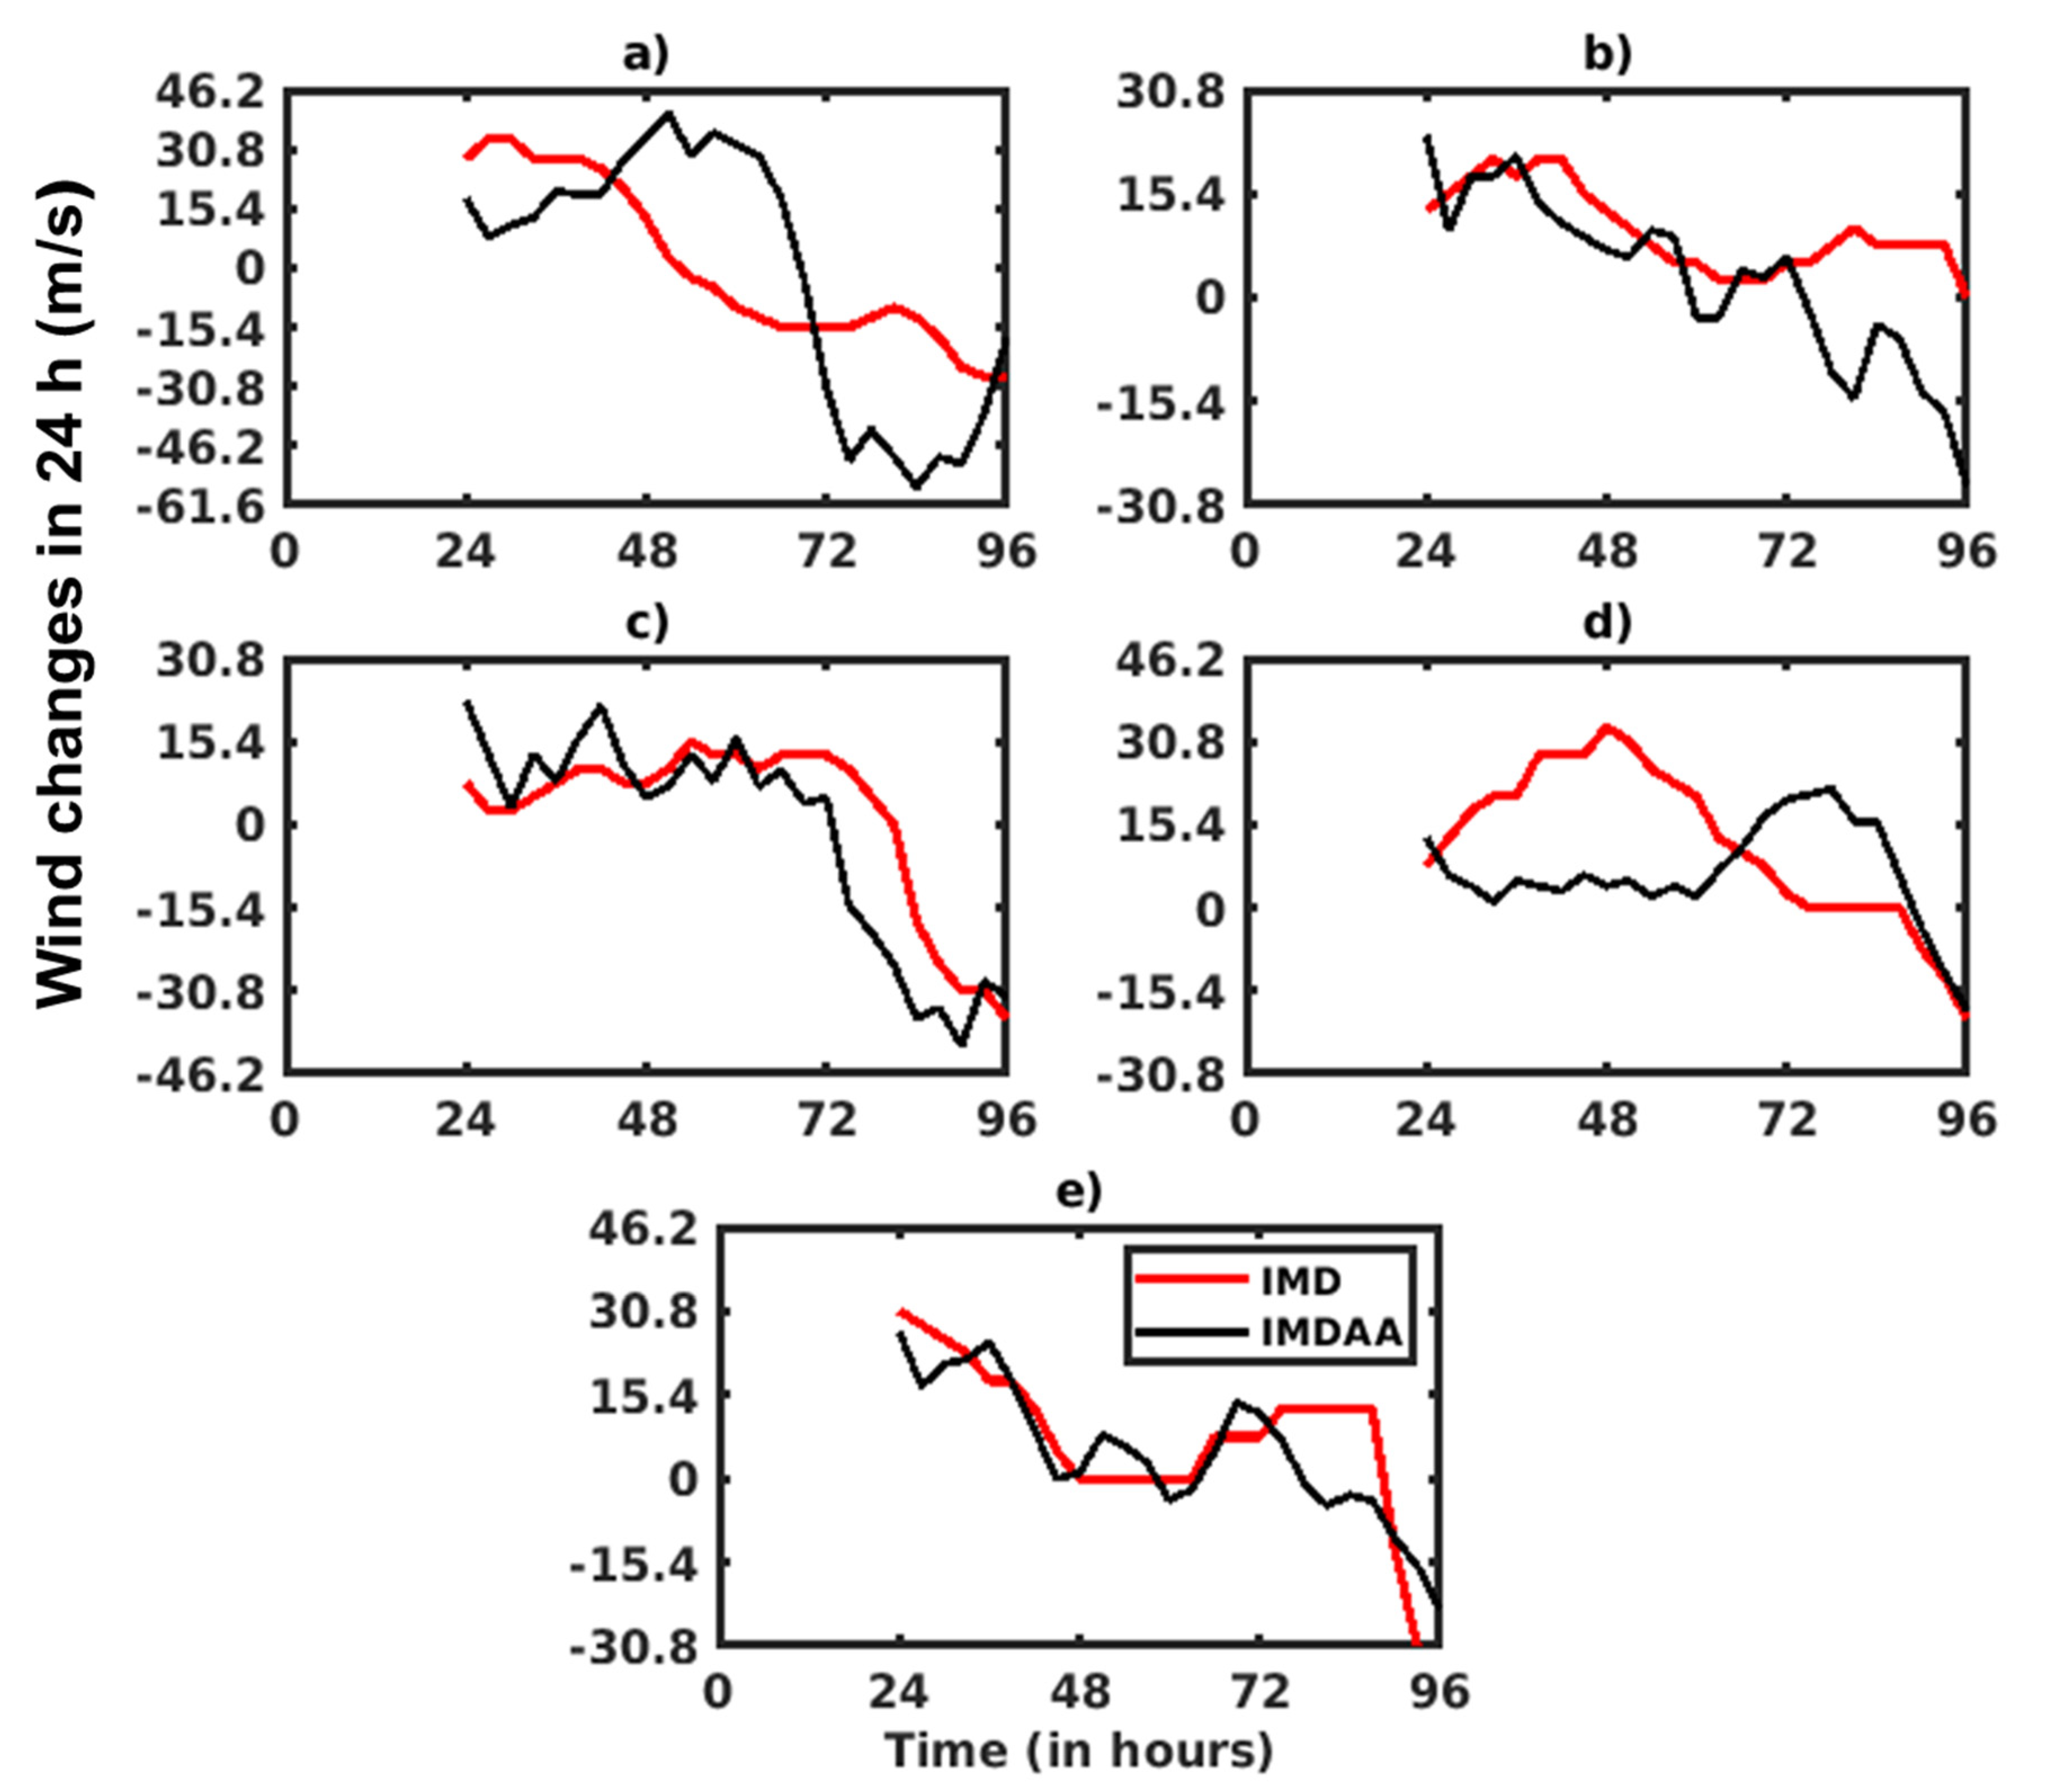
In
Figure 4, the model predicted the rapid intensification (>15.4 m/s) and dissipation (-15.4 m/s) of the five cyclones in a 24-hour period using IMDAA data. This was compared with IMD’s estimated intensification from their best-fit track data. Cyclone Amphan showed over-predicted rapid changes for 48 h and underpredicted rapid dissipation during 72 h-96 h. Similarly, in the case of Cyclones Fani, Hudhud, and Sidr, model simulations reasonably well captured the trend of rapid intensification and dissipation. Whereas Cyclone Phailin was under-predicted for the first 70 h, thereafter it was over-predicted for rapid dissipation. Overall, the results suggested that the model has the ability to capture the Rapid Intensification well with IMD in most of the cyclones.
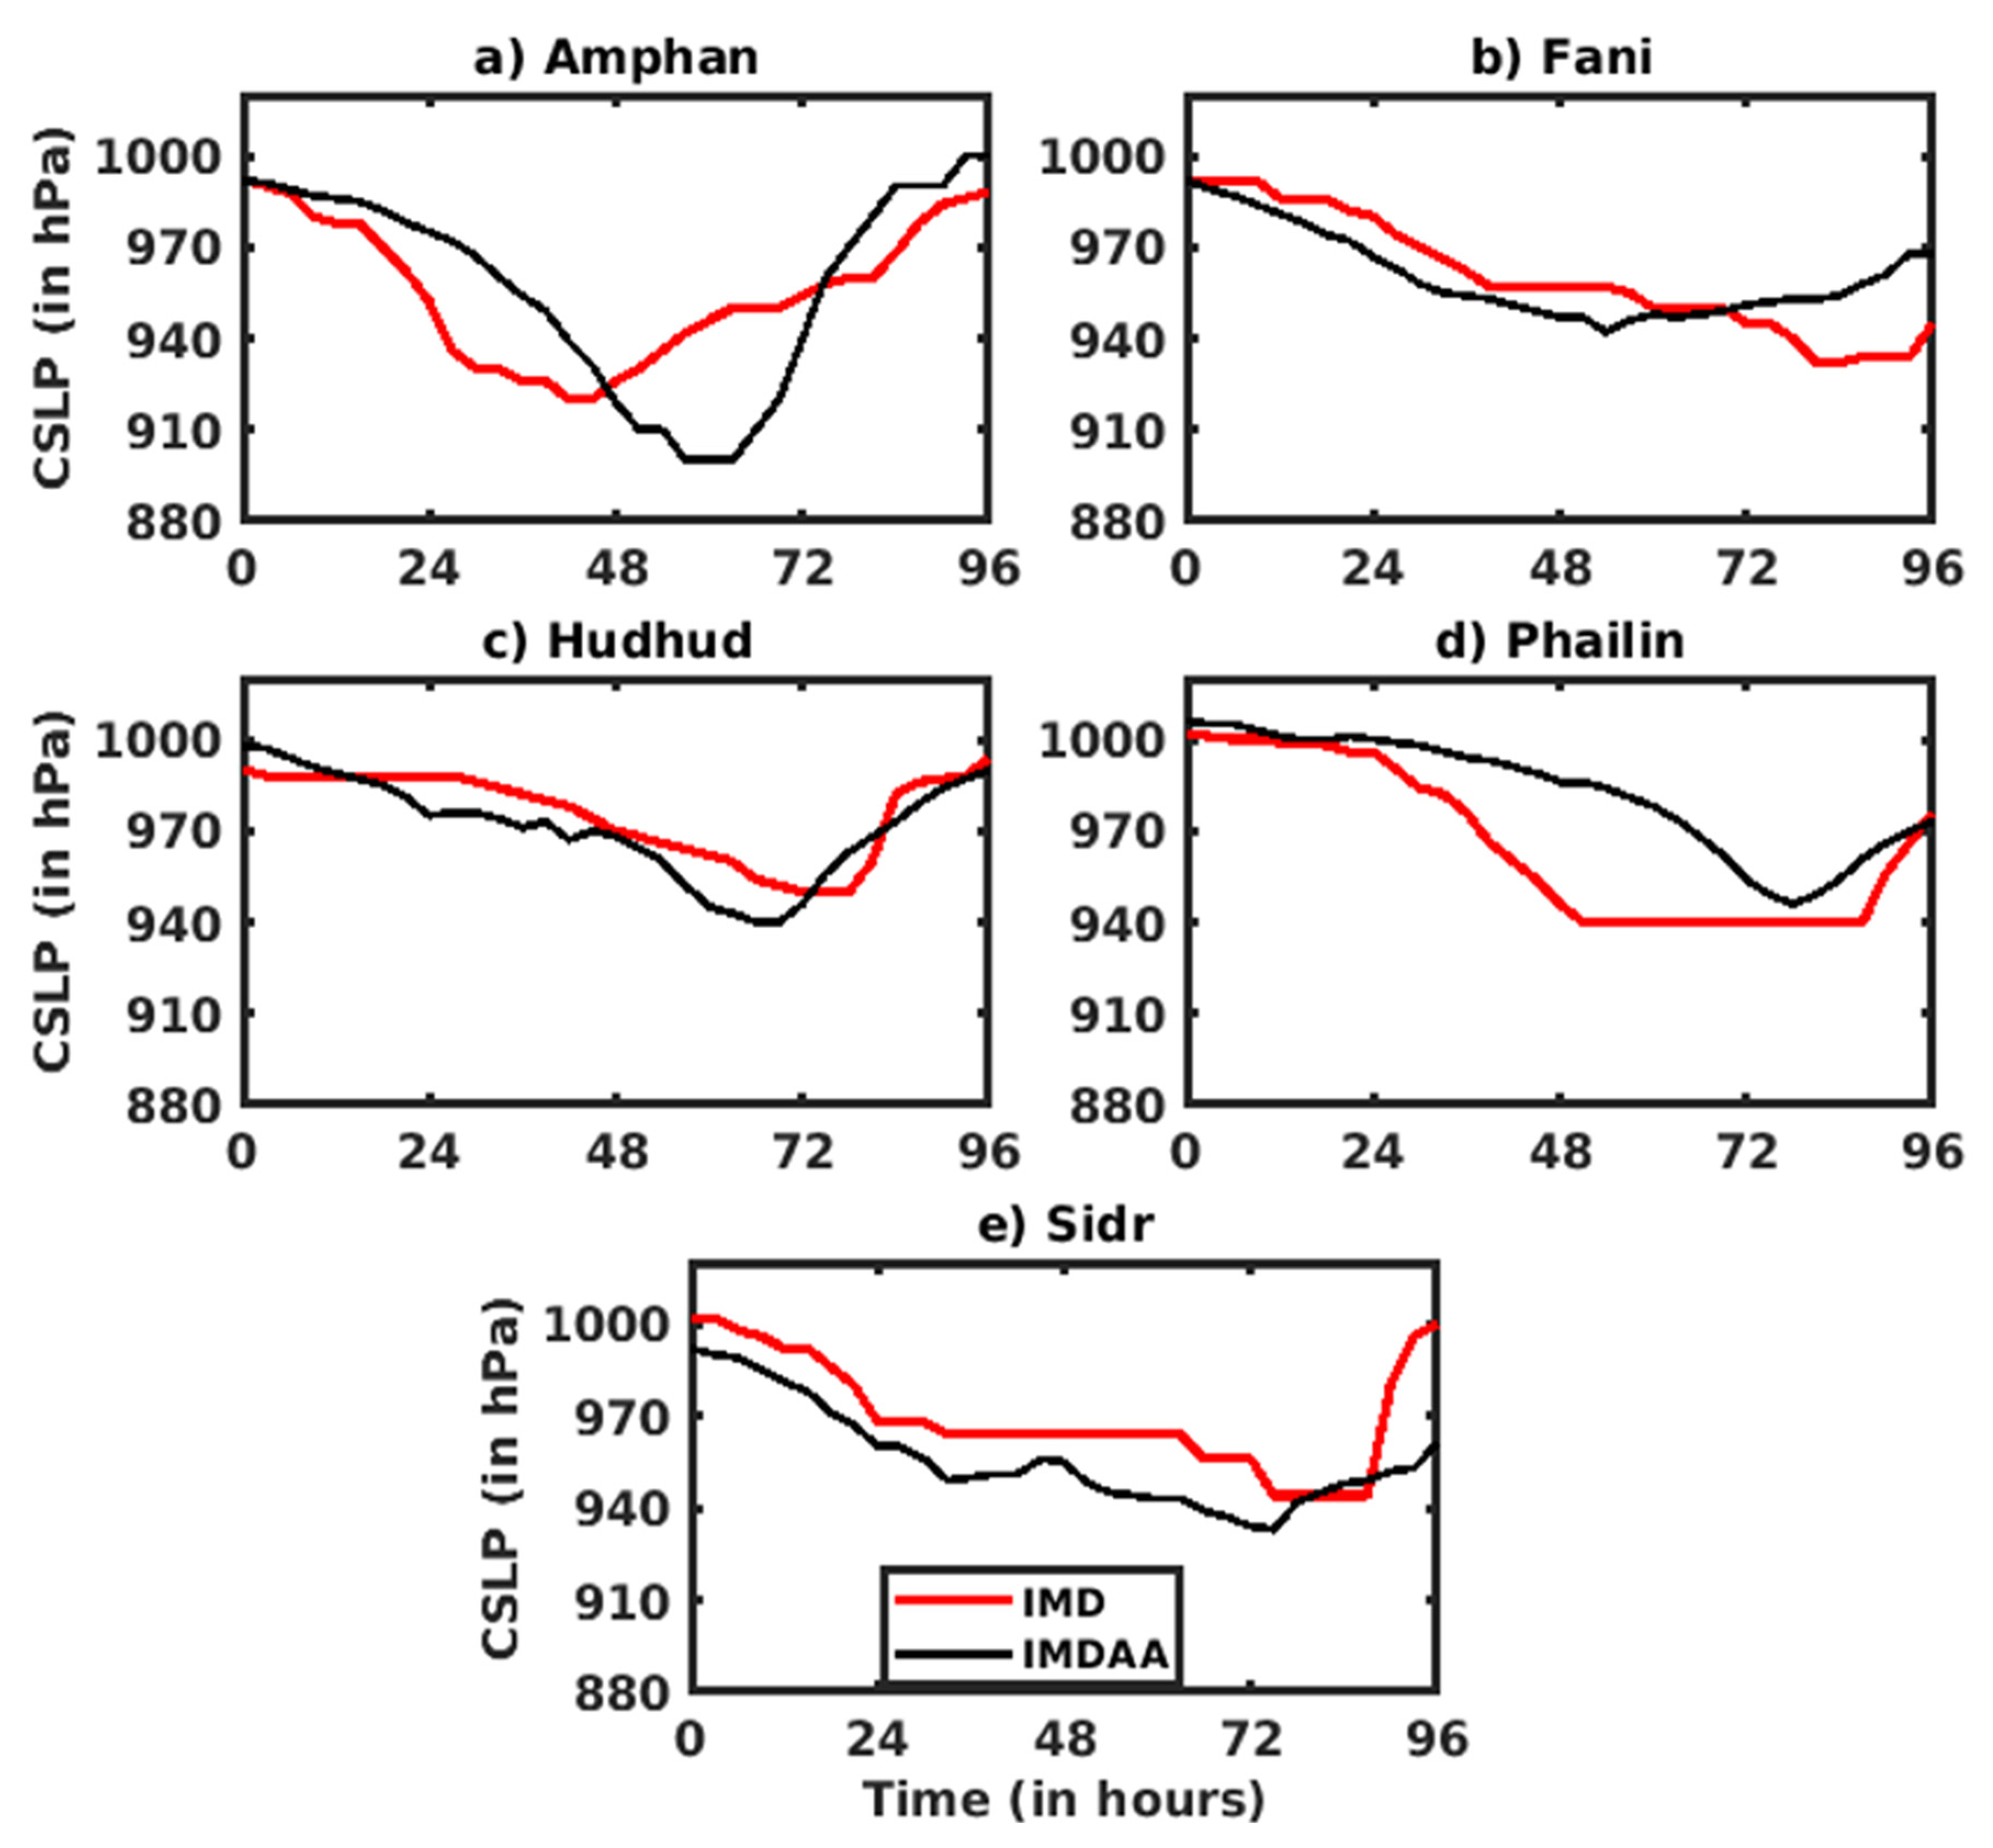
Figure 5 shows the temporal variation of model-simulated CSLP using the IMDAA dataset for the five ESCSs and their comparison with IMD CSLP from the IMD best-fit track dataset. It is observed that the model-predicted CSLP well matched with IMD in Cyclones Fani, Hudhud, and Sidr. On the other hand, the model showed a trend of over-prediction and under-prediction in Cyclones Amphan and Phailin. Finally, it is concluded that the outperformance in predicting CSLP for most cyclones was primarily attributed to the model’s precise depiction of the initial low-pressure system’s vortex, which minimized deviations from the actual storm evolution.
3.2. Evaluation of Model Predictions Using Statistical Methods
Table 3 presents the daily forecasted errors in the model simulation for five cyclones using IMDAA data. It includes track errors (in km), the absolute error of Maximum Surface Wind (MSW) (in m/s), and the absolute error of central sea level pressure (CSLP) (in hPa). It is observed that on day 1, all cyclones showed minimal errors in the prediction of track, MSW, and CSLP. Particularly, the track errors of Fani, Hudhud, and Phailin showed the least errors from day 1 to day 4 compared to Amphan and Sidr. However, errors consistently increased day by day in Amphan and Sidr from day 1 to day 4, as presented in
Table 3. The mean track errors using 3-hour data for five ESCSs were about 356 km, 132 km, 165 km, 101 km, and 392 km, respectively. It is concluded that Fani, Hudhud, and Phailin predicted with fewer errors due to minimal deviations in their initial low-pressure cyclonic vortex position from the IMD data.
The absolute error of MSW (in m/s) calculated daily is presented in
Table 3. The results exhibit that in most of the cyclones, absolute wind errors were less compared with the MSW of IMD data. However, on day 2, Phailin predicted with a higher error value (27.5 m/s). The mean absolute wind speed errors for five ESCSs were about 8.4 m/s, 9.3 m/s, 7 m/s, and 10.6 m/s from day 1 to day 4, respectively. It is seen that the model produced less error on day 3 compared to other days, showing a better forecast in terms of intensity. It is concluded that the IMDAA data performed well in terms of the MSW.
Table 3 shows the absolute error of CSLP (in hPa) every 24 h. It is seen that the simulated CSLP error showed the least in most of the cyclones. However, Phailin and Sidr produced higher values of errors on days 2 and 4. This attribute was due to greater deviations in the initial cyclonic vortex. The mean absolute CSLP errors for five ESCSs were about 12.2 hPa, 13.6 hPa, 12 hPa, and 16.2 hPa from day 1 to day 4, respectively. It is observed that day 3 produced the least error compared to other days. Overall, the IMDAA data performed better and more accurately for most of the cyclones in terms of CSLP.
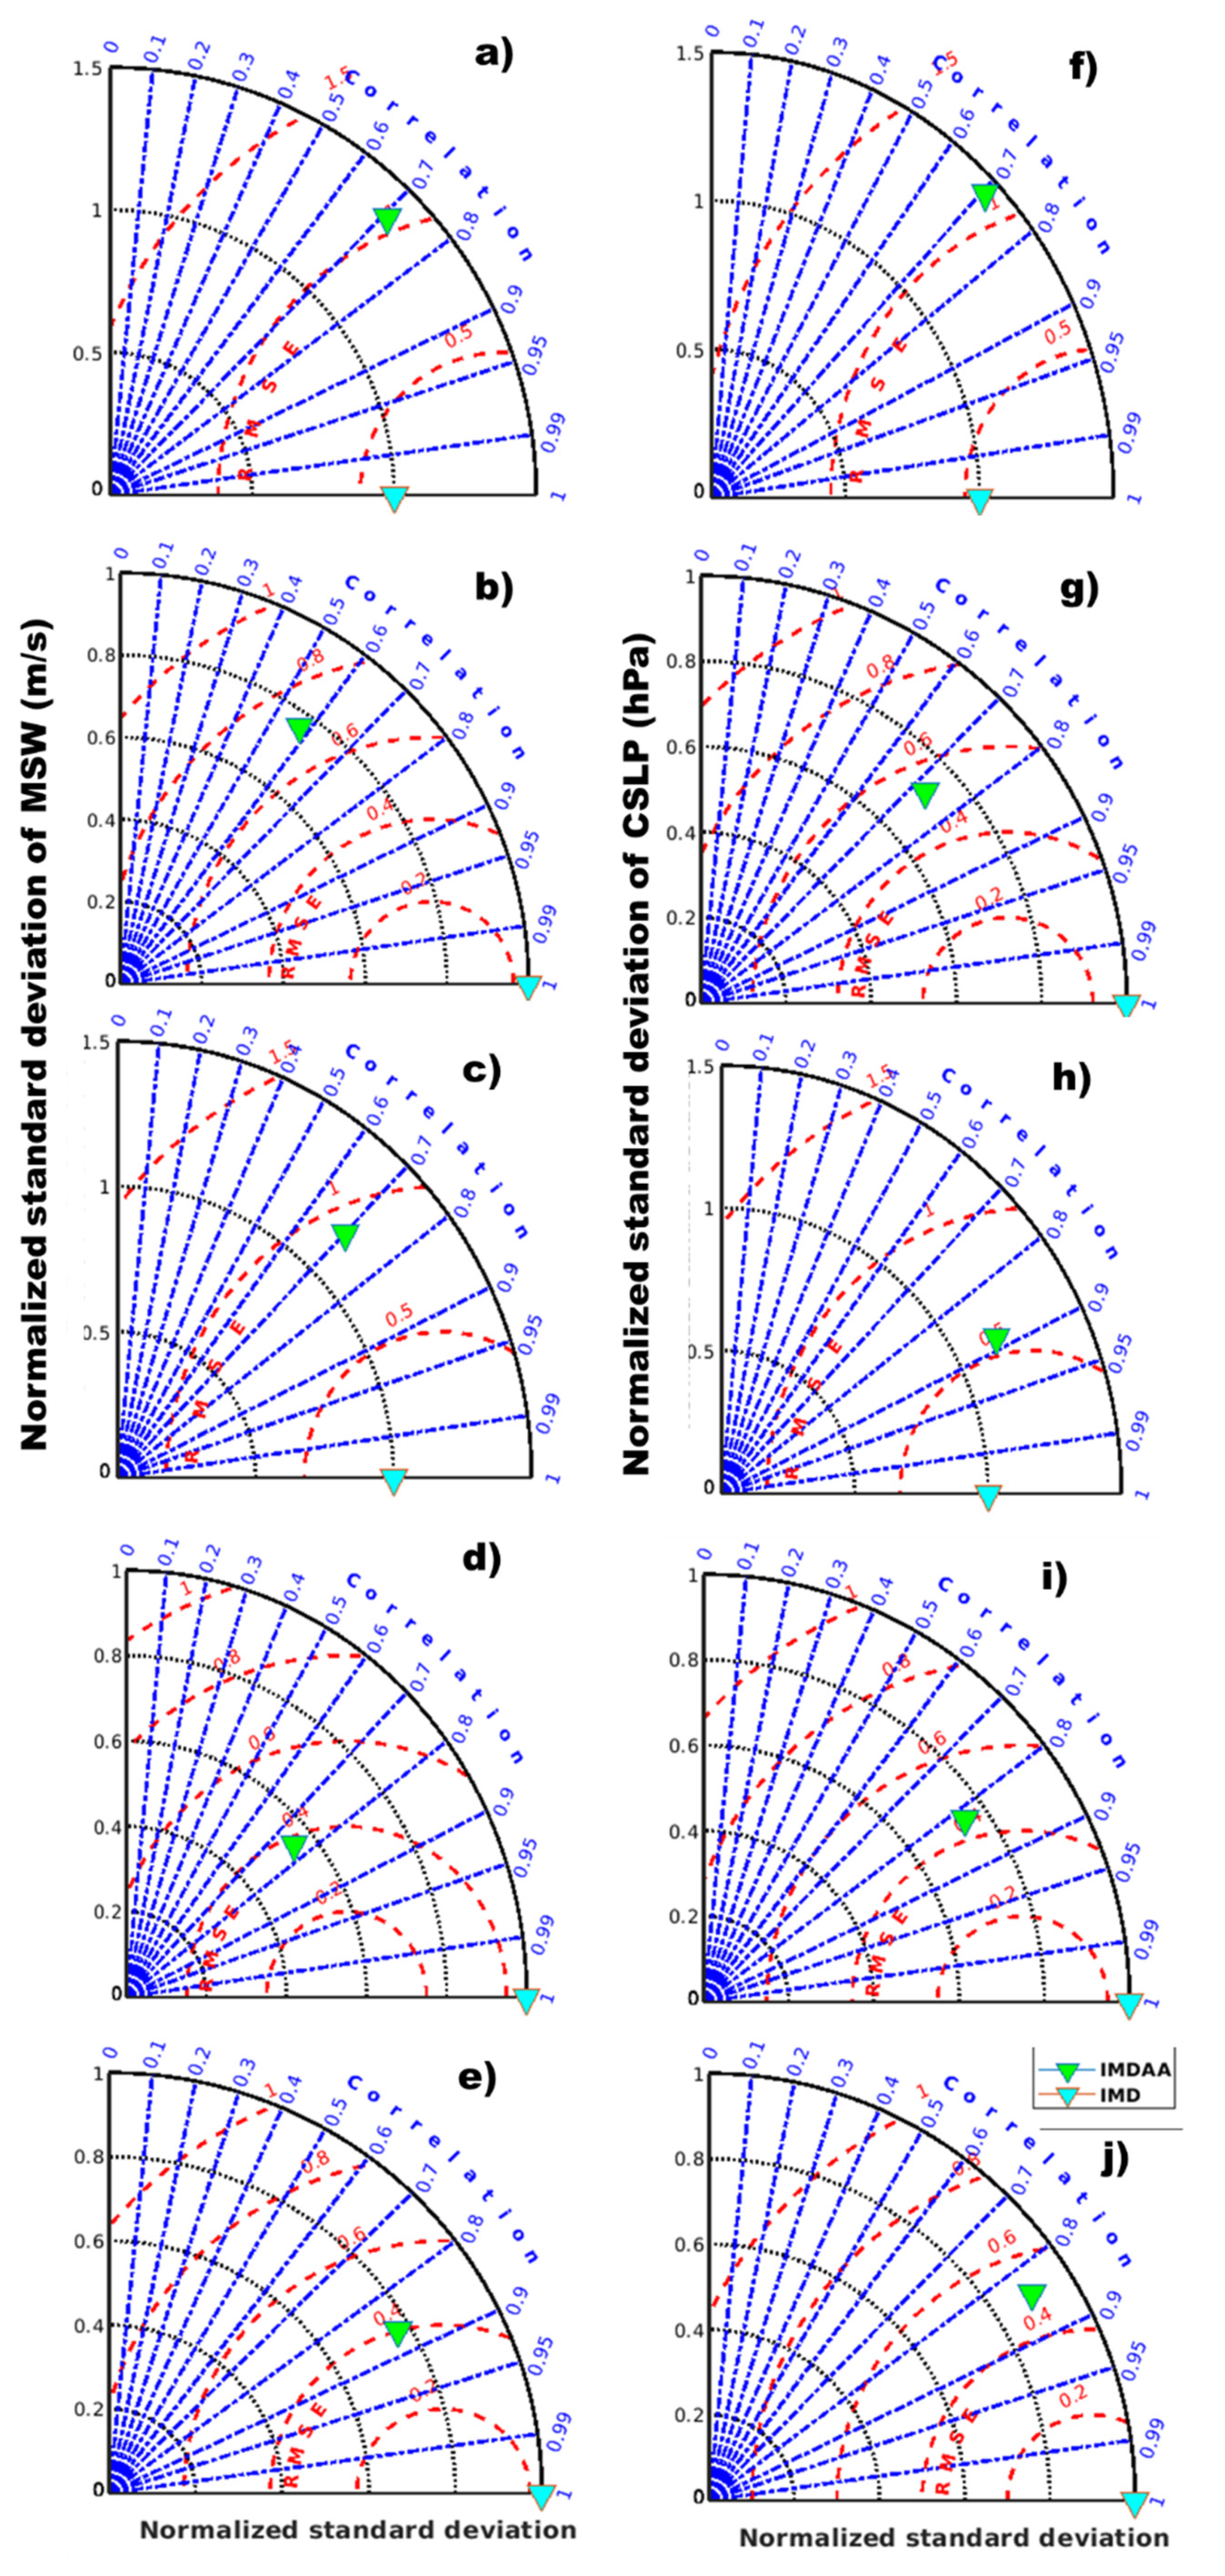
The model’s performance was also evaluated using a Taylor diagram, considering Root Mean Square Error (RMSE), Normalized Standard Deviation (NSD), and Correlation Coefficient (CC). This evaluation is conducted for parameters such as MSW and CSLP of five ESCSs by comparing the model forecasts with IMD best-track data. The Taylor diagrams (
Figure 6(a-e)) depict the relative skill of the model’s forecasted MSW for the ESCSs such as Amphan, Fani, Hudhud, Phailin, and Sidr in comparison to IMD best-track data. The CC of MSW predicted by model simulations ranged between 0.9 and 0.7 for most of the cy-clones, except for Cyclone Fani, where the CC of MSW prediction was different. The NSD of simulated MSW (below 1.0 m/s) is approximately equal to the observed NSD (around 1 m/s) for cyclones Fani, Hudhud, Phailin, and Sidr, except Amphan (1.5 m/s). Simulated MSW exhibited a high correlation and low RMSE for most cyclones. Similarly, the Taylor diagrams (
Figure 6(f-j)) for simulated CSLP using the IMDAA dataset showed high correlations, ranging between 0.7 and 0.9, in all cases. The NSD of simulated CSLP (between 0.6 hPa and 1.5 hPa) with the IMDAA dataset was greater than the observed NSD for cyclones Hudhud and Sidr, while it was less than the observed NSD for other cyclones, such as Am-phan, Fani, and Phailin. Simulated cyclones exhibited low RMSE values (between 0.4 and 0.6 hPa) for most of the cyclones.
3.3. Evaluation of Rainfall and Structure Forecast
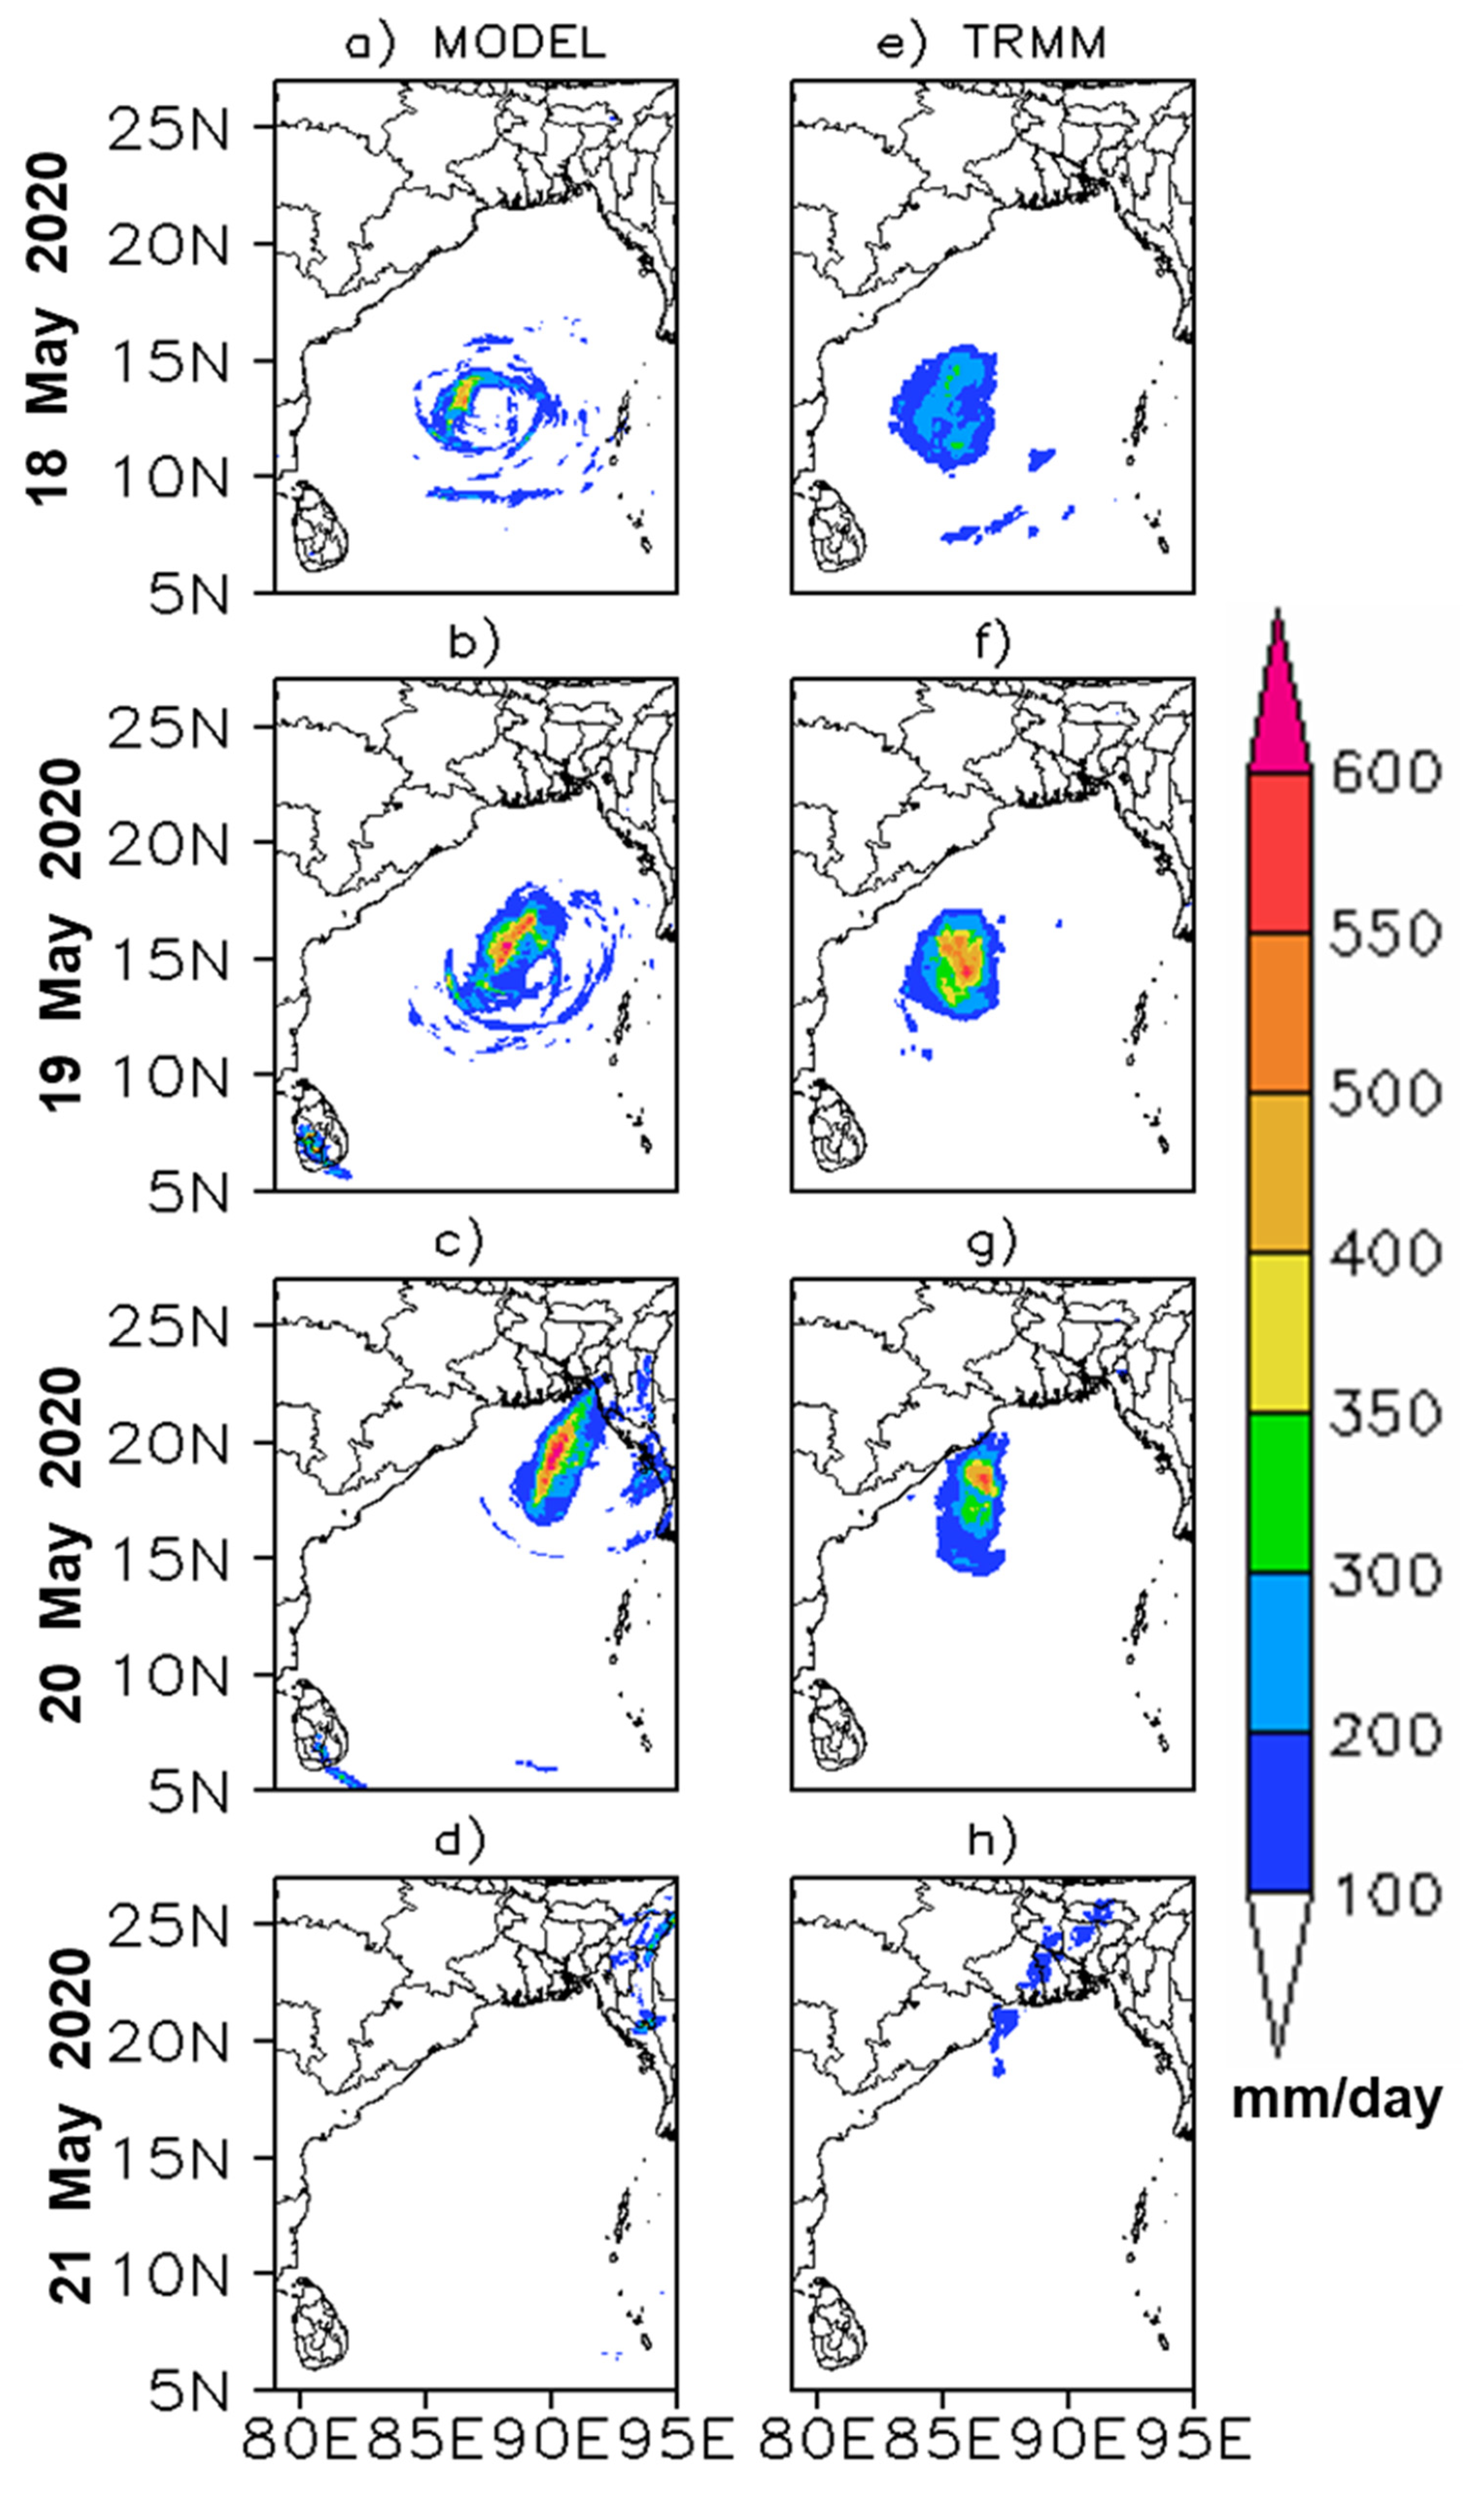
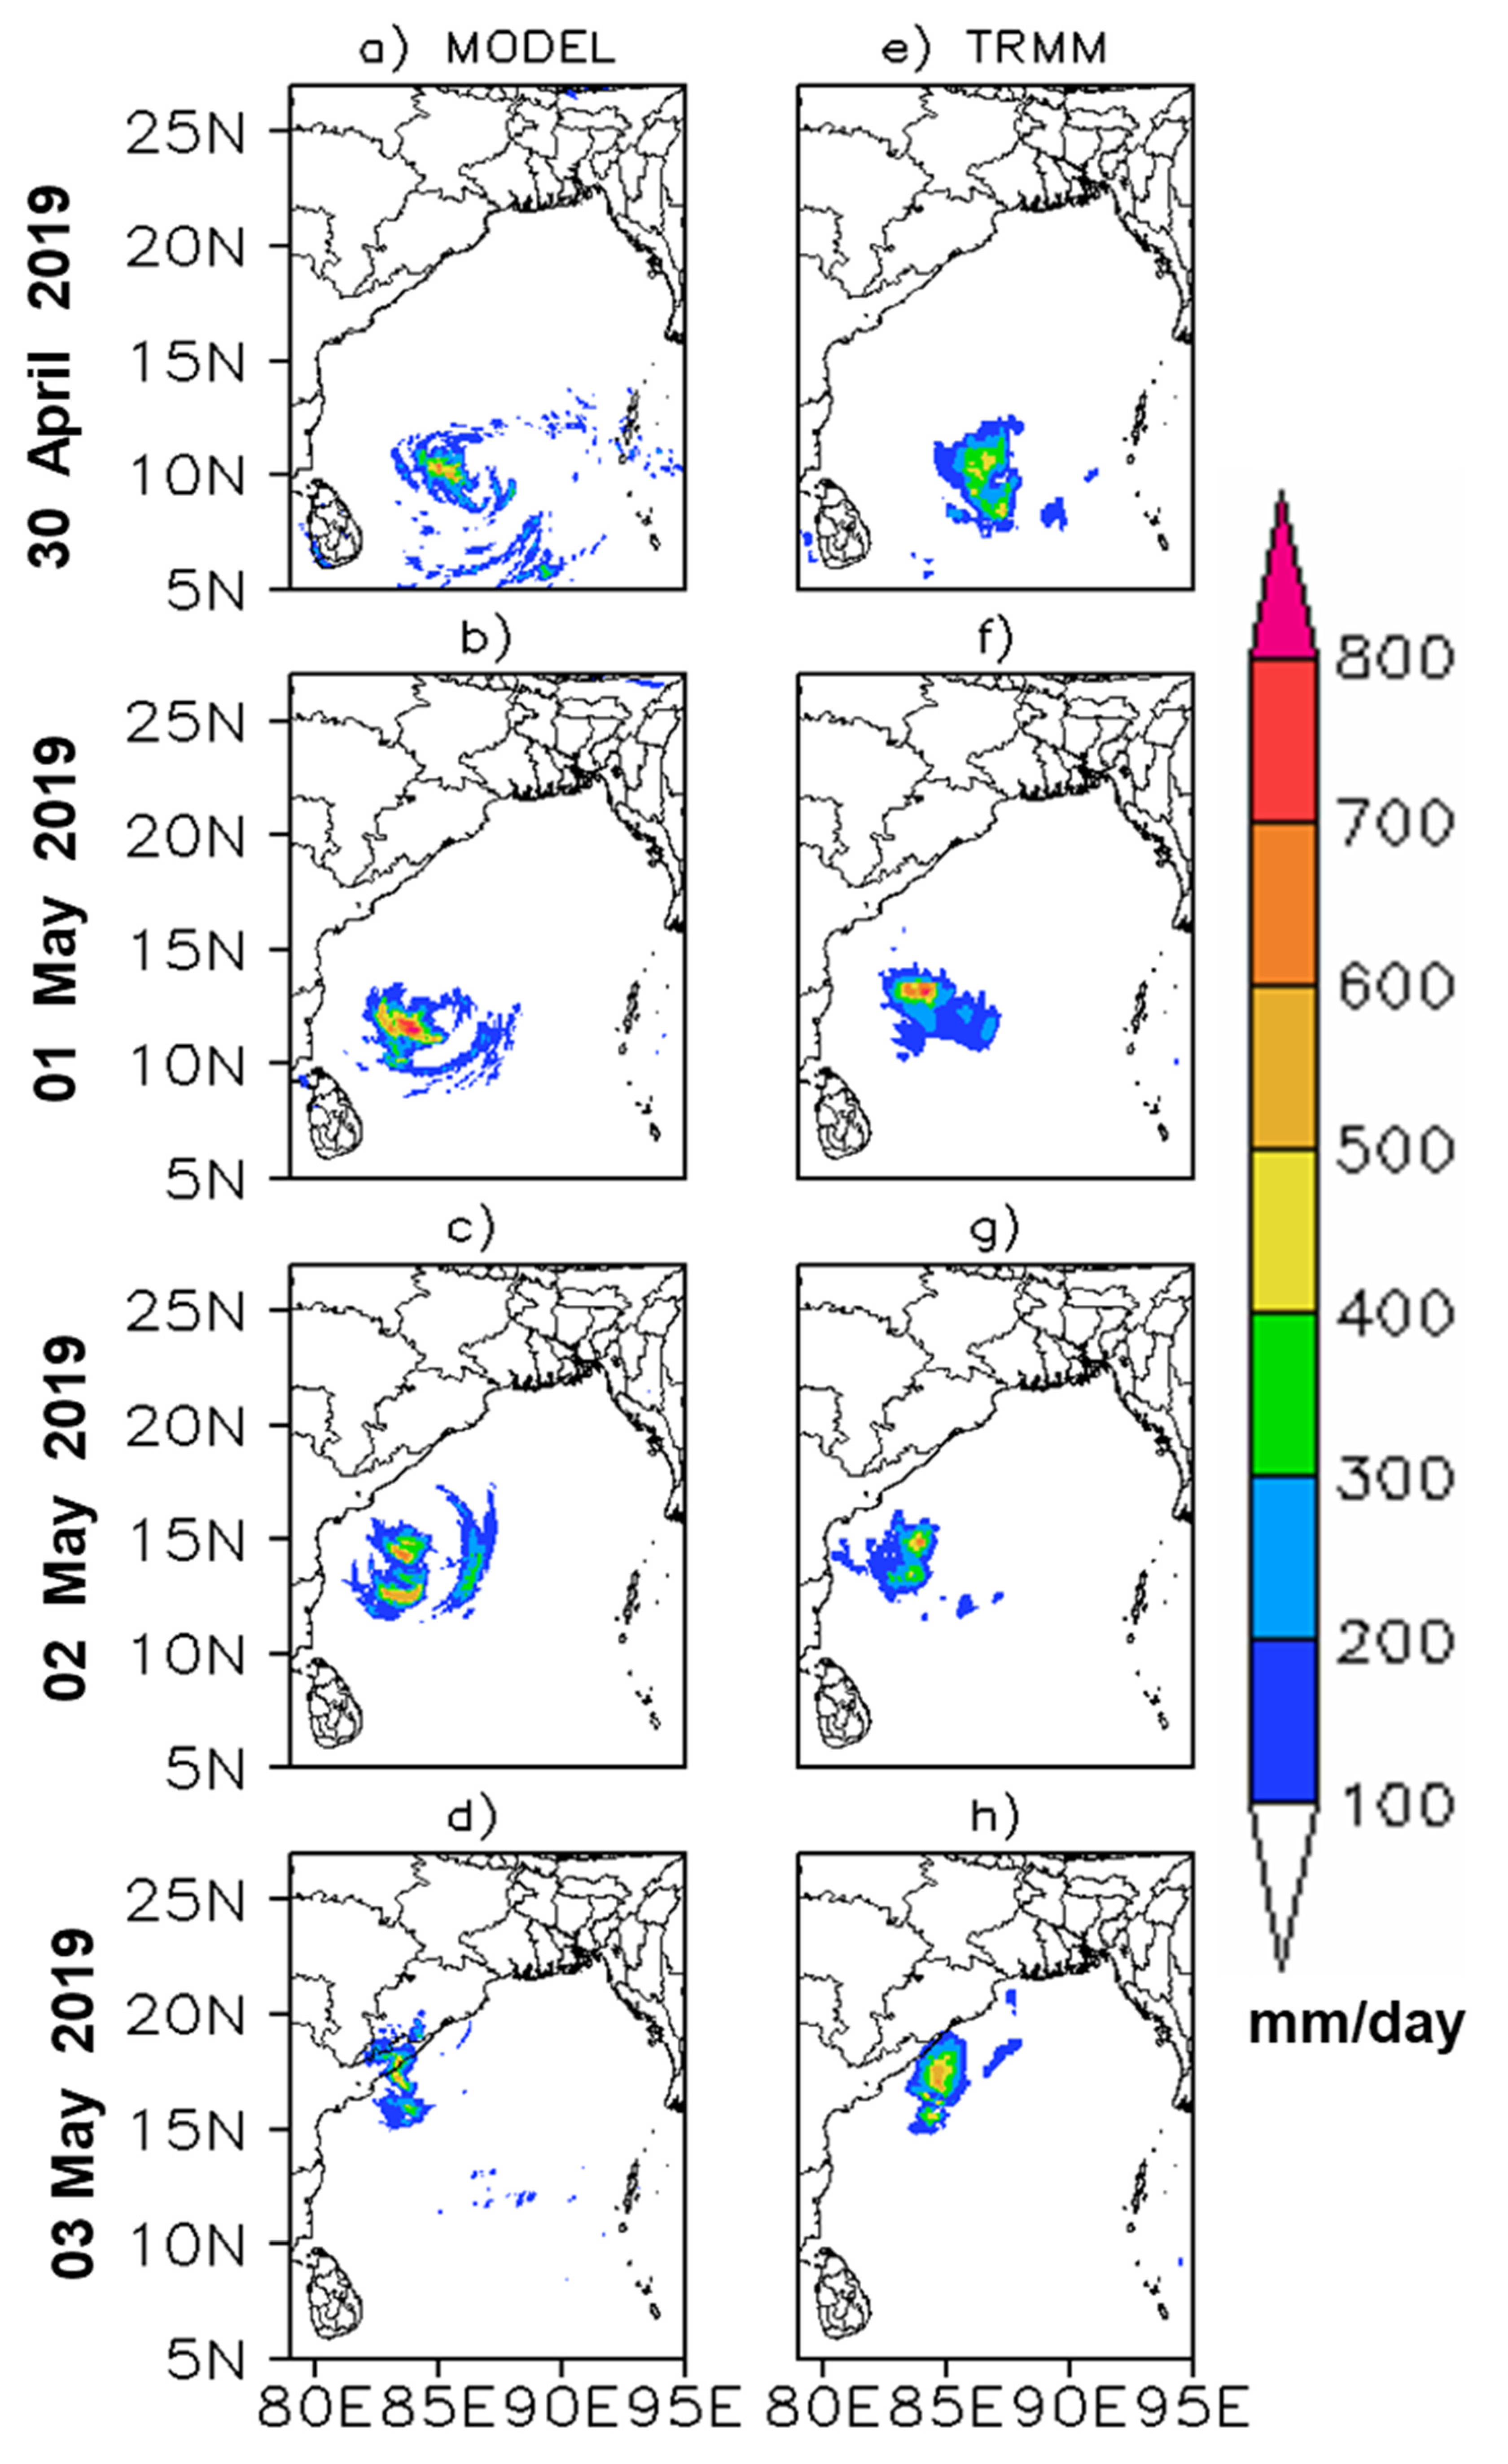
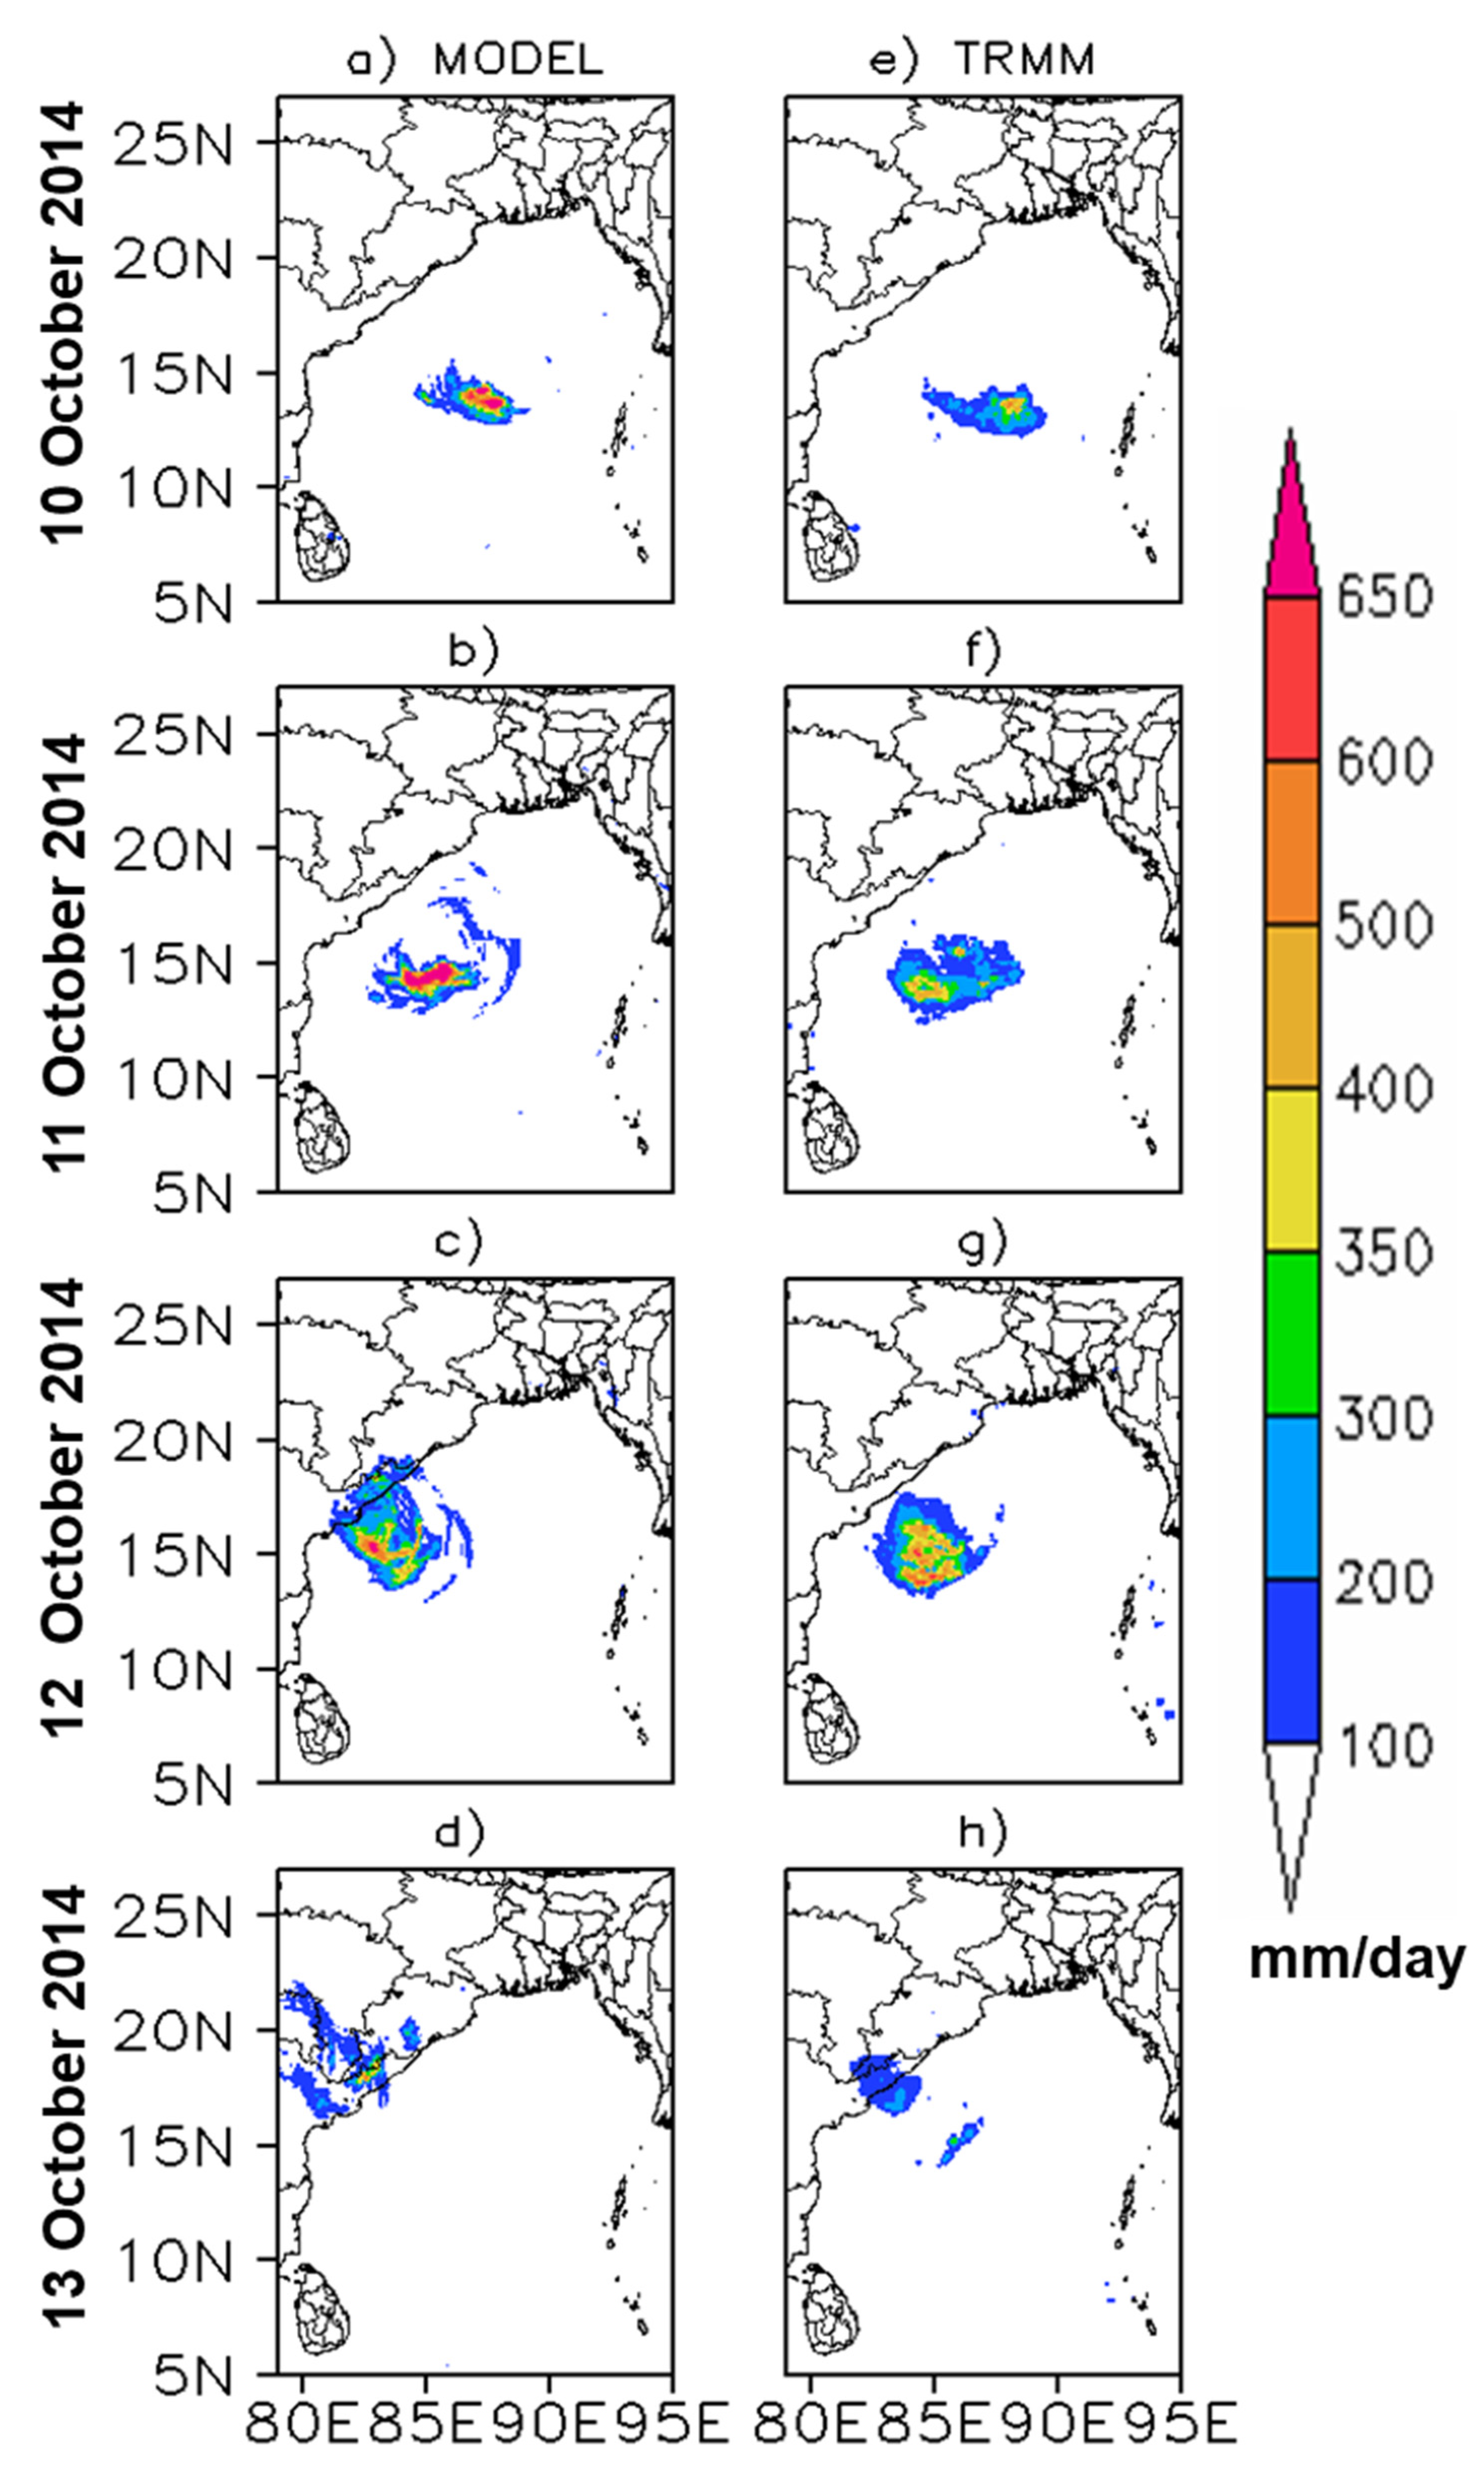
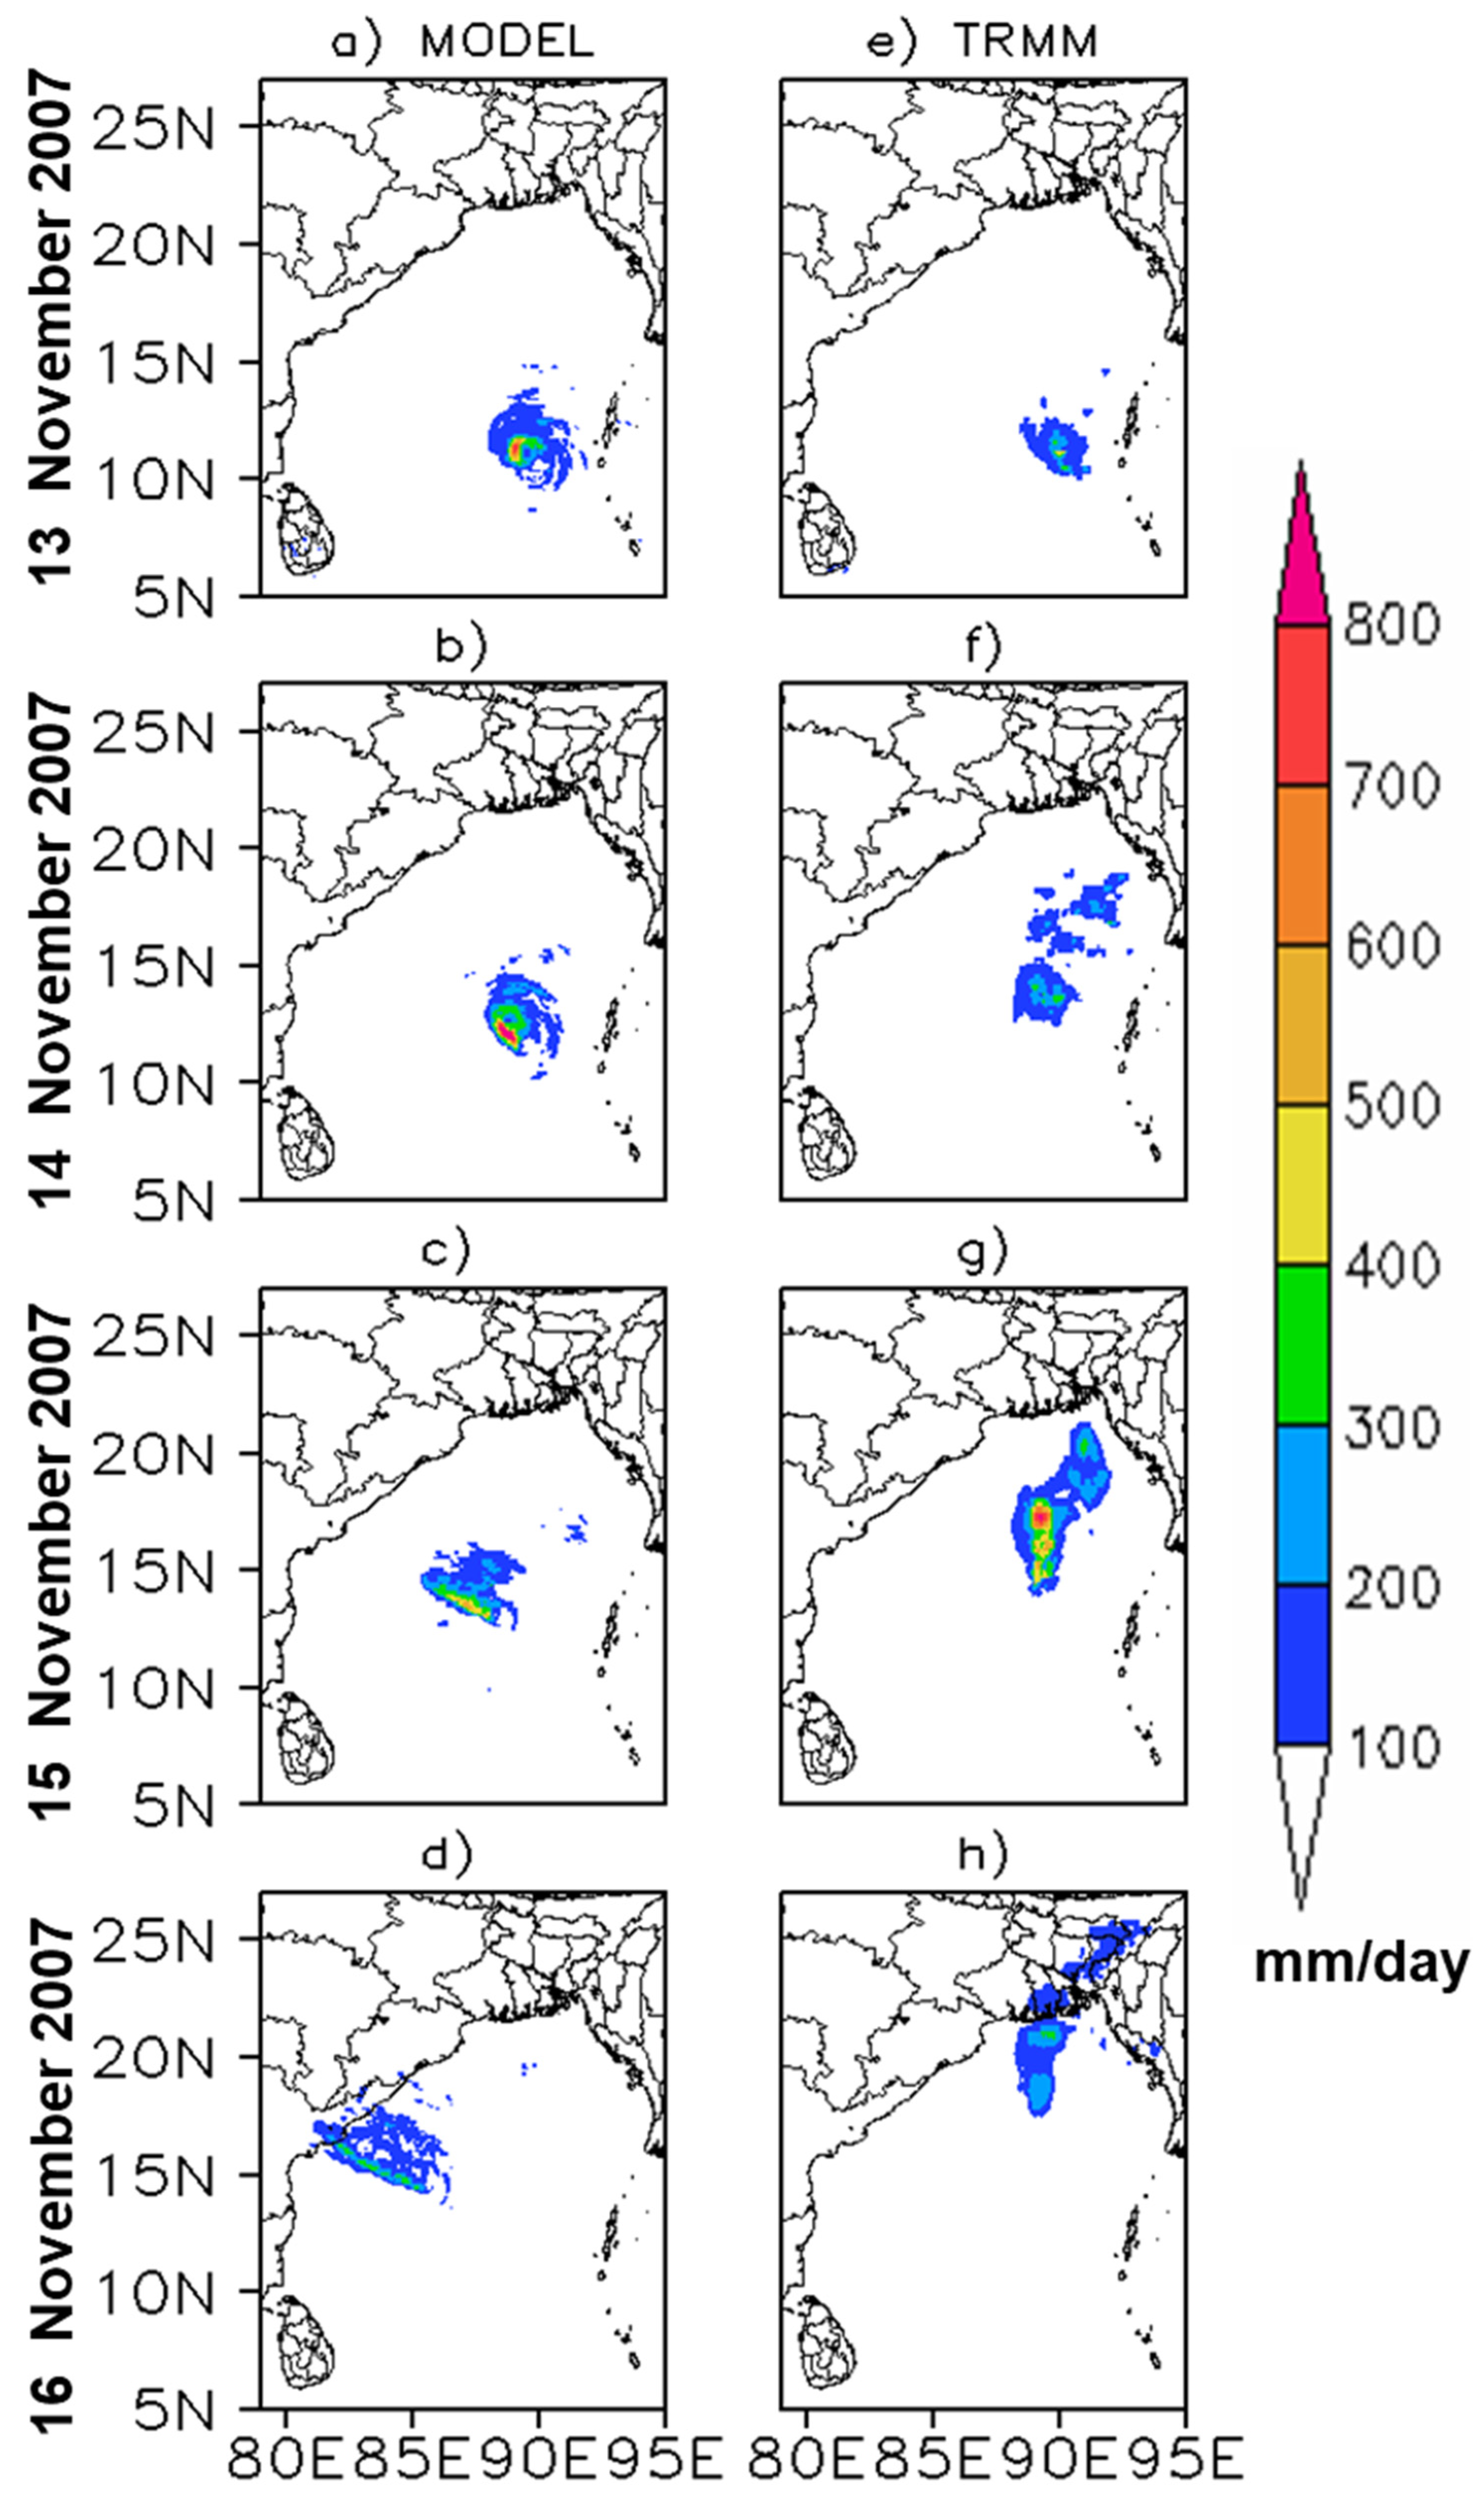
Figure 7,
Figure 8,
Figure 9,
Figure 10 and
Figure 11 illustrate the 24-hour accumulated rainfall (in mm/day) from Day-1 (first day forecast) to Day-4 (4th day forecast) for all ESCSs using finer domain results with a resolution of 4 km. The results are compared with daily accumulated rainfall from TRMM (Glob-al Precipitation Measurement (GPM) Integrated Multi-Satellite Retrievals for GPM (IMERG) _v06) with a spatial resolution of about 11 km.
In the case of Super Cyclone Amphan (
Figure 7), the WRF model well resolves the magnitude of maximum rainfall, but the spatial distribution differs from Day-1 onwards due to the cyclone’s movement. After Day-1, the simulated track deviates to the right of the observed track, causing the spatial distribution of daily rainfall to deviate towards the side of the TRMM accumulated rainfall. The simulated accumulated rainfall is also slightly higher compared to the TRMM values. On Day-2 and Day-3 (19 May and 20 May 2020), the observed maximum rainfall is about 600 mm, well resolved in the WRF model, presenting more than 600 mm rainfall with a broader spatial coverage and higher magnitude.
For Cyclone Fani (
Figure 8), the model captures the magnitude and spatial distribution of maximum rainfall well from Day-1 to Day-3. However, on Day-4, the simulated track deviates to the left of the observed track, resulting in the spatial distribution of daily rainfall deviating to the left of the TRMM accumulated rainfall. The simulated accumulated rainfall is slightly higher than the TRMM values on Day-2. On Day-2 (01 May 2019), the observed maximum rainfall is about 800 mm, well resolved in the WRF model, showing slightly more than 800 mm rainfall. On Day-3 (02 May 2019), two peaks of maximum rainfall observed in TRMM data are well matched in model simulation.
For Cyclone Hudhud (
Figure 9), the spatial distribution of maximum rainfall is well captured in the model from Day-1 to Day-4, mainly due to a better track forecast. However, during Day-1 to Day-4, the magnitude of simulated accumulated rainfall is slightly higher compared to TRMM. On Day-4, the simulated accumulated rainfall is observed over Andhra Pradesh and adjoining areas of Odisha and Chhattisgarh, while in the observation, rain is observed over the coastal region of Andhra Pradesh and adjoining areas of Odisha. Results on day-3 (12 October 2014) show that TRMM accumulated rainfall is maximum, about 650 mm, well resolved in the WRF model. On Day-1 and Day-2 (10 and 11 October 2014), the simulated rainfall is higher compared to TRMM, but on Day-3 and Day-4, the model pro-vides a better forecast in terms of space and magnitude.
Similarly,
Figure 10 & 11 show the accumulated rainfall for Cyclone Phailin and Sidr, respectively. In the case of Cyclone Phailin, the simulated results provide a better forecast on each day except the 2nd day. The observed maximum accumulated rainfall is about 550 mm on day-4 (13 October 2013), well resolved in the WRF model, but shows heavier rainfall over the state of Odisha compared to TRMM. The pattern, spatial coverage, and magnitude are well resolved on Day-3 (12 October 2013) in both model and observations. However, for Sidr, model-simulated rainfall in terms of spatial distribution is good on Day-1 and Day-2 (13 and 14 November 2007) and higher magnitude compared to TRMM. On Day-3 and Day-4, the model fails to capture the spatial rainfall due to higher track error. Overall, the model simulation of the accumulated rainfall of Cyclone Hudhud matches well with the TRMM observational data for most of the days compared to the other cyclones.
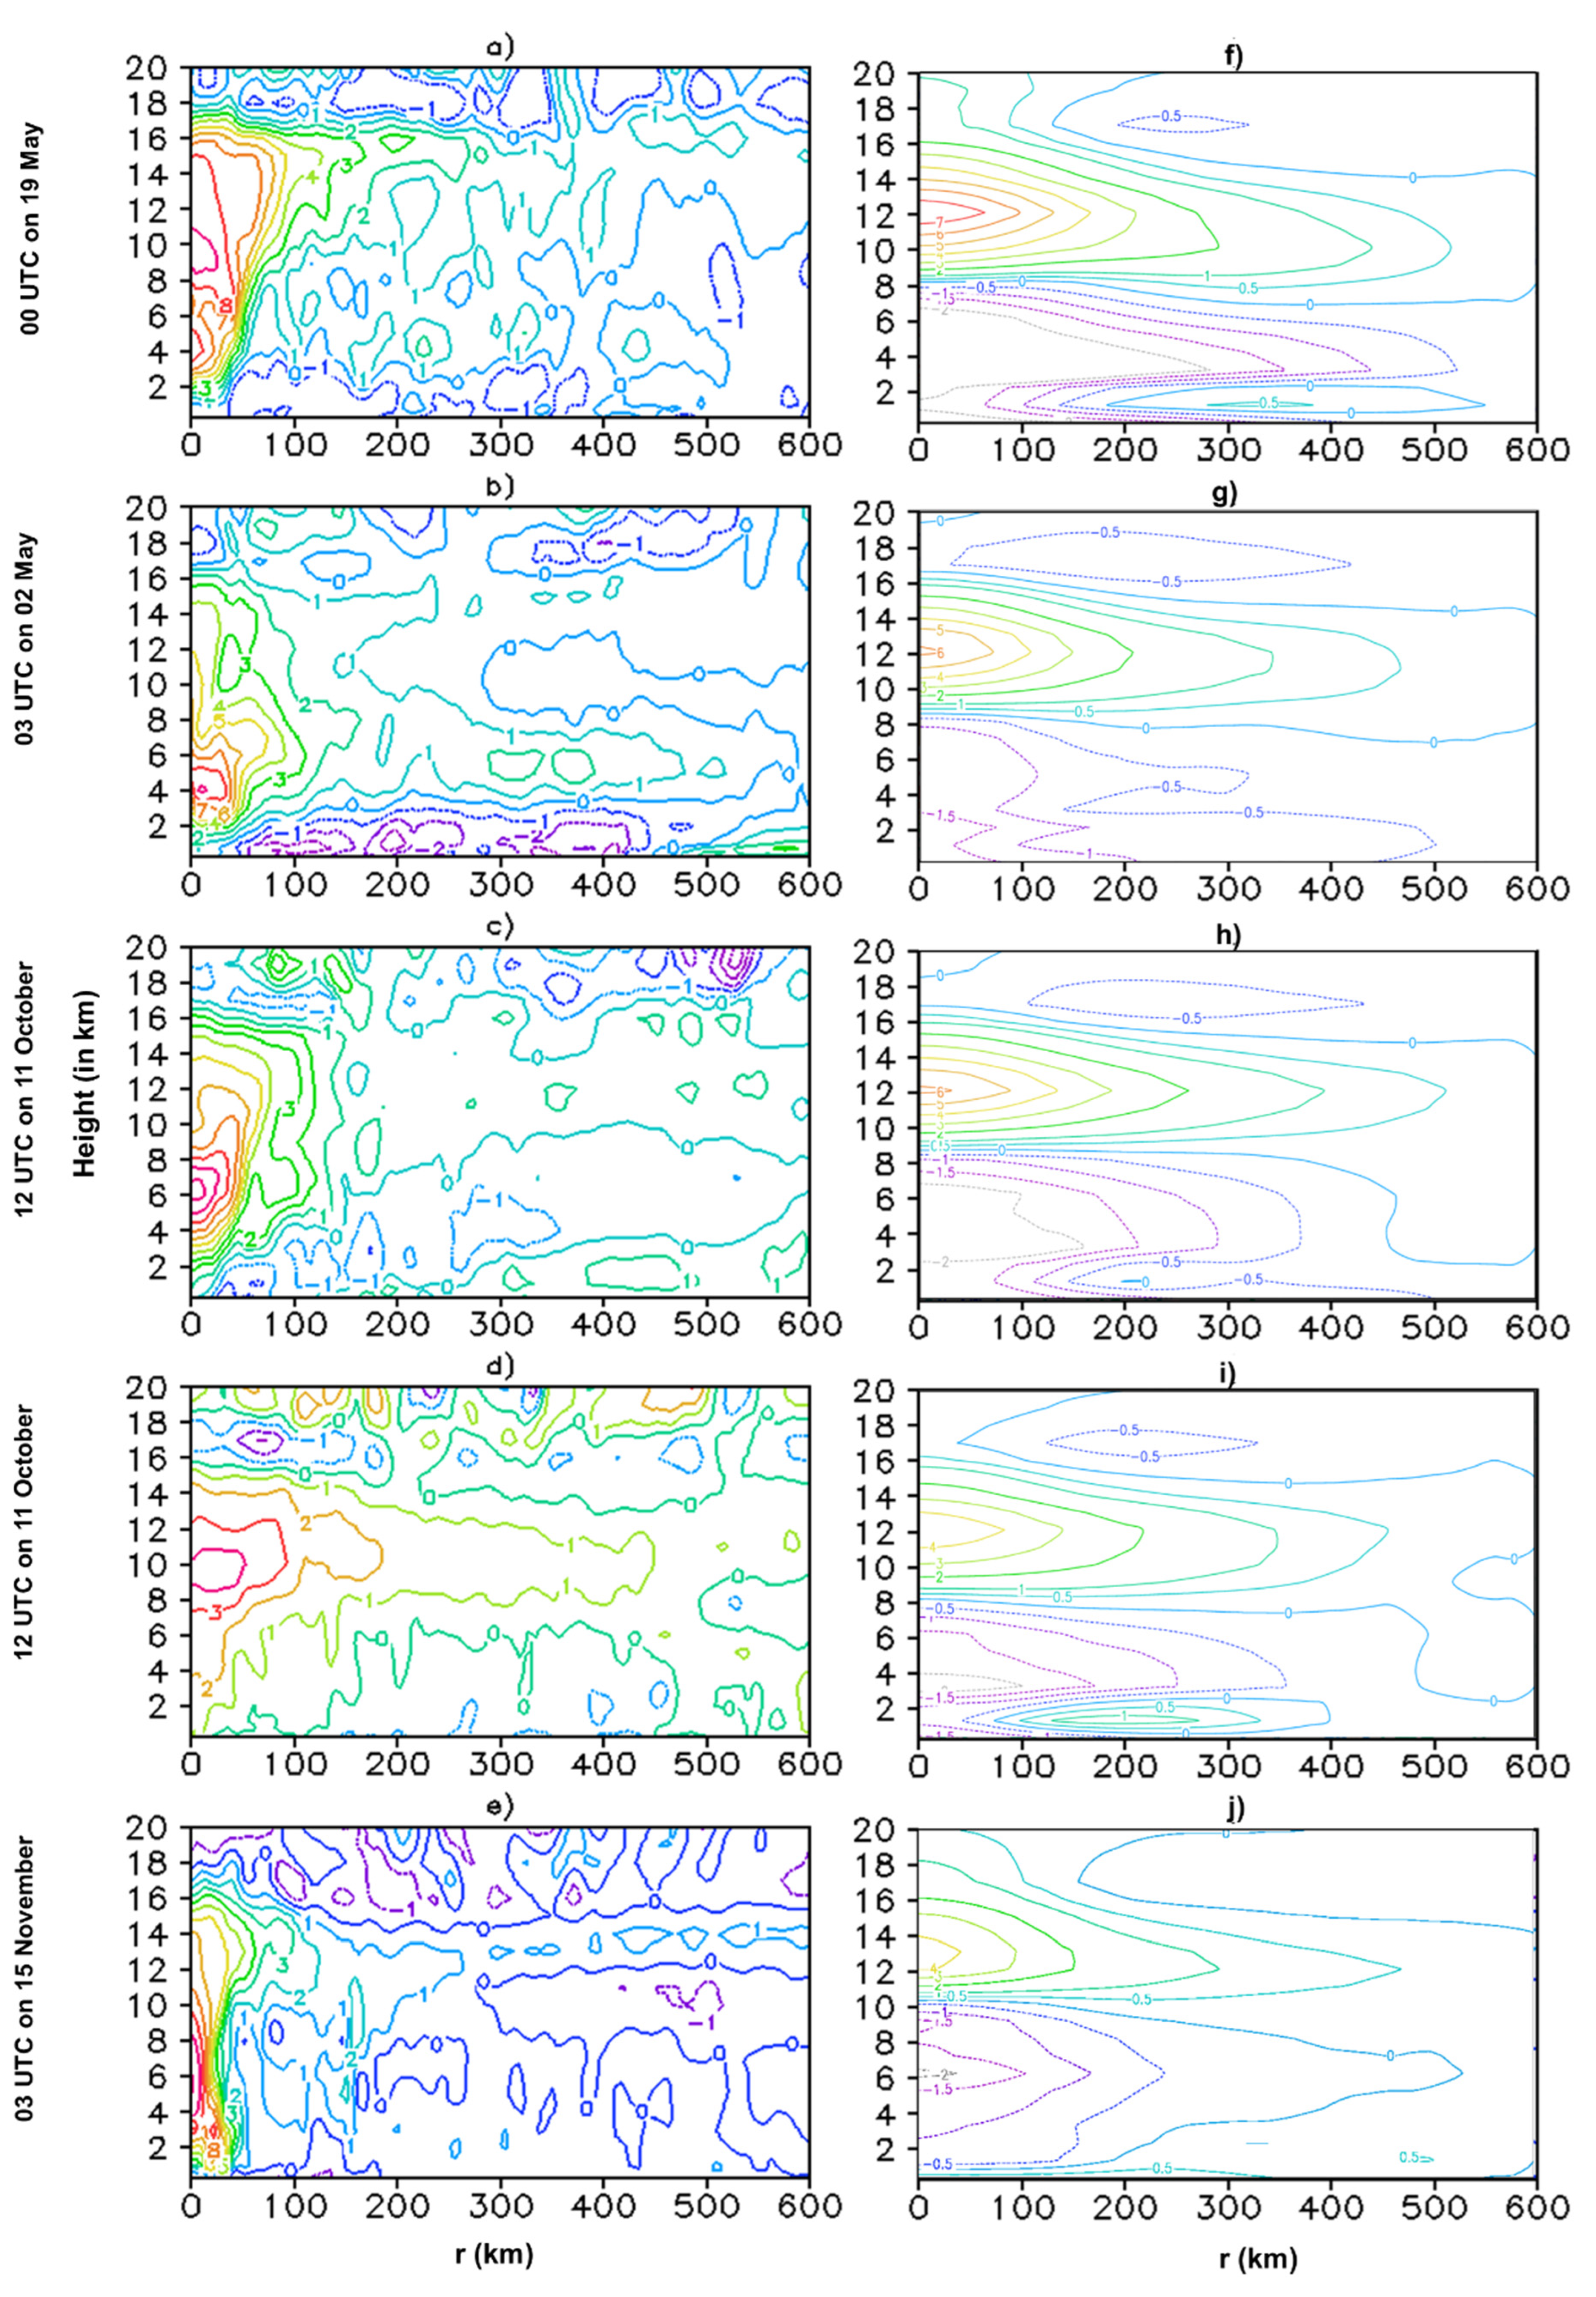
Figure 12 shows the temperature anomaly obtained from model simulation and satellite observations for all ESCSs. Amphan is considered at 00 UTC on 19 May 2020, Fani at 03 UTC on 02 May 2019, Hudhud at 12 UTC on 11 October 2014, Phailin at 12 UTC on 11 October 2013, and Sidr at 03 UTC on 15 November 2007. The positive (negative) anomaly indicates the temperature is warmer (cooler) than the normal temperature, and for the model, it is calculated using temperature at a given time minus the average temperature during the entire simulation period [
58].
From satellite observation, it is noticed that in most cyclone cases, the maximum warm core varies from 9 km to 15 km in height. In model simulation, these maximum warm core phenomena are observed between 4 km to 14 km in height. Results from the Amphan case suggest that the maximum temperature anomaly is about 7°K at about 12 km height, but in the model simulation, the anomaly is about 9°K at about 10 km height. For Fani-2019, this value in observation is about 6°K, but in the model simulation, the maximum temperature anomaly is about 8°K. Similarly, this pattern in Hudhud-2019, Phailin-2013, and Sidr-2007 is noticed at about 5°K, 4°K, 4°K in observations and in the model at about 10°K, 4°K, 10°K, respectively. Results also point out that the model-simulated anomaly is stronger than observation. Overall, results suggest that the warm core structure was well resolved in the model but slightly lower level compared to satellite observation.
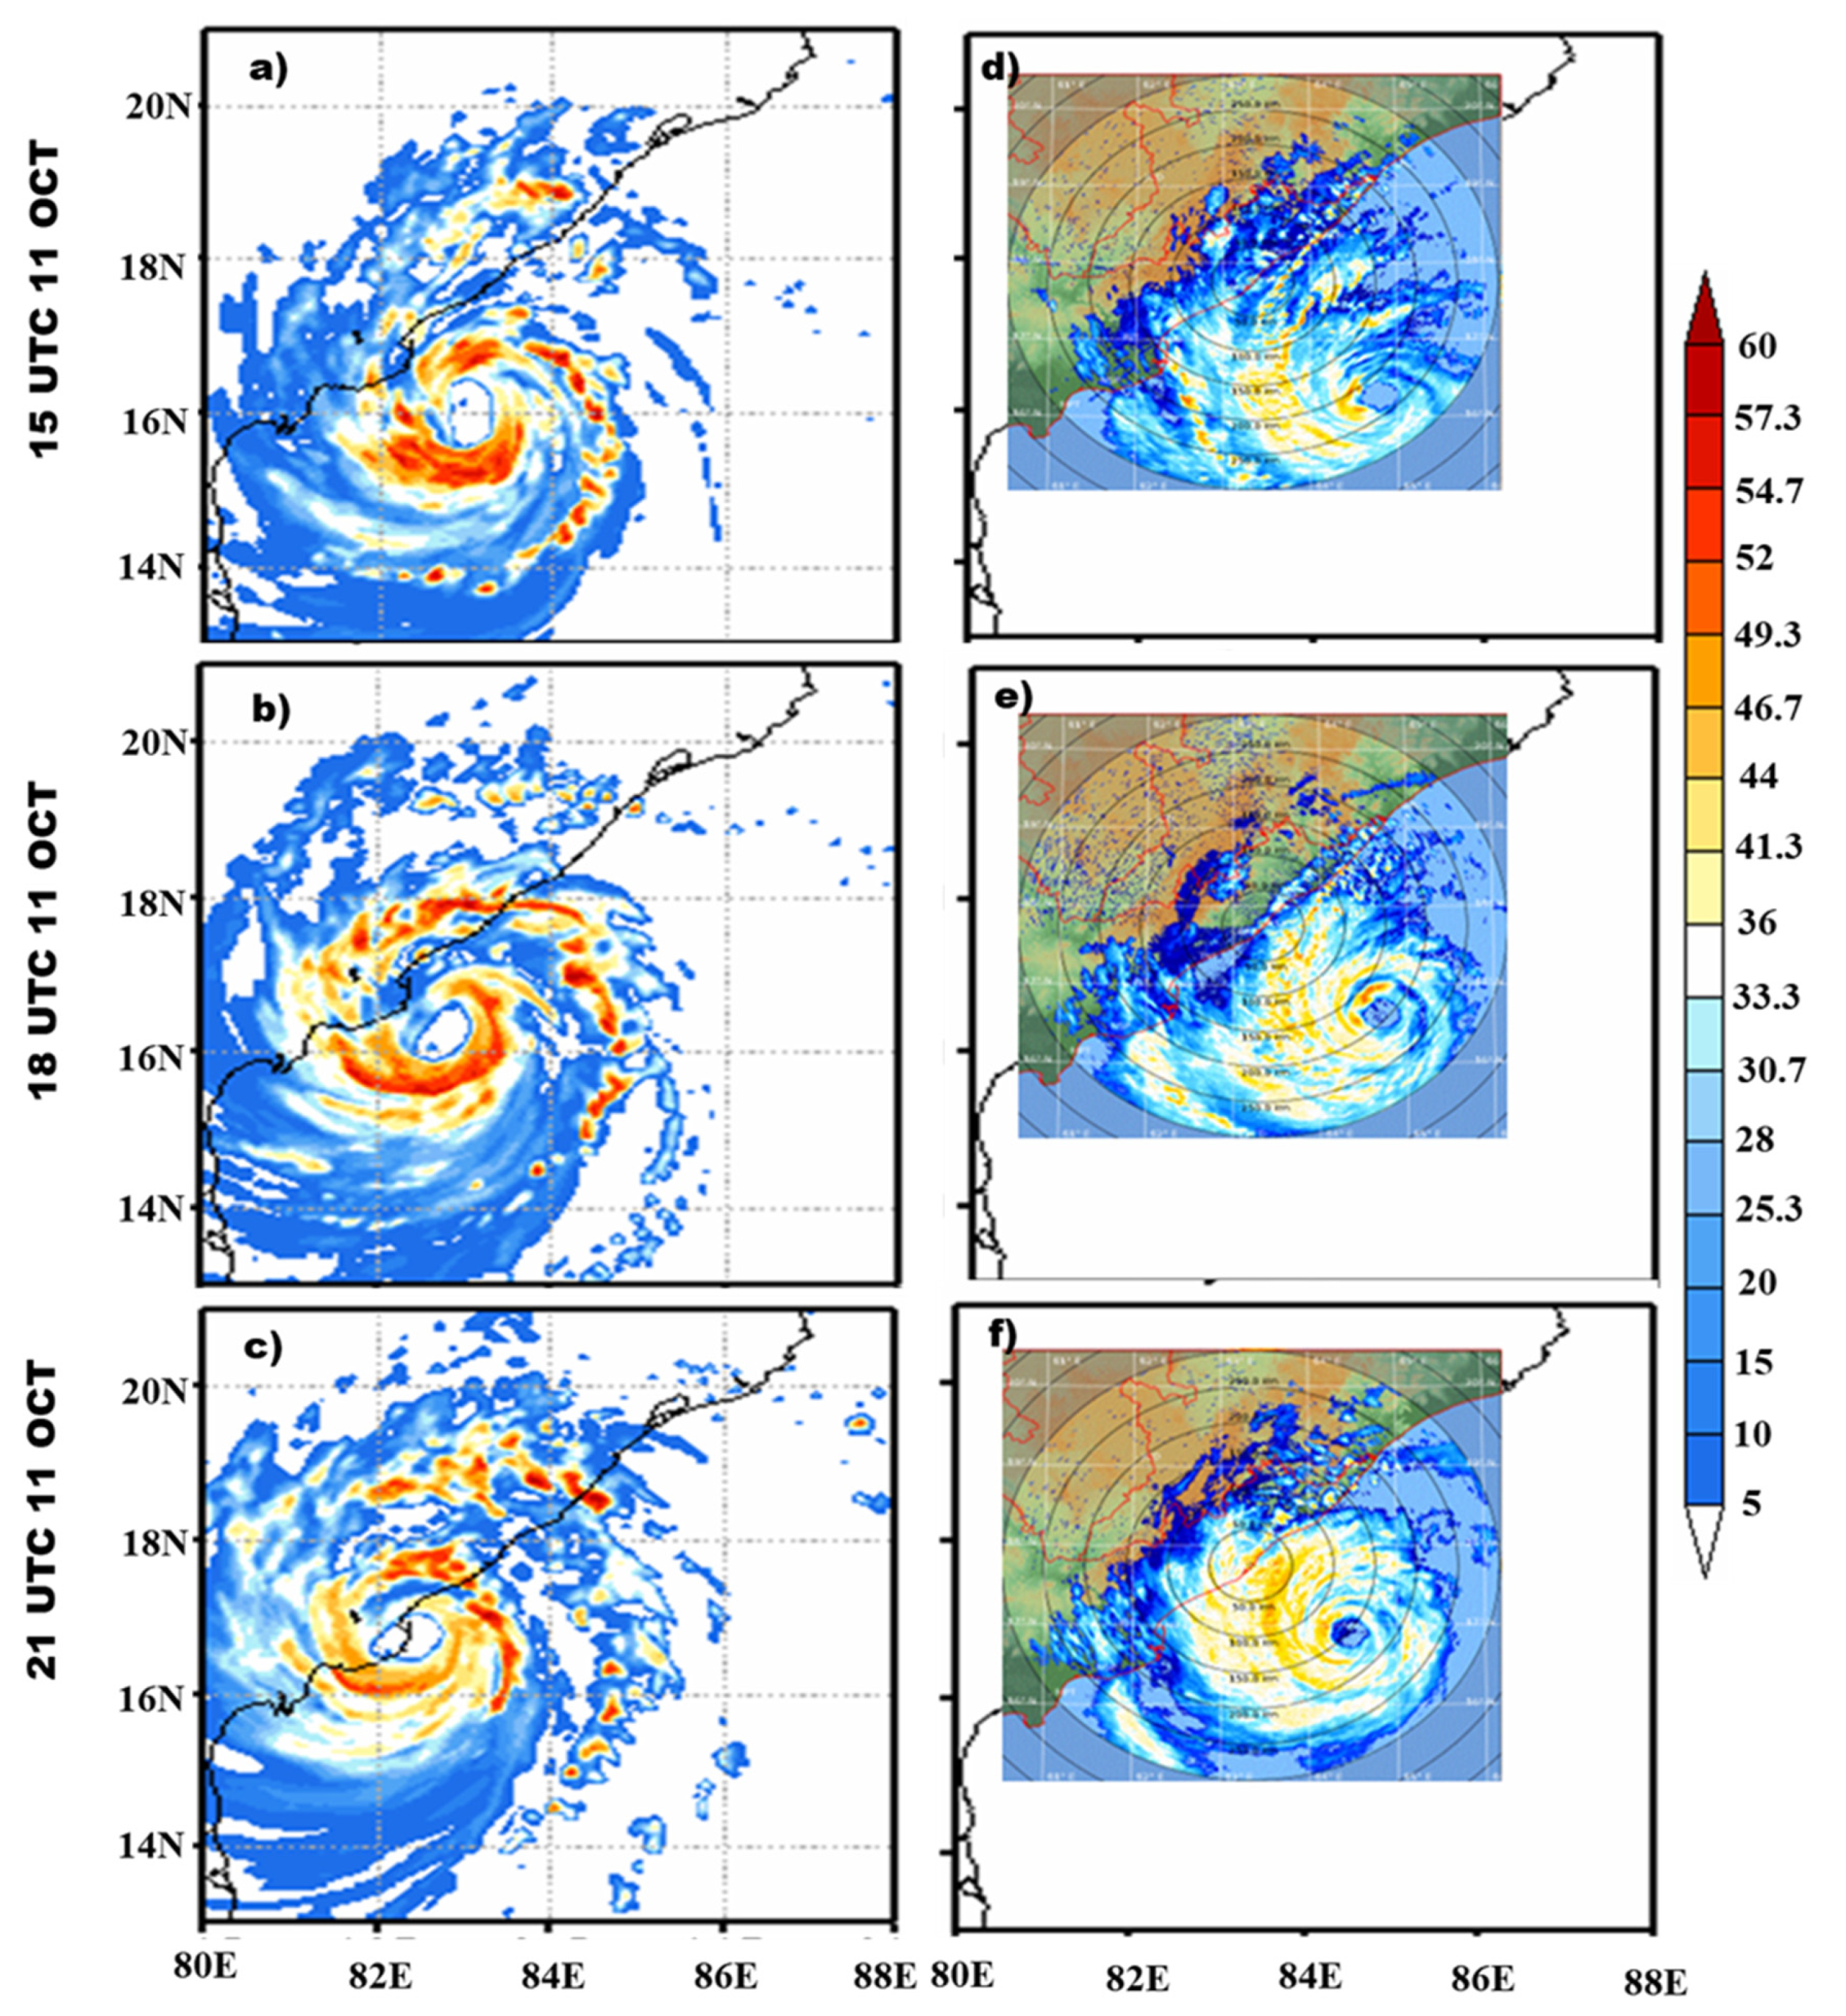
Figure 13 depicts the model-simulated maximum reflectivity (in dBZ) for Hudhud cyclone valid at 1500 UTC, 1800 UTC, and 2100 UTC on 11 October 2014, compared with DWR images obtained from IMD Visakhapatnam DWR station. The forecasted intensity in terms of MSW of cyclone Hudhud showed a better prediction compared to the other ESCSs, and hence the Hudhud case is selected to check the performance of the model in forecasting storm structure and size.
From the report of Regional Specialized Meteorological Centre (RSMC), it is suggested that at 1500 UTC, 1800 UTC, and 2100 UTC, the shape of the eye is closed, and the size of the eye is about 38.1 km, 40.6 km, and 40.8 km, respectively, which approximately matches the model forecast with slight deviation. The model simulations well capture the eye-wall cloud and spiral rain band as observed in DWR reflectivity images. Results from DWR images point out that the maximum convective bands in the wall cloud region were limited from the west sector to the adjoining northwest sector around the center of the storm Hudhud during this period. It is also noted that the outer rain band is important for rainfall activity along the region over the coastal region of Andhra Pradesh and adjoining coastal region of Odisha. In the model simulation, the movement of the storm is slightly faster compared to the observed, and hence the cloud band covers most of the coastal Andhra Pradesh and ad-joining coastal region of Odisha. In conclusion, the model predictions demonstrate the storm’s maximum reflectivity in terms of the size of the eye, eye-wall, and rain bands, which are well resolved in the WRF model using IMDAA reanalysis datasets.
4. Conclusion and Summary
This study evaluates the role of the IMDAA regional reanalysis dataset in predicting five extremely severe cyclonic storms (Sidr, Phailin, Hudhud, Fani, and Amphan) that developed over the Bay of Bengal. A double-nested domain with a finer resolution of about 4 km in the WRF model is used for simulation, with a forecast length of about 96 hours. The simulated results are discussed using finer domains and validated with IMD best-fit track datasets, TRMM daily accumulated precipitation, and other available satellite and Doppler weather radar observations. The outcomes of the present work can be summarized as follows:
Results of the study reveal that the simulated tracks of the ESCSs performed reasonably well for Fani-2019, Hudhud-2014, and Phailin-2013, but the model failed to capture the movement of the storms Amphan-2020 and Sidr-2007. The individual mean track errors suggest that Fani-2019 provided a better forecast due to a lesser initial positional error. The mean track errors of the five ESCSs on day-1 to day-4 in the model using IMDAA reanalysis datasets are about 114 km, 179 km, 307 km, and 496 km, respectively.
The simulated intensity in terms of MSW is better for Fani-2019, Hudhud-2014, and Sidr-2007, with mean absolute errors of about 9.1 m/s, 6.7 m/s, and 7 m/s, respectively. Mean absolute errors in terms of MSW and MCP on day-1 to day-4 are 8.4 m/s, 9.3 m/s, 7 m/s, and 10.6 m/s, and 12.2 hPa, 13.6 hPa, 12 hPa, 16.2 hPa, respectively. The results from 24h wind changes also suggest that the model simulation is better for Fani-2019, Hudhud-2014, and Sidr-2007.
Forecasted daily rainfall in terms of structure and magnitude of the five ESCSs suggests that in most cases, the structure and magnitude are well resolved in the WRF model. How-ever, on day-2 onwards, the structure in terms of spatial distribution of the accumulated rainfall in the cases of ESCS Sidr-2007 and Amphan-2020 is not better due to larger errors in the track. It is noticed that the magnitude of accumulated rainfall is higher in simulated storm vortex compared to the TRMM estimated rainfall.
The results from the warm core structure of all ESCSs suggest that Phailin is well resolved compared to the others. The warm core structure in most of the simulated cases varies from 4 km to 12 km, while in the observation, this varies from 10 km to 14 km. The simulated maximum reflectivity for Cyclone Hudhud suggests that patterns in terms of spatial and magnitude are well simulated in the WRF model, including eye, size of the eye, eyewall, and rain band.
Overall, the results suggest that IMDAA reanalysis datasets are useful in forecasting ESCSs over the Bay of Bengal region, and errors can be improved through data assimilation and a coupled atmosphere-ocean modeling system.
Author Contributions
Conceptualization- K.S.S.; methodology - T.K., K.S.S.; software - T.K.; validation - T.K.; K.S.S., S.N.; formal analysis, K.S.S., T.K.; investigation –T.K., K.S.S., and S.N.; data curation – T.K., K.S.S.; writing—original draft preparation, T.K. K.S.S., and S.N.; writing—review and editing, K.S.S., T.K., S.N.; visualization, K.S.S., T.K., S.N.; supervision, K.S.S. All authors have read and agreed to the published version of the manuscript.
Funding
The authors sincerely acknowledge the financial support by DST-SERB Project file no. ECR/2018/001185.
Data Availability Statement
Acknowledgments
Authors sincerely acknowledge the IMD for providing the Indian Monsoon Data Assimilation and Analysis (IMDAA) and observed best-fit track datasets, and Doppler Weather Radar (DWR) observations. NCAR for the WRF software and NASA is acknowledged for providing TRMM precipitation data sets. Thatiparthi K. is thankful to the Vellore Institute of Technology for providing the research facilities and funding.
Conflicts of Interest
The authors declare that they have no conflict of interest.
References
- Srivastava, A. K.; Ray, K. S.; De, U. S. Trends in the frequency of cyclonic disturbances and their intensification over Indian seas. Mausam 2000, 51, 113–118. [Google Scholar] [CrossRef]
- Singh, O.P.; Khan, T.M.A.; and Rahman, S. Changes in the frequency of tropical cyclones over the North Indian Ocean. Meteorol. Atmos. Phys. 2000, 75, 11–20. [Google Scholar] [CrossRef]
- Singh, O. P.; Khan, T. M. A.; Rahman, M. S. Has the frequency of intense tropical cyclones increased in the north Indian Ocean? Curr. Sci. 2001, 575–580. [Google Scholar]
- Murakami, H.; Vecchi, G. A.; Underwood, S. Increasing frequency of extremely severe cyclonic storms over the Arabian Sea. Nat. Clim. Change. 2017, 7, 885–889. [Google Scholar] [CrossRef]
- Singh, K. S.; Albert, J.; Bhaskaran, P. K.; Alam, P. Numerical simulation of an extremely severe cyclonic storm over the Bay of Bengal using WRF modelling system: influence of model initial condition. MODEL EARTH SYST ENV. 2021, 7, 2741–2752. [Google Scholar] [CrossRef]
- Swapna, P.; Sreeraj, P.; Sandeep, N.; Jyoti, J.; Krishnan, R.; Prajeesh, A. G.; Ayantika, D.C.; Manmeet, S. Increasing frequency of extremely severe cyclonic storms in the North Indian Ocean by anthropogenic warming and Southwest monsoon weakening. Geophys. Res. Lett. 2022, 49, e2021GL094650. [Google Scholar] [CrossRef]
- Neumann, B.; Vafeidis, A. T.; Zimmermann, J.; Nicholls, R. J. Future coastal population growth and exposure to sea-level rise and coastal flooding-a global assessment. PLoS One. 2015, 10, e0118571. [Google Scholar] [CrossRef]
- Hauer, M. E.; Hardy, D.; Kulp, S. A.; Mueller, V.; Wrathall, D. J.; Clark, P. U. Assessing population exposure to coastal flooding due to sea level rise. Nat. Commun. 2021, 12, 6900. [Google Scholar] [CrossRef]
- Sahoo, B.; Bhaskaran, P. K. Assessment on historical cyclone tracks in the Bay of Bengal, east coast of India. Int J Climatol. 2016, 36, 95–109. [Google Scholar] [CrossRef]
- Mohapatra, M.; Bandyopadhyay, B. K.; Nayak, D. P. Evaluation of operational tropical cyclone intensity forecasts over north Indian Ocean issued by India Meteorological Department. Nat. Hazards. 2013, 68, 433–451. [Google Scholar] [CrossRef]
- Mohapatra, M.; Nayak, D. P.; Sharma, R. P.; Bandyopadhyay, B. K. Evaluation of official tropical cyclone track forecast over north Indian Ocean issued by India Meteorological Department. J EARTH SYST SCI. 2013, 122, 589–601. [Google Scholar] [CrossRef]
- Xiao, Q.; Kuo, Y. H.; Zhang, Y.; Barker, D. M.; Won, D. J. A tropical cyclone bogus data assimilation scheme in the MM5 3D-Var system and numerical experiments with Typhoon Rusa (2002) near landfall. J. Meteorol. Soc. Jpn. 2006, 84, 671–689. [Google Scholar] [CrossRef]
- Elsberry, R. L.; Tsai, H. C.; Chin, W. C.; Marchok, T. P. Advanced global model ensemble forecasts of tropical cyclone formation, and intensity predictions along medium-range tracks. Atmosphere. 2020, 11, 1002. [Google Scholar] [CrossRef]
- Srivastava, A.; Prasad, V. S.; Das, A. K.; Sharma, A. A HWRF-POM-TC coupled model forecast performance over North Indian Ocean: VSCS TITLI & VSCS LUBAN. TROP CYCLONE RES REV. 2021, 10, 54–70. [Google Scholar]
- Bachmann, K.; Torn, R. D. Validation of HWRF-based probabilistic TC wind and precipitation forecasts. Weather Forecast. 2021, 36, 2057–2070. [Google Scholar] [CrossRef]
- Singh, K. S.; Thankachan, A.; Thatiparthi, K.; Reshma, M. S.; Albert, J.; Bonthu, S.; Bhaskaran, P. K. Prediction of rapid intensification for land-falling extremely severe cyclonic storms in the Bay of Bengal. Theor. Appl. Climatol. 2022, 1–19. [Google Scholar] [CrossRef]
- Nolan, D. S.; Zhang, J. A.; Stern, D. P. Evaluation of planetary boundary layer parameterizations in tropical cyclones by comparison of in situ observations and high-resolution simulations of Hurricane Isabel (2003). Part I: Initialization, maximum winds, and the outer-core boundary layer. Mon. Weather. Rev. 2009, 137, 3651–3674. [Google Scholar] [CrossRef]
- Singh, K.S.; Mandal, M. Sensitivity of mesoscale simulation of Aila Cyclone to the parameterization of physical processes using WRF Model. In Monitoring and Prediction of Tropical Cyclones in the Indian Ocean and Climate Change; Springer: Dordrecht, The Netherlands, 2014; pp. 300–308. [Google Scholar]
- Singh, K. S.; Bhaskaran, P. K. Impact of PBL and convection parameterization schemes for prediction of severe land-falling Bay of Bengal cyclones using WRF-ARW model. J. Atmos. Sol.-Terr. Phys. 2017, 165, 10–24. [Google Scholar] [CrossRef]
- Zhang, J. A.; Kalina, E. A.; Biswas, M. K.; Rogers, R. F.; Zhu, P.; Marks, F. D. A review and evaluation of planetary boundary layer parameterizations in hurricane weather research and forecasting model using idealized simulations and observations. Atmosphere 2020, 11, 1091. [Google Scholar] [CrossRef]
- Park, J.; Cha, D. H.; Lee, M. K.; Moon, J.; Hahm, S. J.; Noh, K.; Chan, J. C. L.; Bell, M. Impact of cloud microphysics schemes on tropical cyclone forecast over the western North Pacific. J. Geophys. Res. Atmos. 2020, 125, e2019JD032288. [Google Scholar] [CrossRef]
- Wu, D.; Zhang, F.; Chen, X.; Ryzhkov, A.; Zhao, K.; Kumjian, M. R.; Chen, X.; Chan, P. W. Evaluation of microphysics schemes in tropical cyclones using polarimetric radar observations: Convective precipitation in an outer rainband. Mon. Weather. Rev. 2021, 149, 1055–1068. [Google Scholar] [CrossRef]
- Rakesh, V.; Singh, R.; Pal, P. K.; Joshi, P. C. Impact of satellite soundings on the simulation of heavy rainfall associated with tropical depressions. Nat. Hazards. 2011, 58, 945–980. [Google Scholar] [CrossRef]
- Zhao, Y.; Wang, B.; Liu, J. A DRP–4DVar data assimilation scheme for typhoon initialization using sea level pressure data. Mon. Weather. Rev. 2012, 140, 1191–1203. [Google Scholar] [CrossRef]
- Srinivas, C. V.; Bhaskar Rao, D.; Yesubabu, V.; Baskaran, R.; Venkatraman, B. Tropical cyclone predictions over the Bay of Bengal using the high-resolution Advanced ResearchWeather Research and Forecasting (ARW) model. Q. J. R. Meteorol. Soc. 2013, 139, 1810–1825. [Google Scholar] [CrossRef]
- Yesubabu, V.; Srinivas, C. V.; Hariprasad, K. B. R. R.; Baskaran, R. A study on the impact of observation assimilation on the numerical simulation of tropical cyclones JAL and THANE using 3DVAR. Pure Appl. Geophys. 2014, 171, 2023–2042. [Google Scholar] [CrossRef]
- Osuri, K. K.; Mohanty, U. C.; Routray, A.; Niyogi, D. Improved prediction of Bay of Bengal tropical cyclones through assimilation of Doppler weather radar observations. Mon. Weather. Rev. 2015, 143, 4533–4560. [Google Scholar] [CrossRef]
- Greeshma, M. M.; Srinivas, C. V.; Yesubabu, V.; Naidu, C. V.; Baskaran, R.; Venkatraman, B. Impact of local data assimilation on tropical cyclone predictions over the Bay of Bengal using the ARW model. Ann. Geophys. 2015, 33, 805–828. [Google Scholar] [CrossRef]
- Routray, A.; Mohanty, U. C.; Osuri, K. K.; Kar, S. C.; Niyogi, D. Impact of satellite radiance data on simulations of Bay of Bengal tropical cyclones using the WRF-3DVAR modeling system. IEEE Trans. Geosci. Remote Sens. 2016, 54, 2285–2303. [Google Scholar] [CrossRef]
- Singh, K. S.; Bhaskaran, P. K. Impact of lateral boundary and initial conditions in the prediction of Bay of Bengal cyclones using WRF model and its 3D-VAR data assimilation system. J. Atmos. Sol.-Terr. Phys. 2018, 175, 64–75. [Google Scholar] [CrossRef]
- Singh, K. S.; Mandal, M.; Bhaskaran, P. K. Impact of radiance data assimilation on the prediction performance of cyclonic storm SIDR using WRF-3DVAR modelling system. Meteorol. Atmos. Phys. 2019, 131, 11–28. [Google Scholar] [CrossRef]
- Elsberry, R. L.; Feldmeier, J. W.; Chen, H. J.; Peng, M.; Velden, C. S.; Wang, Q. Challenges and Opportunities with New Generation Geostationary Meteorological Satellite Datasets for Analyses and Initial Conditions for Forecasting Hurricane Irma (2017) Rapid Intensification Event. Atmosphere 2020, 11, 1200. [Google Scholar] [CrossRef]
- Zhang, S.; Pu, Z. Evaluation of the four-dimensional ensemble-variational hybrid data assimilation with self-consistent regional background error covariance for improved hurricane intensity forecasts. Atmosphere 2020, 11, 1007. [Google Scholar] [CrossRef]
- Zhang, J.; Feng, J.; Li, H.; Zhu, Y.; Zhi, X.; Zhang, F. Unified ensemble mean forecasting of tropical cyclones based on the feature-oriented mean method. Weather Forecast. 2021, 36, 1945–1959. [Google Scholar] [CrossRef]
- Chen, X.; Xue, M.; Fang, J. Rapid intensification of Typhoon Mujigae (2015) under different sea surface temperatures: Structural changes leading to rapid intensification. J. Atmos. Sci. 2018, 75, 4313–4335. [Google Scholar] [CrossRef]
- Liao, X.; Li, T.; Ma, C. Moist Static Energy and Secondary Circulation Evolution Characteristics during the Rapid Intensification of Super Typhoon Yutu (2007). Atmosphere 2022, 13, 1105. [Google Scholar] [CrossRef]
- Wu, Z.; Zhang, Y.; Zhang, L.; Zheng, H. Improving the WRF Forecast of Landfalling Tropical Cyclones Over the Asia-Pacific Region by Constraining the Cloud Microphysics Model with GPM Observations. Geophys. Res. Lett. 2022, 49, e2022GL100053. [Google Scholar] [CrossRef]
- Singh, K. S.; Nayak, S.; Maity, S.; Nayak, H. P.; Dutta, S. Prediction of Extremely Severe Cyclonic Storm “Fani” Using Moving Nested Domain. Atmosphere 2023, 14, 637. [Google Scholar] [CrossRef]
- DeMaria, M.; Sampson, C. R.; Knaff, J. A.; Musgrave, K. D. Is tropical cyclone intensity guidance improving? Bull. Am. Meteorol. Soc. 2014, 95, 387–398. [Google Scholar] [CrossRef]
- Feng, J.; Wang, X. Impact of increasing horizontal and vertical resolution during the HWRF hybrid EnVar data assimilation on the analysis and prediction of Hurricane Patricia (2015). Mon. Weather. Rev. 2021, 149, 419–441. [Google Scholar] [CrossRef]
- Zhang, X.; Quirino, T.; Yeh, K. S.; Gopalakrishnan, S.; Marks, F.; Goldenberg, S.; Aberson, S. HWRFx: Improving hurricane forecasts with high-resolution modeling. Comput. Sci. Eng. 2010, 13, 13–21. [Google Scholar] [CrossRef]
- Gopalakrishnan, S. G.; Goldenberg, S.; Quirino, T.; Zhang, X.; Marks, F.; Yeh, K. S.; Atlas, R; Tallapragada, V. Toward improving high-resolution numerical hurricane forecasting: Influence of model horizontal grid resolution, initialization, and physics. Weather Forecast. 2012, 27, 647–666. [Google Scholar] [CrossRef]
- Skamarock, W. C.; Klemp, J. B.; Dudhia, J.; Gill, D. O.; Liu, Z.; Berner, J.; Wang, W.; Powers, J.G.; Duda, M.G; Barker, D.M.; Huang, X. Y. A description of the advanced research WRF model version 4. National Center for Atmospheric Research: Boulder, CO, USA, 2019; 145, 550. [Google Scholar]
- Osuri, K. K.; Mohanty, U. C.; Routray, A.; Kulkarni, M. A.; Mohapatra, M. Customization of WRF-ARW model with physical parameterization schemes for the simulation of tropical cyclones over North Indian Ocean. Nat. Hazards. 2012, 63, 1337–1359. [Google Scholar] [CrossRef]
- Osuri, K. K.; Mohanty, U. C.; Routray, A.; Mohapatra, M.; Niyogi, D. Real-time track prediction of tropical cyclones over the North Indian Ocean using the ARW model. J. Appl. Meteorol. Climatol. 2013, 52, 2476–2492. [Google Scholar] [CrossRef]
- Nellipudi, N. R.; Viswanadhapalli, Y.; Challa, V. S.; Vissa, N. K.; Langodan, S. Impact of surface roughness parameterizations on tropical cyclone simulations over the Bay of Bengal using WRF-OML model. Atmos. Res. 2021, 262, 105779. [Google Scholar] [CrossRef]
- Mahmood, S.; Davie, J.; Jermey, P.; Renshaw, R.; George, J. P.; Rajagopal, E. N.; Rani, S. I. Indian monsoon data assimilation and analysis regional reanalysis: Configuration and performance. Atmos. Sci. Lett. 2018, 19, e808. [Google Scholar] [CrossRef]
- Ashrit, R.; Indira Rani, S.; Kumar, S.; Karunasagar, S.; Arulalan, T.; Francis, T.; Routraay, A.; Laskar, S.I.; Mahmood, S.; Jermey, P.; Maycock, A.; Renshaw, R.; George, J. P.; Rajagopal, E. N. IMDAA regional reanalysis: Performance evaluation during Indian summer monsoon season. J. Geophys. Res. Atmos. 2020, 125, e2019JD030973. [Google Scholar] [CrossRef]
- Rani, S. I.; Arulalan, T.; George, J. P.; Rajagopal, E. N.; Renshaw, R.; Maycock, A.; Barker, D. M.; Rajeevan, M. IMDAA: High-resolution satellite-era reanalysis for the Indian monsoon region. J. Clim. 2021, 34, 5109–5133. [Google Scholar] [CrossRef]
- Demuth, J.L.; De Maria, M.; Knaff, J.A.; Haar, T.H.V. Evaluation of Advanced Microwave Sounding Unit tropical-cyclone intensity and size estimation algorithms. J. Appl. Meteorol. Climatol. 2004, 43, 282–296. [Google Scholar] [CrossRef]
- Lin, Y.L.; Farley, R.D.; Orville, H.D. Bulk parameterization of the snow field in a cloud model. J. Appl. Meteorol. Climatol. 1983, 22, 1065–1092. [Google Scholar] [CrossRef]
- Chen, S. H.; Sun, W. Y. A one-dimensional time dependent cloud model. J. Meteorol. Soc. Jpn. 2002, 80, 99–118. [Google Scholar] [CrossRef]
- Kain, J. S. The Kain–Fritsch convective parameterization: an update. J. Appl. Meteorol. 2004, 43, 170–181. [Google Scholar] [CrossRef]
- Hong, S.Y.; Noh, Y.; Dudhia, J. A new vertical diffusion package with an explicit treatment of entrainment processes. Mon. Weather. Rev. 2006, 134, 2318–2341. [Google Scholar] [CrossRef]
- Mlawer, E.J.; Taubman, S.J.; Brown, P.D.; Iacono, M.J.; Clough, S.A. Radiative transfer for inhomogeneous atmospheres: RRTM, a validated correlated-k model for the longwave. J. Geophys. Res. Atmos. 1997, 102, 16663–16682. [Google Scholar] [CrossRef]
- Dudhia, J. Numerical study of convection observed during the winter monsoon experiment using a mesoscale two-dimensional model. J. Atmos. Sci. 1989, 46, 3077–3107. [Google Scholar] [CrossRef]
- Niu, G.Y.; Yang, Z.L.; Mitchell, K.E.; Chen, F.; Ek, M.B.; Barlage, M.; Kumar, A.; Manning, K.; Niyogi, D.; Rosero, E.; et al. The community Noah land surface model with multi parameterization options (Noah-MP): 1. Model description and evaluation with local-scale measurements. J. Geophys. Res. Atmos. 2011, 116, D12109. [Google Scholar] [CrossRef]
- Singh, K.S.; Bhaskaran, P.K. Prediction of landfalling Bay of Bengal cyclones during 2013 using the high resolution Weather Research and Forecasting model. Meteorological Applications, 2020, 27, p.e1850. [Google Scholar] [CrossRef]
Figure 1.
Initial low-pressure vortex of five ESCSs: a) Amphan, b) Fani, c) Hudhud, d) Phailin, and e) Sidr – was derived from IMDAA data set were compared with the IMD best-fit track data, indicating the location in terms of the weather symbol.
Figure 1.
Initial low-pressure vortex of five ESCSs: a) Amphan, b) Fani, c) Hudhud, d) Phailin, and e) Sidr – was derived from IMDAA data set were compared with the IMD best-fit track data, indicating the location in terms of the weather symbol.
Figure 2.
Model simulated tracks of five ESCSs: a) Amphan b) Fani c) Hudhud, and d) Phailin, and e) Sidr along with IMD best-fit tracks.
Figure 2.
Model simulated tracks of five ESCSs: a) Amphan b) Fani c) Hudhud, and d) Phailin, and e) Sidr along with IMD best-fit tracks.
Figure 3.
Temporal variation of model simulated MSW (in m/s), a) Amphan, b) Fani, c) Hudhud, d) Phailin, e) Sidr along with IMD best-fit track data set.
Figure 3.
Temporal variation of model simulated MSW (in m/s), a) Amphan, b) Fani, c) Hudhud, d) Phailin, e) Sidr along with IMD best-fit track data set.
Figure 4.
Wind speed changes in 24 hours (in m/s) for five ESCSs from model simulations and IMD best-fit track data set: a) Amphan, b) Fani, c) Hudhud, and d) Phailin, and e) Sidr.
Figure 4.
Wind speed changes in 24 hours (in m/s) for five ESCSs from model simulations and IMD best-fit track data set: a) Amphan, b) Fani, c) Hudhud, and d) Phailin, and e) Sidr.
Figure 5.
Temporal variation of model simulated CSLP for five ESCSs: a) Amphan, b) Fani, c) Hudhud, d) Phailin, and e) Sidr along with IMD best-fit track data set.
Figure 5.
Temporal variation of model simulated CSLP for five ESCSs: a) Amphan, b) Fani, c) Hudhud, d) Phailin, and e) Sidr along with IMD best-fit track data set.
Figure 6.
Taylor diagrams of MSW (a-e) and CSLP (f-j) for five ESCSs [(a & f) Amphan, (b & g) Fani, (c & h) Hudhud, (d & i) Phailin and (e & j) Sidr].
Figure 6.
Taylor diagrams of MSW (a-e) and CSLP (f-j) for five ESCSs [(a & f) Amphan, (b & g) Fani, (c & h) Hudhud, (d & i) Phailin and (e & j) Sidr].
Figure 7.
Daily accumulated rainfall (in mm/day) from Day-1 to Day-4 valid at 0000 UTC from 18 May to 21 May 2020, simulated (a-d, left panel) and TRMM (e-h, right panel).
Figure 7.
Daily accumulated rainfall (in mm/day) from Day-1 to Day-4 valid at 0000 UTC from 18 May to 21 May 2020, simulated (a-d, left panel) and TRMM (e-h, right panel).
Figure 8.
Daily accumulated rainfall (in mm/day) from Day-1 to Day-4 valid at 0000 UTC from 30 April to 03 May 2019, simulated (a-d, left panel) and TRMM (e-h, right panel).
Figure 8.
Daily accumulated rainfall (in mm/day) from Day-1 to Day-4 valid at 0000 UTC from 30 April to 03 May 2019, simulated (a-d, left panel) and TRMM (e-h, right panel).
Figure 9.
Daily accumulated rainfall (in mm/day) from Day-1 to Day-4 valid at 0000 UTC from 10 October to 13 October 2014, simulated (a-d, left panel) and TRMM (e-h, right panel).
Figure 9.
Daily accumulated rainfall (in mm/day) from Day-1 to Day-4 valid at 0000 UTC from 10 October to 13 October 2014, simulated (a-d, left panel) and TRMM (e-h, right panel).
Figure 10.
Daily accumulated rainfall (in mm/day) from Day-1 to Day-4 valid at 0000 UTC from 10 October to 13 October 2013, simulated (a-d, left panel) and TRMM (e-h, right panel).
Figure 10.
Daily accumulated rainfall (in mm/day) from Day-1 to Day-4 valid at 0000 UTC from 10 October to 13 October 2013, simulated (a-d, left panel) and TRMM (e-h, right panel).
Figure 11.
Daily accumulated rainfall (in mm/day) from Day-1 to Day-4 valid at 0000 UTC from 13 November to 16 November 2007, simulated (a-d, left panel) and TRMM (e-h, right panel).
Figure 11.
Daily accumulated rainfall (in mm/day) from Day-1 to Day-4 valid at 0000 UTC from 13 November to 16 November 2007, simulated (a-d, left panel) and TRMM (e-h, right panel).
Figure 12.
Temperature anomaly for five ESCSs such as a) Amphan at 00 UTC on 19 May 2020, b) Fani at 03 UTC on 02 May 2019, c) Hudhud at 12 UTC on 11 October 2014, d) Phailin at 12 UTC on 11 October 2013, and e) Sidr at 03 UTC on 15 November 2007 obtained from model forecasted (left panel) and the satellite observations (right panel).
Figure 13.
Simulated (a-c) and observed (d-e; from Vishakhapatnam DWR) maximum reflectivity (in dBZ) for Hudhud cyclone valid at: a) 1500 UTC, b) 1800 UTC and c) 2100 UTC on 11 October 2014.
Figure 13.
Simulated (a-c) and observed (d-e; from Vishakhapatnam DWR) maximum reflectivity (in dBZ) for Hudhud cyclone valid at: a) 1500 UTC, b) 1800 UTC and c) 2100 UTC on 11 October 2014.
Table 1.
Model configuration used in the study for the simulations.
Table 1.
Model configuration used in the study for the simulations.
| Dynamical core |
ARW, non-hydrostatic |
| Horizontal grid distance |
Domain 1 : 12 km
Domain 2 : 4 km |
| Initial and lateral boundary conditions |
IMDAA reanalysis |
| Boundary conditions updated |
6 hours |
| Number of vertical levels |
51 |
| Integration time step |
60 seconds (D1) and 20 seconds (D2) |
| Microphysical scheme |
Lin [51,52] |
| Cumulus parameterization |
Kain-Fritsch [53] |
| PBL scheme |
YSU [54] |
| Radiation schemes |
LW-RRTM [55] and SW-Dudhia [56] |
| Land surface model |
Noah [57] |
Table 2.
Details of extremely severe cyclonic storms considered in the study.
Table 2.
Details of extremely severe cyclonic storms considered in the study.
| Name of Cyclone |
Initialization stage |
Landfall location |
Initialization time |
| Amphan (May 2020) |
Cyclonic |
West Bengal coast |
00 UTC on 17 May 2020 |
| Fani (April 2019) |
Cyclonic |
Puri, Odisha |
00 UTC on 29 April 2019 |
| Hudhud (October 2014) |
Cyclonic |
Vishakhapatnam, AP |
00 UTC on 09 October 2014 |
| Phailin (October 2013) |
Deep depression |
Gopalpur, Odisha |
00 UTC on 09 October 2013 |
| Sidr (November 2007) |
Deep depression |
Bangladesh coast |
00 UTC on 12 November 2007 |
Table 3.
Model simulated track errors (in km), absolute MSW error (in m/s) and absolute MCP errors (in hPa) for all five ESCSs.
Table 3.
Model simulated track errors (in km), absolute MSW error (in m/s) and absolute MCP errors (in hPa) for all five ESCSs.
| |
Day-1 |
Day-2 |
Day-3 |
Day-4 |
Mean Errors
(using 3 hourly data) |
| Track errors (in km) |
| Sidr-2007 |
53 |
196 |
489 |
1282 |
356 |
| Phailin-2013 |
175 |
72 |
74 |
105 |
132 |
| Hudhud-2014 |
77 |
94 |
269 |
285 |
165 |
| Fani-2019 |
150 |
138 |
25 |
129 |
101 |
| Amphan-2020 |
114 |
393 |
677 |
677 |
392 |
| Mean errors |
114 |
179 |
307 |
496 |
229 |
| MSW errors (in w/s) |
| Sidr-2007 |
0.7 |
1.7 |
5.9 |
18.5 |
7 |
| Phailin-2013 |
1.8 |
27.5 |
10.1 |
8.5 |
13.9 |
| Hudhud-2014 |
10.1 |
7.4 |
0.4 |
3.5 |
6.7 |
| Fani-2019 |
12 |
6.1 |
6.9 |
21 |
9.1 |
| Amphan-2020 |
17.4 |
3.7 |
11.8 |
1.5 |
12.9 |
| Mean absolute errors |
8.4 |
9.3 |
7 |
10.6 |
9.9 |
| MCP errors (in hPa) |
| Sidr-2007 |
8 |
9 |
22 |
39 |
14.6 |
| Phailin-2013 |
4 |
40 |
14 |
3 |
17 |
| Hudhud-2014 |
13 |
2 |
4 |
4 |
7.7 |
| Fani-2019 |
13 |
10 |
6 |
23 |
10.6 |
| Amphan-2020 |
23 |
7 |
14 |
12 |
19.1 |
| Mean absolute errors |
12.2 |
13.6 |
12 |
16.2 |
13.8 |
|
Disclaimer/Publisher’s Note: The statements, opinions and data contained in all publications are solely those of the individual author(s) and contributor(s) and not of MDPI and/or the editor(s). MDPI and/or the editor(s) disclaim responsibility for any injury to people or property resulting from any ideas, methods, instructions or products referred to in the content. |
© 2024 by the authors. Licensee MDPI, Basel, Switzerland. This article is an open access article distributed under the terms and conditions of the Creative Commons Attribution (CC BY) license (http://creativecommons.org/licenses/by/4.0/).
