1. Introduction
Initially conceptualized to examine the decline of post-industrial Western cities, “shrinking cities” have become ubiquitous in literature about Japan’s urban dynamics in the 21st century (Yahagi, 2009). Indeed, a majority of its localities has been coping with shrinkage for at least 15 years, leading to a multiplication of abandoned spaces and infrastructures (Uto, 2012, 2013, 2014, 2018). Approximately three-quarters of all Japanese municipalities lost inhabitants between 2005 and 2020, and the few places that consistently gained residents are situated within the country’s main metropolises. Even parts of Tokyo are shrinking, and there is “no truly booming city” in today’s Japan (Hattori et al., 2017: 2). The driver behind this phenomenon is depopulation: with an ongoing deficit of births relative to deaths not balanced with positive migration rates, the number of inhabitants may plunge from 127 million in 2008 to barely 100 million by 2050 according to the projections of the National Institute of Population and Social Security Research of Japan. Covid-19 has only accelerated the country’s transition into degrowth (Hoshino, 2021). Therefore, the central question of current research on Japanese cities is not to wonder whether they will shrink or not, but whether they will avoid full-scale collapse.
In this respect, Japan provides one of the most relevant contexts to examine “a future of globally-extensive decline” (Ohashi & Phelps, 2020). The correlation between depopulation, housing vacancy and impoverishment has especially garnered the attention of geographers and economists. Their works highlight that a stronger pace of shrinkage systematically implies more decrease in land prices (Kubo & Yui, 2020; Saito, 2014; Suzuki & Asami, 2017, 2020; Tamai et al., 2017; Uto et al., 2023). An overall depreciation of the value of individually-owned properties ensues. However, one limitation of existing literature concerns its geographical scope: the intensity of shrinkage and its impacts on the housing sector varies considerably from one locality to another (Baba & Asami, 2017; Iwasaki, 2021; Ohashi & Phelps, 2020), but Japanese regions have not received equal attention. Indeed, most studies that categorize the factors leading to different trajectories of decline (Kato, 2023; Kawabe & Watanabe, 2020; Ohashi & Phelps, 2020; Sakamoto et al., 2017), or analyse the impacts of shrinkage on the built environment and real estate markets (Baba & Hino, 2019; Iwama et al., 2021; Kanayama & Sadayuki, 2021; Kubo & Yui, 2020; Suzuki & Asami, 2017; Usui & Perez, 2022), base their fieldwork upon cases situated either in Tokyo or a non-metropolitan municipality. Metropolitan-level studies centred on cities as big as Osaka and Nagoya are absent from this stream of investigations.
Our study fills this gap to clarify changes of the Housing Asset Value (HAV) in the Kansai metropolitan area (Osaka, Kyoto, Hyogo, Nara and Wakayama prefecture) by re-applying a regression model that Uto et al. (2023) elaborated to project differentiations in deflation of the HAV for the Tokyo Metropolitan Area. The Kansai metropolitan area has around 20 million habitants, and World top 10 rank metropolitan area, so we defined such class metropolitan area (like Dhaka, Beijing, and Mumbai) is Tier 2. Also, we defined Tier1 world-class over 30million habitants like Tokyo metropolitan area (Delhi and Shanghai reach soon) which has 36 million and is the biggest metropolitan area (The World’s Cities in 2018, United Nation). The Kansai metropolitan area accounts for a gradually decreasing percentage of Japan’s population and GDP, which illustrates its difficulties to resist a polarization of political and economic power by Tokyo (Kidokoro et al., 2021). For these reasons, the inner-outer distribution of decline, obvious in Tokyo’s case (Ohashi & Phelps, 2021), is less evident here. These regional differences must be better understood if we want to improve the shrinking cities problem in Japan and beyond.
2. Literature Review
Japan’s transition into aging and decline could be foreseen as early as in the 1980s (Hattori et al., 2017). But one could hardly predict that, out of a lack of demographic growth, the market downturn precipitated by the burst of the Bubble in 1990 would be prolonged into a recession which the country unevenly recovered from (Matsutani, 2006; Sorensen, 2011; Suzuki & Asami, 2020). According to data collected by the MLIT, land prices of residential areas throughout the country in 2019 barely represented 50 % of their 1989 nominal value. A state of the art about the geographies of territorial development and residential markets in Japan documents a transition from generalized growth to extensive decline, where three stages can be discerned.
Until the mid-1990s, skyrocketing land prices, combined with the spread of car-based mobilities, led to a peculiar “doughnut effect”: households seeking access to homeownership had to go farther from downtown areas to purchase land, hence a demographic decline occurring inside and near the business districts of large cities (Miyazawa & Abe, 2005). The latter registered a rise in the day-to-night population ratios because employment, especially in the service sector and within the Tokyo region, did not relocate significantly to “edge cities” in spite of plans facilitating office dispersion (Phelps & Ohashi, 2020; Uesugi, 2021). Meanwhile, hollowing-out became visible in the cores of mid-size cities and capitals of non-metropolitan Prefectures (Iwama et al., 2021; Iwasaki, 2021).
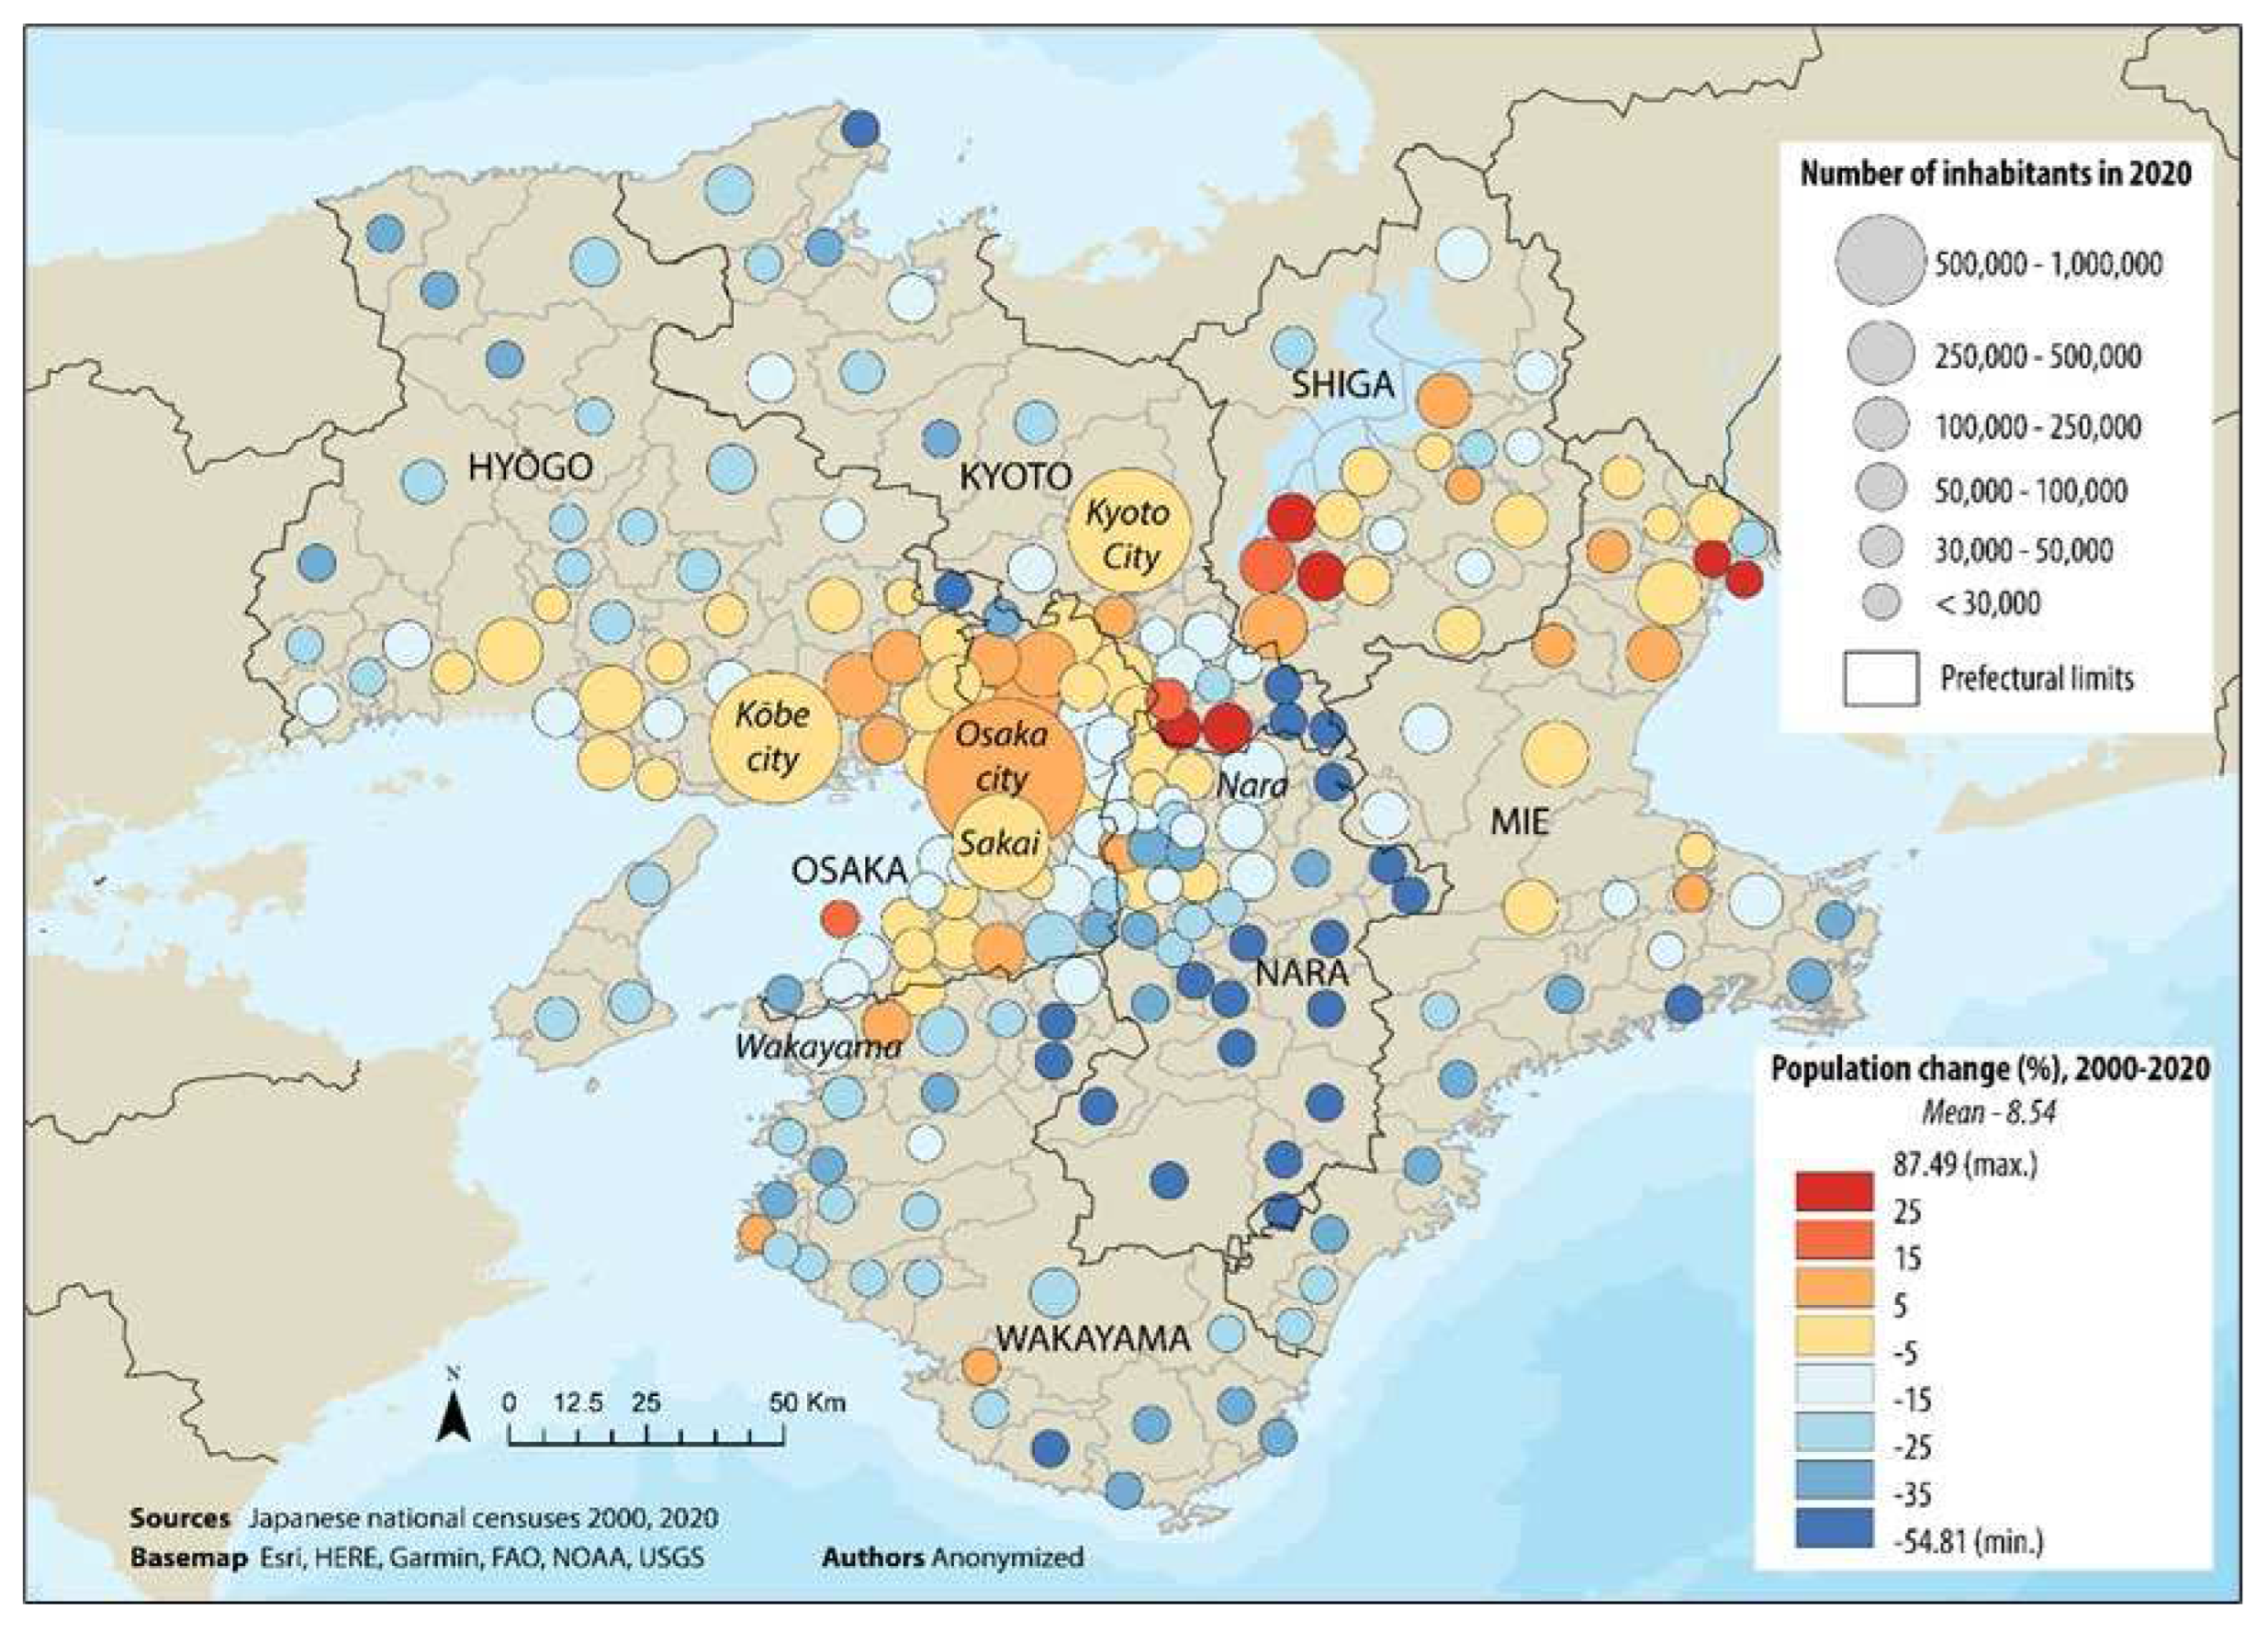
The early 2000s to mid-2010s witnessed a reversal of growth dynamics within metropolitan areas (
Figure 1), one of the distinctive features of Japan’s contemporary urban dynamics (Buhnik, 2017; Ohashi & Phelps, 2021; Suzuki & Asami, 2017; Yui et al., 2017). The game-changing Urban Renaissance Special Measures Law was voted in 2002, with the aim to enhance the global competitiveness of Japan’s economy after a decade of stagnation (Saito, 2013; Tsukamoto, 2012). It promoted transit-oriented redevelopment and large-scale renewal projects conducted within selected perimeters (Aveline-Dubach, 2014; Liu et al., 2022). Thanks to a relaunch of condominium construction, the wards of cities with over 500,000 inhabitants began to attract migrants again, capitalizing on the newfound affordance of their housing supply for certain classes (Kidokoro et al., 2023; Machimura, 2021; Miura, 2021; Wakabayashi & Koizumi, 2018). On the contrary, decline worsened in rural margins, regional cities (ranging between 50,000-400,000 inhabitants) and, within metropolitan regions, outlying municipalities, due to a “double demographic disequilibrium” (Matanle & Sato, 2010): out-migrations of working-age adults reinforce natural degrowth. The subsequent aging of households who remain in suburbs mirrors a restructuring of the intermingled political, economic and social dimensions behind the post-war success of suburbia (Ohashi & Phelps, 2020). Frequently criticized because of their sprawl and bed town atmosphere, Japanese suburbs now come up as less adapted to a society where singles outnumber the male-breadwinner household (Fujii & Oe, 2006; Kubo & Yui, 2011; Yabe, 2018; Yoshida, 2010).
The 2010s do not witness major shifts in the abovementioned trends. But the administrations’ continuing “push towards fiscal devolution while carrying out focused urban revitalization” (Tsukamoto, 2011) contributed to the political construction of shrinkage as a spatial expression of Japan’s widening inequalities (Hattori et al., 2017). First, the “back-to-the-city” movement, under the influence of real estate securitization, has bolstered Tokyo and the cores of few metropolises (Aveline-Dubach, 2014; Kubo, 2020); property investments primarily target neighborhoods with high-end commercial and service activities. In mid-size cities, by contrast, the wilful application of compact city schemes did not entail strong downtown revitalization, with few exceptions (Sakamoto et al., 2017). Second, discourses promoting compact city as a solution to fight sprawl actually undermine the sustainable nature of many suburban or rural communities (Galloway, 2009; Okada, 2022). The 2014 Vacant Houses Special Measures Act has equipped localities with more tools to tear down derelict houses; but problems now lie in a lack of financial, technical and human resources to achieve such targets (Saito, 2014). Therefore, the fabric of Japan’s cities displays intricate patterns of devitalization and dedensification (Hirayama, 2005; Liu et al., 2022). As municipalities struggle to keep their number of taxpayers afloat, they welcome mixed-use projects that incorporate ecological and digital innovations, often several blocks away from obsolescent neighborhoods. Consequently, within any municipality, urban perforations born out of an accumulation of vacant lots coexist with scrap-and-build processes or new allotments (Usui & Perez, 2022). There is thus a heightened risk of creating a regional oversupply of housing.
This supply/demand imbalance has soared in Japan’s formerly booming suburbs (Kanayama & Sadayuki, 2021; Sakai, 2014; Suzuki & Asami, 2020) and causes the overall depreciation of property values (Kubo, 2020). Put in comparative light, nonetheless, the correlation that Japanese literature makes between depopulation, shrinkage and land/real estate devaluation seems more straightforward than in other mature countries, where the “cold market” phenomenon exists but remains embedded in wider contexts of housing price inflation. In France for example, de-industrializing regions and rural margins that have undergone population decline and a rise in vacancy for decades, can still register high levels of investments stimulated by a steady nationwide inflation of housing markets (Le Goix et al., 2020). Meanwhile, the surge of foreclosures after 2008 in the USA hit the disadvantaged downtown areas and inner suburbs of post-fordist cities. Abandonment of ownership rights nurtures a neglect of properties and puts a downward pressure on local housing values (Suzuki et al., 2022). Yet, this depreciation precisely attracts acquirers who bargain on the profitability of “distressed real estate” (Nussbaum, 2019). Such opportunistic investments, encouraged by a scarcity of affordable housing on a national scale, have become rather rare in Japan. Despite the dearth of research about buyers of land and houses in depopulating areas, we can infer that their numbers are not enough to offset hollowing-out processes. As noted by Suzuki et al. (2022), unmaintained empty houses generating negative externalities in Japan are not the outcome of foreclosures: it is the by-produce of inheritance issues. Children of owners are often not interested in moving into their parents’ home after the latter have entered care facilities or passed away (Hino et al., 2022). Barely 20% of heirs are willing to engage in rehabilitations of houses with almost no chance to be resold or rented (Ministry Land, Infrastructure & Tourism of Japan, 2020).
To sum up, there is now a remarkable body of works about the intermingled issues faced by declining residential neighborhoods in today’s Japan: their aging is a sign they are not among the most attractive places of a given city. They are subsequently at an extreme risk of experiencing long-term vacancy and contribute to a decrease in the average value of existing assets within the city’s boundaries. However, in spite of gradual attention paid to spatial variegations, most case studies, whether they adopt an inter-municipal approach or focus on one municipality for reiterated fieldwork, are overwhelmingly directed towards the biggest cities like Tokyo. So, we believe our study is remarkable in the shrinking cities study field.
3. Research Design and Methods
3.1. Research Questions and Targeted Study Area
Uto et al. (2023) predicted that the deflation of the HAV will reach 94 trillion JPY (667 billion US dollars) by 2045 for the Tokyo region and exceed 10 million JPY (around 71,000 USD, 1USD=141JPY, As of December 2023) per household on average, with detrimental effects on citizens and urban planning in three ways: 1. An immobility of aging homeowners, who cannot rely on asset-based welfare logics to cover their care needs; 2. Impediments to compact city policies that require resources to coordinate demolitions and relocations; 3. A drastic reduction of local governments’ tax income. But what about metropolises like Osaka, Nagoya, or Fukuoka, whose size is on par with Paris or Chicago? Squeezed between a scholarly emphasis on Tokyo and a political prioritization of rural revitalization, they are quasi absent from literature about uneven spatial development in a post-growth context. Fleshing out their reconfigurations would yet provide original answers to these two questions:
1) In Tier 2 metropolises (Kansai) compared to Tier 1(Tokyo), are depopulation and decrease in the HAV distributed same pattern or not?
2) In Tier 2 metropolises (Kansai), are the effects of the HAV deflation more severe than Tier1(Tokyo), both in percentage and volume of financial loss?
Both Tokyo and Kansai qualify as large metropolitan areas with the country’s highest levels of commuting. The main distinctions stem from population size and monocentric/polycentric structures. Greater Tokyo gathers nearly 36 million inhabitants in 2022 (on a surface of about 13,452 km²), against 19.2 for Kansai. Inside Greater Tokyo, the 23 wards of Tokyo city (2,194 km²), which hold 9.2 million residents in 2022, are municipalities inside the Tokyo Prefecture (14 million inhabitants). Tokyo city is then composed of sub-centres which consolidate a dense spoke-hub transit network leading to satellite cities, each acting as administrative capitals of Tokyo’s neighbouring Prefectures: Yokohama (3.72 million), Saitama (1.26 million) and Chiba (971,000). By comparison, Osaka city, on a surface area of 225 km², reached almost 2.7 million dwellers in 2022, in the middle of a coastal plain that is narrower than the Kanto plain, upon which Tokyo expanded. It lost its rank of second most populated city to Yokohama by the 1980s. The cities of Kobe, Kyoto and Nara respectively include 1.6 million, 1.47 million and 367,000 inhabitants and are Prefectural capitals, while Sakai (820,000) belongs to Osaka Prefecture (
Figure 1).
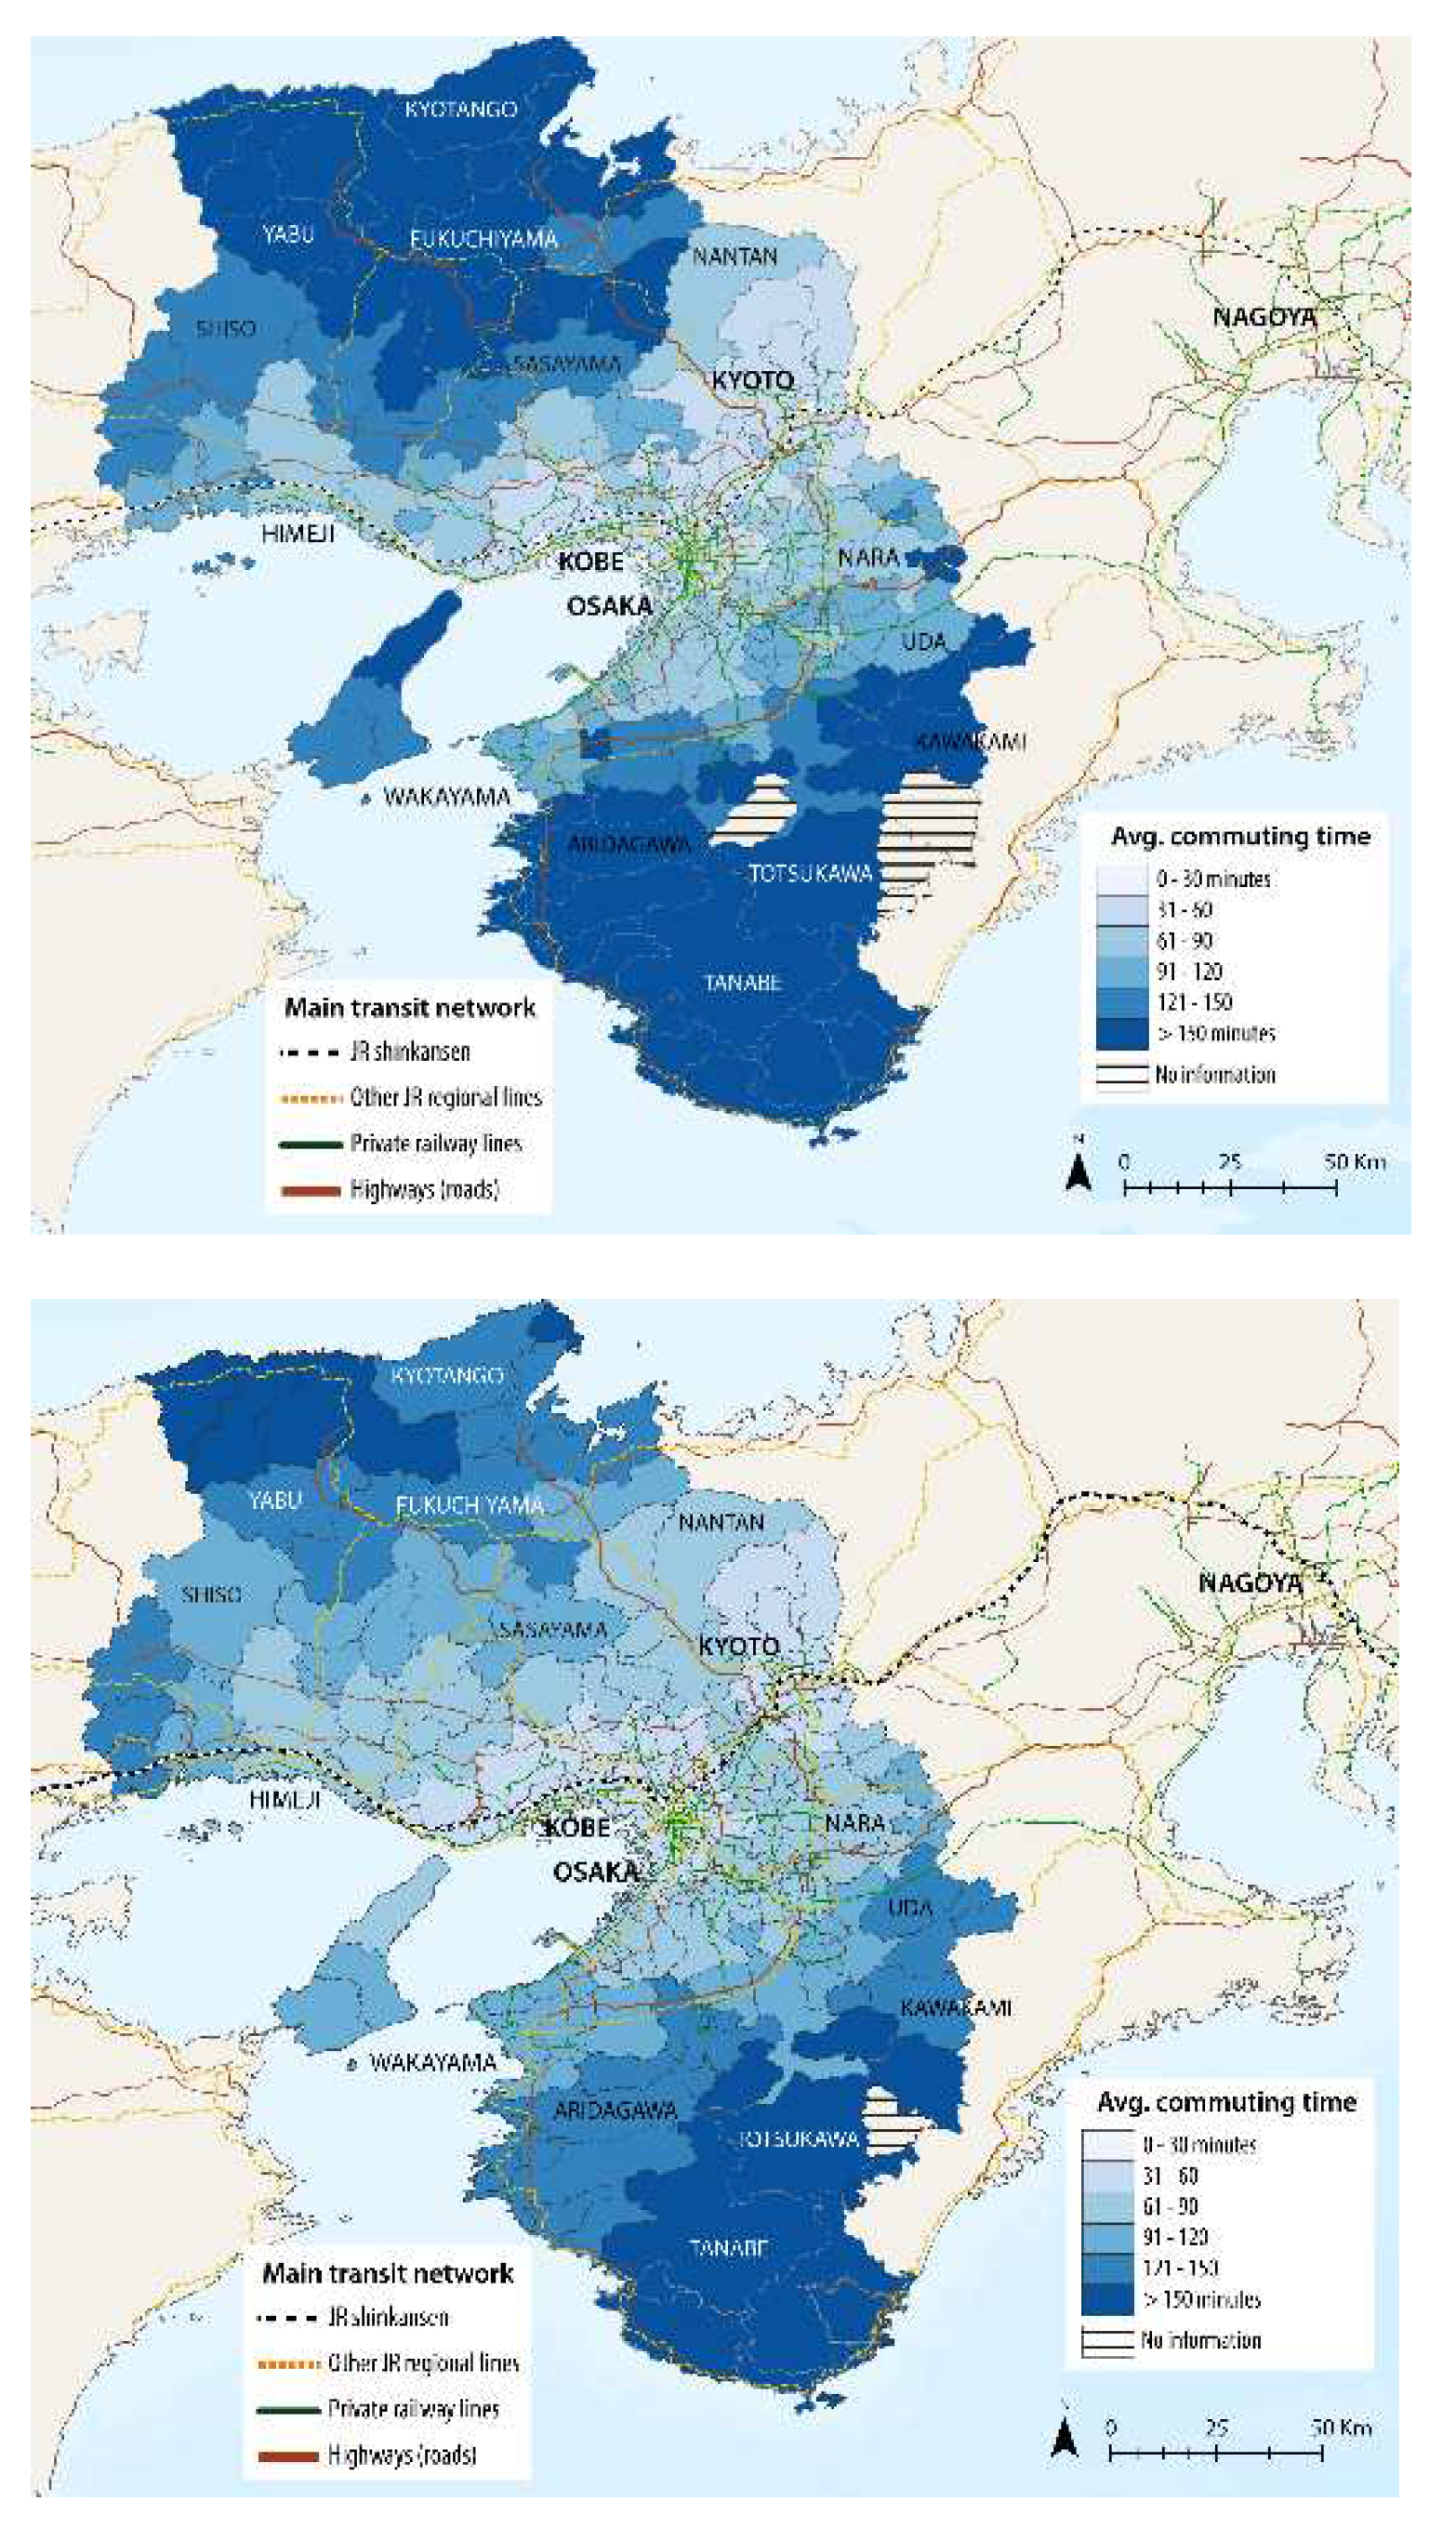
Train commuting still amounts to around one half of daily trips, in a region famous for having pioneered the creation of residential suburbs under the umbrella of private railway operators (Nozawa & Lintonbon, 2016).
Figure 2 is a result of our measurements of average commuting times from each municipality’s city halls to the stations closest to the CBDs of Osaka, Kyoto and Kobe, relying on data from Google Maps (for car) and “Yahoo! Transfer Guide” (for train). We assumed that the majority of commuters use the main station of their municipality of residence (close to the city hall in general), at 9.00 a.m. on weekday. Then we added 10 minutes corresponding to average commuting time from home to the municipality’s main station or the city hall (for travel by car), and 10 minutes for the travel from a CBD station to one’s workplace. These elements invite us to carefully approach the suburban shrinkage phenomenon highlighted by academic literature in
Section 2, Literature review.
3.2. Data Collection and Methods
To address the aforementioned questions 1) and 2), we apply a year-by-year municipal-level estimation of the impacts of population change on the HAV from 1984 to 2045, which Uto et al. (2023) formulated for the study the Tokyo Metropolitan Area. It is based on yearly assessments, by the Ministry of Land, Infrastructures, Transport and Tourism (MLIT), of the average land prices for residential areas (in JPY/m²), which are then multiplied by yearly records of the total surface of land for residential use (in m²), at the scale of each existing municipality. Summary records of fixed asset prices by the Ministry of Internal Affairs and Communications are updated every year to calculate municipal property tax, while the size of the residential area subjected to property tax is checked by each municipal government. Admittedly, these data are not fit for a simulation of the future conditions of residential markets, which are highly heterogeneous on the sub-municipal level; but they are relevant for an estimation of the wealth that can be derived from the estimated value of housing properties through tax (for municipalities) or transactions (for households). Moreover, the value of individually owned buildings is still considered negligible compared to the value of land in most cases, despite attempts at lengthening the durability of new constructions. This is why most property transactions on second-hand housing markets still have their worth calculated based on the quality of the land for residential use that is resold—what a housing asset really refers to—rather than the real estate that may be atop.
If we consider the 226 municipalities that belong to the five Prefectures (Osaka, Kyoto, Hyogo, Nara and Wakayama prefecture) covering the Kansai Metropolitan Area, then the amount of housing asset values i on year j is calculated as follows:
V: Housing asset value (JPY)
p: Standard land price for residential use (JPY/m2)
s: Residential area subjected to property tax base by each municipality (m2, 1984–2021: real, 2022–2045: assumed to remain similar from 2022 onwards, due to a curb on new allotment sites and an increase in abandoned properties that are not subjected to taxation)
i: Municipalities (1–226)
j: Year (1984–2021: real, 2022–2045: projected)
In order to project standard land prices, conceives a regression model which adopts and adapts Hashimoto et al. (2020)’s verification of Glaeser & Gyourko (2005)’s study of the durability of housing values in declining urban contexts. They state that land and housing prices respond more sensitively to phases of population decline than phases of population increase and are now more affected by depopulation than changes in age structure (aging of homeowners). This leads to the formulation of the following equation:
where
stands for publicly assessed (residential) land prices in municipality i at year t
: Total Population in municipality i at year t.
is a dummy variable that takes a value of 1 when the total population change is positive and 0 if negative; , a dummy variable takes a value of 1 when the total population change is negative and 0 if not.
is a dummy variable takes a value of 1 when the municipality i’s population exceeds 500,000 inhabitants at year t, and 0 if it is inferior. On the contrary, takes a value of 1 when the municipality i’s population is under 500,000 inhabitants and 0 if over.
refers to the logarithm of land price in 2000 in municipality i.
and are intended to control the administrative position of municipalities. According to the Law on Local Autonomy, cities populated with more than 500,000 denizens indeed become designated cities: they are divided into wards (akin to the boroughs of New York or Paris) and are delegated planning functions normally performed by Prefectural governments in Japan, which gives them more leeway to implement housing vacancy countermeasures or other initiatives to support land markets. serves to control the socioeconomic condition of each municipality at the start of the estimation period.
Population data are extracted from the Portal site of statistics managed by the Japanese government: it compiles the results of exhaustive population censuses (released every five years) and projections made by the National Institute of Population and Social Security Research until 2045. It thus provides us with information about inhabitants and households from 1984—when the land price bubble took momentum—to 2022 for real figures, 2045 for projections. In this respect, the strength of equations (1) and (2) lies in their reproducibility, as they only use complete data series freely open to Japanese- and English-speaking users, covering every Japanese municipality since the 1980s. To maintain statistical continuity after municipal mergers occurred, changes in land prices and residential area size are adjusted by using the method of weighted means.
,, and
correspond to the correlation coefficients we obtained by running a regression analysis where land price changes are the explained variable, while yearly rates of population change, and logarithm of land prices in big and small cities are the explanatory ones, with an estimation period going from 2000 to 2022 (date of last records of land price data). We observe the relationships on a yearly basis, but also up to seven-year moving averages, so as to better analyze the medium-term influence of population dynamics over land prices, as shown by
Table 1. It also serves to smooth out the price spikes eventually induced by new housing projects put up for sale on the smaller markets of rural municipalities.
Compared with the results obtained by Uto et al. (2023),
Table 2 shows that the same protocols lead to positive correlations between land price change and population change at the 6- and 7-year moving averages, with adjusted R-square in the 0.45-0.49 range, against 0.30-0.37 at the 4- to 5-year moving averages in the case of Tokyo. Correlation coefficients for the parameters of increasing/decreasing rate of population by municipality are yet more moderate, even if their values rise as the moving average period lengthens: 0.25-0.35 and around 0.2 respectively for Kansai; against values of 0.5-0.8 and 0.77-0.78 for Tokyo. In both cases, figures for the parameters of land price according to city size are nonetheless almost identical: an extremely slight correlation of about -0009 for Kansai, against -0.0004 to -0.0006 for the Tokyo region (Uto et al., 2023: 6). We can interpret these results as an outcome of a higher heterogeneity in the profiles of Kansai municipalities and as a possible influence of tourism on real estate production in rural localities, which are famous for their cultural heritage and natural resources (e.g., hot springs).
4. Findings
4.1. Aggregate Results
We move on with the estimation of future land prices and housing asset values on a municipal level, by applying the parameters obtained at the 7-year moving average to Equation (2).
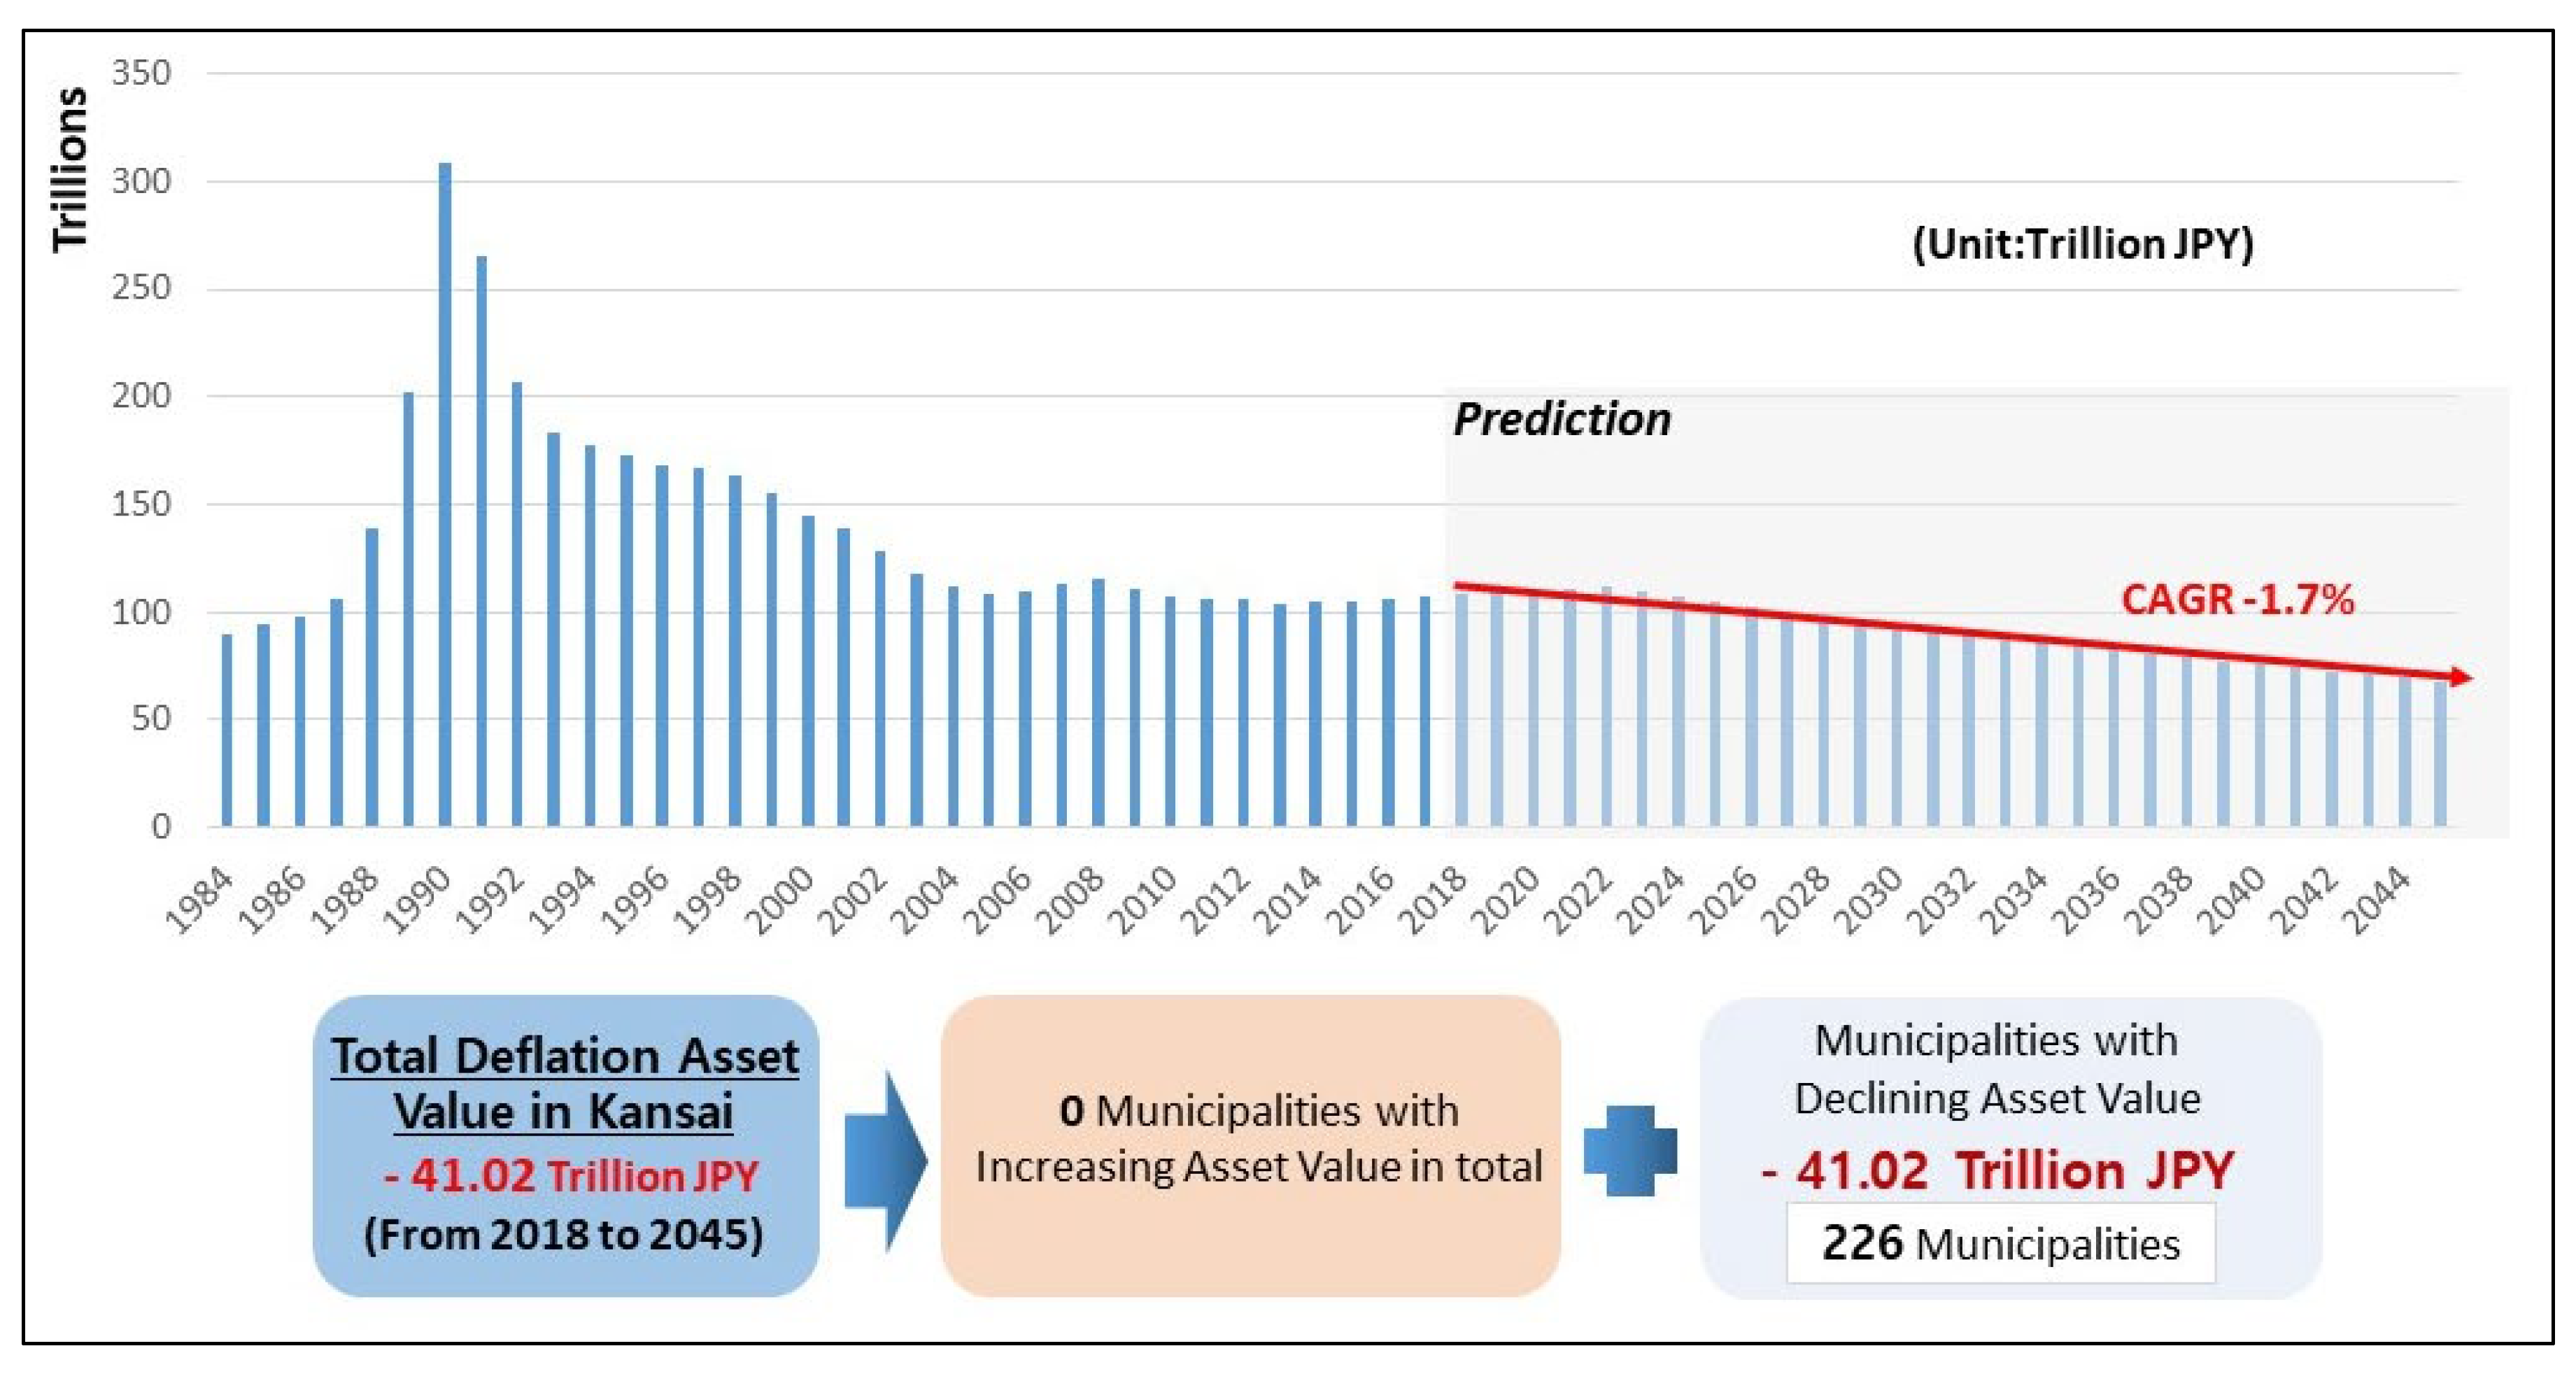
Figure 3 depicts the aggregate results: although real data are available until 2022, we calculate the difference between recorded values and estimated values beginning in 2018, in order to more accurately compare the evolution of the Kansai Metropolitan Area with Uto et al., (2023)’s results for Tokyo.
The predicted total loss in the value of land used for housing in the region, by 2045, would reach a little more than 41.02 trillion JPY (around 298.3 billion USD) according to this simulation. It represents less than one half of the aggregate figures found for Tokyo with the same calculation (-94 trillion JPY, or around 667 trillion USD). The annual rate of decrease is still slightly superior, at 1.7 % (against 1.3 %). With regards to the history of the Tokyo-Osaka balance of power, we see that the residential markets of the Kansai region are already several orders of magnitude behind those of the capital region, indicating that regional gaps have broadened.
4.2. Cartography of Housing Asset Values by Municipality
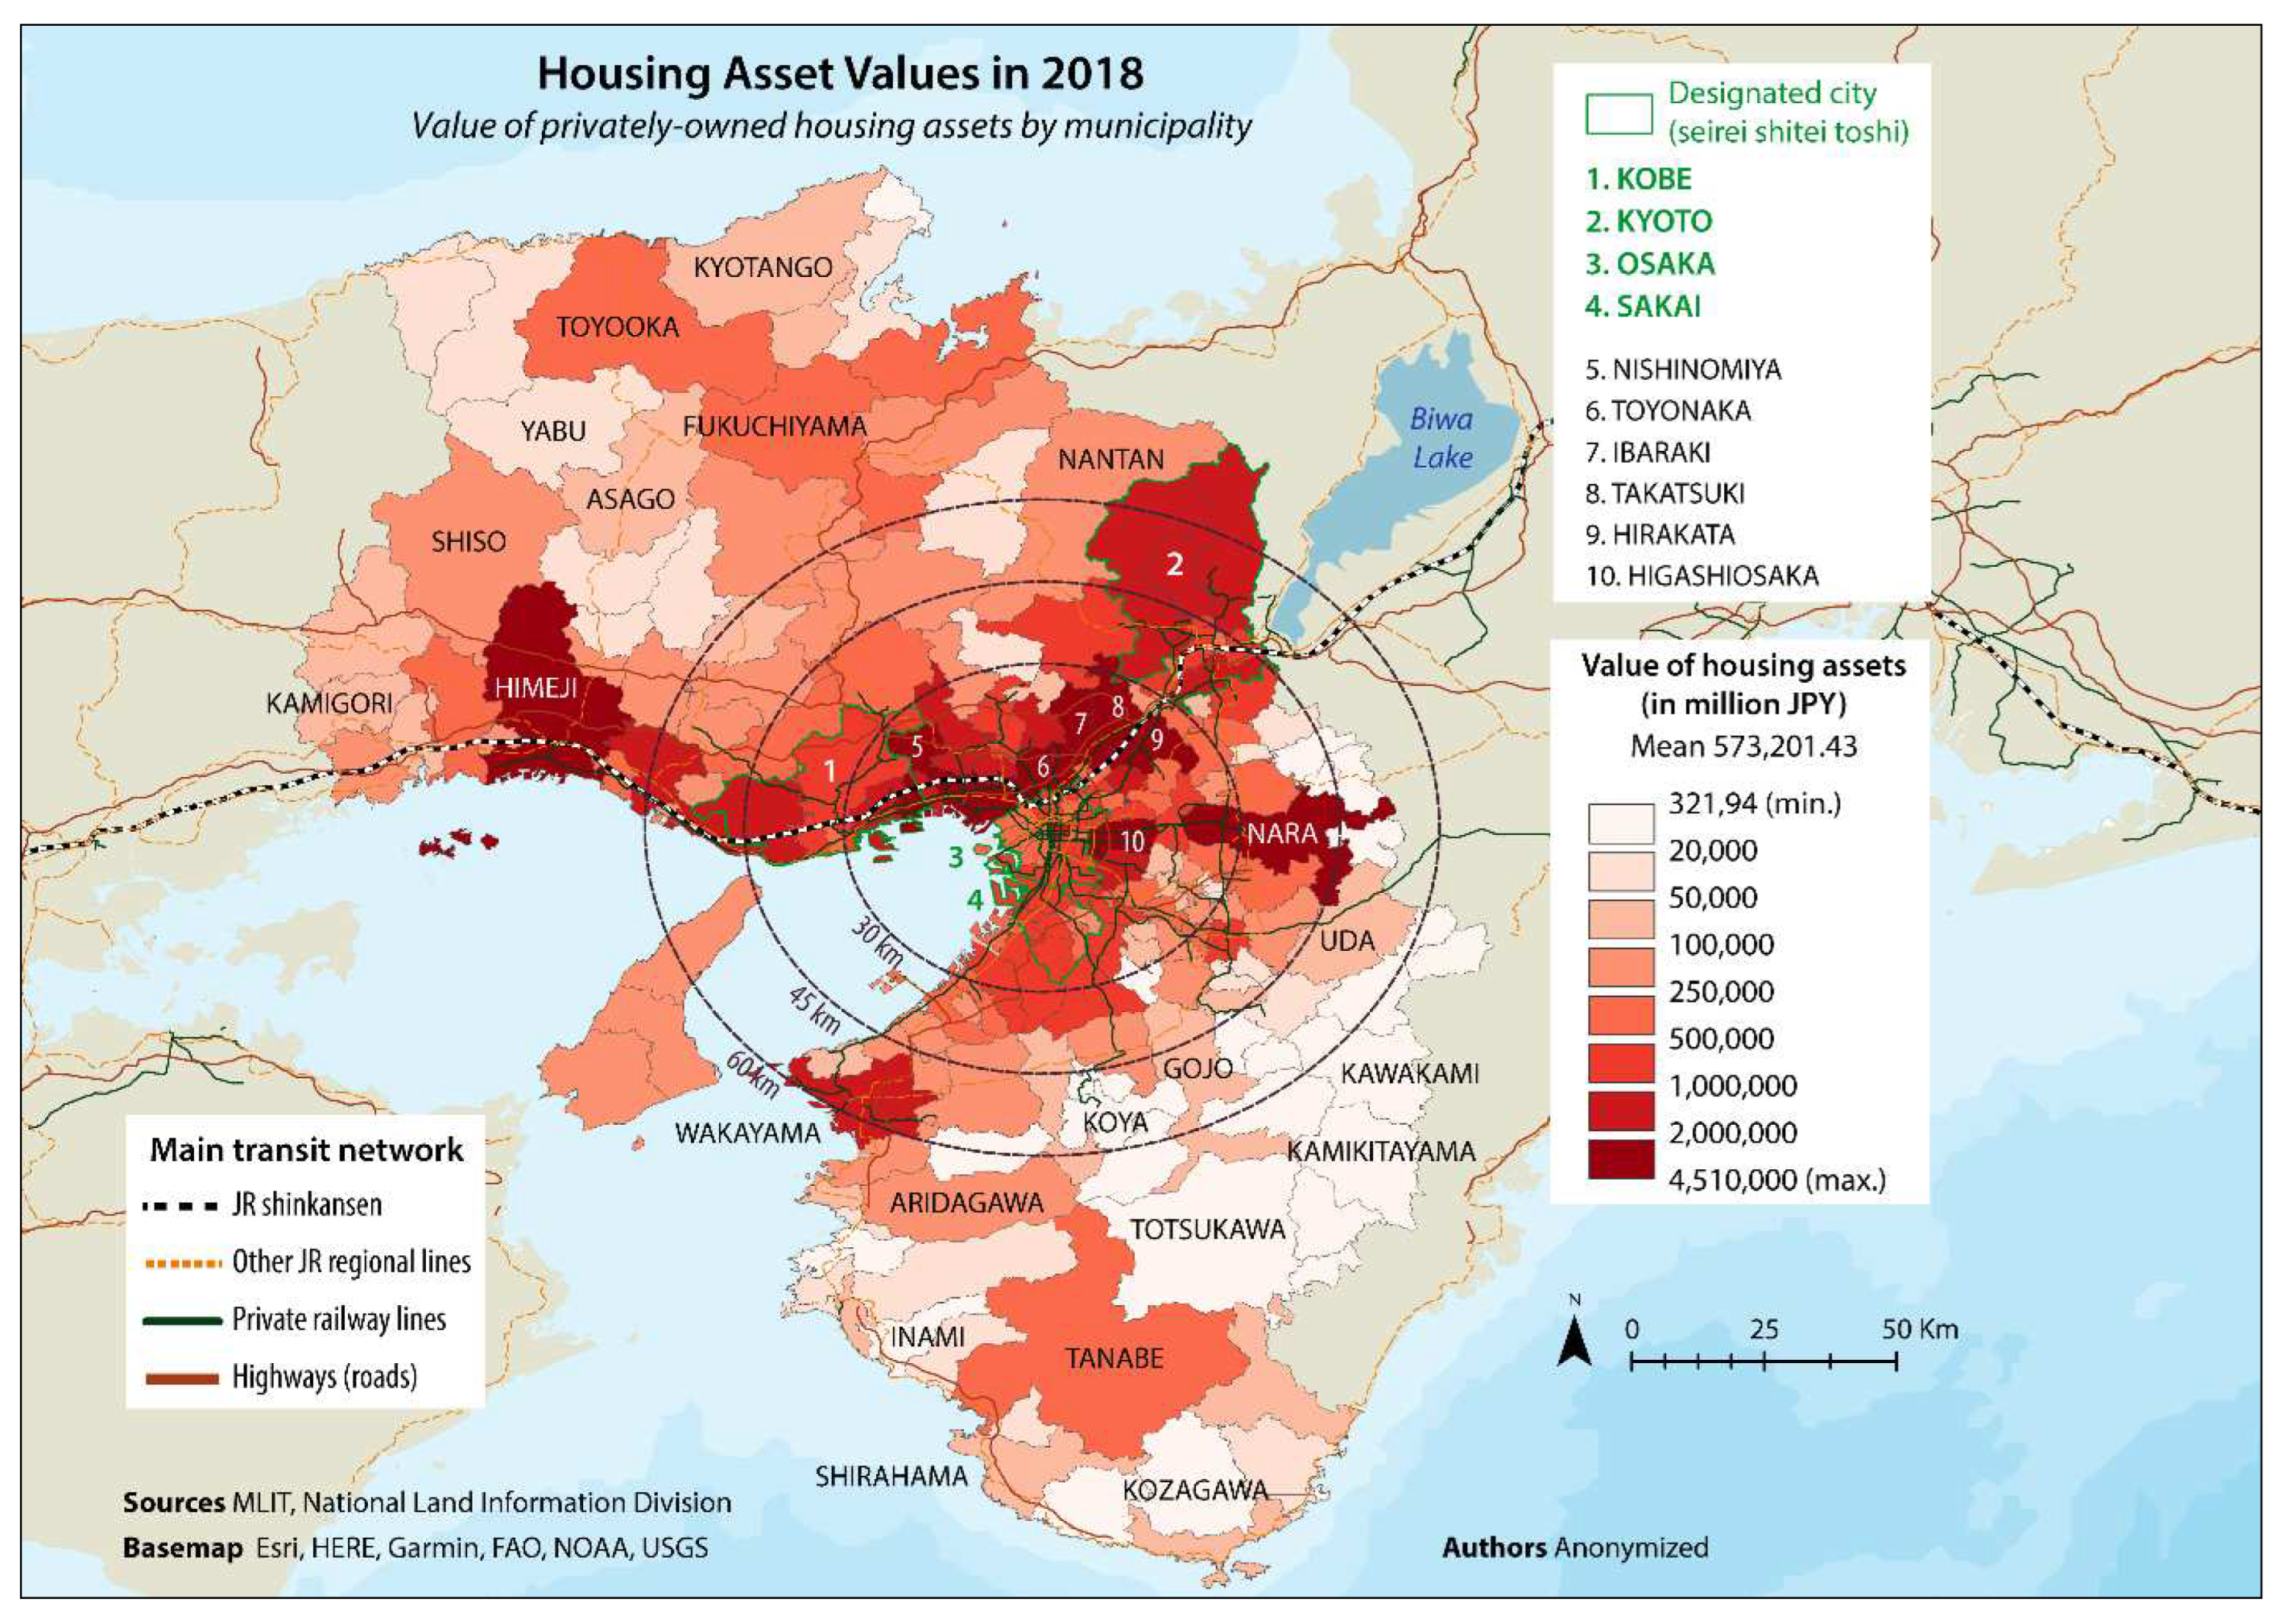
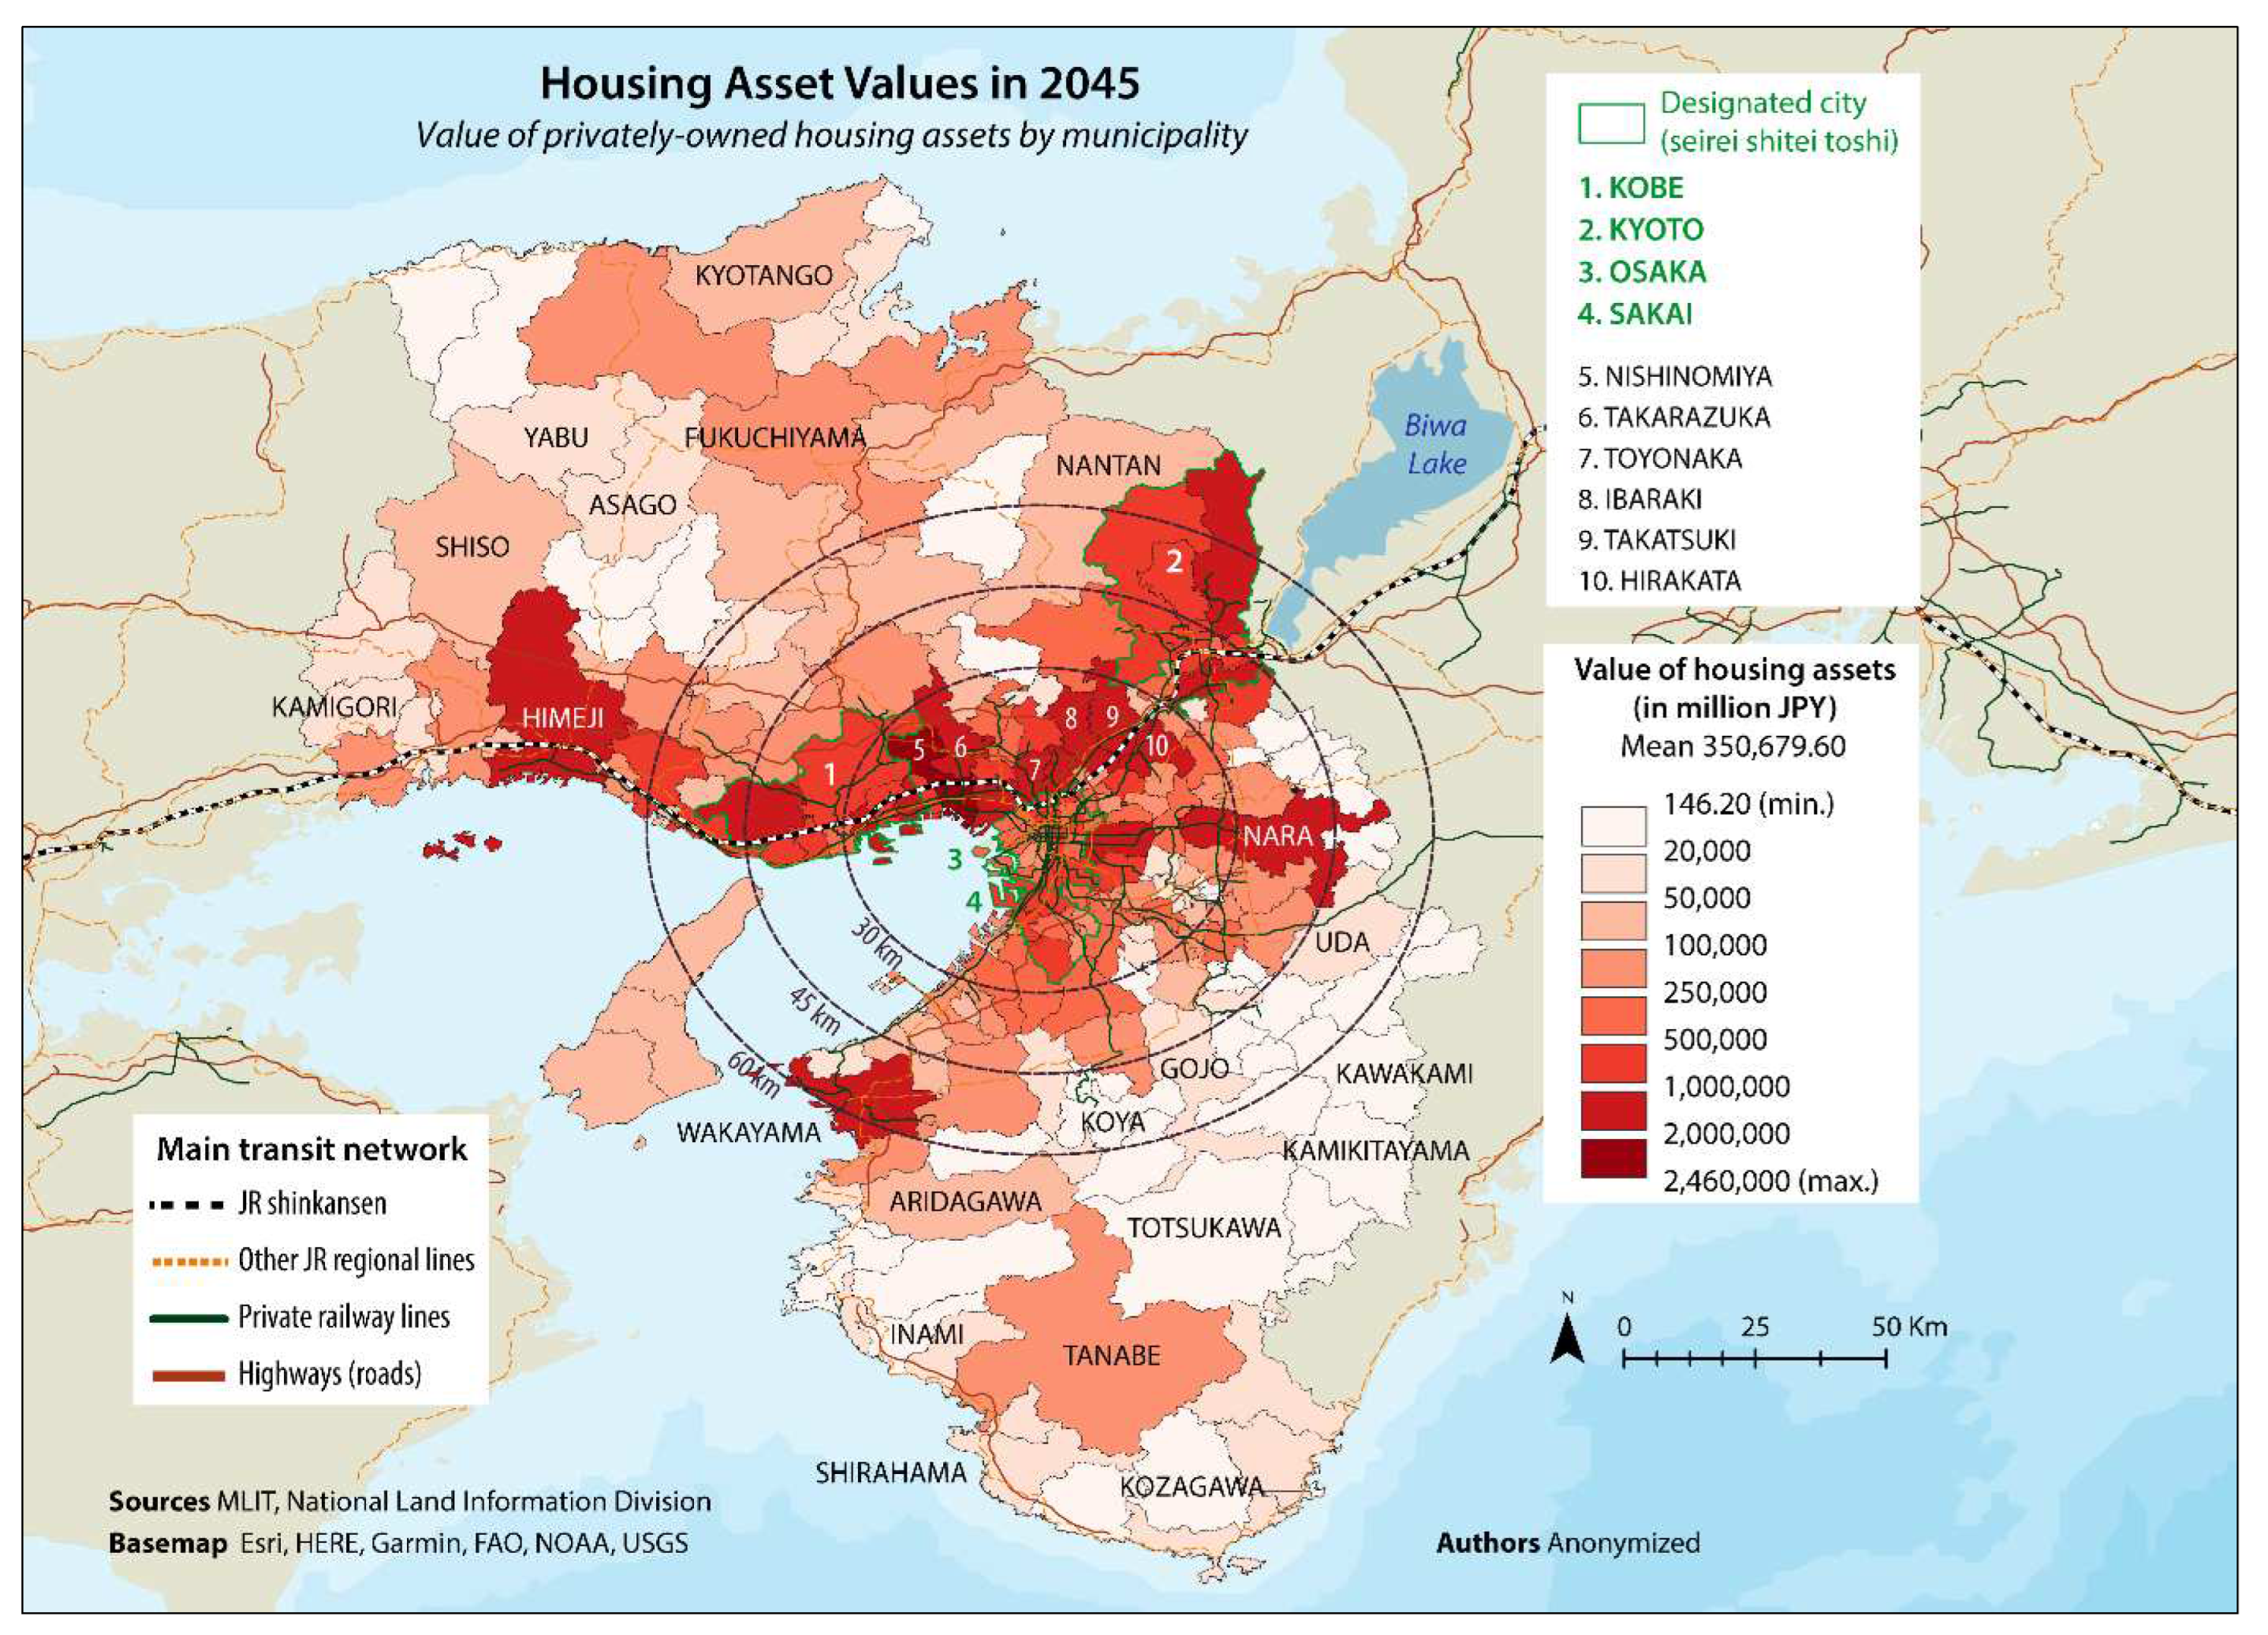
A mapping of total housing asset values on a municipal scale in 2018 and 2045 reveals an unequal distribution of wealth in favour of the region’s main poles (Kyoto, Osaka, Kobe, Nara, Wakayama and Himeji) and their surrounding suburbs, and this hierarchy is lasting (
Figure 4 and
Figure 5).
The same can be said about municipal hierarchies in the Tokyo region; but what distinguishes Kansai is that 1) municipalities with the highest HAV are not all located within a 45 or even a 60-km radius from major employment cores (i.e., Osaka, Kyoto, Kobe); 2) the HAV levels of Kansai’s main poles do not seem considerably superior to several suburbs and even more distant municipalities. However, we must note that the HAV of many rural municipalities is augmented by their sheer geographical size, and that all cities over 500,000 inhabitants are divided into wards that are comparatively tiny. If we add up the value of all wards belonging to Osaka city in particular, the sum slightly exceeds 14 trillion JPY in 2018-2022, while some neighbouring municipalities like Nishinomiya or Takatsuki are in the 2-5 trillion range (
Figure 4 and
Figure 5).
Kidokoro et al. (2021) underscore how, after the stagnation of the 1990s, property values increased again in Tokyo city, owning to a renewed demand for housing and an accumulation of public/private investments backed by the 2002 Urban Renaissance Law. Such gentrification based upon condominium construction, albeit not negligible, has been more moderate in Osaka and primarily fixed itself in the city’s northern wards, around the business hubs of Umeda and Shin-Osaka shinkansen station; recently however, repeated attempts to rebrand Osaka’s image through retail gentrification (Kirmizi, 2017), have accompanied a transformation of the city’s landscape around Nishi, Namba and Tennoji. Residential redevelopments stirred by tourism and rehabilitations after the 1995 earthquake generated population gains for the cities of Kyoto, Kobe and Sakai.
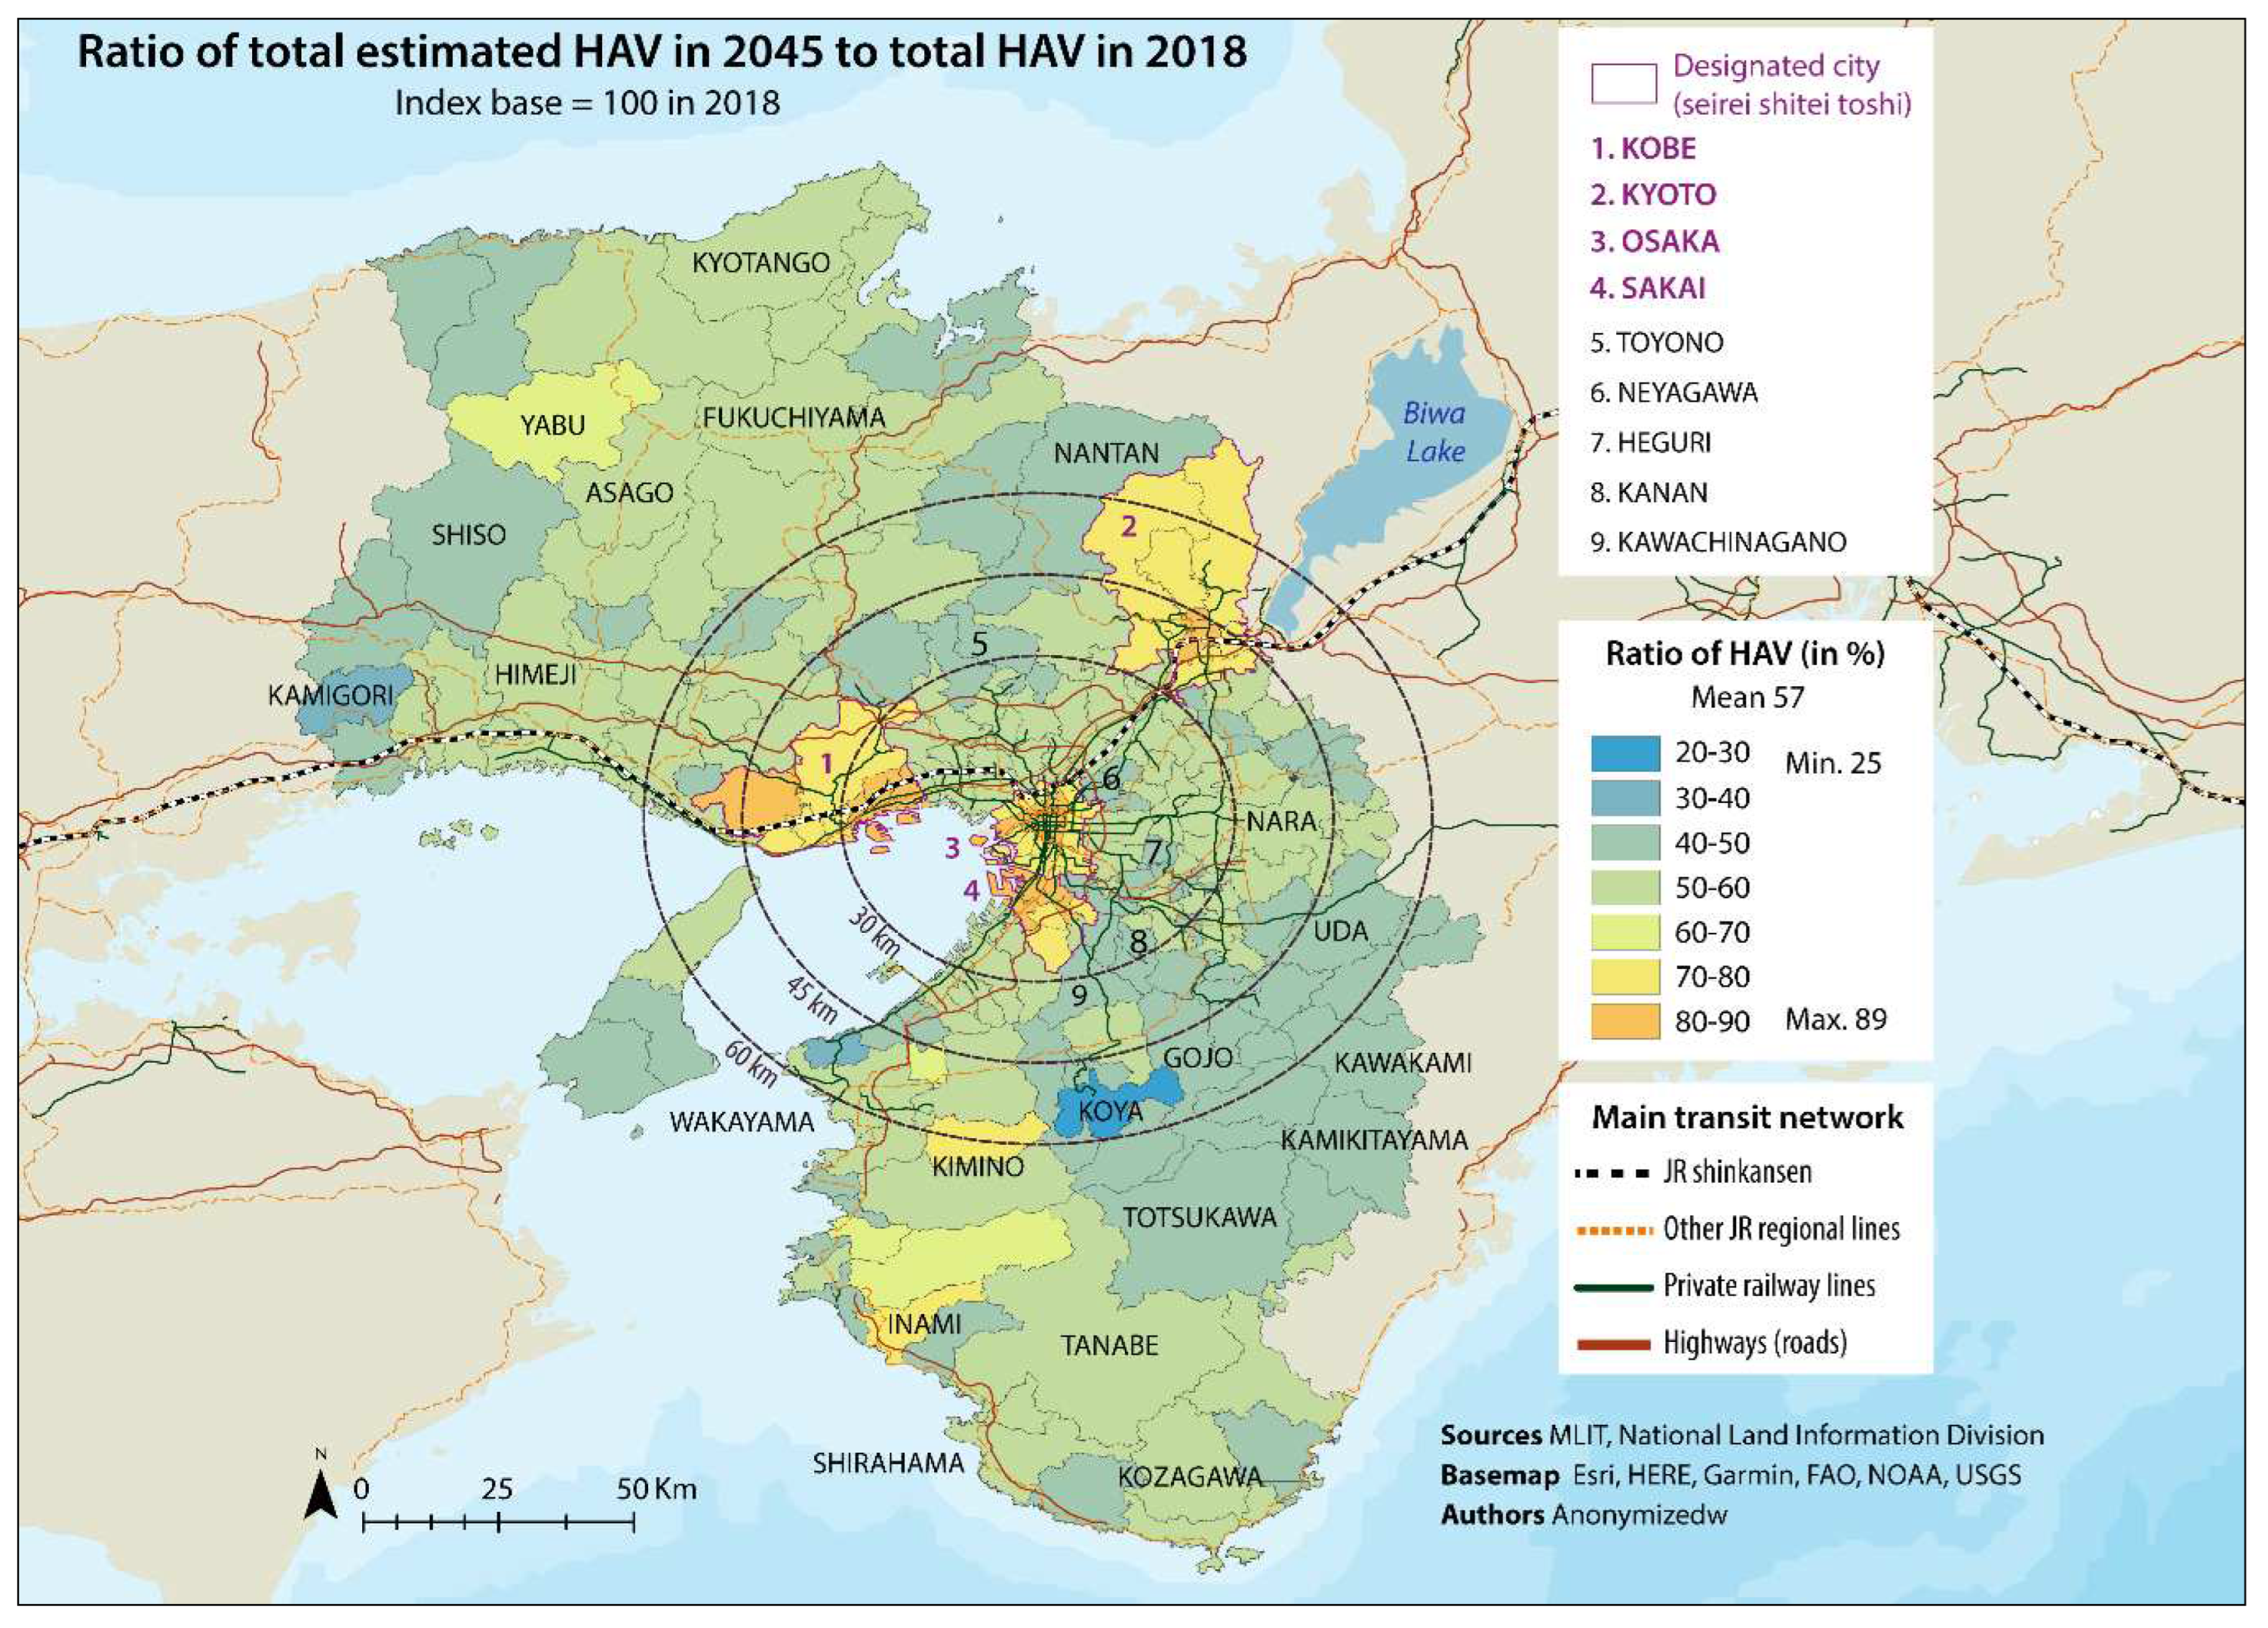
These background elements help us interpret the inter-municipal distribution of estimated the HAV by 2045, expressed as a ratio of their value in 2018 (
Figure 6). According to our calculations, land for residential use in the region’s urban cores, which remain the most demographically dynamic, could retain at least 70-80 % of the value they have as of 2018. By contrast, surrounding municipalities would barely keep 50-60 % of it (on the Osaka Bay and the Sea of Japan, like Kyotango) or even 40-50 %, especially in the South-East of Osaka, the landlocked areas in Nara and Wakayama and the western margins of Hyogo Prefecture.
4.3. Interpreting Differences in Housing Asset Values by Municipality and by Household
Considering the results we mapped, we can provide some hints to the two questions raised at the beginning of
Section 3. First, we asked whether In Tier 2 metropolises (Kansai) compared to Tier 1(Tokyo), are depopulation and decrease in the HAV distributed same pattern or not ?; second, we wonder whether the effects of the HAV deflation more severe than Tier1(Tokyo).
According to Uto et al. (2023), in the case of the Tier 1 (Tokyo metropolitan area), no municipality located beyond a 45km radius of Tokyo’s central business districts should expect to retain more than 40-50 % of their current housing asset values by 2045, so that spatial inequalities in the accumulation and de-accumulation of housing wealth would worsen. The overall picture in Kansai is more complex, since we can discern municipalities staying above the threshold of 60 % beyond a 60-km radius. This is confirmed by our calculation of the average deflation ratio of the HAV by municipality, depending on the average commuting time by car or train necessary to reach core employment areas (
Table 3.). While the rate of loss regularly increases with the distance in the case of Tokyo, Kansai’s biggest ‘losers’ are municipalities situated within a 60–120-minute range.
How can we explain that some outlying municipalities, according to our model, would be ‘faring better’ than municipalities holding currently more inhabitants and economic activity? A main argument is that already by 2018, the average land prices of these areas are at a low level: their earlier and stronger pace of depopulation spurred housing vacancy and put an extreme downward pressure on the value of still occupied residential land. To say it bluntly, the weaker value of housing assets in these areas is such that further losses would not be quantitatively important, both in volume and percentage of the HAV. Compared to Tokyo, the Kansai metropolitan areas lack a specific centre while Tokyo has the centre of Tokyo, special wards, and bed towns. Kansai has an Osaka-Kyoto-Kobe multi-centric city structure. It thus appears that from rural areas, commuting by car can be faster than resorting to railway.
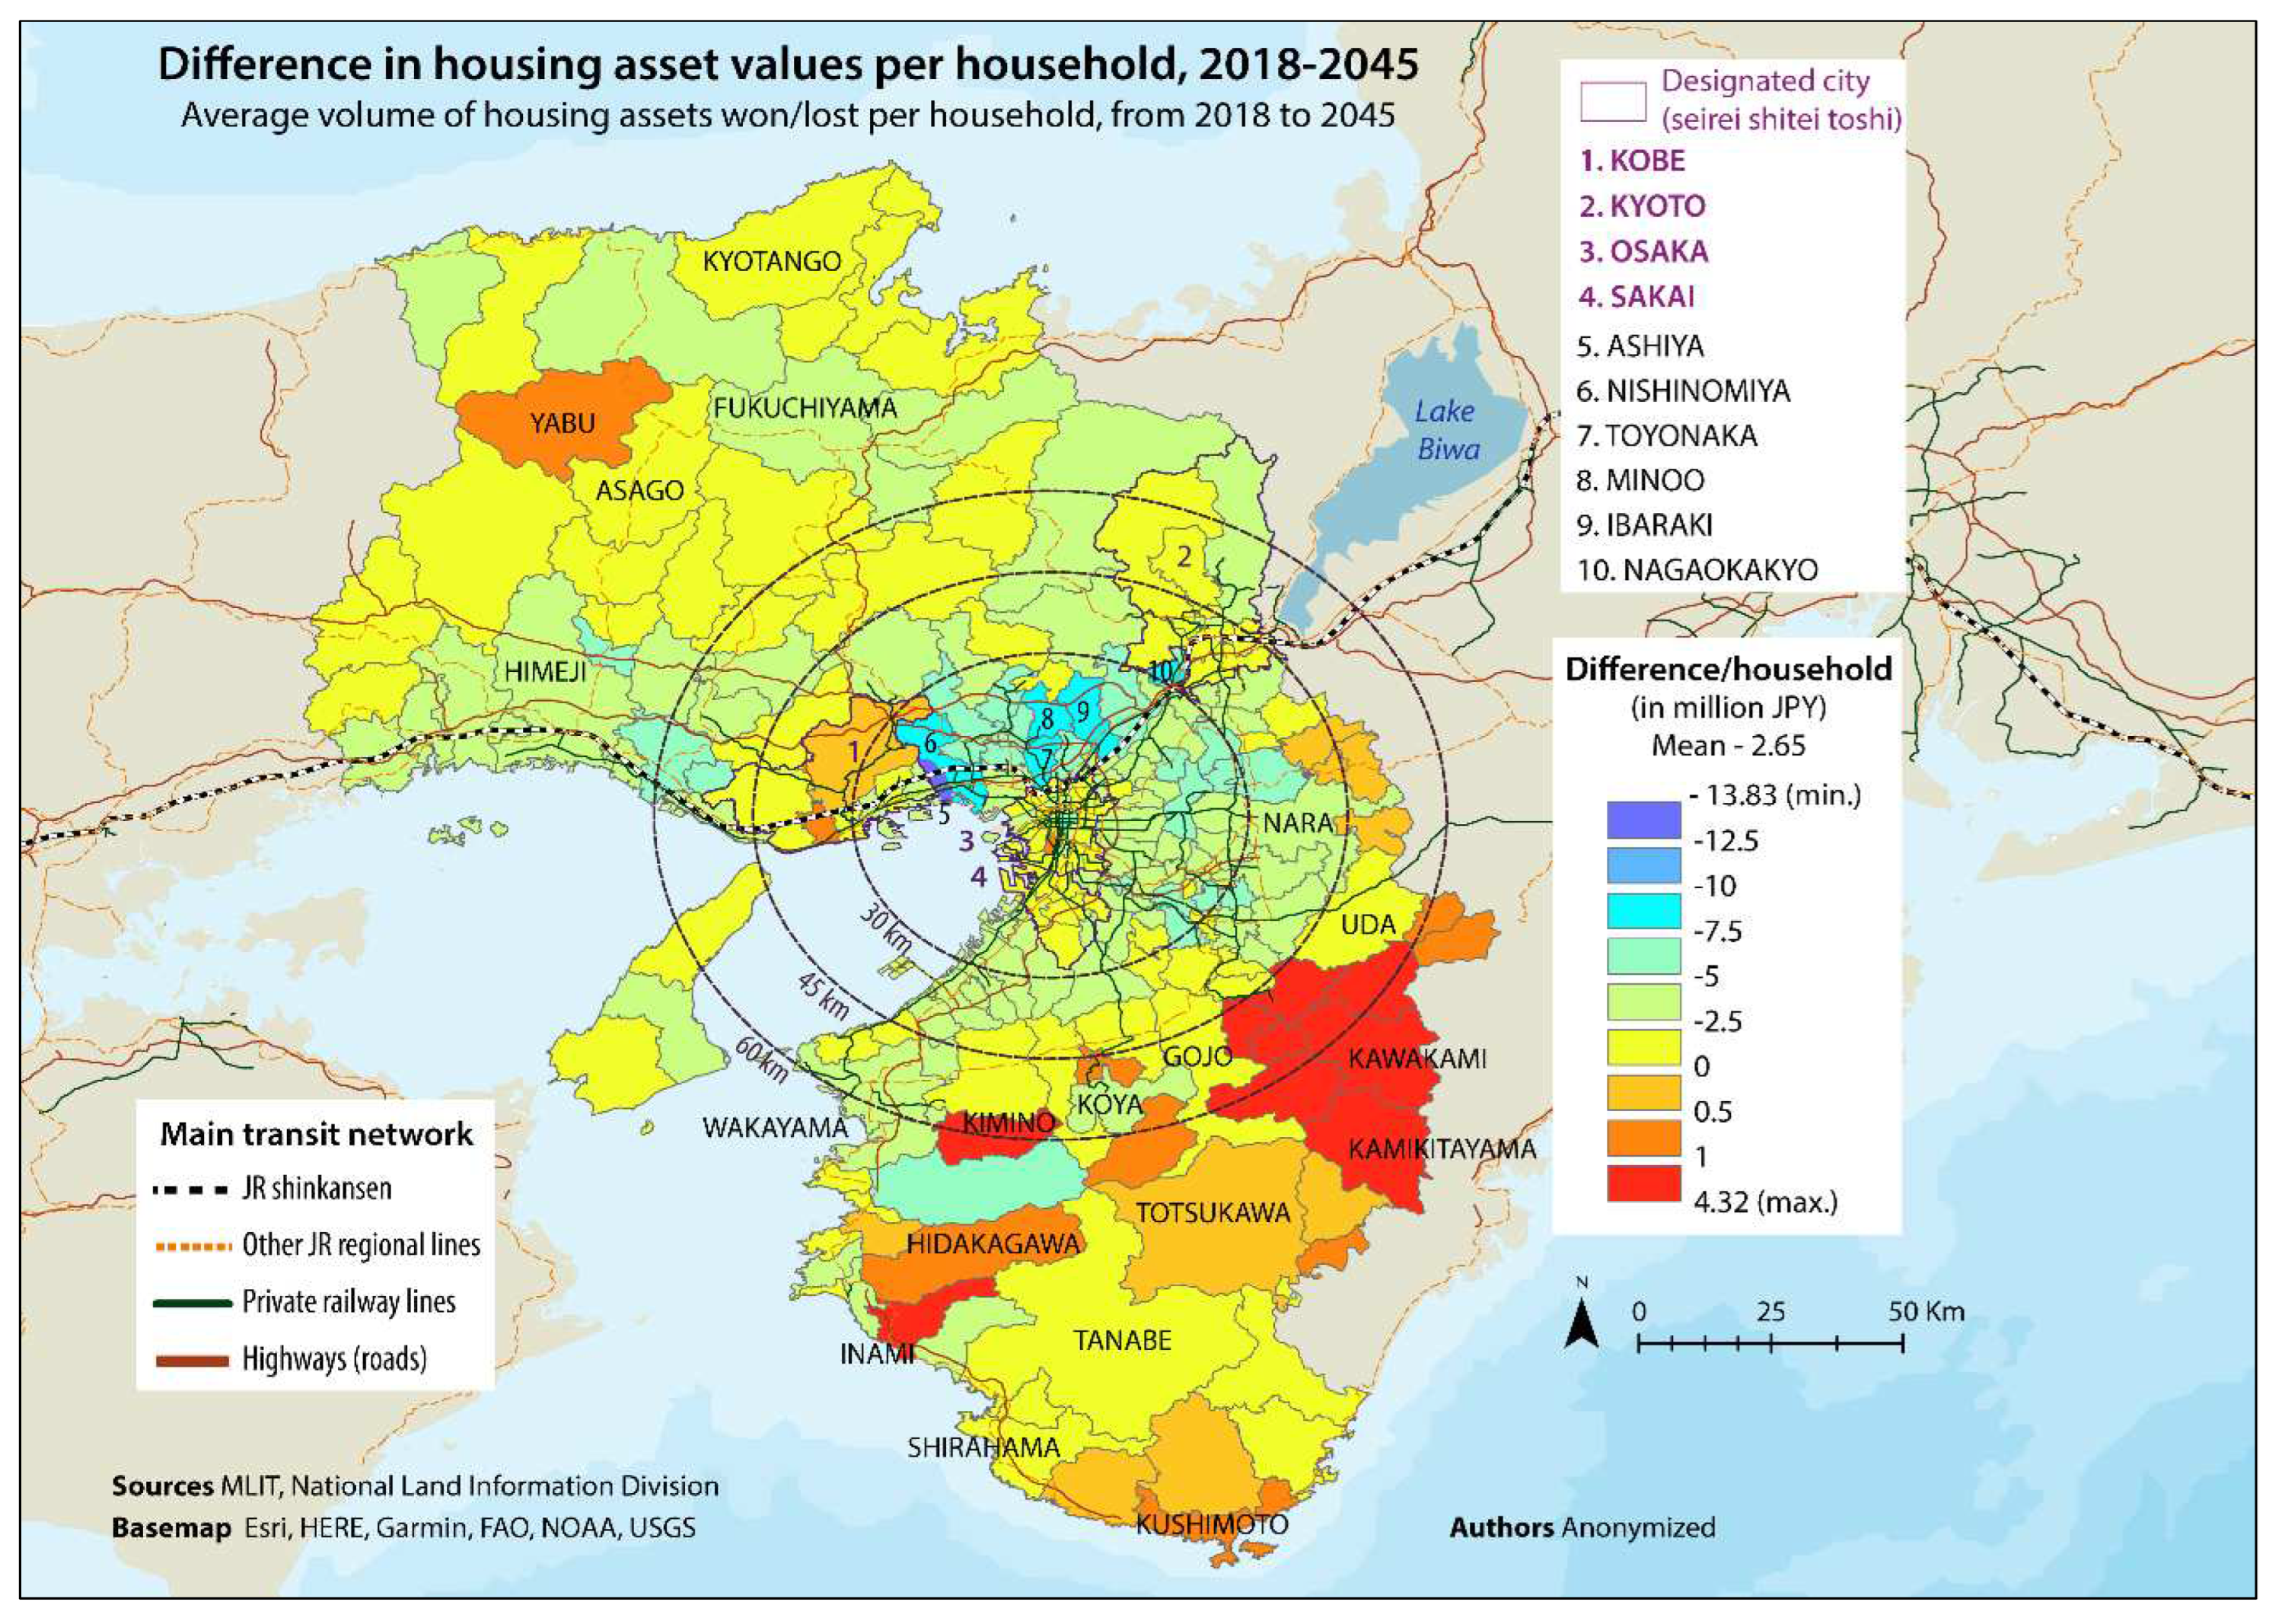
Finally, the financial implications, both in collective and individual terms, are addressed with
Figure 7. Because they presently hold some of the most valued residential markets of the region but face stronger rates of aging and depopulation than regional cores, the municipalities lying along the backbone of the Kansai metropolitan area (like Nishinomiya, Takarazuka, Takatsuki) may face the biggest HAV deflation, as measured by the sum of the difference in JPY/m² between 2018 and 2045. Such municipalities have grown as bedroom communities for mainly more than upper middle-income households, thus now residential land price is relatively high compared with other residential areas. If we consider the difference per household, an average loss of 7.5 to 13 million JPY (around 53,000 to 91,000 USD) per household could be expected.
5. Tier 1 vs. Tier 2 Metropolitan Areas
Compared to Tier 1(Tokyo) metropolitan area, have Tier 2 (Kansai) metropolitan areas more or less effects on the HAV due to population decline? We divided the discussion into three parts for deeper understanding.
5.1. Impact of Population Decline and Commuting Time on HAV
Looking at the HAV estimation results for the Kansai metropolitan area and the Tokyo metropolitan area (
Table 4), the population decline rate in the Kansai metropolitan area is -18.3%, which is much higher than the -6.6% in the Tokyo metropolitan area. In addition, the HAV decline rate is -37.7%, which is higher than that of the Tokyo metropolitan area. We found that the rate of decline of the HAV in Tier 2 Kansai is higher than that in Tier 1 Tokyo. On the other hand, the rate of decrease in the HAV by commuting time tends to increase in Kansai in proportion to the commuting time. The maximum decrease is over -30% within 60-120 minutes, but the decrease rate after that is as low as -25%. In addition, the HAV decrease rate is -23% even within 30 minutes from the Kansai CBD, and the HAV decrease rate is also significant near the CBD. We found that in Tier 2 Kansai, compared to Tier 1 Tokyo, there was a greater decrease of the HAV even near the CBD, and the decrease rate of the HAV was more uniform overall in Tier2 Kansai. A possible reason for this is that as the size of the metropolitan areas is smaller, the trend of decline also spreads to the vicinity of the CBD.
5.2. Spatial Pattern Differences on HAV Decrease
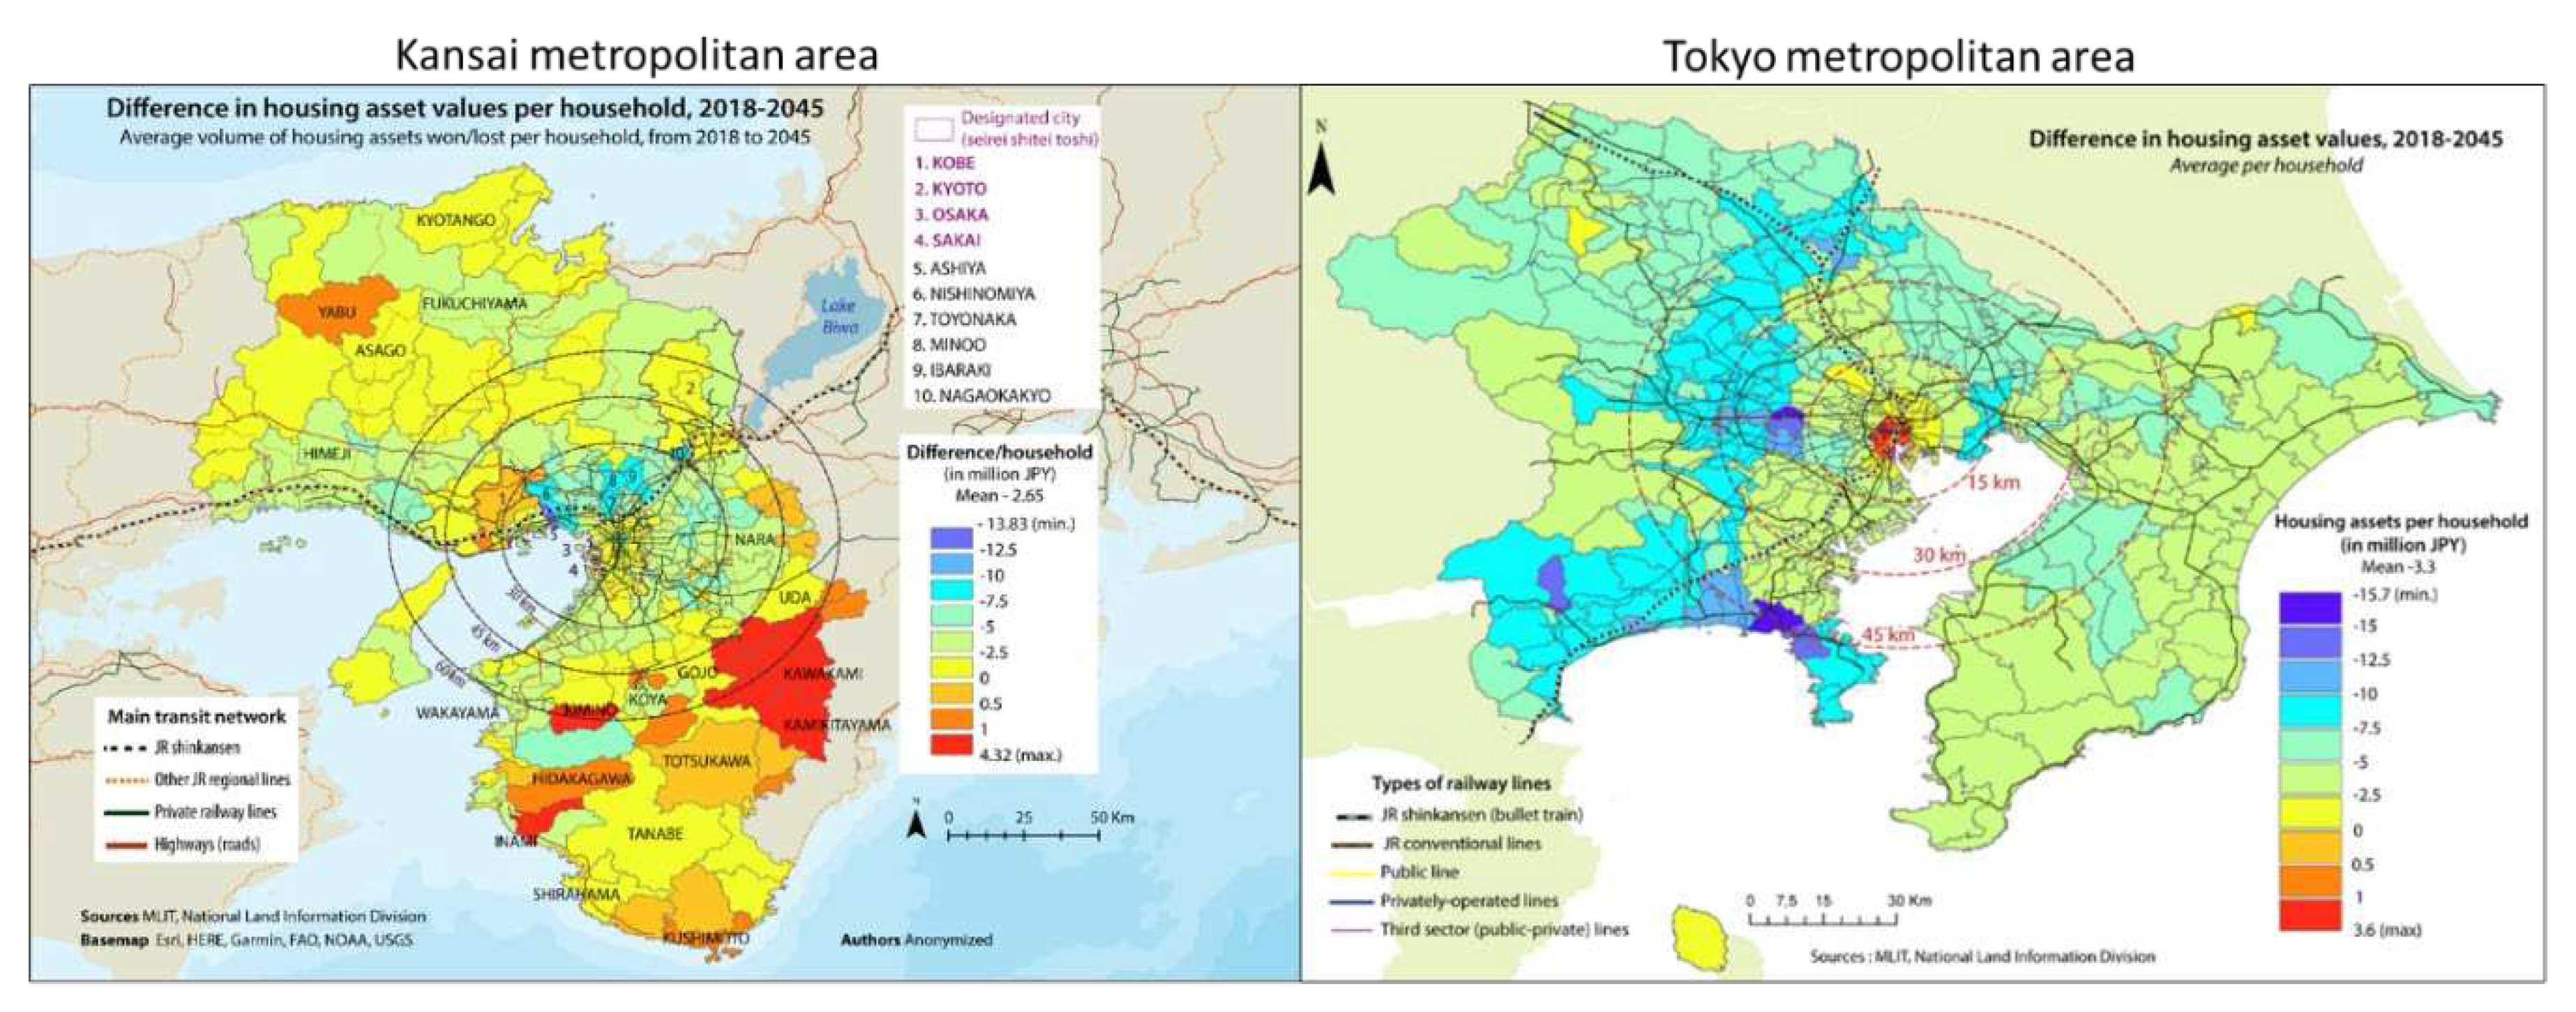
We considered differences in the spatial decreasing trends of the HAV. A common trend for both of metropolitan areas, municipalities that developed as bedroom communities during the population growth period faced a notable HAV decrease. In the Kansai metropolitan area, there is a concentration of bedroom communities in the northern part of Osaka, and such municipalities were exceeding 7.5 to 13 million JPY (around 53,000 to 91,000 USD, see dark blue and light blue areas in
Figure 8). In the Tokyo metropolitan area, there are many bedroom communities in the western part of Tokyo, and a similar decline in the HAV is observed as in the Kansai metropolitan area. However, there is a difference in location trends, with the Kansai metropolitan area having some bedroom communities within a 30 km radius, indicating a significant decrease in the HAV even in municipalities with short commuting times. On the other hand, in the Tokyo metropolitan area, where many bedroom communities are located outside the 30km radius, the decrease in the HAV is more notable in municipalities with longer commuting times. Many municipalities in the Tokyo metropolitan area have larger declines in the HAV than those in the Kansai metropolitan area because of the more extensive bedroom communities in the metropolitan area. Since the decline in the HAV in bedroom communities is large, it has a negative impact on the retirement life of elderly households, as pointed out by Uto et al. (2023). Considering this point, we believe that the impact of the HAV decline is more likely to be a social problem in metropolitan areas. Thus, Tier1 Tokyo may have a more severe urban shrinkage problem than Tier2 Kansai.
Next, looking outside the 45 km radius, there is a decreasing trend in the HAV in the Tokyo metropolitan area, but the HAV is stabilized in the Kansai metropolitan area, and there is a slight increase in some municipalities. We assumed that these differences in the size of the metropolitan areas are due to the fact that fewer households in the Kansai metropolitan area commute to the CBD from municipalities that are 120 minutes or more (≈45 km outside the metropolitan area) from the CBD, and such areas are not affected by the population decline. In addition, municipalities outside the 45 km radius of the Kansai metropolitan area are either tourist destinations or residential areas where land prices are quite low, so even if the population declines, there is little room for the HAV decline.
5.3. Factors of HAV Decrease
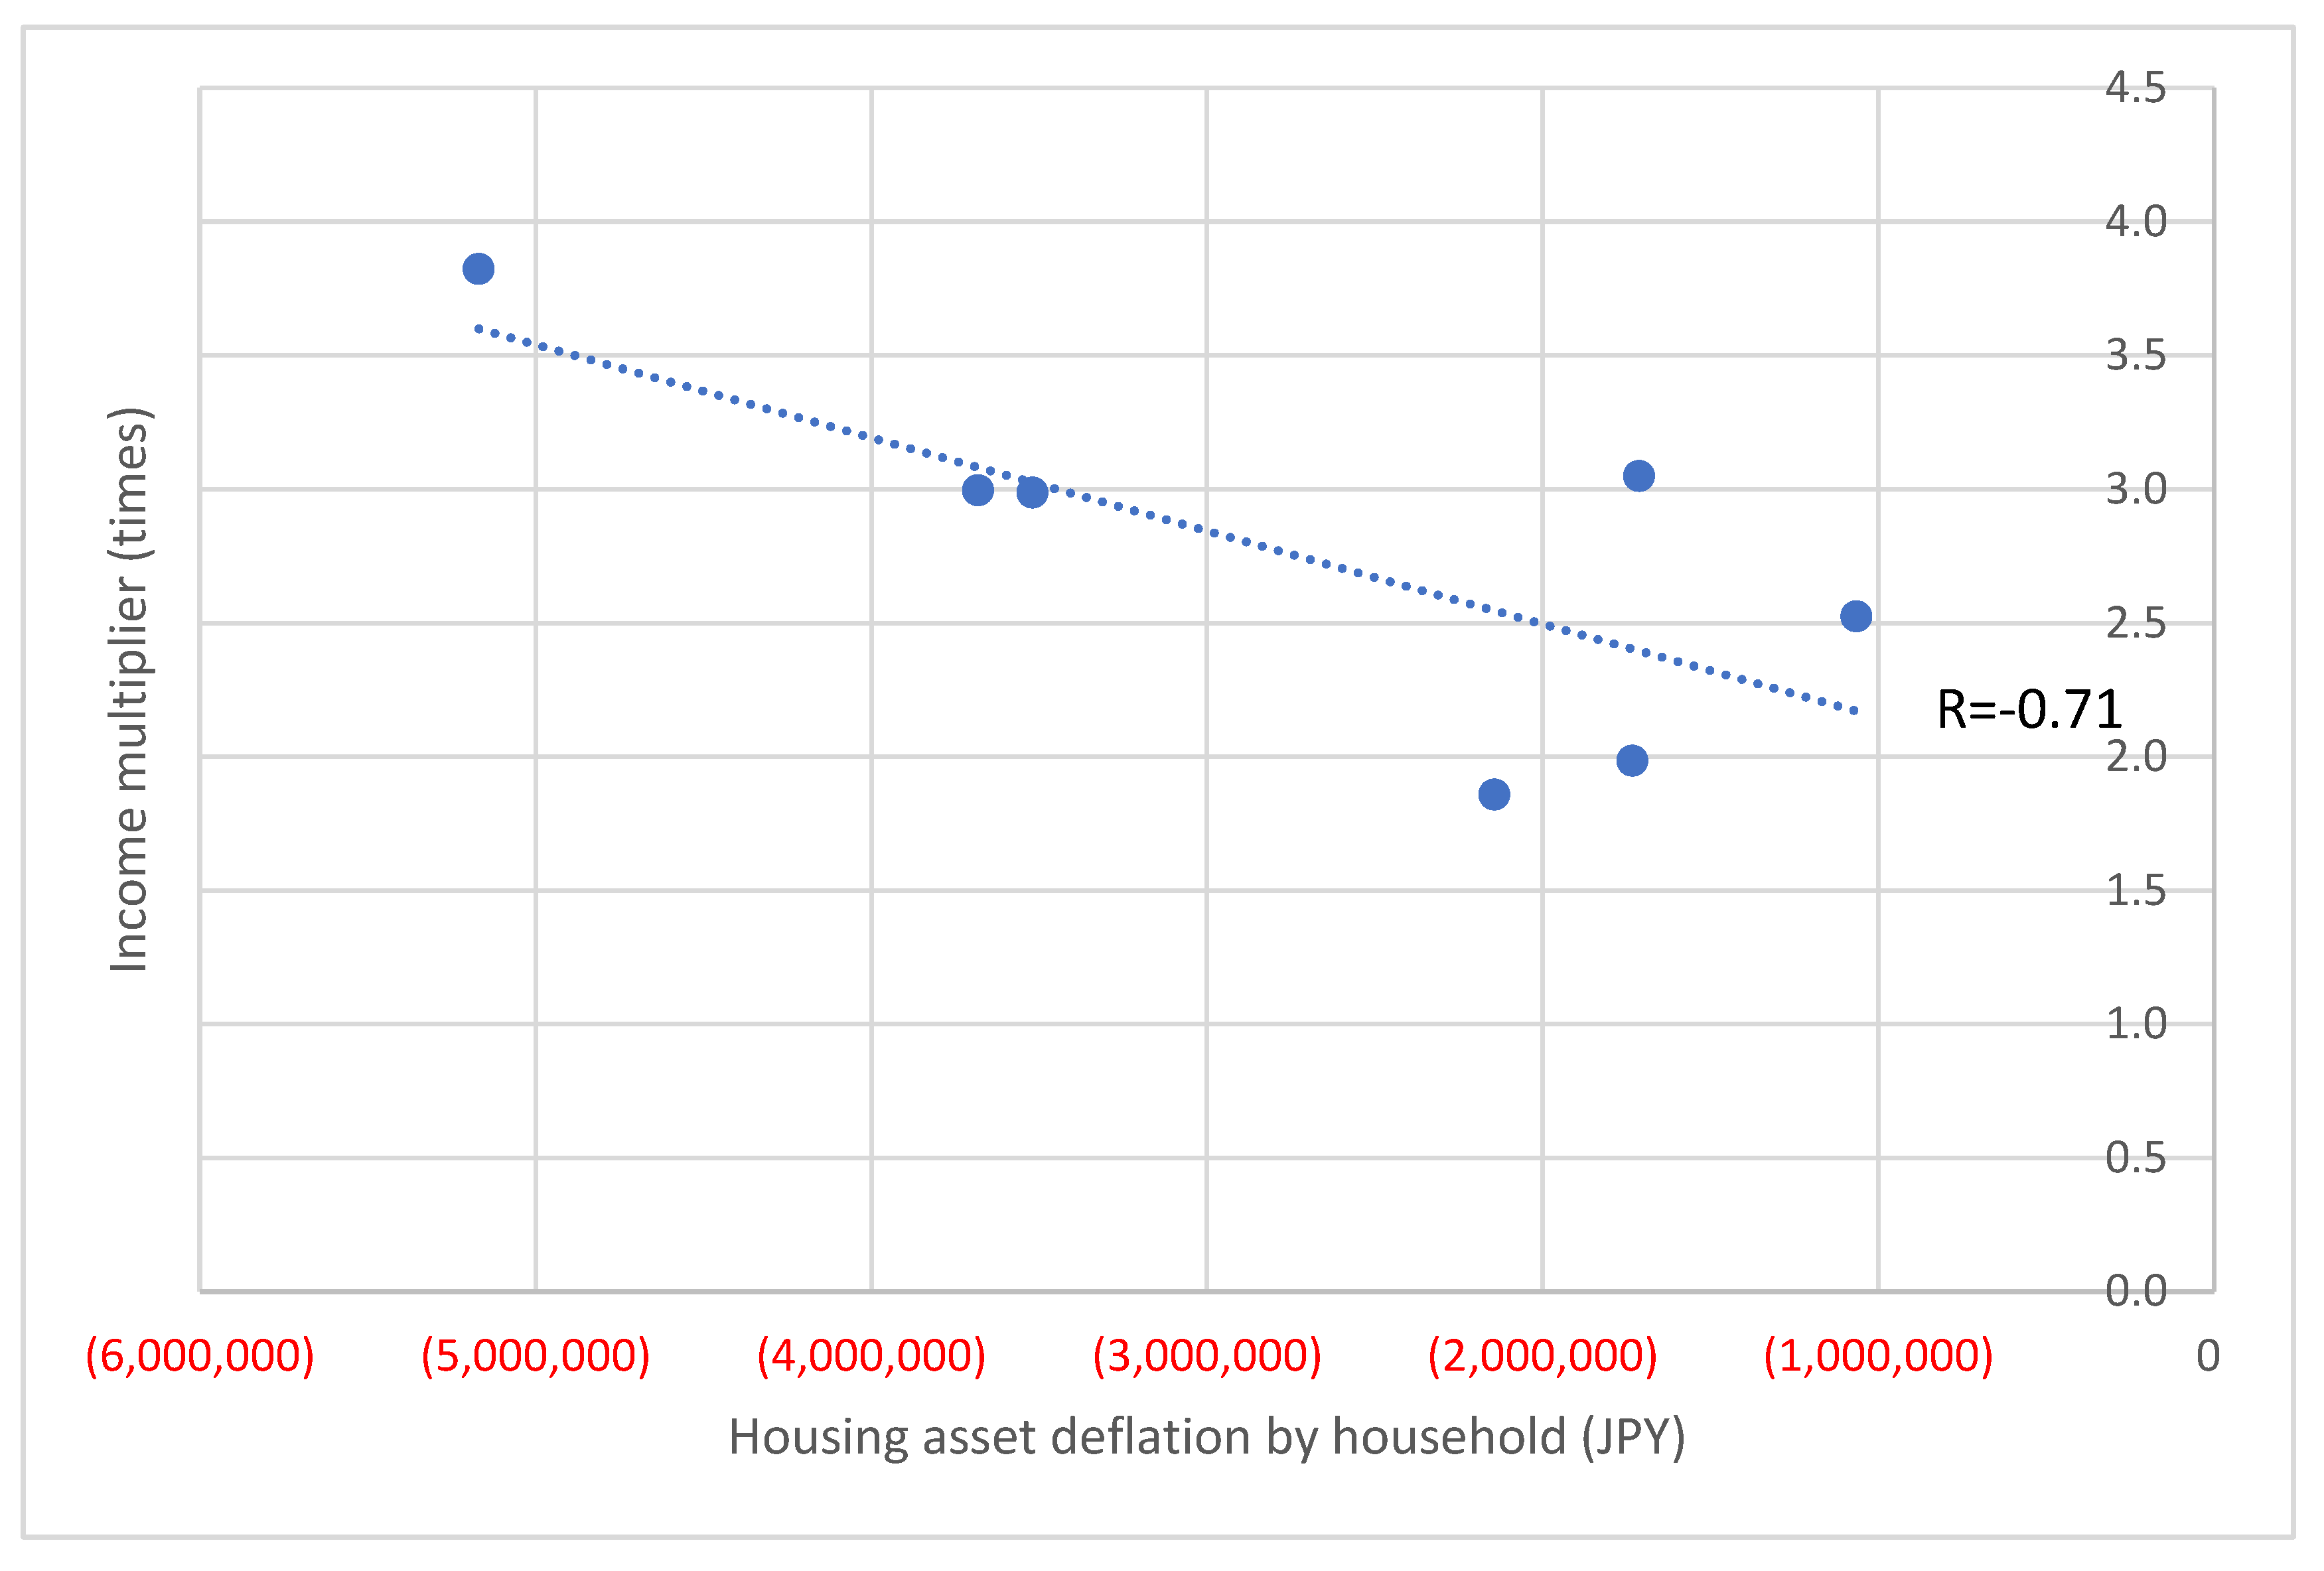
As we have discussed, the Kansai metropolitan area has a higher rate of population decline and the HAV decrease than the Tokyo metropolitan area, and municipalities closer to the CBD also tend to experience declines, with Tier 2 Kansai being more susceptible to population decline than Tier 1 Tokyo. On the other hand, the Tokyo metropolitan area has a larger number of bedroom communities, so the municipalities where the decline in the HAV per household exceeds 7.5-13.0 million JPY(around 53,000 to 91,000 USD) are distributed over a much wider area spatially, while the Kansai metropolitan area only has a concentration in northern Osaka. This suggests that the problem of declining the HAV in the Tokyo metropolitan area may be more serious than in the Osaka metropolitan area. One of the issues we focused on was the correlation between income multipliers for the HAV per household. In general, the larger the population of a metropolitan area, the higher the land price, but households in metropolitan areas also have higher incomes, which to some extent offsets the higher land prices. But if land prices are higher than income, the income multiplier is higher. The income multiplier is higher, the ratio of real estate to household asset should be higher. Hence, we hypothesized that the impact of the HAV decline on households in the Tokyo metropolitan area would be larger than in the Kansai metropolitan area. To examine this, we calculated the income multiplier for the HAV per household in 2018. Since there are no statistics on household incomes all municipalities, we only looked at Major cities, but a comparison of income multipliers showed that the Tokyo metropolitan area had higher income multipliers than the Kansai metropolitan area (
Table 5.).
When comparing the average income in each area, Tokyo city had the highest at 6,575 thousand JPY (National Survey of Family Income, Consumption and Wealth, 2019, Statistics Bureau of Japan). The income multiplier was 3.82 in Tokyo city, while in Osaka, Kyoto, and Kobe city, it was 1.98, 3.05, and 2.53, respectively. This indicates the leverage of purchasing a house by household. The Kansai metropolitan area appears to have a lighter burden when it comes to buying homes compared to Tokyo metropolitan area. Tokyo cities the HAV will decline -18.8% in 2045 than Kansai -10.5%.The impact of the HAV deflation would a more severe problem, especially in Tokyo cities, which already had higher housing values.
To examine the relationship between income multipliers and HAV declines, the results in
Table 5 are plotted on the scatter plot in
Figure 9. The correlation coefficient between HAV decline per household and income multiplier is -0.71, which shows a relatively strong negative correlation. This suggests that cities with higher income multipliers tend to have higher HAV declines per household. Cities with housing prices that are relatively high for the city’s income level will experience greater housing asset deflation. This is consistent with the finding that bedroom communities experience greater housing asset deflation. Bedroom communities would have had lower housing prices if not for commuters to the CBD. As the city expanded, housing prices skyrocketed despite the long commute. As the population declines and housing closer to the CBD becomes more affordable, bedroom communities will end their mission.
6. Discussion and Conclusions
The focus of this study is to examine the deflation of HAVs in the Kansai metropolitan area. In addition, by comparing the Kansai metropolitan area with the Tokyo metropolitan area, differences between metropolitan areas of different sizes (Tier 1 and Tier 2 classes) were examined.
These findings were discussed in a manner that eliminates as much as possible the elements unique to the Tokyo metropolitan area and the Kansai metropolitan area. This is because we believe that the value of this study would diminish if its findings could not be used from a global perspective as well.
This article addresses the socioeconomic challenges that population decline, and hollowing-out processes entail for metropolitans, by assessing the evolution of housing asset values for each municipality belonging to the Kansai metropolitan area. Our estimates, which run until 2045, re-apply to this region a model recently elaborated by (Uto et al., 2023) to calculate the impact of the HAV deflation on the housing wealth accumulated so far by municipalities and residents of the Tokyo metropolitan area. We found that the HAV in Kansai would decrease faster than in the Tokyo (1.7 % annually against 1.3 %); but by 2045, it would amount to less than one half of the latter’s expected losses (approximately 41 trillion JPY against 94 trillion). Hence, we can assert that disparities in the concentration of wealth associated with homeownership would widen between Tier 1 and Tier 2 regions. Furthermore, we confirm that suburban municipalities specialized in “dormitory” functions emerge as local losers from the current effects of demographic decline. This suggests that densely populated Tier 1 metropolitan areas such as Tokyo may face serious social problem and be unable to maintain their housing value in the future, while Tier 2 metropolitan areas such as Kansai, with lower HAV, may experience greater stability in an aging society.
The relationship between the HAV and average income shows that households in Tokyo need to earn nearly 4 times the income to purchase a home, compared to Kansai, where the income requirement is about 2.5 times. This higher leverage in Tokyo may cause serious problem for elderly households due to the deflation of the HAV, but lower leverage in Kansai could help stabilize the lives of elderly households. Considering our study, we can state that Tier 2 metropolitan area is much faster effects of the HAV deflation, but Tier 1 metropolitan area has more serious social problem than Tier 2. Hence, our conclusion is that there are different problems of different natures rather than which one is more severely affected by the deflation of the HAV.
The contribution of this study is that it reveals that the impact of the HAV deflation on residents in different sizes of metropolitan areas is a serious but different challenge in nature. This point leads us to imagine that even smaller metropolitan areas have a different problem. We believe that these issues are worthy of continued research. In addition, this study points out that differences in the size of metropolitan areas alter the problem of urban shrinkage. The diversity in the size of the world’s metropolitan areas indicates that the issue of urban shrinkage cannot be discussed within the single category of metropolitan areas. From a global perspective, the findings suggest that there are a variety of sizes of metropolitan areas in the world, and that discussions need to be tailored to each of these sizes. In this sense, we believe that this study provides valuable insights.
Author Contributions
Masaaki Uto: Conceptualization, Methodology, Formal analysis, Revised and Editing draft, Funding acquisition. Sophie Buhnik: Data collecting, Formal analysis, original draft. Yuki Okazawa: Data collecting, Formal analysis, Revised draft.
Funding
This study was supported by the Japan Society for the Promotion of Science (JSPS) KAKENHI (Grant Numbers: 22K04500).
Data Availability Statement
The data is available on request.
Conflicts of Interest
The authors declare that they have no conflict of interest.
References
- Aveline-Dubach, N. (2014). New patterns of property investment in “post-bubble” Tokyo: The shift from land to real estate as a financial asset. In Globalization and new intra-urban dynamics in Asian cities (N. Aveline-Dubach, S. Jou, H.M. Hsiao (Eds.), pp. 265–294). Taipei: National Taiwan University Press.
- Baba, H.; Asami, Y. Regional Differences in the Socio-economic and Built-environment Factors of Vacant House Ratio as a Key Indicator for Spatial Urban Shrinkage. Urban Reg. Plan. Rev. 2017, 4, 251–267. [Google Scholar] [CrossRef]
- Baba, H.; Hino, K. Factors and tendencies of housing abandonment: An analysis of a survey of vacant houses in Kawaguchi City, Saitama. Jpn. Archit. Rev. 2019, 2, 367–375. [Google Scholar] [CrossRef]
- Bell, D.; Jayne, M. Small Cities? Towards a Research Agenda. Int. J. Urban Reg. Res. 2009, 33, 683–699. [Google Scholar] [CrossRef]
- Buhnik, S. The dynamics of urban degrowth in Japanese metropolitan areas: What are the outcomes of urban recentralisation strategies? Town Plan. Rev. 2017, 88, 79–92. [Google Scholar] [CrossRef]
- Chiavacci, D.; Hommerich, C. (2017). Social inequality in post-growth Japan: Transformation during economic and demographic stagnation. London and New York: Routledge.
- Dore, R.; Sako, M. (1998). How the Japanese learn to work (2nd ed.). Routledge.
- Fujii, T.; Oe, M. A Study on Generational Changes in the Suburbs of the Tokyo Metropolitan Area: A comparative analysis from 1980 to 2020 among cohorts by GBI. J. Archit. Plan. 2006, 71, 101–108. [Google Scholar] [CrossRef] [PubMed]
- Galloway, W. (2009). Of suburbs and cities. Town & Country Planning, 322–327.
- Glaeser, E.L.; Gyourko, J. Urban Decline and Durable Housing. J. Political Econ. 2005, 113, 345–375. [Google Scholar] [CrossRef]
- Hashimoto, Y.; Hong, G.H.; Zhang, X. (2020). Demographics and the Housing Market: Japan’s Disappearing Cities IMF Working Paper (N°20/200). Available online: https://ssrn.com/abstract=3721225 (accessed on 1 February 2024).
- Hattori, K.; Kaido, K.; Matsuyuki, M. The development of urban shrinkage discourse and policy response in Japan. Cities 2017, 69, 124–132. [Google Scholar] [CrossRef]
- Hino, K.; Mizutani, K.; Asami, Y.; Baba, H.; Ishii, N. Attitudes of parents and children toward housing inheritance in a Tokyo suburb. J. Asian Archit. Build. Eng. 2022, 21, 2131–2140. [Google Scholar] [CrossRef]
- Hirayama, Y. Running hot and cold in the urban home-ownership market: The experience of Japan’s major cities. J. Hous. Built Environ. 2005, 20, 1–20. [Google Scholar] [CrossRef]
- Hoshino, T. (2021, May 25). The COVID-19 Pandemic is Accelerating Japan’s Population Decline: A Statistical Analysis. Nippon.Com. Available online: https://www.nippon.com/en/in-depth/d00701/ (accessed on 1 February 2024).
- Iwama, N.; Asakawa, T.; Tanaka, K.; Sasaki, M.; Komaki, N.; Ikeda, M. (2021). Urban Food Deserts in Japan (Vol. 15). Springer Singapore.
- Iwasaki, Y. Shrinkage of regional cities in Japan: Analysis of changes in densely inhabited districts. Cities 2021, 113, 103168. [Google Scholar] [CrossRef]
- Kanayama, Y.; Sadayuki, T. What types of houses remain vacant? Evidence from a municipality in Tokyo, Japan. J. Jpn. Int. Econ. 2021, 62. [Google Scholar] [CrossRef]
- Kato, H. Urban modeling of shrinking cities through Bayesian network analysis using economic, social, and educational indicators: Case of Japanese cities. PLoS ONE 2023, 18. [Google Scholar] [CrossRef] [PubMed]
- Kawabe, A.; Watanabe, S. An Analysis on Urban Shrinkage Trends of All Japanese Cities via Detecting Relative Densely Inhabited District: Urban form changes of Japanese cities in an era of shrinking population—Part 2. Journal of Architecture and Planning (Transactions of AIJ) 2020, 85, 997–1005. [Google Scholar] [CrossRef]
- Kidokoro, T.; Hsiao, H.; Fukuda, R. Study on the polarization to megacity regions and the urban divide: Focusing on the case of Nishinari Ward, Osaka City, Japan. Jpn. Archit. Rev. 2021, 4, 117–128. [Google Scholar] [CrossRef]
- Kidokoro, T.; Sho, K.; Fukuda, R. Urban suburbia: Gentrification and spatial inequality in workers’ communities in Tokyo. Cities 2023, 136, 104247. [Google Scholar] [CrossRef]
- Kirmizi, M. (2017). Urban Redevelopment in Osaka: The More Gentrified, the Less Crafted? Sociology, Anthropology and Philosophy, Graduate School of Human Sciences, Osaka University. [CrossRef]
- Kubo, T. (2020). Divided Tokyo: Disparities in living conditions in the city centre and the shrinking suburbs. Singapore: Springer.
- Kubo, T.; Yui, Y. Transformation of the Housing Market in Tokyo since the Late 1990s: Housing Purchases by Single-person Households. Asian Stud. 2011, 3, 3–21. [Google Scholar] [CrossRef]
- Kubo, T.; Yui, Y. (2020). The rise in vacant housing in post-growth Japan housing market, urban policy, and revitalizing aging cities.
- Le Goix, R.; Casanova Enault, L.; Bonneval, L.; Le Corre, T.; Benites-Gambirazio, E.; Boulay, G.; Kutz, W.; Aveline-Dubach, N.; Migozzi, J.; Ysebaert, R. (2020). Housing (In)Equity and the Spatial Dynamics of Homeownership in France: A Research Agenda. Tijdschrift Voor Economische En Sociale Geografie, tesg.12460.
- Liu, Y.; Nath, N.; Murayama, A.; Manabe, R. Transit-oriented development with urban sprawl? Four phases of urban growth and policy intervention in Tokyo. Land Use Policy 2022, 112, 105854. [Google Scholar] [CrossRef]
- Machimura, T. Gentrification without Gentry in a Declining Global City? Vertical Expansion of Tokyo and Its Urban Meaning 1. International Journal of Japanese Sociology 2021, 30, 6–22. [Google Scholar]
- Martinez-Fernandez, C.; Audirac, I.; Fol, S.; Cunningham-Sabot, E. Shrinking Cities: Urban Challenges of Globalization: Shrinking cities: Urban challenges of globalization. Int. J. Urban Reg. Res. 2012, 36, 213–225. [Google Scholar] [CrossRef]
- Matanle, P.; Sato, Y. Coming Soon to a City Near You! Learning to Live ‘Beyond Growth’ in Japan’s Shrinking Regions. Soc. Sci. Jpn. J. 2010, 13, 187–210. [Google Scholar] [CrossRef]
- Matsutani, A. (2006). Shrinking-population economics: Lessons from Japan. Tokyo: International House of Japan.
- Ministry of Land, Infrastructures, Transport and Tourism (2020). “Infrastructure, Transport and Tourism.” Survey of Vacant House Owners. Available online: https://www.mlit.go.jp/report/press/content/001377049.pdf (accessed on 1 February 2024).
- Miura, R. Rethinking Gentrification and the Right to the City: The Process and Effect of the Urban Social Movement against Redevelopment in Tokyo. Int. J. Jpn. Sociol. 2021, 30, 64–79. [Google Scholar] [CrossRef]
- Miyazawa, H.; Abe, T. Recovery and Changes in the Socioeconomic Composition of Population in the Central Area of Tokyo during the Period from 1995 to 2000: Analysis of Small-area Census Data. Geogr. Rev. Jpn. 2005, 78, 893–912. [Google Scholar] [CrossRef] [PubMed]
- Nozawa, S.; Lintonbon, J. Suburban taste: Hankyu Corporation and its housing development in Japan, 1910–1939. Home Cultures 2016, 13, 283–311. [Google Scholar] [CrossRef]
- Nussbaum, F. The bungalow and the bulldozer. How shrinking suburbs deal with vacant homes in the US. Géographie, Économie, Société 2019, 21, 89–116. [Google Scholar] [CrossRef]
- Ohashi, H.; Phelps, N.A. Diversity in decline: The changing suburban fortunes of Tokyo Metropolis. Cities 2020, 103, 102693. [Google Scholar] [CrossRef]
- Ohashi, H.; Phelps, N.A. Suburban (mis)fortunes: Outer suburban shrinkage in Tokyo Metropolis. Urban Stud. 2021, 58, 3029–3049. [Google Scholar] [CrossRef]
- Okada, N. Rethinking Japan’s depopulation problem: Reflecting on over 30 years of research with Chizu Town, Tottori Prefecture and the potential of SMART Governance. Contemp. Jpn. 2022, 34, 210–227. [Google Scholar] [CrossRef]
- Phelps, N.A.; Ohashi, H. Edge City Denied? The Rise and Fall of Tokyo’s Outer Suburban “Business Core Cities”. J. Plan. Educ. Res. 2020, 40, 379–392. [Google Scholar] [CrossRef]
- Saito, A. (2013). World City Policies and the erosion of the developmental State. In P. Kantor, C. Lefèvre, A. Saito, H.V. Savitch; A. Thornley (Eds.), Struggling Giants. City-Region Governance in London, New York, Paris, and Tokyo (pp. 219–238). University of Minnesota Press.
- Saito, H. Issues to Resolve and Avoid Vacant House from lnstitution regarding Real Estate Point of View. Jpn. J. Real Estate Sci. 2014, 28, 24–31. [Google Scholar]
- Sakai, A. A research of the reality of generation and diminishment of vacant parcels and the mechanism in suburban housing area: Case studies of 2 suburban housing areas in Capital area and Kinki area. J. City Plan. Inst. Jpn. 2014, 49, 1035–1040. [Google Scholar] [CrossRef]
- Sakamoto, K.; Iida, A.; Yokohari, M. Spatial Emerging Patterns of Vacant Land in a Japanese City Experiencing Urban Shrinkage: A Case Study of Tottori City. Urban Reg. Plan. Rev. 2017, 4, 111–128. [Google Scholar] [CrossRef]
- Sorensen, A. (2002). The making of urban Japan: Cities and planning from Edo to the twenty-first century. London: Routledge.
- Sorensen, A. Uneven Processes of Institutional Change: Path Dependence, Scale and the Contested Regulation of Urban Development in Japan. Int. J. Urban Reg. Res. 2011, 35, 712–734. [Google Scholar] [CrossRef]
- Sorensen, A.; Funck, C. (2007). Living Cities in Japan: Citizens’ Movements, Machizukuri and Local Environments (1st ed.). Routledge. [CrossRef]
- Statistics Bureau of Japan (2018). Outlines of the 2018 Land and Housing Survey of Japan. Available online: https://www.stat.go.jp/english/data/jyutaku/index.html (accessed on 1 February 2024).
- Suzuki, M.; Asami, Y. (2017). Shrinking metropolitan area: Costly homeownership and slow spatial shrinkage. Urban Studies, 1–16.
- Suzuki, M.; Asami, Y. Shrinking housing market, long-term vacancy, and withdrawal from housing market. Asia-Pac. J. Reg. Sci. 2020, 4, 619–638. [Google Scholar] [CrossRef]
- Suzuki, M.; Hino, K.; Muto, S. Negative externalities of long-term vacant homes: Evidence from Japan. J. Hous. Econ. 2022, 57, 101856. [Google Scholar] [CrossRef]
- Tamai, Y.; Shimizu, C.; Nishimura, K.G. Aging and Property Prices: A Theory of Very-Long-Run Portfolio Choice and Its Predictions on Japanese Municipalities in the 2040s. Asian Economic Papers 2017, 16, 48–74. [Google Scholar] [CrossRef]
- Tsukamoto, T. Devolution, new regionalism and economic revitalization in Japan: Emerging urban political economy and politics of scale in Osaka–Kansai. Cities 2011, 28, 281–289. [Google Scholar] [CrossRef]
- Tsukamoto, T. Why Is Japan Neoliberalizing? Rescaling of the Japanese Developmental State and Ideology of State–Capital Fixing. J. Urban Aff. 2012, 34, 395–418. [Google Scholar] [CrossRef]
- Uesugi, M. (2021). Changes in Occupational Structure and Residential Segregation in Tokyo. In M. Van Ham, T. Tammaru, R. Ubarevičienė; H. Janssen (Eds.), Urban Socio-Economic Segregation and Income Inequality (pp. 209–226). Springer International Publishing.
- Usui, H.; Perez, J. Are patterns of vacant lots random? Evidence from empirical spatiotemporal analysis in Chiba prefecture, east of Tokyo. Environ. Plan. B Urban Anal. City Sci. 2022, 49, 777–793. [Google Scholar] [CrossRef]
- Uto, M. The viewpoint of the infrastructure management during the decreasing population era, Japan Association for Real Estate Sciences 2012, 25 (4), pp. 43–49. (In Japanese). [CrossRef]
- Uto, M. (Ed.) (2013). The Infrastructure Management under the Decreasing Population Era. The university of Tokyo Press. Available online: https://www.utp.or.jp/book/b306483.html (accessed on 1 February 2024). (In Japanese).
- Uto, M. (2014). Considering problems of the infrastructure aging in Tokyo, May 10, 2014, Urban Housing Sciences, No. 87, pp. 14–17. (In Japanese). [CrossRef]
- Uto, M. Examining environmental risks from the viewpoint of population decline and infrastructure issues. J. Natl. Inst. Public Health 2018, 67, 306–312. (In Japanese) [Google Scholar] [CrossRef]
- Uto, M.; Nakagawa, M.; Buhnik, S. Effects of housing asset deflation on shrinking cities: A case of the Tokyo metropolitan area. Cities 2023, 132, 104062. [Google Scholar] [CrossRef]
- United Nation. The World’s Cities in 2018, 4 pages. 2018. Available online: https://population.un.org/wup/Publications/ (accessed on 1 February 2024).
- Wakabayashi, Y.; Koizumi, R. (2018). Spatial Patterns of Population Change in Central Tokyo Since the Period of the Bubble Economy. In T. Kikuchi & T. Sugai (Eds.), Tokyo as a Global City (Vol. 8, pp. 155–176). Springer Singapore.
- Yabe, N. (2018). Central Tokyo as a Place for Raising Children While Working. In T. Kikuchi & T. Sugai (Eds.), Tokyo as a Global City (Vol. 8, pp. 177–196). Springer Singapore.
- Yahagi, H. (2009). Toshi shukushô no jidai [ The age of shrinking Cities]. Tokyo: Kadokawa shinsho.
- Yoshida, T. (2010). Kōgai no suitai to saisei. Shrinkingu shiti o tenbō suru [Suburban decline and renewal]. Kyoto: Kōyōshobō.
- Yui, Y.; Kubo, T.; Miyazawa, H. Shrinking and Super-Aging Suburbs in Japanese Metropolis. Sociol. Study 2017, 7. [Google Scholar]
|
Disclaimer/Publisher’s Note: The statements, opinions and data contained in all publications are solely those of the individual author(s) and contributor(s) and not of MDPI and/or the editor(s). MDPI and/or the editor(s) disclaim responsibility for any injury to people or property resulting from any ideas, methods, instructions or products referred to in the content. |
© 2024 by the authors. Licensee MDPI, Basel, Switzerland. This article is an open access article distributed under the terms and conditions of the Creative Commons Attribution (CC BY) license (http://creativecommons.org/licenses/by/4.0/).
