Preprint
Article

Performance Assessment of Presurgical Tests in Temporal Lobe Epileptic Patients

Altmetrics

Downloads

125

Views

54

Comments

0

A peer-reviewed article of this preprint also exists.

Submitted:

07 February 2024

Posted:

07 February 2024

You are already at the latest version

Alerts
Abstract
The performance of the presurgical test (preSurg) for temporal lobe epilepsy (TLE) was evaluated via video-electroencephalography (VEEG), electroencephalography (EEG), 99mTc-HmPAO single-photon emission tomography (SPECT) and 1.5 T magnetic resonance imaging (MRI) in a group of 112 men (37.0 ± 1.1 years) and 106 women (39.7 ± 1.1 years) operated on for TLE. The epileptic zone (EZ) was adequately identified to determine whether the patient reached an Engel I grade (EI) at least one year postop. Accuracy was evaluated by the coefficient α, ranging from 3 (when result = EZ) to 2 (result in the same hemisphere as the EZ), 1 (noninformative result) or 0 (EZ in the contralateral hemisphere). The simplicity of diagnosis was defined as the number of preSurg surgeries needed to identify the EZ. EI was obtained in 85.8% of patients even though 42.2% of patients had noninformative MRI results. For preSurg α was (mean ± SEM) = VEEG (2.83 ± 0.04) > MRI (2.14 ± 0.08) > EEG (1.87 ± 0.09) > SPECT (1.71 ± 0.09). The accuracy (combination of sensitivity and specificity) was calculated as follows: VEEG (0.797) > MRI (0.518) > EEG (0.446) > SPECT (0.360). The likelihood positive ratio was greater, and the likelihood negative ratio was lower for VEEG. The most relevant factor for the regression model was VEEG (3.106) > MRI (2.558) > EEG (1.905), and the factors were not significantly related to SPECT. EZs in EI patients with low simplicity were identified mainly by VEEG. A very good postoperative outcome can be obtained even in TLE patients with no lesions on MRI. The VEEG is the most reliable preSurg test and may be the only reliable test for patients with very low simplicity (i.e., difficult).single paragraph of about 200 words maximum. For research articles, abstracts should give a pertinent overview of the work. We strongly encourage authors to use the following style of structured abstracts, but without headings: (1) Background: Place the question addressed in a broad context and highlight the purpose of the study; (2) Methods: briefly describe the main methods or treatments applied; (3) Results: summarize the article’s main findings; (4) Conclusions: indicate the main conclusions or interpretations. The abstract should be an objective representation of the article and it must not contain results that are not presented and substantiated in the main text and should not exaggerate the main conclusions.
Keywords: 
Subject: Medicine and Pharmacology  -   Neuroscience and Neurology

1. Introduction

Temporal lobe epilepsy (TLE) is the most common type of focal epilepsy. Fortunately, drug-resistant patients have good outcomes after surgery [1]. Accurate localization of the epileptogenic zone (EZ) is a prerequisite for successful surgical treatment of patients with pharmacoresistant focal epilepsy [2]. The identification of that region requires careful evaluation via several presurgical tests (preSurg) in highly specialized centres [3]. Among these methods, long-term scalp video-electroencephalography (VEEG) monitoring is mandatory for recording interictal EEG features and seizures, including bioelectrical patterns and semiology, neuropsychological assessments and magnetic resonance imaging (MRI) that are specifically related to epileptic evaluation. Other tests can include interictal 18-fluoro-deoxyglucose ([18F]-FDG) positron emission tomography (PET) or 99mHmPAO single-photon emission computed tomography (SPECT) [4,5,6,7,8]. Approximately 30–90% of epileptic patients with concordant electroclinical data may have seizure freedom [9,10,11,12]
The EZ is the region in which resection or disconnection results in the disappearance of seizures [2,13]. Therefore, it is an operational definition and does not allow for positive identification before surgery. Consequently, no gold standard method can be used for a statistical analysis of preSurg because it is currently impossible to assess the degree of certainty in cases of non-Engel I (and dubiously II too). This means that we can only be sure about the presurgical accuracy in Engel I patients.
Nevertheless, it seems highly relevant to assess the contribution of preSurg to the treatment of drug-resistant epileptic patients. Nonetheless, there is no canonical definition for which preSurg surgery must be included in the presurgical evaluation, except for the mandatory use of VEEG and MRI. Similarly, patient selection for surgical treatment depends strongly on the experience of the clinical team [6]. However, there is a significant proportion of epileptic patients with no clear anatomical lesions on MRI or even discordant preSurg who could benefit from surgery. However, the percentage of these patients remains to be determined. In this sense, we must keep in mind that in recent years, the concept of network epilepsy has developed and is not necessarily associated with morphological lesions according to imaging studies [14,15,16,17,18].
In this work, we assessed two complementary goals: i) evaluation of the accuracy of the preSurg protocols of EEG, SPECT, MRI and scalp VEEG in determining the location of the EZ and ii) the evaluation of agreement between tests in temporal lobe epilepsy (TLE) patients operated on in the last 20 years in a national reference unit for the treatment of epilepsy. The first goal depends on the specific capacity of the tests to identify the EZ, and the second goal is related to the intrinsic difficulty of diagnosis for every patient. Therefore, regarding the difficulty in the diagnosis, we have termed simplicity the degree of agreement of different preSurg, e.g., a higher simplicity implies that more preSurg correctly identified the EZ.
We were not interested in the surgical details, anatomy or other pathological or therapeutic considerations.

2. Materials and Methods

2.1. Patients

This study retrospectively evaluated 112 men and 106 women who underwent surgery for TLE at the National Reference Unit for the Treatment of Refractory Epilepsy, University Hospital La Princesa (Spain), from 2001 to 2021. The experimental procedure was approved by the medical ethical review board of the Hospital Universitario de La Princesa and was deemed “care as usual”. Under these circumstances, written informed consent was not needed. Most of the patients were treated with at least two antiepileptic drugs (AEDs) and had a history of epilepsy longer than 2 years. See below.
Presurgical evaluation was performed according to the protocol of Hospital La Princesa and has been described in detail elsewhere (Sola et al., 2005[5]). Briefly, patients were evaluated presurgically with a 19-channel scalp EEG (EEG32U, NeuroWorks, XLTEK®, Oakville, ON, Canada) following the international 10–20 system. Additionally, we employed interictal single-photon emission computed tomography (SPECT, Starcam 3200, General Electric®, Fairfield, CT, USA) using 99mTc-HmPAO and magnetic resonance imaging (MRI, General Electric®, Fairfield, CT, USA) 1.5 T with specific epilepsy study and video-electroencephalography (VEEG; EMU64, NeuroWorks, XLTEK®, Oakville, ON, Canada) using 19 scalp electrodes according to the international 10–20 system plus additional electrodes in T1/T2, T9/T10 and P5/P8 (for a total of 25 electrodes). In some cases, foramen ovale electrodes or depth electrodes were used after VEEG. However, in this paper, we considered only the information obtained from the scalp. Patients who underwent surgery after the use of intracranial electrodes were not included.
All preSurg were performed by different highly specialized staff (clinical neurophysiologists, nuclear medicine specialists and radiologists) without knowledge of the results from the remaining studies. Only during the final clinical meeting were the results publicly discussed, and if needed, ambiguous results could be reinterpreted according to the rest of preSurg. However, in this work, we selected the former results (before the clinical meeting). All the members of the unit had more than 10 years of professional experience.
Postsurgical outcomes were assessed through Engel’s scale [6]. Patients were evaluated at three, six and twelve months after surgery. The evaluation of the Engel scale at any time involved considering the presence/absence of ES during the period between the previous evaluation (or the immediate postop period) and the current evaluation. Considering that the EZ is an operational definition, only in patients with an Engel grade I (EI) can we be sure of the anatomical location of the EZ. This is a very restrictive classification because we classified non-Engel I patients (nEIs) with early postsurgical seizures despite the absence of seizures for many years.
Most of the patients underwent electrocorticography (ECoG)-tailored anterior medial temporal resection. Five patients underwent only lateral cortectomy, and only three patients underwent amygdalo-hippocampectomy. All eight of these patients were in the EI group; therefore, the type of surgery could not influence the results.

2.2. Performance assessment of presurgical tests

The sampling space (Ω) for any epileptic patient has 8 possibilities, i.e., four lobes (frontal, temporal, parietal and occipital) from the left and right hemispheres, namely, Ω = F l , T l , P l , O , F t , T t , P t , O t   l = l e f t ; r = r i g h t . Therefore, the operation zone (OpZ) must be one of these options. Formally, any lobe can be represented by an 8th-dimensional vector, where 1 indicates a specific lobe and the rest are 0. For example, the OpZ of a patient with intervention in the left temporal lobe can be indicated by OpZ=[0,1,0,0,0,0,0,0]. Considering that the EZ is an operational definition, not a positive concept, its identification can be performed only in terms of the procedures used for evaluation (in this case, the absence of seizures after the excision/disconnection of a brain region). Therefore, we have no means to know exactly a priori its placement. However, we have an objective determination, which is the OpZ. Therefore, if the patient has EI, we assume that the EZ is in the OpZ, as in topographical terms E Z O p Z . However, if the patient has nEI, we know that E Z O p Z , although unfortunately, we have no means to know in which other lobe it can be located. In the example considered (nEI in a patient operated on from the left temporal lobe), the putative EZ ( E Z ¯ ) was included in the vector E Z ¯ = [ x , 0 , x , x , x , x , x , x ] . Obviously, this formalism does not indicate that the EZ would be in fact located in all the lobes except the left temporal lobe; rather, it only indicates our lack of knowledge.
The same formalism can be used to codify the results of preSurg. For example, if we have the next result for SPECT = hypoperfusion in the right temporal lobe, EEG = no presence of irritative activity, VEEG = left temporal lobe epilepsy and MRI = left temporal lobe sclerosis, we can codify these results in vectorial form as S P E C T = [ 0,0 , 0,0 , 0,1 , 0,0 ] , E E G = [ 0,0 , 0,0 , 0,0 , 0,0 ] , v E E G = [ 0,1 , 0,0 , 0,0 , 0,0 ] and M R I = [ 0,1 , 0,0 , 0,0 , 0,0 ] .
We considered the next diagnosis from preSurg for localization of the OpZ. We had any of the following possibilities on MRI: hippocampal sclerosis/atrophy, cortical dysplasia, low-grade tumours, cavernoma, cortical development disorder or vascular malformation; on VEEG (in descending order of relevance): ictal patterns and clinical semiology; presence of irritative activity > 75% in the same lobe; and presence of irritative activity during rapid eye movement sleep; on EEG: irritative activity, including spikes, sharp waves, temporal intermittent rhythmic delta activity or any combination of these; or on SPECT: hypoperfusion.
The use of a formalism in terms of vectors allowed us to implement an algorithm to compute the performance assessment from all the preSurgs. The accuracy of the preSurg in locating the EZ was assessed by means of a coefficient (α) defined in this way: if the test identified the EZ, then we assigned a value of 3; if the test identified the hemisphere (e.g., the test indicated more lobes than OpZ in the same hemisphere), we assigned a value of 2; if the test could not discriminate between the two hemispheres (e.g., normal MRI), we assigned a value of 1; and if the test indicated the contralateral hemisphere, we assigned a value of 0. In the case of nEI, if the test indicated a region outside of the OpZ, we assigned a value of 1; however, if the test indicated the OpZ, we assigned a value of 0, the same as the contralateral localization for EI.
We used α to evaluate the degree of difficulty in the diagnosis of a patient (i.e., the opposite concept of simplicity) or of a group of patients by means of the concept of simplicity. We calculated simplicity by computing the mean of α from all the preSurg, and in this way, we obtained a value that reflected the degree of agreement between all the preSurg values and the OpZ. According to this definition   α 0,3 , the maximum value indicates perfect identification in all the patients or of all the preSurg in a given patient. We assumed that a patient whose preSurg test results coincided with the EZ had a simpler diagnosis than a patient with EI when only one or two preSurg tests correctly indicated the EZ.
We also evaluated the performance of the preSurg classification by means of a confusion matrix, obtaining sensitivity (S), specificity (Sp) and several related measures [19]. To do that, we computed the confusion matrices according to these definitions:
True positive (TP): patient EI + preSurg localizing (α=3)
False-negative (FN): patient EI + preSurg not localizing ( 0 α 2 )
True negative (TN): patient, nEI + preSurg not in OpZ (α=1)
False-positive (FP): patient, nEI + preSurg in OpZ (α=0)
With these expressions, we can define
S = T P T P + F N
S p = T N T N + F P
The use of these confusion matrices allows us to obtain several measurements of accuracy to characterize the performance of a given preSurg and compare them, defined according to these expressions
Positive   Likelihood   Ratio   ( PLR )   P L R = S 1 S p
Negative   Likelihood   Ratio   ( NLR )   N L R = 1 S S p
Odds   of   Engel   I   ( O EI )   O E I = S 1 S
Odds   of   non - Engel   I   ( O nEI )   O n E I = 1 S p S p
Odds   ratio   ( OR )   for   outcome   O R = S × S p ( 1 S ) × ( 1 S p )
Predictive   Positive   Value   ( PPV )   P P V = S × P D S × P D + ( 1 S p ) × ( 1 P D )
Predictive   negative   value   ( PNV )   P N V = S p × ( 1 P D ) ( 1 S ) × P D + S p × ( 1 P D )
where PD (predominance) is the estimator of the prevalence (in this case, EI).
Finally, as a comprehensive measure of precision, we used accuracy (AC), defined as A C = S × E I E I + n E I + S p × n E I E I + n E I .
These definitions and their equivalences are summarized in Table 1.

2.3. Multiple binary logistic model

We constructed a multiple binary logistic regression model to evaluate the contribution of preSurg to obtaining an EI outcome. To do that, we used the coefficients (α) from the different preSurg variables and the outcome of Engel’s scale (1 for EI and 0 for nEI) as the dependent variable. We evaluated the goodness of fit by means of the Hosmer–Lemeshow statistic and the significance of the variables by the Wald statistic [20,21].
A detailed description of the model is given in Appendix A.

2.4. Statistics

We used the relative frequencies as probabilities; consequently, we could use the formula for conditional probability [22] to evaluate the probability of occurrence of two simultaneous events. For two events, namely, A and B, the conditional probability ( P r ( B / A )) is given by the expression
P r ( B / A ) = P r ( A B ) P r ( A )
where P r ( A B ) are the probabilities of events A and B simultaneously and P r ( A ) is the probability of event A.
Statistical comparisons between groups were performed using Student’s t test or ANOVA for normally distributed data. Normality was evaluated using the Kolmogorov–Smirnov test. The Mann–Whitney rank sum test or ANOVA on ranks was used when normality failed. In the last case, either the Tukey or Holms–Sidak test was used for all pairwise post hoc comparisons of the mean ranks of treatment groups. The Chi-square test ( χ 2 ) was used to assess the differences between groups. SigmaStat® 3.5 software (SigmaStat, Point Richmond, CA, USA) and MATLAB® were used for statistical analysis.
The significance level was set at p = 0.05. The results are shown as the mean ± SEM, except where otherwise indicated.

3. Results

3.1. Clinical results

In this paper, we analysed all the patients diagnosed with temporal lobe epilepsy who underwent surgery to control seizures; therefore, some patients who underwent palliative care, indicated to diminish the frequency or severity of seizures, were not included. The proportions of male and female patients were similar (Table 2), and their clinical features were similar, except for the distribution of the number of AEDs, which differed. In this cohort, 111 patients underwent surgery on the left temporal lobe, and 107 underwent surgery on the right.
In this group of patients, we obtained constant EI during the first year in 187/218 (85.8%) and nEI in 31/218 (14.2%).
No modification of AED treatment was accomplished in the first postoperative year.
In the EI group, the most frequent histological finding was hippocampal sclerosis (35.0%), followed by gliosis (26.3%), and no alterations were found in third place (14.6%). In the case of nEI patients, the most common finding was no alterations (31.6%), followed by gliosis (21.1%) and hippocampal sclerosis (15.8%). Pie charts showing the distribution of pathology in both groups can be found in Figure 1.

3.2. Evaluation of presurgical accuracy in localization of the EZ.

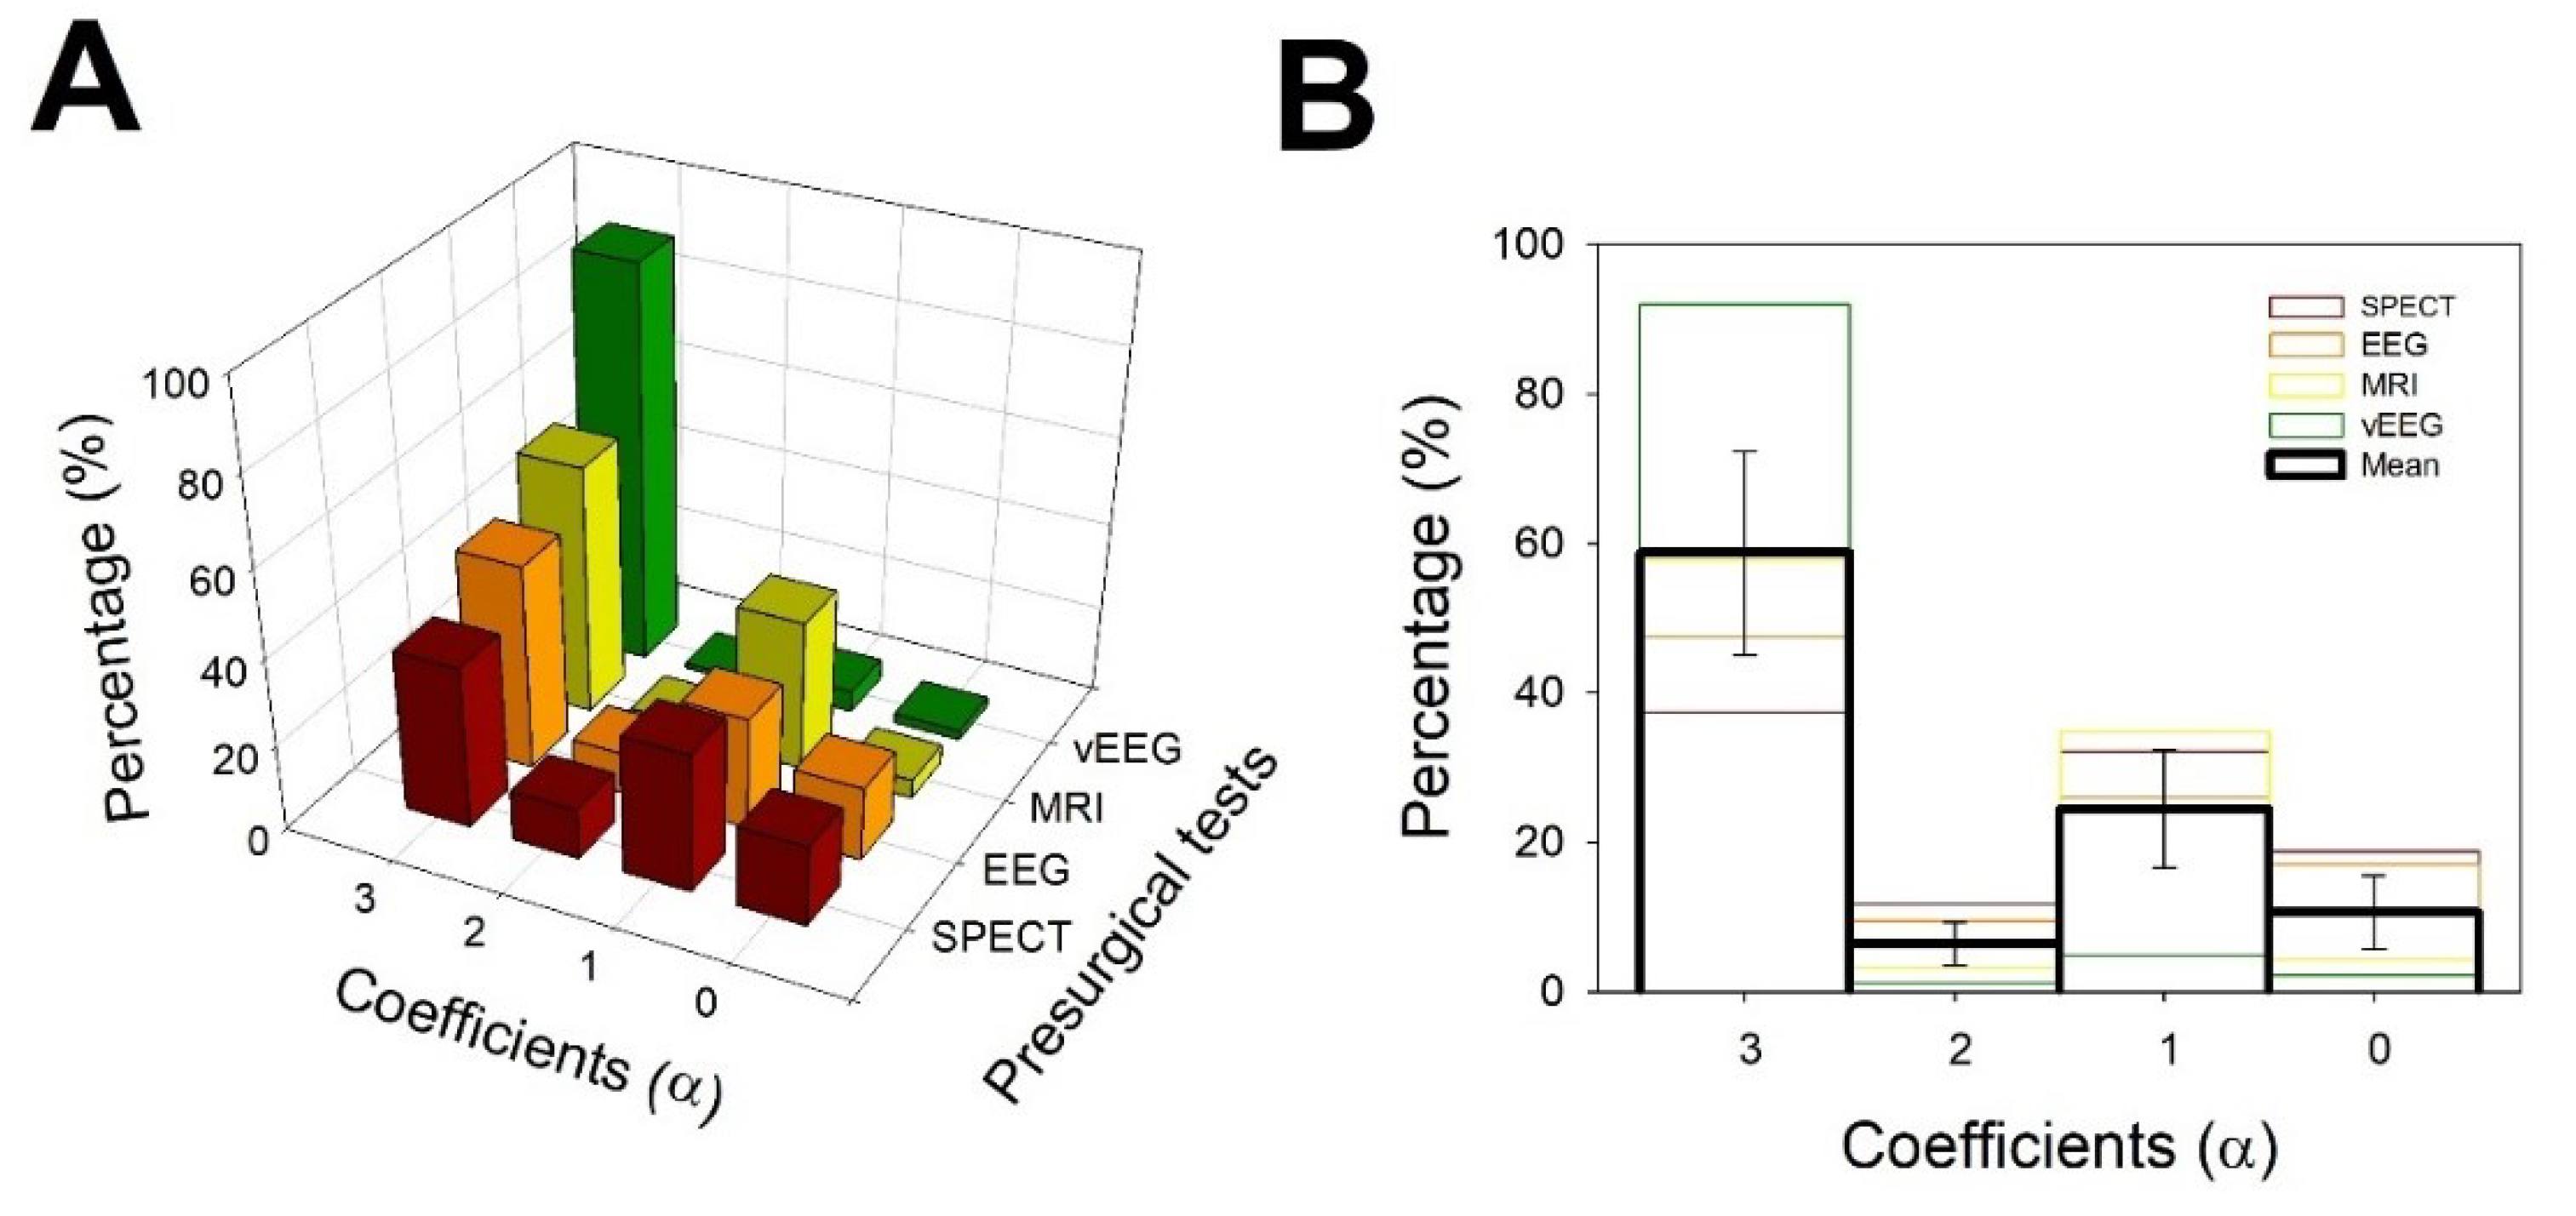
We used the α coefficient in EI patients to evaluate the overall accuracy of the preSurg. Figure 2A shows that VEEG had a greater percentage at α = 3 (92.0%), which implies lobar identification of the EZ. However, globally, all the preSurg values had a bimodal distribution, with the maximum occurring at α = 3 (lobar identification) and the second occurring at α = 1 (hemispheric identification) as shown in Figure 2B, in which we overlapped the distributions of α for all the preSurg values.
The high percentage of α = 1 (not-localizing) results for SPECT, EEG and MRI was a shocking result, mainly for MRI, and it is an index of the complexity of patients (see below).
We computed the mean value of α ( α ¯ ) for every preSurg, and we determined (mean ± SEM and 95% interval of confidence) that SPECT = 1.71 ± 0.09 (1.48-1.94), EEG = 1.87 ± 0.09 (1.64-2.11), MRI = 2.14 ± 0.08 (1.95-2.33) and VEEG = 2.83 ± 0.04 (2.72-2.94). The lowest value was for SPECT, followed by EEG, which was not too far from the MRI value. Only the VEEG showed an overall value and interval of confidence clearly separated from the other tests. Obviously, VEEG was the most exact preSurg for locating the EZ. Most likely, more surprising was the fact that the accuracy of identification via EEG was quite similar to that achieved via MRI.
A complementary way to evaluate the performance of preSurg in the identification of EZ was the construction of confusion matrices. Table 3 shows the matrices used for SPECT, EEG, MRI and VEEG.
Table 3 shows that the S value for VEEG was the highest, practically double that for MRI. The lowest value was for SPECT. In the case of Sp, the highest value was for EEG, and the lowest was for VEEG. To describe a classification as a whole, we used AC information, which ranged from lowest to highest 0.360, 0.446, 0.518 and 0.797 for SPECT, EEG, MRI and VEEG, respectively. Therefore, despite the small Sp values for all the preSurg, and especially for VEEG, the best classification was attained by VEEG.
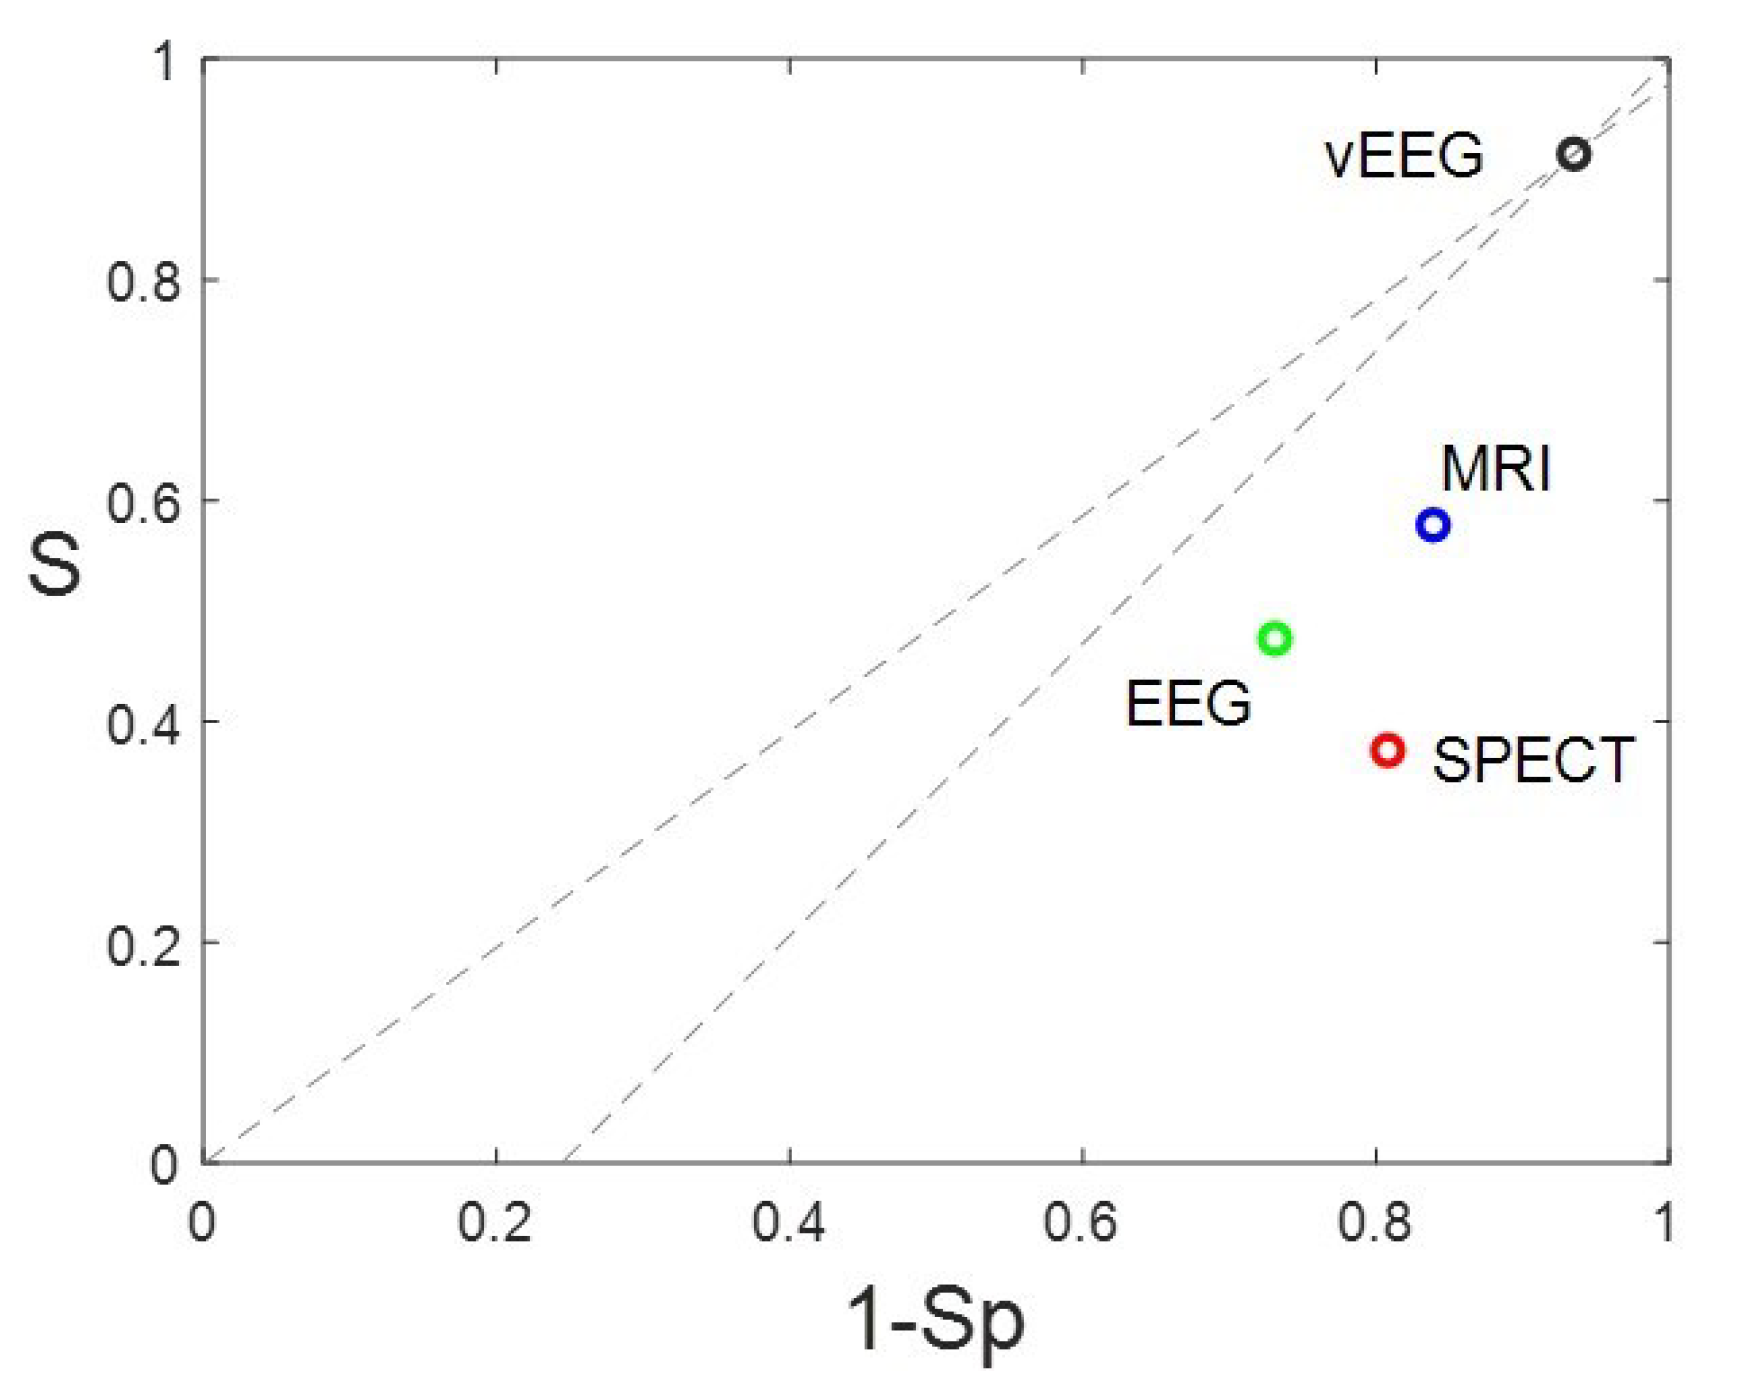
The discriminatory ability of a preSurg can be expressed as a function of the likelihood ratio (LR), which can be either positive (LRP) or negative (LRN). LR reflects the degree of evidence of a presurgical location in favour of the presence of the condition (e.g., EI) relative to the absence of the condition (e.g., nEI). Both the LRP and LRN can be helpful for comparing different preSurg values, which can be graphically plotted in a graph formed by 1-Sp on the x-axis and S on the y-axis (Figure 3). We plotted a straight line passing through those values for VEEG, namely, (0.935, 0.914) and point (0,0). Then, we plotted a second line passing through the same point for VEEG and point (1,1). The graph is divided into 4 regions, and the region located below both lines represents the worst performance in confirming the presence of the condition and the absence of the condition [23].
Therefore, SPECT and EEG, like MRI, performed worse than VEEG in localizing the EZ.
However, thus far, we have assessed the capacity of localization considering that we know that patients have either EI or nEI. Nevertheless, the most important feature of a presurgical test is the capacity to predict an outcome of EI after the specific result of that test. This information can be obtained by Bayes’ theorem for the PPV and PNV (Equations 8 and 9). Ranking from the most to least common, the PPVs of the next tests (between brackets) were as follows: VEEG (0.855) > MRI (0.806) > EEG (0.798) > SPECT (0.759). Therefore, all the tests predicted with p > 0.75 the probability of obtaining an EI, although again, the highest value was for the VEEG.
The PNV indicates the probability of an nEI after a nonlocalizing result in the test, and the preSurg can be ordered from high to low: VEEG (0.111) < EEG (0.078) < MRI (0.060) < SPECT (0.045). As observed for the PPV, the test with the best ability to predict an nEI was VEEG, and the test with the worst ability was SPECT. Nevertheless, these values are clearly less than 0.5; therefore, their predictive value is negligible.
Finally, to assess the contribution of the different preSurg to the outcome, we constructed a multiple binary logistic model (see Appendix A). The null distance was d0 = 177.46. For only one variable, we could order the distances in ascending order: VEEG (34.9) < MRI (73.2) < EEG (114.4) < SPECT (118.1). Then, we had RL = 177.46–34.9 = 142.59; obviously, we could incorporate VEEG into the model. We subsequently repeated the process for two variables, in increasing order: VEEG/MRI (19.126) < VEEG/EEG (24.075) < VEEG/SPECT (27.052). In this case, the LR = 34.895-19.126 = 15.769; therefore, MRI could be incorporated into the model. Then, we repeated this process with three variables, obtaining a VEEG/MRI/EEG (15.230) < VEEG/MRI/SPECT (17.078). In this case, LR = 19.126-15.230=3.896; therefore, we incorporated EEG data. Finally, with these four variables, we obtained an LR = 15.230-12.099 = 3.131, which was lower than 3.84; moreover, we did not incorporate SPECT into the model. Finally, the expression that best fit the model was
P = 1 1 + e x p ( 4.425 3.106 × V E E G 2.558 × M R I 1.905 × E E G )
where P represents the outcome, P = 1 EI, and P = 0 nEI.
The Hosmer–Lemeshow Statistic was 0.247, indicating that the model fit the data well. We have added the features of the model to Table 1A in the Appendix.

3.3. Evaluation of simplicity of diagnosis

We defined the simplicity of the diagnosis of a patient as the degree of agreement between the preSurg the EZ, which was calculated as the average of the coefficients of lateralization. The range was [0,3], where 0 means that no preSurg test identified the EZ and 3 means that all the preSurg tests did so. Let us have an example from a patient with left temporal mesial sclerosis, left temporal sharp waves at EEG, left temporal hypoperfusion at SPECT and a left theta pattern with ipsilateral automatisms and contralateral dystonia. The simplicity of this specific case is α ¯ = 3 . However, this is not always the case.
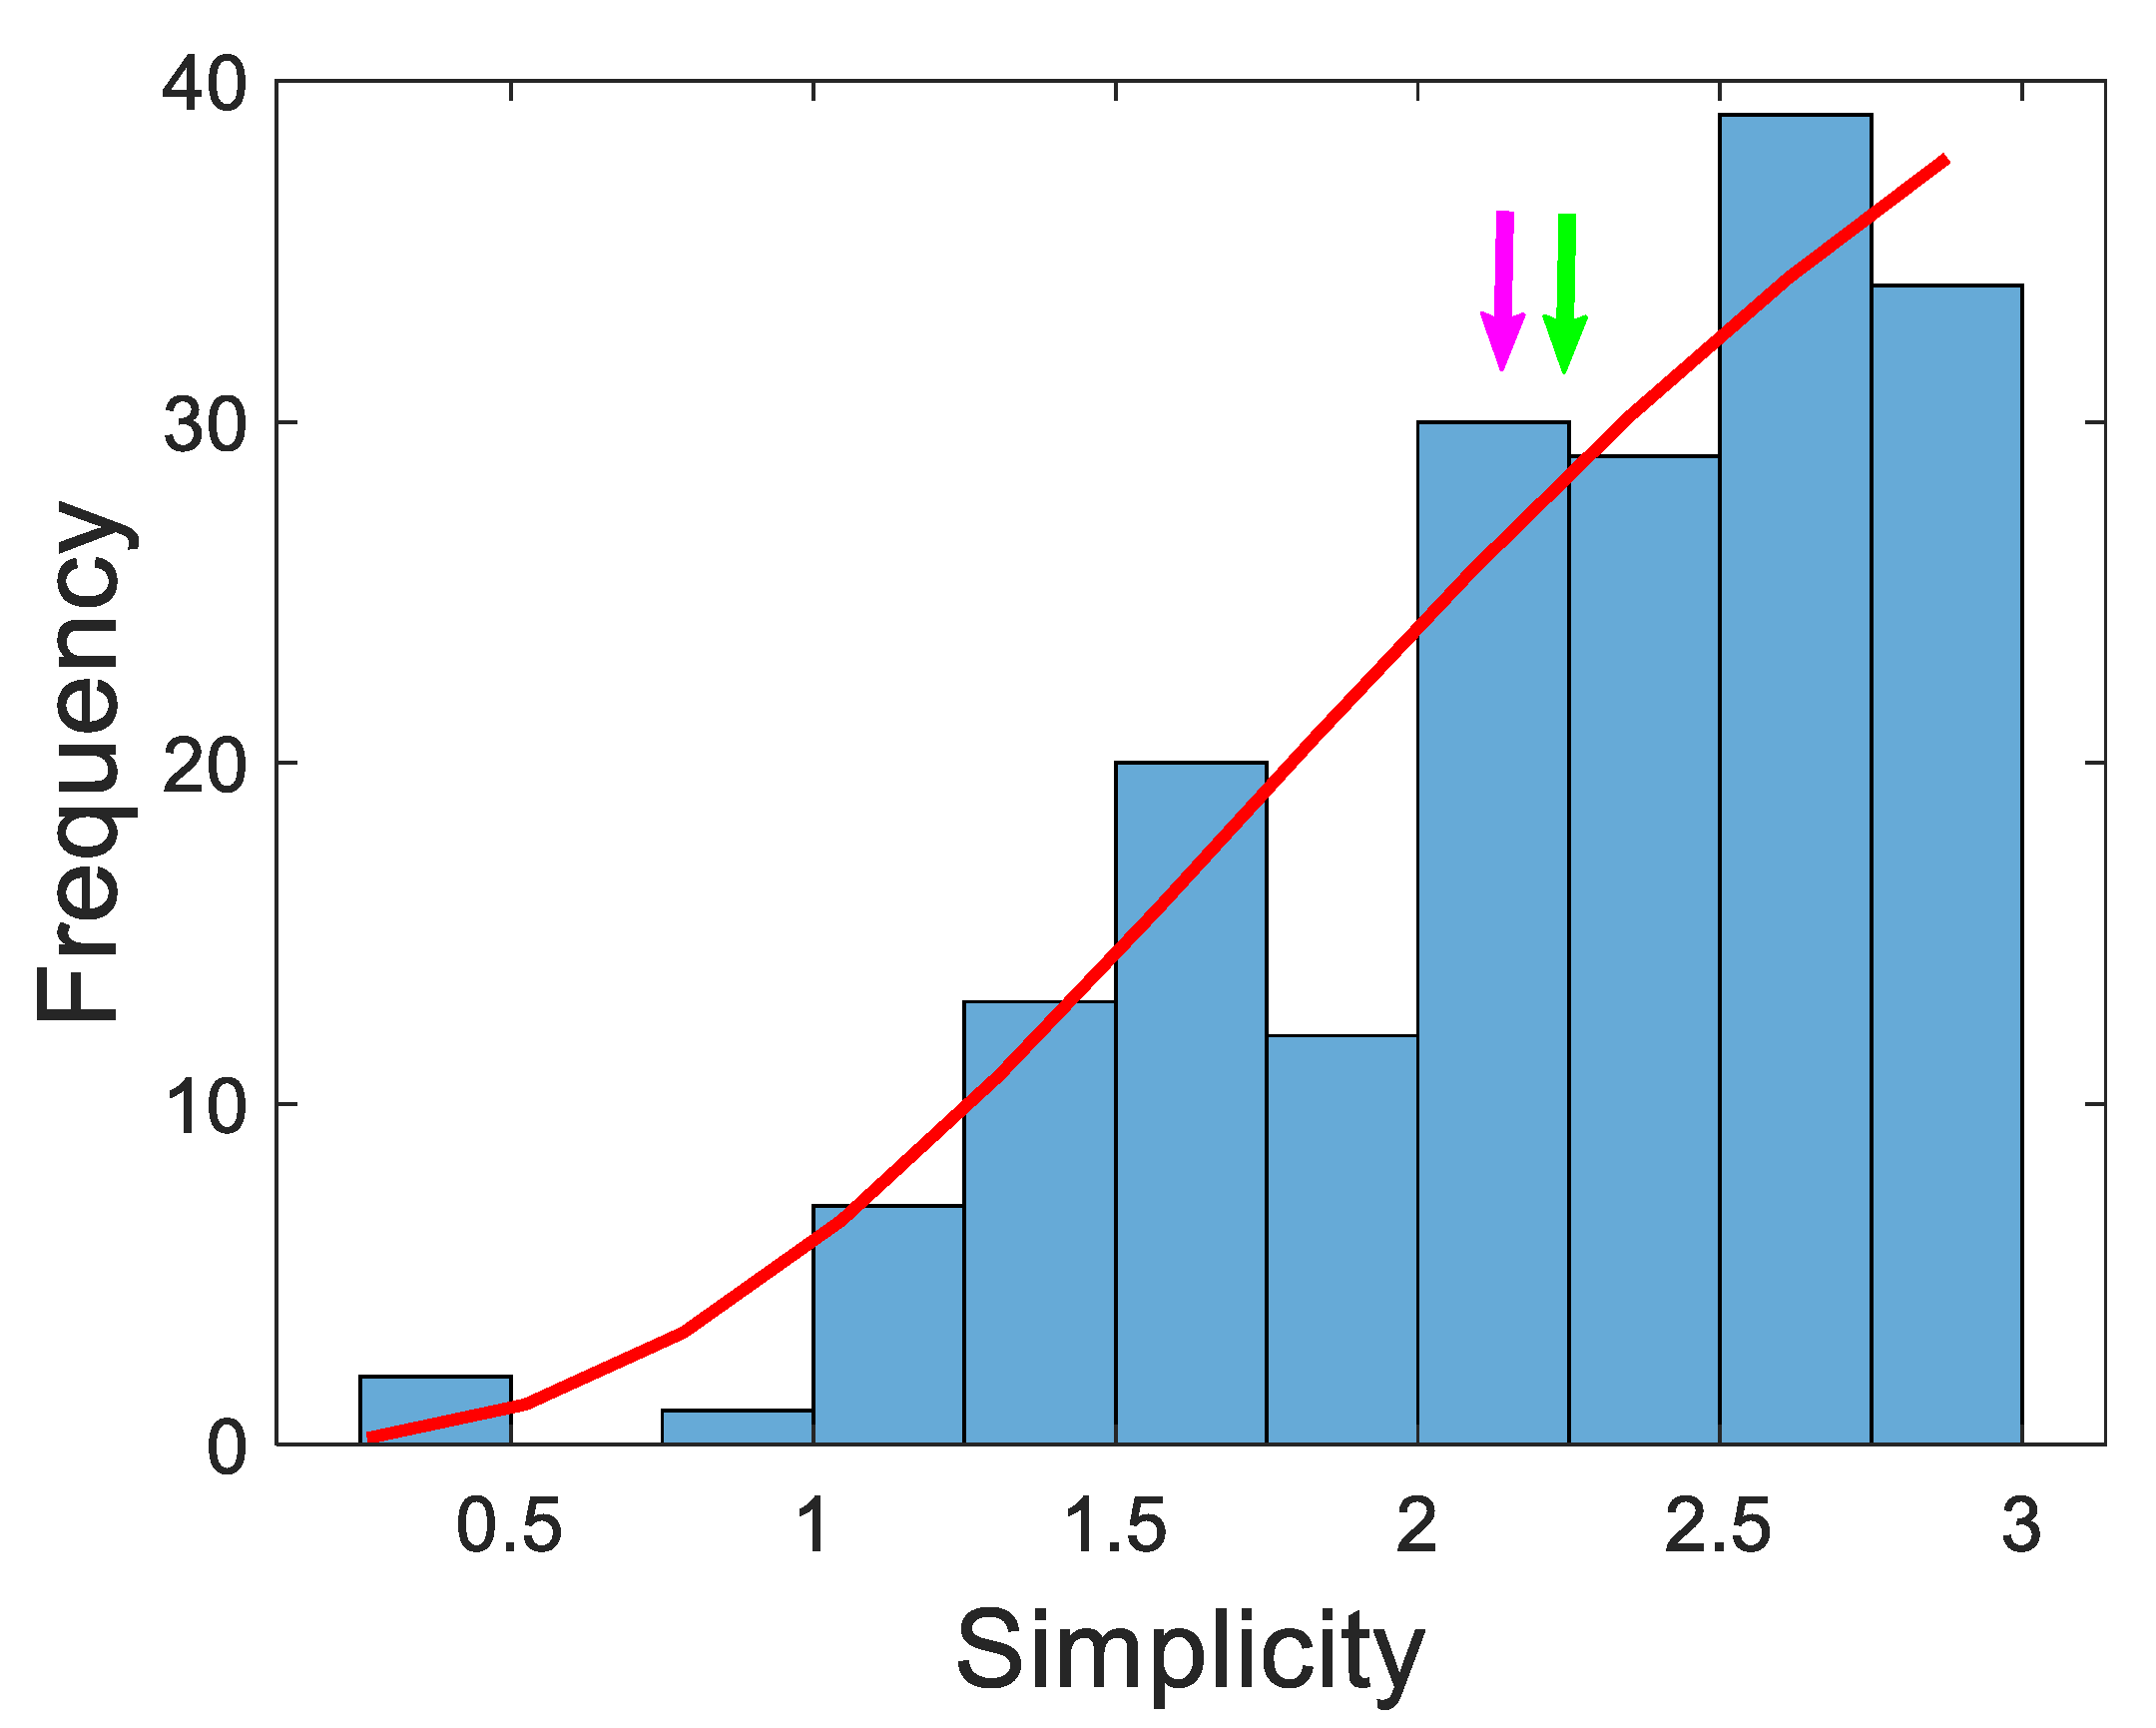
The distribution of patient characteristics within our EI group is shown in Figure 4. We fitted the data to a logistic function by means of the least-squares method to obtain the expression
f r e q = 59.14 1 + s i m p / 2.31 2.62
where freq and simp are the frequency and simplicity, respectively. This function fit the data very well (r2 = 0.9251).
The figure shows that the mean and median are the next most common. In fact, half of the data are between 2.25 and 3.0, which represents 25% of the range. Nevertheless, the remaining half was distributed in the lower 75% of the range, from 0.2 to 2.25. In this case of low simplicity, the agreement of preSurg was very low.
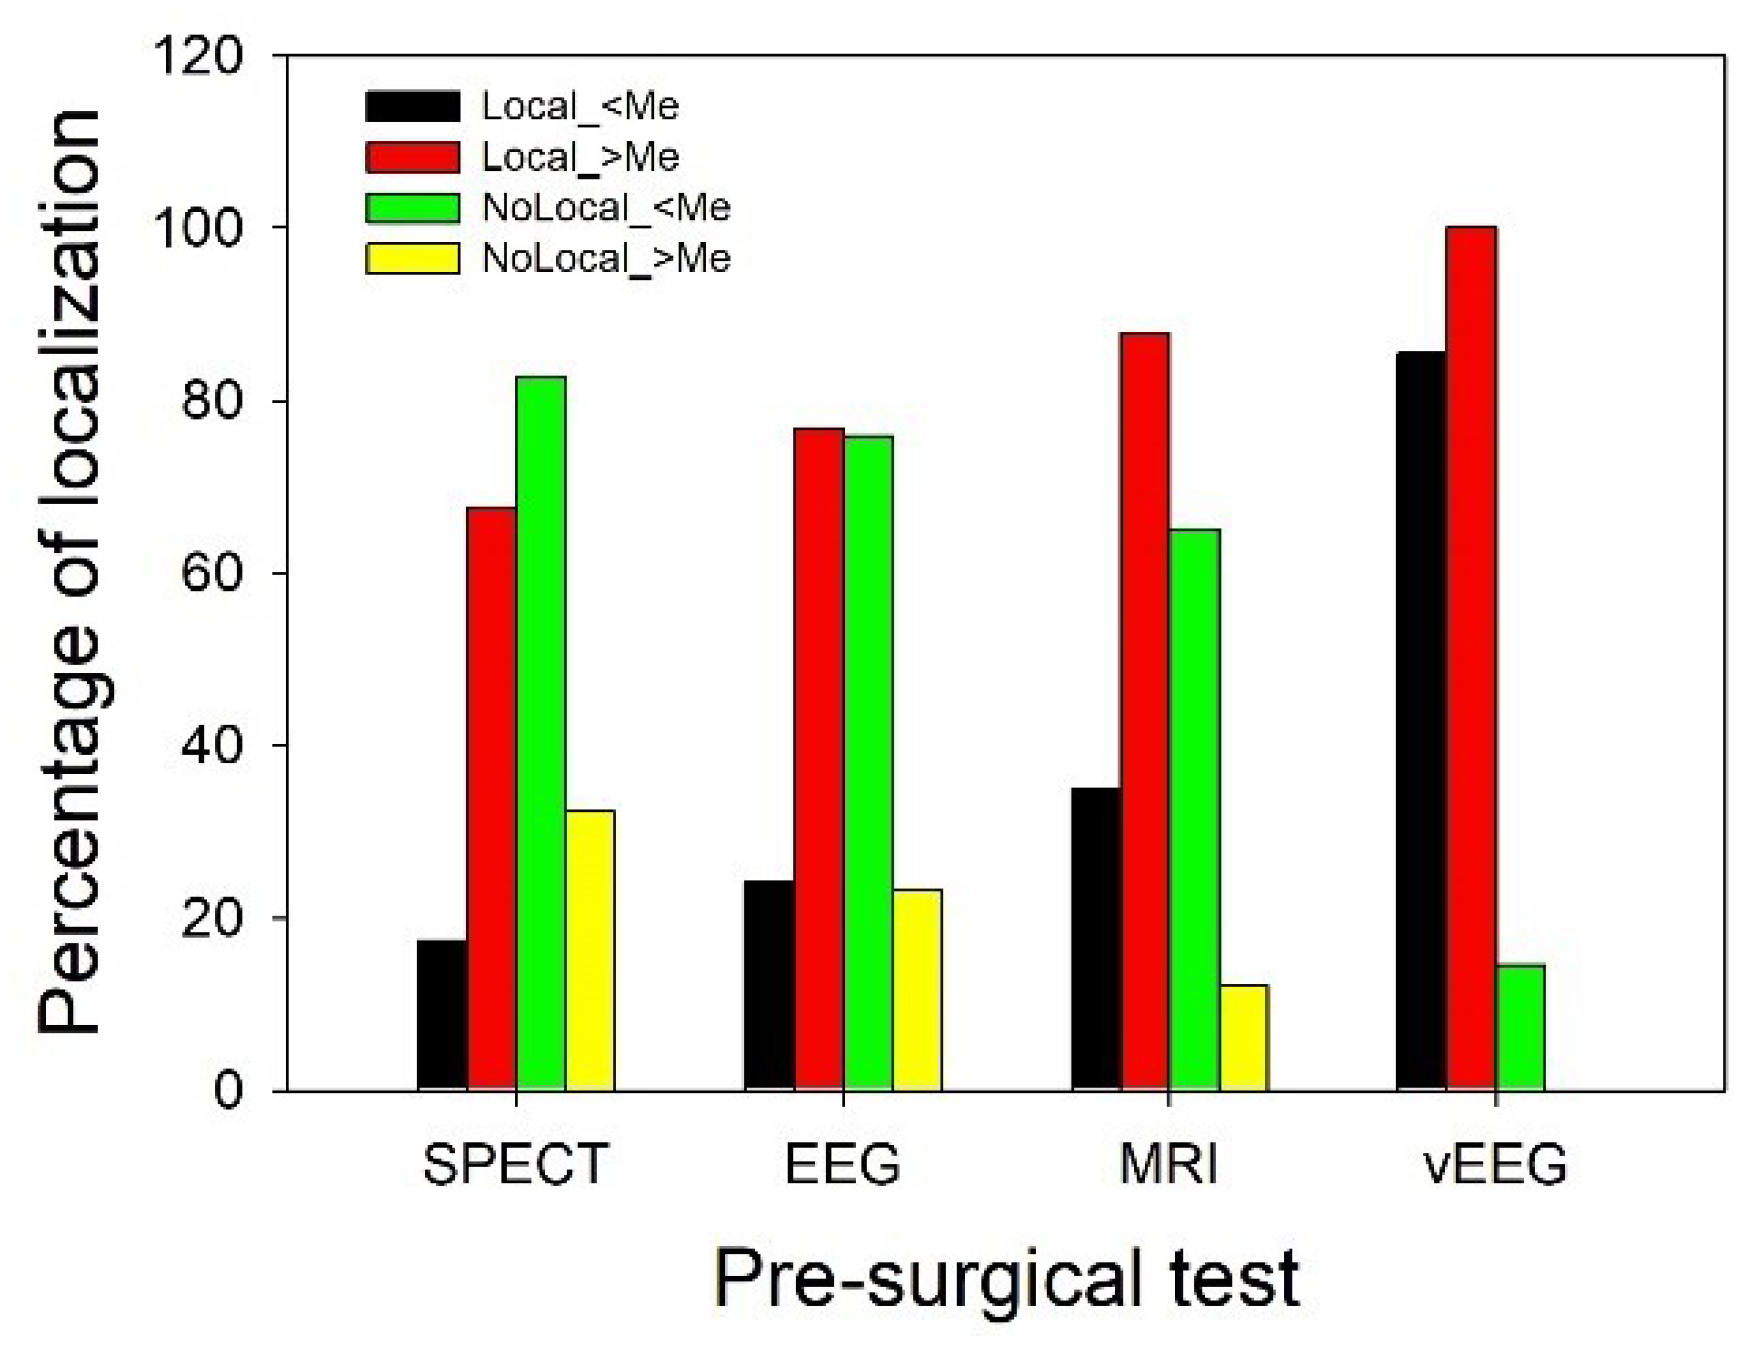
We assessed the contribution of every preSurg to both the low and high simplicity groups. We computed the percentage of localizing results in both groups as shown in Figure 5.
In patients with low simplicity, most of the MRI (65.0%), EEG (75.9%) and SPECT (82.6%) results were not localizing, but in the case of VEEG, 85.4% of patients had a localizing result. Therefore, practically all these patients underwent surgery with the information obtained from the VEEG. In high-simplicity patients, on the contrary, the information obtained for localization from all the preSurg was greater than 67%, with 87.8% for MRI and 100.0% for VEEG.
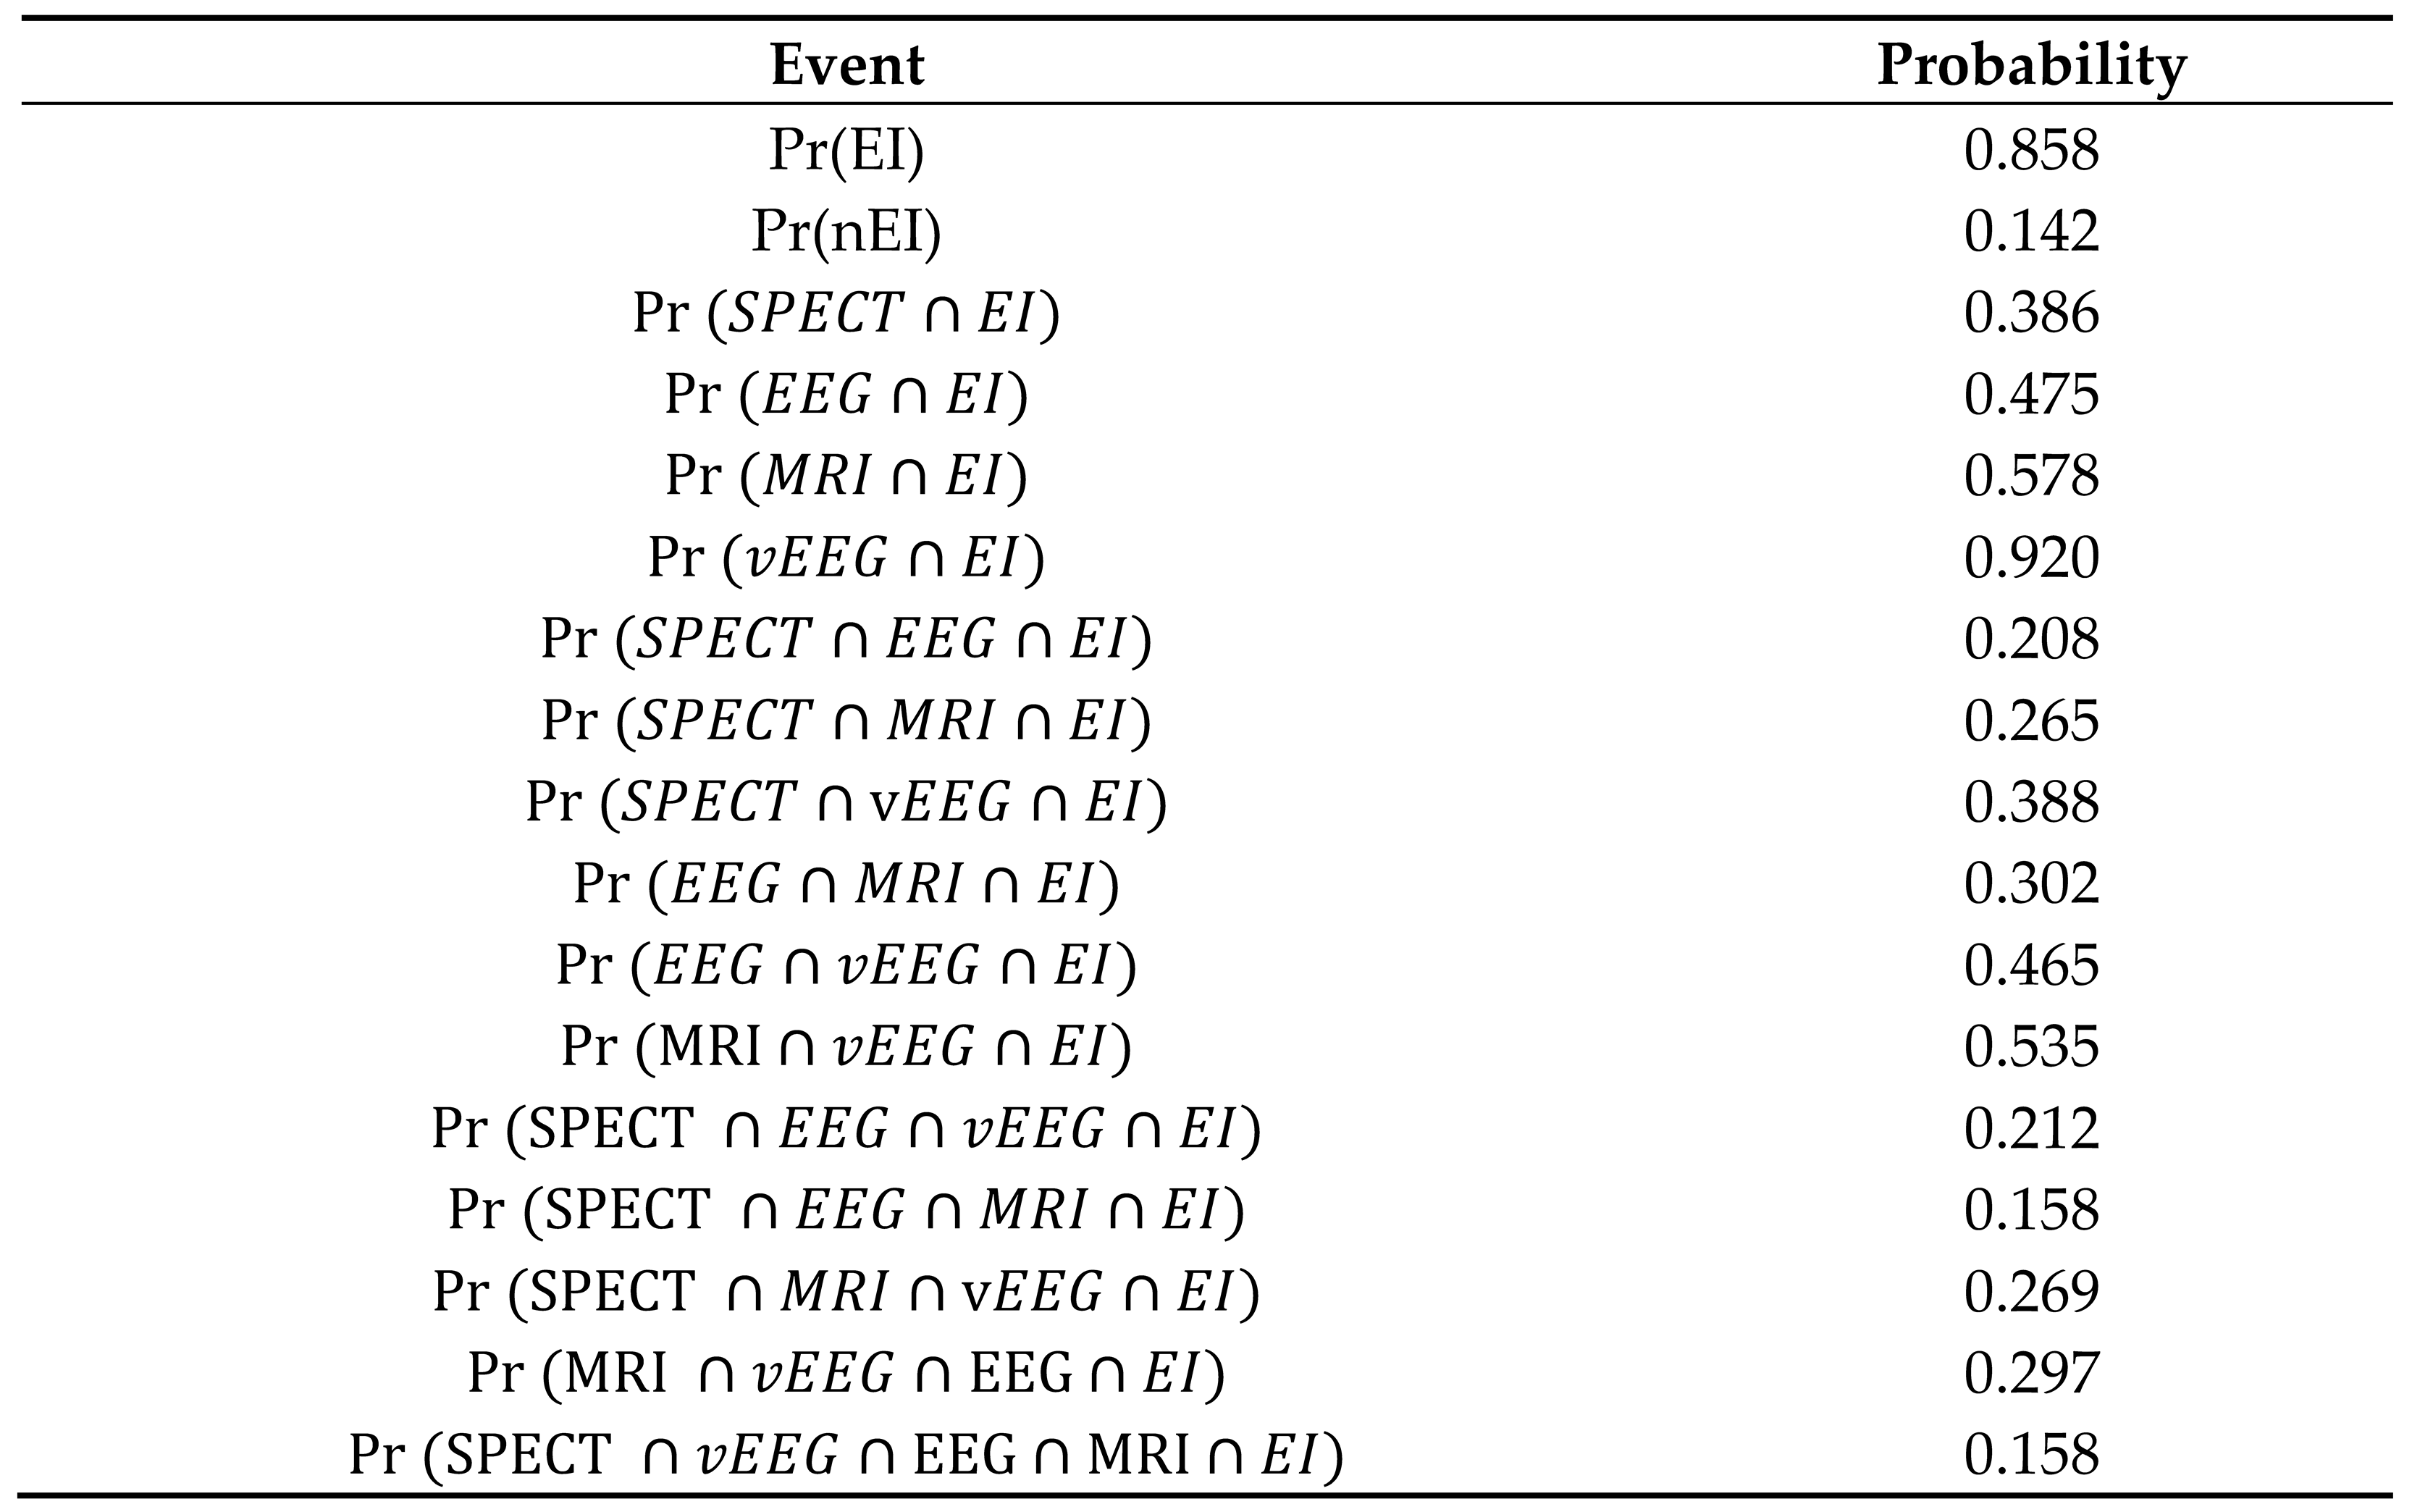
We assessed the probability of adequate localization in patients with EI for different combinations of preSurg. Following the definition of probability [22], we have assumed the equivalence between relative frequencies and probabilities. These results are shown in Table 4.
For individual tests, we ranked the preSurg from highest to lowest probability of localization: Pr(VEEG ∩ EI) > Pr(MRI ∩ EI) > Pr(EEG ∩ EI) > Pr(SPECT ∩ EI). The probability was greater for VEEG, in fact, 59.2% greater than for MRI. Interestingly, the probability of MRI results being slightly greater than the chance ratio was because a large number of patients did not present any specific lesions associated with epilepsy. Nevertheless, it must be remembered that these patients had EI, meaning that not performing MRI alone did not exclude a good postsurgical outcome. For the two presurgical test combinations, we listed the results as follows: Pr(VEEG ∩ MRI ∩ EI) > Pr(VEEG ∩ EEG ∩ EI) > Pr(VEEG ∩ SPECT ∩ EI) > Pr(EEG ∩ MRI ∩ EI) > Pr(MRI ∩ SPECT ∩ EI) > Pr(EEG ∩ SPECT ∩ EI). All the pairs, including VEEG, better localized the EZ. Similar results were observed for the combination of the three tests. Finally, the combination of the four tests only localized to the EZ with a low probability (0.158).

4. Discussion

In this work, we showed that VEEG was the preSurg method with the best ability to identify the EZ in TLE patients. Additionally, a very good outcome (85.8% of EI) could be attained even when a significant percentage of patients showed no localizing results on MRI (42.2% in EI). This is a very interesting finding because epileptic patients must be presurgically evaluated even when no localizing information about the EZ can be obtained via MRI.
The first aspect we must consider is the unsatisfactory definition of EZ [2,13]. This operational definition cannot guarantee a positive definition of the EZ in the majority of patients and depends on the postsurgical outcome. This situation has worsened with the appearance of the concept of network epilepsy and its variant of different threshold EZs [24] because, in this kind of pathophysiology, a true EZ could not be found [14,15,18]. In fact, although presurgical evaluations and surgeries have recently decreased in some TLE patients at most centres, the number of nonlesional patients, patients requiring intracranial recordings, and patients requiring neocortical resection has increased [25]. It is important to be conscious that the absence of structural lesions in imaging studies must not limit the referral of a patient to a specialized unit for presurgical evaluation.
Currently, imaging studies of a great number of TLE patients who underwent surgery due to refractory seizures revealed structural lesions [26,27,28,29,30,31]. However, patients with nonlesional TLE can be candidates for standard surgery and have good postoperative outcomes comparable to those of patients with lesional TLE, although invasive recording is usually needed in these patients [32].
The main flaw of our approach is the highly defective definition of variables related to nEI patients. We have assumed that an nEI outcome is due to the presence of the EZ in a brain area other than the OpZ; however, this is not necessarily true. The EZ may have been adequately identified, but the resection was insufficient, or the patient suffered from network epilepsy and a new EZ substituted for the former EZ or subsequent pathology (e.g., infection or bleeding) following the surgery, biasing the outcome. The main problem is that we have absolutely no way to unmask the true reason. Therefore, the definitions of TN and FP and the coefficients given to patients in the nEI group are more dubious than those given to patients in the EI group. Fortunately, this definition does not excessively affect our results because the percentage of nEI patients was only 14.2%. In this sense, we obtained similar statistical results for the whole cohort and for the nEI group, confirming this idea.
The value of the PPV is strongly dependent on the PD, and in cases where this value is low, the PPV can be underestimated. However, in our case, the PD was 0.858, which means that we could be confident in this probability. In the case of the PNV, the main problem was not the PD value but the difficulty in identifying true FN cases. As mentioned above, this problem cannot be satisfactorily resolved until a better definition of an EZ can be achieved.
It has been proposed that VEEG is not imperative in patients with unilateral mesial TLE hippocampal sclerosis who have compatible semiology with unilateral interictal epileptiform discharges (IEDs) ipsilateral to hippocampal sclerosis [31]. This finding is in good agreement with our finding for simple patients because, in these cases, the preSurg test results will coincide; therefore, redundant information was obtained. A completely different problem emerges for difficult patients, in which no matches are obtained for the preSurg test; in these patients, the most informative and mandatory preSurg test is VEEG. In fact, we observed that scalp VEEG was sufficient to identify the EZ. Indeed, hippocampal sclerosis on MRI, although probabilistically relevant as a predictor of good outcome, cannot be identified with certainty by the EZ because all patients (or at least a probability near one) with hippocampal sclerosis should obtain an EI outcome, which is not true, with percentages of EI between 67 and 82% [31,33]. Moreover, hippocampal sclerosis can be the main factor for predicting disease outcome, not the VEEG result [34]).
Globally, the percentage of adults with EI postsurgical outcomes is between 60 and 90% [35,36,37,38]. In our series, we obtained 85.8%. This result is in the upper part of the interval. However, more importantly, a high percentage of patients in our study did not have any localizing lesions on MRI (up to 42.2%), despite the postsurgical outcome being EI. This is not the first time that surgery has been performed in nonlesional patients. In fact, more than a decade ago, patients with medically intractable epilepsy and normal MRI findings appeared to benefit from epilepsy surgery [39].
In our work, a very interesting finding was the close predictive value of EEG compared with MRI for most of the analyses performed (for α, PPV, PNV or probability), although some values obtained from confusion matrices were lower for EEG. This fact is more relevant when considering that EEG has access to neither intracranial data (as MRI or SPECT do) nor ictal events (as VEEG does. Therefore, this topic continues to be a very important topic in presurgical evaluation [6,25]. However, the low values obtained for interictal SPECT and the exclusion of these data from the logistic model indicate that this test is not needed to systematically evaluate TLM patients. We have not evaluated the utility of peri-ictal SPECT, although etomidate activated SPECT can be used to localize the EZ very precisely during either interictal activity [40,41] or the ictal period.
It is commonly assumed that the agreement of preSurg will be correlated with functional outcome. Therefore, high congruence implies a better result than low agreement. This is a very reasonable hypothesis, but it is important to keep in mind that not all the intrinsic information obtained from preSurg is similar, and on the other hand, patients will have intrinsic complexity, which means that presurgical evaluation needs to be highly individualized.
Therefore, epilepsy patients cannot be excluded from presurgical evaluation because of the absence of lesions on imaging. Temporal lobe epilepsy is likely more complex than hippocampal sclerosis because it includes more pathophysiological aetiologies, and we must remember that epilepsy is primarily an illness affecting bioelectrical excitability [42,43,44]. Therefore, preSurg, which evaluates bioelectrical activity, mainly during seizures, is more directly related to pathophysiology than morphological, metabolic or vascular perfusion.

5. Conclusions

EZs in temporal lobe epilepsy patients can sometimes be very difficult to identify because preSurg do not overlap within the same anatomical region. Even in these complicated cases, presurgical evaluation should be performed because the outcome is not necessarily poor. In fact, the information obtained from VEEG can be enough to accurately identify the EZ and increase the probability of success in a group of patients with a high percentage of noninformative imaging studies. Scalp EEG is a very informative technique, although interictal SPECT can be considered unnecessary as a systematic presurgical test.

Author Contributions

J.P. is responsible for the idea. L.V.-Z., P.P, R.G.S. and J.P. participated in data collection. J.P. developed the analytical methods and L.V.-Z. participated in analysis and interpretation, and J.P. was responsible for manuscript preparation. All authors approved the submitted version of this manuscript.

Funding

None.

Institutional Review Board Statement

Ethical review and approval were waived for this study due to was deemed “care as usual.

Informed Consent Statement

Patient consent was waived due to it is considered a regular study.

Data Availability Statement

No new data was created.

Conflicts of Interest

The authors declare no conflict of interest.

Appendix A

For every model, we computed the likelihood (L), which is defined as
L = i = 1 N p i Y i ( 1 p i ) 1 Y i
where pi is the probability of EI/nEI assigned by the model and Y1 = EI and Y0 = nEI. L is a measure of how good the model fits the real data. A better classification of all the patients by the model would give rise to L = 1. Usually, the numerical values are very small because it is preferable to convert a more useful variable, called deviance (d), defined as
d = 2 ln L
Therefore, the lower d is, the better the prediction of a model. For every pair of ds, we can obtain the following statistics: the likelihood ratio (LR), which follows a chi-squared ( χ 2 ) distribution, and N0-N degrees of freedom (d.o.f.). Then, LR has the form
L R = d 0 d = 2 ln L 0 + 2 ln L = 2 ln L 0 L
The algorithm for building a better regression model follows the next steps (Silva, Barroso 2004[20]):
  • Initially, we computed the “null model” (L0) and obtained the null deviance (d0). Then, we computed a simple binary regression model for every preSurg, obtaining the deviances for everyone, i.e., dSPECT, dEEG, dMRI and dVEEG. Obviously, each of these parameters was smaller than d0. Then, we computed L R i ; i = S P E C T ,   E E G ,   M R I ,   v E E G following Equation 12 and identified the highest. Let us suppose   L R k = 2 ln L 0 L k
  • We evaluated the significance of the LR by means of χ 2 . If L R k was greater than 3.84 (95 percentile for χ 2 one d.o.f.), then the variable k was incorporated into the model.
  • We computed two-variable models, obtaining L k i , where i = preSurg-{k}. Obviously, we had three possibilities. We identified the lowest one, named L k l . We evaluated L R k l = 2 ln L k L k l , and if it was greater than 3.84, we incorporated the variable l into the model.
  • We repeated this procedure until the four preSurg were incorporated or after a new incorporation did not result in significant results.
Table A1. Definition of accuracy for preSurg for different variables.
Variable Coefficient (± SEM) Wald statistic Odds Ratio Confidence interval
Constant -4.425 ± 1.385 10.207 0.012 0.001-0.181
VEEG 3.106 ± 1.224 6.440 22.329 2.028-245.859
MRI 2.558 ± 1.364 3.516 12.914 0.891-187.250
EEG 1.905 ±1.419 1.803 6.718 0.417-108.335

References

  1. de Tisi, J.; Bell, G.S.; Peacock, J.L.; McEvoy, A.W.; Harkness, W.F.; Sander, J.W.; Duncan, J.S. The long-term outcome of adult epilepsy surgery, patterns of seizure remission, and relapse: a cohort study. Lancet 2011, 378, 1388–1395. [Google Scholar] [CrossRef] [PubMed]
  2. Rosenow, F.; Luders, H. Presurgical evaluation of epilepsy. Brain 2001, 124, 1683–1700. [Google Scholar] [CrossRef] [PubMed]
  3. Jehi, L.; Jette, N.; Kwon, C.S.; Josephson, C.B.; Burneo, J.G.; Cendes, F.; Sperling, M.R.; Baxendale, S.; Busch, R.M.; Triki, C.C.; Cross, J.H.; Ekstein, D.; Englot, D.J.; Luan, G.; Palmini, A.; Rios, L.; Wang, X.; Roessler, K.; Rydenhag, B.; Ramantani, G.; Schuele, S.; Wilmshurst, J.M.; Wilson, S.; Wiebe, S. Timing of referral to evaluate for epilepsy surgery: Expert Consensus Recommendations from the Surgical Therapies Commission of the International League Against Epilepsy. Epilepsia 2022, 63, 2491–2506. [Google Scholar] [CrossRef] [PubMed]
  4. Duncan, J.S.; Winston, G.P.; Koepp, M.J.; Ourselin, S. Brain imaging in the assessment for epilepsy surgery. Lancet Neurol. 2016, 15, 420–433. [Google Scholar] [CrossRef] [PubMed]
  5. Sola, R.G.; Hernando-Requejo, V.; Pastor, J.; García-Navarrete, E.; DeFelipe, J.; Alijarde, M.T.; Sánchez, A.; Domínguez-Gadea, L.; Martín-Plasencia, P.; Maestú, F.; DeFelipe-Oroquieta, J.; Ramón-Cajal, S.; Pulido-Rivas, P. Epilepsia farmacorresistente del lóbulo temporal. Exploración con electrodos del foramen oval y resultados quirúrgicos [Pharmacoresistant temporal-lobe epilepsy. Exploration with foramen ovale electrodes and surgical outcomes]. Rev Neurol. 2005, 41, 4–16. (In Spanish) [Google Scholar] [PubMed]
  6. Pastor, J.; Hernando-Requejo, V.; Domínguez-Gadea, L.; de Llano, I.; Meilán-Paz, M.L.; Martínez-Chacón, J.L.; Sola, R.G. Impacto de la experiencia sobre los resultados quirúrgicos en la epilepsia del lóbulo temporal [Impact of experience on improving the surgical outcome in temporal lobe epilepsy]. Rev Neurol. 2005, 41, 709–716. (In Spanish) [Google Scholar] [PubMed]
  7. Bernasconi, A.; Cendes, F.; Theodore, W.H.; Gill, R.S.; Koepp, M.J.; Hogan, R.E.; Jackson, G.D.; Federico, P.; Labate, A.; Vaudano, A.E.; Blümcke, I.; Ryvlin, P.; Bernasconi, N. Recommendations for the use of structural magnetic resonance imaging in the care of patients with epilepsy: A consensus report from the International League Against Epilepsy Neuroimaging Task Force. Epilepsia 2019, 60, 1054–1068. [Google Scholar] [CrossRef]
  8. Taherpour, J.; Jaber, M.; Voges, B.; Apostolova, I.; Sauvigny, T.; House, P.M.; Lanz, M.; Lindenau, M.; Klutmann, S.; Martens, T.; Stodieck, S.; Buchert, R. Predicting the Outcome of Epilepsy Surgery by Covariance Pattern Analysis of Ictal Perfusion SPECT. J Nucl Med. 2022, 63, 925–930. [Google Scholar] [CrossRef]
  9. Wiebe, S.; Blume, W.T.; Girvin, J.P.; Eliasziw, M. Effectiveness and Efficiency of Surgery for Temporal Lobe Epilepsy Study Group. A randomized, controlled trial of surgery for temporal-lobe epilepsy. N Engl J Med. 2001, 345, 311–318. [Google Scholar] [CrossRef]
  10. Engel, J., Jr. The current place of epilepsy surgery. Curr. Opin. Neurol. 2018, 31, 192–197. [Google Scholar] [CrossRef]
  11. Barba, C.; Cossu, M.; Guerrini, R.; Di Gennaro, G.; Villani, F.; De Palma, L.; Grisotto, L.; Consales, A.; Battaglia, D.; Zamponi, N.; d’Orio, P.; Revay, M.; Rizzi, M.; Casciato, S.; Esposito, V.; Quarato, P.P.; Di Giacomo, R.; Didato, G.; Pastori, C.; Pavia, G.C.; Pellacani, S.; Matta, G.; Pacetti, M.; Tamburrini, G.; Cesaroni, E.; Colicchio, G.; Vatti, G.; Asioli, S.; Caulo, M.; TLE Study Group; Marras, C. E.; Tassi, L. Temporal lobe epilepsy surgery in children and adults: A multicenter study. Epilepsia 2021, 62, 128–142. [Google Scholar] [CrossRef] [PubMed]
  12. Li, Y.; Liu, P.; Lin, Q.; Zhou, D.; An, D. Postoperative seizure and memory outcome of temporal lobe epilepsy with hippocampal sclerosis: A systematic review. Epilepsia 2023, 64, 2845–2860. [Google Scholar] [CrossRef] [PubMed]
  13. Jehi, L. The Epileptogenic Zone: Concept and Definition. Epilepsy Curr. 2018, 18, 12–16. [Google Scholar] [CrossRef] [PubMed]
  14. Bartolomei, F.; Wendling, F.; Bellanger, J.J.; Regis, J.; Chauvel, P. Neural networks involving the medial temporal structures in temporal lobe epilepsy. Clin. Neurophysiol. 2001, 112, 1746–1760. [Google Scholar] [CrossRef] [PubMed]
  15. Spencer, S.S. Neural networks in human epilepsy: evidence of and implications for treatment. Epilepsia 2002, 43, 219–227. [Google Scholar] [CrossRef]
  16. Sequeira, K.M.; Tabesh, A.; Sainju, R.K.; DeSantis, S.M.; Naselaris, T.; Joseph, J.E.; Ahlman, M.A.; Spicer, K.M.; Glazier, S.S.; Edwards, J.C.; Bonilha, L. Perfusion network shift during seizures in medial temporal lobe epilepsy. PLoS One 2013, 8, e53204. [Google Scholar] [CrossRef] [PubMed]
  17. Pastor, J.; Sola, R.G.; Vega-Zelaya, L.; Garnés, O.; Ortega, J. New network and synchronization approaches in focal research epilepsy and treatment. Health 2013, 5, 1–8. [Google Scholar] [CrossRef]
  18. Pastor, J.; Vega-Zelaya, L. Redes neurales en epilepsia. In Contribución Iberoamericana a la Epilepsia; Velasco, A.L., Ed.; Editorial Alfil, Mexico: ISBN, 2018; pp. 17–33. [Google Scholar]
  19. Franco Nicolás, M.; Vivo Molina, J.M. Análisis de curvas ROC. Principios básicos y aplicaciones. La Muralla SA, Madrid. 2007; ISBN 978-84-7133-772-6. [Google Scholar]
  20. Silva Ayçaguer, L.C.; Barroso Utra, I.M. Regresión Logística. La Muralla SA; Madrid. 2004; ISBN 84-7133-738-X. [Google Scholar]
  21. Hosmer, D.E.; Lemeshow, S.; Sturdivant, R.X. Applied logistic regressions, 3rd ed.; John Wiley and Sons: New York, NY, USA. [CrossRef]
  22. Spiegel, M.R.; Schiller, J.J.; Srinivasan, R.A. Probability and statistics; McGraw-Hill: New York, NY, USA; ISBN 978-0-07-177751-3.
  23. Biggerstaff, B.J. Comparing diagnostic test: a simple graphic using likelihood ratios. Statist. Med. 2000, 19, 649–663. [Google Scholar] [CrossRef]
  24. Schmeiser, B.; Zentner, J.; Steinhoff, B.J.; Brandt, A.; Schulze-Bonhage, A.; Kogias, E.; Hammen, T. The role of presurgical EEG parameters and of reoperation for seizure outcome in temporal lobe epilepsy. Seizure 2017, 51, 174–179. [Google Scholar] [CrossRef]
  25. Baumgartner, C.; Koren, J.P.; Britto-Arias, M.; Zoche, L.; Pirker, S. Presurgical epilepsy evaluation and epilepsy surgery. F1000Res 2019, 8, F1000. [Google Scholar] [CrossRef]
  26. Immonen, A.; Jutila, L.; Kälviäinen, R.; Mervaala, E.; Partanen, K.; Partanen, J.; Vanninen, R.; Ylinen, A.; Alafuzoff, I.; Paljärvi, L.; Hurskainen, H.; Rinne, J.; Puranen, M.; Vapalahti, M. Preoperative clinical evaluation, outline of surgical technique and outcome in temporal lobe epilepsy. Adv Tech Stand Neurosurg. 2004, 29, 87–132. [Google Scholar] [CrossRef] [PubMed]
  27. Erdem, A.; Demirciler, A.K.; Solmaz, S.; Ozgural, O.; Eroglu, U.; Wambe, A.; Tekneci, O. Surgical Treatment of Temporal Lobe Epilepsy and Micro-Neuroanatomical Details of the Medial Temporal Region. Turk Neurosurg. 2021, 31, 422–431. [Google Scholar] [CrossRef] [PubMed]
  28. Morita-Sherman, M.; Li, M.; Joseph, B.; Yasuda, C.; Vegh, D.; De Campos, B.M.; Alvim, M.K.M.; Louis, S.; Bingaman, W.; Najm, I.; Jones, S.; Wang, X.; Blümcke, I.; Brinkmann, B.H.; Worrell, G.; Cendes, F.; Jehi, L. Incorporation of quantitative MRI in a model to predict temporal lobe epilepsy surgery outcome. Brain Commun. 2021, 3, fcab164. [Google Scholar] [CrossRef] [PubMed]
  29. Wieshmann, U.C.; Larkin, D.; Varma, T.; Eldridge, P. Predictors of outcome after temporal lobectomy for refractory temporal lobe epilepsy. Acta Neurol Scand. 2008, 118, 306–312. [Google Scholar] [CrossRef] [PubMed]
  30. Jutila, L.; Immonen, A.; Mervaala, E.; Partanen, J.; Partanen, K.; Puranen, M.; Kälviäinen, R.; Alafuzoff, I.; Hurskainen, H.; Vapalahti, M.; Ylinen, A. Long term outcome of temporal lobe epilepsy surgery: analyses of 140 consecutive patients. J Neurol Neurosurg Psychiatry. 2002, 73, 486–494. [Google Scholar] [CrossRef] [PubMed]
  31. Alvim, M.K.M.; Morita, M.E.; Yasuda, C.L.; Damasceno, B.P.; Lopes, T.M.; Coan, A.C.; Ghizoni, E.; Tedeschi, H.; Cendes, F. Is inpatient ictal video-electroencephalographic monitoring mandatory in mesial temporal lobe epilepsy with unilateral hippocampal sclerosis? A prospective study. Epilepsia 2018, 59, 410–419. [Google Scholar] [CrossRef] [PubMed]
  32. Kuba, R.; Tyrlíková, I.; Chrastina, J.; Slaná, B.; Pažourková, M.; Hemza, J.; Brázdil, M.; Novák, Z.; Hermanová, M.; Rektor, I. “MRI-negative PET-positive” temporal lobe epilepsy: invasive EEG findings, histopathology, and postoperative outcomes. Epilepsy Behav. 2011, 22, 537–541. [Google Scholar] [CrossRef] [PubMed]
  33. da Conceição, P.O.; Nascimento, P.P.; Mazetto, L.; Alonso, N.B.; Yacubian, E.M.; de Araujo Filho, G.M. Are psychiatric disorders exclusion criteria for video-EEG monitoring and epilepsy surgery in patients with mesial temporal sclerosis? Epilepsy Behav. 2013, 27, 310–314. [Google Scholar] [CrossRef]
  34. Monnerat, B.Z.; Velasco, T.R.; Assirati, J.A., Jr.; Carlotti, C.G., Jr.; Sakamoto, A.C. On the prognostic value of ictal EEG patterns in temporal lobe epilepsy surgery: a cohort study. Seizure 2013, 22, 287–291. [Google Scholar] [CrossRef]
  35. Lowe, N.M.; Eldridge, P.; Varma, T.; Wieshmann, U.C. The duration of temporal lobe epilepsy and seizure outcome after epilepsy surgery. Seizure 2010, 19, 261–263. [Google Scholar] [CrossRef]
  36. Hebel, J.M.; Heerwig, C.; Möller, H.; Sauvigny, T.; Martens, T.; Dührsen, L.; Stodieck, S.R.G.; Brückner, K.; Lanz, M. Resective epilepsy surgery in patients aged 50 years and older–A retrospective study regarding seizure outcome, memory performance, and psychopathology. Epilepsy Behav. 2021, 118, 107933. [Google Scholar] [CrossRef] [PubMed]
  37. Meguins, L.C.; Adry, R.A.; Silva-Junior, S.C.; Araújo Filho, G.M.; Marques, L.H. Shorter epilepsy duration is associated with better seizure outcome in temporal lobe epilepsy surgery. Arq Neuropsiquiatr. 2015, 73, 212–217. [Google Scholar] [CrossRef] [PubMed]
  38. Barba, C.; Giometto, S.; Lucenteforte, E.; Pellacani, S.; Matta, G.; Bettiol, A.; Minghetti, S.; Falorni, L.; Melani, F.; Di Giacomo, G.; Giordano, F.; De Masi, S.; Guerrini, R. Seizure Outcome of Temporal Lobe Epilepsy Surgery in Adults and Children: A Systematic Review and Meta-Analysis. Neurosurgery 2022. [CrossRef] [PubMed]
  39. Smith, A.P.; Sani, S.; Kanner, A.M.; Stoub, T.; Morrin, M.; Palac, S.; Bergen, D.C.; Balabonov, A.; Smith, M.; Whisler, W.W.; Byrne, R.W. Medically intractable temporal lobe epilepsy in patients with normal MRI: surgical outcome in twenty-one consecutive patients. Seizure 2011, 20, 475–479. [Google Scholar] [CrossRef] [PubMed]
  40. Pastor, J.; Wix, R.; Meilán, M.L.; Martínez-Chacón, J.L.; De Dios, E.; Domínguez-Gadea, L.; HerreraPeco, I.; Sola, R.G. Etomidate accurately localizes the epileptic area in patients with temporal lobe epilepsy. Epilepsia 2010, 51, 602–609. [Google Scholar] [CrossRef] [PubMed]
  41. Pastor, J.; Domínguez-Gadea, L.; Sola, R.G.; Hernando, V.; Meilán, M.L.; De Dios, E.; Martínez-Chacón, J.L.; Martínez, M. First true initial ictal SPECT in partial epilepsy verified by electroencephalography. Neuropsychiatr Dis Treat. 2008, 4, 305–309. [Google Scholar] [CrossRef]
  42. Wang, Y.; Tan, B.; Wang, Y.; Chen, Z. Cholinergic Signaling, Neural Excitability, and Epilepsy. Molecules 2021, 26, 2258. [Google Scholar] [CrossRef]
  43. Akyuz, E.; Polat, A.K.; Eroglu, E.; Kullu, I.; Angelopoulou, E.; Paudel, Y.N. Revisiting the role of neurotransmitters in epilepsy: An updated review. Life Sci. 2021, 265, 118826. [Google Scholar] [CrossRef]
  44. Yang, L.; Wang, Y.; Chen, Z. Central histaminergic signalling, neural excitability and epilepsy. Br J Pharmacol. 2022, 179, 3–22. [Google Scholar] [CrossRef]
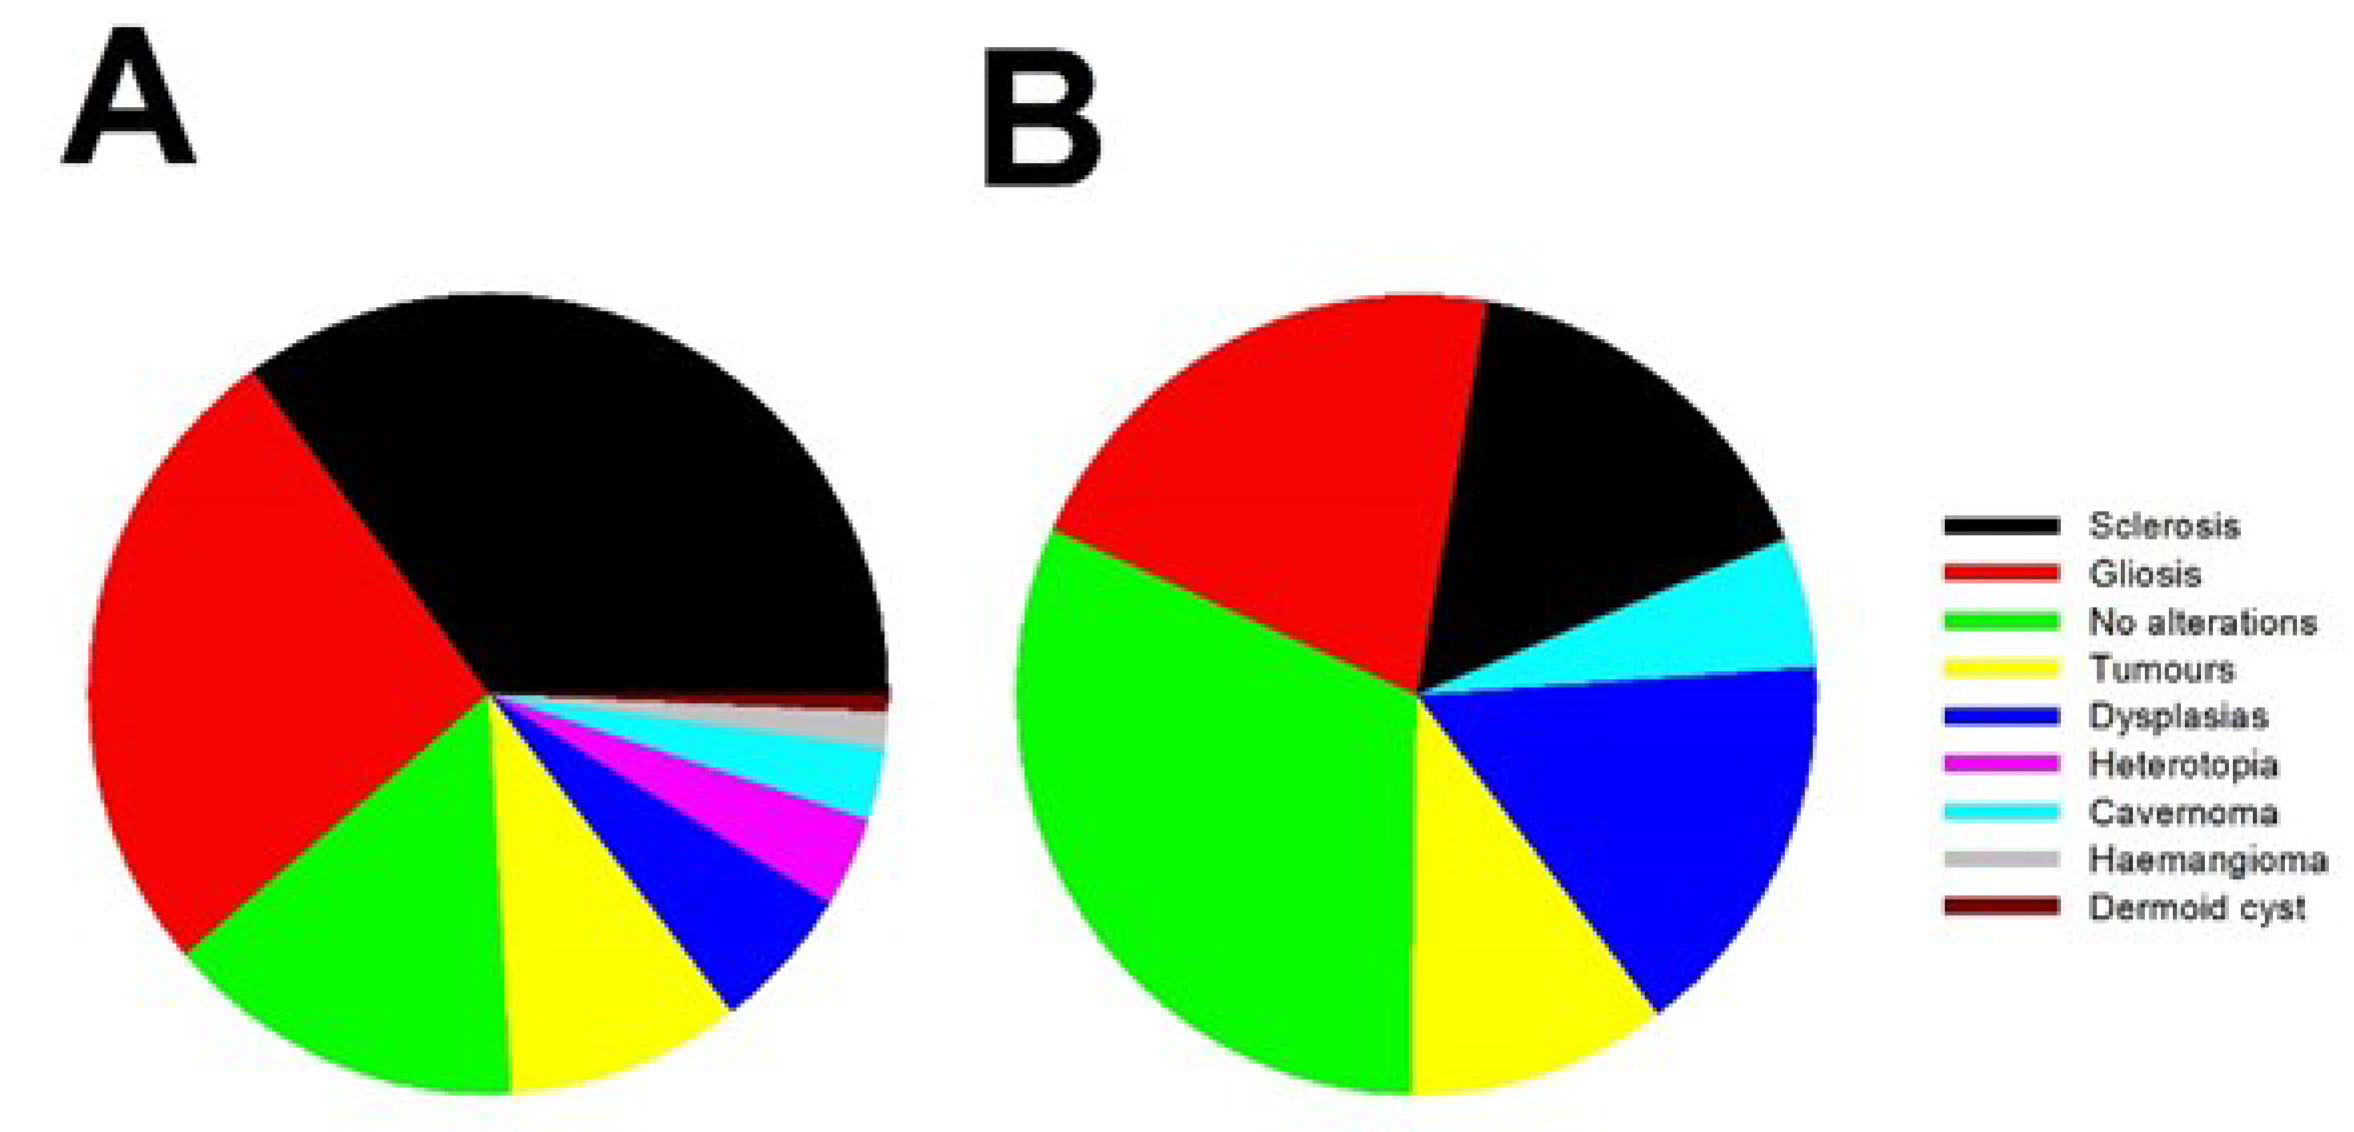
Figure 1. Pie charts showing the percentage of pathological findings from surgical specimens for a) EI and b) nEI patients.
Preprints 98440 g001
Figure 2. Accuracy in the identification of EZ in Engel’s grade I patients. (a) 3D bar graph showing the distribution of coefficients for the different preSurg; (b) 2D bar graph showing overlapped the distributions of the different test and the averages from all the test (black lines). Colors are the same for both graphs: dark red = SPECT, orange = EEG; yellow = MRI and green = VEEG.
Preprints 98440 g002
Figure 3. Different regions defined by the VEEG values of 1-Sp and S. Gray dashed lines going through this point and extreme points (0,0) and (1,1). Both lines have the expressions S = 0.978 × ( 1 S p ) and S = 1.323 × 1 S p 0.323 . Points for the rest of preSurg are also showed and all of them are located below both of lines.
Preprints 98440 g003
Figure 4. Distribution of simplicity for all the EI patients. Green arrow = median; Purple arrow = mean. The red line represents the logistic function fitted. Bin = 0.25.
Preprints 98440 g004
Figure 5. Graph bar showing the percentage of localization (Local) and non-localization (NoLocal) results in EI patients with low simplicity (α < Me) and high simplicity (α > Me) for all the preSurg.
Preprints 98440 g005
Table 1. Performance of preSurg for different variables.
Outcome Result of preSurg α True/False classification Example from EEG*
EI Indicates a lobe that coincides with the EZ 3 TP Left temporal sharp waves
Indicates the hemisphere where EZ is located 2 FN Left fronto-temporal sharp waves
Indicates a non-informative result 1 FN Physiological or generalized spike-wave
Indicates the contralateral hemisphere 0 FN Right sharp waves
nEI Indicates the same OpZ 0 FP Left temporal sharp waves
Indicates a region different from OpZ 1 TN Left frontal sharp waves
EI = Engel’s I grade; FN = false negative; EZ = epileptic zone; FP = false positive; nEI = non-Engel’s I grade; OpZ = operated zone; TN = true negative; TP = true positive; *Suppose a patient operated from the left temporal lobe.
Table 2. Clinical and demographic features.
Variable Men Women p
N 112 106
Age (years) 37.0 ± 1.1 39.7 ± 1.1 0.077*
Start epilepsy (years) 13.9 ± 1.1 14.1 ± 1.0 0.521**
Time of epilepsy (years) 23.1 ± 1.2 25.6 ± 1.2 0.159*
AED 3.1 ± 0.2 2.8 ± 0.1 0.055**
One 3.6 3.6 < 0.001***
Two 10.7 32.1
Three 57.1 50.0
Four 25.0 14.3
Five 3.6 0.0
Frequency
Daily 16.8 18.5 0.500***
Weekly 51.3 54.6
Monthly 31.9 26.9
*Student-t test; **Mann-Whitney Rank Sum test;***Chi-squared test.
Table 3. Matrix of confusion for all the preSurg. Variables are shown as probabilities and totals in absolute frequencies. Inside brackets are shown 95% confidence intervals.
Pre-surgical test Outcome Localization Not localization Total
EI 0.386* (0.379-0.393) 0.614 171
SPECT nEI 0.808 0.192** (0.179-0.206) 26
Total 85 112 197
EI 0.475* (0.467-0.482) 0.525 158
EEG nEI 0.731 0.269** (0.253-0.285) 26
Total 94 90 184
EI 0.578* (0.571-0.584) 0.422 187
MRI nEI 0.839 0.161** (0.150-0.173) 31
Total 134 84 218
EI 0.914* (0.911-0.918) 0.086 187
VEEG nEI 0.935 0.065** (0.057-0.072) 31
Total 200 18 218
* sensitivity; ** specificity.
Table 4. Conditional probability for different combination of preSurg.
Preprints 98440 i001
Disclaimer/Publisher’s Note: The statements, opinions and data contained in all publications are solely those of the individual author(s) and contributor(s) and not of MDPI and/or the editor(s). MDPI and/or the editor(s) disclaim responsibility for any injury to people or property resulting from any ideas, methods, instructions or products referred to in the content.
Copyright: This open access article is published under a Creative Commons CC BY 4.0 license, which permit the free download, distribution, and reuse, provided that the author and preprint are cited in any reuse.
Prerpints.org logo

Preprints.org is a free preprint server supported by MDPI in Basel, Switzerland.

Subscribe

© 2024 MDPI (Basel, Switzerland) unless otherwise stated