1. Introduction
With the rapid development of e-commerce and supply chain management, the logistics industry is facing the requirement of being more efficient and more intelligent. In warehouse logistics, automated truck loading is one of the key parts to improve efficiency, reduce cost, and avoid the risk of manual operation [
1,
2,
3]. However, the problem of accurate positioning and rotation angle estimation of flatbed trucks are challenging due to the uncertainty of manually parking trucks [
4] and the complexity of flatbed truck types.
Several researchers have already studied the positioning of trucks in the automatic loading process. Positioning sensors can be categorized into three types according to the installation position: fixed sensors, i.e., installing sensors in fixed positions [
4,
5,
6,
7], semi-free sensors, i.e., installing sensors on fixed devices such as conveyor belts [
8,
9,
10], and free sensors, i.e., installing sensors on Automated Guided Vehicles (AGVs) [
11,
12]. Positioning based on a single fixed sensor results in large errors due to long observation distances. Positioning based on multiple sensors can meet the demand for pallet loading, but the driver parking requirements are more stringent. Conveyor belts and other fixed installations have a high degree of automation and standardization, but at the same time the cost is higher, which is suitable for new logistics parks. The positioning method with sensors installed on AGVs is economical and flexible, while being more relaxed to the driver.
Combining the disadvantages of these methods, this study aims to explore and solve the problem of flatbed truck localization and rotation angle estimation in the automated loading process. We designed and constructed a flatbed truck localization and rotation angle estimation system with high accuracy and stability, which does not require human intervention or installation of fixed devices, and is compatible with automatic loading of flatbed trucks in a variety of scenes and at different lengths.
Firstly, the double antenna mobile receiver was installed on the unmanned forklift for acquiring the forklift position and attitude, and the RGB-D camera was installed for acquiring depth images near the front and rear endpoints of the flatbed. Then the truck flatbed was segmented from the depth image using the deep dual-resolution network (DDRNet-23-slim) [
13] and straight lines were extracted from the edges of the flatbed using the Hough transform [
14], and the intersection sets of the straight lines were computed. Thereafter, a neighborhood feature vector was designed to locate the endpoint of a flatbed from a set of intersection points by feature screening. Finally, the relative coordinates of endpoints were converted to the absolute coordinate system by BeiDou positioning, from which the precise position of the flatbed truck was determined and the rotation angle estimation is performed by the front and rear endpoints. This method meets the accuracy requirements of unmanned forklift loading on the release point. It fills the research gap of outdoor automated loading by unmanned forklift.
In this paper, a review of truck localization and measurement methods related to automated truck loading is presented at the beginning. Then, the detailed steps for designing and realizing our proposed method will be presented. Further, we will conduct experiments to validate the practicality and applicability of this method. Finally, the conclusions, limitations and future directions for expansion of the study will be explored.
Through the implementation and results of this study, we expect to provide a new method and technology for solving the problem of flatbed truck positioning and rotation angle estimation in the automated loading process, which will promote the development of the logistics industry and improve the efficiency of loading and the safety of transportation.
2. Method
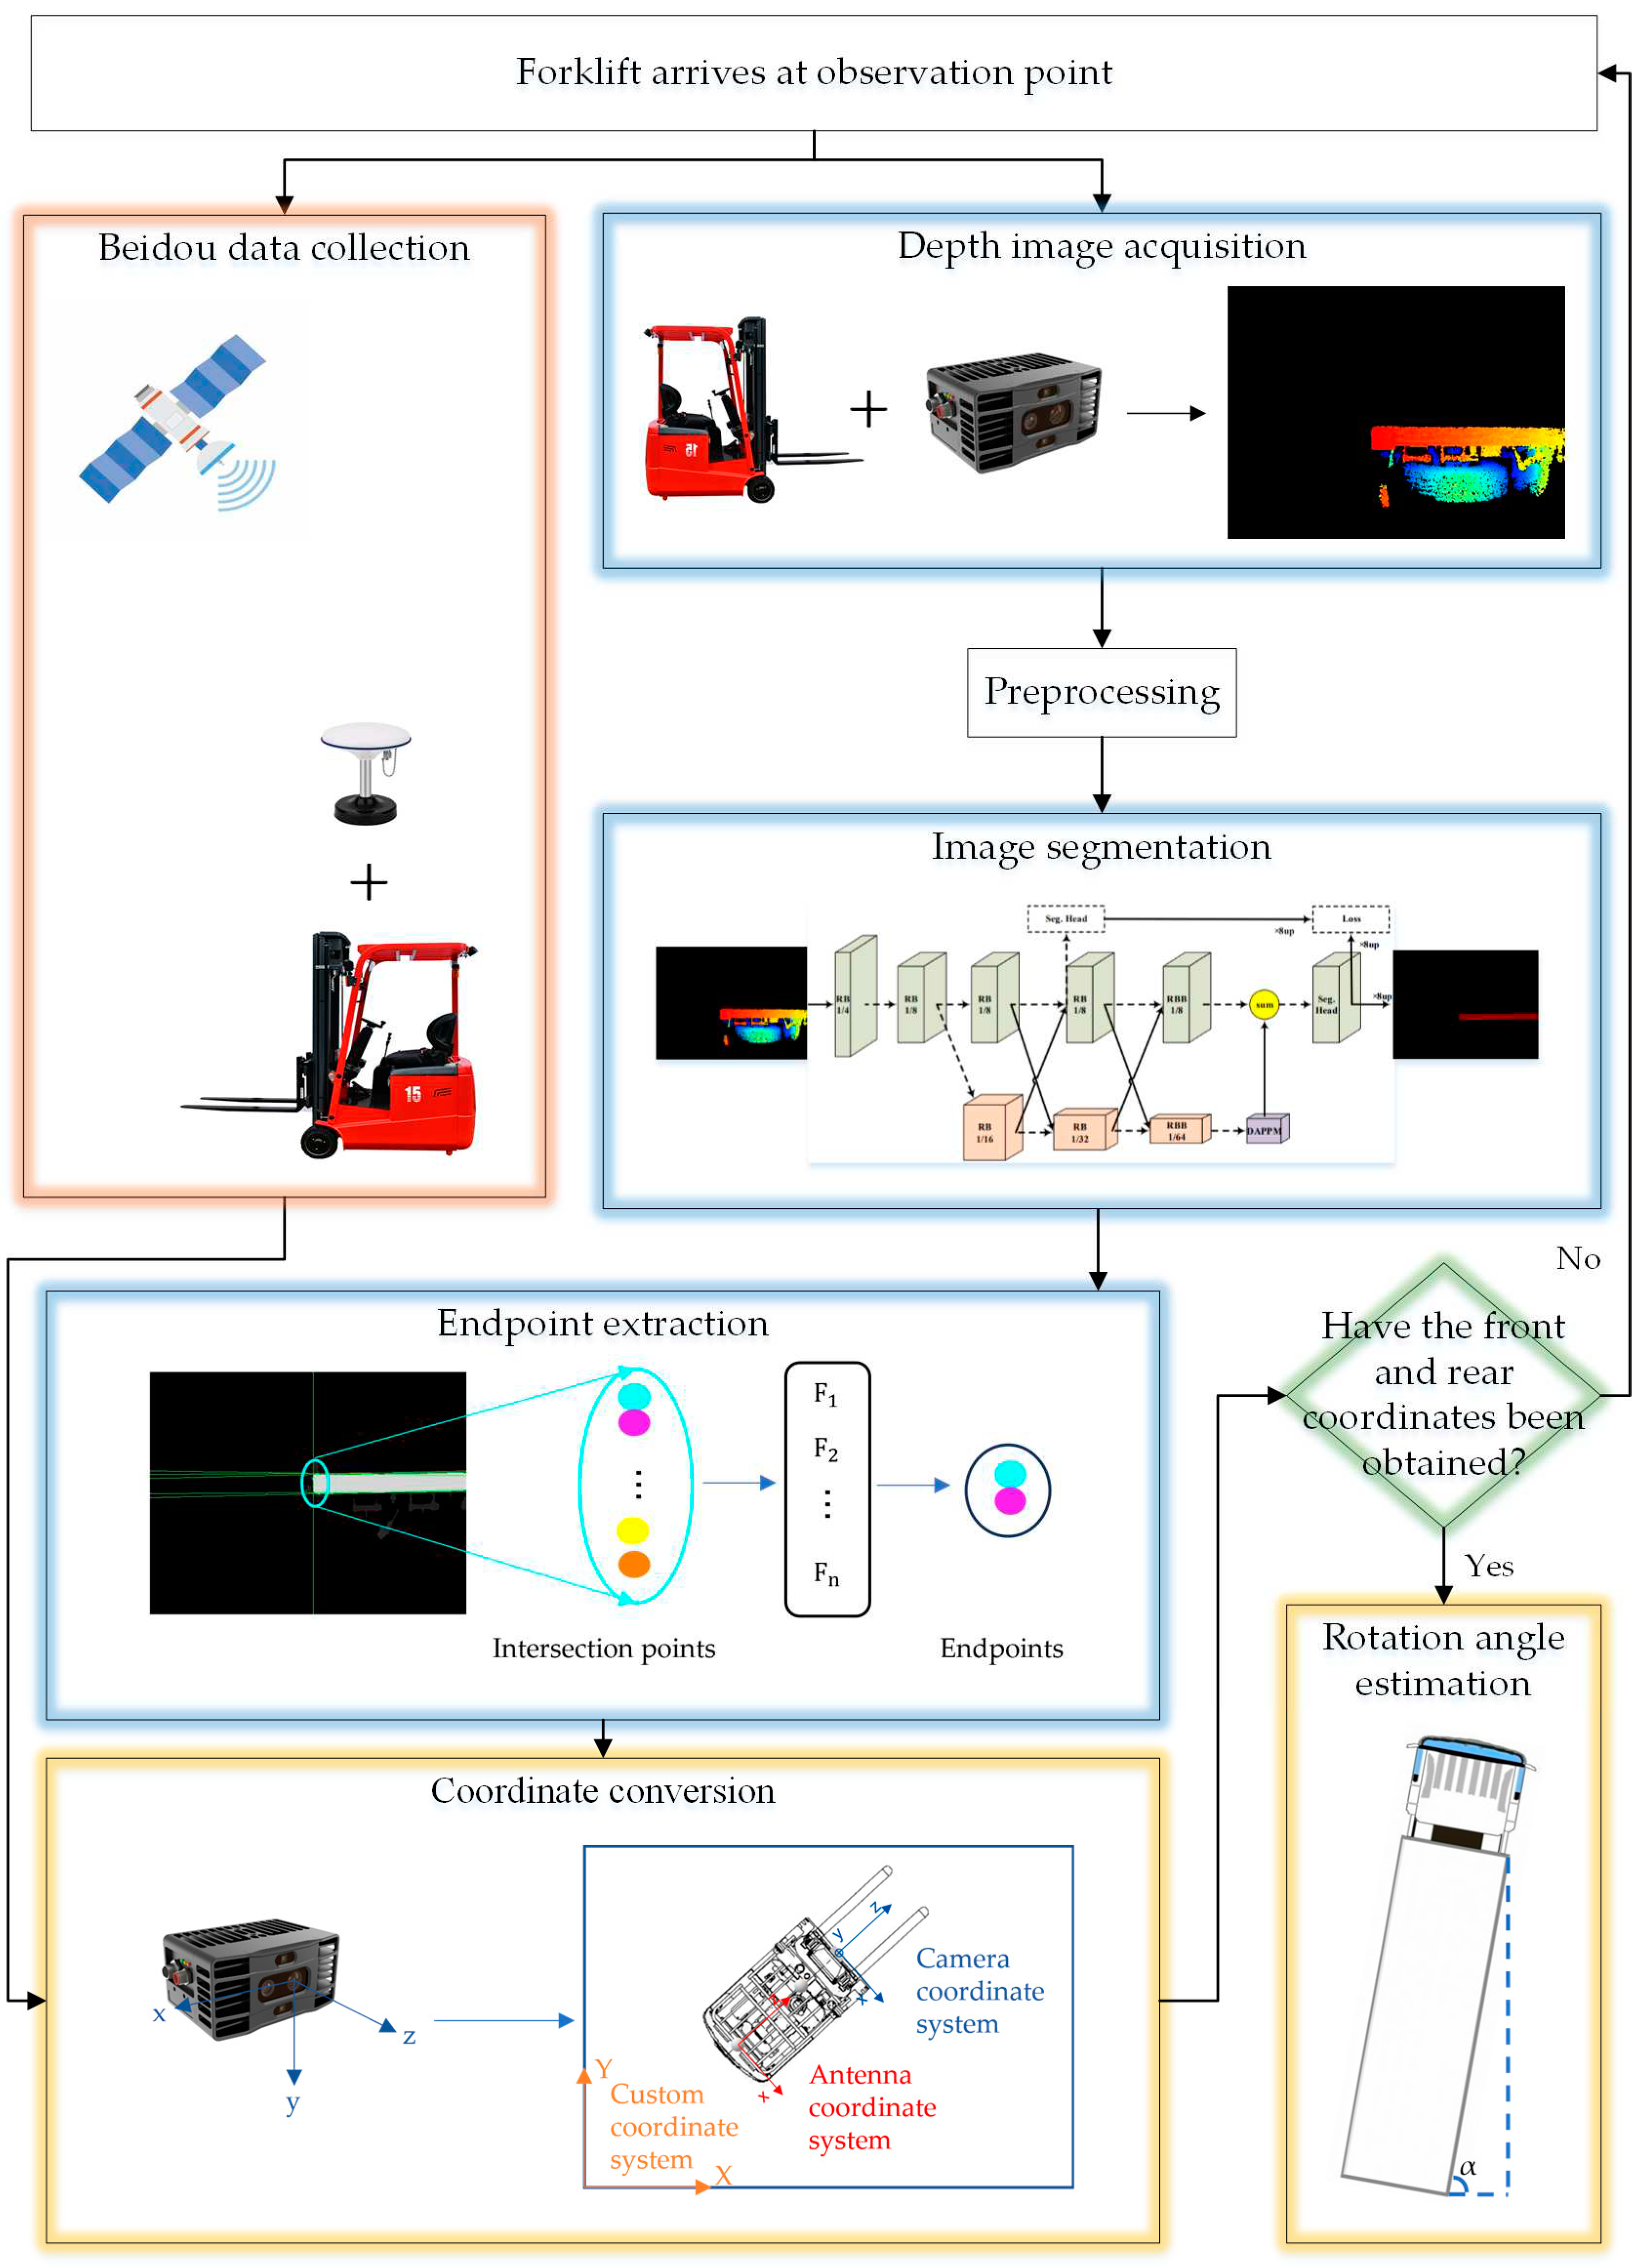
Our method can be divided into five modules: depth image acquisition and preprocessing, image segmentation, endpoint extraction, BeiDou data acquisition, coordinate conversion and rotation angle estimation. The flowchart is shown in
Figure 1.
2.1. Depth images acquisition and preprocessing
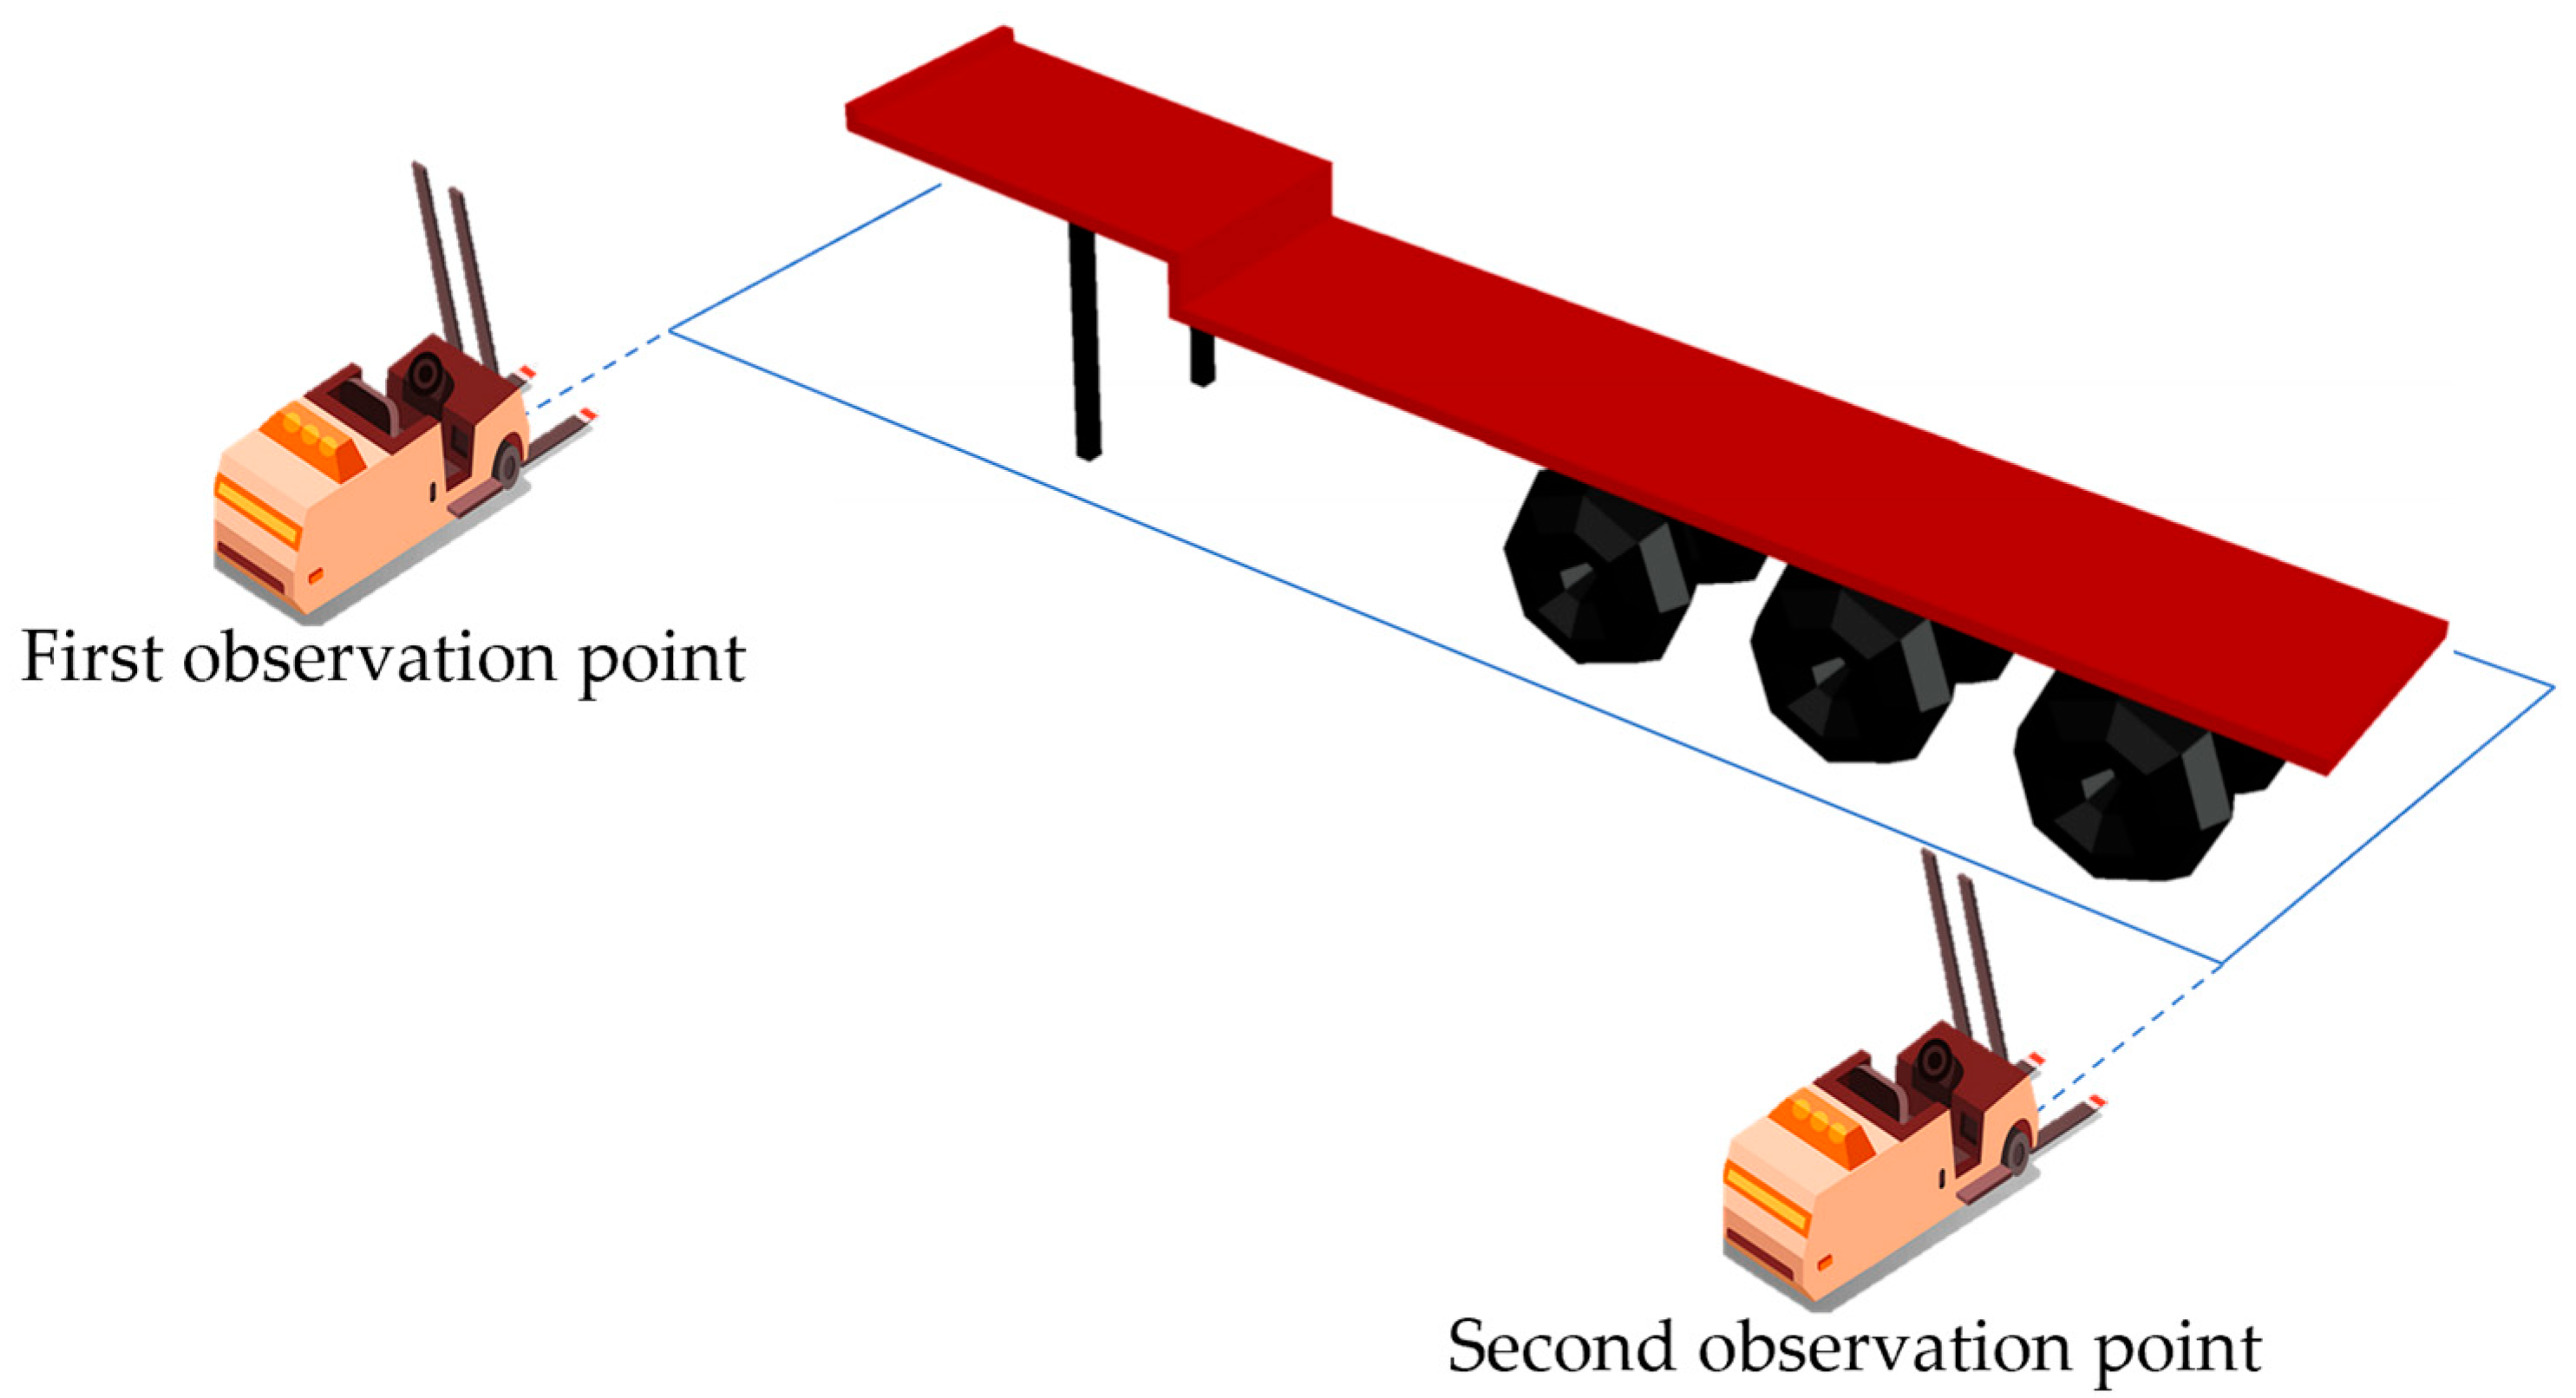
The unmanned forklift equipped with a ToF camera captures depth images of the flatbed truck at the first and second observation points, as shown in the
Figure 2.
In order to eliminate the interference pixels in the depth image, the upper limit of the depth where the target is located was used as the segmentation threshold . By removing the depth data larger than , the segmented image must contain the target and most of the non-target depth data have been eliminated. This threshold is related to the distance of the observation point from the flatbed truck and can be selected according to the actual situation.
The manufacturing accuracy and assembly deviation of the lens lead to distortion of the original image [
15], which need to be corrected using the internal and external parameters of the camera. The depth jitter at the edges of the object is strong and there is noise interference, so Gaussian filtering on a large scale was used to smooth the image and reduce the noise.
2.2. Image segmentation
For a wide variety of flatbed trucks (
Figure 3), coupled with the inconsistent degree of deformation due to use, traditional methods of image processing are difficult to be compatible with these cases, so deep learning algorithms was used for image segmentation.
Classical semantic segmentation networks usually trade off heavy computation and lengthy inference time for high accuracy, but for unmanned forklifts, it is not desirable to spend a lot of inference time. Since DDRNet-23-slim introduces deep high resolution in real-time semantic segmentation, which achieves a balance between speed and accuracy by expanding the width and depth of the model [
13]. The architecture of the DDRNet-23-slim is shown in
Table 1.
The segmentation results are shown in
Figure 4.
After the flatbed has been segmented out, the depth image was masked to retain only the depth information of the flatbed region. Then the non-null values in the masked depth image were assigned to 255 and the null values were assigned to 0 to get the depth binary image.
2.3. Endpoint extraction
Edge detection is a common method for segmenting images based on gray level mutation, which in essence is to extract the features of the discontinuous part of the image [
16]. Canny edge extraction [
16] was performed on the depth binary image and then straight lines were extracted by Hough transform [
14]. The lines that were screened out as approximately horizontal and vertical, i.e., lines with angles close to 0 and 90 degrees to the north direction were respectively denoted as set
and set
. Then the intersection of the lines in set
with the lines in set
was calculated. The set of intersection pixels was denoted as
.
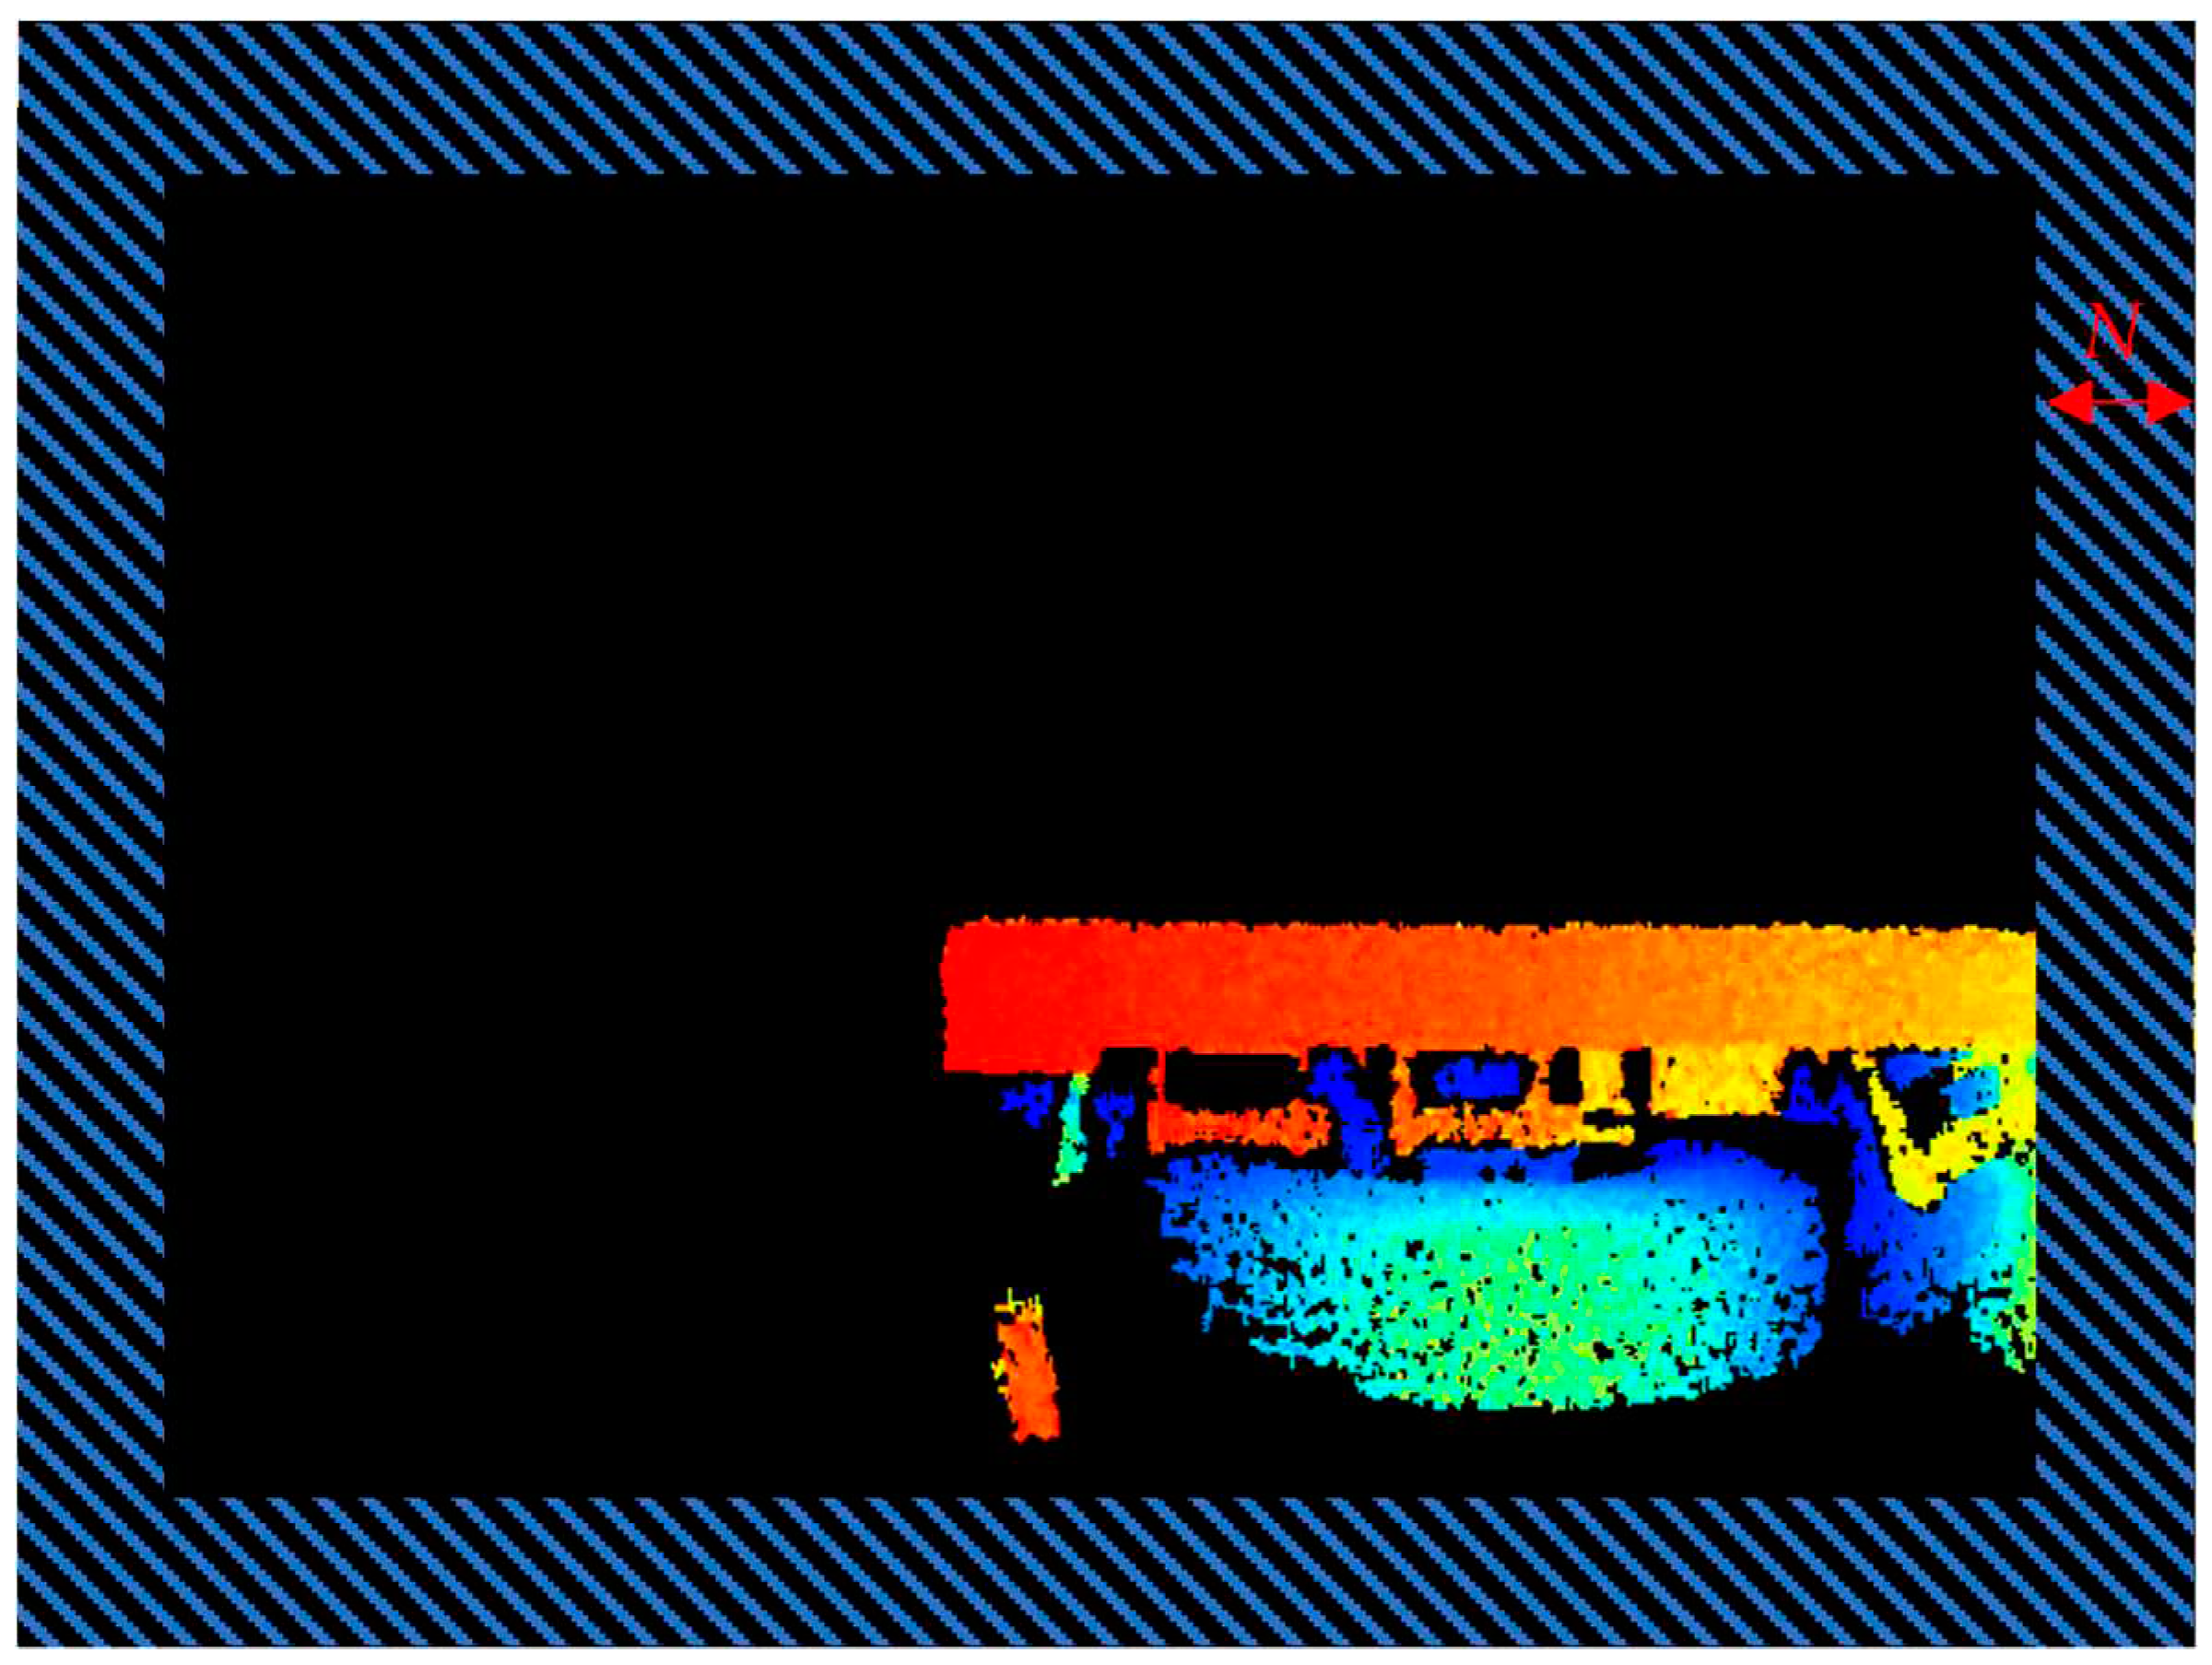
The location of the intersection point needs to be at a certain distance
from the edge, otherwise the subsequent intersection screening process is not possible, so the intersection points that are in the shaded area are shown in the
Figure 5 were eliminated, and the remaining set of intersection pixels was denoted as
.
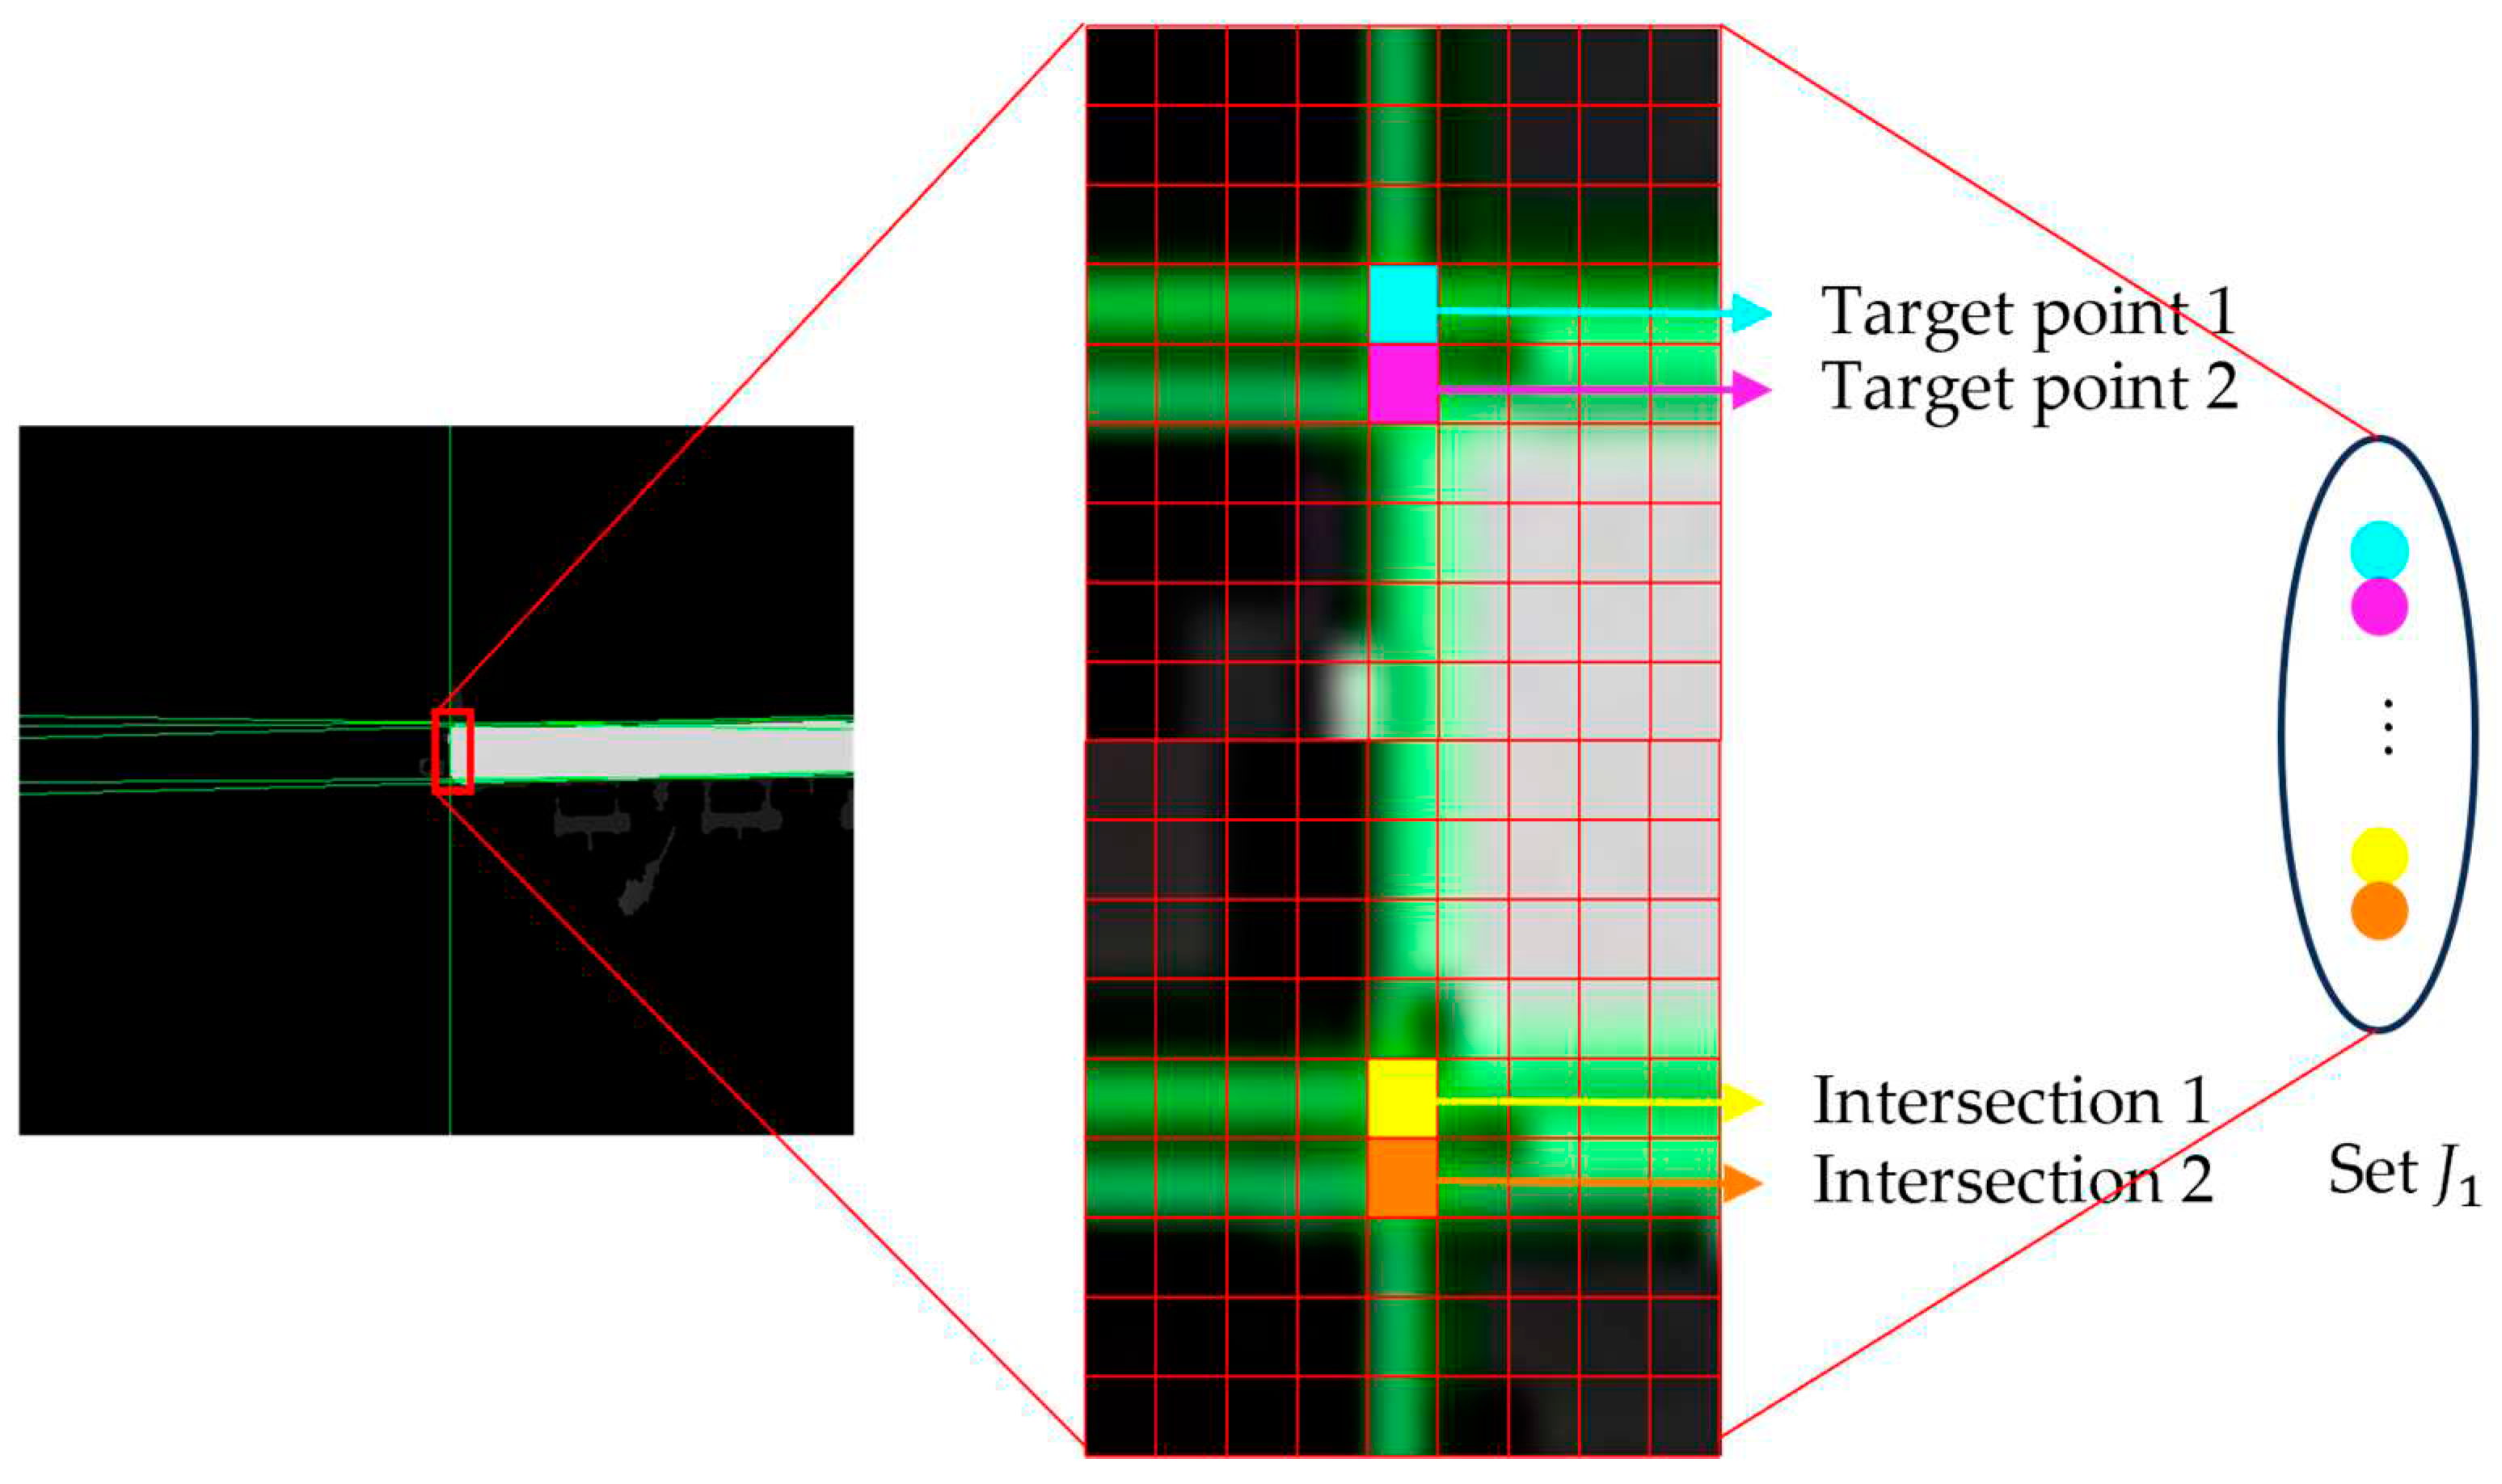
The set
contains endpoints and some non-endpoints as shown in
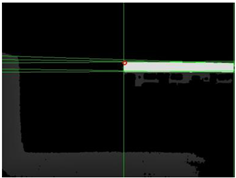
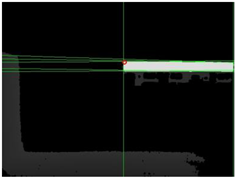
Figure 6. A neighborhood template matching method was proposed for selecting the endpoints from
.
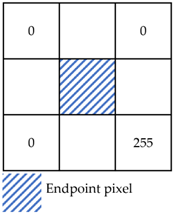
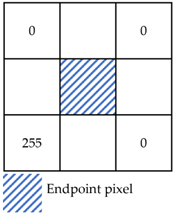
Depending on the observation direction, the depth image, the endpoint schematic image, and the neighborhood pixel values in the northwestern, northeastern, southeastern, and southwestern directions of the endpoints are theoretically the following two cases.
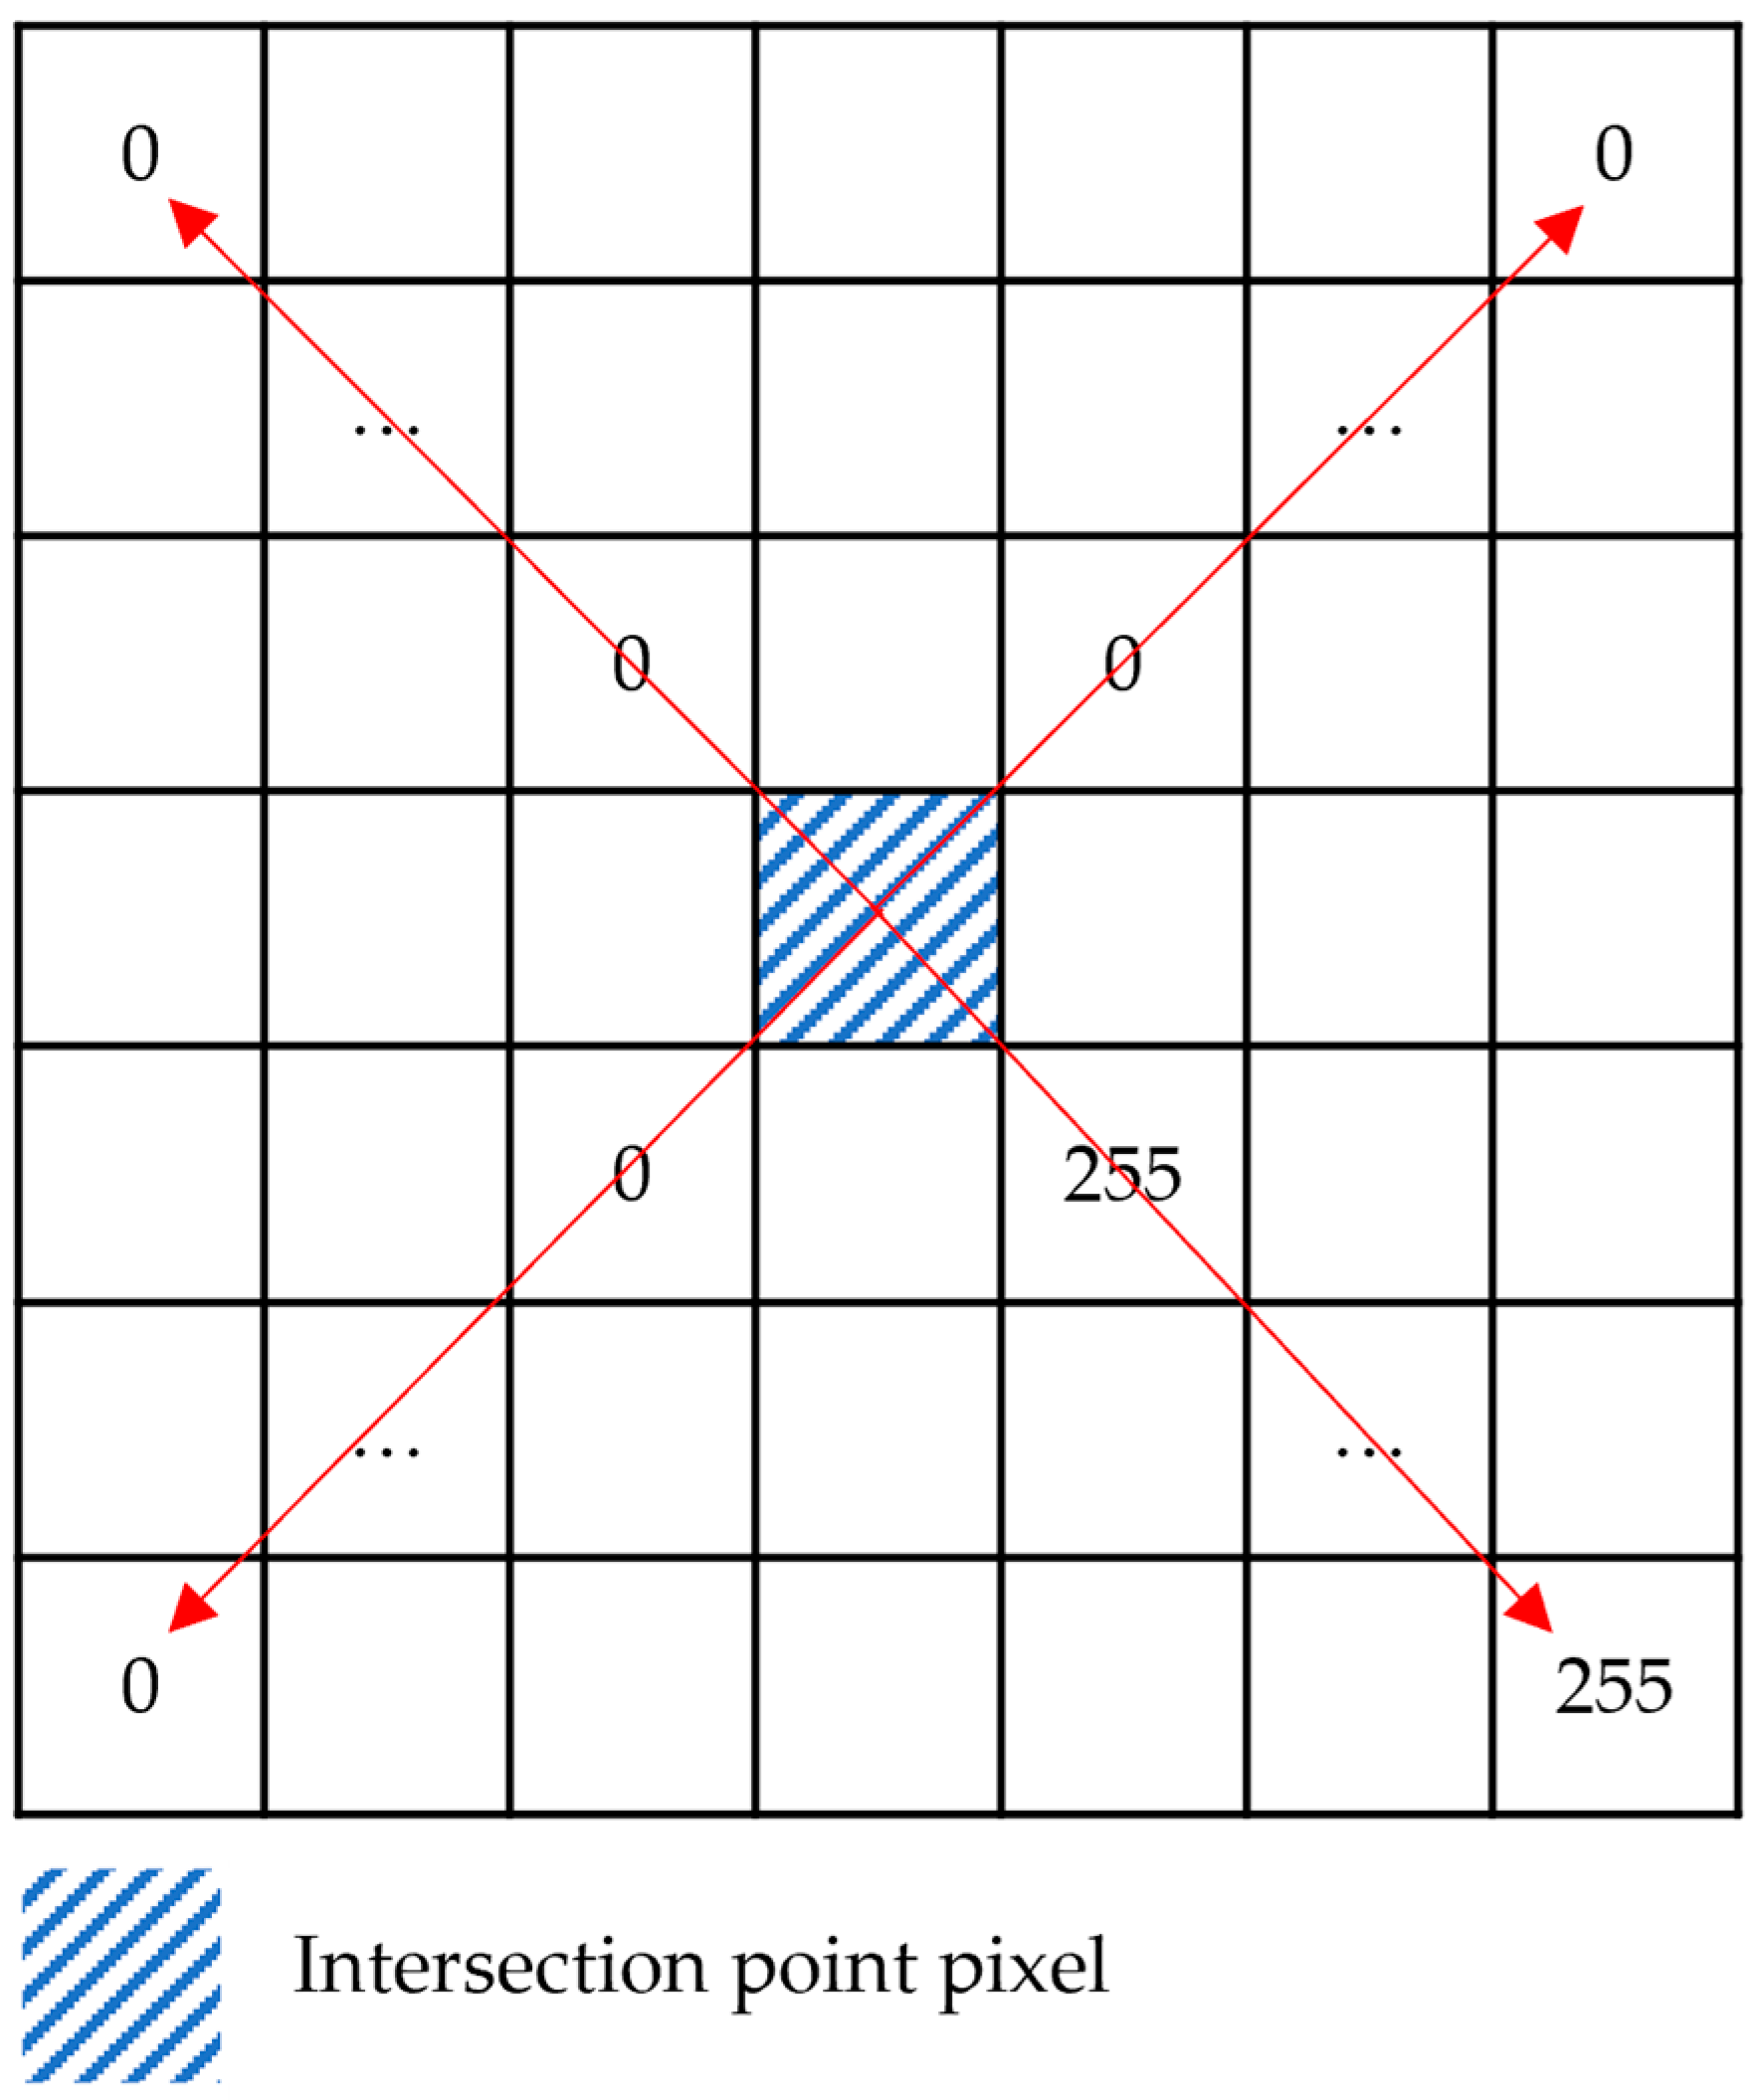
The depth image is unstable at the boundary, resulting in endpoints that do not exactly match the theoretical pixel features. Therefore, the statistical range of neighborhood features was expanded. A square window with a side length of
pixels was constructed centered on the intersection point, as shown in the
Figure 7. The pixel values in the northwest, northeast, southeast and southwest directions of this intersection point were recorded as its features. Taking case 1 in
Table 2 as an example, this intersection pixel is characterized by the vector
, in which
,
,
,
, and the number of elements of each vector is
.
For any intersection point, if the number of elements in the
,
, and
vectors with the value of 255 was less than 1/5
and the number of elements in the
vectors with the value of 255 was more than 4/5
, i.e., satisfied the following formula, the intersection point was regarded as an endpoint. The set consisting of several endpoints was denoted
.
was an endpoint cluster, in which the distance of each element should be small. Then the average of the pixel coordinates of each element was taken as the endpoint pixel coordinates.
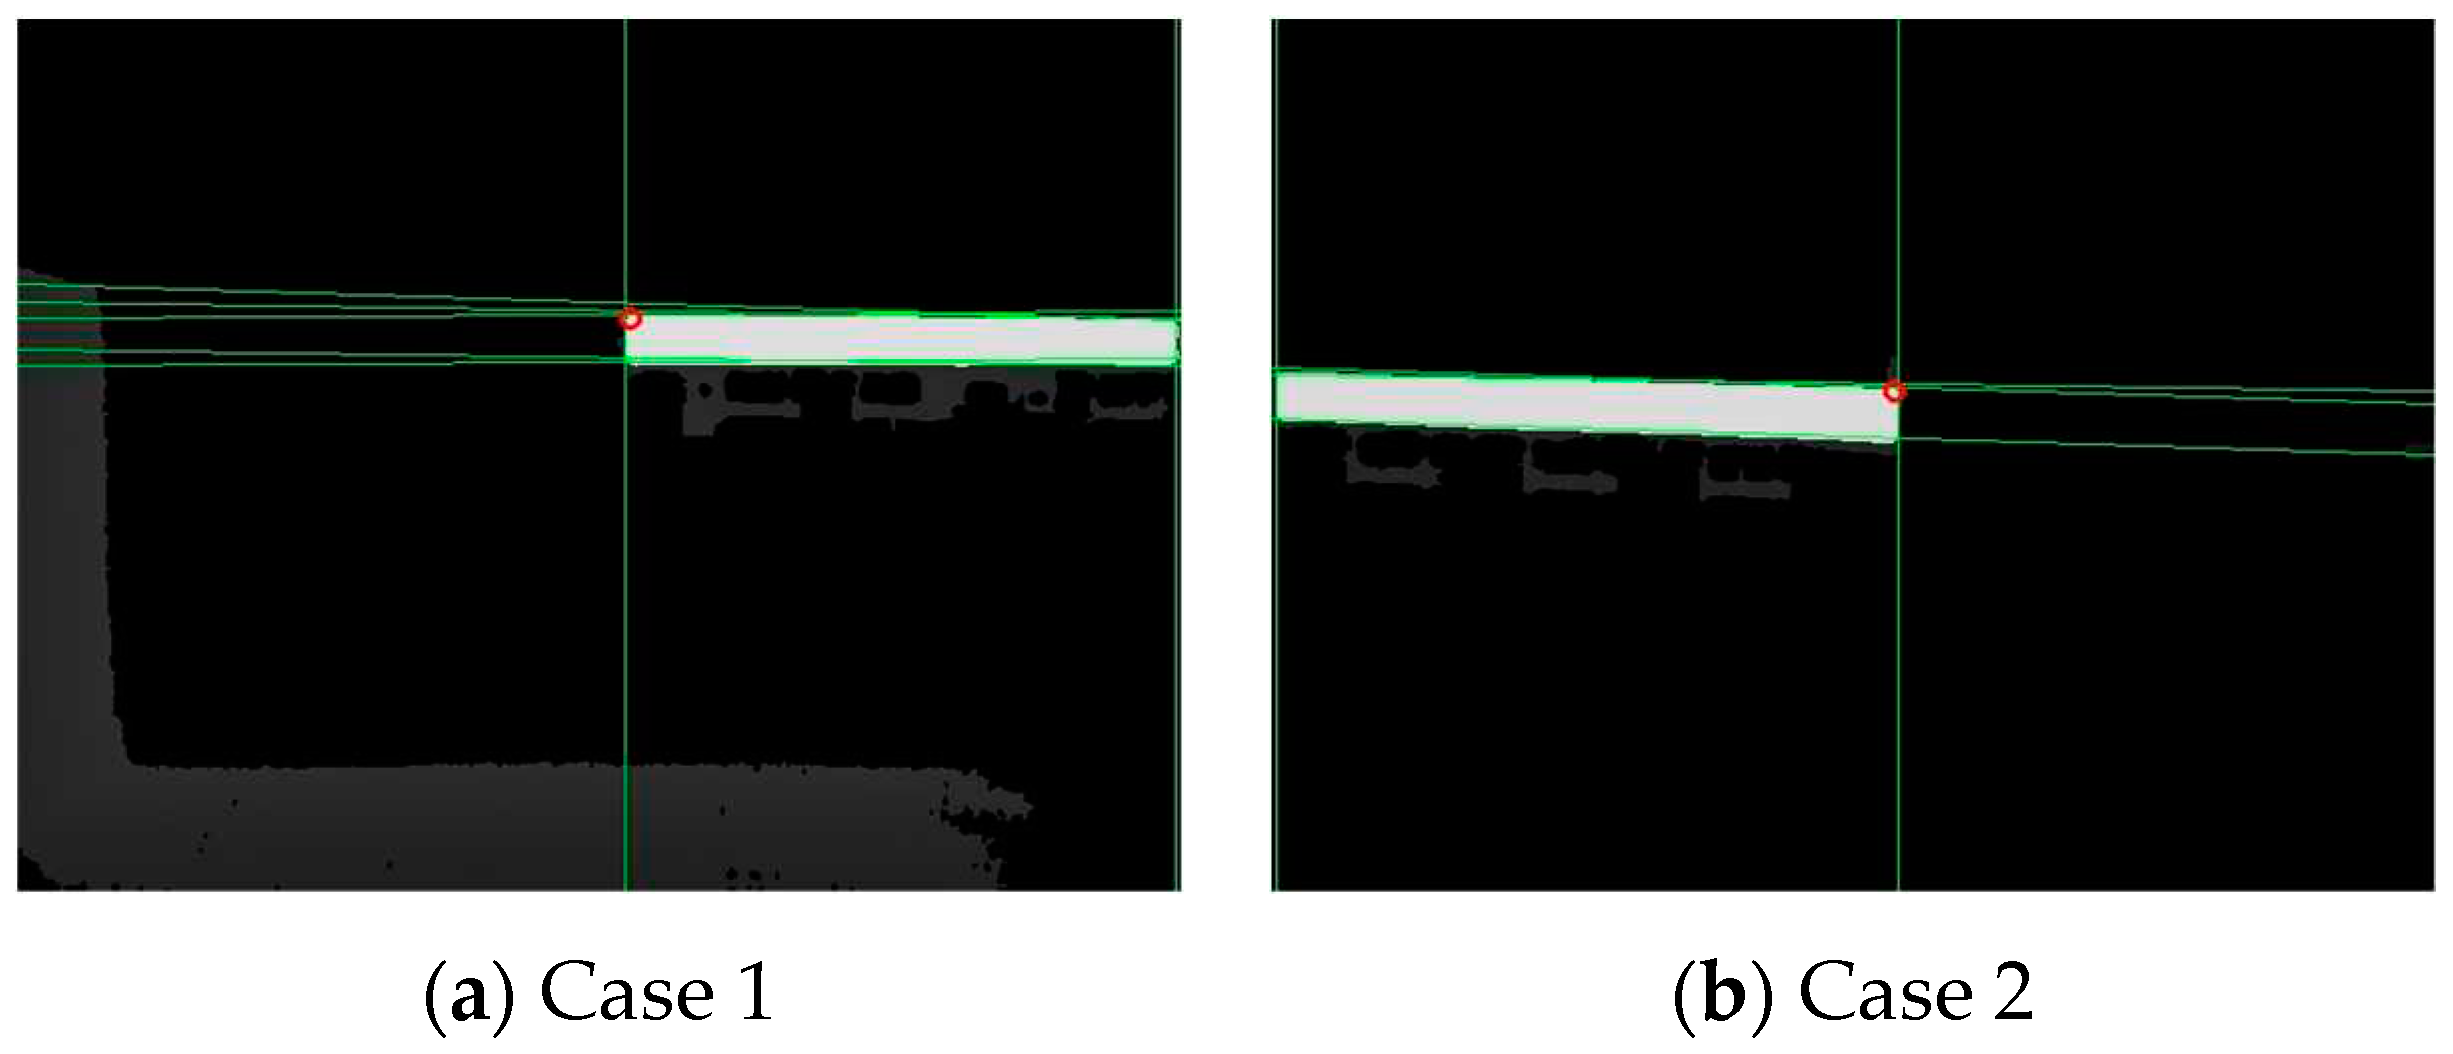
The depth at the endpoint obtained from the above calculation may be null, which in the binary image has a value as 0. The first pixel with a non-null depth in the southeast or southwest direction of the neighborhood was taken as the corrected endpoint. For example, in case 1 of
Table 2, the first pixel with non-null depth in the southeast direction of the intersection point is taken as the corrected endpoint; in case 2 of
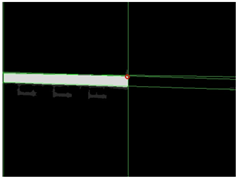
Table 2, the first pixel with non-null depth in the southwest direction of the intersection point is taken as the corrected endpoint. The corrected endpoint localization results are shown in
Figure 8, in which the red hollow circles indicate the corrected endpoints.
2.4. BeiDou data acquisition
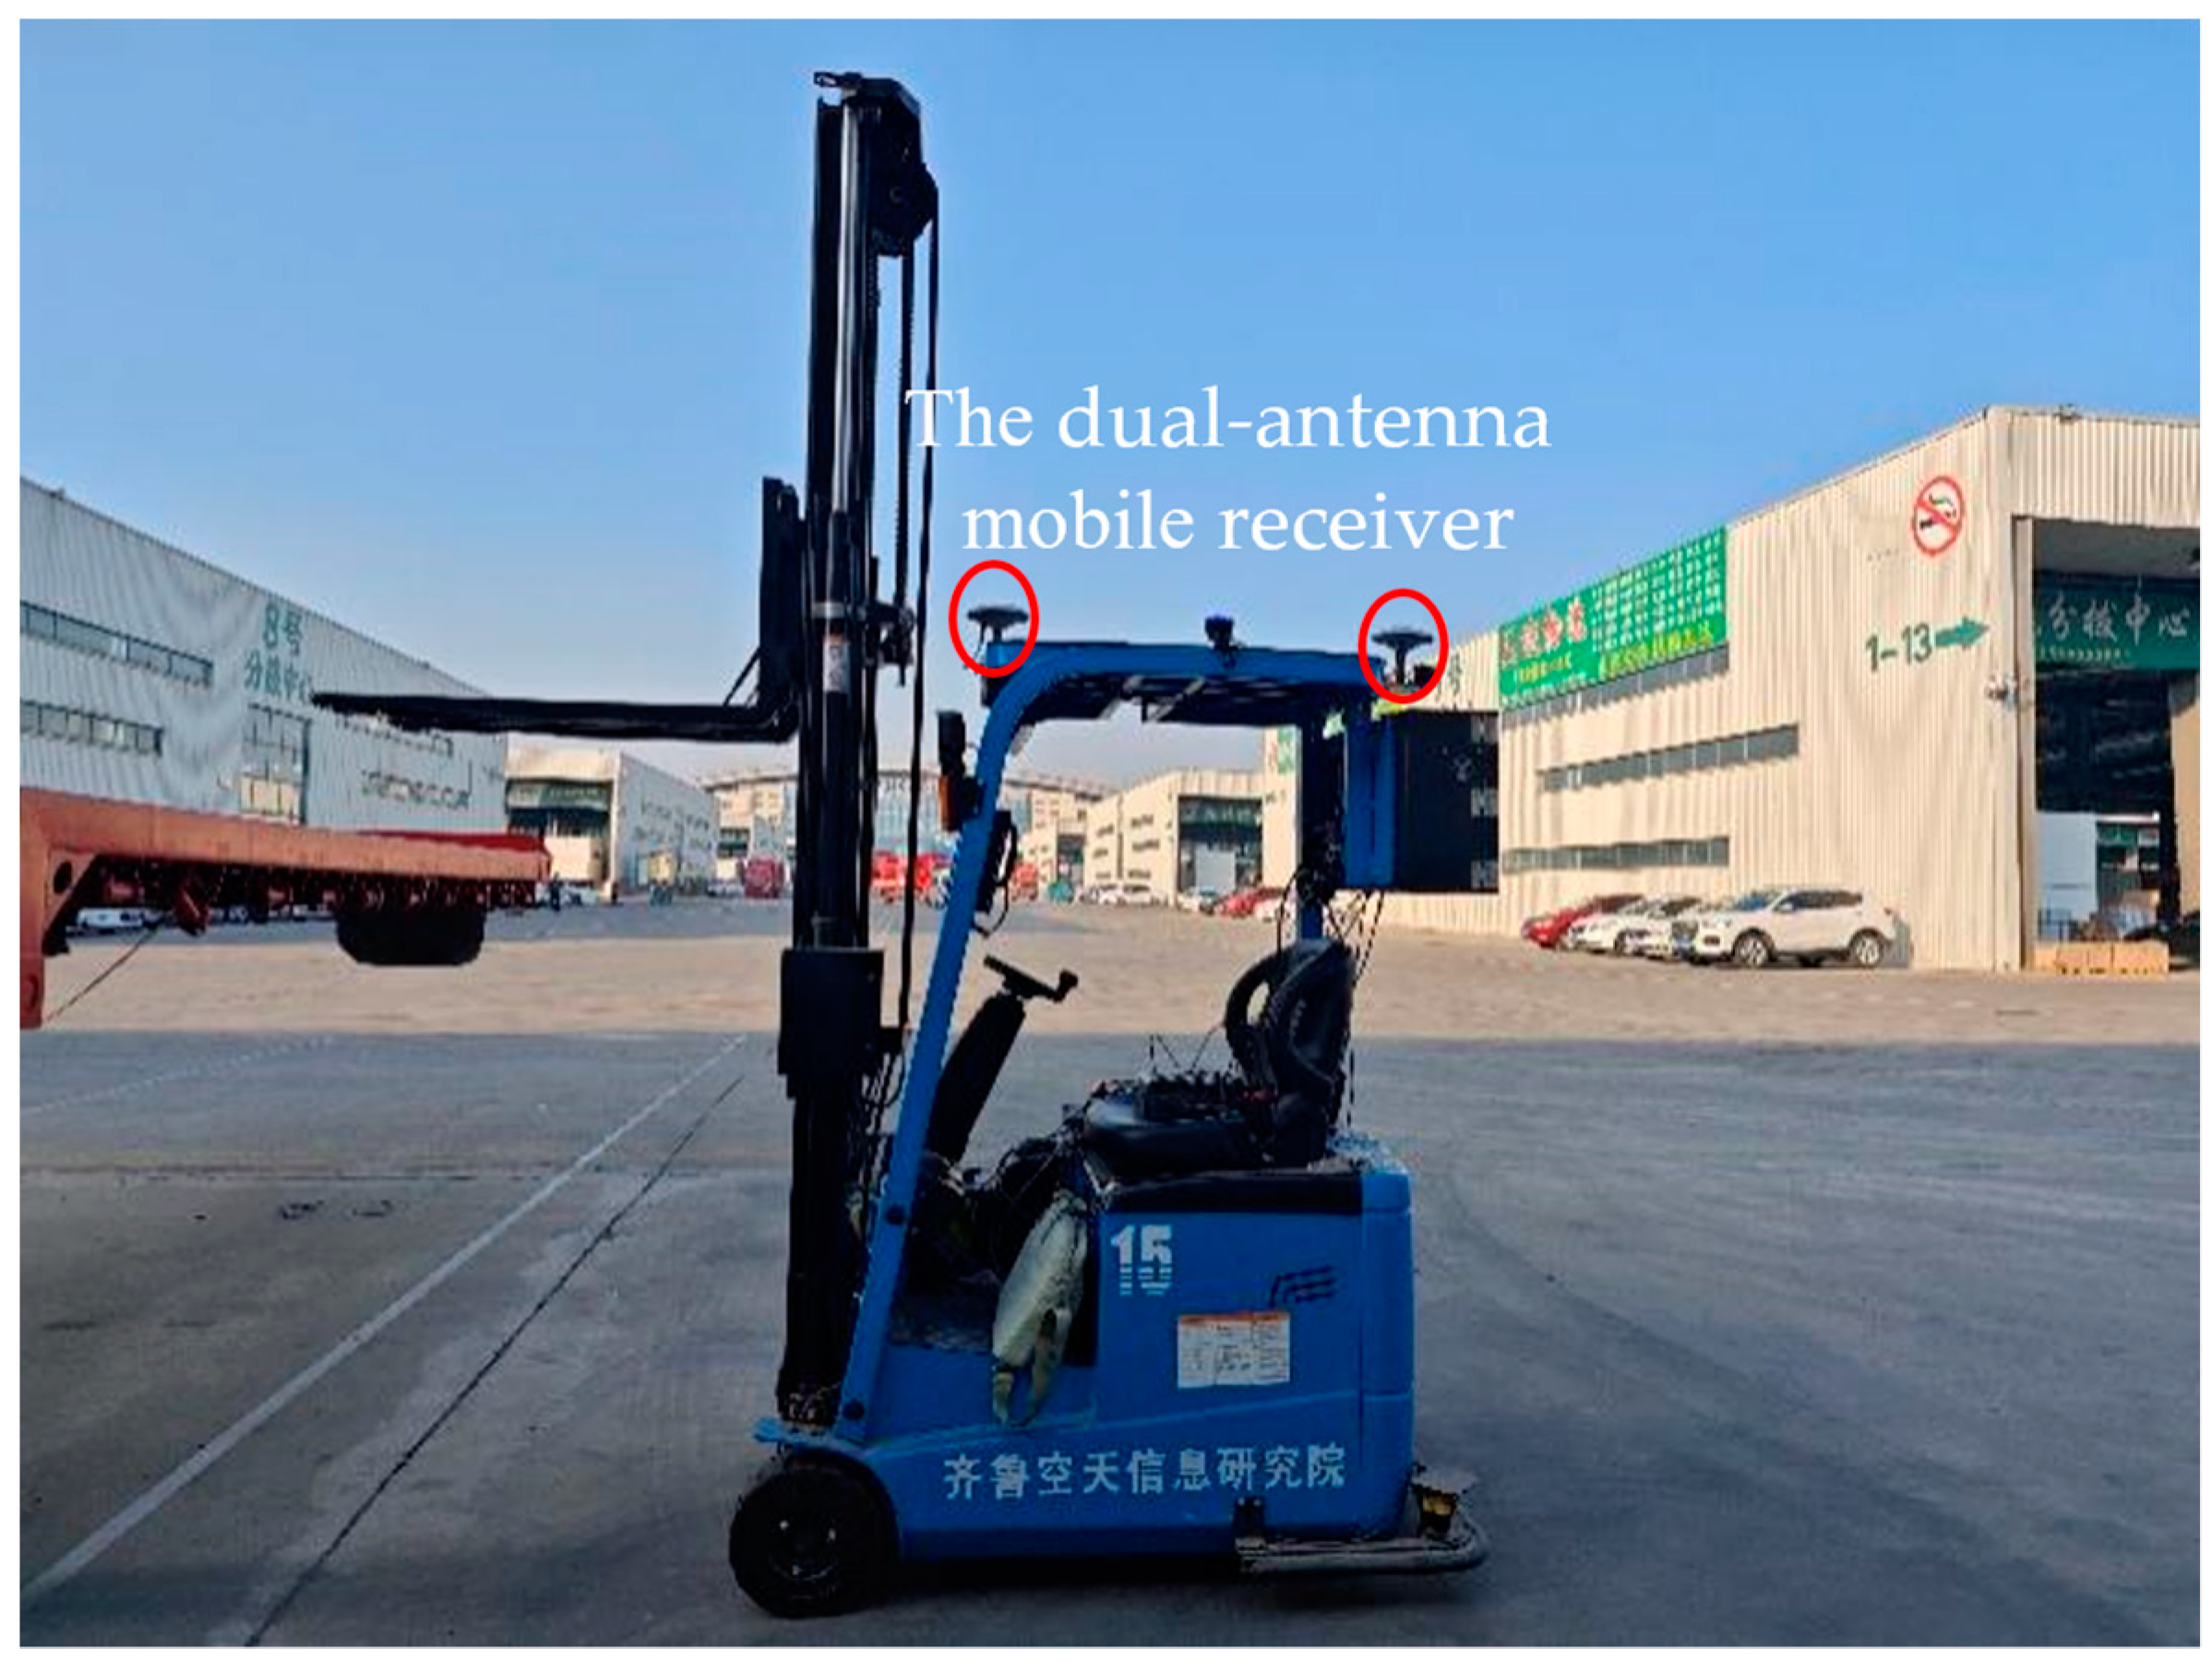
A BeiDou reference station was constructed near the logistics center and a dual-antenna mobile receiver was installed on the top of the forklift, as shown in the
Figure 9. The data from the BeiDou reference station and the mobile receiver were processed differentially to eliminate errors such as atmospheric delay and receiver clock difference, so as to obtain the precise position and yaw angle of the forklift.
2.5. Coordinate conversion and rotation angle estimation
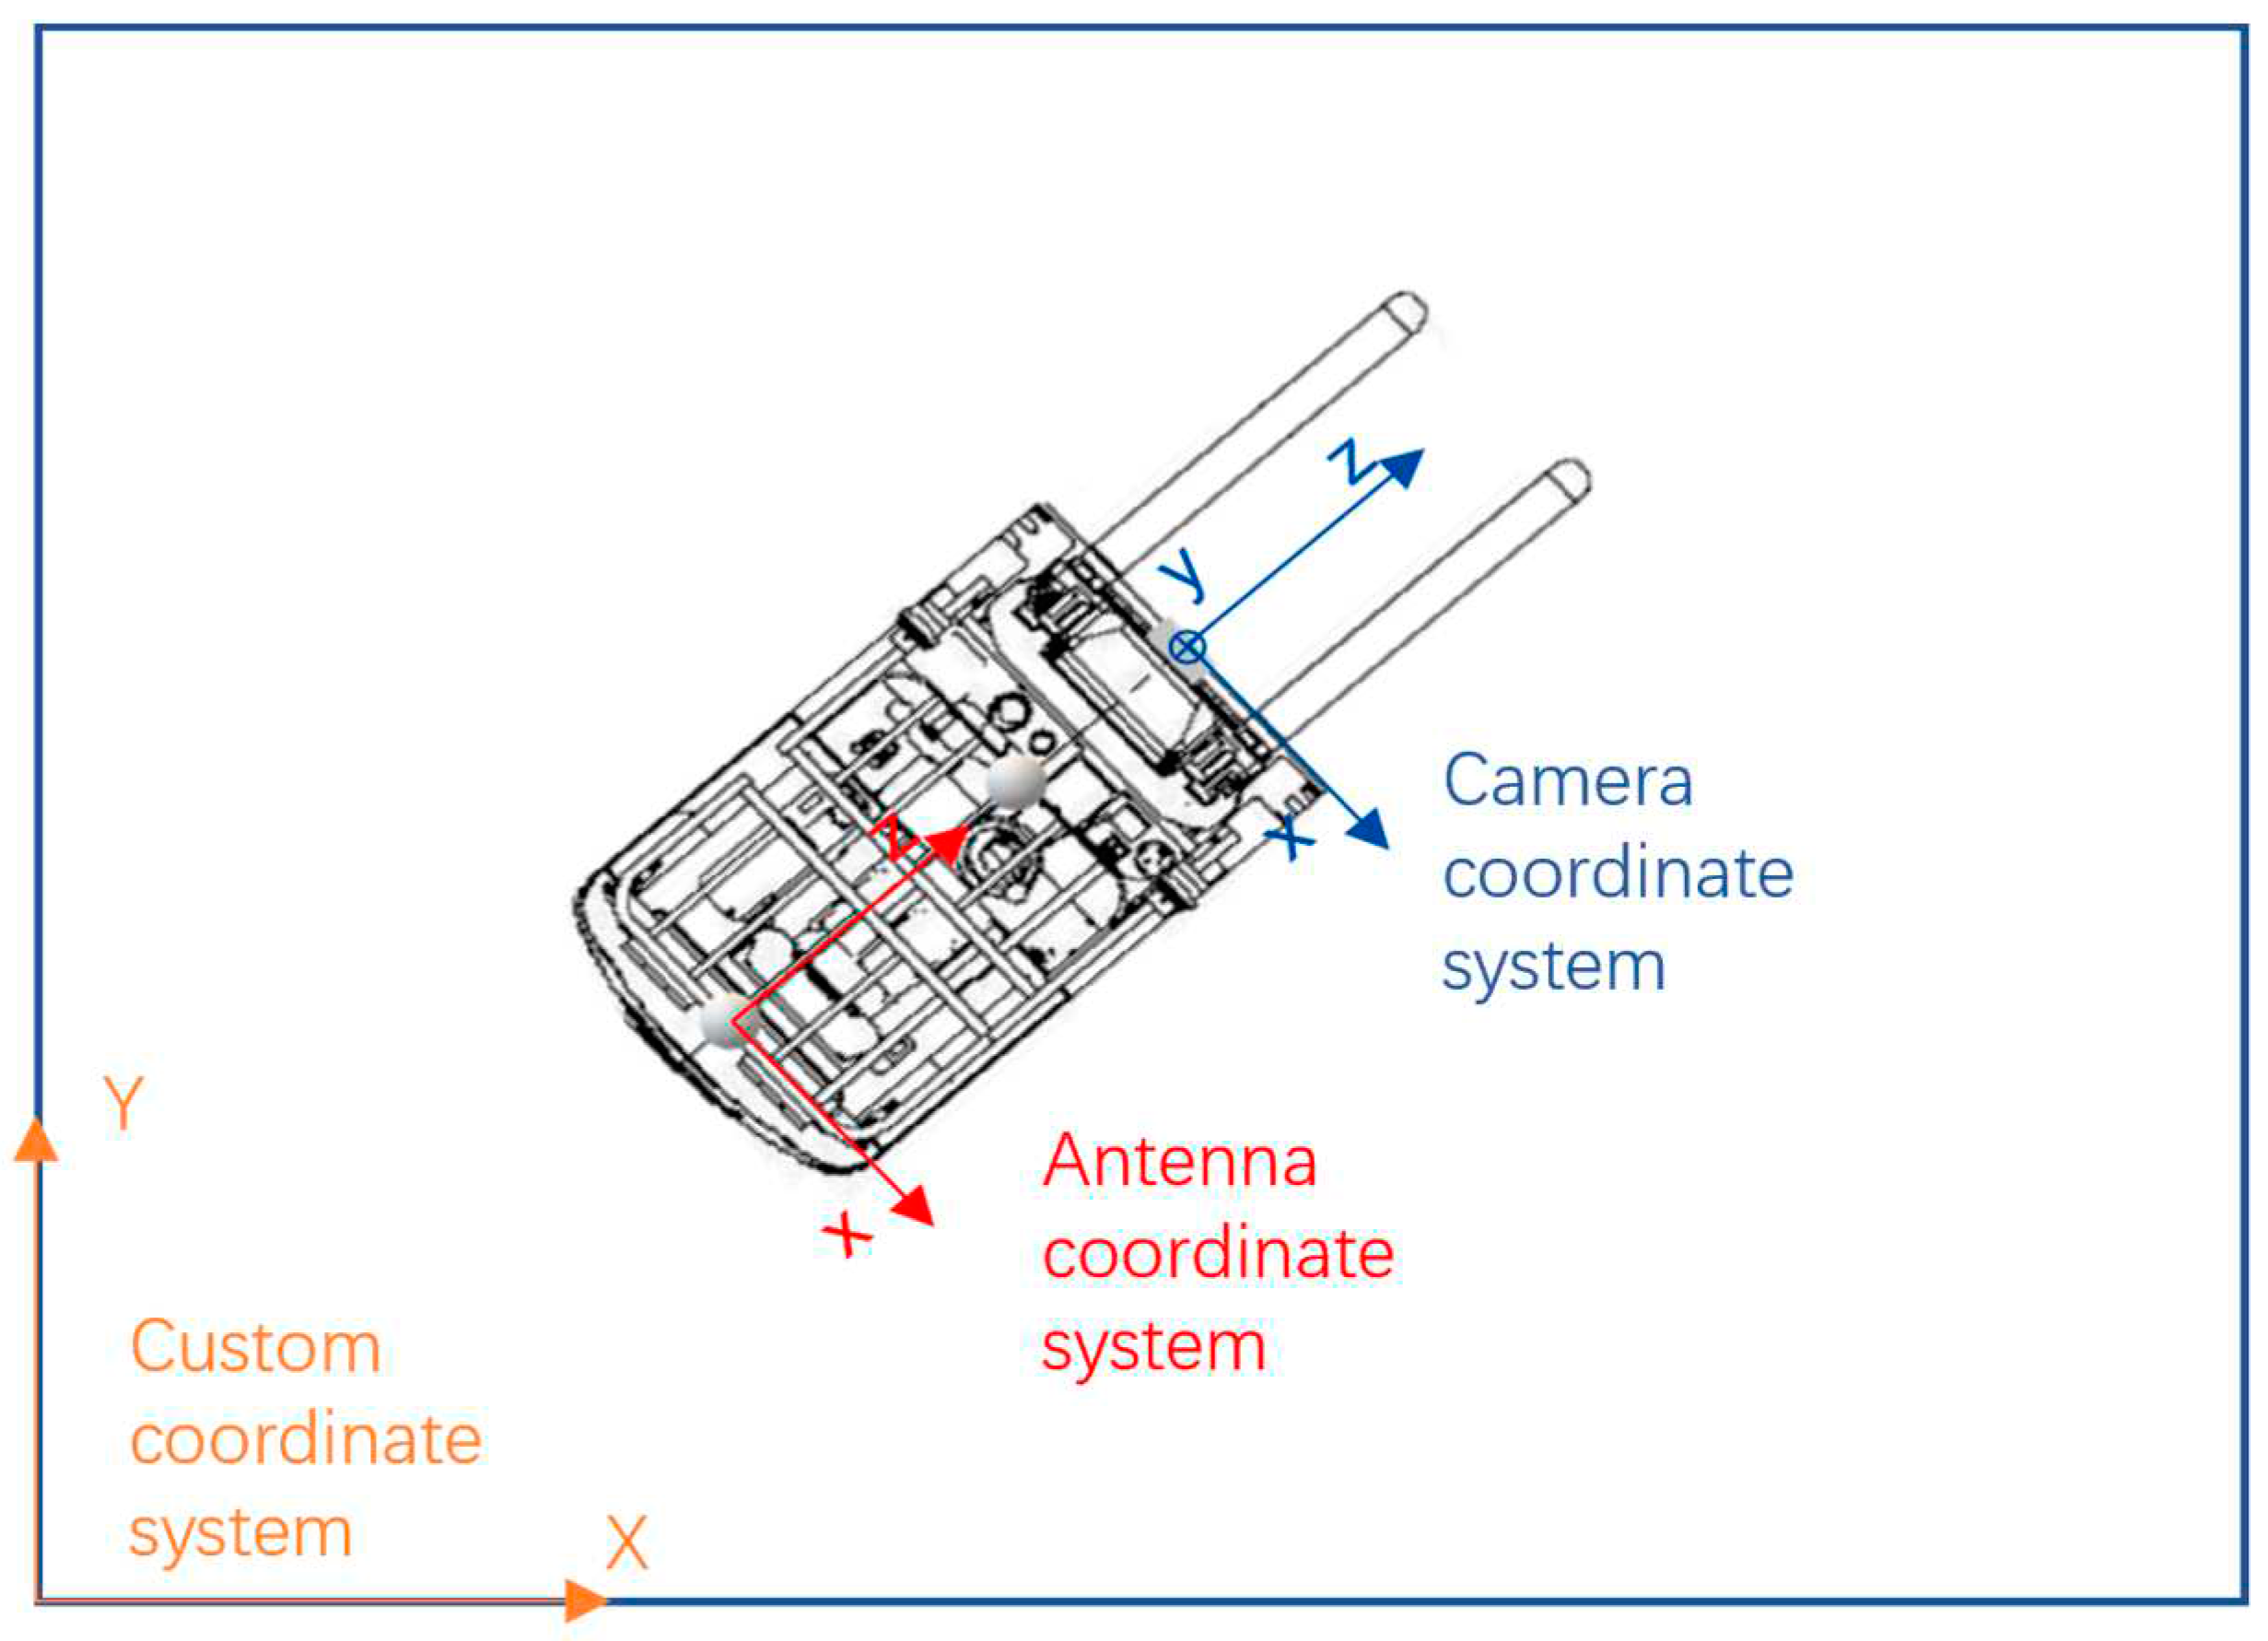
The depth image was mapped to the point cloud data through the camera internal and external references, and then the spatial location of the flatbed endpoint under the camera coordinate system was indexed by the pixel coordinate in the depth image. In order to navigate, the camera coordinate system needs to be converted to the forklift navigation coordinate system. In this paper a custom plane coordinate system was used as the forklift navigation coordinate system.
Since the forklift navigation relies on the antenna to receive signals, the coordinates of the forklift itself under the custom coordinate system are actually the position of the main antenna set to (
). In the loading scene, the flatbed truck height information was not used for navigation, so the coordinate of the target endpoint was simplified to (
) by ignoring the height information. The antenna coordinate system was obtained by translating the camera coordinate system after dimensionality reduction, as shown in the
Figure 10. Assuming that the origin of the camera plane coordinate system is shifted to the left by
along the X-axis direction and shifted downward by
along the Z-axis direction to coincide with the antenna coordinate system, so that the coordinates of the target endpoint under the antenna coordinate system are
).
Taking the above custom coordinate system as an example, assume that the antenna coordinate system is rotated counterclockwise by angle θ to parallel the local coordinate system.
In the custom coordinate system, the front endpoint of the flatbed truck is labeled as
, and the rear endpoint is labeled as
. The linear equation that can be used to plan the location of the cargoes is constructed as follows.
The formula for calculating the rotation angle of a truck is as follows.
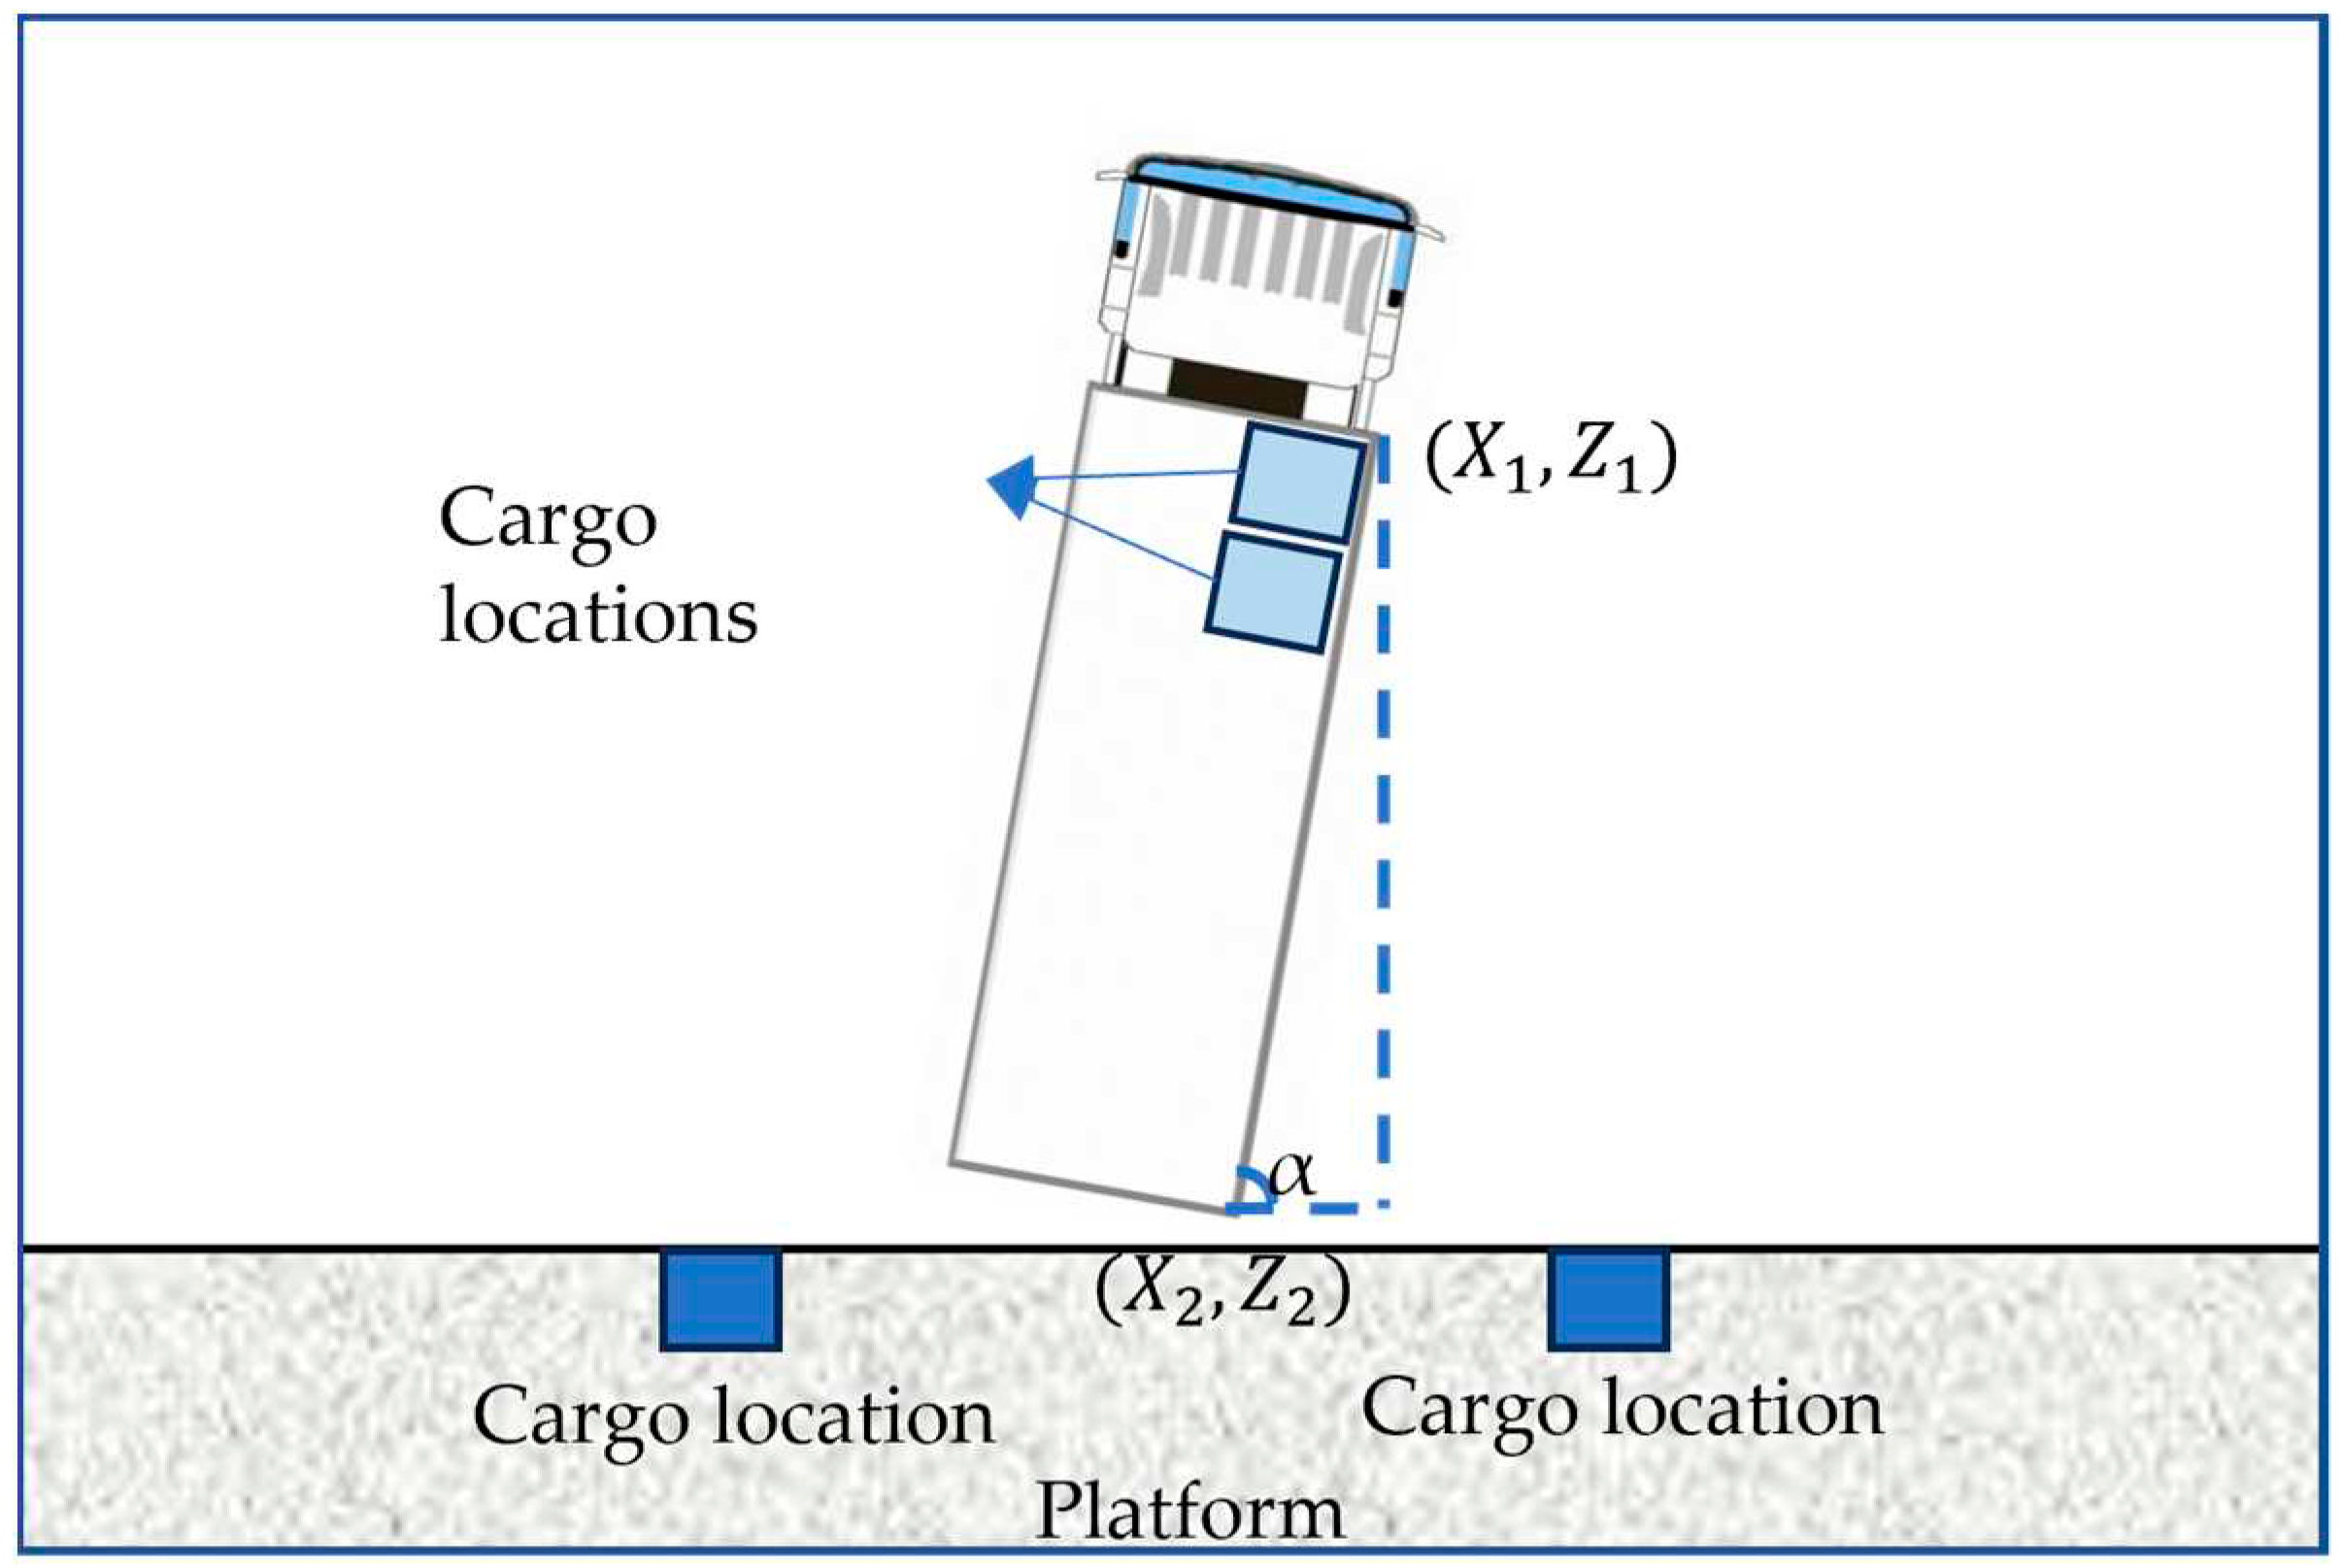
The flatbed truck is rotated as shown below.
Figure 11.
Example diagram of a rotated truck.
Figure 11.
Example diagram of a rotated truck.
3. Experiments
3.1. Experimental site
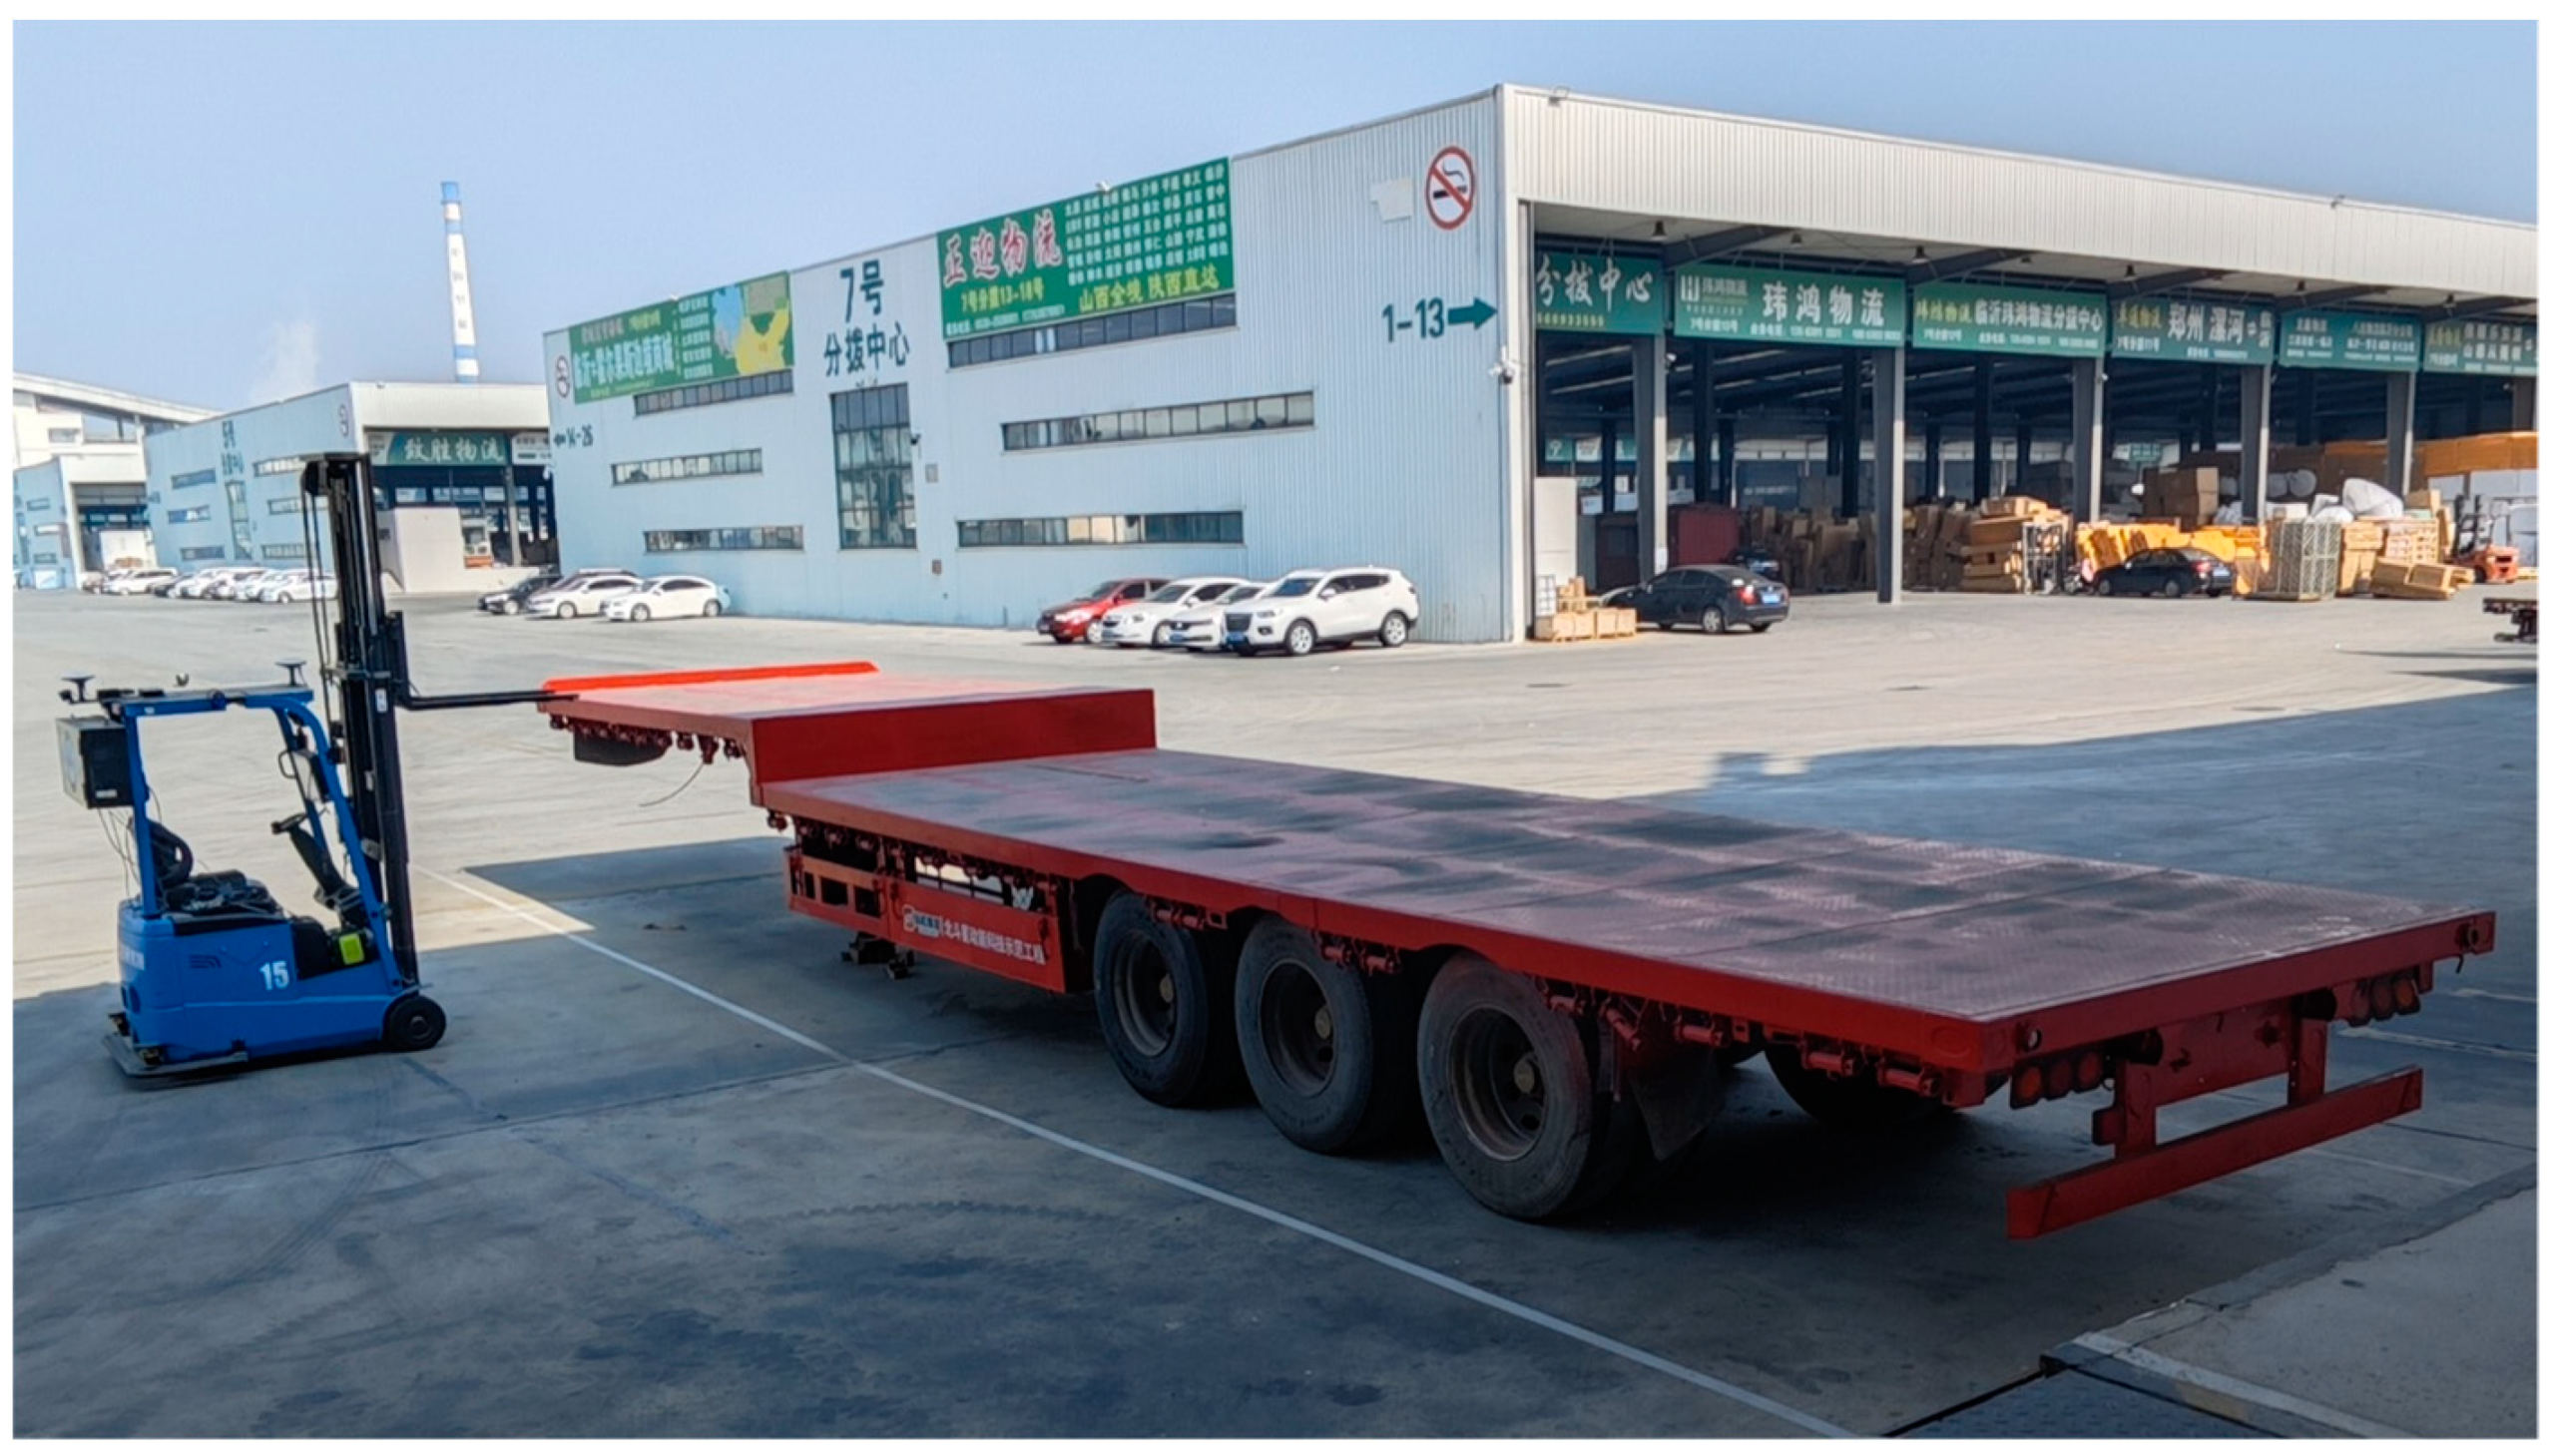
These experiments were carried out in Shunhe International Intelligent Logistics Park in Linyi City, Shandong Province, and the field situation is shown in the
Figure 12.
On the basis of the known parking space and the length of the flatbed truck, the vertical distance from the first and second observation points to the side lines of the parking space was set to 2 m, which were located near the front and the rear of the truck, respectively. The unmanned forklift first arrived at the first observation point for depth data acquisition and preprocessing, image segmentation, endpoint extraction, Beidou data acquisition, and position calculation. Then through the forklift motion control module, the unmanned forklift was controlled to travel to the second observation point for the above process, and the rotation angle estimation was performed after the position of the rear of the flatbed is also obtained.
3.2. Flatbed image segmentation datasets
A total of 1378 flatbed segmentation data were produced, of which 20% was the validation dataset and 80% was the training dataset, and the overall accuracy test of the method was performed after training, so the test dataset was not set. Part of the dataset are shown in the
Figure 13.
When the net was training, the initial learning rate was set to 0.0003, the batch was set to 32, and the number of training rounds was set to 200. The learning rate was dynamically adjusted using the cosine annealing function.
3.3. Parameters setting
3.3.1. Preprocessing parameters selection
In this scene, taking into account the positioning accuracy of the camera and the control accuracy of the unmanned forklift, the segmentation threshold was set to 2.3 m, i.e., the data with a depth greater than 2.3 m were excluded, and only the depth data less than or equal to 2.3 m were retained. The Gaussian filter window size was set to 9*9.
3.3.2. Line extraction and screening parameters setting
The set of straight lines with line segments greater than a certain length in the edge information was extracted, where the length was set to 120 pixels and 20 pixels, and the corresponding sets were denoted as and , respectively.
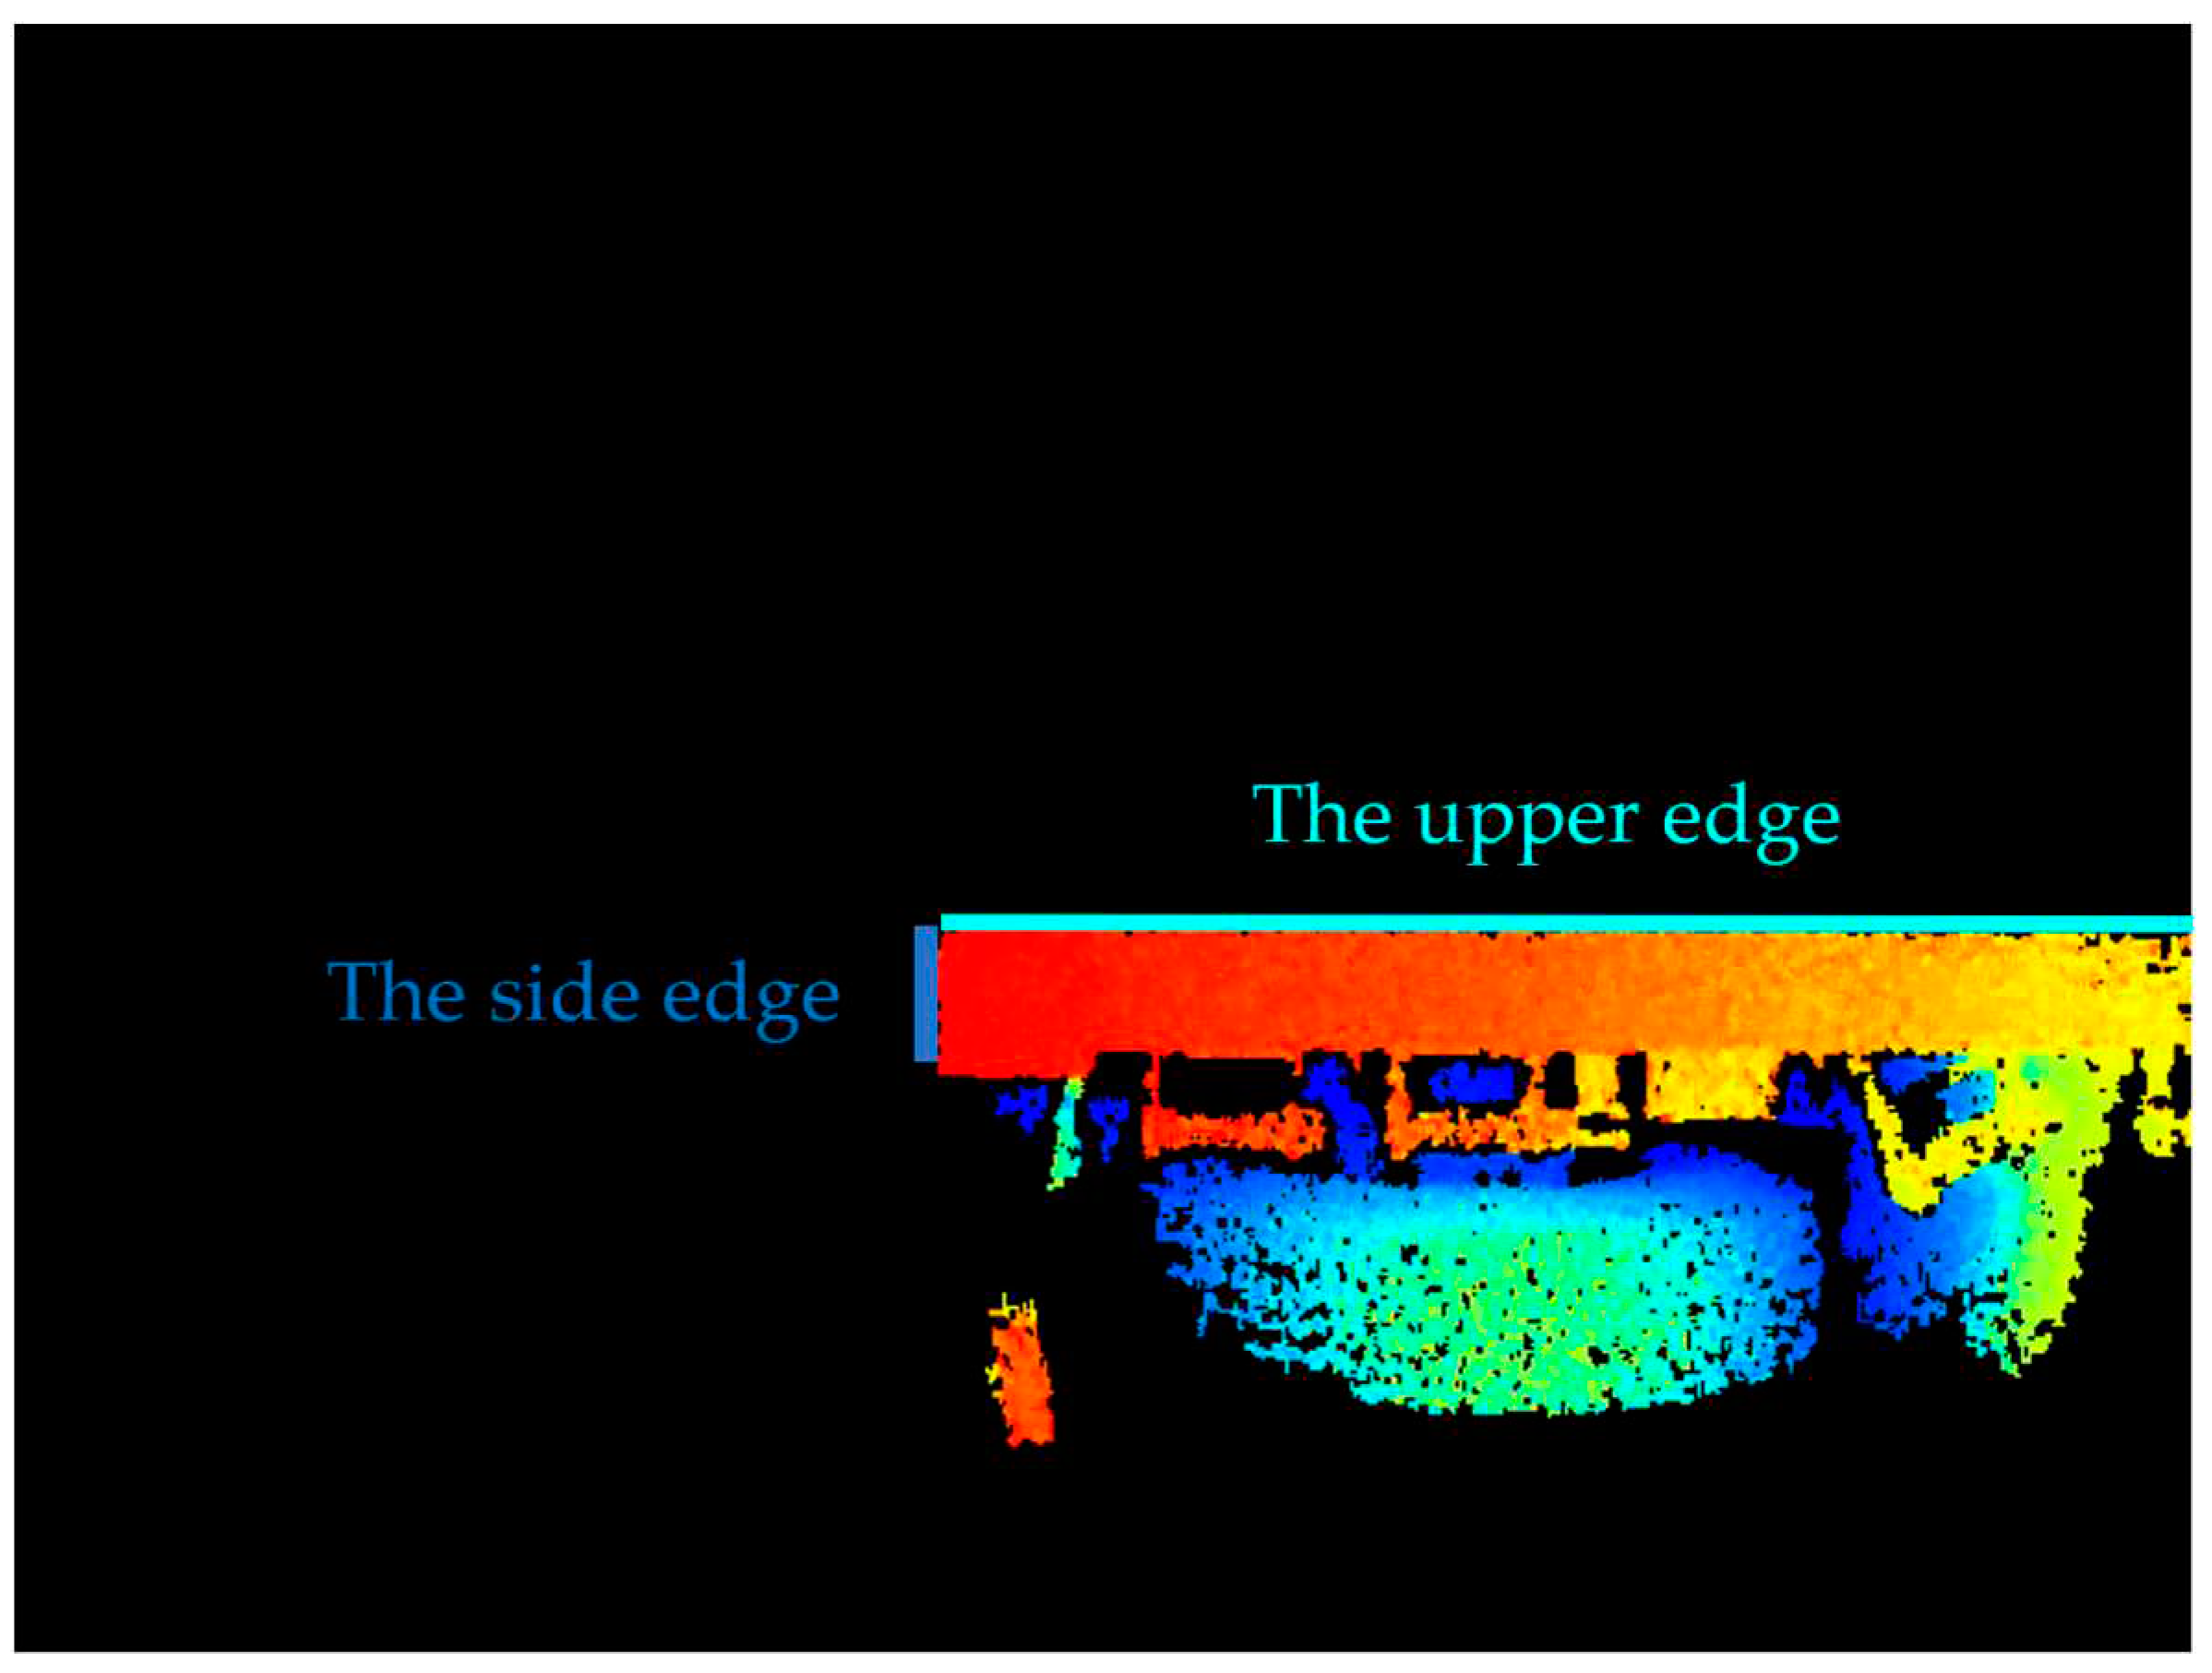
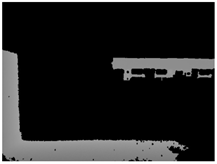
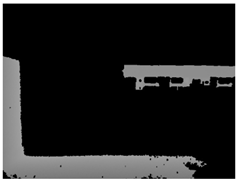
The upper edge contour of the flatbed truck is long as well as approximately transverse, and the side edge is short as well as approximately vertical, as shown in the figure below. A set of straight lines whose angle with the north direction (clockwise is positive and counterclockwise is negative) is within the threshold range of [, ] was screened from set for fitting the upper edge of the flatbed, where was set to 88° and was set to 92°. When the flatbed truck was parked rotated, the upper edge of the flatbed truck in the depth image will be rotated accordingly, so the above threshold range can be increased appropriately. Similarly, a set of straight lines whose angle with the north direction is within the threshold value of [, ] was screened to fit the side edges of the flatbed from the set , where was set to be -0.5° and was set to be 0.5°.
Figure 14.
Flatbed truck rear depth image.
Figure 14.
Flatbed truck rear depth image.
3.3.3. Number of feature vector elements
The number of feature vector elements was taken according to the thickness of the flatbed truck and the location of the observation point, which was set to 10 in this experiment.
4. Evaluation
Three measurements were taken at each endpoint using RTK, and the average value was taken as the reference data, which was compared with the results obtained by the method in this paper. The absolute error (
AE) was used to measure the error between the predicted value and the reference value. For endpoints,
AE is the Euclidean distance between the predicted value and the reference value. For angles,
AE is the absolute value of the difference between the measured angle and the reference angle. In addition, in order to measure the degree of dispersion of the predicted data, the standard deviation (
STD) was used as an evaluation indicator with the following formula. Where the endpoint data measured by RTK is denoted as (
,
), and the rotation angle is denoted as
. The ith predicted endpoint obtained with the method of this paper is denoted as (
,
) and the rotation angle is denoted as
. The
is the number of observations, the average of the
times predicted endpoint coordinates is denoted as (
,
), and the average of the rotation angles is denoted as
.
Since the loading operation was carried out simultaneously on both sides of the flatbed truck, the front and rear endpoints on each side were tested 20 times, and the recognition results for each endpoint are shown in the
Table 3.
Evaluation indexes for each endpoint as well as for the inclination angles on both sides were counted. The results are as follows.
Table 4.
Error between reference and predicted coordinates of endpoints.
Table 4.
Error between reference and predicted coordinates of endpoints.
| Endpoints |
Error (mm) |
| AE |
STD |
| min |
max |
average |
| 1 |
24.588 |
28.514 |
26.614 |
0.049 |
| 2 |
21.230 |
29.285 |
25.790 |
0.016 |
| 3 |
21.961 |
27.876 |
25.629 |
0.008 |
| 4 |
10.871 |
26.450 |
21.775 |
0.080 |
Table 5.
Errors between reference and predicted rotation angles.
Table 5.
Errors between reference and predicted rotation angles.
| Angles |
Error (°) |
| AE |
STD |
| min |
max |
mean |
| 1 |
0.002 |
0.271 |
0.051 |
0.005 |
| 2 |
0.104 |
0.271 |
0.201 |
0.010 |
From the above results, the AE of the endpoint is less than 30 mm, and the STD is less than 0.1 mm, with lower dispersion of the prediction results. The angular errors AE and STD are small. The precision is fully satisfied with the demand through the automatic loading test by the unmanned forklift at the logistics site.
5. Conclusions
This study aims to solve the problem of flatbed truck localization and rotation angle estimation in logistics automatic loading process. By collecting a large amount of sample data of flatbed trucks, we designed a high-precision positioning and rotation angle estimation algorithm for flatbed trucks with BeiDou and vision, and verified the usability and reliability of the method in the automatic loading process. The results of this research are of great significance to improve the loading efficiency, reduce human operation errors, and promote the development of intelligent logistics. In the future, we will continue to improve the algorithm to further address the challenges in more loading scenes and expand the application fields of this research.
6. Patents
This paper has resulted in a patent, with application number CN202311047777.9, titled Flatbed Truck Positioning Method, Installation, and Storage Medium Based on Depth Images.
Author Contributions
Conceptualization, Xinli Yu, Yufei Ren and Xiaoxv Yin; Data curation, Xinli Yu; Formal analysis, Deqiang Meng; Funding acquisition, Yufei Ren; Investigation, Xiaoxv Yin; Methodology, Xinli Yu, Deqiang Meng and Haikuan Zhang; Project administration, Xiaoxv Yin; Resources, Yufei Ren and Xiaoxv Yin; Software, Xinli Yu; Supervision, Xiaoxv Yin; Validation, Deqiang Meng; Visualization, Xinli Yu; Writing – original draft, Xinli Yu and Deqiang Meng.
Funding
This research was funded by National Key Research and Development Program of China, grant number 2021YFB1407003 and Key Technology Research and Development Program of Shandong Province, grant number 2021SFGC0401.
Conflicts of Interest
The authors declare no conflict of interest.
References
- Carlan, V.; Ceulemans, D.; van Hassel, E.; Derammelaere, S.; Vanelslander, T. Automation in cargo loading/unloading processes: do unmanned loading technologies bring benefits when both purchase and operational cost are considered? Journal of Shipping and Trade. 2023, 8, 1–25. [Google Scholar] [CrossRef]
- Kim, K. W. Characteristics of forklift accidents in Korean industrial sites. Work. 2021, 68, 679–687. [Google Scholar] [CrossRef] [PubMed]
- Hanson, R.; Agrawal, T.; Browne, M.; Johansson, M.; Andersson, D.; Stefansson, G.; Katsela, K. Challenges and requirements in the introduction of automated loading and unloading. In Proceedings of the 11th Swedish Transportation Research Conference, Lund, Sweden, 18-19 October 2022. [Google Scholar]
- Park, D.; Park, S.; Byun, S.; Jung, S.; Kim, M. Container Chassis Alignment and Measurement Based on Vision for Loading and Unloading Containers Automatically. In Proceedings of the 2006 International Conference on Hybrid Information Technology, Cheju, Korea (South), 09-11 November 2006; pp. 582–587. [Google Scholar]
- Stentz, A.; Bares, J.; Singh, S.; Rowe, P. A robotic excavator for autonomous truck loading. Auton. Robot. 1999, 7, 175–186. [Google Scholar] [CrossRef]
- Liu, Z. Intelligent bulk grain loading system based on IO-Link technology. Port Operation. 2022, 6, 44–46+60. [Google Scholar]
- Yu, J.; Huang, L.; Tang, H.; Huang, G.; Chen, G. Incoming vehicle detection and planning system for automatic loading. Applied Laser. 2022, 42, 91–100. [Google Scholar]
- Du, G.; Xv, J.; Li, Y.; Jiang, D. A modification scheme of automatic train loading process for rail-type loading machine. Port Operation. 2023, 4, 57–60. [Google Scholar]
- Lee, S.; Chang, T. W.; Won, J. U.; Kim, Y. J. Systematic development of cargo batch loading and unloading systems. Int. J. Logist. Res. Appl. 2014, 3, 75–85. [Google Scholar] [CrossRef]
- Hua, W.; Xie, S. Design and application of automatic loading system for bagged cement robots. Robot Technique and Application. 2020, 1, 31–34. [Google Scholar]
- Cao, W. S.; Dou, L. Implementation method of automatic loading and unloading in container by unmanned forklift. In Proceedings of the 2021 International Conference on Machine Learning and Intelligent Systems Engineering (MLISE), Chongqing, China, 09-11 July 2021; pp. 503–509. [Google Scholar]
- Cen, H.; Wei, H.; Shen, Z. Design of automatic down loading control system for zinc ingot stack. Machinery Design & Manufacture. 2019, 11, 192–195+199. [Google Scholar]
- Pan, H.; Hong, Y.; Sun, W.; Jia, Y. Deep dual-resolution networks for real-time and accurate semantic segmentation of traffic scenes. IEEE trans. Intell. Transp. Syst. 2022, 24, 3448–3460. [Google Scholar] [CrossRef]
- Ballard, D. H. Generalizing the Hough transform to detect arbitrary shapes. Pattern Recognit. 1981, 13, 111–122. [Google Scholar] [CrossRef]
- Li, S.; Zhu, Y.; Zhang, C.; Yuan, Y.; Tan, H. Rectification of images distorted by microlens array errors in plenoptic cameras. Sensors. 2018, 18, 2019. [Google Scholar] [CrossRef] [PubMed]
- Canny, J. A computational approach to edge detection. IEEE Trans. Pattern Anal. Mach. Intell. 1986, 6, 679–698. [Google Scholar] [CrossRef]
|
Disclaimer/Publisher’s Note: The statements, opinions and data contained in all publications are solely those of the individual author(s) and contributor(s) and not of MDPI and/or the editor(s). MDPI and/or the editor(s) disclaim responsibility for any injury to people or property resulting from any ideas, methods, instructions or products referred to in the content. |
© 2024 by the authors. Licensee MDPI, Basel, Switzerland. This article is an open access article distributed under the terms and conditions of the Creative Commons Attribution (CC BY) license (http://creativecommons.org/licenses/by/4.0/).
