
Submitted:
08 February 2024
Posted:
09 February 2024
You are already at the latest version
Abstract
In this paper, the experimental results of the thermal sub-system of a reliable and cost-effective polygeneration solar system are presented. This polygeneration system produces heating, cooling and electricity from solar energy, which are used in an existing test-building. Heat is generated in four evacuated tube solar collectors (ETC). The heat may be used for space cooling, through a variable geometry ejector (VGE) heat pump. In order to reduce the mismatches between generation and consumption, two thermal storage tanks were added.
The performance of a new thermal storage, with 400 l, able to storage both sensible and latent heat, was tested. Heating performances of the test-building were assessed. Ejector cycle tests were also performed.
Keywords:
polygeneration
; solar
; ejector
; thermal storage
; cooling
; heating
1. Introduction
Buildings are responsible for 40% of the total energy consumption and 36% of greenhouse gas emissions in the European Union (EU). Therefore, the EU established a directive on the energy performance of buildings, which requires new buildings to be nearly-Zero Energy Buildings (nZEB), in all member states (European Union 2010).
In Portugal, this directive was transposed onto national legislation in December 2020, becoming effective in July 2021. Improved energy efficiency is essential to reduce building energy consumption and harmful emissions. Additionally, renewable sources should be used to satisfy their energy needs.
A polygeneration system is an energy system able to produce, at least, three useful energy outputs [1]. The experimental analysis of this work was developed in the POLYSOL prototype. It is an existing prototype developed during the POLYSOL project [2] to be used in nZEB buildings, located at FEUP (Faculty of Engineering - University of Porto, Portugal), and which is driven by solar energy. The solar energy is converted into heat (using solar thermal collectors) and into electricity (using photovoltaic solar collectors).
The thermal sub-system, where the thermal collectors (ETC – evacuated tube collectors) are included, may provide heating, or cooling using variable geometry ejector (VGE) heat pump. The variable geometry ejector (VGE) heat pump converts heat into useful cooling. The electricity output of the POLYSOL prototype is provided by the photovoltaic sub-system.
In the cold season, the thermal sub-system of the nZEB prototype provides indoor heating to the test-building. It is known that space heating is the application that consumes more energy in the residential sector (European Union 2010). Therefore, using a low carbon energy source, such as solar energy, to provide heating is a good solution to help decarbonizing the sector.
However, the main disadvantage of using solar energy is its intermittency. Thus, it is necessary to use an energy storage system, even if it increases the overall cost of the system [3].
In this case study, a storage tank with a capacity of 400 liters was used. The performance of this solution was evaluated using only sensible heat storage, with water as heat transfer fluid. In a further development in the near future, the effect of using a phase change material (PCM) will be tested.
A VGE cycle, driven by thermal solar energy, delivers cooling to the test-building, in warm days. Solar energy is very suitable for providing cooling because peak hours of high solar radiation usually correspond to higher cooling demands.
The heating performance was assessed. Ejector cycle space cooling tests were also performed.
2. State of the Art
2.1. Solar Energy
Climate change and environmental concerns have led to find alternatives to fossil fuels for energy conversion. So, there is a trend to use renewable sources, like solar energy, for a lot of applications, including the residential sector.
Solar energy can be used directly or indirectly. In an indirect way, solar energy induces waves, winds and tides that can be used to generate energy. In a direct way, solar energy can be used to obtain thermal energy with the help of improved energy conversion technologies. An example of a thermal energy conversion technology is the use of solar thermal collectors.
2.2. Space Heating
It is possible to supply heating to a space through solar thermal collectors. With these devices, solar radiation is converted into thermal energy, which is transported by a working fluid, such as water, air or oil.
The thermal energy produced by the solar thermal collectors can be directly used to heat a space through a heat exchanger, or stored in a thermal storage. Storage is essential to respond to energy needs when solar energy is low or unavailable.
Thermal heat storage can be subdivided into three categories: sensible, latent and thermochemical heat storage. However, due to the lack of commercially available thermochemical heat storage solutions, and due to high material costs and unknown lifespan, the most used are sensible and latent heat storage [4].
2.3. Space Cooling
Usually, solar radiation is available during the hours when the demand for cooling is extreme [7]. So, solar energy is suitable to produce cooling, combining it with a refrigeration cycle.
One of the most promising technologies to provide cooling to a space is the ejector heat pump system. Although ejector systems have a somewhat lower cooling cycle coefficient of performance (COP) when compared to absorption heat pumps, they are structurally simple, have a relatively low initial cost, and a high flexibility in terms of working fluid selection, besides having low maintenance requirements [8].
2.3.1. Solar Ejector Cycle
Figure 1 shows a T-s diagram of a solar ejector cooling cycle [9]. In this cooling cycle the solar radiation is captured by solar thermal collectors and converted into heat. The heat is transported by a working fluid, usually water, and it is transferred to the ejector subsystem through a heat exchanger called generator.
The steam leaves the generator at high pressure (primary pressure) and high temperature (point 2 in Figure 1), enters in the ejector and entrains the steam at low pressure (suction pressure) and temperature from the evaporator (point 4). The mixed flow leaves the ejector at an intermediate pressure (back pressure) and temperature (point 5). The heat of the mixed flow is dissipated through a condenser to the outside, achieving the state of saturated or sub-cooled liquid (point 6). After that, the flow is divided between the generator (point 1) and the evaporator (point 3). In the entrance of the evaporator there is an expansion valve that allows the fluid to expand and, consequently, the temperature decreases. The flow through the evaporator allows providing cooling to a space.
There are several indicators to evaluate the performance of the ejector cycle. One of them is the coefficient of performance (COP), defined by
where is the heat rate supplied by the solar thermal collectors through the generator and it is the cooling rate capacity, as calculated by
where it is the secondary mass flow rate and is the enthalpy variation of the refrigerant fluid on the evaporator.
The entrainment ratio λ is defined by eq. (3) and represents the relationship between the secondary and primary flow. The higher the entrainment ratio for an ejector, the larger the quantity of low-pressure steam that can be recovered [10].
Another indicator is the critical back pressure that is defined as the maximum back pressure for which there is no reduction of λ.
The area ratio is an indicator defined by the ratio of the constant area section and the nozzle section area (in the ejector). For this indicator, depending on operation conditions, there is an optimum value that allows the ejector to operate in critical mode [11]. However, due to the variability of solar energy, the operating conditions are variable and the optimum point is not constant. To solve this problem, it is possible to use a movable spindle that allows to change the area ratio [12]. Figure 2 illustrates the linear movement of the spindle (NXP), which allows changing the flow section in the ejector primary nozzle.
3. Description of the Thermal Sub-System
Figure 3 shows the thermal sub-system presented in this work. It is able to provide heating or cooling to an existing small test-building (with a floor area of 15 m2 and a height of 2.5 m), through the use of a fan-coil. The fluid used for the heat transfer to the space is water. Cold or warm water is supplied to the fan-coil, depending on the combination between opening and closing positions of the different valves and the operation state of the pumps in the system. To convert solar radiation into useful thermal energy, The evacuated tube collectors were connected in series, with a net absorber area of about 13 m2.
As shown in a previous study [2] the solar thermal collector area is oversized. It requires a heat dissipating fan-coil to protect the system from overheating, especially during clear-sky days, releasing the heat into the environment. To reach this goal, a larger storage tank could also be used. Furthermore, it could compensate for a longer-period variability, although increasing the system inertia [8].
In this context, besides the heat dissipator, a thermal storage tank with a 400 l capacity is used in addition to the 50 l storage tank. The larger tank is able to store sensible heat, using water as storage means. Moreover, it is also possible to apply PCMs, storing latent heat. This could be a good solution due to the high phase change latent heat of PCMs, compared to the specific heat of water.
The cold water is obtained with a VGE cycle, using isobutane (R600-a) as working fluid. The low-pressure secondary flow of the ejector passes through the evaporator with low temperature and allows cooling the water. The rejected heat needs to be dissipated through the condenser to an external cold water flow. The ejector used has a variable geometry. Hence, the change in the spindle position is possible, which influences both COP and cooling capacity [8].
In different locations of the thermal system, as indicated in Figure 1, there are thermocouples (TC), flowmeters (FM), pressure transducers (PT), resistance temperature detectors (RTD) and a pyranometer. They are electronically connected to a data logger. Therefore, with the use of the Labview graphical program, measurement data can be recorded and the sub-system controlled and managed.
4. Results and Discussion
4.1. Space Heating Test
The space heating test consisted in using the sensible thermal energy stored in the tank during the day, maintaining the room air temperature between 22 ºC and 26 ºC. The test was done during the night of April 29 to April 30, because during the day the heating needs were small. So, under those conditions, it was possible to assess the performance of the thermal storage tank for heating purposes.
The test started at 21 pm of April 29, 2021. In that moment, the temperature of the water inside of the thermal storage tank was 72 ºC.
With a thermocouple and the Labview program it was possible to set the temperature of the room between 22 ºC and 26 ºC: when the air room temperature was higher than 26 ºC, the fan-coil pump was turned off and stopped providing heat to the room. On the other hand, when the air room temperature was lower than 22 ºC, the pump of the fan-coil was turned on and it was possible to heat the space.
Figure 4 represents the temperature of the space test (marked with black dots) and the ambient temperature (marked with blue dots) during the time. It is possible to observe that the storage tank could keep the room temperature between 26 ºC and 22 ºC until 9 am. In fact, when the ambient temperature was lower (between 5 am and 7 am), the storage tank couldn’t raise the room temperature to 26 ºC. In that period, the maximum room temperature of the room was 25 ºC, and it decreased constantly after that point. Even with the increase in ambient temperature after 9 am, the storage tank couldn’t heat the space.
Figure 5 represents the temperature of the water at the inlet of the fan-coil (blue dots) and the accumulated thermal energy supplied to the space test (black dots) during the time. Furthermore, Table 1 presents the numerical values of the accumulated thermal energy supplied to the test space.
It is visible that, in the beginning, the total energy supply increases more quickly than at the end of the test. Twelve hours after the beginning of the test, the total thermal energy supply was 18.67 kWh.
In terms of water temperature at the fan-coil inlet, it appears that at least 35ºC were needed (temperature after 8 hours of the test start), to be possible to respond to the thermal load of the space.
4.2. Ejector Cycle Test
4.2.1. Minimum Secondary Pressure to Obtain Cooling on the Indoor Test Space
The first test carried out to evaluate the ejector heat pump, consisted in the determination of the minimum secondary pressure to obtain cooling on the space, with different primary pressures and spindle positions. The minimum secondary pressure may be obtained if the entrainment ratio is zero. In other words, the entrainment ratio is zero if the flow rate on the evaporator is zero too. So, heat transfer in the evaporator doesn’t exist under these circumstances.
The variation of the secondary pressure (and its uncertainty) with the backpressure, for different spindle positions (6, 7 and 8 mm) and different primary pressures (8, 9, 10 and 11 bar) are represented in Figure 6, Figure 7 and Figure 8. Each color represents a fixed primary pressure, with 3 different test points. The 3 tests were carried out on 3 different days.
It is visible that for the same primary pressure, the back pressure increases with the increase of the spindle position. In addition, for each position, with the increase in primary pressure, the secondary pressure decreases. However, for the same spindle position and primary pressure, with the increase of the back pressure, the secondary pressure also increases. This relation is clearer for higher back pressures.
Although the variation of the secondary pressure with the primary pressure, back pressure and the spindle position follow the expected tendency, there are points that present a high uncertainty (10 % higher than the measured value). This aspect makes impossible to obtain a value for the minimum secondary pressure for operating conditions. The cause of that could be uncontrollable factors like the variation of solar radiation and cooling water flow rate, which makes this test not proper under these conditions.
4.2.2. Test to Analyse the Influence of Isobutane Mass on the Ejection Cycle
The previous test was inconclusive in terms of the minimum secondary pressure values needed to achieve cooling. Therefore, the evolution of the coefficient of performance (COP) for various mass flowrates was examined to evaluate the performance of the ejector and ejector cycle.
A spindle position of 6.5 mm and an opening expansion valve value of 50% were used in the tests. Under these circumstances, the ejector cycle gas was released for three seconds, successively increasing its mass flowrate. Between tests, the system performance was evaluated, and the COP was calculated. Figure 9 represents the system COP variation and respective uncertainty, as a function of primary pressure. The aforementioned figure shows four groups of points with different color combinations. Each color stands for an equal gas flowrate in the system. The blue dots represent the tests realized for higher flowrate, followed by the yellow, green and black dots.
As shown in the figure, the COP nearly remains constant with the lower gas flowrate (black dots). The COP varies more significantly for higher mass flowrates. The maximum deviation of the COP in percentage, from the higher to the lower flowrates is 38.1 %, 38.1%, 28.6%, and 10.0%, respectively.
Comparing the cases with the highest and lowest flow rates (blue and black dots, respectively), it was found that, for 9 bar, the COP for the lowest flowrate is 38,5% higher than the one obtained for the other case. For 10 bar, it is 20,0 % higher. With a primary pressure of 11 bar, it isn’t possible to state, with 95% confidence, which case has a higher COP. At 12 bar, the COP decreases with the decrease in flowrate. However, with the lowest one, the COP is only 10,5% inferior to the one with highest flowrate.
5. Conclusions
In this work, the performance of the thermal subsystem of a polygeneration system, providing heating and cooling to an existing test building, was evaluated.
First, the 400 litre storage tank was tested to provide heating to the test building. Only sensible thermal energy storage was tested. It was concluded that, due to the environmental conditions and for an initial temperature of 72 ºC of the storage tank, it was possible to maintain the room temperature between 22 ºC and 26 ºC, until 5:00 a.m. In other words, the heat storage was capable of heating the test building for 8 hours. Furthermore, at the end of the test, the accumulated thermal energy was 18.67 kWh.
Subsequently, tests related to cooling of the test building were carried out. The first test consisted in obtaining the minimum ejector secondary pressure to achieve cooling. Although the suction pressure varies as expected with back pressure, it was not possible to achieve a value for the spindle positions and required primary pressures. Therefore, it was not possible to evaluate the performance of the new ejector with this test, due to uncontrollable factors such as solar radiation variation and cooling water flow rate.
As an alternative, the evaluation of the COP was made, as a function of the primary pressure, for the same position of the spindle and opening of the expansion valve. The test was carried out for different amounts of isobutane in the cooling cycle.
It was concluded that with a lower mass of isobutane in the cycle, a lower variation of the COP with the primary pressure is achieved. Although the COP achieved with the higher flow rate of isobutane for 12 bar was 10.5% higher than with the lower flow rate, for 9 bar the maximum COP achieved was 38.5 % higher than the minimum.
Acknowledgments
The authors would like to thank the National Funding Agency for Science and Research in Portugal (FCT) for the financial support of this work through the POLYSOL project, under grant n. POCI-01-0145-FEDER-030223.
References
- Kasaeian, Alibakhsh, Evangelos Bellos, Armin Shamaeizadeh, and Christos Tzivanidis. Solar-driven polygeneration systems: Recent progress and outlook. Applied Energy 2020, 264, 114764. [Google Scholar] [CrossRef]
- B. Shahzamanian, J. Soares, S. Varga, A.I. Palmero-Marrero, A.C. Oliveira. Thermal and electrical performance assessment of a solar polygeneration system. Energy Reports 2020, 6, 725–731. [CrossRef]
- Rabaia, Malek Kamal Hussien, Mohammad Ali Abdelkareem, Enas Taha Sayed, Khaled Elsaid, Kyu-Jung Chae, Tabbi Wilberforce, and A. G. Olabi. Environmental impacts of solar energy systems: A review. Science of The Total Environment 2021, 754, 141989. [CrossRef]
- Faraj, Khaireldin, Mahmoud Khaled, Jalal Faraj, Farouk Hachem, and Cathy Castelain. A review on phase change materials for thermal energy storage in buildings: Heating and hybrid applications. Journal of Energy Storage 2021, 33, 101913. [Google Scholar] [CrossRef]
- Koçak, Burcu, Ana Ines Fernandez, and Halime Paksoy. Review on sensible thermal energy storage for industrial solar applications and sustainability aspects. Solar Energy 2020, 209, 135–169. [Google Scholar] [CrossRef]
- Rathore, Pushpendra Kumar Singh, and Shailendra Kumar Shukla. Enhanced thermophysical properties of organic PCM through shape stabilization for thermal energy storage in buildings: A state of the art review. Energy and Buildings 2021, 236, 110799. [Google Scholar] [CrossRef]
- Saikia, Kangkana, Manel Vallès, Alexandre Fabregat, Raúl Saez, and Dieter Boer. A bibliometric analysis of trends in solar cooling technology. Solar Energy 2020, 199, 100–114. [Google Scholar] [CrossRef]
- Varga, Szabolcs, Armando C. Oliveira, Anna Palmero-Marrero, and Jakub Vrba. Preliminary experimental results with a solar driven ejector air conditioner in Portugal. Renewable Energy 2017, 109, 83–92. [CrossRef]
- Braimakis, Konstantinos. Solar ejector cooling systems: A review. Renewable Energy 2021, 164, 566–602. [Google Scholar] [CrossRef]
- Ariafar, Kavous, David Buttsworth, Ghassan Al-Doori, and Navid Sharifi. Mixing layer effects on the entrainment ratio in steam ejectors through ideal gas computational simulations. Energy 2016, 95, 380–392. [Google Scholar] [CrossRef]
- Varga, Szabolcs, Armando C. Oliveira, Xiaoli Ma, Siddig A. Omer, Wei Zhang, and Saffa B. Riffat. Experimental and numerical analysis of a variable area ratio steam ejector. International Journal of Refrigeration 2011, 34, 1668–1675. [CrossRef]
- Varga, Szabolcs, Armando C. Oliveira, and Bogdan Diaconu. Influence of geometrical factors on steam ejector performance – A numerical assessment. International Journal of Refrigeration 2009, 32, 1694–1701. [CrossRef]
Figure 1.
a) Schematic representation of a generic solar ejector cycle and b) thermodynamic evolution of the cycle in a T-s diagram [9].
Figure 1.
a) Schematic representation of a generic solar ejector cycle and b) thermodynamic evolution of the cycle in a T-s diagram [9].
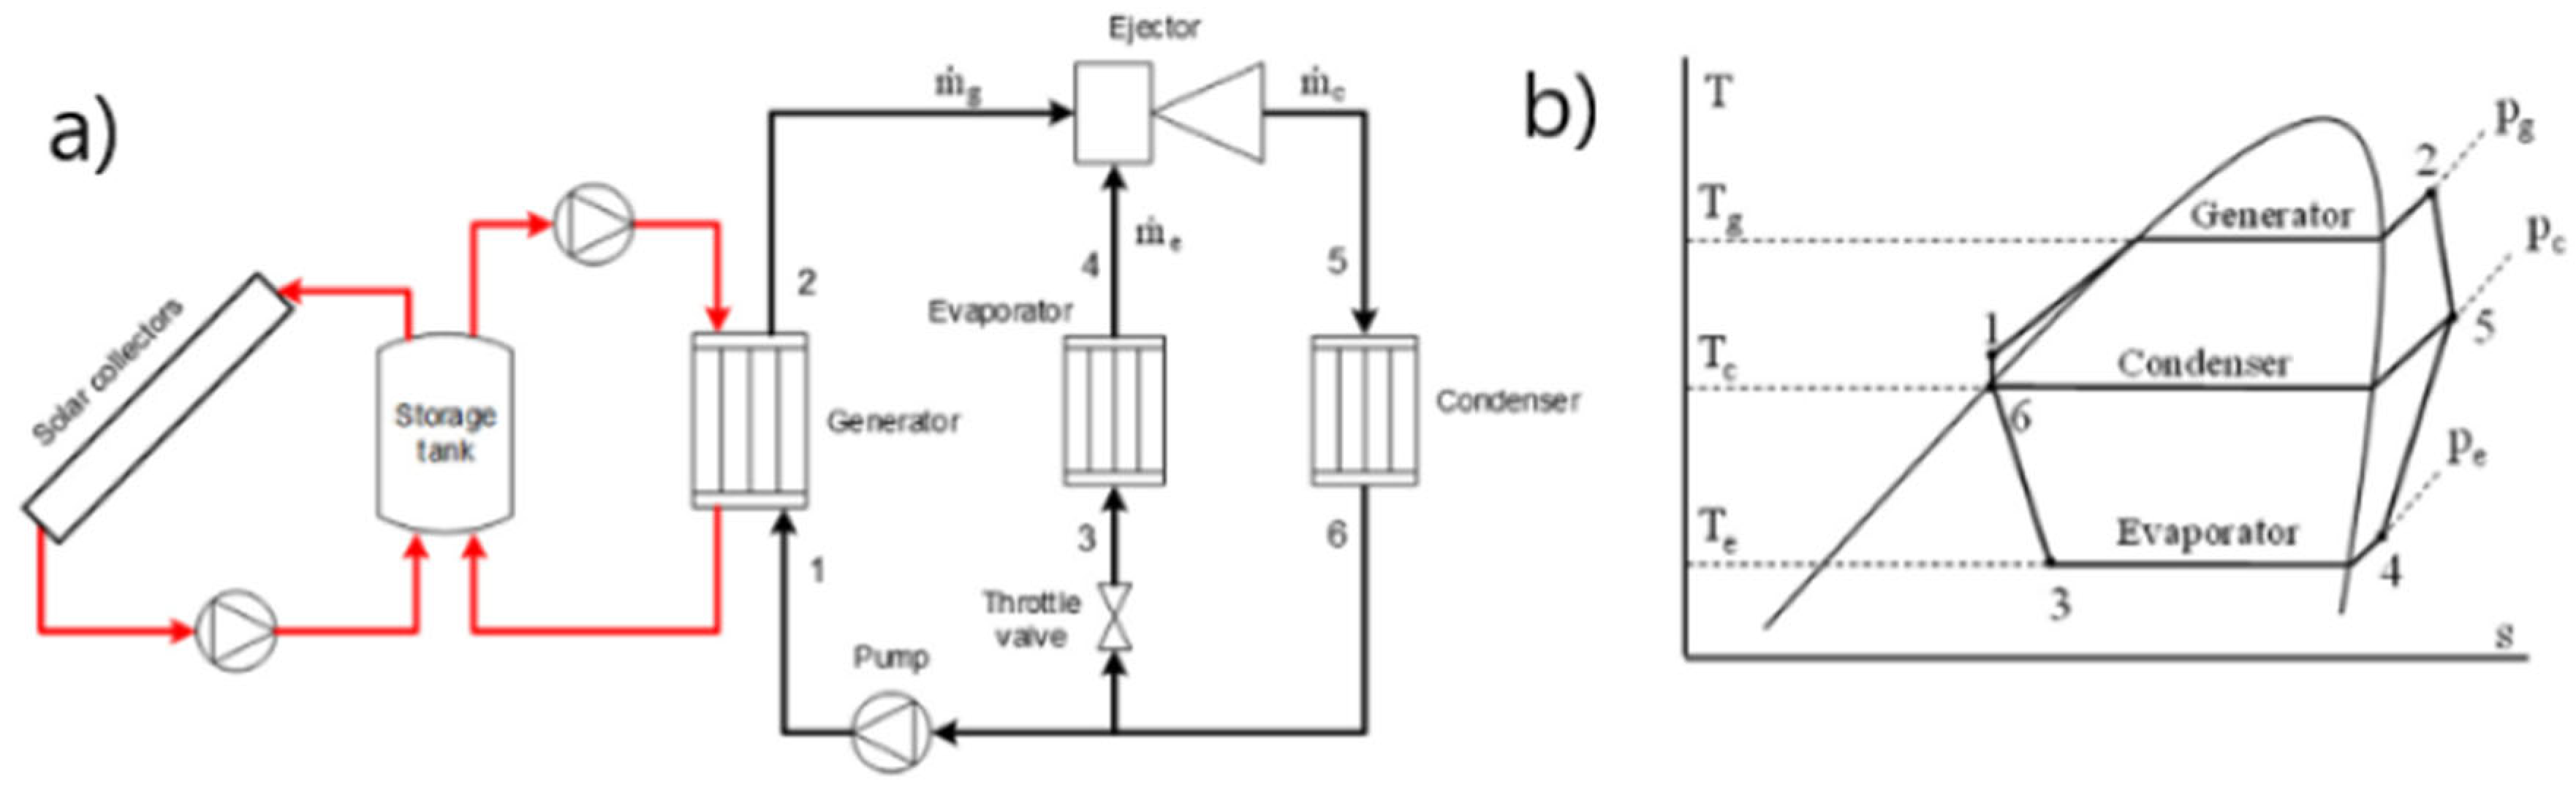
Figure 2.
Schematic representation of the ejector and movable spindle.
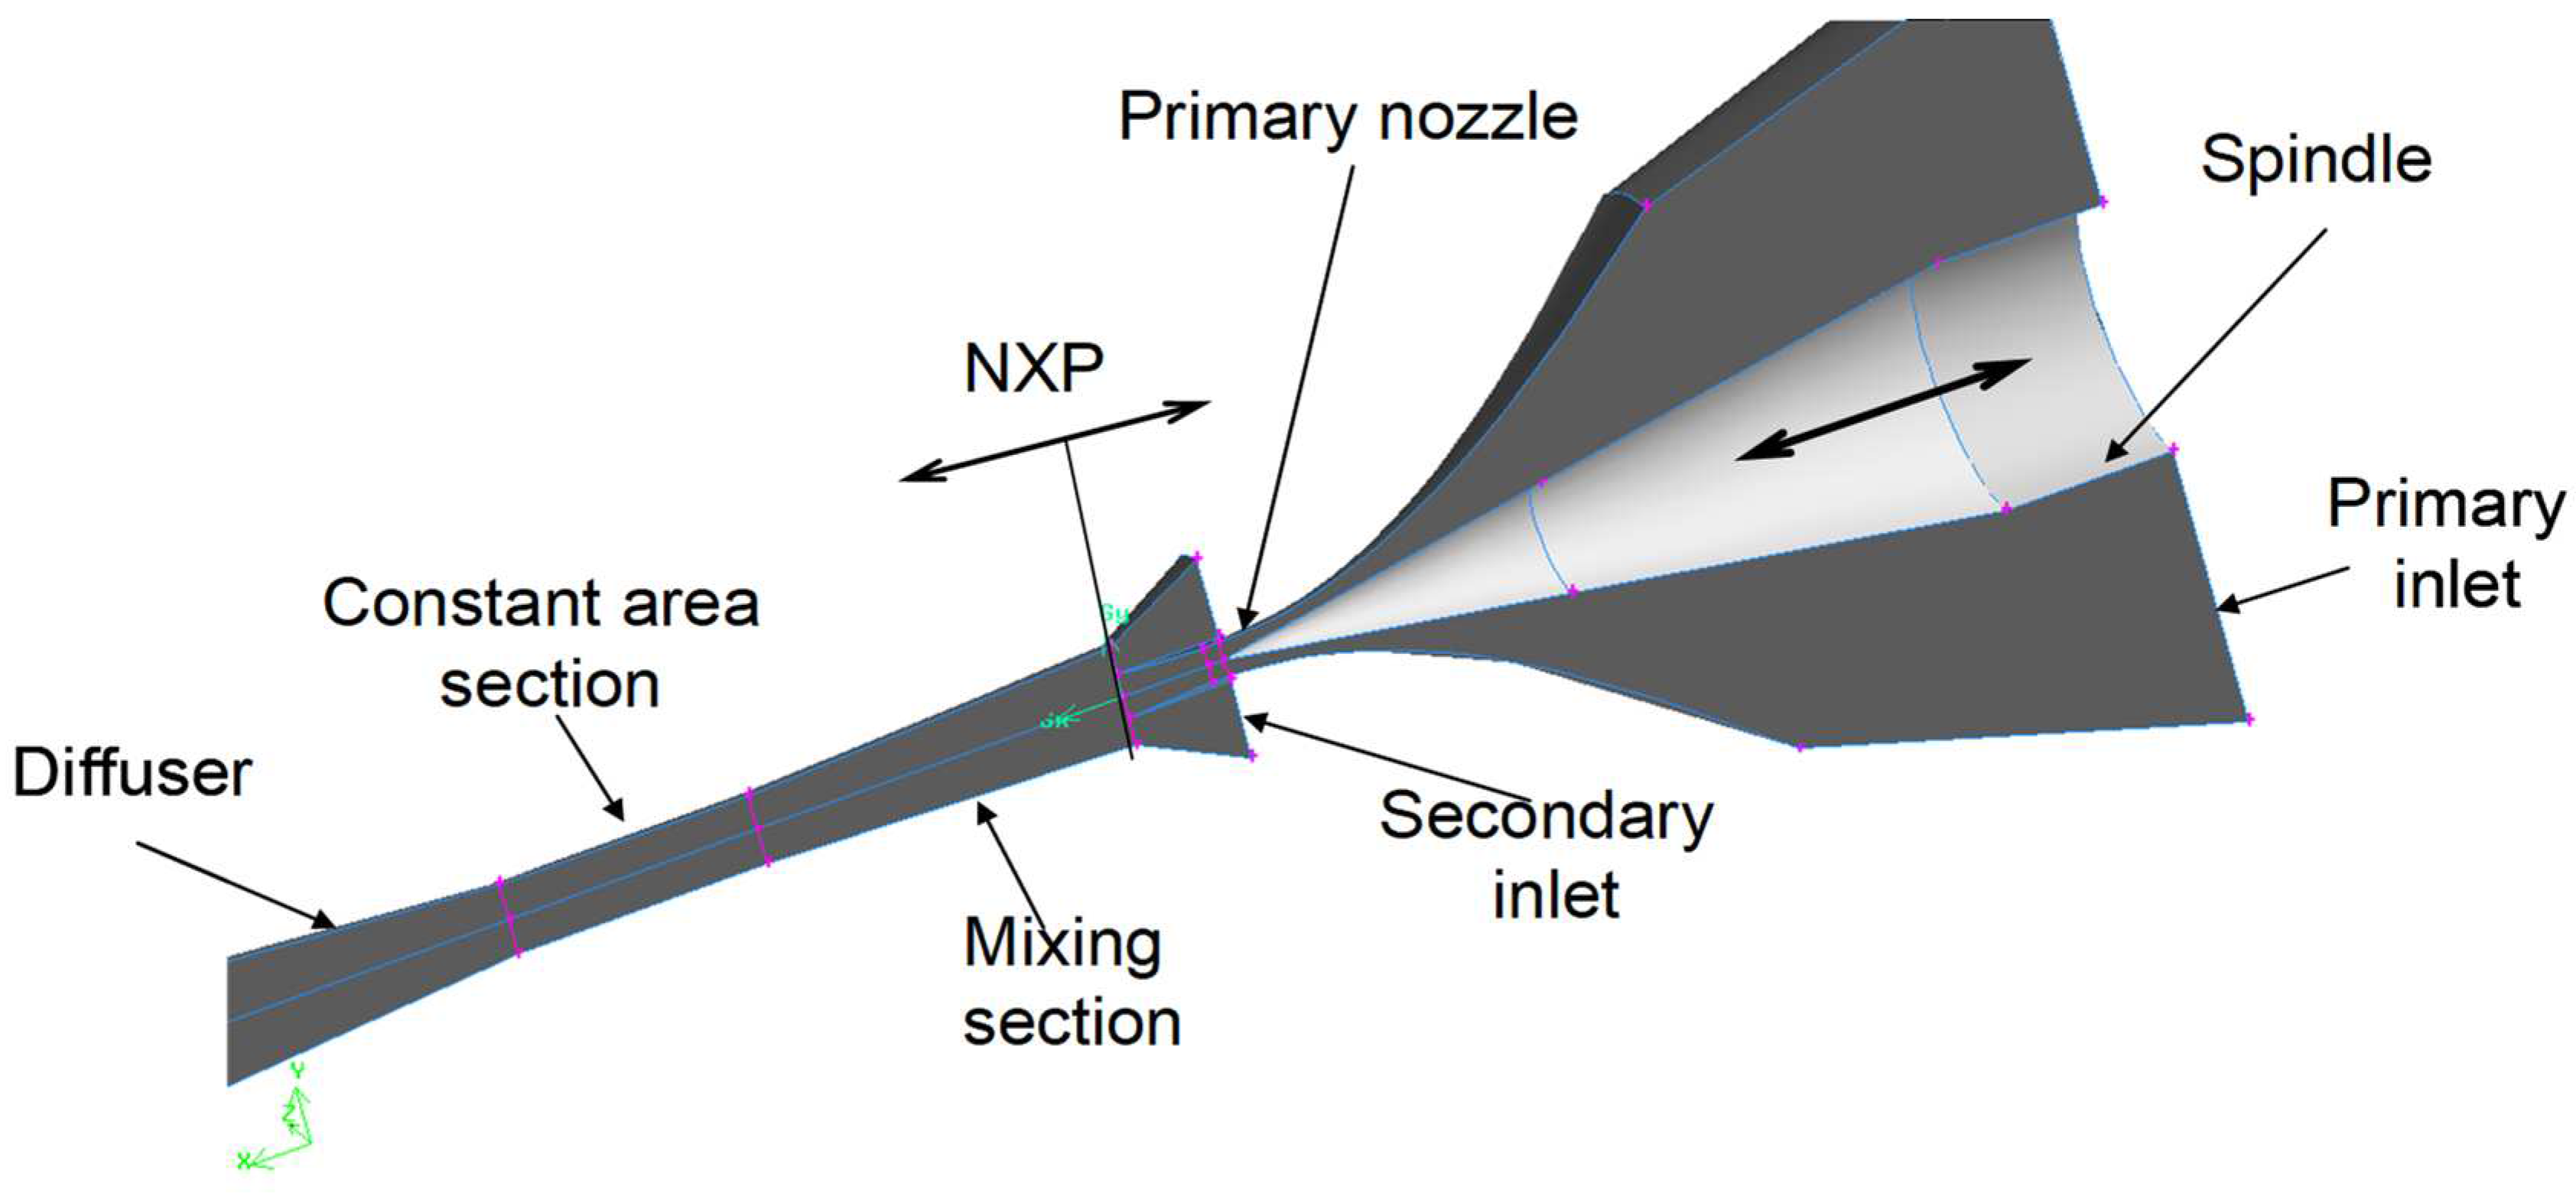
Figure 3.
Schematic representation of the thermal sub-system and measuring points.
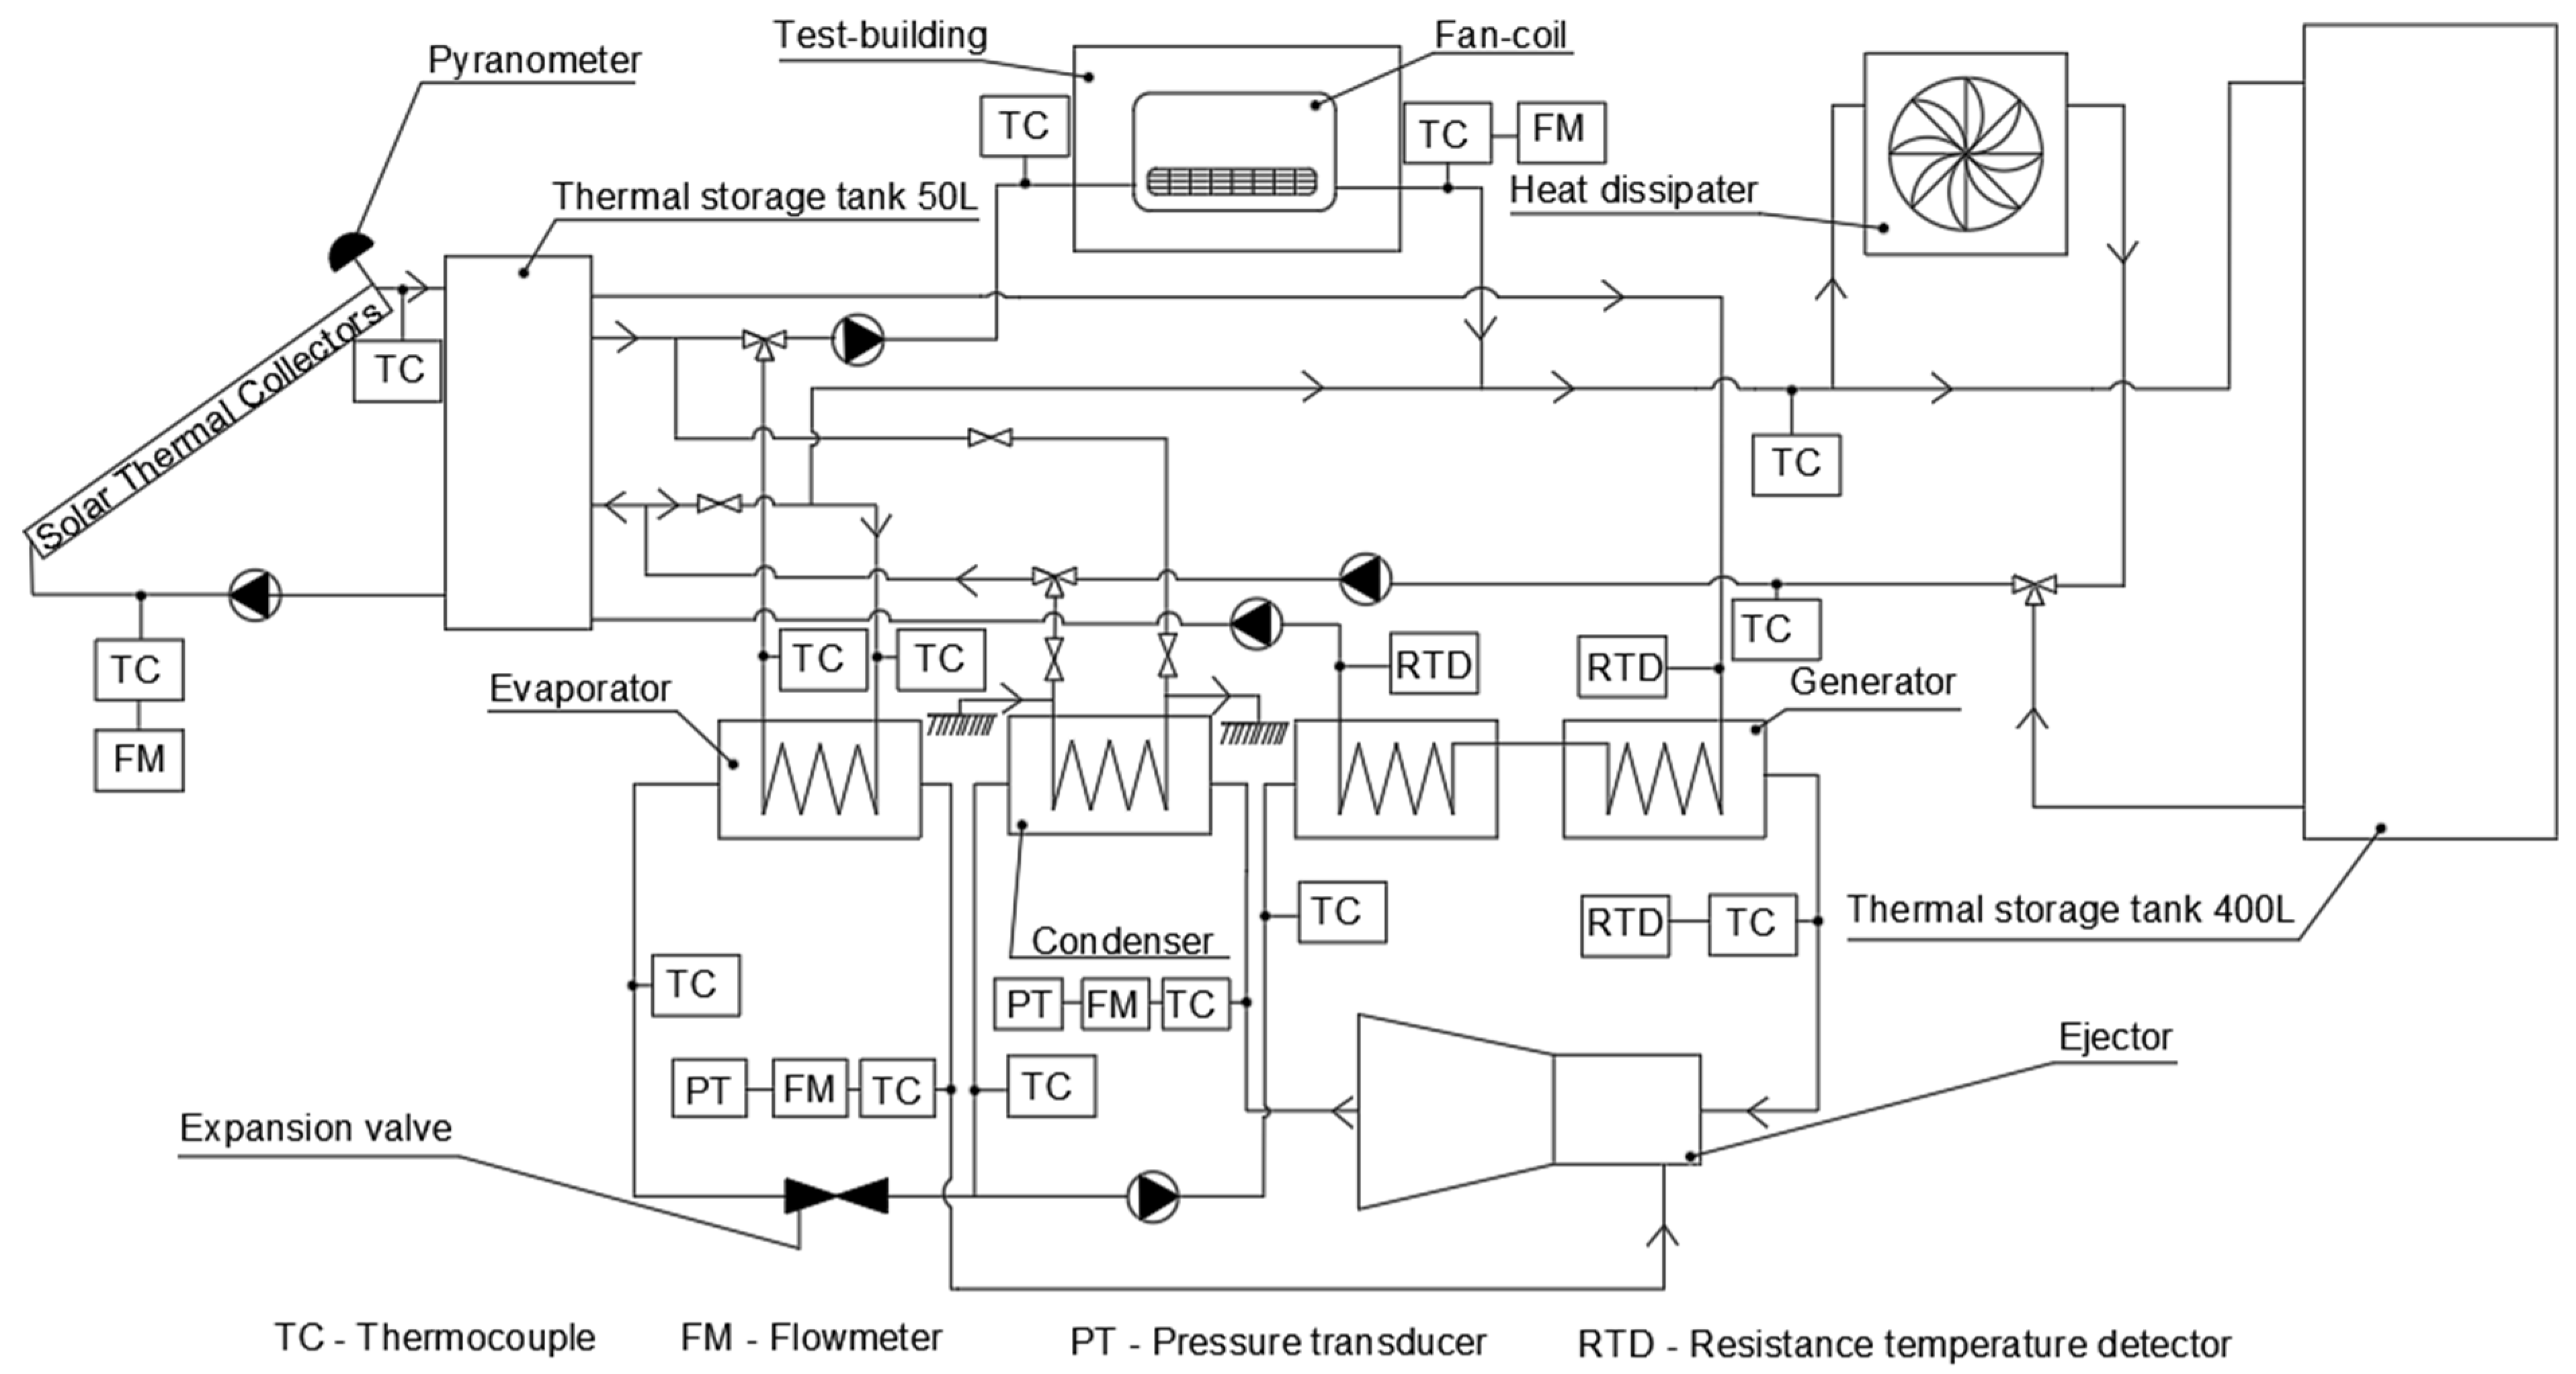
Figure 4.
Evolution of the test-building temperature (black dots) and ambient temperature (blue dots), during the test period (start at 21:00).
Figure 4.
Evolution of the test-building temperature (black dots) and ambient temperature (blue dots), during the test period (start at 21:00).
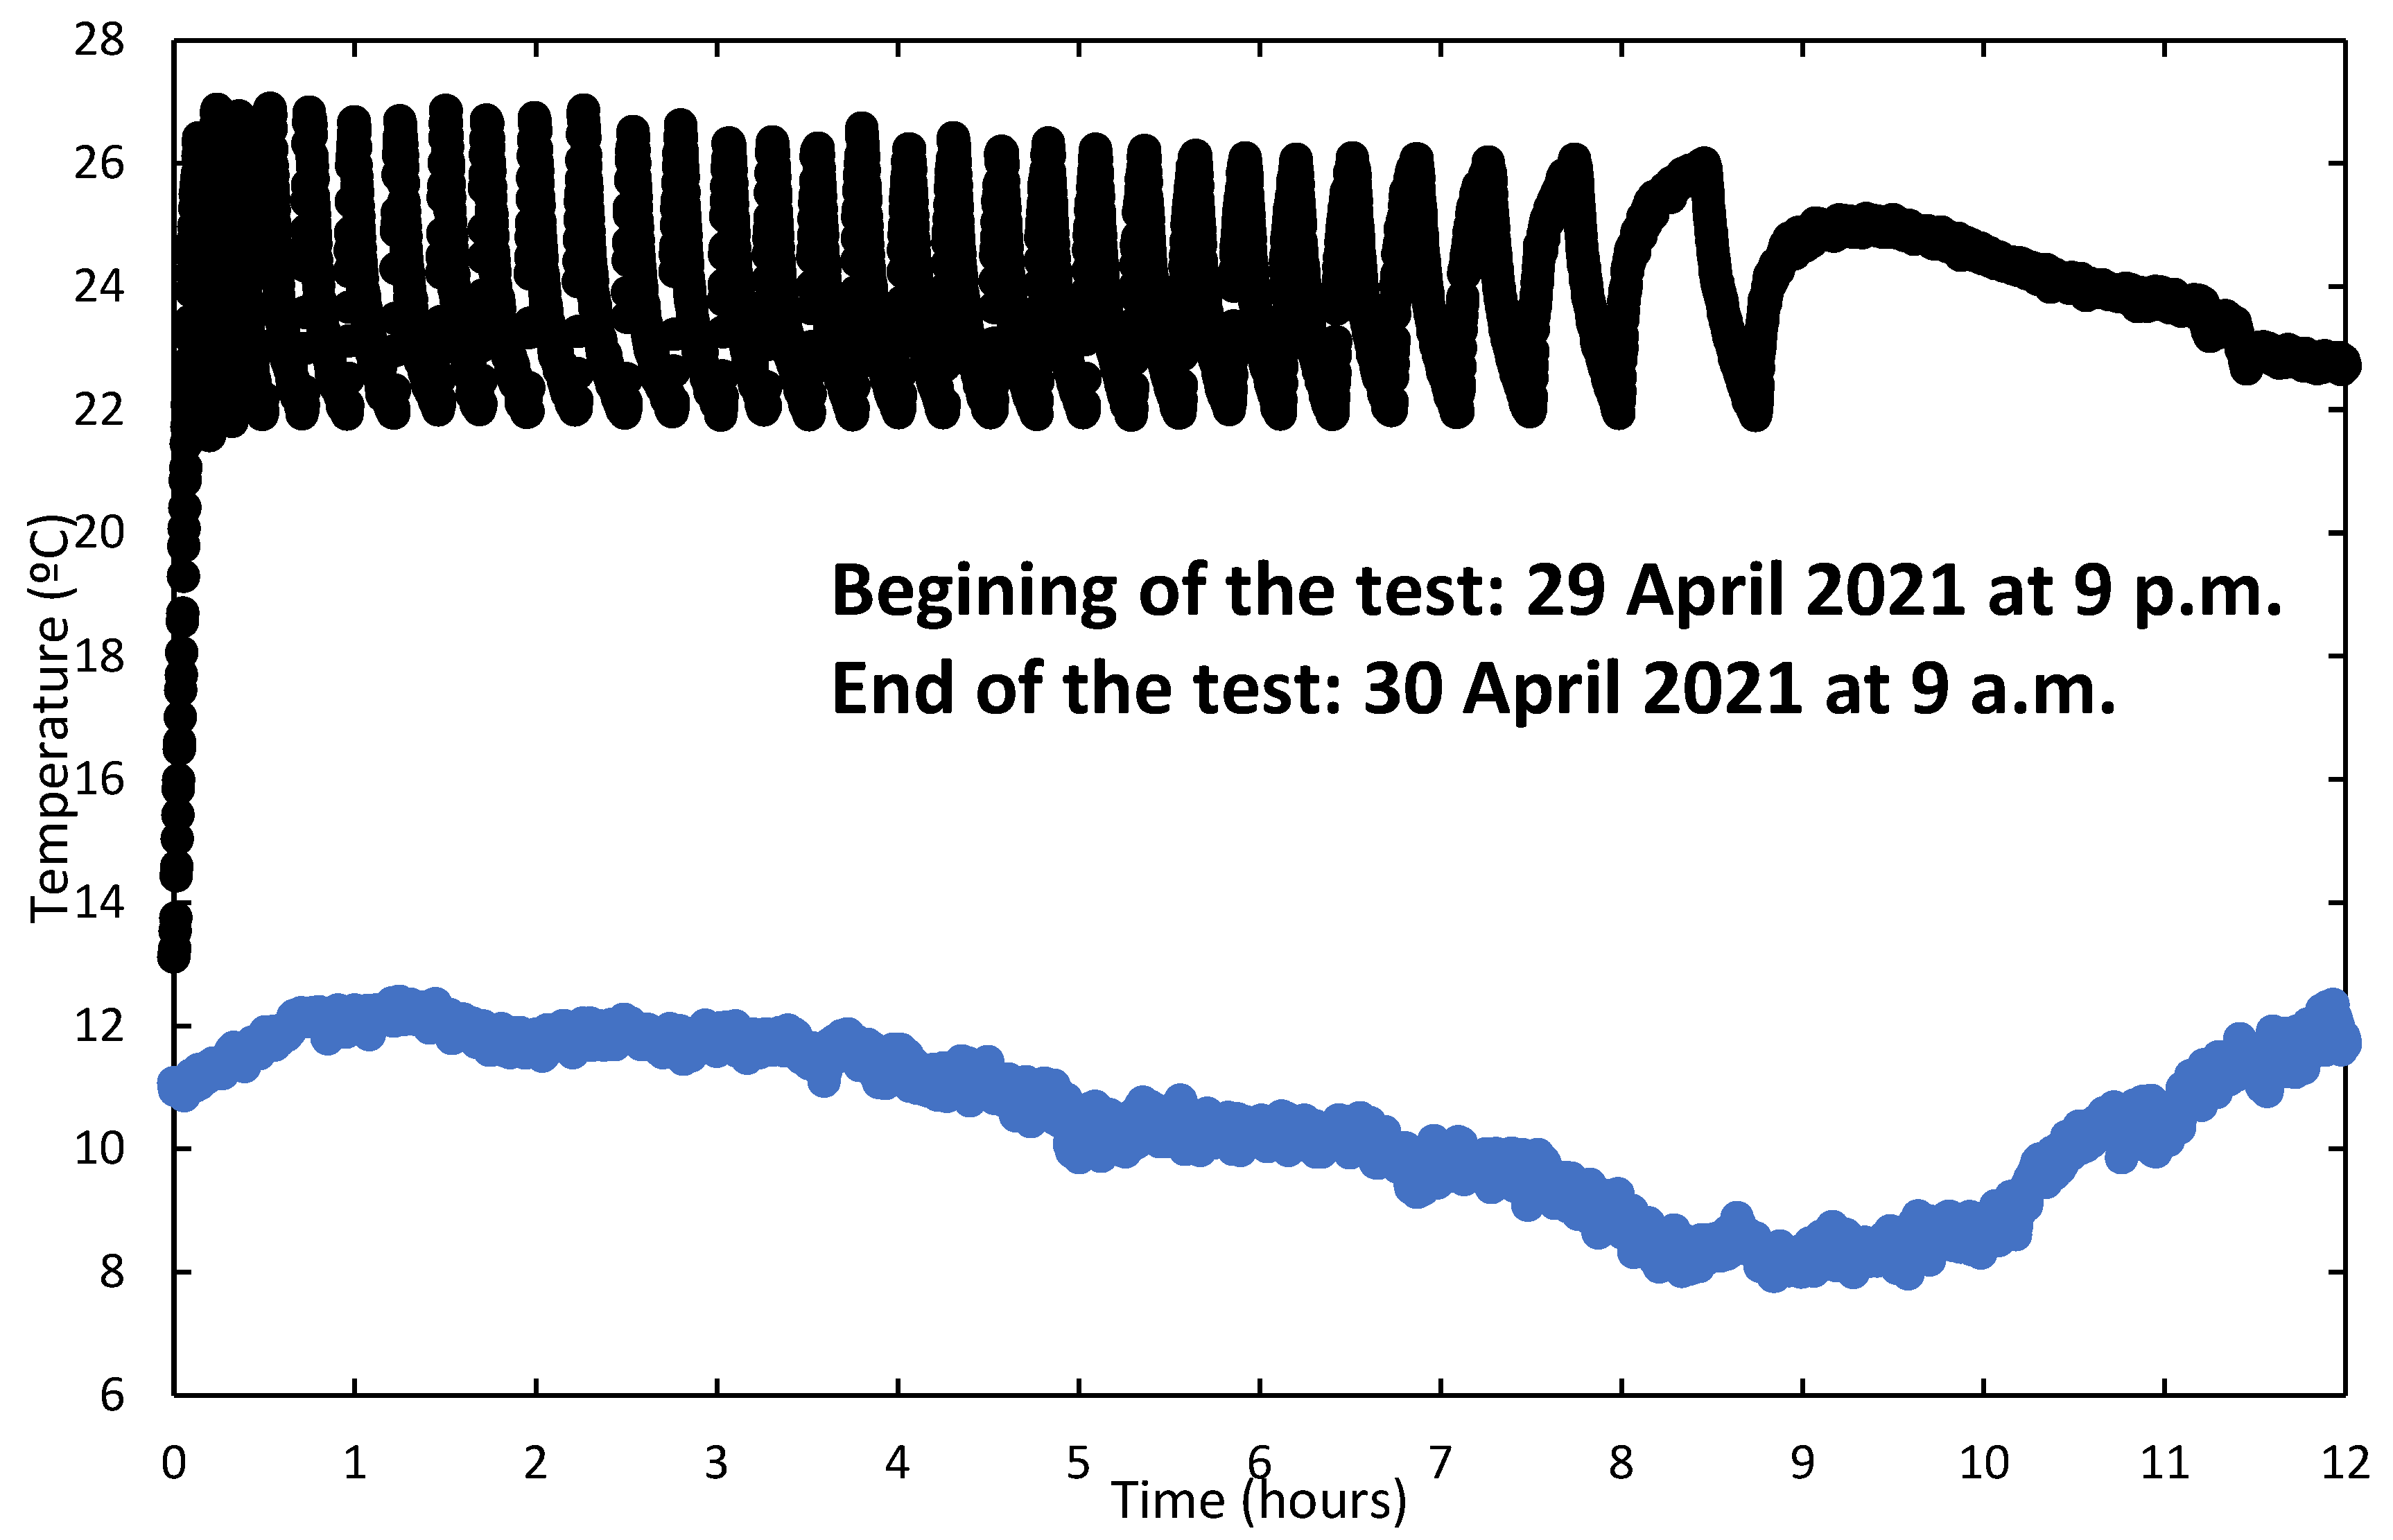
Figure 5.
Evolution of the accumulated thermal energy supplied to the tested space (black dots) and of the water temperature at the fan-coil inlet (blue dots).
Figure 5.
Evolution of the accumulated thermal energy supplied to the tested space (black dots) and of the water temperature at the fan-coil inlet (blue dots).
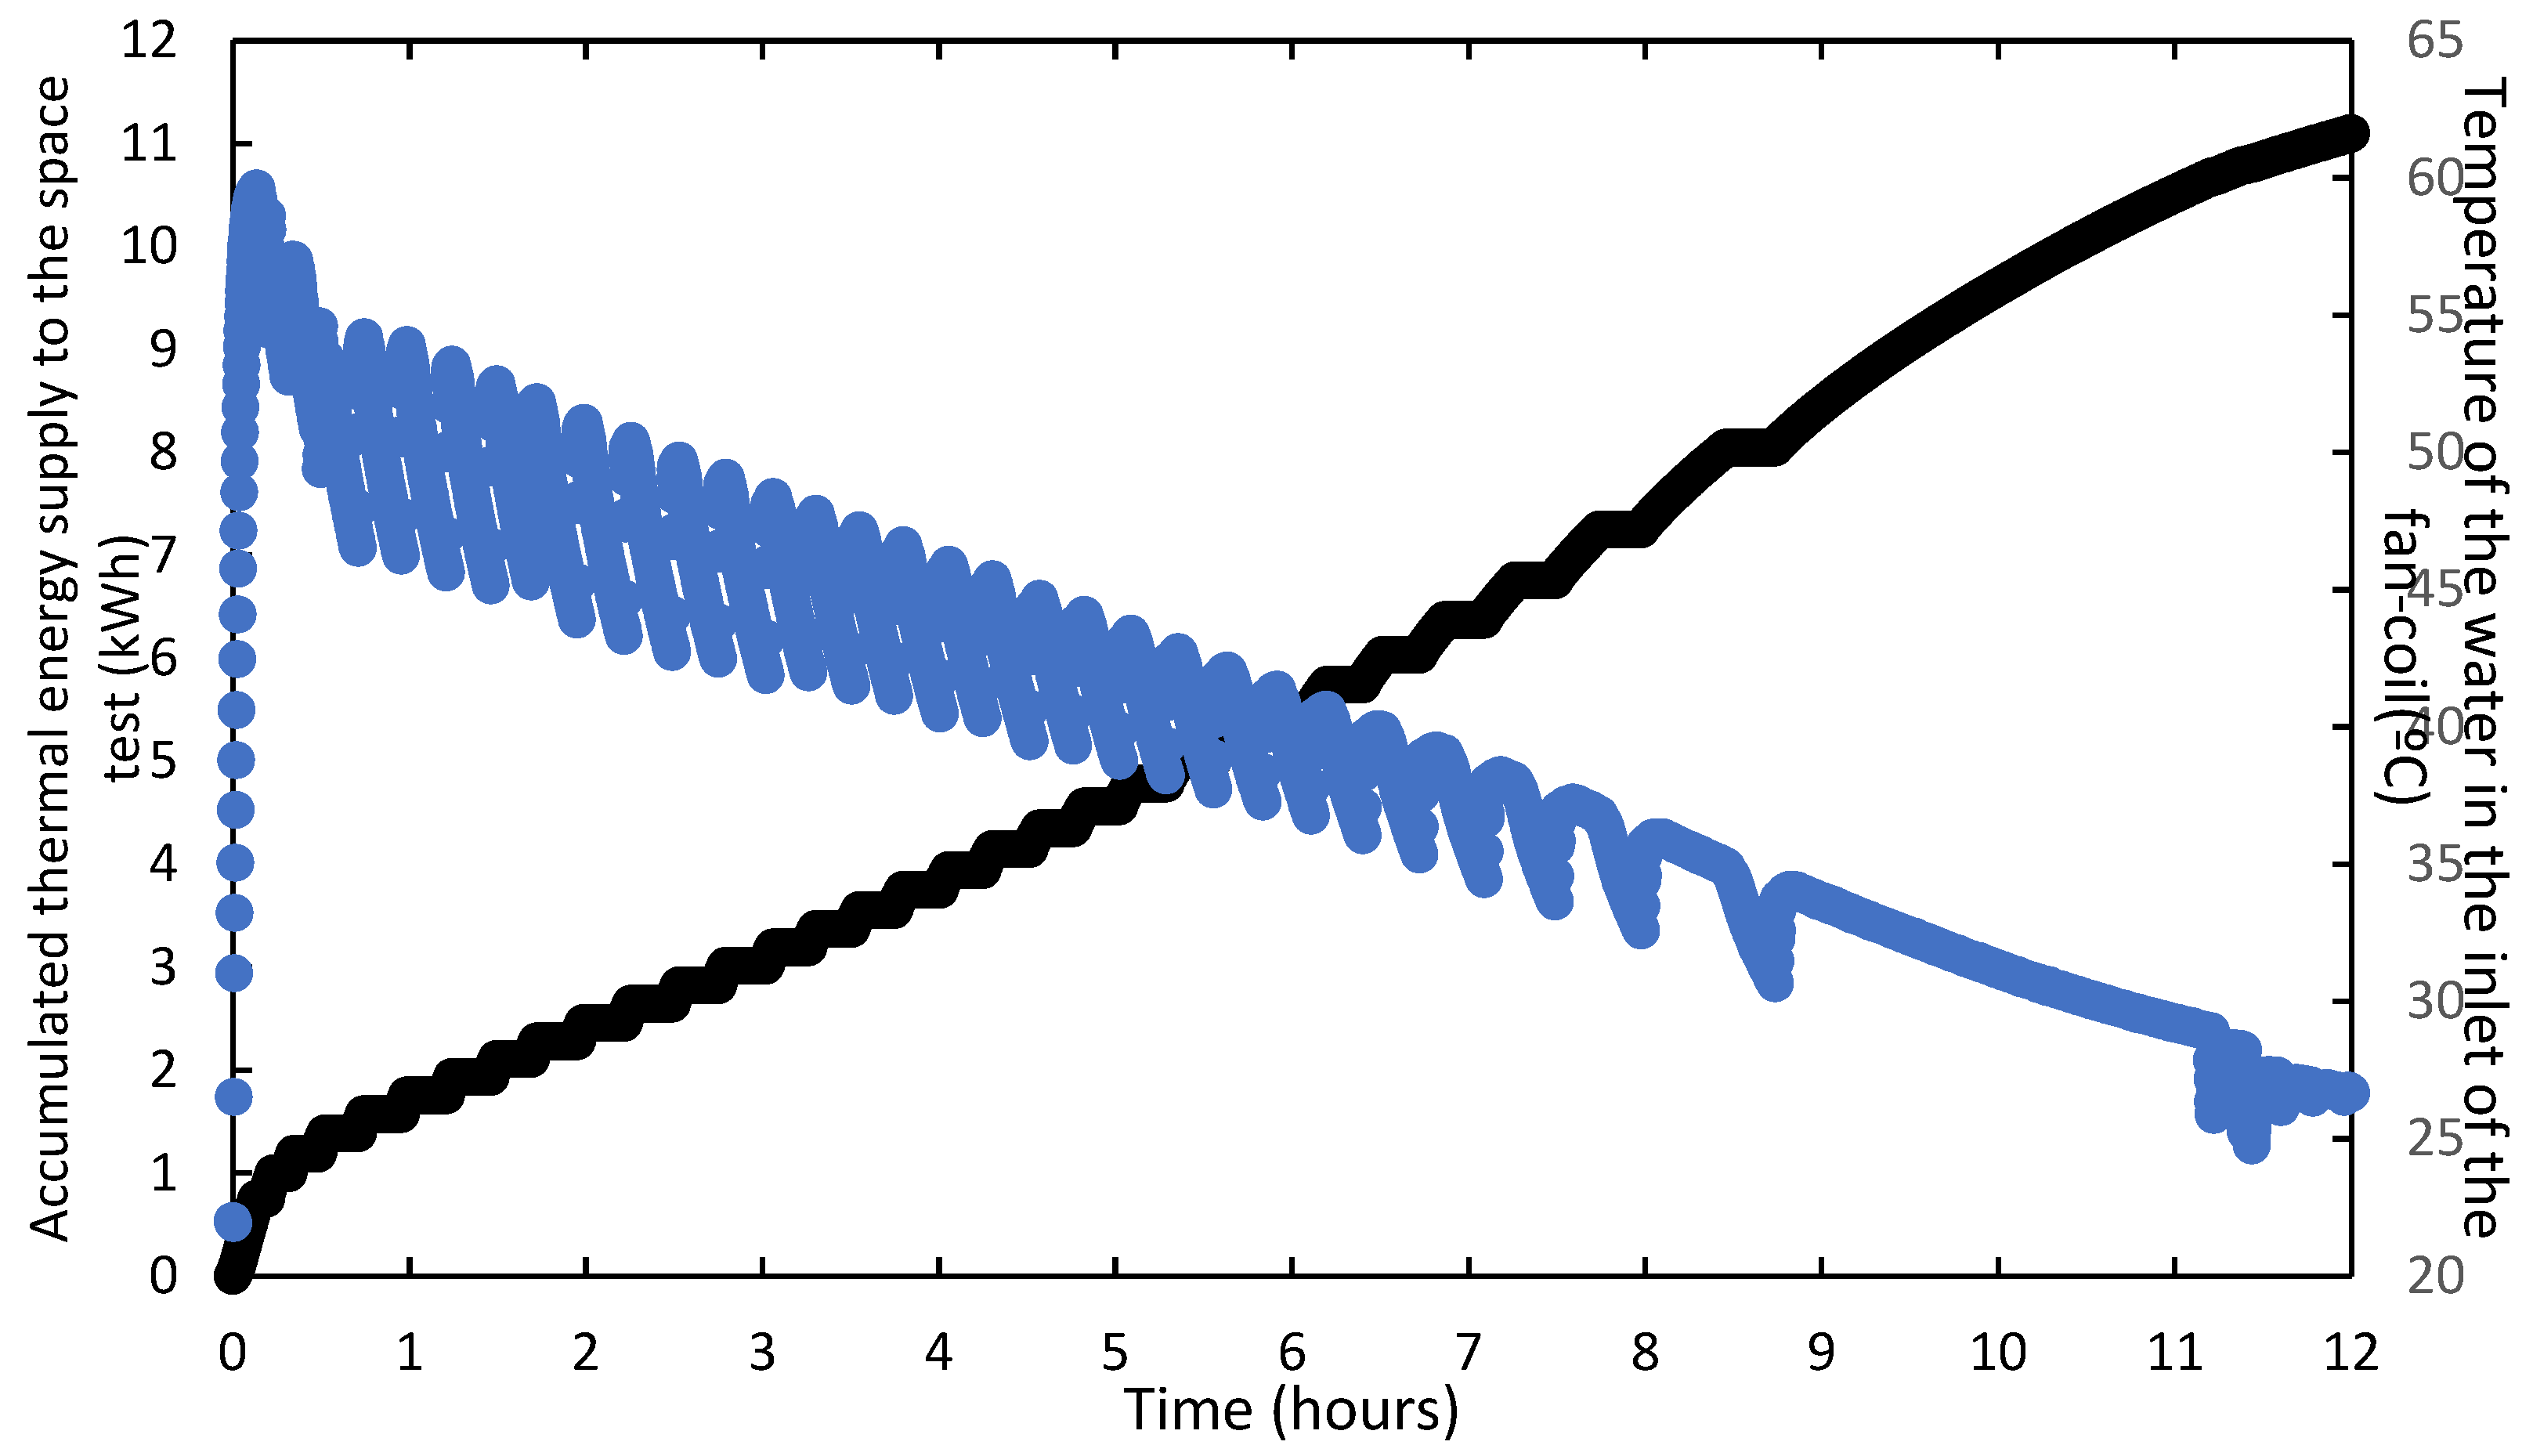
Figure 6.
Evolution of the suction pressure, and respective uncertainty, as a function of the backpressure, for a spindle position of 6 mm for the three tests and different primary pressures: 8 bar (blue); 9 bar (red); 10 bar (black); 11 bar (green).
Figure 6.
Evolution of the suction pressure, and respective uncertainty, as a function of the backpressure, for a spindle position of 6 mm for the three tests and different primary pressures: 8 bar (blue); 9 bar (red); 10 bar (black); 11 bar (green).
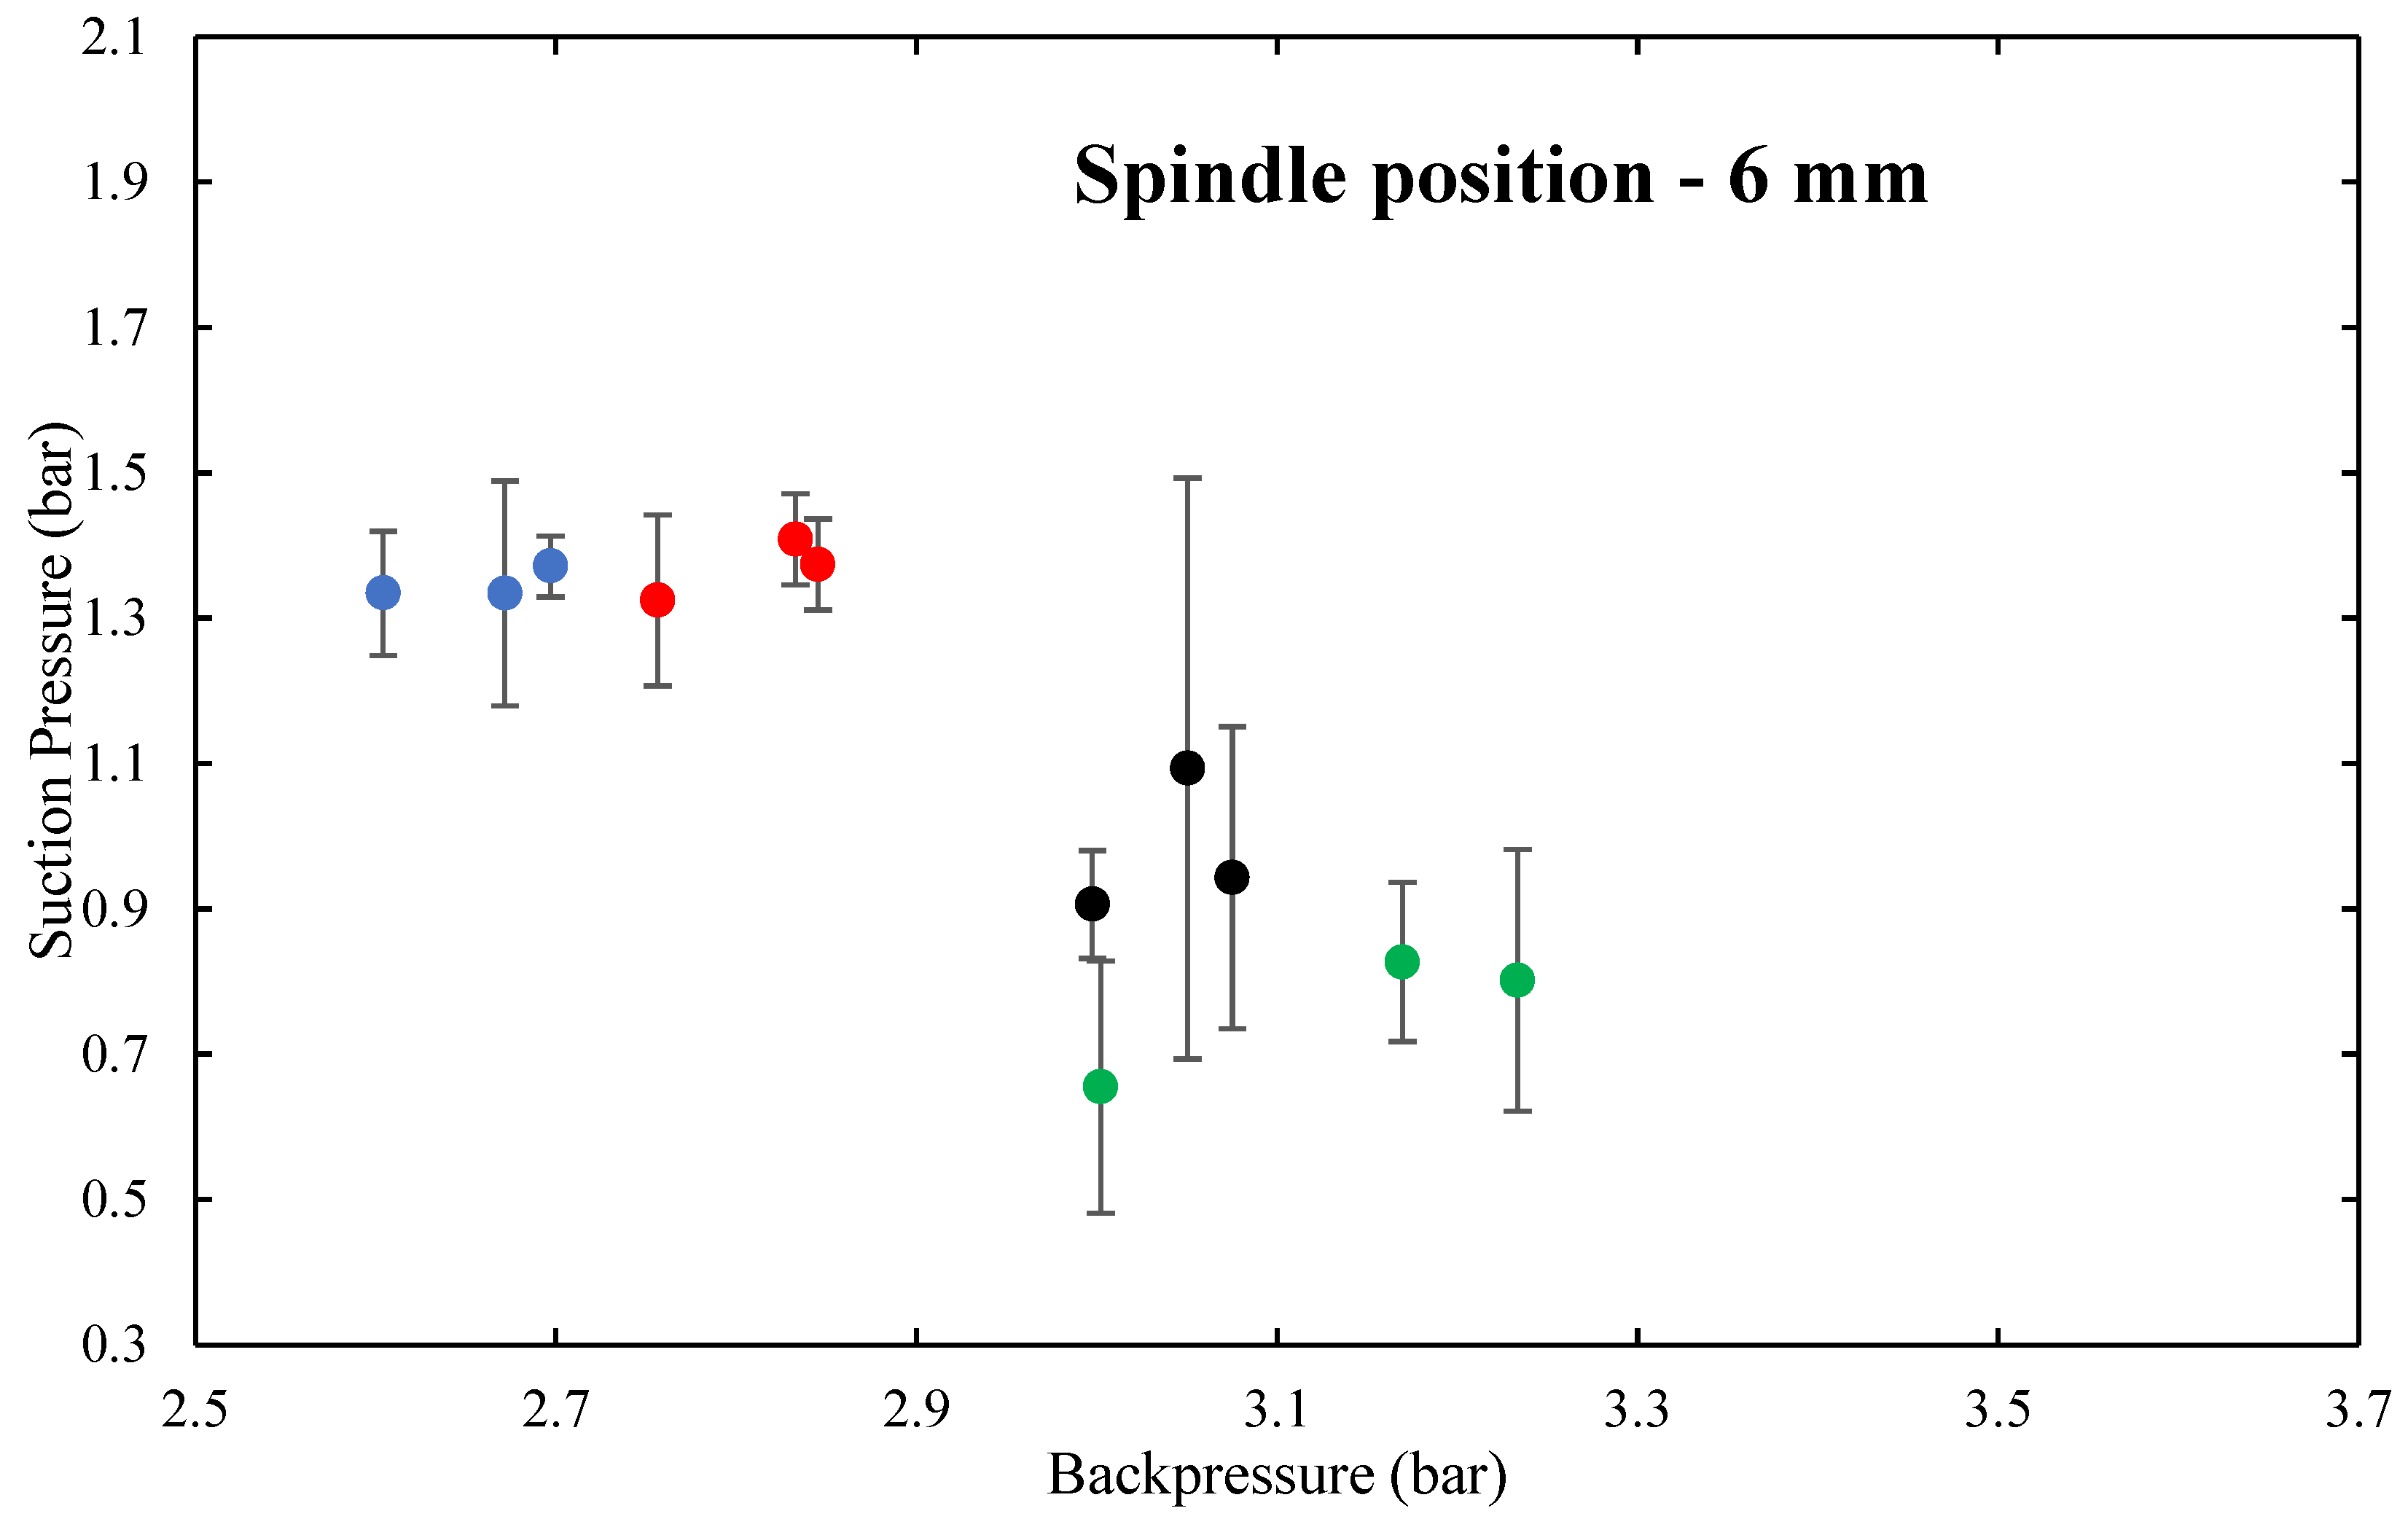
Figure 7.
Evolution of the suction pressure, and respective uncertainty, as a function of the backpressure, for a spindle position of 7 mm for the three tests and different primary pressures: 8 bar (blue); 9 bar (red); 10 bar (black); 11 bar (green).
Figure 7.
Evolution of the suction pressure, and respective uncertainty, as a function of the backpressure, for a spindle position of 7 mm for the three tests and different primary pressures: 8 bar (blue); 9 bar (red); 10 bar (black); 11 bar (green).
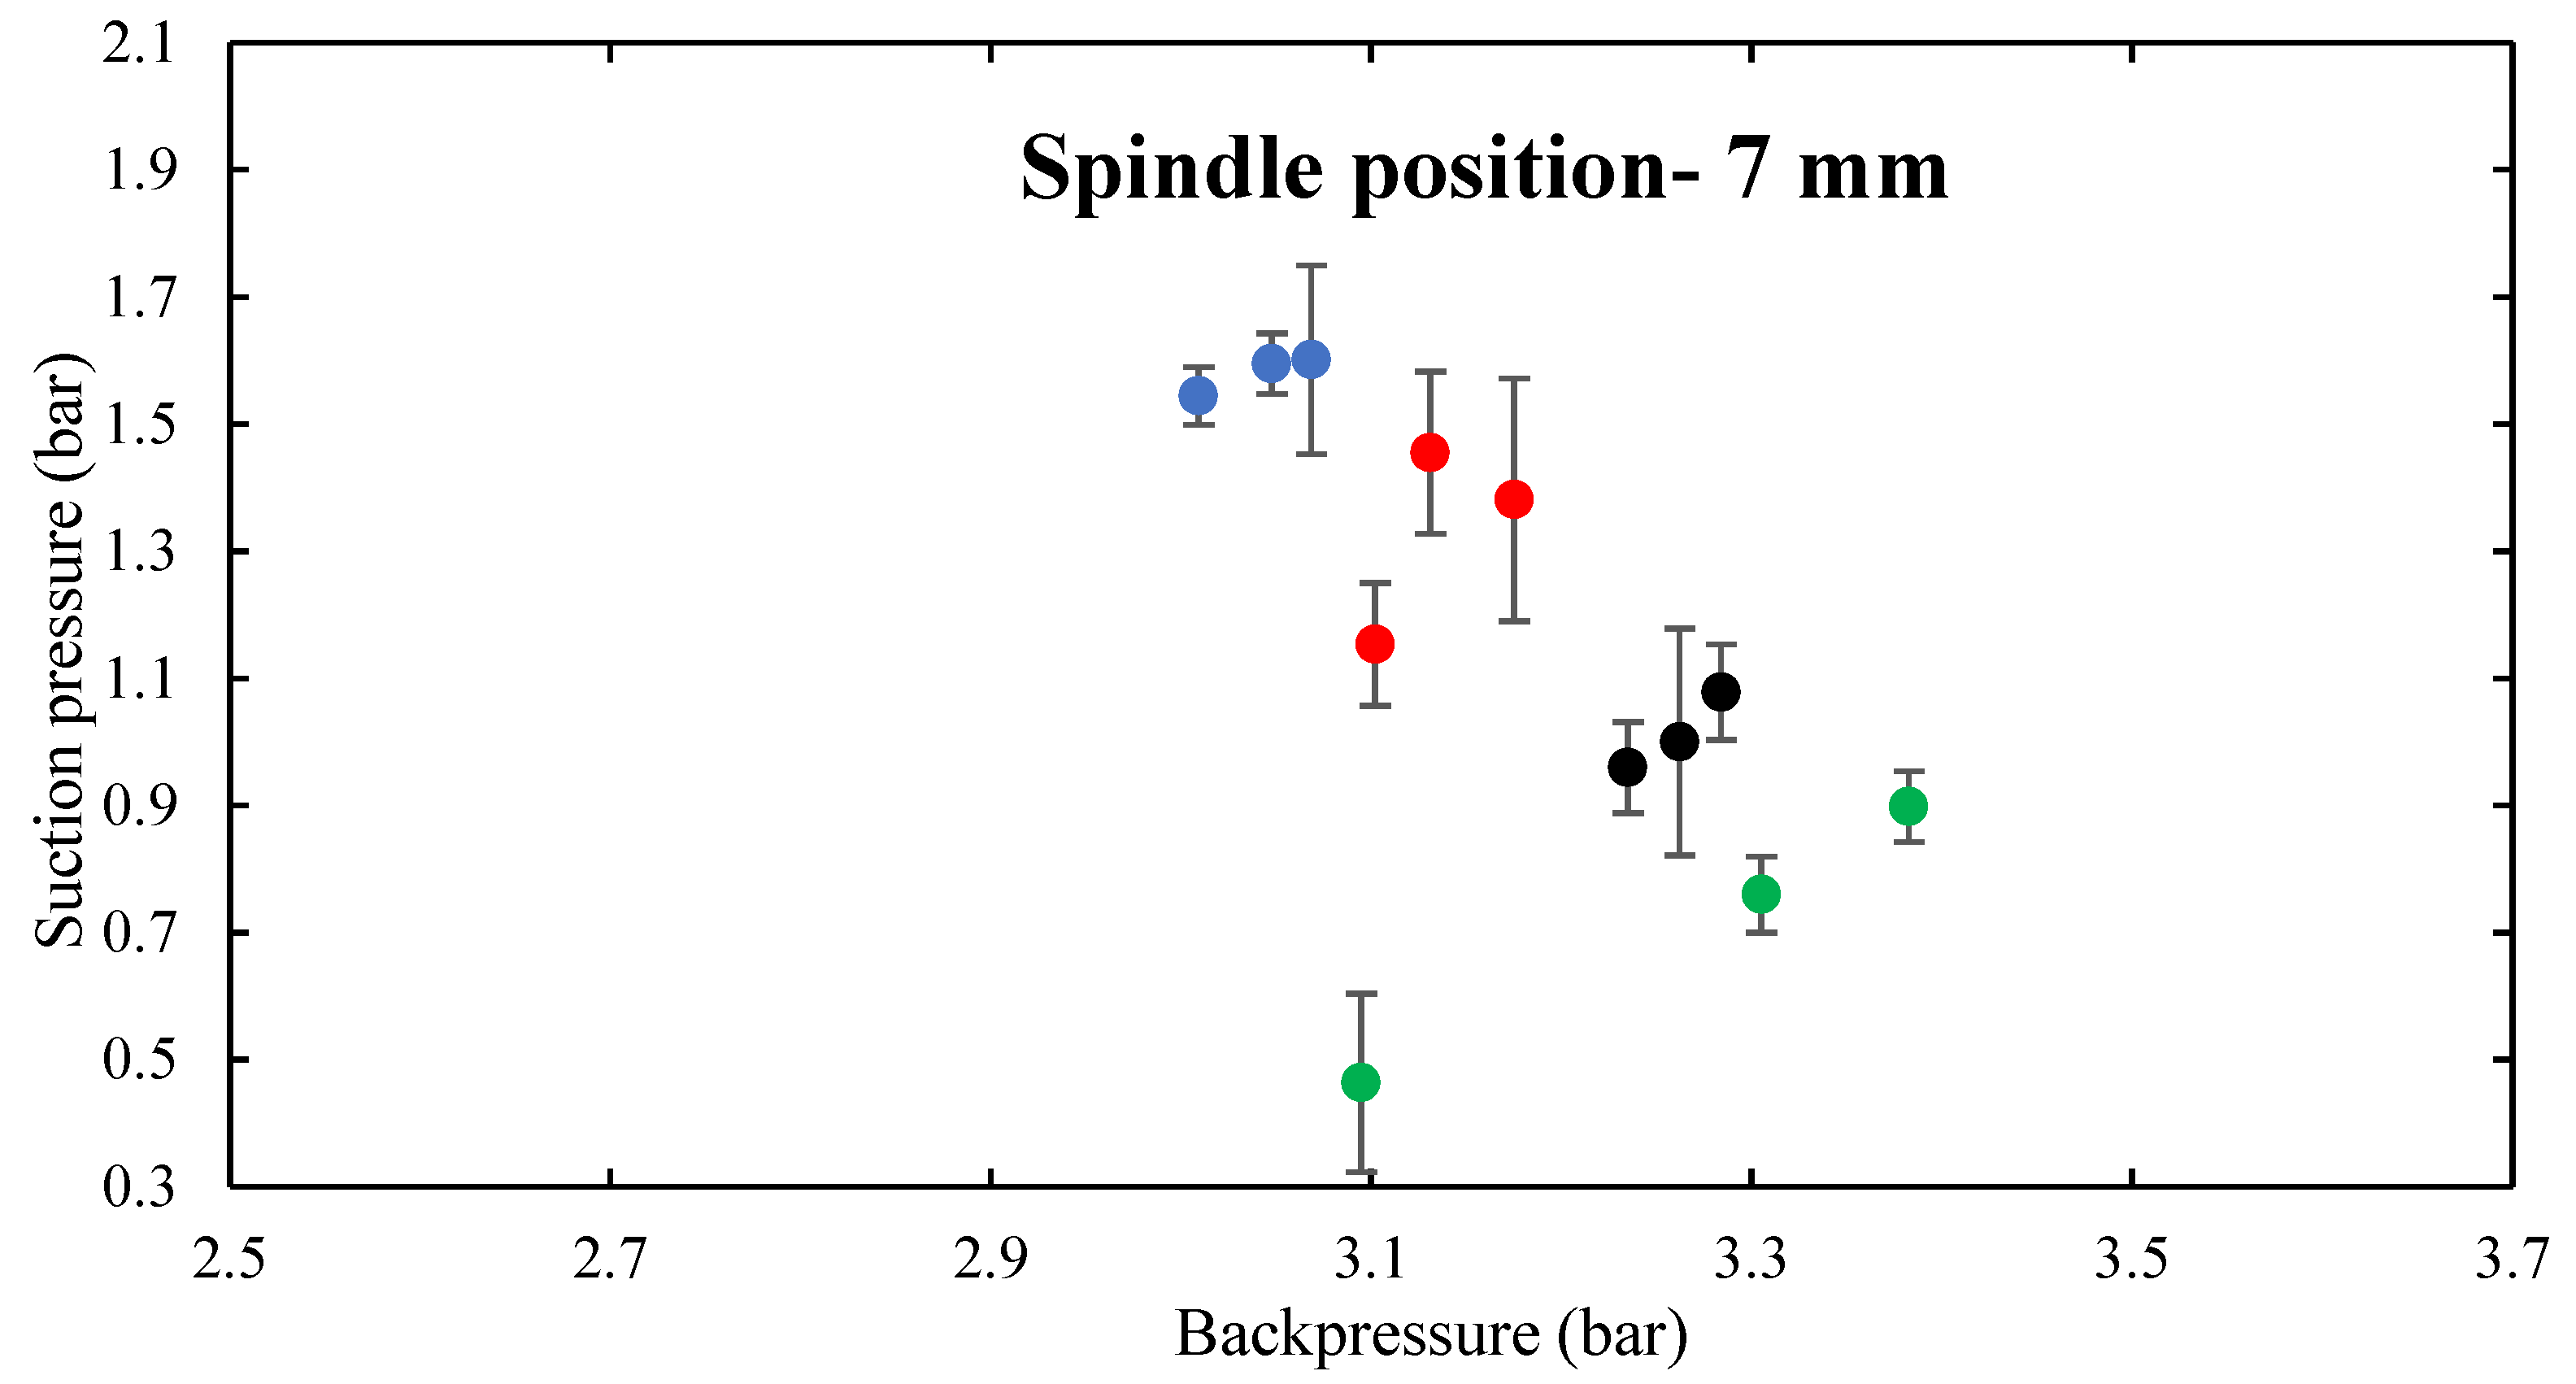
Figure 8.
Evolution of the suction pressure, and respective uncertainty, as a function of the backpressure, for a spindle position of 8 mm for the three tests and different primary pressures: 8 bar (blue); 9 bar (red); 10 bar (black); 11 bar (green).
Figure 8.
Evolution of the suction pressure, and respective uncertainty, as a function of the backpressure, for a spindle position of 8 mm for the three tests and different primary pressures: 8 bar (blue); 9 bar (red); 10 bar (black); 11 bar (green).
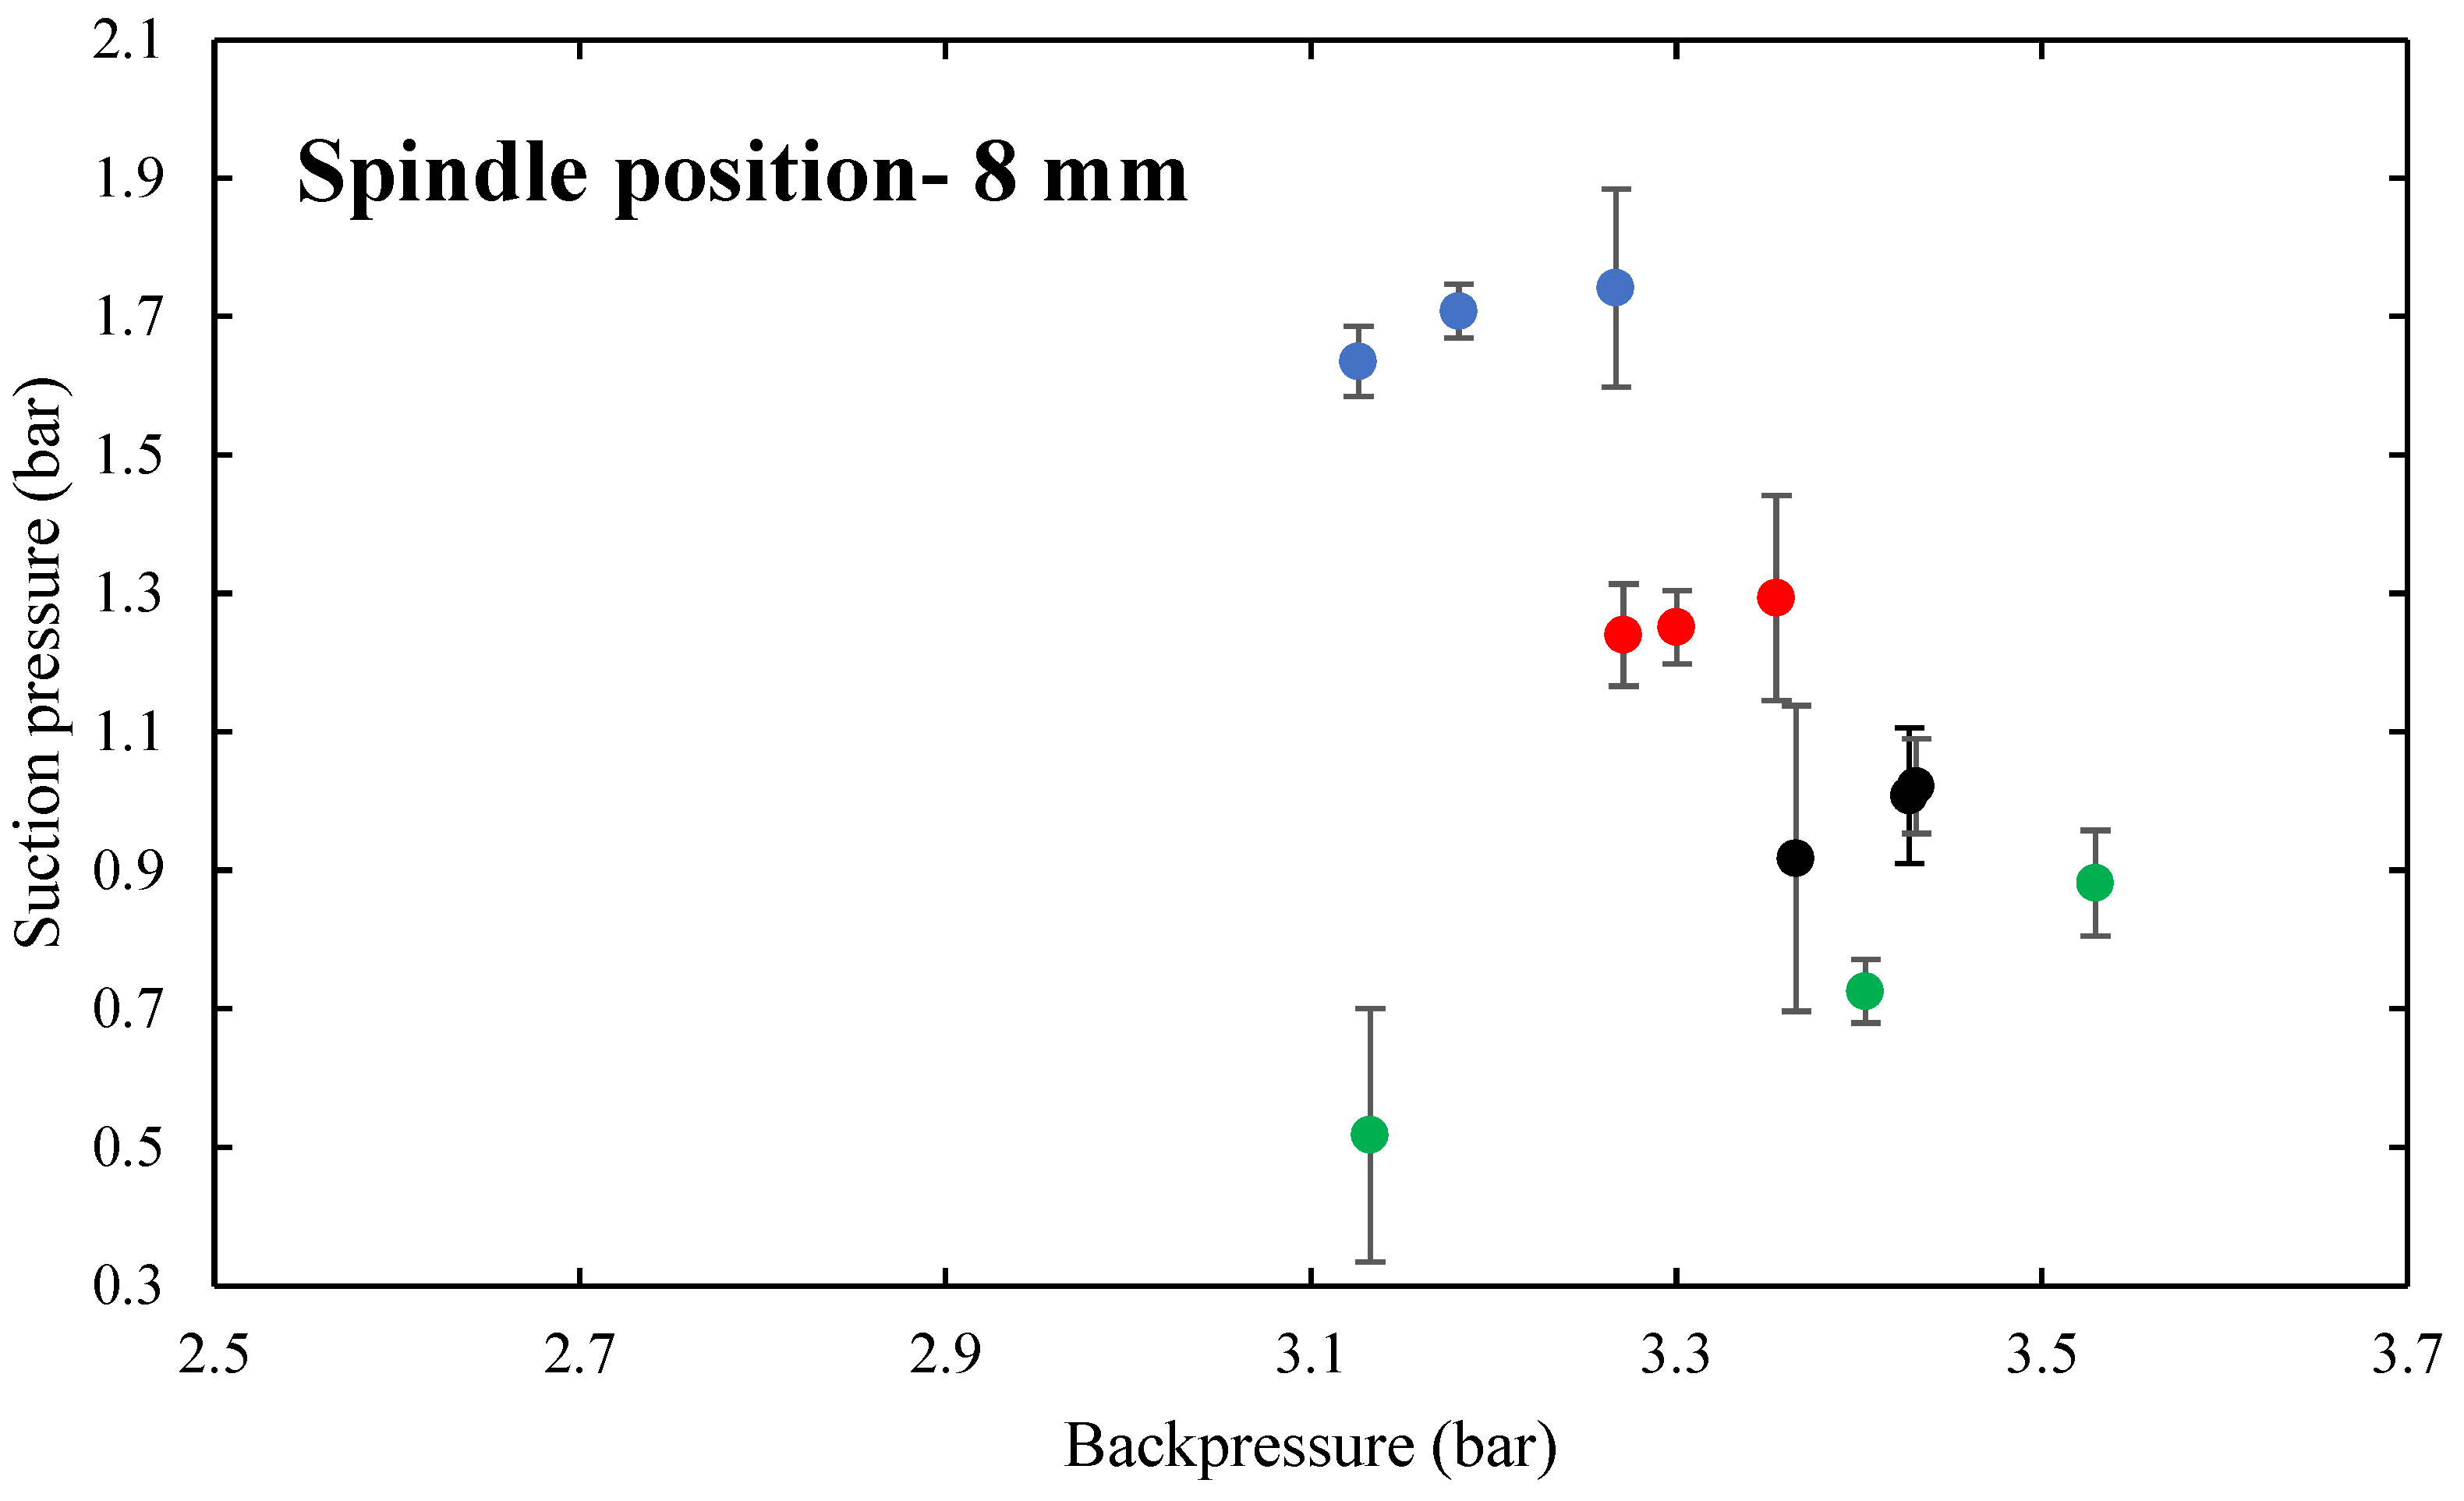
Figure 9.
Evolution of the COP, and respective uncertainty, as a function of the primary pressure, in each test with different gas flowrates, from the highest to the lowest: 1st test (blue dots); 2nd test (yellow dots); 3rd test (green dots); 4th tests (black dots).
Figure 9.
Evolution of the COP, and respective uncertainty, as a function of the primary pressure, in each test with different gas flowrates, from the highest to the lowest: 1st test (blue dots); 2nd test (yellow dots); 3rd test (green dots); 4th tests (black dots).
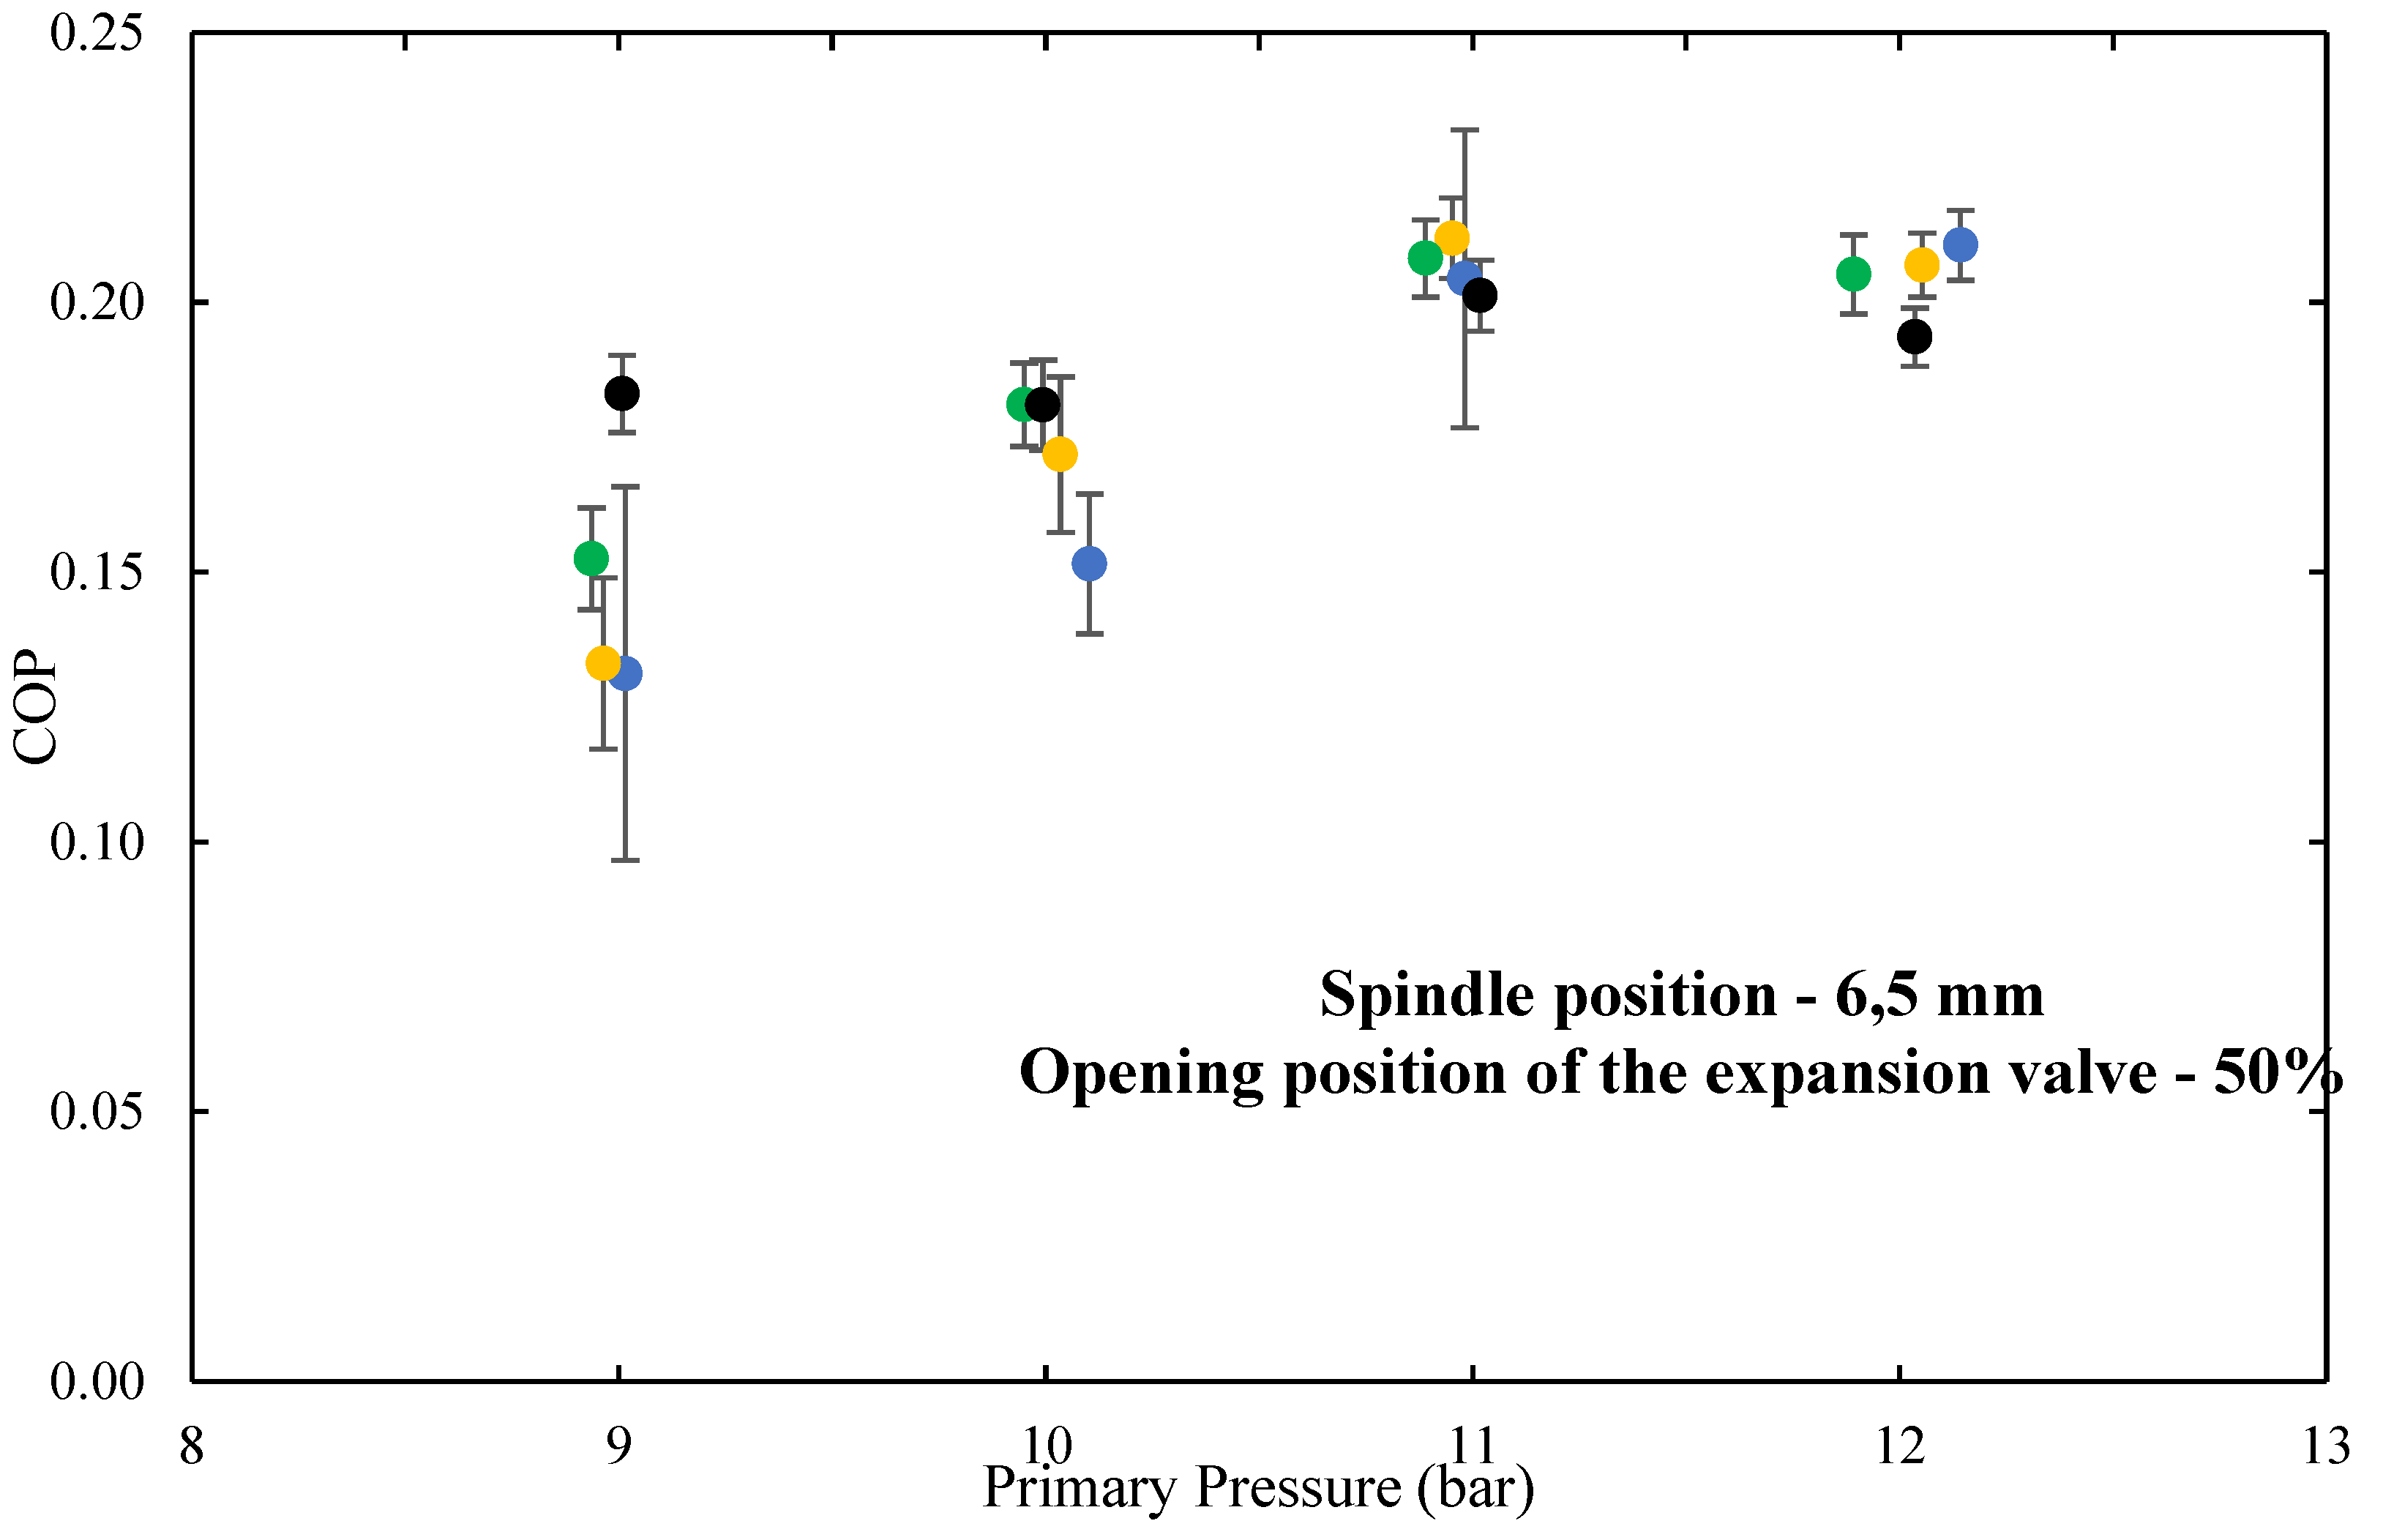

Table 1.
Accumulated thermal energy supplied to the test space since the beginning of the test, in 29th April 2021 at 09:00 a.m., until the end of the different hours.
Table 1.
Accumulated thermal energy supplied to the test space since the beginning of the test, in 29th April 2021 at 09:00 a.m., until the end of the different hours.
| Hour of the test (h:min) | Time after the beginning of the test (hours) | Accumulated thermal energy supplied (kWh) |
|---|---|---|
| 21:00 | 0 | 0.00 |
| 22:00 | 1 | 2.99 |
| 23:00 | 2 | 4.19 |
| 00:00 | 3 | 5.13 |
| 01:00 | 4 | 6.38 |
| 02:00 | 5 | 7.75 |
| 03:00 | 6 | 9.32 |
| 04:00 | 7 | 10.79 |
| 05:00 | 8 | 12.34 |
| 06:00 | 9 | 14.26 |
| 07:00 | 10 | 16.18 |
| 08:00 | 11 | 17.68 |
| 09:00 | 12 | 18.67 |
Disclaimer/Publisher’s Note: The statements, opinions and data contained in all publications are solely those of the individual author(s) and contributor(s) and not of MDPI and/or the editor(s). MDPI and/or the editor(s) disclaim responsibility for any injury to people or property resulting from any ideas, methods, instructions or products referred to in the content. |
© 2024 by the authors. Licensee MDPI, Basel, Switzerland. This article is an open access article distributed under the terms and conditions of the Creative Commons Attribution (CC BY) license (http://creativecommons.org/licenses/by/4.0/).
Copyright: This open access article is published under a Creative Commons CC BY 4.0 license, which permit the free download, distribution, and reuse, provided that the author and preprint are cited in any reuse.


