
Submitted:
05 February 2024
Posted:
08 February 2024
You are already at the latest version
Abstract
In horses, quantitative assessment of gait parameters, as the use of inertial measurement
units system (IMUs), might help in the decision-making process. However, it requires financial investment, is time-consuming, and lacks accuracy if displaced. An innovative Artificial Intelligence marker-less Motion Tracking System (AI-MTS) may overcome these limitations in the field. Our aim was to compare the level of agreement and accuracy between both systems and visual clinical assessment. Twenty horses underwent locomotion analysis by visual assessment, IMUs and AI- MTS systems, in the following conditions: straight hard (SH), straight soft (SS), left and right circle hard (LCH, RCH) and soft (LCS, RCS). A greater number of horses were considered sound by clinical examination, compared to those identified as symmetric by the two gait analysis systems. More limbs were considered asymmetric by the AI-MTS compared to IMUs, suggesting its greater sensitivity. The greatest agreement between the two systems was found for the difference between two minima in vertical head position in SH, while the lowest for the difference between two minima in vertical pelvis position in SS, reflecting the difficulties in assessing asymmetry of hindlimbs. Some degree of asymmetry may be clinically relevant, suggesting its regular use in training horses.
Keywords:
Artificial Intelligence
; Gait Analysis
; Horse
; Inertial Measurement Units System
; Locomotion.
; Lameness
1. Introduction
Lameness is a major cause of poor performance, with serious consequences for horses, owners, and veterinarians in terms of the welfare of the equine athlete, the expectations of the trainer/rider, and the loss of economic income associated with competition. In a clinical setting, the assessment of lameness involves the observation of various characteristics of the horse’s movement at different gaits, particularly, but not exclusively, at trot. Various subjective numerical scales have been developed to standardize the severity of lameness for communication among clinicians and for inclusion in clinical records for future consultation. The American Association of Equine Practitioners (AAEP) grading scale is one of the most widely used for quantifying lameness severity [1,2]. This scale ranges from 0, indicating soundness, to 5, representing maximum lameness with minimal weight bearing.
Several studies have documented that the agreement in clinical subjective assessment using standardized scoring between experienced clinicians is low for lameness of mild to moderate intensity (1-2/5 on the AAEP scale) [3], with higher agreement in the detection of the lame limb, but not for the degree of the lameness. Inter and intra-clinician agreement is acceptable to poor, being poorer for hindlimb lameness compared to forelimbs [4,5]. Perception, expectation bias, and the limited resolution of the human eye are the main causes of moderate to low levels of inter-observer agreement, as well as poor intra-observer reliability of visual lameness examination [6,7,8,9].
To overcome these problems, several inertial measurement unit systems (IMUs) have been developed in recent years to aid in the decision- making process, particularly in cases of mild lameness, referred lameness, evaluation of improvements after a treatment or recovery period, or when conducting clinical research studies [10,11].
Most of these IMUs are based on the assessment of gait symmetry during trot. They provide quantitative data on vertical movement symmetry and vertical displacement over multiple trot strides. The IMUs are attached to primary axial body segments; the head for forelimb lameness, the pelvis for hindlimb lameness, and sometimes the withers for compensatory lameness [12,13,14]. The vertical displacement of these body segments is represented by a sinusoidal double wave curve of each stride. The highest position of the two peaks and the lowest position or valleys of this signal are analyzed, to indicate the level of asymmetric loading of the right versus left limb during the midstance and push-off phases of the trotting stride [15]. Several publications have reported that IMUs are reliable tools for correctly identifying and localizing the limb with pain or dysfunction [16,17,18,19]. These sensors are considered accurate and precise because they provide measurement parameters that are consistent with subjective visual assessment of lameness and data collected from force plate analysis, and proved to be sensitive to small changes in movement symmetry, as observed in horses with experimentally induced lameness [20,21,22,23,24,25].
However, the use of IMUs requires a substantial financial investment, and mounting the sensors on the horse’s body is time consuming and may lack accuracy if the sensors are displaced, which limits their use in a field setting. Recently, an artificial intelligence (AI) marker-less motion tracking system (AI-MTS) has been developed (Sleip AI, Uppsala, Sweden). It is based on deep neural networks that process large amounts of data from computer algorithms previously trained by deep learning on the horse’s body for objective motion analysis. In particular, it tracks the movement of the head, pelvis, and hooves of trotting horses, both towards and away from the camera, to obtain measurement images [26,27,28,29]. This system allows its use with minimal technical training and no expensive equipment, allowing assessment from a smartphone camera video, which is easier and more practical in a clinical setting [30].
The current study was conducted with the aim of comparing IMUs with AI-MTS, analyzing the level of agreement and accuracy of both systems, and in different conditions (straight line and circles) and over two different types of surfaces (soft and hard), in horses considered sound or mildly lame at clinical examination.
2. Materials and Methods
2.1. Horse Population
A convenience sample of twenty horses of different age, sex, breed, and use, referred to the Equine Sports Medicine Center (CEMEDE) of the University of Cordoba (Spain) for performance assessment, were enrolled on a voluntary basis during a 2-week data collection period. Depending on the owners’ preference, the procedures were performed either at the riding stables where the horses were normally kept, or at the facilities of the Equine Sports Medicine Center. Requirements for the stables were the presence of a hard flat surface, and a sand riding arena, where horses could be trotted in hand in a straight line and lunged in circles of 10-meter diameter.
Enrolled horses first underwent a clinical lameness assessment while trotting in hand on a straight line and in circles, on a hard and soft surface. Trots were recorded with a smartphone for later analysis. Two experienced blinded operators (N.C-G.) and (C.M.L.F.), assigned a score of 0-5 based on the AAEP lameness grading system and recorded the lame limb(s). Only horses with clinical lameness ≤ 2/5 were included in the study.
A signed written informed consent for the inclusion of horses in the present study and the use of data for research purposes was obtained from all owners. The followed procedures and the results derived were explained to the owners. All procedures were performed in accordance with the Code of Good Veterinary Practice. No specific ethical approval was required for the present study, as all horses were presented for veterinary examination and the cases were considered as professional activities.
2.2. Locomotor Assessment
The horses underwent gait analysis using two different validated gait analysis technologies simultaneously: an inertial sensor-based gait analysis system IMUs (Equigait Ltd., Chestnut, Herts, UK) and a smartphone application based on a computer vision system AI-MTS (Sleip AI, Uppsala, Sweden).To allow comparison of data collected by the two systems and to maximize synchronization between them, the recordings were manually started and stopped at the same time by two different operators. To reduce variability between trials, the same operators (C.M.L.F. and N.C-G.) were responsible for recording and collecting data from all the horses.
The locomotion analysis of the included horses was performed in the following assessment conditions: 1) Straight hard (SH): trot in hand on a straight line on a hard surface; 2) Straight soft (SS): trot in hand on a straight line on a soft surface; 3) Left and right circle hard (LCH and RCH): trot in circle on the left and right hand on a hard surface; 4) Left and right circle soft (LCS and RCS): trot in circle on the left and right hand on a soft surface.
During the straight line data collection, horses were trotted by a handler at least two times back and forth on a 30-meter long straight line. Handlers trotted the horses at their preferred speed and were asked not to interfere with the horses’ head movements. After, the horses were lunged on the left hand for at least 45 seconds, stopped, and then lunged on the right hand for at least 45 seconds in a circle of 10-meter diameter.
2.2.1. Locomotor Assessment with an Inertial Measurement Units System
Horses were equipped with five inertial sensors (MTw2, Xsens, Enschede, The Netherlands) attached to the poll (at the center of the highest part of the head, between the ears), the withers (at the most prominent part, over the spinous process of T6), the tuber sacrale, and the right and left tuber coxae. All the sensors were wirelessly synchronized with a station (Awinda, Xsens) that received the data and transmitted them simultaneously at a sampling rate of 100 Hz per channel to a dedicated laptop with a pre- installed analysis software (Equigait, Ltd., Chestnut, Herts, UK). Data recording was manually initiated and stopped by the same operator (N.C-G.) for all horses. For each assessment condition, the following data provided by the software were considered in the present study:
- –
- HDmin: difference between the vertical minima reached by the head during left and right forelimbs stance, expressed in millimeters;
- –
- HDmax: difference between the vertical maxima reached by the head following left and right forelimb stance, expressed in millimeters;
- –
- H-ROM: range of motion of the head, difference between minimum and maximum values reached by the head throughout the stride cycle, expressed in millimeters;
- –
- PDmin: difference between the vertical minima reached by the pelvis during left and right hindlimbs stance, expressed in millimeters;
- –
- PDmax: difference between the vertical maxima reached by the pelvis following left and right hindlimb stance, expressed in millimeters;
- –
- P-ROM: range of motion of the pelvis, difference between minimum and maximum values reached by the pelvis throughout the stride cycle, expressed in millimeters;
- –
- Number of recorded strides;
- –
- Laterality of the asymmetry (towards the left or the right side).
Furthermore, to allow a direct comparison between horses of different sizes and with different ranges of movement, as well as with the results of the AI-MTS, the values of HDmin, HDmax, PDmin, and PDmax were normalized to H-ROM and P-ROM. For this purpose, HDmin and HDmax were divided by the H-ROM and then multiplied by 0.4; PDmin and PDmax were divided by the P-ROM and then multiplied by 0.25 [26,27]. The values obtained were defined respectively as: MinDiffhead, MaxDiffhead, MinDiffpelvis, and MaxDiffpelvis.
Finally, the HDmin and PDmin data recorded during the SH assessment were additionally analyzed by applying published thresholds to discriminate between symmetric and asymmetric horses. Specifically, kinematic thresholds of 12 mm for HDmin and 6 mm for PDmin were used, as suggested by previous studies [31,32]. After applying these thresholds, horses were classified as “symmetric” or “asymmetric,” and the asymmetric limb(s) were recorded.
2.2.2. Locomotor Assessment with an AI Markerless Motion Tracking System
Simultaneously with the IMUs recordings, gait analysis was performed using a computer vision-based smartphone application (Sleip AI, Uppsala, Sweden), downloaded onto an iPhone 11 Pro. For this purpose, the smartphone was placed on a tripod at a height of 160 cm in landscape mode and the trots were recorded in all the assessment conditions described above. The video streams were first saved locally and later uploaded to the software for data processing.
Data recording was manually started and stopped for all horses by the same operator (C.M.L.F.) for all horses. For each assessment condition, the following data provided by the software were considered in the present study:
- –
- MinDiffhead: difference between two minima in vertical position of the head, during the right and left forelimbs halves of a stride, normalized to the head range of motion;
- –
- MaxDiffhead: difference between two maxima in vertical position of the head, during the right and left forelimbs halves of a stride, normalized to the head range of motion;
- –
- MinDiffpelvis: difference between two minima in vertical position of the pelvis, during the right and left hindlimbs halves of a stride, normalized to the pelvis range of motion;
- –
- MaxDiffpelvis: difference between two maxima in vertical position of the pelvis, during the right and left hindlimbs halves of a stride, normalized to the pelvis range of motion;
- –
- Number of recorded forelimb and hindlimb strides (as the pelvis was visible only when the horse was trotting away from the camera, the number of hindlimb strides was lower than the forelimb strides);
- –
- Laterality of the asymmetry and the presumed affected limb(s).
For both IMUs and AI-MTS, the values of MinDiffhead, MaxDiffhead, MinDiffpelvis, and MaxDiffpelvis were multiplied by -1 if the presumed affected limb was on the left side, while positive values indicated that the presumed affected limb was on the right side [26,27]. Moreover, the severity of any asymmetry was defined as follows: 0.3-0.5 (very mild asymmetry), 0.6-0.9 (mild asymmetry), 1-1.4 (moderate asymmetry). No horses in the study population had severe asymmetry, as horses with clinical lameness grade ≥ 3/5 were excluded. Thresholds for asymmetry severity were chosen based on the results provided by the AI-MTS application to allow diagnostic comparison between systems [26,27].
2.3. Statistical Analysis
Data were collected in an electronic spreadsheet (Microsoft Excel, Redmond, WA, USA), and analyzed using a commercial statistical software package (GraphPad Prism 9.5.1 for MacOS; GraphPad Software, San Diego, CA, USA). All data were tested for normality using the Shapiro-Wilk test, and descriptive statistics were performed according to the data distribution. Data are presented as mean ± standard deviation if normally distributed, or as median and interquartile range (IQR) if not normally distributed. Statistical significance was set at p < 0.05.
The agreement between the locomotor parameters evaluating the impact or push-off phases of the stride detected by the two technologies used (IMUs and AI-MTS) was evaluated by the K Cohen coefficient, in each assessment condition. K Cohen coefficient values of 0 indicated no agreement, 0 - 0.2 slight agreement, 0.21 - 0.4 fair agreement, 0.41 - 0.6 moderate agreement, 0.61 - 0.8 substantial agreement, and 0.81 - 1 almost perfect agreement. Bland-Altman analysis was used to evaluate the statistical agreement between the gait analysis systems for each locomotor parameter in each of the assessment conditions.
In addition, the locomotion parameters were assessed by comparing the absolute values (without arithmetic signs) of each locomotion parameter in each assessment condition measured by the two technologies, using the paired t test (for normally distributed data) or the Wilcoxon test (for non-normally distributed data). The number of strides recorded by the two systems in each assessment condition was compared using a paired t-test. To evaluate the effect of different surfaces and trot direction on the locomotor parameters, the data were compared using one-way ANOVA and Tukey’s multiple comparison test (for normally distributed data) or the Friedman test and Dunn’s multiple comparison test (for non-normally distributed data). In these tests, the absolute values were used for comparison since the goal was to compare asymmetry regardless of laterality.
3. Results
3.1. Horse Population
The study population consisted of 20 horses aged between 4 and 24 years (median 9, IQR 8 - 15 years), including 15 geldings, 4 mares, and 1 stallion. The horses belonged to different breeds, including 9 mixed breeds, 5 Spanish Purebred horses, 3 Arabians, 1 pony, 1 Quarter Horse and 1 KWPN. Regarding horses’ use, 10 were recreational horses, 5 were used for Spanish cowboy dressage competitions, 3 for endurance, and 2 for dressage. The results of the clinical examination and the symmetry data provided by the two locomotor analysis systems are shown in Table 1.
The number of animals considered sound/symmetrical by clinical examination was 9; by IMUs, when using the the HDmin and PDmin cut-off values, 6 while, when using the severity cut-off values, 0; and by AI-MTS, 1. Complete agreement between the three scoring systems (i.e., clinical examination, IMUs and AI-MTS) regarding the affected limb(s) occurred in only 4 horses. In all the horses that were considered lame on clinical examination, on the straight and on hard surface, IMUs and IA-MTS agreed on at least one of the affected limb(s) detected by clinical examination. However, both locomotor assessment systems detected more asymmetric limbs than those detected by clinical examination.
3.2. Agreement between Inertial Measurement Units System and AI Marker-Less Motion Tracking System
The Cohen´s Coefficients of agreement between the two gait analysis systems (IMUs and AI-MTS) in the different assessment conditions (SH, SS, RCH, RCS, LCH and LCS) are shown in Table 2 for the four locomotor parameters considered, (MinDiffhead; MaxDiffhead; MinDiffpelvis; MaxDiffpelvis). In none of the assessment conditions, the coefficient of Cohen was greater than 0.80, which was indicative of almost perfect agreement. Substantial agreement between IMUs and AI-MTS was found for: MinDiffhead in SH, SS, and RCH; MaxDiffhead in RCH and RCS; and MaxDiffpelvis in LCS, RCH and RCS. The lowest agreement coefficients were found for MinDiffpelvis in all the assessment conditions (Table 2).
3.3. Significant Differences in the Locomotor Parameters between Inertial Measurement Units System and AI Marker-Less Motion Tracking System
The significant differences for the four locomotor parameters using IMUs and AI-MTS are presented in Figure 7, Figure 8 and Figure 9 (only significant differences are shown). The following significant differences in locomotor parameters were found when comparing the two technologies. MinDiffhead values were significantly greater with IMUs compared to AI- MTS in SH and SS. Likewise, MinDiffpelvis values were greater with IMUs in SH and LCS. On the contrary, higher MaxDiffhead values were found for AI-MTS in LCS (Figure 7, Figure 8 and Figure 9). 392
The mean number of valid strides recorded by the IMUs and IA-MTS in the different assessment conditions are shown in Table 3. The number of recorded forelimb strides was significantly higher for the AI-MTS compared to the IMUs in SH, LCH, LCS, RCH, and RCS conditions. Conversely, the number of hindlimb strides was higher for the IMUs compared to the AI-MTS in the SS assessment, and lower in LCH and RCH conditions.
3.4. Effect of the Different Assessment Conditions
The comparisons between the ansolute values of the studied locomotion parameters measured under the different assessment conditions are shown in Figure 10 and Figure 11. For IMUs, significantly higher MinDiffpelvis values were found for LCS compared to SH and SS (Figure 10). Regarding AI-MTS, the differences between the various assessment conditions were found in MaxDiffhead. Higher values for MaxDiffhead were found in LCH compared to SH and SS and in LCS compared to SH and SS (Figure 11).
4. Discussion
The present study was performed due to the recent development of an AI marker- less motion tracking system (AI-MTS) for lameness/asymmetry assessment that can be easily used in a clinical setting to aid in the decision-making process [26,27]. In this study, our aim was to compare a commercial IMUs, previously validated and widely used [10,14,15,19] with this new system (AI-MTS) [33], in clinically sound horses and in horses with a mild intensity lameness and under different assessment conditions, i.e., straight line and in right and left circles, on hard and soft surfaces.
The most significant findings were: 1) The number of horses considered sound in the clinical examination was higher compared to the number of asymmetric animals detected by the IMUs and AI-MTS systems. 2) A complete agreement between the clinical examination and the two gait assessment systems regarding the affected limb(s) occurred only in a very reduced number of animals, because IMUs and AI-MTS detected more asymmetrical limbs than clinical examination; 3) The greatest agreement between IMUs and AI-MTS was found for MinDiffhead in SH conditions. MaxDiffhead and MaxDiffpelvis showed substantial agreement in circles, particularly towards the right side and on both types of surface types (hard and soft). The lowest agreements were found for MinDiffpelvis in all conditions; 4) Finally, and considering the absolute values of the evaluated locomotor parameters, the IMUs system presented higher values for MinDiffhead (in SH and SS conditions) and for MinDiffpelvis (for SH and LCS conditions), and lower values for MaxDiffhead (for LCS condition).
The fact that the number of asymmetric horses detected by both gait assessment systems was higher than the number of horses considered lame by clinical examination was an expected finding. Clinical examination, using the human eye and depending on the experience of the examiner, detects more obvious changes in gait as well as other clinical manifestations that are not detected by gait assessment systems, which are based on an asymmetry or gait deviation that is considered ‘normal’ or ‘perfect’. Mild asymmetries may have gone unnoticed during the clinical examination, particularly when more than one limb was affected and/or when compensatory movements affected other limbs. In fact, at a subclinical level, the human ability to detect very mild asymmetries may be limited. This idea was supported by the finding that the limb(s) considered lame during the clinical examination, were also detected as asymmetric by the two gait analysis systems assessed. However, the number of affected limb(s) was greater with AI-MTS first, and then with IMUs compared to the number of limb(s) identified as lame by clinical examination. Moreover, of the horses considered lame on clinical examination (n=11), 7 presented lameness in the forelimbs. The detection of very subtle hindlimb lameness is more complex and may go unnoticed, and this fact may partially justify the detection of a greater number of asymmetrical limbs with the IMUs and AI-MTS systems compared to the clinical examination. This result deserves to be highlighted, since the correct identification of the hindlimb lameness by clinical examination is very challenging, mainly because the vertical movements of the pelvis and the pelvic rotations are highly dependent on other factors different from lameness, such as physical anatomy, conformation [34] as well as the different movement patterns and hip rotation adaptations [34,35,36,37]. Interestingly, we have also noticed that the previously published cut-off values for the distinction between symmetry and asymmetry by the IMUs are less sensitive compared to the ranges adopted in the present study for the classification of asymmetry severity. Indeed, when defining asymmetry in a dichotomous way (present/absence), very mild asymmetries may go under-diagnosed.
There is much debate about the clinical significance of asymmetries detected by gait assessment systems. As mentioned previously, gait asymmetry does not imply lameness, which is a clinical concept with several different implications, such as a reduction in athletic performance or an impact on welfare during exercise and training. In fact, numerous studies [31,38,39], described that 50-72% of the horses considered sound by their owners were quantified outside normal values for gait asymmetry using IMUs. The relevance of these asymmetries to athletic performance is currently unknown. In a population of 33 elite eventing horses in competition [32], authors found that 61% of these animals exhibited locomotor asymmetries. However, the clinical relevance of these asymmetries was not demonstrated, as no differences were found between pre- and post- competition, and the horses were considered ‘fit for competition’ by the veterinary staff. Interesting results were described by Lopes et al. (2018) in endurance horses in competition. Using an IMUs system, 21 of the 22 endurance horses evaluated were considered asymmetric, and there was a significant disagreement between these results and the clinical assessment of the competition veterinarians, although this disagreement disappeared when the sensitivity of the IMUs was reduced. Considering these data together, it seems that the gait analysis systems are too sensitive and perhaps the sensitivity should be reduced so it can be used in a competitive setting, but this hypothesis must be analyzed in further detail.
In our case, all horses assessed performed as expected by their owners. However, it should be considered that none of the horses studied were elite athletes. In the near future, it would be interesting to include these locomotor assessments in performance tests, and to analyze their changes throughout the competitive season for each individual. There are numerous physiological factors that may influence locomotor asymmetry without being associated with lameness. This idea is supported by data provided by Jansson et al. (2021) [40], who described that horses subjected to a high-energy diet, resulted in weight gain, with greater locomotor asymmetry than those animals subjected to a 36-day dietary restriction.
The greatest agreement between IMUs and AI-MTS was found for MinDiffhead in SH conditions. This is possibly due to a greater regularity of the assessment surface, together with easier identification of anatomical landmarks in the case of AI-MTS. Also, horses have highly symmetrical peak vertical forces, stance duration, and limb impulses during the stance phase when trotting in a straight line [41], which explains the higher level of head agreement in this condition. The lower level of agreement between the two systems for MinDiffpelvis can be explained by the fact that the AI-MTS recorded a lower number of hindlimb strides compared to IMUs, since the pelvis was predominantly visible when the horse trotted away from the camera. This can lead to biases, since the resulting asymmetries will be based on the different underlying data in terms of stride selection.
Finally, we observed that the absolute values of MinDiffhead (SH and SS) and MinDiffpelvis (SH and LCS) were higher when measured by IMUs compared to AI-MTS, while those of MaxDiffhead (LCS) were higher when measured by AI-MTS. These results suggest that IMUs may be more sensitive for the detection of impact asymmetries, while AI-MTS for the push-off ones. Since these differences were significant only in some assessment conditions, further studies should be conducted to confirm our hypothesis.
5. Conclusions
In the present study, horses of different breeds were clinically assessed for lameness and locomotor asymmetry was analyzed by using two different methods: IMUs and AI-MTS. The number of horses considered sound by clinical examination was greater than the number of asymmetrical animals according to the two different gait analysis systems (IMUs and AI-MTS).
However, the limb(s) identified as lame by clinical examination were also identified as asymmetrical by both IMUs and AI-MTS. A greater number of limbs considered asymmetric were detected by AI-MTS and IMUs, suggesting a greater sensitivity of these technologies for asymmetry detection compared to visual assessment, particularly in the hindlimbs. However, differences in sensitivity may occur depending on the different thresholds established for asymmetry. The agreement between both IMUs and AI-MTS was greater in straight line and hard surface, particularly for MinDiffhead. The lowest agreement in MinDiffpelvis probably reflects the difficulties in assessing asymmetry in hindlimbs. Because a certain degree of asymmetry should have clinical relevance, these studies must be performed regularly. In the future, the introduction of these measurements in training horses along with those derived from physiological adaptations to exercise tests (such as heart rate and blood lactate accumulation) are strongly encouraged.
Author Contributions
Conceptualization, N.C-G. and C.M.L.F.; methodology, A.M. and F.F.; software, N.C-G.; formal analysis N.C-G., C.M.L.F., L.S., F.R.; data curation: all authors; writing-original draft preparation, N.C-G., C.M.L.F. and A.M.; writing-review and editing, N.C-G., C.M.L.F., and A.M.; visualization: all authors; supervision, A.M and F.F. All authors have read and agreed to the published version of the manuscript.
Funding
This research received no external funding.
Institutional Review Board Statement
Animal ethical approval was not applicable for this study since it involved privately owned clinical horses which were not subjected to any invasive procedures or alterations to the clinical decisions due to entering the study.
Informed Consent Statement
A written informed consent was obtained from the owners of all the animals involved in the study.
Data Availability Statement
The data presented in the current study are available from the corresponding author upon reasonable request.
Acknowledgments
The authors wish to acknowledge all the colleagues, students, trainers, and owners, who collaborated to make this study possible. Moreover, we wish to acknowledge Sleip team for technical and administrative support, and for providing us with the smartphone application with a discounted fee.
Conflicts of Interest
The authors declare no conflicts of interest. The company (Sleip) had no role in the design of the study; in the collection, analyses, or interpretation of data; in the writing of the manuscript; or in the decision to publish the results.
References
- Dyson, S. Can Lameness Be Graded Reliably?: Can Lameness Be Graded Reliably? Equine Vet J 2011, 43, 379–82. [Google Scholar] [CrossRef]
- Keegan, K.G. Evidence-Based Lameness Detection and Quantification. Vet Clin North Am Equine Pract 2007, 23, 403–23. [Google Scholar] [CrossRef]
- Starke, S.D.; Oosterlinck, M. Reliability of Equine Visual Lameness Classification as a Function of Expertise, Lameness Severity and Rater Confidence. Vet Rec 2019, 184, 63–63. [Google Scholar] [CrossRef]
- Hardeman, A.M.; Egenvall, A.; Serra Bragança, F.M.; Swagemakers, J.H.; Koene, M.H.W.; Roepstorff, L.; Van Weeren, R.; Byström, A. Visual Lameness Assessment in Comparison to Quantitative Gait Analysis Data in Horses. Equine Vet J 2022, 54, 1076–85. [Google Scholar] [CrossRef] [PubMed]
- Hammarberg, M.; Egenvall, A.; Pfau, T.; Rhodin, M. Rater Agreement of Visual Lameness Assessment in Horses during Lungeing. Equine Vet J 2016, 48, 78–82. [Google Scholar] [CrossRef] [PubMed]
- Keegan, K.G.; Dent, E.V.; Wilson, D.A.; Janicek, J.; Kramer, J.; Lacarrubba, A.; Walsh, D.M.; Cassells, M.W.; Esther, T.M.; Schiltz, P.; Frees, K.E.; Wilhite, C.L.; Clark, J.M.; Pollitt, C.C.; Shaw, R.; Norris, T. Repeatability of Subjective Evaluation of Lameness in Horses. Equine Vet J 2010, 42, 92–97. [Google Scholar] [CrossRef] [PubMed]
- Parkes, R.S.V.; Weller, R.; Groth, A.M.; May, S.; Pfau, T. Evidence of the Development of ‘Domain-restricted’ Expertise in the Recognition of Asymmetric Motion Characteristics of Hindlimb Lameness in the Horse. Equine Vet J 2009, 41, 112–17. [Google Scholar] [CrossRef] [PubMed]
- Hammarberg, M.; Egenvall, A.; Rhodin, M. Subjective Evaluation of Lameness in Horses During Lungeing. Equine Vet J 2014, 46, 41–41. [Google Scholar] [CrossRef]
- Arkell, M.; Archer, R.M.; Guitian, F.J; May, S.A. . Evidence of Bias Affecting the Interpretation of the Results of Local Anaesthetic Nerve Blocks When Assessing Lameness in Horses. Vet Rec 2006, 159, 346–48. [Google Scholar] [CrossRef]
- Crecan, C.M.; Peștean, C.P. Inertial Sensor Technologies—Their Role in Equine Gait Analysis, a Review. Sensors 2023, 23, 6301. [Google Scholar] [CrossRef]
- Keegan, K.G.; Wilson, D.A.; Kramer, J.; Reed, S.K.; Yonezawa, Y.; Maki, H.; Pai, P.F.; Lopes, M.A.F. Comparison of a body- mounted inertial sensor system–based method with subjective evaluation for detection of lameness in horses». Am J Vet Res 2013, 74, 17–24. [Google Scholar] [CrossRef] [PubMed]
- Rhodin, M.; Persson-Sjodin, E.; Egenvall, A.; Serra Bragança, F.M.; Pfau, T.; Roepstorff, L.; Weishaupt, M.A.; Thomsen, M.H.; Van Weeren, P.R.; Hernlund, E. Vertical Movement Symmetry of the Withers in Horses with Induced Forelimb and Hindlimb Lameness at Trot. Equine Vet J 2018, 50, 818–24. [Google Scholar] [CrossRef]
- Keegan, K.G.; Kramer, J.; Yonezawa, Y.; Maki, H.; Pai, P.F.; Dent, E.V.; Kellerman, T.E.; Wilson, D.A.; Reed, S.K. Assessment of repeatability of a wireless, inertial sensor–based lameness evaluation system for horses. Am J Vet Res 2011, 72, 1156–63. [Google Scholar] [CrossRef]
- Pfau, T.; Weller, R. Comparison of a Standalone Consumer Grade Smartphone with a Specialist Inertial Measurement Unit for Quantification of Movement Symmetry in the Trotting Horse. Equine Vet J 2017, 49, 124–29. [Google Scholar] [CrossRef]
- Pfau, T. Sensor-Based Equine Gait Analysis: More than Meets the Eye? UK-Vet Equine 2019, 3, 102–12. [Google Scholar] [CrossRef]
- Serra Bragança, F.M.; Broomé, S.; Rhodin, M.; Björnsdóttir, S.; Gunnarsson, V.; Voskamp, J.P.; Persson-Sjodin, E.; Back, W.; Lindgren, G.; Novoa-Bravo, M.; Gmel, A.I.; Roepstorff, C.; Van Der Zwaag, B.J.; Van Weeren, P.R.; Hernlung, E. Improving Gait Classification in Horses by Using Inertial Measurement Unit (IMU) Generated Data and Machine Learning. Sci Rep 2020, 10, 17785. [Google Scholar] [CrossRef] [PubMed]
- Bosch, S.; Serra Bragança, F.; Marin-Perianu, M.; Marin-Perianu, R.; Van Der Zwaag, B.; Voskamp, J.; Back, W.; Van Weeren, R.; Havinga, P. EquiMoves: A Wireless Networked Inertial Measurement System for Objective Examination of Horse Gait. Sensors 2018, 18, 850. [Google Scholar] [CrossRef]
- Rana, M.; Mittal, V. Horse Gait Analysis Using Wearable Inertial Sensors and Machine Learning. Proceedings of the Institution of Mechanical Engineers, Part P: Journal of Sports Engineering and Technology 2023, 17543371231196814. [CrossRef]
- Pfau, T.; Boultbee, H.; Davis, H.; Walker, A.; Rhodin, M. Agreement between Two Inertial Sensor Gait Analysis Systems for Lameness Examinations in Horses. Equine Vet Educ 2016, 28, 203–8. [Google Scholar] [CrossRef]
- Keegan, K.G.; MacAllister, C.G.; Wilson, D.A.; Gedon, C.A.; Kramer, J.; Yonezawa, Y.; Maki, Y.; Pai, P.F. Comparison of an inertial sensor system with a stationary force plate for evaluation of horses with bilateral forelimb lameness. Am J Vet Res 2012, 73, 368–74. [Google Scholar] [CrossRef]
- Bell, R.P.; Reed, S.K.; Schoonover, M.J.; Whitfield, C.T.; Yonezawa, Y.; Maki, H.; Pai, P.F.; Keegan, K.G. Associations of force plate and body-mounted inertial sensor measurements for identification of hind limb lameness in horses. Am J Vet Res 2016, 77, 337–45. [Google Scholar] [CrossRef]
- Tijssen, M.; Hernlund, E.; Rhodin, M.; Bosch, S.; Voskamp, J.P.; Nielen, M.; Serra Braganςa, F.M. Automatic Hoof-on and -off Detection in Horses Using Hoof-Mounted Inertial Measurement Unit Sensors. PLoS ONE 2020, 15, e0233266. [Google Scholar] [CrossRef]
- Bragança, F.M.; Bosch, S.; Voskamp, P.; Marin-Perianu, M.; Van Der Zwaag, B.J.; Vernooij, J.C.M.; Van Weeren, P.R.; Back, W. Validation of Distal Limb Mounted Inertial Measurement Unit Sensors for Stride Detection in Warmblood Horses at Walk and Trot. Equine Vet J 2017, 49, 545–51. [Google Scholar] [CrossRef] [PubMed]
- Donnell, J.R.; Frisbie, D.D.; King, M.R.; Goodrich, L.R.; Haussler, K.K. Comparison of Subjective Lameness Evaluation, Force Platforms and an Inertial-Sensor System to Identify Mild Lameness in an Equine Osteoarthritis Model. Vet J 2015, 206, 136–42. [Google Scholar] [CrossRef] [PubMed]
- Crecan, C.M.; Morar, I.A.; Lupsan, A.F.; Lupsan, C.C.; Rus, M.A.; Repciuc, C.C. Development of a Novel Approach for Detection of Equine Lameness Based on Inertial Sensors: A Preliminary Study. Sensors 2022, 22, 7082. [Google Scholar] [CrossRef] [PubMed]
- Lawin, F.J.; Byström, A.; Roepstorff, C.; Rhodin, M.; Almlöf, M.; Silva, M.; Haubro Andersen, P.; Kjellström, H.; Hernlund, E. Is Markerless More or Less? Comparing a Smartphone Computer Vision Method for Equine Lameness Assessment to Multi- Camera Motion Capture. Animals 2023, 13, 390. [Google Scholar] [CrossRef]
- Martinsson, J. Gait screening using a mobile phone application : Horse asymmetry levels and usability of a mobile phone application for gait analysis, during a long format FEI eventing competition. Degree Thesis, Swedish University of Agricultural Sciences, Uppsala, Sweden, 23rd February 2022. [Google Scholar]
- Wang, J.; Sun, K.; Cheng, T.; Jiang, B.; Deng, C.; Zhao, Y.; Liu, D.; Mu, Y.; Tan, M.; Wang, X.; Liu, W.; Xiao, B. Deep High- Resolution Representation Learning for Visual Recognition. IEEE Trans Pattern Anal Mach Intell 2021, 43, 3349–64. [Google Scholar] [CrossRef]
- Alagele, M.; Yildirim, R. Animal gait identification using a deep learning method. In 2022 International Symposium on Multidisciplinary Studies and Innovative Technologies (ISMSIT), Ankara, Turkey; IEEE, 2022, 540-4. [CrossRef]
- Azhand, A.; Rabe, S.; Müller, S.; Sattler, I.; Heimann-Steinert, A. Algorithm based on one monocular video delivers highly valid and reliable gait parameters. Sci Rep 2021, 11, 14065. [Google Scholar] [CrossRef]
- Müller-Quirin, J.; Dittmann, M.T.; Roepstorff, C.; Arpagaus, S.; Latif, S.N.; Weishaupt, M.A. Riding Soundness—Comparison of Subjective With Objective Lameness Assessments of Owner-Sound Horses at Trot on a Treadmill. J Equine Vet Sci 2020, 95, 103314. [Google Scholar] [CrossRef]
- Scheidegger, M.D.; Gerber, V.; Dolf, G.; Burger, D.; Flammer, S.A.; Ramseyer, A. Quantitative Gait Analysis Before and After a Cross-Country Test in a Population of Elite Eventing Horses. J Equine Vet Sci 2022, 117, 104077. [Google Scholar] [CrossRef] [PubMed]
- Pfau, T.; Landsbergen, K.; Davis, B.L.; Kenny, O.; Kernot, N.; Rochard, N.; Porte-Proust, M.; Sparks, H.; Takahashi, Y.; Toth, K.; Scott, W.M. Comparing Inertial Measurement Units to Markerless Video Analysis for Movement Symmetry in Quarter Horses. Sensors 2023, 8414. [Google Scholar] [CrossRef] [PubMed]
- Ross, M.W.; McIlwraith, C.W. Conformation and Lameness. In Diagnosis and Management of Lameness in the Horse, 2nd ed.; Scott, M.W., Dyson, S.J., Eds.; Elsevier: St. Louis, Missouri, USA, 2011; pp. 15–32. [Google Scholar] [CrossRef]
- Starke, S.D.; May, S.A.; Pfau, T. Understanding Hind Limb Lameness Signs in Horses Using Simple Rigid Body Mechanics. J Biomech 2015, 48, 3323–31. [Google Scholar] [CrossRef]
- Starke, S.D.; May, S.A. Robustness of Five Different Visual Assessment Methods for the Evaluation of Hindlimb Lameness Based on Tubera Coxarum Movement in Horses at the Trot on a Straight Line. Equine Vet J 2022, 54, 1103–13. [Google Scholar] [CrossRef] [PubMed]
- Buchner, H. H. F.; Savelberg, H.H.C.M.; Schamhardt, H.C.; Barneveld, A. Head and Trunk Movement Adaptations in Horses with Experimentally Induced Fore- or Hindlimb Lameness. Equine Vet J 1996, 28, 71–76. [Google Scholar] [CrossRef] [PubMed]
- Pfau, T.; Jennings, C.; Mitchell, H.; Olsen, E.; Walker, A.; Egenvall, A.; Tröster, S.; Weller, R.; Rhodin, M. Lungeing on Hard and Soft Surfaces: Movement Symmetry of Trotting Horses Considered Sound by Their Owners. Equine Vet J 2016, 48, 83–89. [Google Scholar] [CrossRef] [PubMed]
- Rhodin, M.; Egenvall, A.; Haubro Andersen, P.; Pfau, T. Head and Pelvic Movement Asymmetries at Trot in Riding Horses in Training and Perceived as Free from Lameness by the Owner. PLoS ONE 2017, 12, e0176253. [Google Scholar] [CrossRef]
- Jansson, A.; Gunnarsson, V.T.; Ringmark, S.; Ragnarsson, S.; Söderroos, D.; Asgeirsson, E.; Jóhannsdóttir, T.R.; Liedberg, C.; Stefánsdóttir, G.J. Increased Body Fat Content in Horses Alters Metabolic and Physiological Exercise Response, Decreases Performance, and Increases Locomotion Asymmetry. Physiol Rep 2021, 9, e14814. [Google Scholar] [CrossRef]
- Greve, L.; Dyson, S. What Can We Learn from Visual and Objective Assessment of Non-lame and Lame Horses in Straight Lines, on the Lunge and Ridden? Equine Vet Educ 2020, 32, 479–91. [Google Scholar] [CrossRef]
Figure 1.
Difference in the locomotor parameters measured by inertial measurement units system (IMUs) and an artificial intelligence marker-less motion tracking system (AI-MTS) (y axis) as a function of average value of both systems (x axis) for each straight hard (SH) assessment in the 20 horses included in the study. The upper and lower limits of agreement are illustrated by the dotted lines.
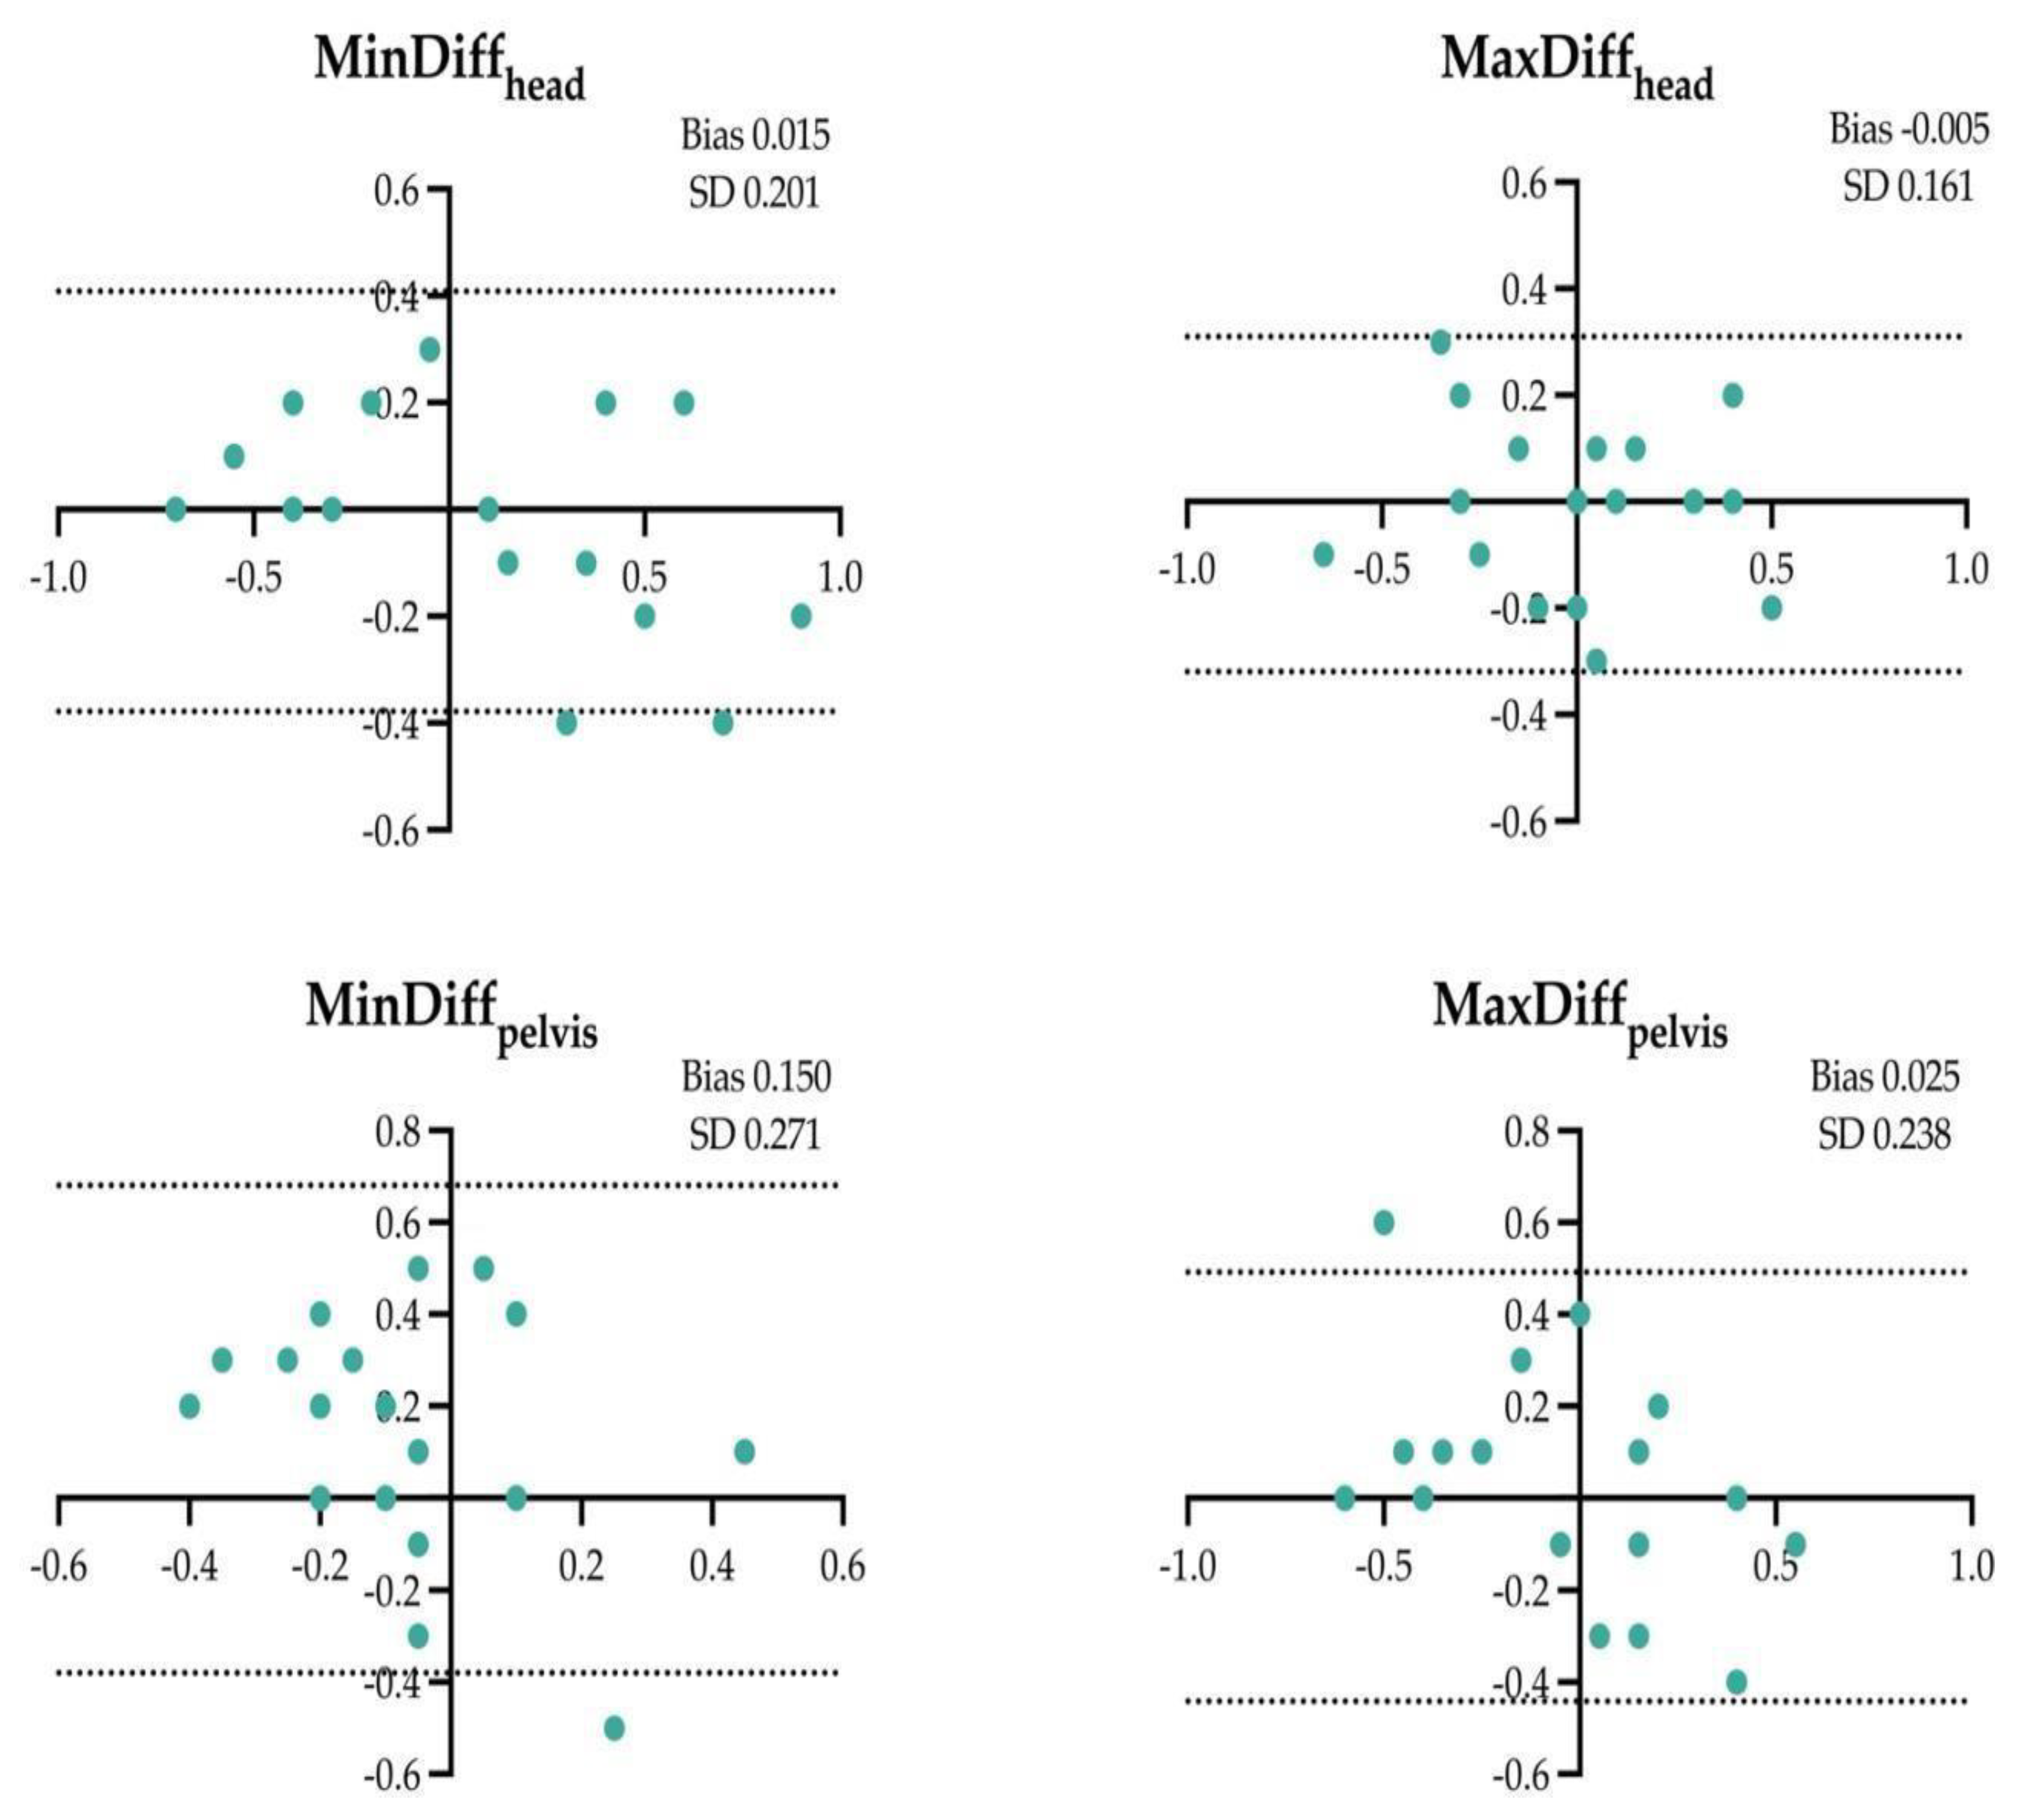
Figure 2.
Difference between the locomotor parameters measured by inertial measurement units system (IMUs) and an artificial intelligence marker-less motion tracking system (AI-MTS) (y axis) as a function of average value of both systems (x axis) for each straight soft (SH) assessment in the 20 horses included in the study. The upper and lower limits of agreement are illustrated by the dotted lines.
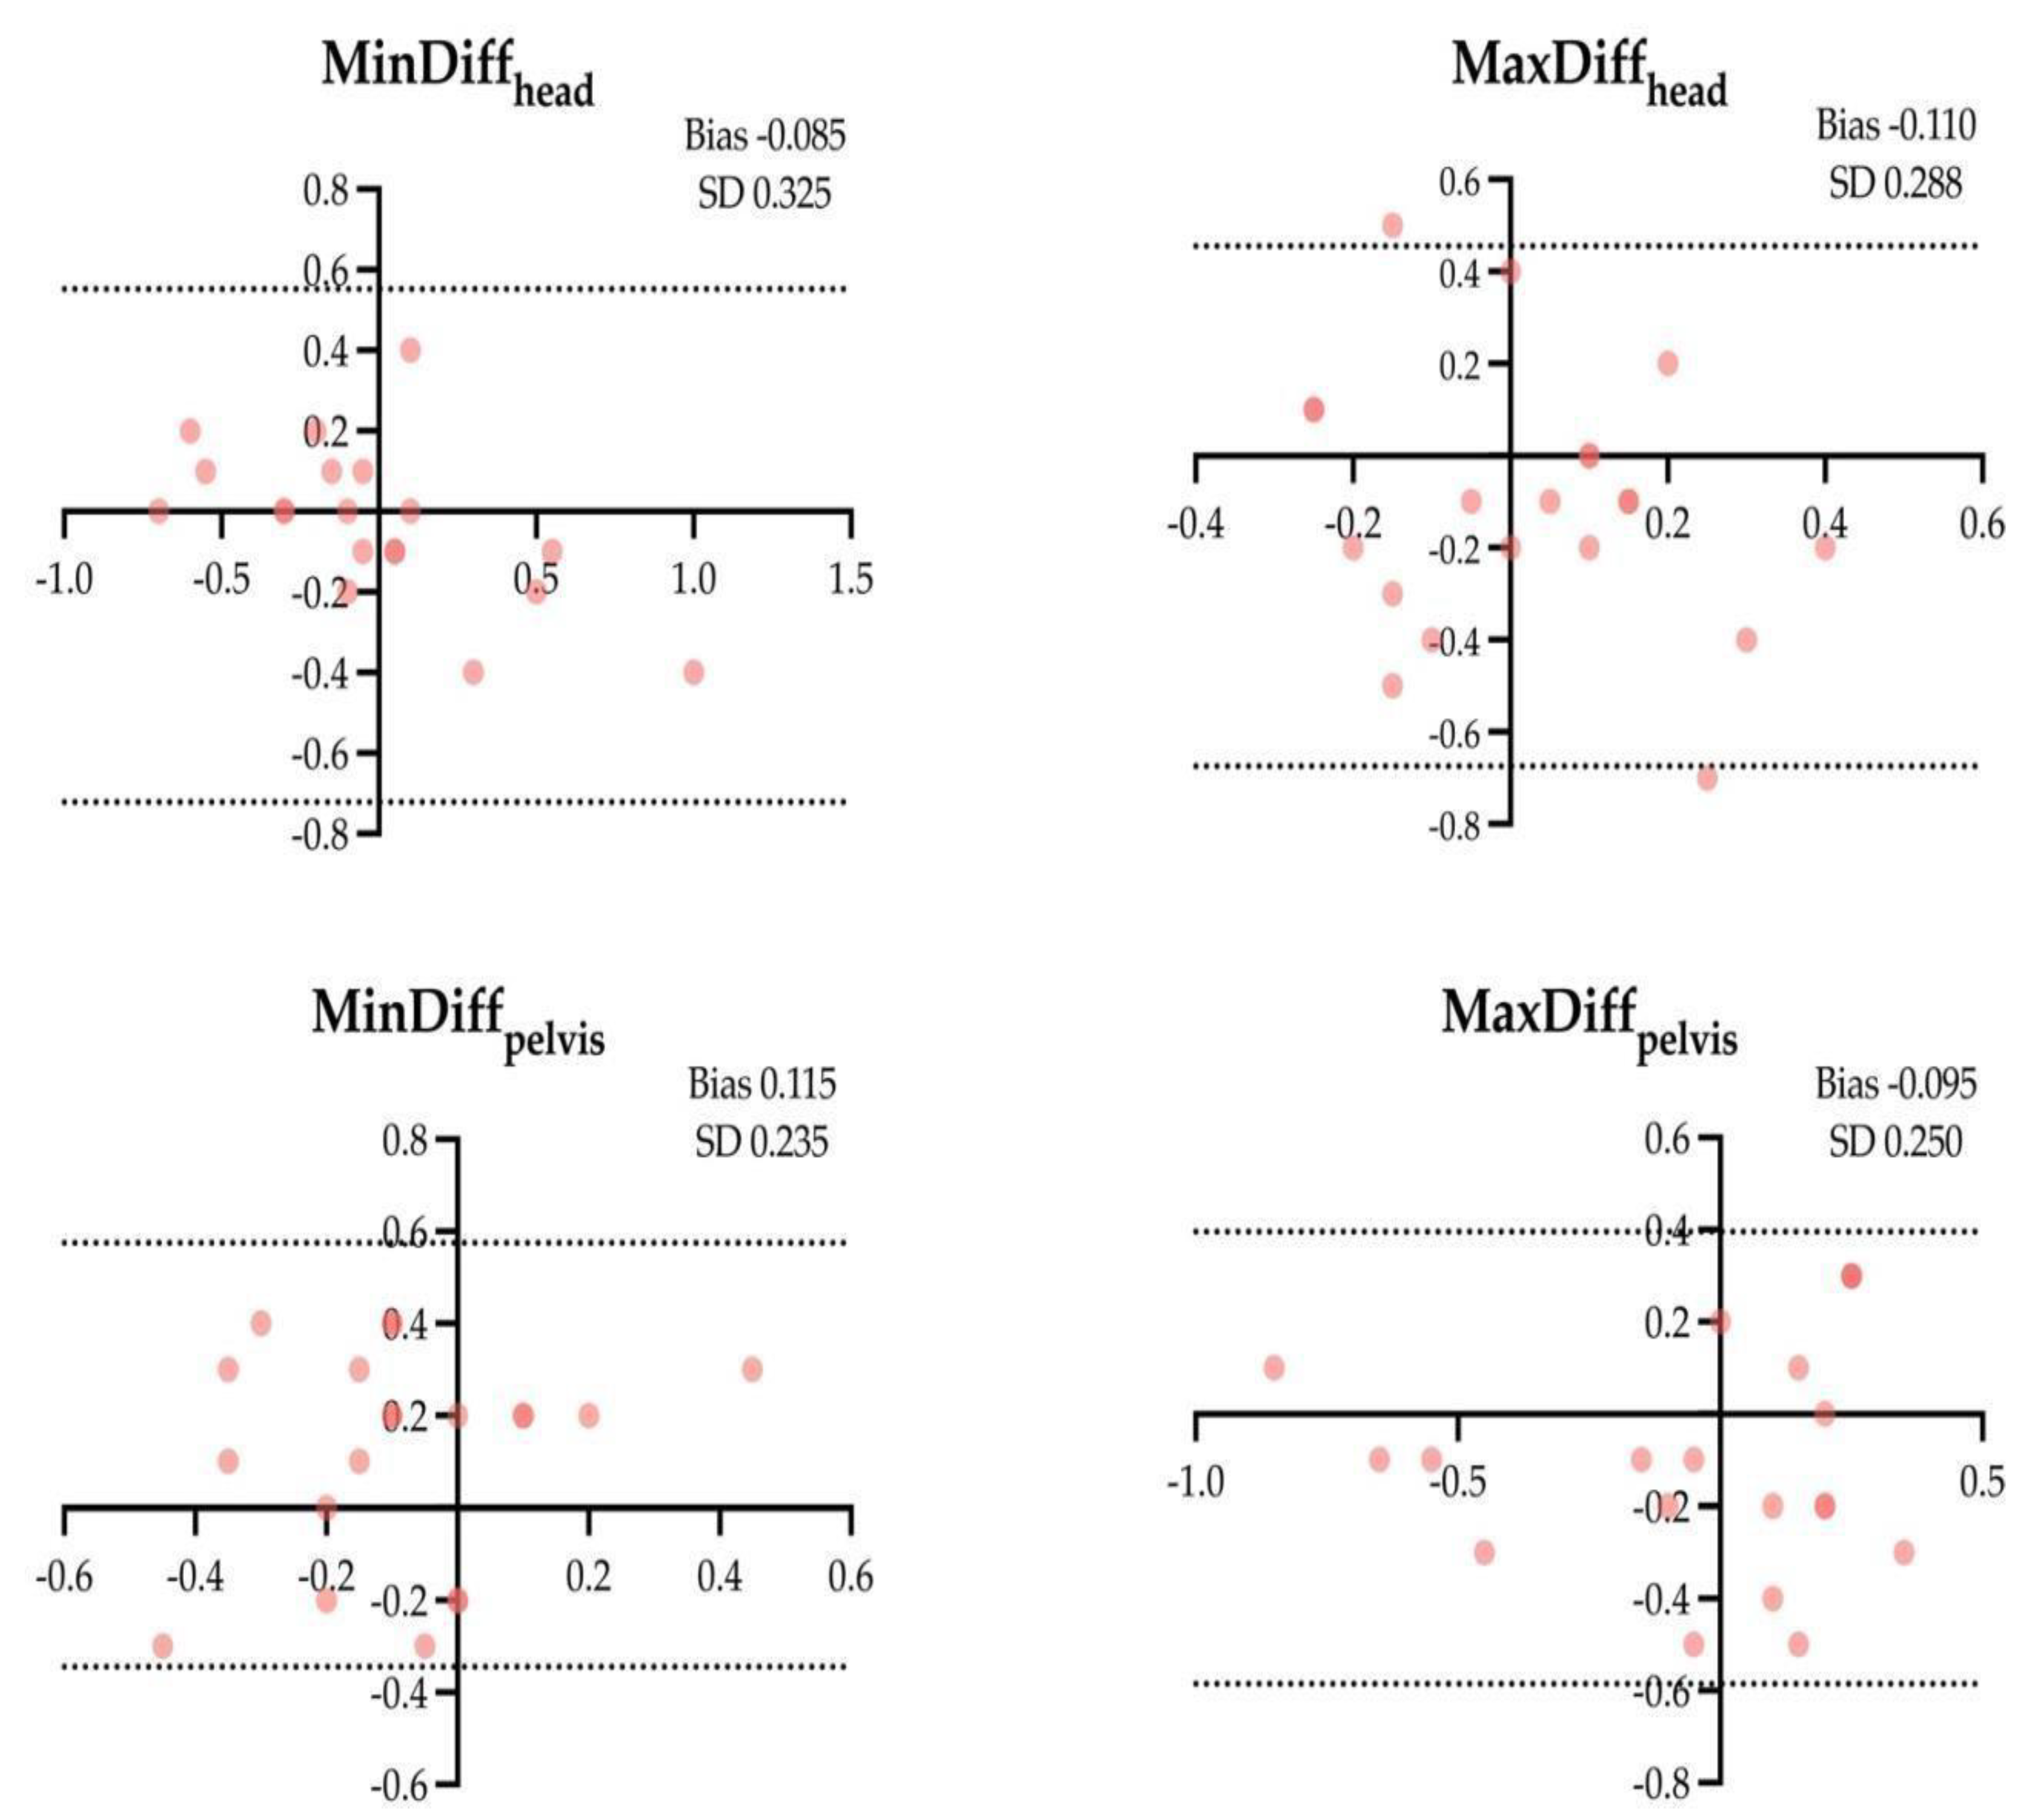
Figure 3.
Difference between the locomotor parameters measured by inertial measurement units system (IMUs) and an artificial intelligence marker-less motion tracking system (AI-MTS) (y axis) as a function of average value of both systems (x axis) for each left circle hard (LCH) assessment in the 20 horses included in the study. The upper and lower limits of agreement are illustrated by the dotted lines.
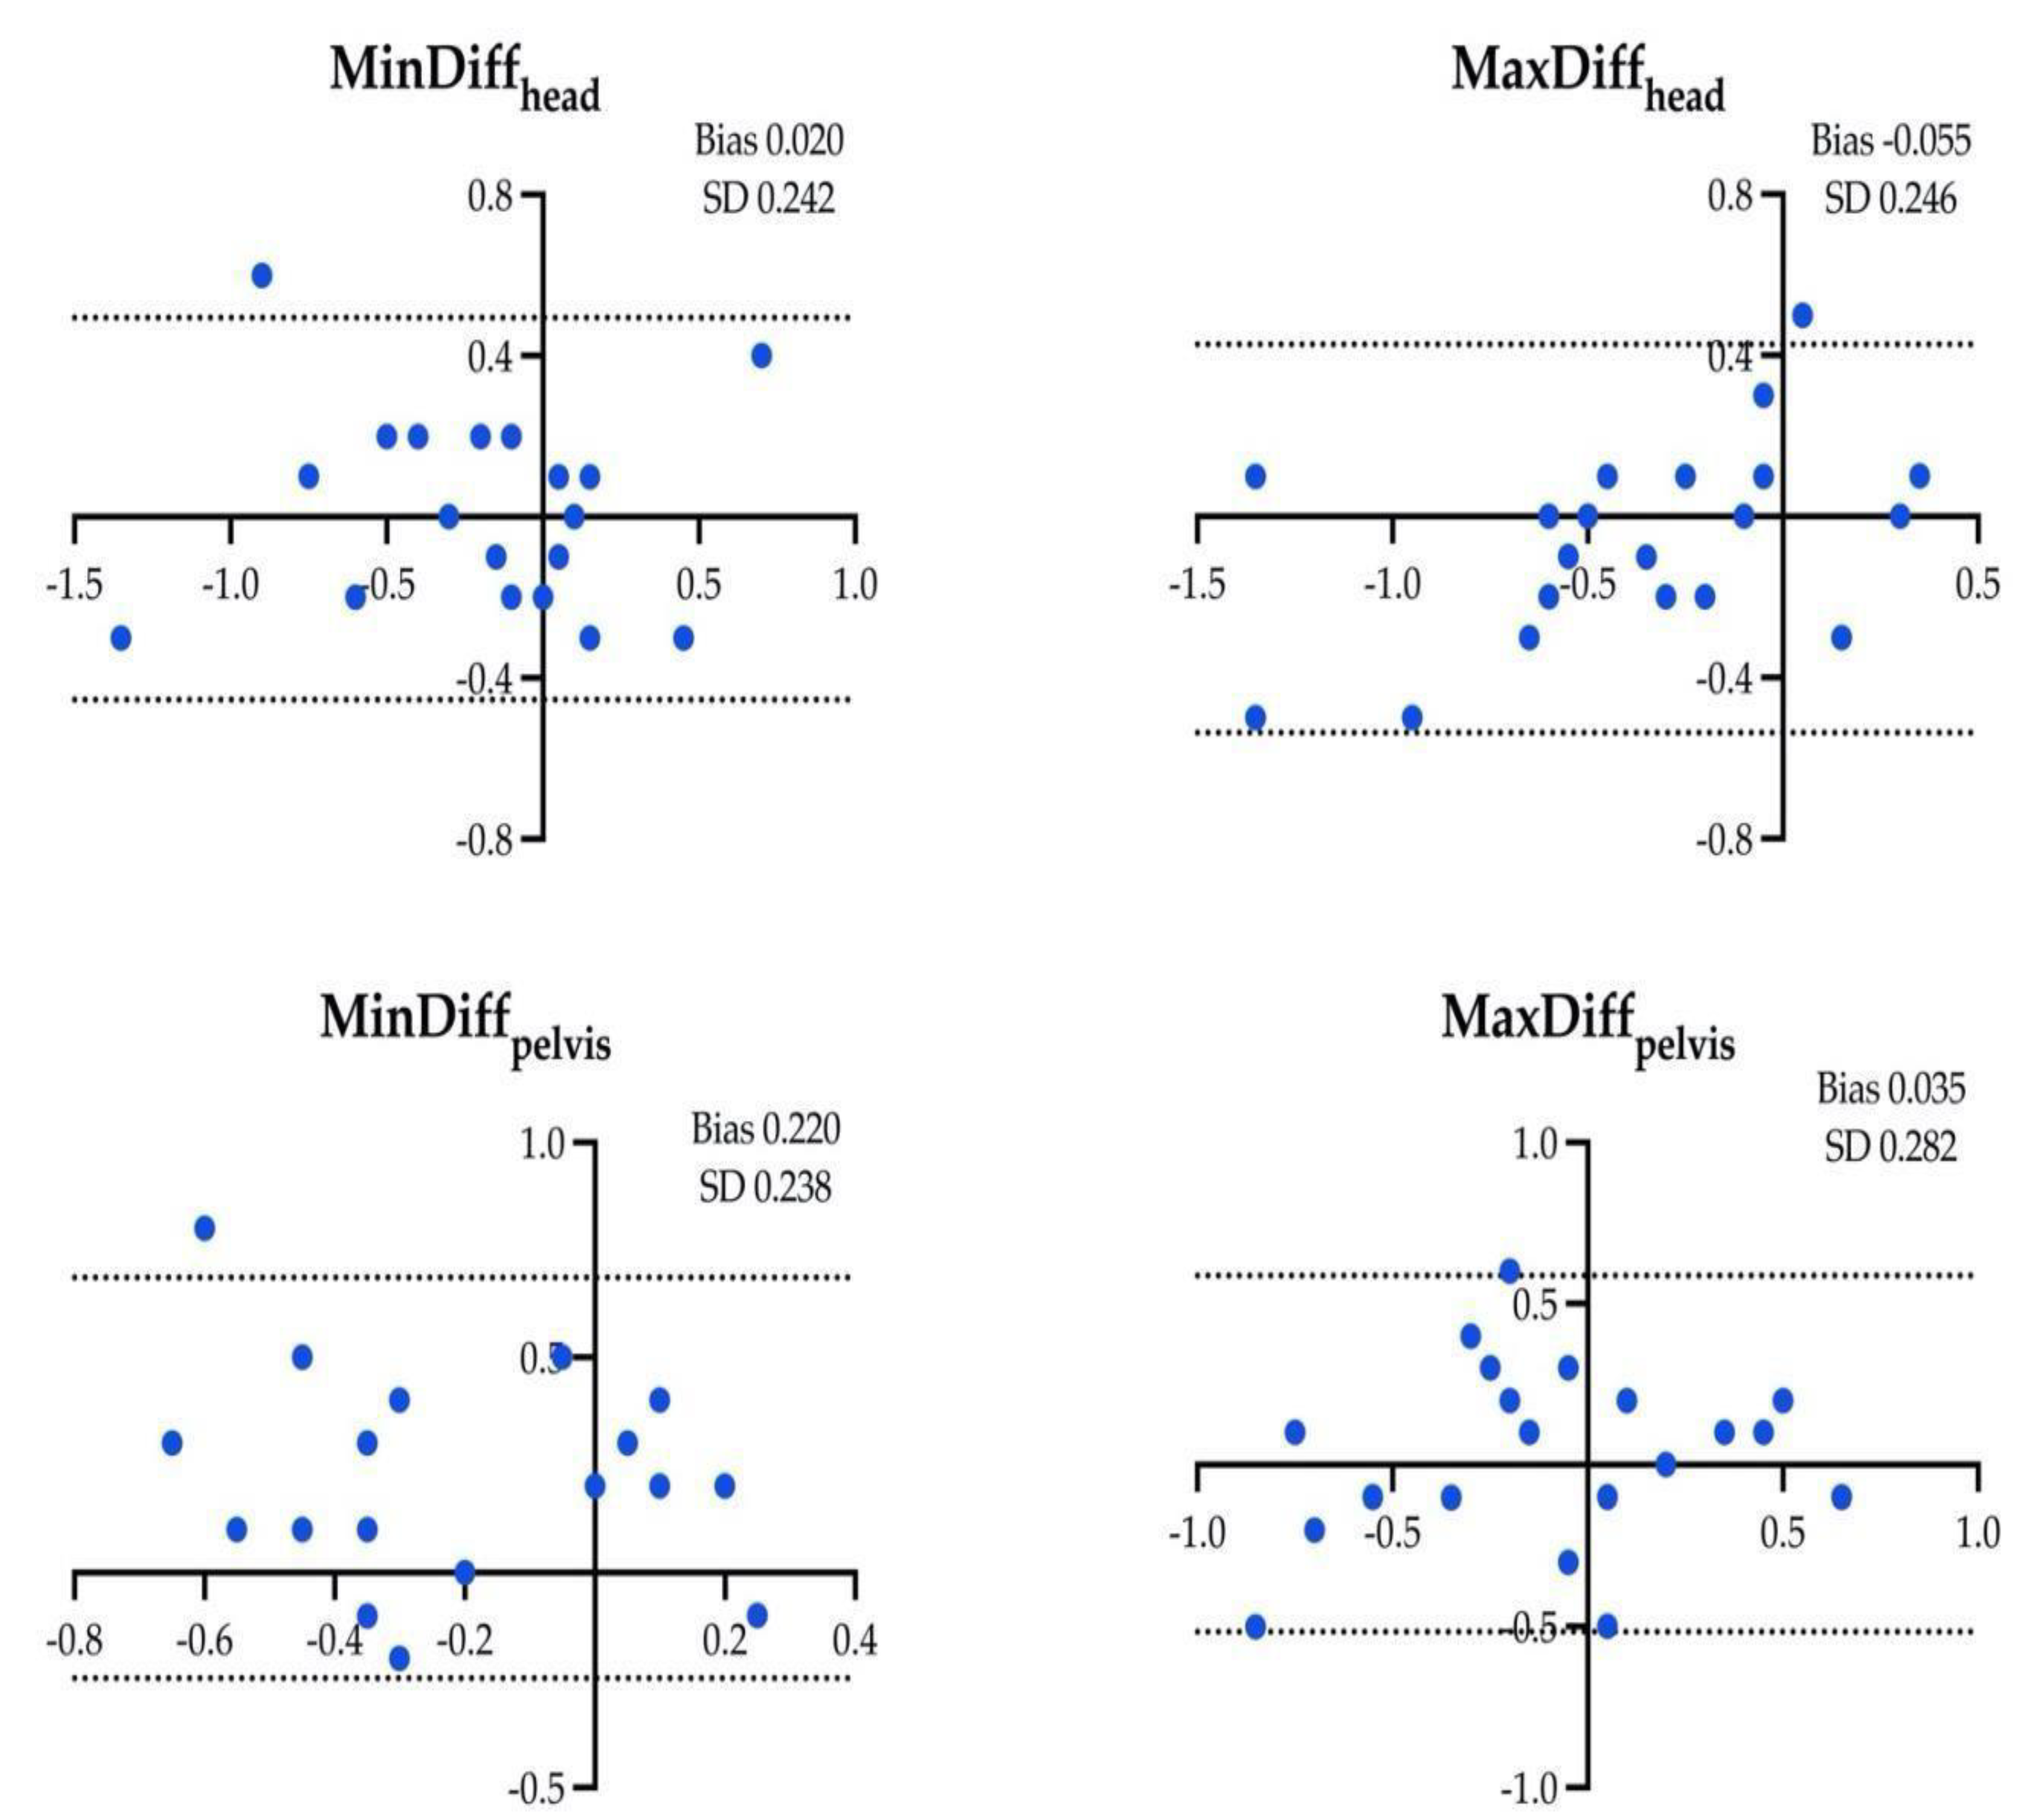
Figure 4.
Difference between the locomotor parameters measured by inertial measurement units system (IMUs) and an artificial intelligence marker-less motion tracking system (AI-MTS) (y axis) as a function of average value of both systems (x axis) for each right circle hard (RCH) assessment in the 20 horses included in the study. The upper and lower limits of agreement are illustrated by the dotted lines.
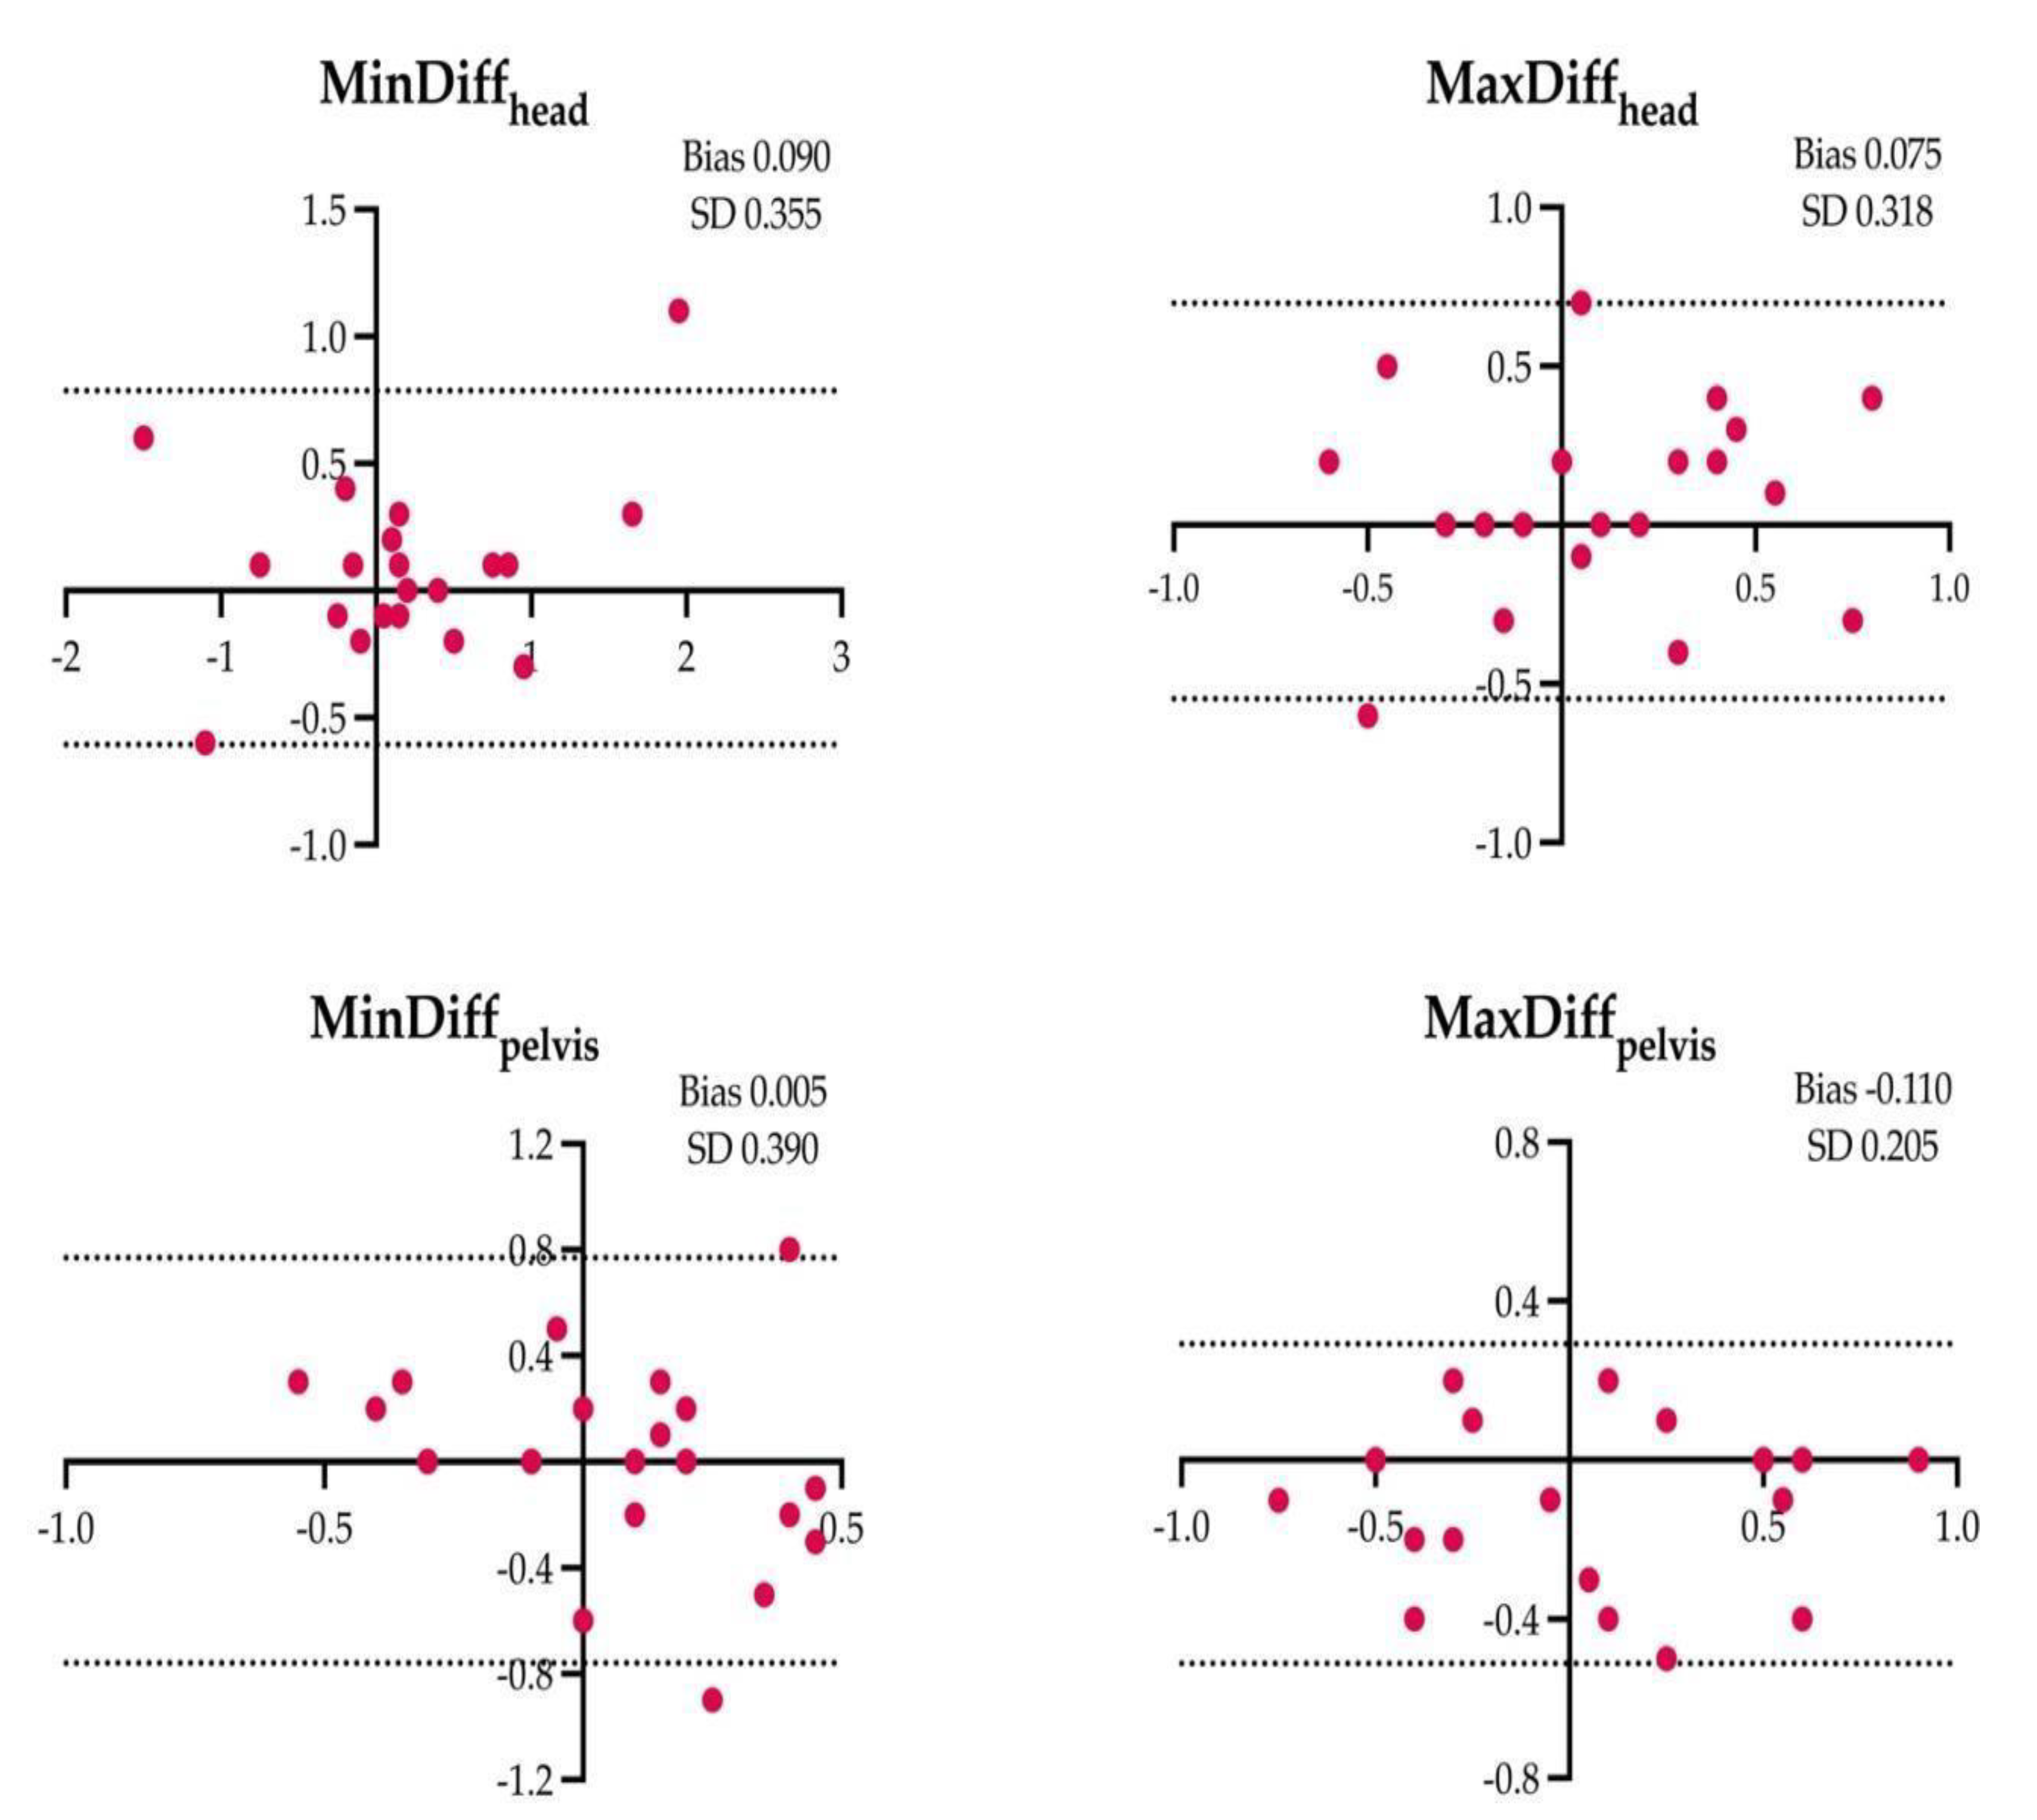
Figure 5.
Difference between the locomotor parameters measured by inertial measurement units system (IMUs) and an artificial intelligence marker-less motion tracking system (AI-MTS) (y axis) as a function of average value of both systems (x axis) for each left circle soft (LCS) assessment in the 20 horses included in the study. The upper and lower limits of agreement are illustrated by the dotted lines.
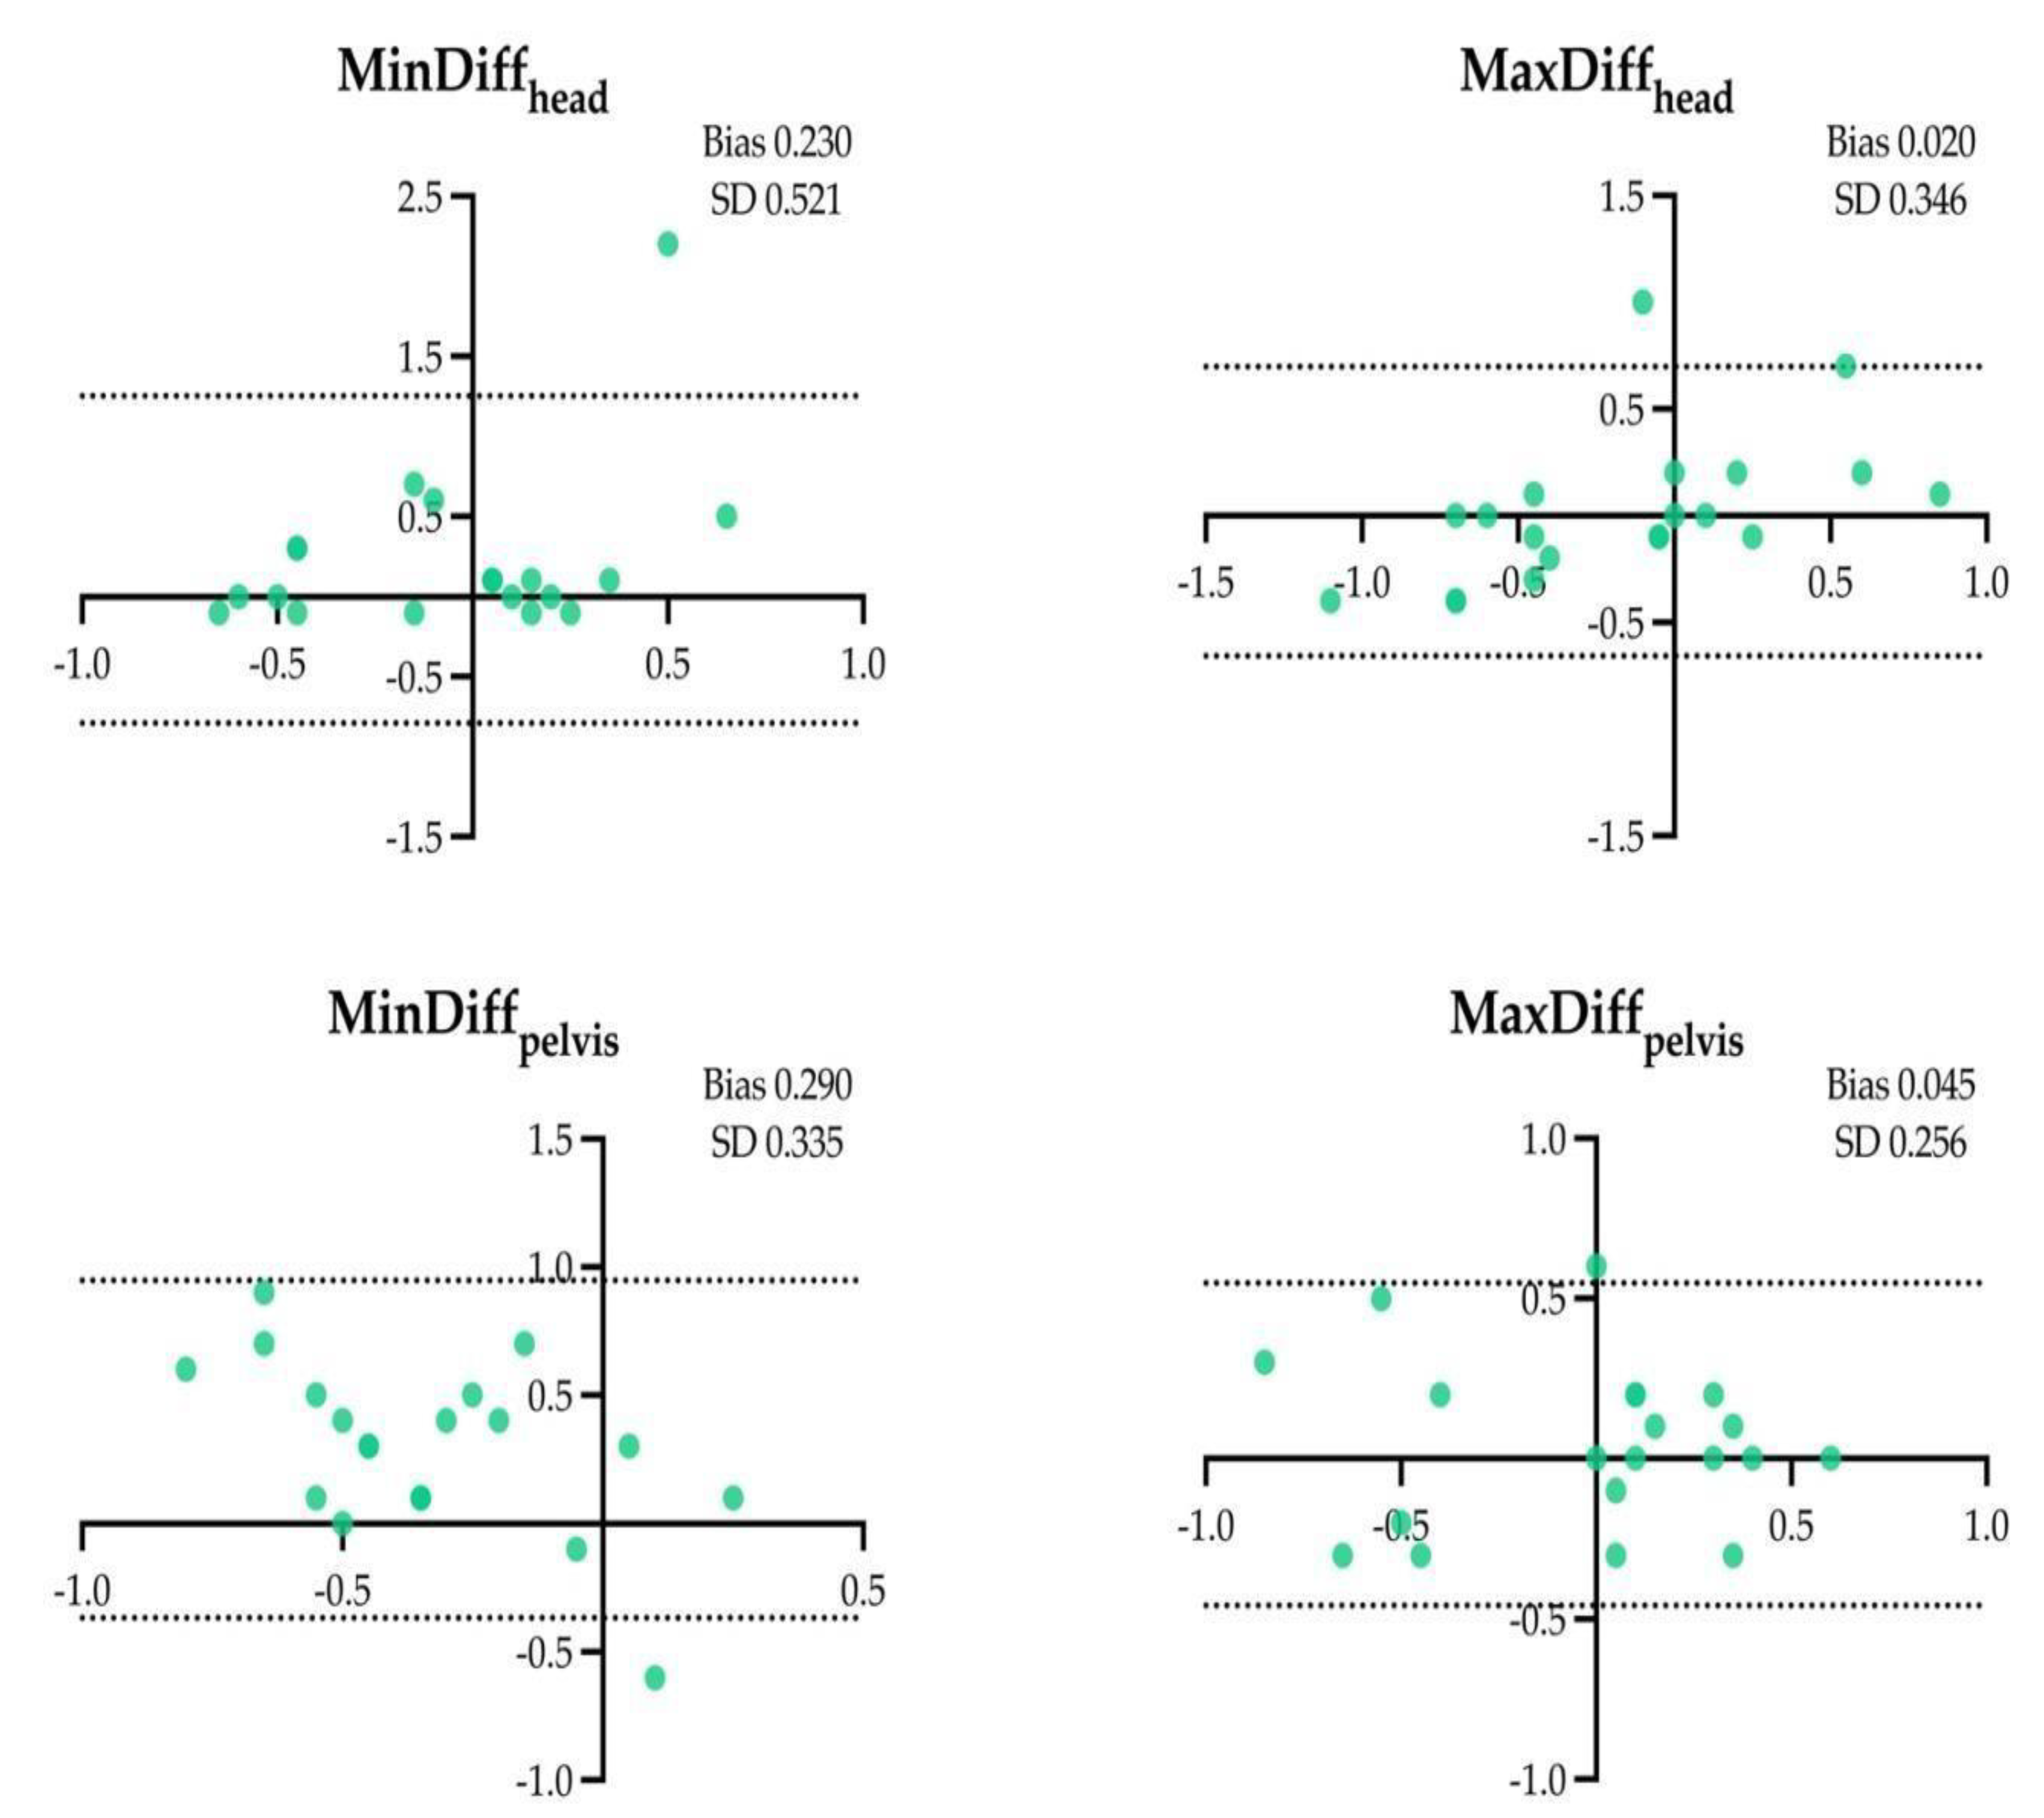
Figure 6.
Difference between the locomotor parameters measured by inertial measurement units system (IMUs) and an artificial intelligence marker-less motion tracking system (AI-MTS) (y axis) as a function of average value of both systems (x axis) for each right circle soft (RCS) assessment in the 20 horses included in the study. The upper and lower limits of agreement are illustrated by the dotted lines.
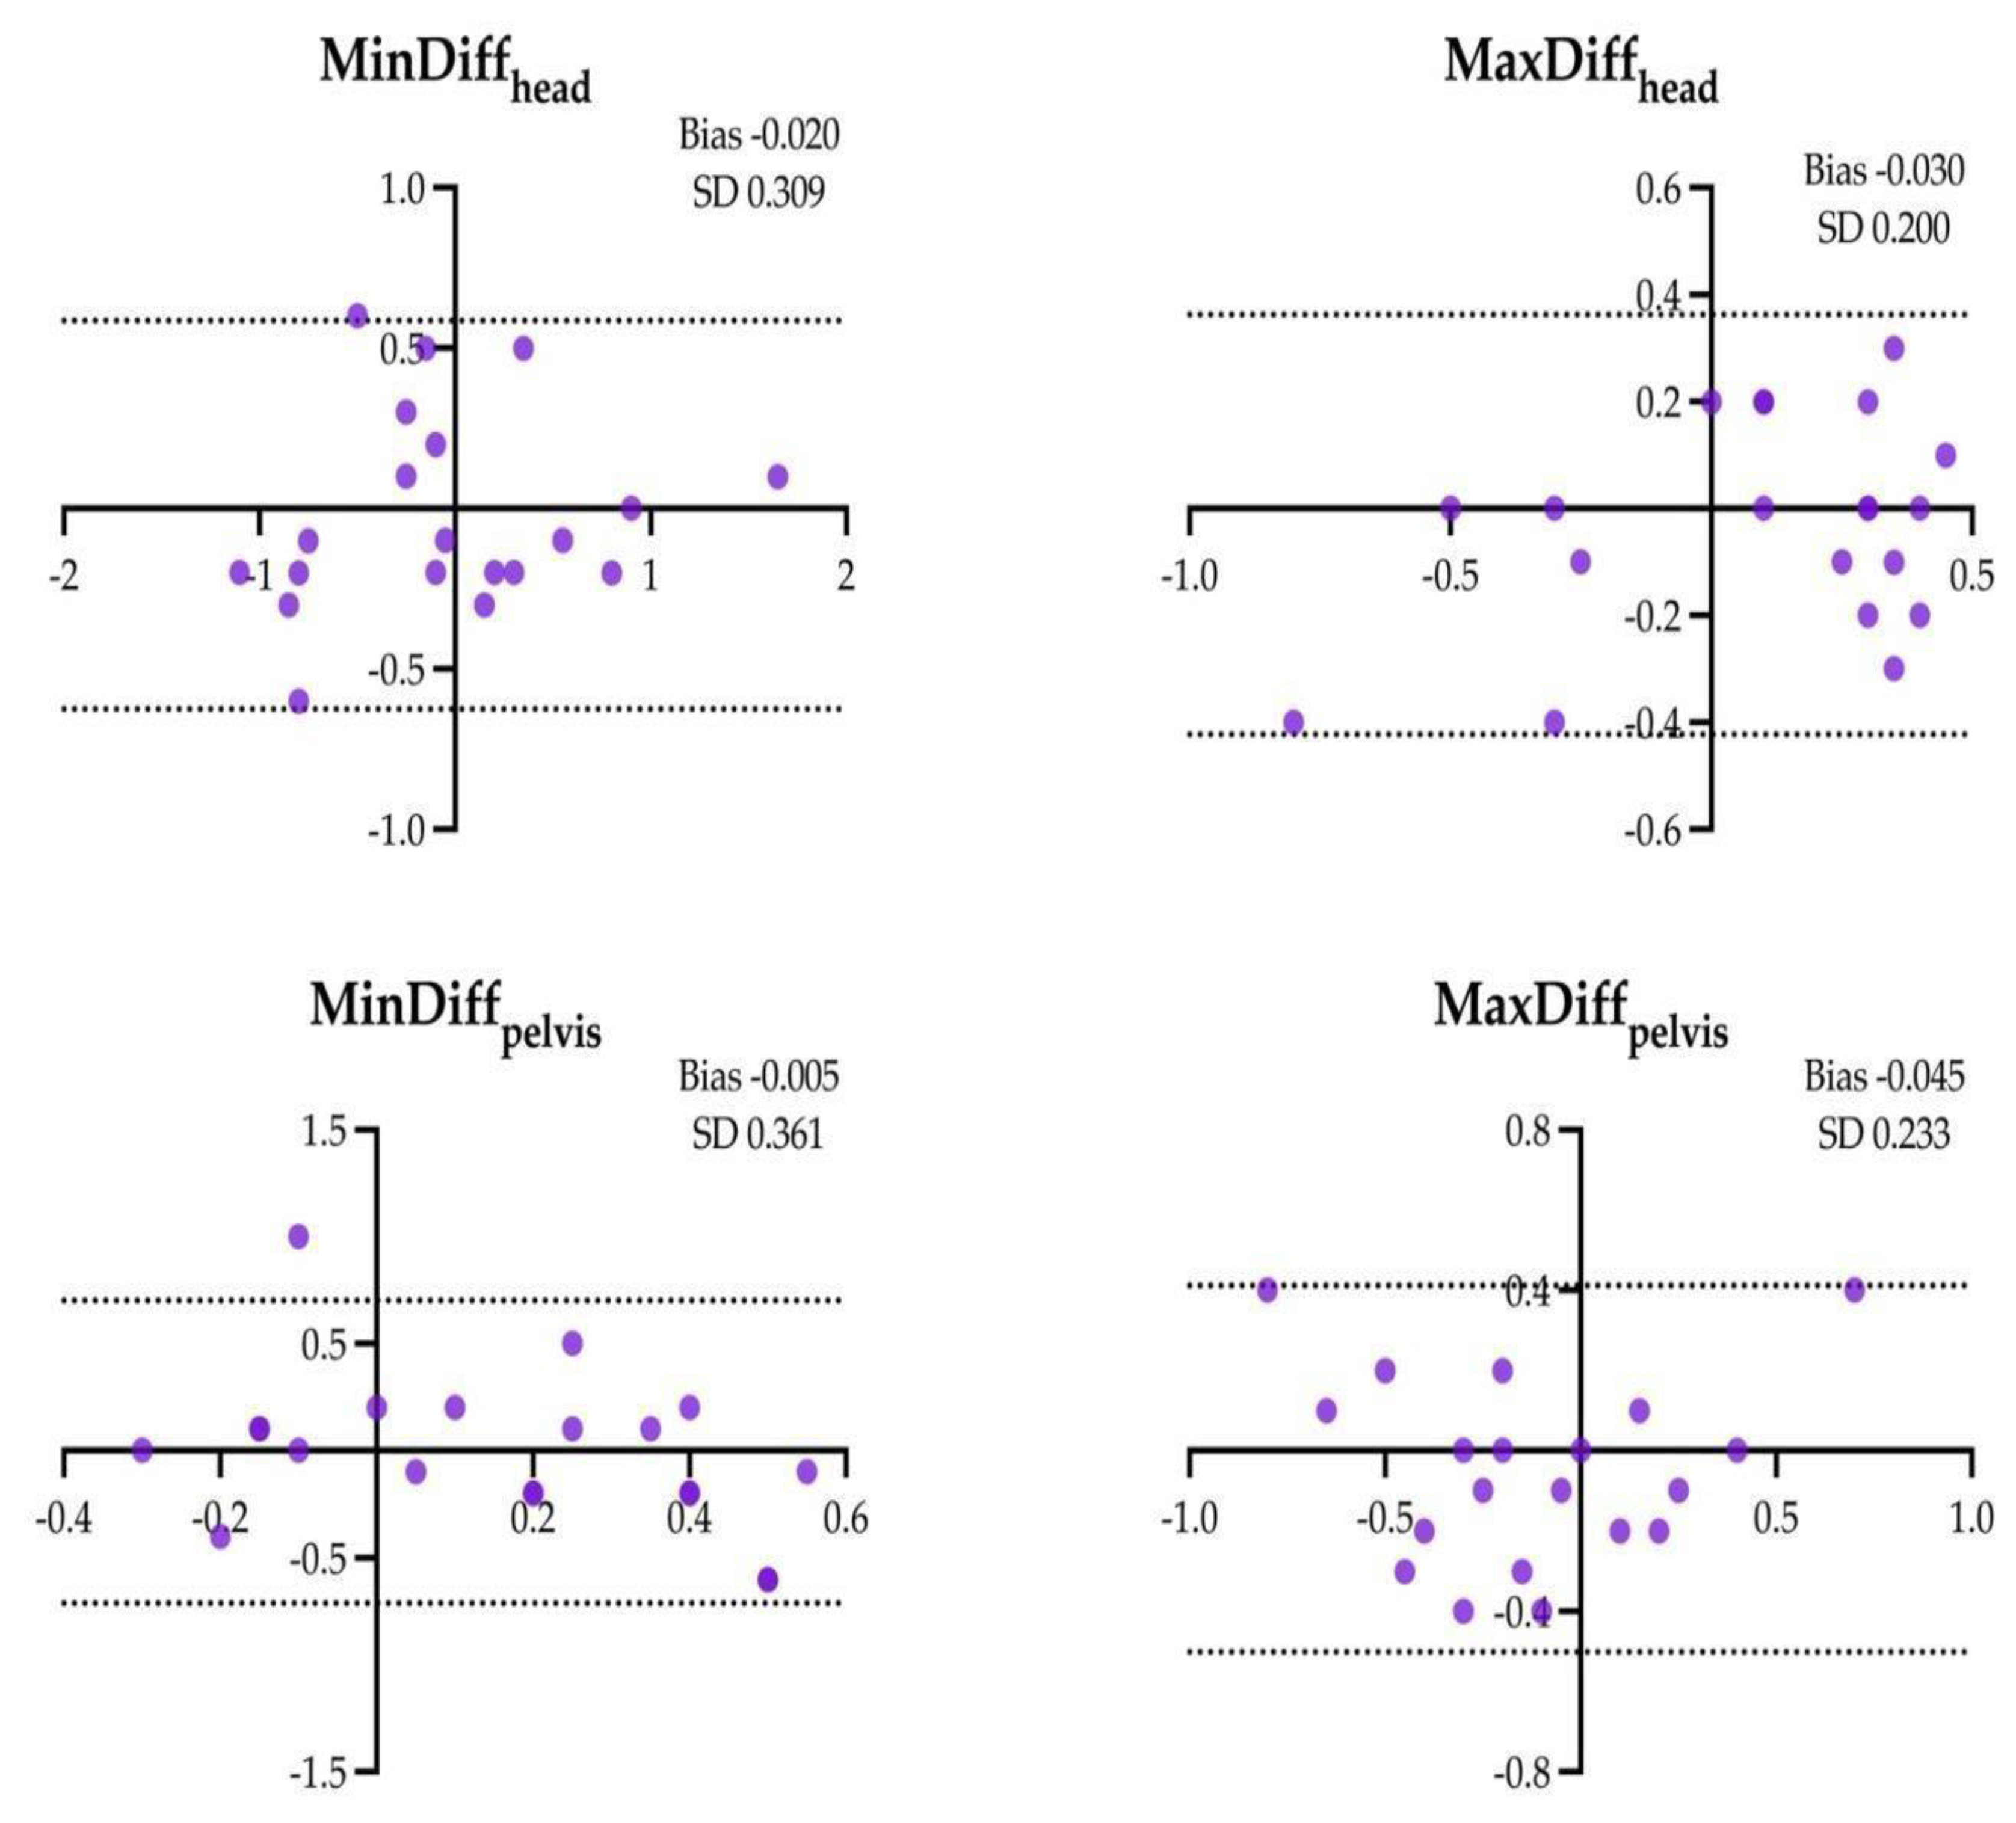
Figure 7.
Box and Whiskers plot, showing median, interquartile range and total range of the MinDiffhead and MinDiffpelvis measured by the two gait analysis systems (IMUs and AI-MTS) during the straight hard (SH) assessments. Statistical significance was set as *(p < 0.05).
Figure 7.
Box and Whiskers plot, showing median, interquartile range and total range of the MinDiffhead and MinDiffpelvis measured by the two gait analysis systems (IMUs and AI-MTS) during the straight hard (SH) assessments. Statistical significance was set as *(p < 0.05).
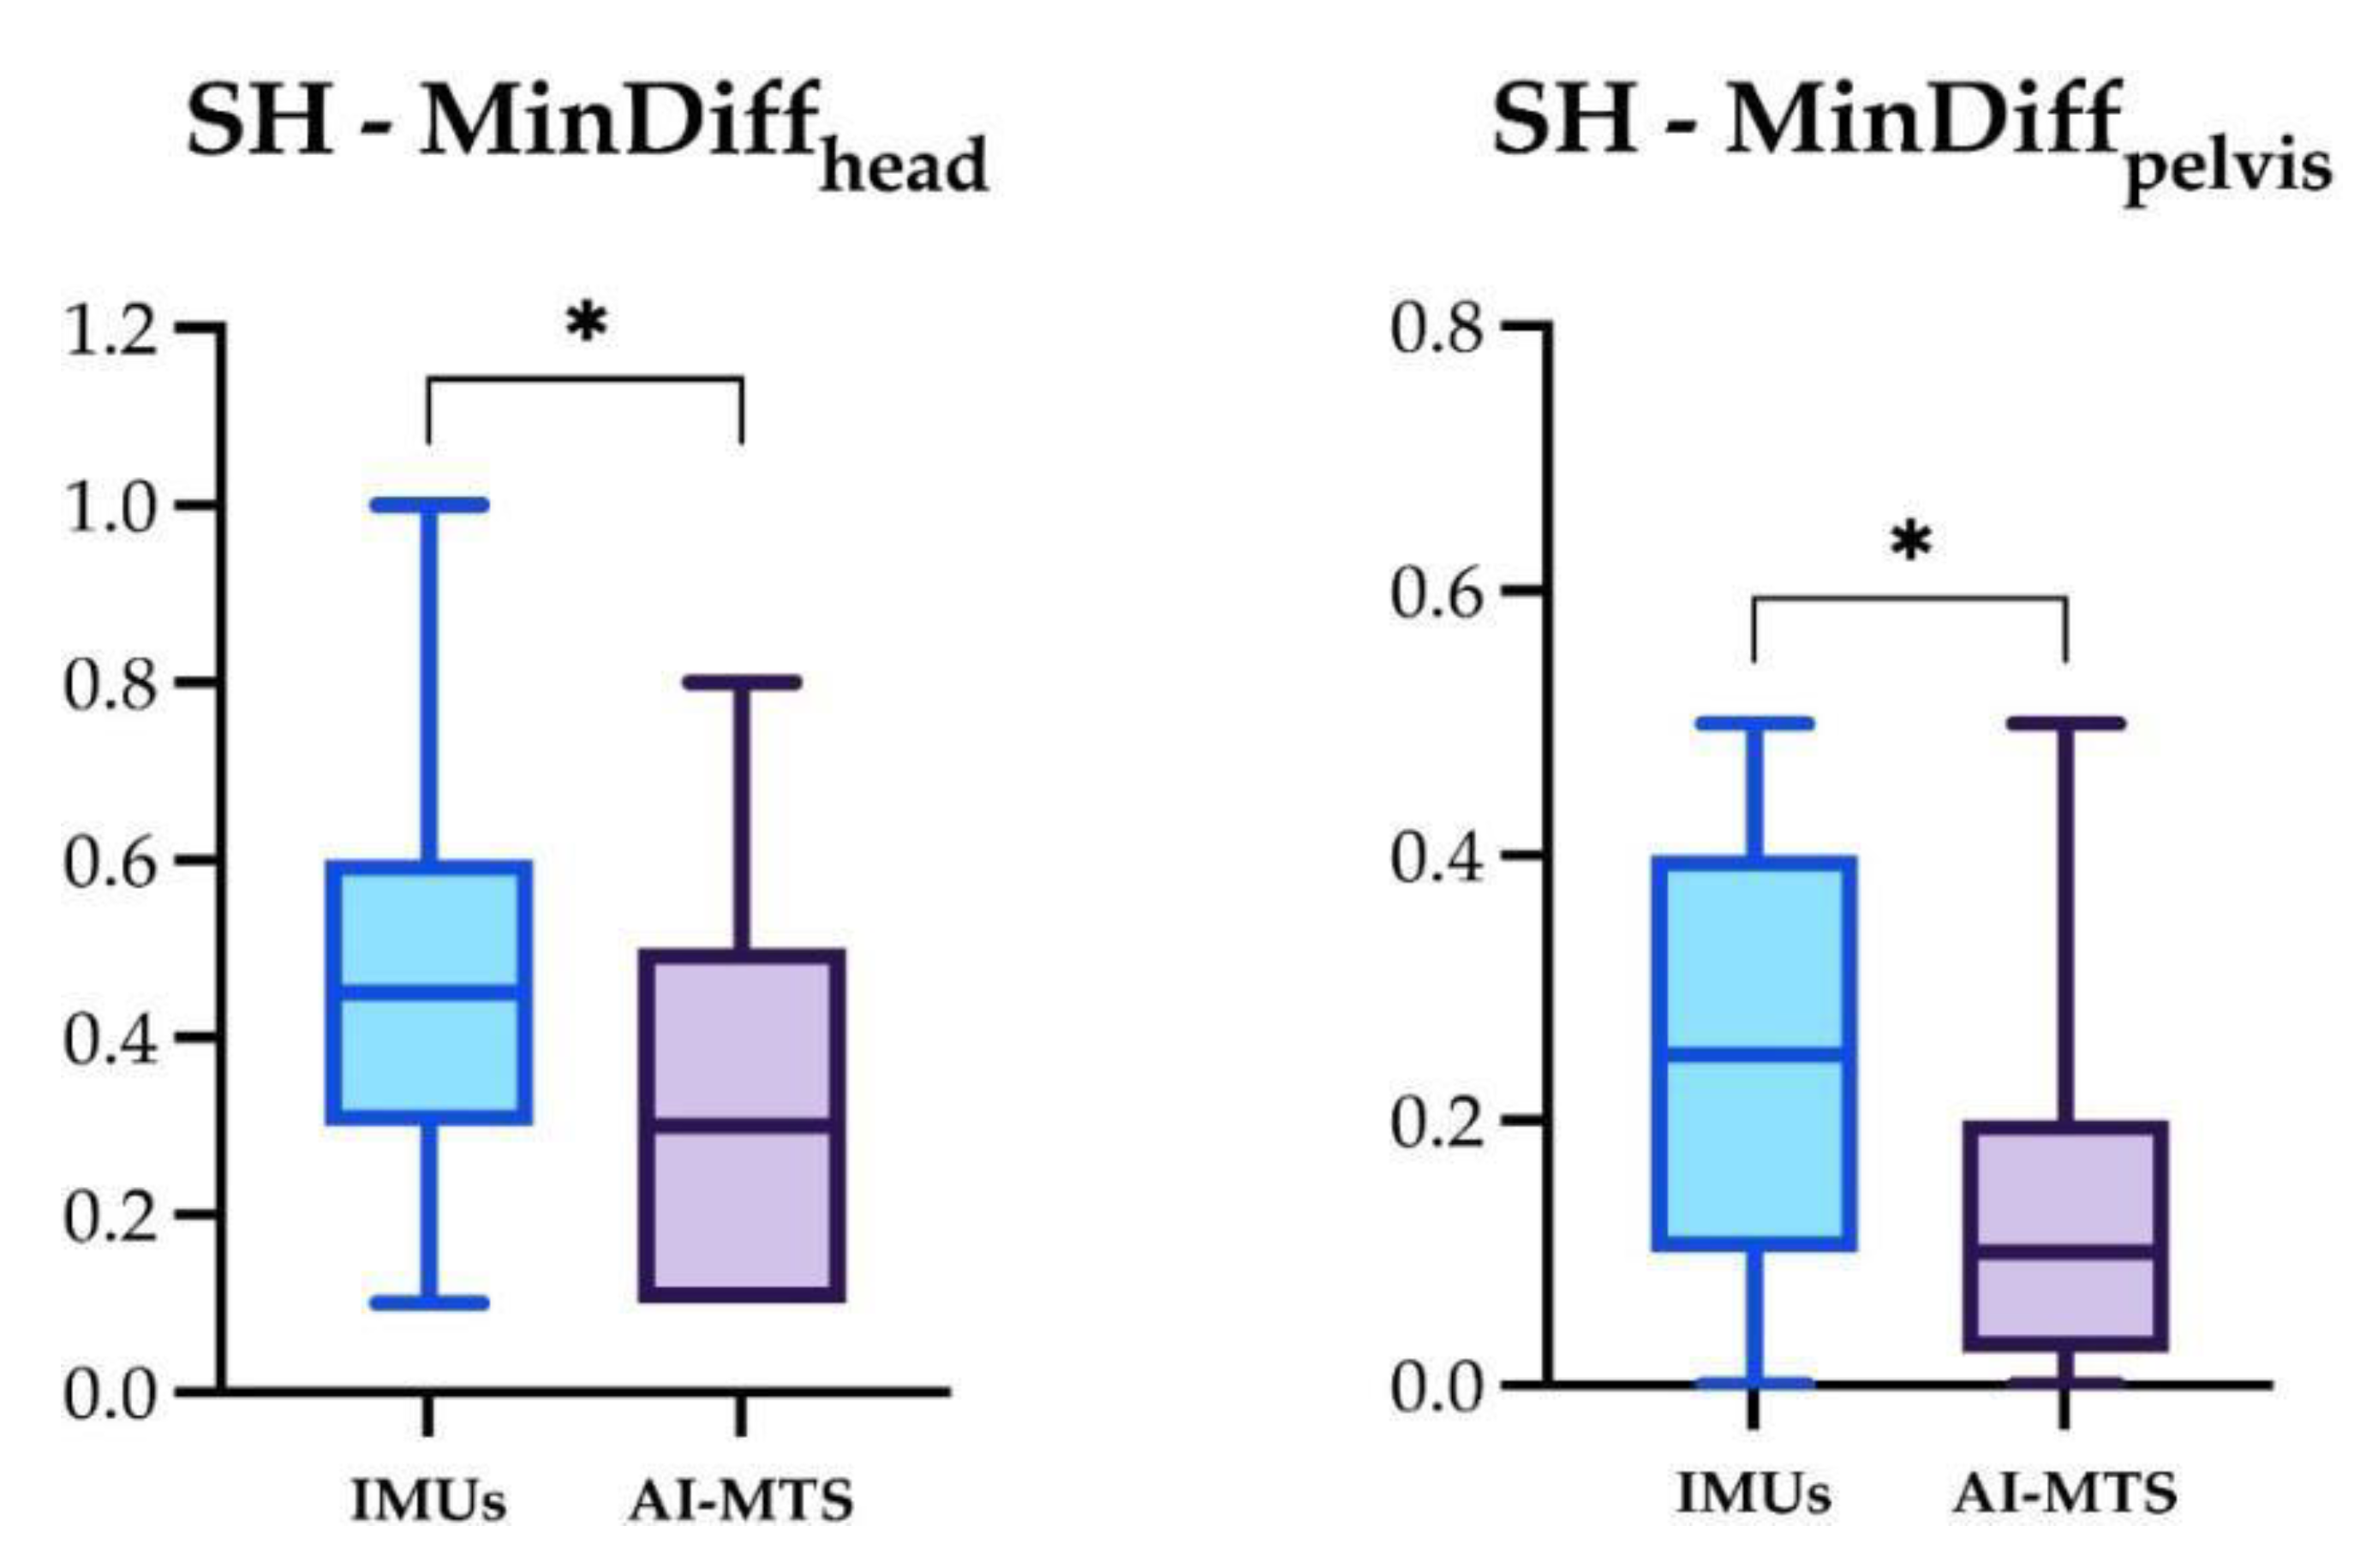
Figure 8.
Box and Whiskers plot, showing median, interquartile range and total range of the MinDiffhead measured by the two gait analysis systems (IMUs and AI-MTS) during the straight soft (SS) assessment. Statistical significance was set as *(p < 0.05).
Figure 8.
Box and Whiskers plot, showing median, interquartile range and total range of the MinDiffhead measured by the two gait analysis systems (IMUs and AI-MTS) during the straight soft (SS) assessment. Statistical significance was set as *(p < 0.05).
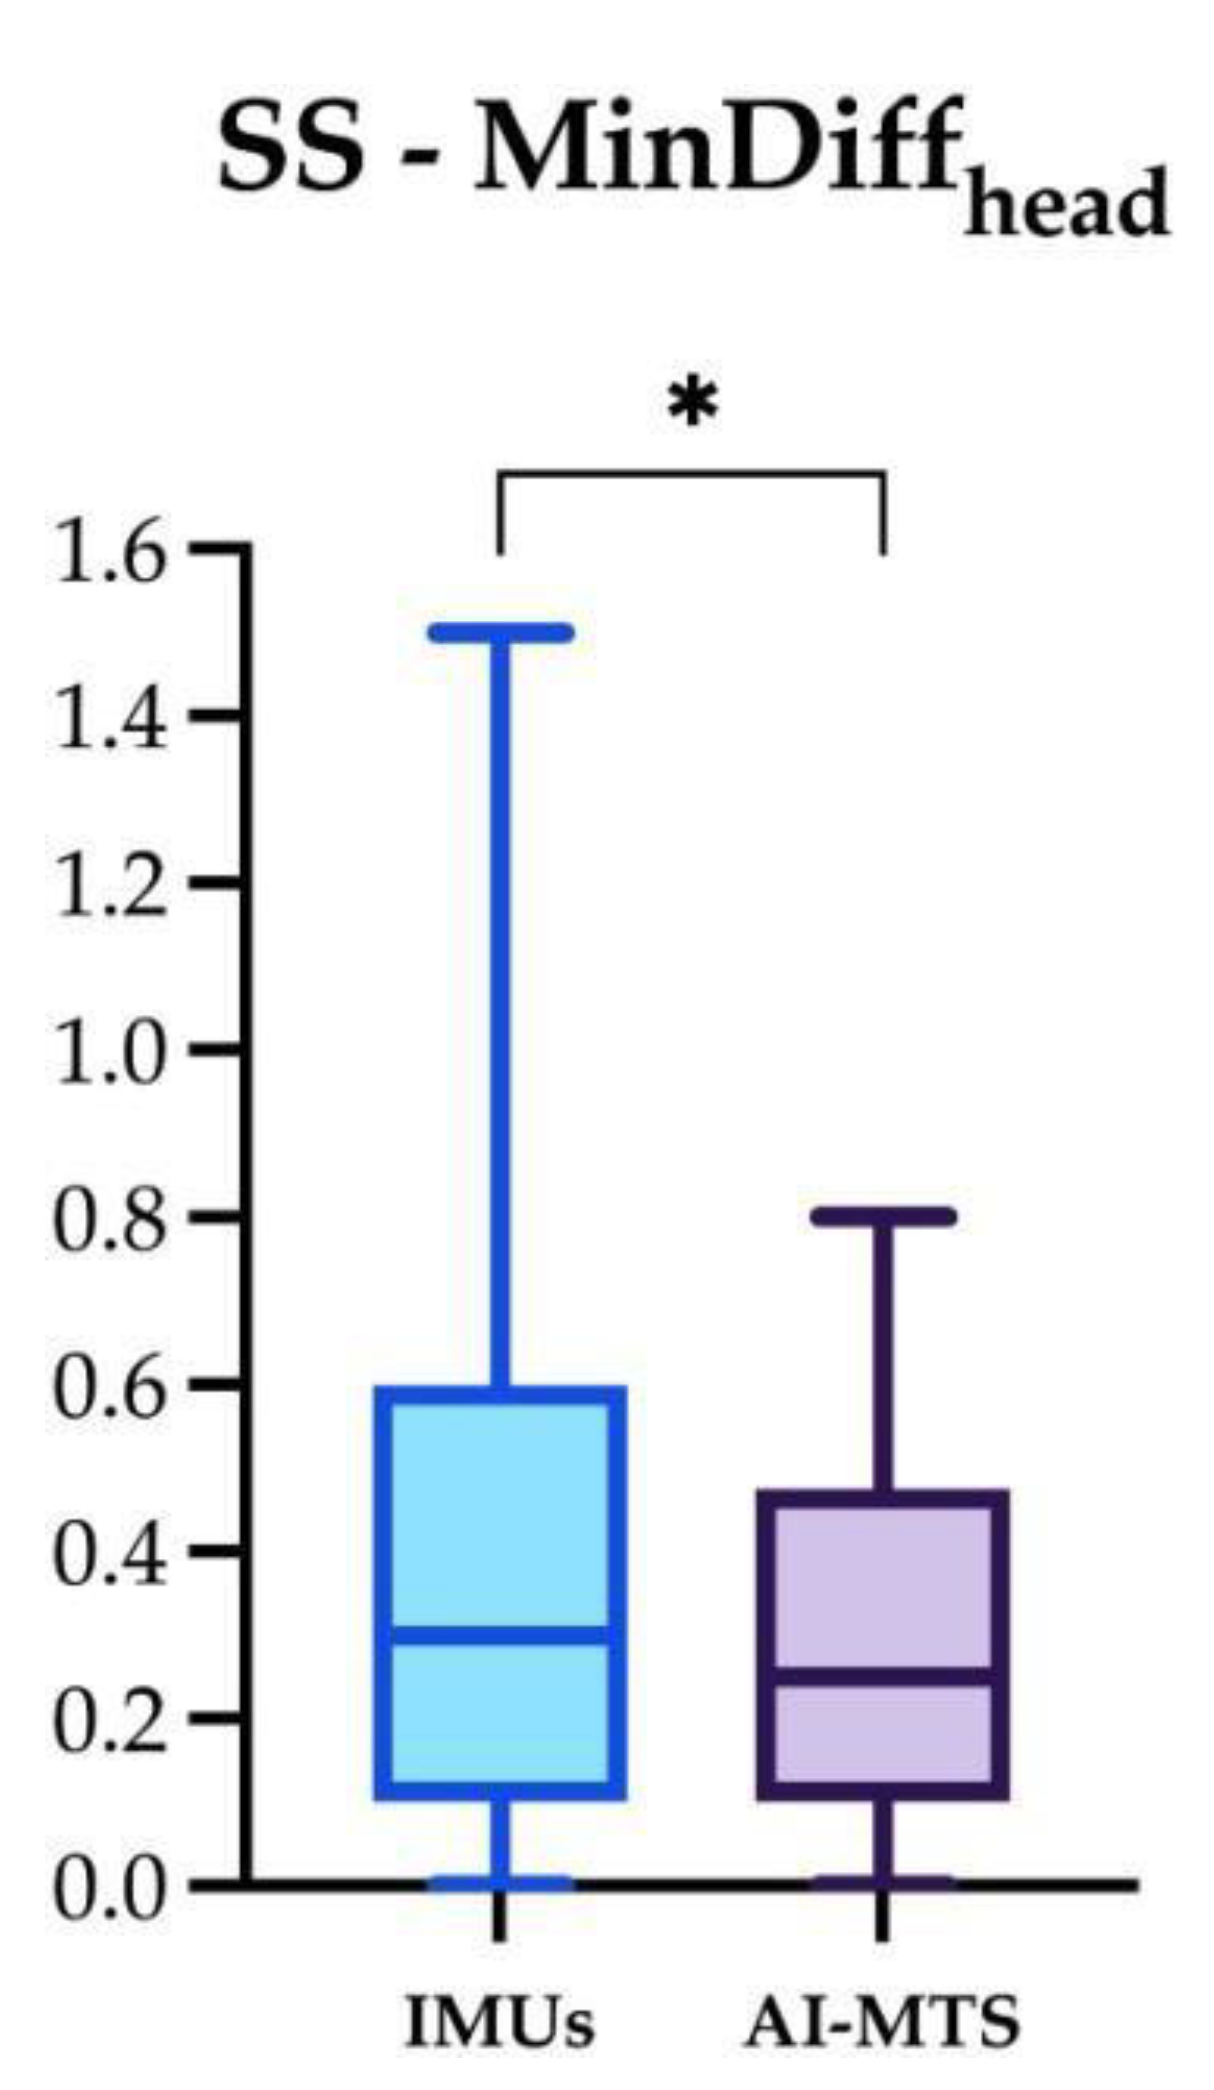
Figure 9.
Box and Whiskers plot, showing median, interquartile range and total range of the MinDiffhead and MinDiffpelvis measured by the two gait analysis systems (IMUs and AI-MTS) during the left circle soft (LCS) assessment. Statistical significance was set as **(p < 0.01) and *** (p < 0.001).
Figure 9.
Box and Whiskers plot, showing median, interquartile range and total range of the MinDiffhead and MinDiffpelvis measured by the two gait analysis systems (IMUs and AI-MTS) during the left circle soft (LCS) assessment. Statistical significance was set as **(p < 0.01) and *** (p < 0.001).
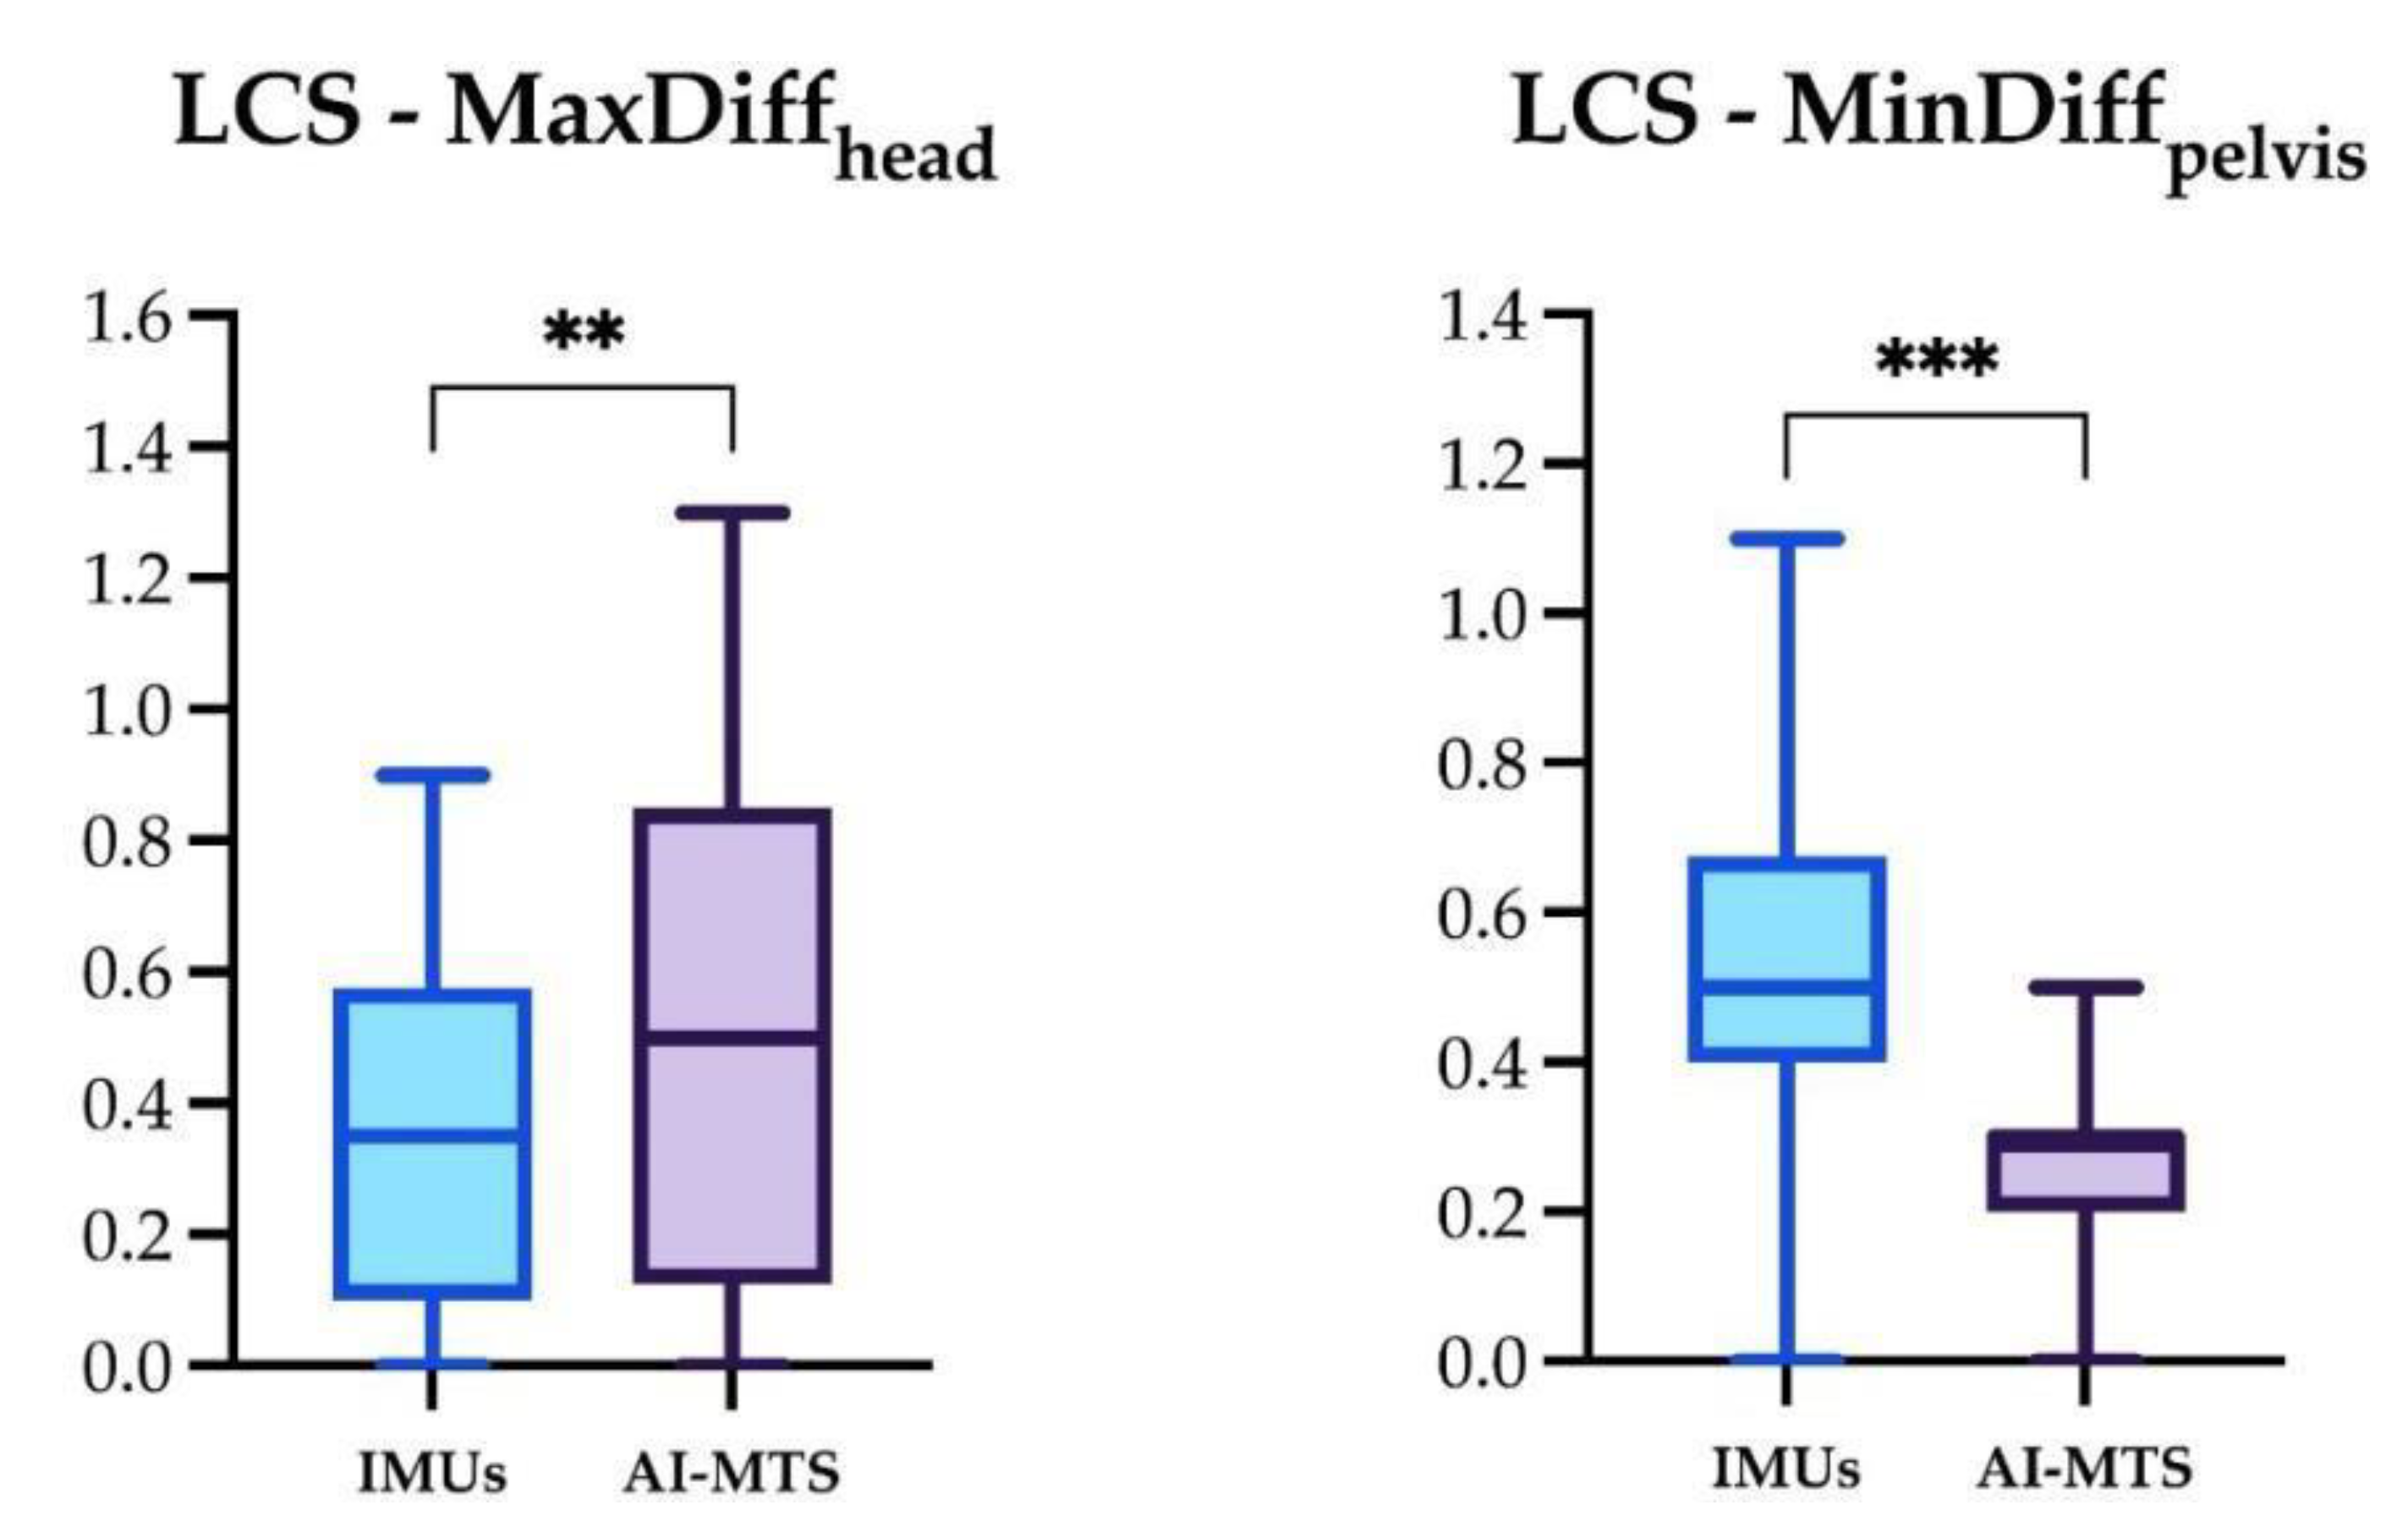
Figure 10.
Box and whiskers plot, showing median, interquartile range and total range of the locomotion parameters measured by the inertial measurement units system (IMUs) in the following trotting conditions: straight hard (SH), straight soft (SS), left and right circle hard (LCH and RCH), left and right circle soft (LCS and RCS). Statistical significance is shown as ** (p < 0.01).
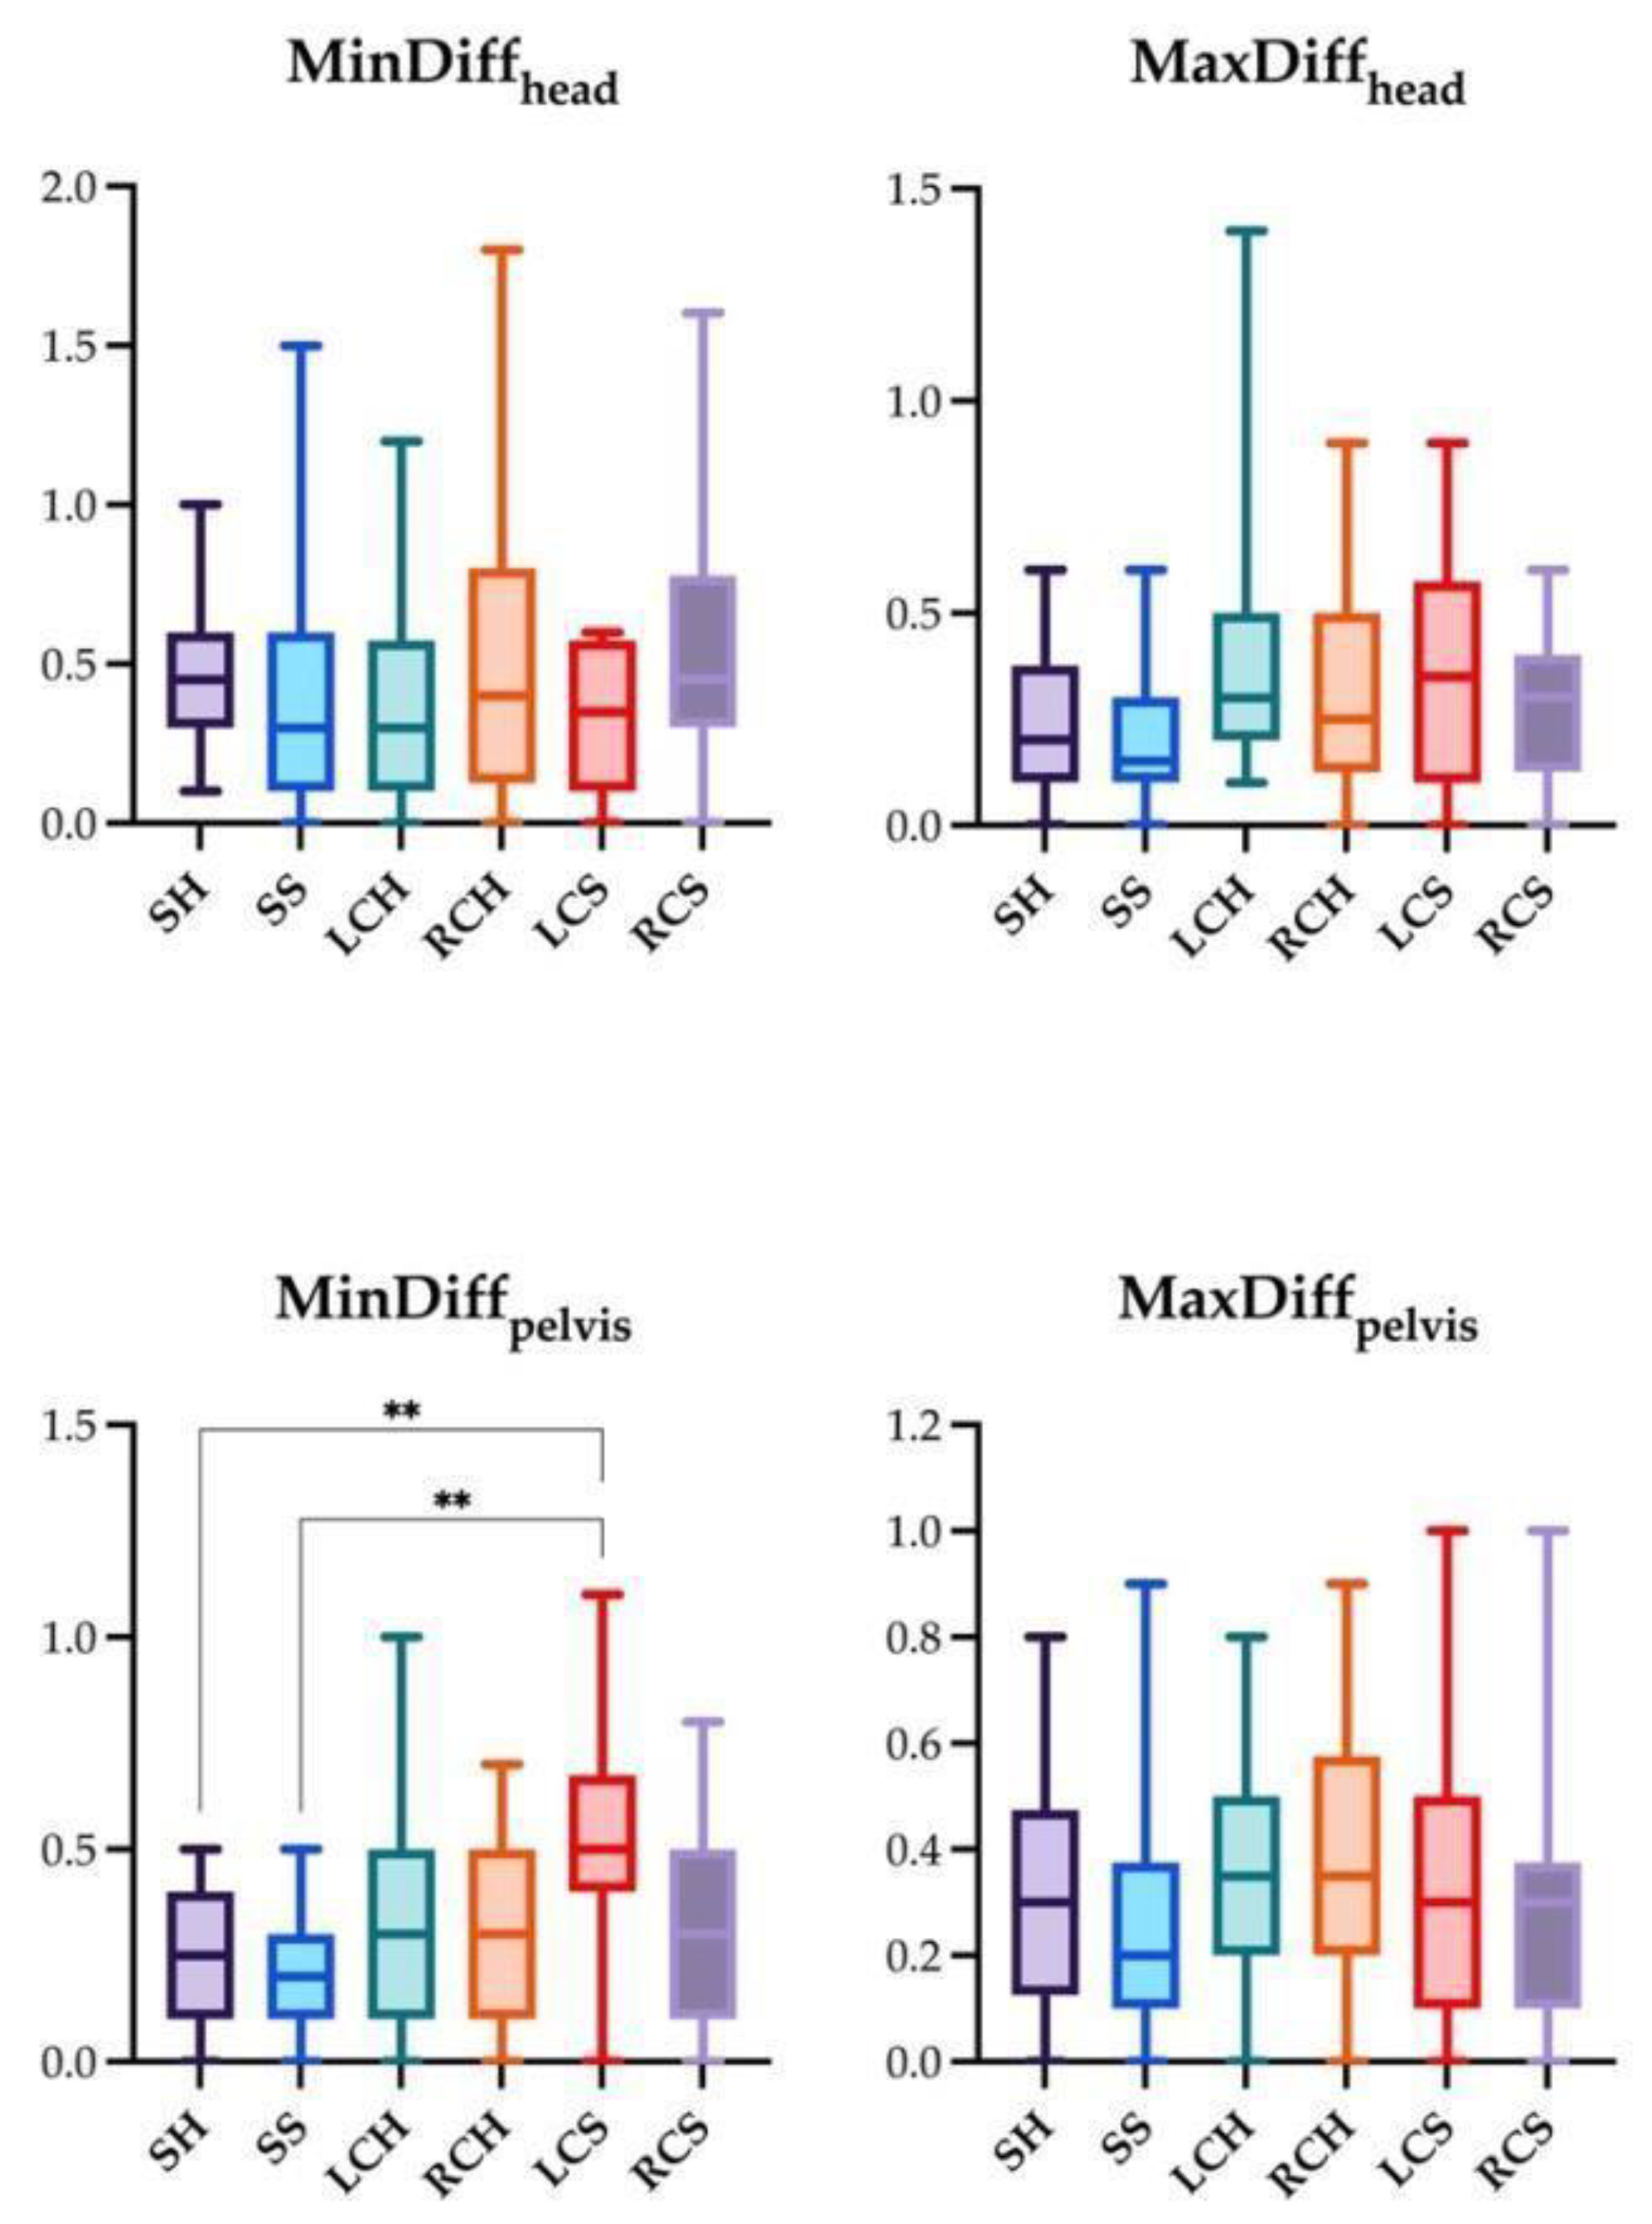
Figure 11.
Box and whiskers plot, showing median, interquartile range and total range of the locomotion parameters measured by artificial intelligence marker-less motion tracking system (AI-MTS) in the following trotting conditions: straight hard (SH), straight soft (SS), left and right circle hard (LCH and RCH), left and right circle soft (LCS and RCS). Statistical significance is shown as * (p < 0.05) and ** (p < 0.01).
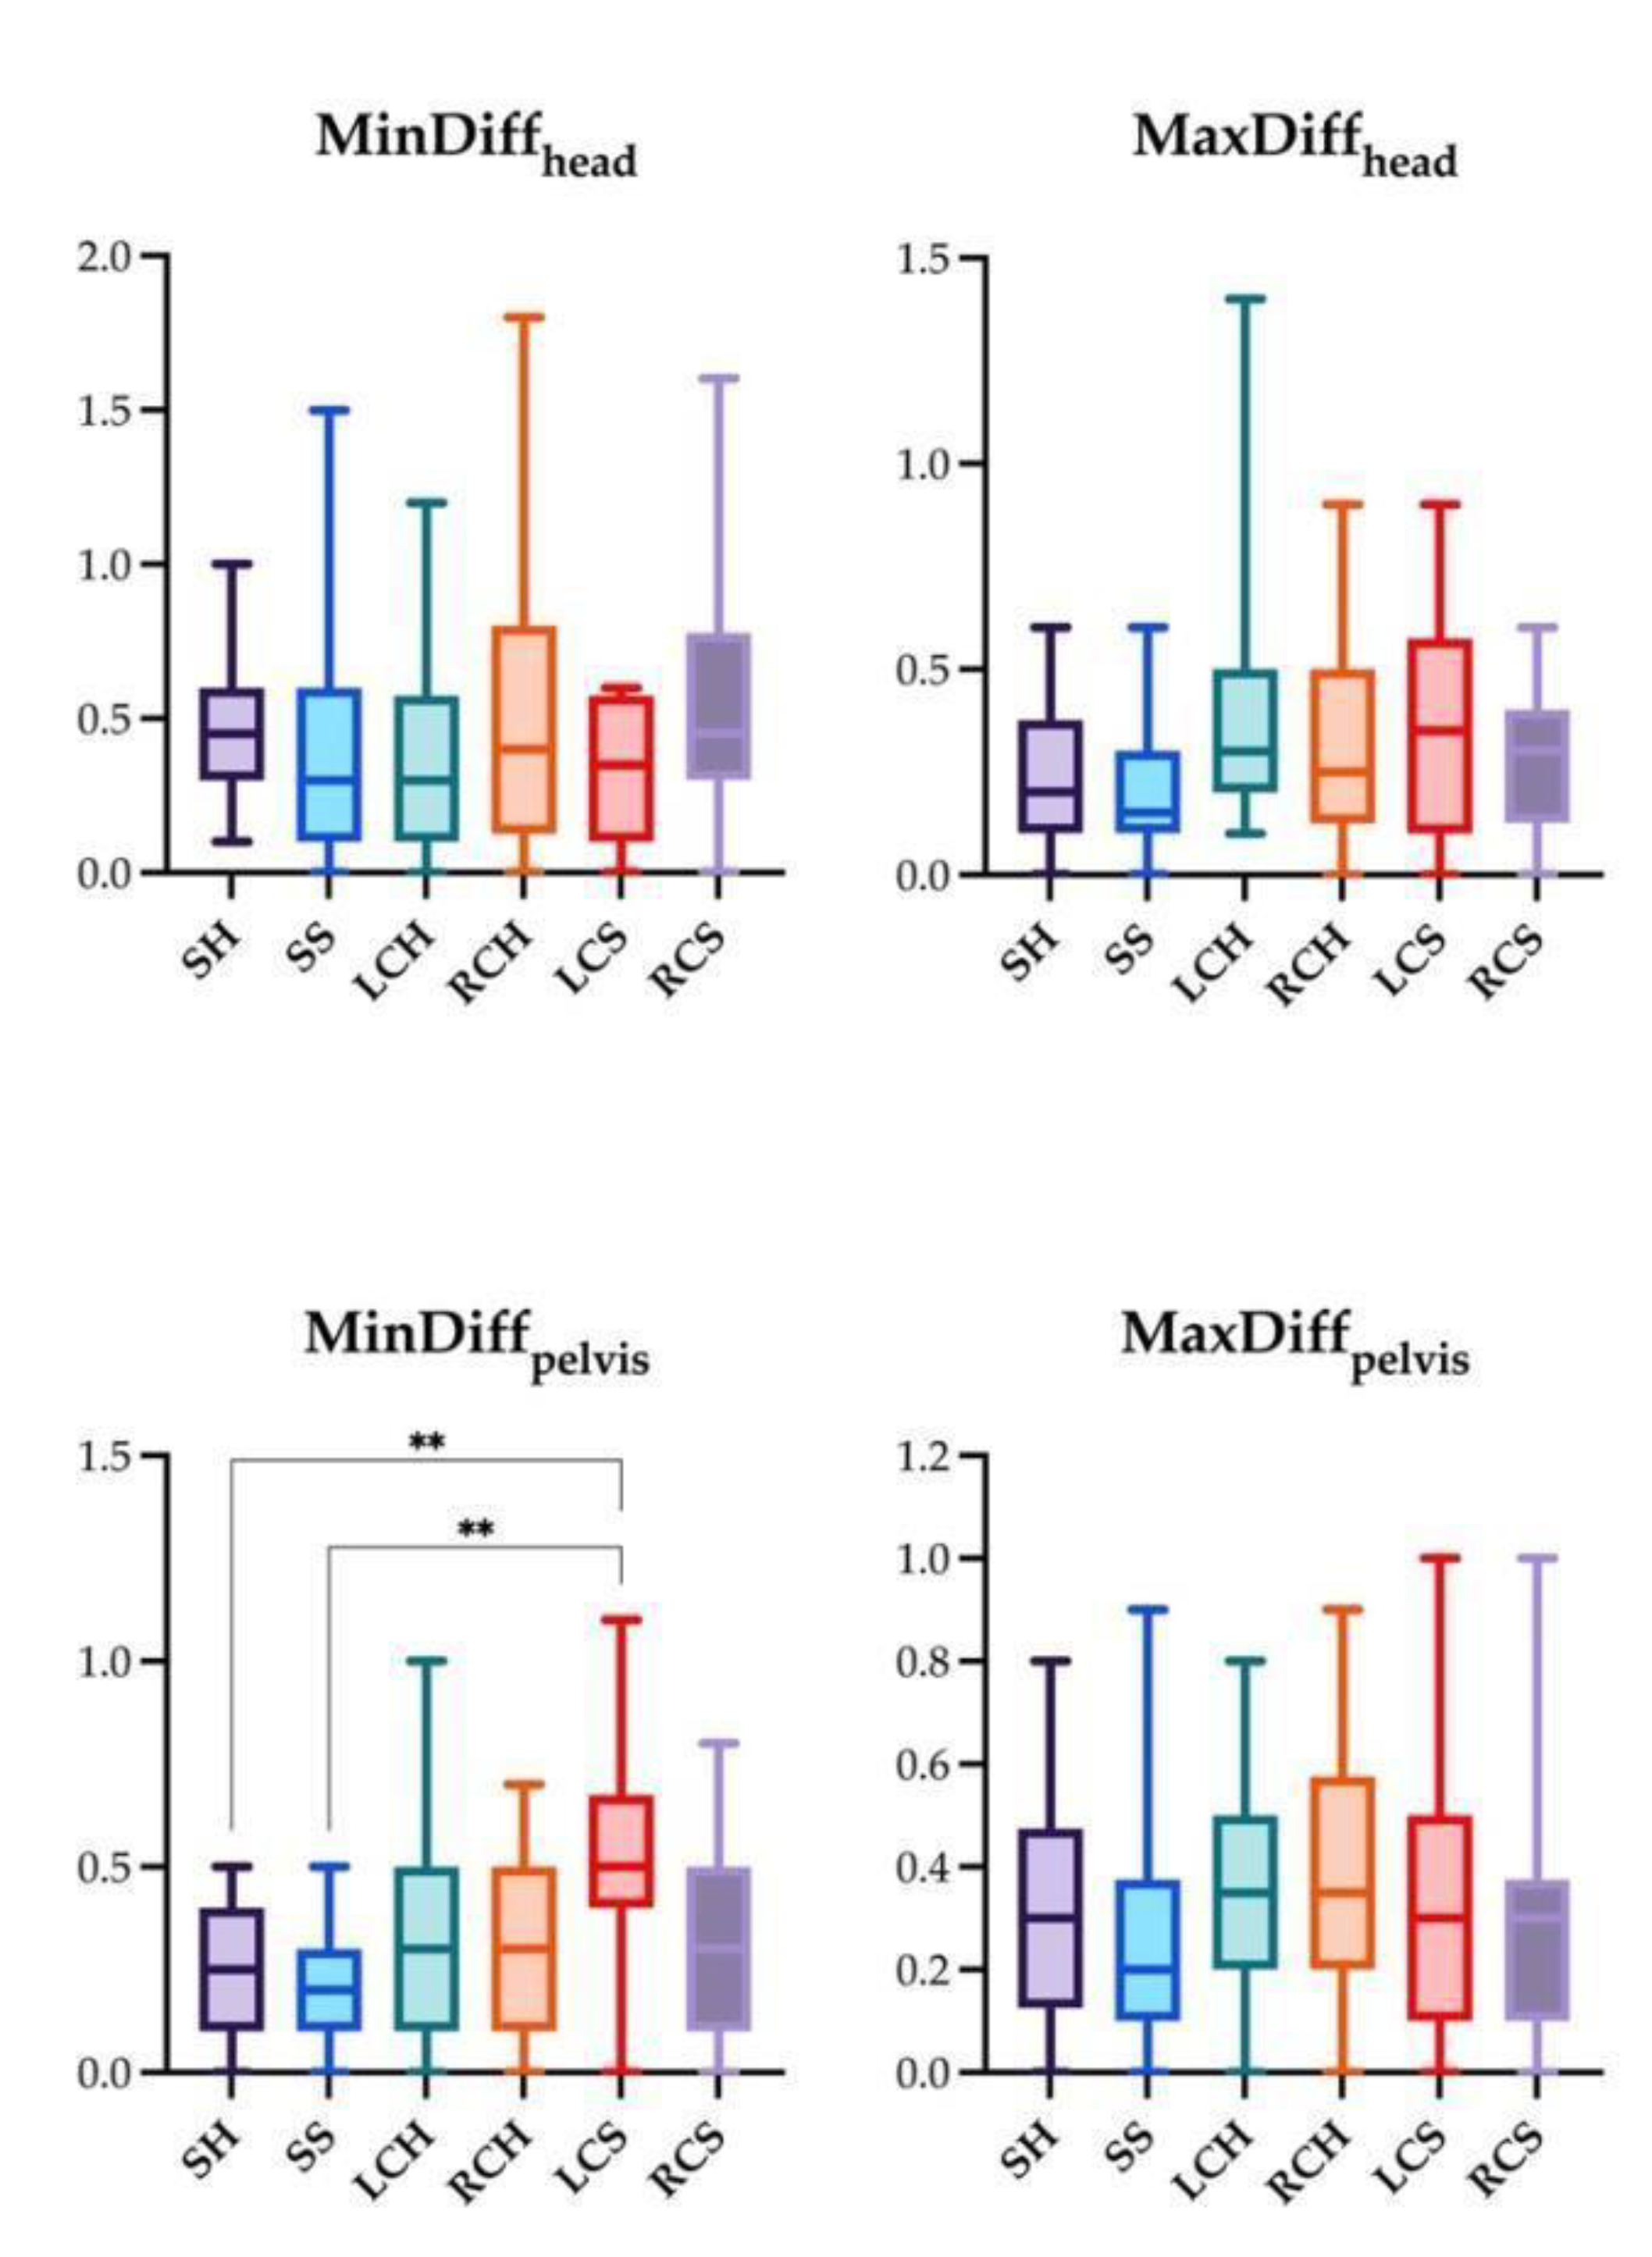

Table 1.
Lameness scoring based on clinical lameness examination, and outcomes of the inertial measurement units system (IMUs) using two sifferent cut-off values (millimeters to distinguish symmetric from asymmetric horses, and severity cut-off values), and artificial intelligence markerless motion tracking system (AI-MTS) in horses (IMUs and AI-MTS results: assessed at trot on a straight line and hard surface).
| IMUs | ||||
|---|---|---|---|---|
| Horse |
AAEP grade |
Millimeters cut-off | Severity | AI-MTS |
| 1 | RF: 2/5 | Asymmetric (FL, HL) | RF: moderate impact, very mild push-off; RH: very mild impact | RF: mild impact, mild push off; RH: very mild impact |
| 2 | Sound | Symmetric | LF: very mild impact | LF: very mild impact |
| 3 | RF: 2/5 | Asymmetric (FL) | RF: very mild impact, very mild push-off; LH: very mild push-off | RF: mild impact, very mild push-off; LH: very mild push-off |
| 4 | Sound | Asymmetric (HL) | LH: very mild impact, very mild push-off | Symmetric |
| 5 | LF: 1/5; LH: 2/5 | Asymmetric (FL, HL) | LF: mild impact, mild push-off; LH: very mild impact, mild push-off | LF: mild impact, mild push-off; LH: mild push-off |
| 6 | Sound | Symmetric | LF: very mild impact, very mild push-off; RH: mild push-off | LF: very mild impact; RH: mild push-off |
| 7 | RF: 1/5 | Asymmetric (FL) | RF: very mild impact; LF: very mild push-off; LH: very mild impact, very mild push-off |
RF: mild impact; LF: very mild push- off; RH: very mild impact; LH: very mild push-off |
| 8 | Sound | Symmetric | RF: very mild push-off | RF: very mild push-off |
| 9 | LF: 1/5 | Asymmetric (FL, HL) | LF: mild impact; LH: very mild impact, very mild push-off | LF: very mild impact |
| 10 | RF: 2/5 | Asymmetric (FL) | RF: mild impact; RH: very mild push-off | RF: very mild impact; RH: very mild impact |
| 11 | LH: 1/5 | Asymmetric (HL) | LH: very mild impact., very mild push-off | LH: very mild push-off |
| 12 | Sound | Asymmetric (HL) | LF: very mild impact; RH: very mild impact | LF: very mild impact |
| 13 | LF: 1/5 | Asymmetric (FL) | LF: mild impact | LF: very mild impact, very mild push-off; RH: very mild impact |
| 14 | LH: 1/5 | Asymmetric (HL) | LH: very mild impact, mild push-off | LH: very mild impact, very mild push-off |
| 15 | Sound | Asymmetric (FL) | RF: very mild impact | RH: very mild impact |
| 16 | RF: 1/5 | Asymmetric (FL) | RF: mild impact, mild push-off | RF: very mild impact, very mild push-off |
| 17 | LF: 1/1 | Symmetric | LF: very mild impact; LH: very mild push-off | LF: very mild impact; LH: very mild push-off |
| 18 | Sound | Symmetric | RF: very mild impact; LF: very mild push-off; LH: very mild impact | RF: very mild impact; RH: very mild push-off |
| 19 | Sound | Asymmetric (HL) | LF: very mild impact; RH: very mild push-off; LH: very mild impact | RH: very mild push-off |
| 20 | Sound | Symmetric | LF: very mild impact; RH: mild push-off | RH: very mild push-off; LH: very mild impact |
FL = forelimb, HL = hindlimb, RF = right forelimb, LF = left forelimb, RH = right hindlimb, LH = left hindlimb.
Table 2.
K Cohen coefficients of agreement between inertial measurement units system (IMUs) and an artificial intelligence motion tracking system (AI-MTS) in the following assessment conditions: straight hard (SH), straight soft (SS), left circle hard (LCH), left circle soft (LCS), right circle hard (RCH), and right circle soft (RCS).
| Locomotion parameters | SH | SS | LCH | LCS | RCH | RCS |
|---|---|---|---|---|---|---|
| MinDiffhead | 0.80 | 0.65 | 0.58 | 0.53 | 0.67 | 0.60 |
| MaxDiffhead | 0.55 | 0.25 | 0.54 | 0.54 | 0.74 | 0.77 |
| MinDiffpelvis | 0.12 | 0.08 | 0.35 | 0.17 | 0.47 | 0.59 |
| MaxDiffpelvis | 0.50 | 0.51 | 0.49 | 0.68 | 0.69 | 0.63 |
Table 3.
Number of valid strides recorded by the inertial measurement units system (IMUs) and the artificial intelligence motion tracking system (AI-MTS) in the different assessment conditions (SH, SS, LCH, RCH, LCS, RCS). Data are expressed as mean ± SD. Data in rows with different superscript letters are significantly different from each other (p <0.05).
| Assessment condition | IMUs | AI-MTS | |
|---|---|---|---|
| Forelimbs | Hindlimbs | ||
| Straight hard (SH) | 23 ± 7b | 34 ± 9a | 21 ± 7b |
| Straight soft (SS) | 21 ± 6a | 25 ± 6a | 16 ± 4b |
| Left circle hard (LCH) | 28 ± 11c | 44 ± 14a | 37 ± 11b |
| Left circle soft (LCS) | 30 ± 9b | 40 ± 16a | 34 ± 11b |
| Right circle hard (RCH) | 29 ± 12c | 48 ± 9a | 36 ± 8b |
| Right circle soft (RCS) | 29 ± 12b | 42 ± 15a | 35 ± 10b |
Disclaimer/Publisher’s Note: The statements, opinions and data contained in all publications are solely those of the individual author(s) and contributor(s) and not of MDPI and/or the editor(s). MDPI and/or the editor(s) disclaim responsibility for any injury to people or property resulting from any ideas, methods, instructions or products referred to in the content. |
© 2024 by the authors. Licensee MDPI, Basel, Switzerland. This article is an open access article distributed under the terms and conditions of the Creative Commons Attribution (CC BY) license (http://creativecommons.org/licenses/by/4.0/).
Copyright: This open access article is published under a Creative Commons CC BY 4.0 license, which permit the free download, distribution, and reuse, provided that the author and preprint are cited in any reuse.


