1. Introduction
For many engineering applications it is sufficient to use the concept of simple materials [
1] that includes only first gradients of the kinematical variables. However, in various fields modern continuum mechanics is also driven by applications that include higher gradients [
2]. This is particular true for materials with micro-structure, functionally graded materials, and metamaterials [
3,
4,
5,
6,
7,
8]. Furthermore, finite gradient plasticity [
8,
9] and theories for gradient fluids [
10,
11,
12] became blossoming fields of research in the last decades. Because of the broad range of research in this field, the list of references is restricted to recent publications. For this reason the latter is far away from being complete. The author therefore apologize to any colleague not mentioned in spite of their important contributions to academic and/or applied research on gradient materials.
The same holds for theories that have been developed for vibrational problems and wave propagation. A comprehensive overview on formulations is given in [
13]. In this reference so called dynamically consistent models based on at least two length scale parameter are discussed. In particular it is shown that one scalar length scale parameter in combination with strain gradients is relevant for statics, while a second one can, in combination with acceleration gradients, be added for use in dynamics. A purely strain gradient approach using three different length scale parameter that has been applied longitudinal vibration analysis of microbars has been proposed in [
14].
Analytical solutions for thermal vibrations of strain gradient beams considering one internal length scale parameter for the strain gradient have been reported in [
15]. Furthermore, optimal vibration control of gradient materials based on a dynamically consistent approach with two length scale parameter has been studied in [
16].
However, even if sophisticated and thermodynamically consistent material models can be established there are still not yet standard experiments to determine length scale parameter or higher order material constants [
17]. To solve this problem it is possible to apply atomistic simulation approaches [
18]. An alternative approach is the application of system identification approaches that have been established in the theory of mechanical vibrations. For simple materials system identification based on resonance measurements has been proposed [
19,
20]. Recently an inverse identification approach based on results of impulse response measurements has been proposed in [
21].
It is obvious that especially for linear time-invariant (LTI) systems that are composed of structures described by material models considering higher gradients of the kinematical variables the question of system identification needs further discussion. To contribute to this discussion is the motivation for the present paper. In order to avoid restrictions, the presented approach is embedded into a thermodynamically consistent continuum theory of second-order gradient materials [
2] without further specification of internal micro-structures or length scales that are linked to specific strain or acceleration gradients. This allows for a consistent formulation of the governing equations of LTI-systems using longitudinal vibrations in one-dimensional wave guides as an illustrative example. Such systems can be identified by adaptive filtering considering self-adaptive identification schemas based on the least mean square (LMS) algorithm [
22]. To the best knowledge of the author this paper reports for the first time on the application of adaptive filtering for system identification considering second-order gradient materials.
The paper is structured as follows: All aspects of material modelling, necessary to describe and investigate longitudinal vibrations of one-dimensional wave guides considering both simple materials and second-order gradient materials are described in section 2. The associated numerical models as well as the principle of adaptive filtering applied in this paper are presented in section 3, while results of numerical simulations and discussion of the dynamical behavior are presented in section 4. The main findings are summarized in the conclusions, sections 5.
2. Continuum Models for One-Dimensional Wave Guides Based on Linear Elasticity
The dynamical behavior will be analyzed for elastic materials considering only geometrically linear theories also kwon as theories of small deformations, compare [
1]. As a consequence it is not necessary to distinguish between the current placement and the reference placement. The same holds for operators such as
grad,
div, and
curl that are related to the gradient, divergence and curl operation of a vector field. The analysis will be limited to the use of Cartesian coordinates and isotropic materials. Furthermore, specific body field forces will be neglected.
2.1. Modeling Longitudinal Vibrations Considering Simple Materials
Following the framework presented in [
2], the local balance of linear momentum for simple materials reads
where
is the displacement field,
is the acceleration field (both vectors are depending on space and time), and
is the density. Furthermore,
is the first and
is the second LAMÉ constant, respectively. If the displacement field is given by
where
is the unit vector in
x-direction, it is straight forward to show that the local balance of linear momentum is represented by the (classical) wave equation
in which the speed of sound
is defined by the relation of YOUNGS’s modulus
and density. Considering time-harmonic fluctuations of all quantities equation (3) can be solved considering proper boundary conditions, compare [
13,
14,
15,
16], in order to derive natural frequencies as well as the associated mode shapes.
2.2. Modeling Longitudinal Vibrations Considering Second-Order Gradient Linear Elasticity
If isotropic material behavior as well as linear elasticity is assumed for a second-order gradient material, the local balance of linear momentum becomes more sophisticated. According to [
2] the following form can be derived that contains six additional material constants (
)
In contrast to equation (1) higher gradients of the displacement field can be found in the third, fourth, and fifth term on the left hand side of equation (4). It should be noticed that, in contrast to the formulations used in [
13,
14,
15,
16], a parameter describing an internal length scale has not been introduced. Thus, all terms containing higher gradients of the displacement field are linked to material properties, described by material constants. This results from the fact that equation (4) is embedded into a thermodynamically consistent theory of second-order gradient material behavior. If the displacement field is again described by equation (2), the local balance of linear momentum is reduced to
Because the displacement field is given by equation (2), the material constant
is not present in equation (5) that can be rearranged such as
where
describes a combination of the relevant material constants. If
vanishes, equation (6) reduces to the classical wave equation, compare equation (3), that is used to describe the dynamical behavior of simple materials. Please notice that equation (6) still describes longitudinal vibrations.
In order to derive an analytical solution for equation (6), time-harmonic fluctuation of the displacement field is assumed, such as
where
is the spatial distribution of the displacement field and
is the associated angular frequency. Considering equation (7) it is possible to derive a frequency-domain representation, such as
where
is known as the wave number. If
vanishes, equation (8) reduces to the well-known HELMHOLTZ-equation. For a special set of boundary conditions such as
in combination with
, where
is the total length of the wave guide, the ansatz
is valid to calculate natural frequencies. Equation (9) describes the superposition of harmonic mode shapes considering arbitrary constants
for each
n-th vibrational mode. It is straight forward to show that inserting equation (9) into equation (8) yields
where
is the
n-th natural frequency. The result presented in equation (10) is in agreement to the results presented in [
13,
14,
15,
16]. If
vanishes, equation (10) reduces to the solution known for simple materials that are described by equation (3) and boundary conditions such as
. The solution presented in equation (10) includes the influence of the higher material constants that are combined in
on the natural frequencies. This influence increases, if the total length of the wave guide
decreases. If higher gradients of the displacements have to be taken into account the
n-the natural frequency is increased by the term
compared to the classical theory.
3. Numerical Models for One-Dimensional Continua and Self-Adaptive Filtering
In the previous section linear elastic material behavior has been modeled for simple as well as second-order gradient materials. The models can be used to analyze longitudinal vibrations of one-dimensional wave guides considering one specific set of boundary conditions. In order to study the potential of self-adaptive filtering for system identification applied to second-order gradient materials, numerical models have been used to generate a data base. The upcoming section reports on simple numerical modelling of the material behavior. Furthermore, the method for self-adaptive filtering used for system identification is summarized.
3.1. Finite Difference Models for Linear Elastic Materials
In order to generate data that are required for system identification, simple numerical models based on the finite difference method (FDM) have been established. The FDM is well-documented [
23] and still an effective approach to boundary value problems [
24].
It is of course also possible to use other approaches to computational continuum mechanics such as the finite element method [
23], but the FDM is a straight forward approach that is sufficient to generate reliable numerical data that can be used for adaptive filtering. To ease the numerical approach a damping term has been introduced at the right hand side of equation (6), such as
where
is a viscosity parameter that in combination with the first time-derivative of the displacement field
allows for considering velocity proportional damping. The influence of physical damping on the numerical stability is discussed since decades. However, it has been found that the analysis becomes unconditionally stable for extremely high linear-viscous damping, and that in adjusting the details of time integrations schemas, physical damping should be taken into account to eliminate higher erroneous modes, compare [
25].
In order to discretize equation (11) in time and space well-known finite difference formulas, compare [
23,
24], have been applied. These formulas are given by
where the index
n describes a discrete time step, while the index
m represents a certain position inside the calculation domain. The time step size is given by
, and the special discretization is defined by
. Inserting the formulas presented in equation (12) into equation (11) yields, considering causality, to an algebraic equation that has to be evaluated for every spatial point
m at every time step
n inside the calculation domain
Please notice that the boundary condition that have been used in the previous subsection have to be applied properly following the approaches described in [
23,
24]. Equation (13) represents a simple numerical model that can easily be implemented and solved using an ordinary personal computer. The second term on the right hand side of equation (13) represents the influence of the second-order gradient effects, while the first and the third term would also appear for a simple material.
3.2. Plant Modelling Using Self-Adaptive Finite Impulse Response Filter
Using the numerical data it is possible to analyze the potential of system identification based on adaptive filtering and the application of the LMS algorithm [
22]. In the present study the so called normalized NLMS [
26] will be applied. The main idea of this approach will be outlined in this subsection. Let's consider a time-discrete LTI-system with input signal
(called reference signal) and output signal
(called desired signal). Both signals can be measured for every
n-th time step and therefore be used to define an error signal such as
where the
column matrix
contains the
coefficients of a time-varying finite impulse response (FIR) filter at the
n-th time step such as
The signal
y, compare equation (14), represents a model of the desired signal and results from the discrete convolution of the adaptive FIR filter
, given in equation (15), with the last
coefficients of the reference signal
Please notice that the number of filter coefficients (filter length)
defines the number of samples that have to be taken into account for the reference signal, as shown in equation (16). Based on the instantaneous error signal it is possible to define cost function such as
The cost function introduced in equation (17) depends quadratic on the coefficients of the adaptive FIR filter. According to [
22] and [
26] the steepest-descend method can be applied to find the global minimum of
using an update schema that is given by
where
defines the power-adaptive step size, compare [
26]. The latter is based on the instantaneous power of the reference signal normalized by the filter length
. The minimum power
is used to avoid a division by zero
As shown in [
26] the normalized step size must be limited by
to guarantee a stable filter update. Calculating the gradient of the cost function, compare equation (18), yields the NLMS update schema given in equation (20)
It is obvious that speed of adaption is reduced, if the error signal is reduced. For more details on adaptive filtering the reader is referred to the references cited in this paper.
4. Results of Numerical Simulations and Discussion of Dynamic Behavior
The numerical models that have been derived in the previous section can be used to analyze and identify the dynamics of simple materials and second-order gradient materials considering longitudinal vibrations in time-domain as well as in frequency-domain. Because system identification based on the NLMS is organized in time-domain the discussion focusses on the results of discrete-time simulations. In the upcoming section the system response is discussed considering input signals such as (i) the unit impulse, (ii) time-harmonic excitation, and (iii) band-limited noise.
Parameter that have been used in all simulations are summarized in
Table 1. The remaining settings for the damping constant
, the length of the adaptive filter
, and the excitation frequency range are specified in the associated subsections. Considering simple materials it should be noticed that the convergence condition defined by Courant, Friedrichs, and Lewy, compare [
27], holds for the chosen set of simulation parameter, because
. For every simulation the input signal is prescribed at
, while the system output is determined at the 29-th grid point.
4.1. Impule Response of Simple Materials and Second-Order Gradient Materials
In a first step the response to a unit impulse input at the position
has been analyzed considering boundary conditions such as
In addition to the boundary condition listed in equation (21) the damping parameter has been set to
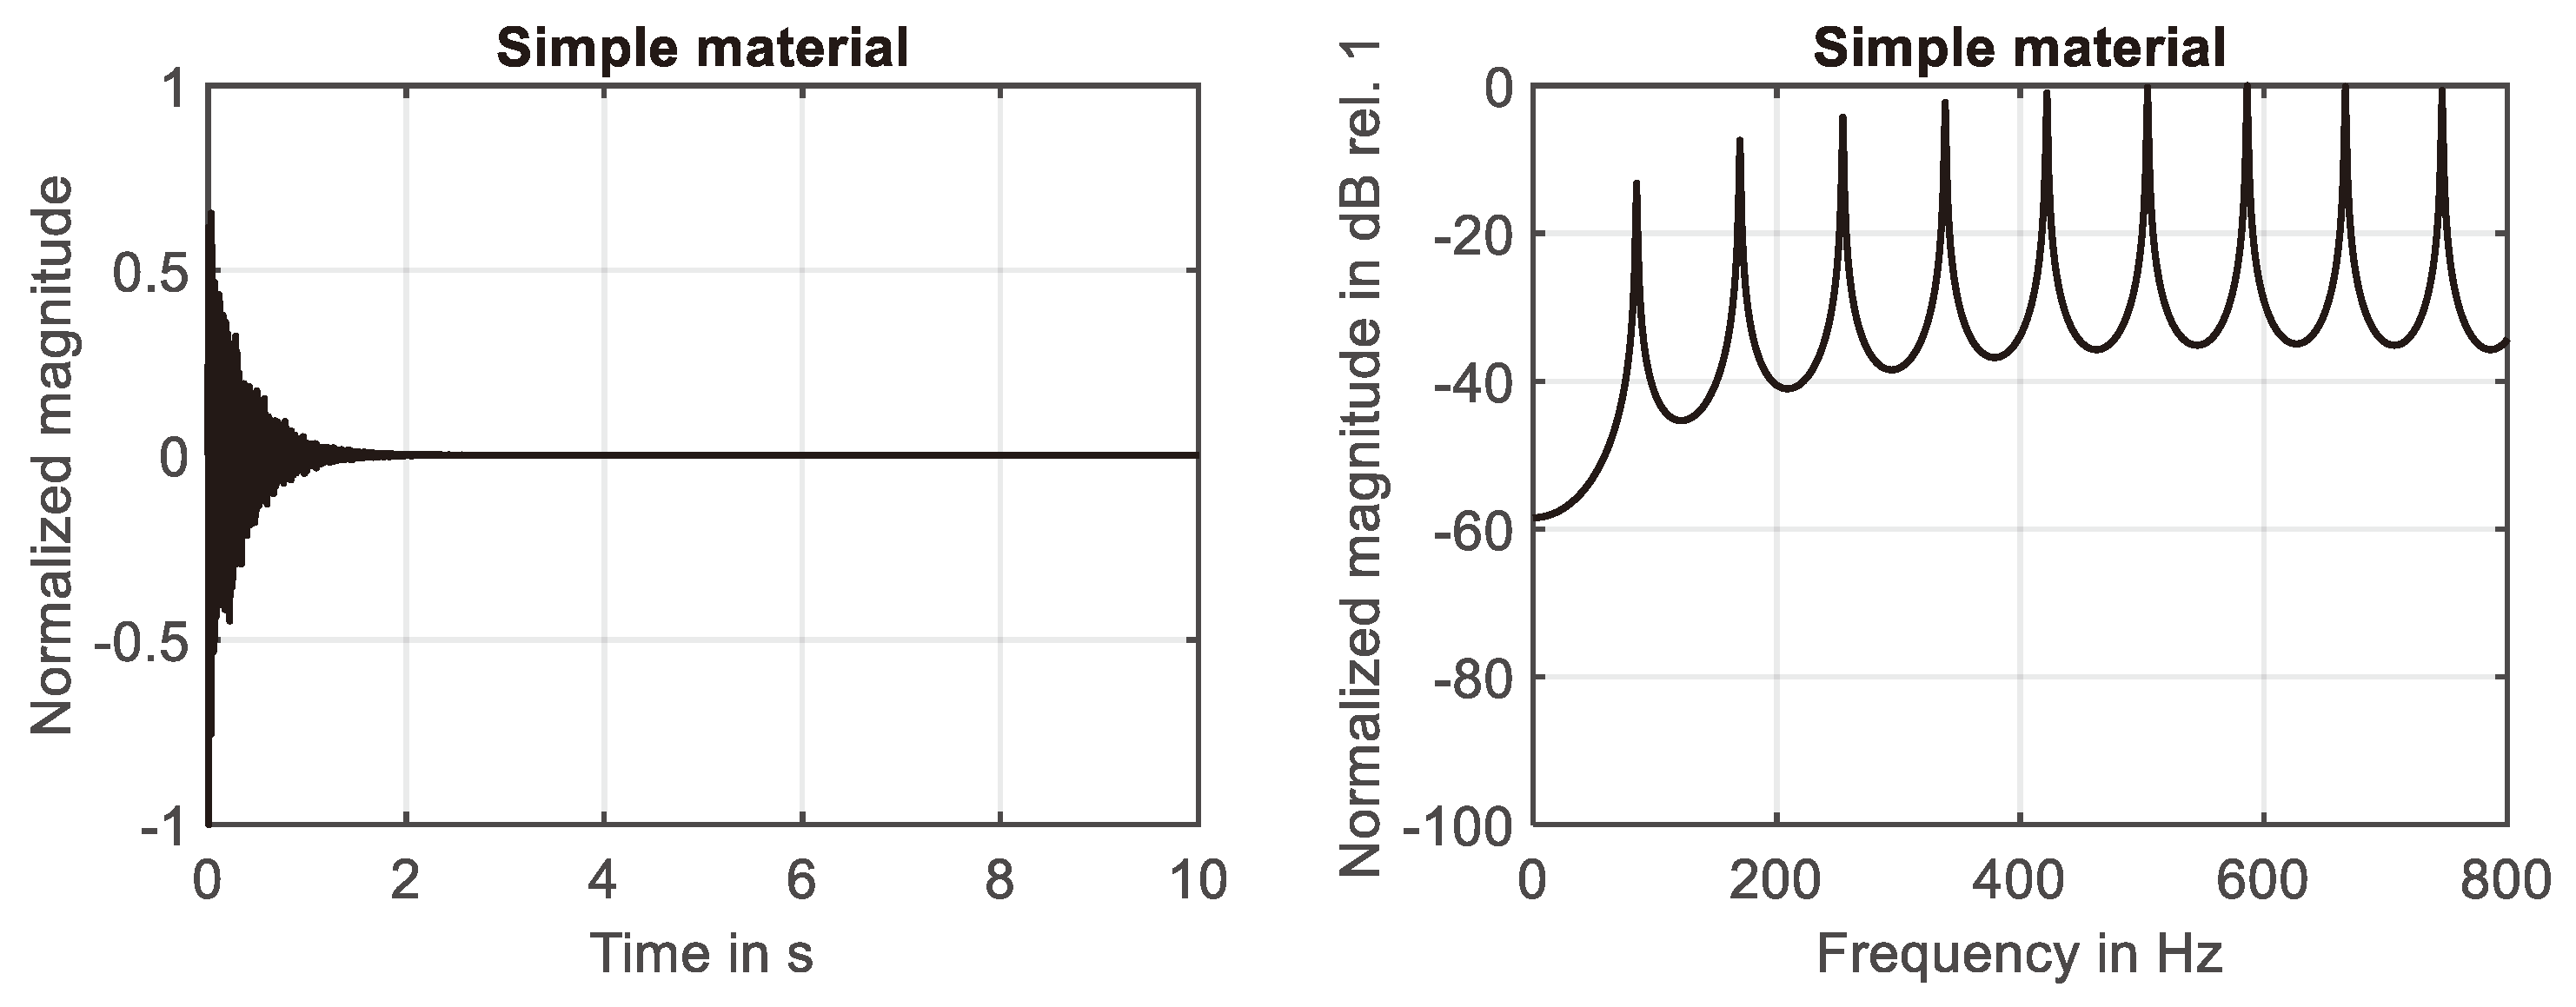
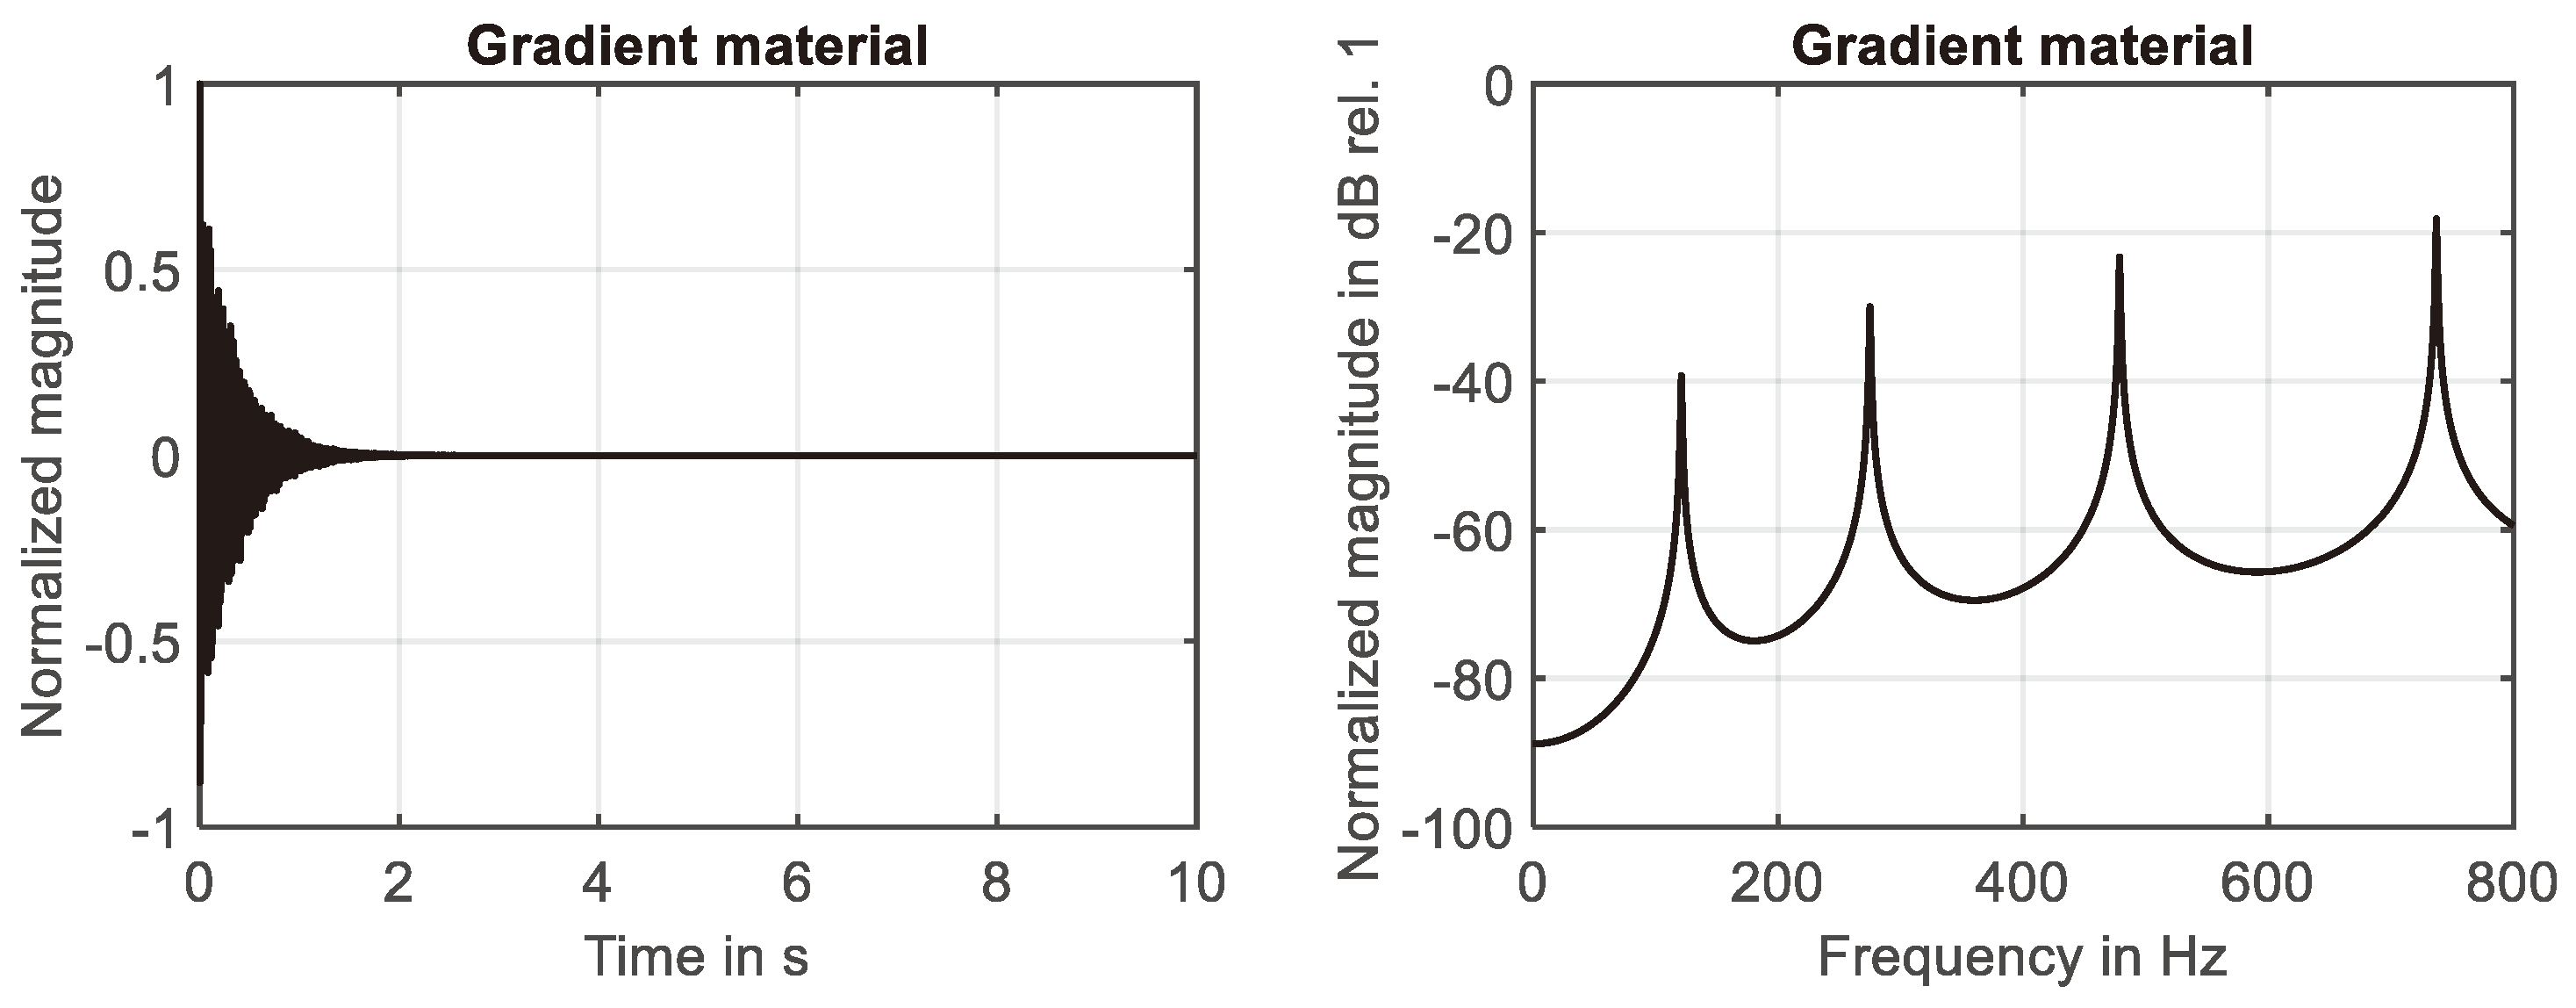
. The results of these simulations are shown in
Figure 1 and
Figure 2 for both time-domain and frequency-domain. Please notice that the curves are normalized to the maximum of the absolute values of the dependent variable.
For both materials the impulse response decreases rapidly and shows the typical behavior of linear systems with viscous damping. To recognize the differences it is necessary to compare the frequency response curves shown in Figures 1 (right) and 2 (right). For the simple material in total nine resonances can be detected below 800 Hz. As known from the classical theory these resonances are equally spaced. The results are in full agreement with equation (10), if higher gradient effects are neglected, i.e. .
As shown in
Figure 2 (right), the number of resonances is reduced down to four, if the second-order gradient material is analyzed. The spacing between the resonances increases with an increase in mode number. Furthermore, modes with the same mode number occur at higher frequencies compared to the simple material. Thus, the results of the numerical simulations confirm the analytical solution given in equation (10).
4.2. Time-Harmonic Excitation
In a second step adaptive filtering has been applied considering time-harmonic excitation with an excitation frequency of
at
and a damping parameter of
. The associated boundary conditions are summarized in equation (22)
Because adaptive filtering has been performed using a harmonic signal, it has been sufficient to restrict the filter length to . The minimum power of the reference signal has been set to and has been used as normalized step size.
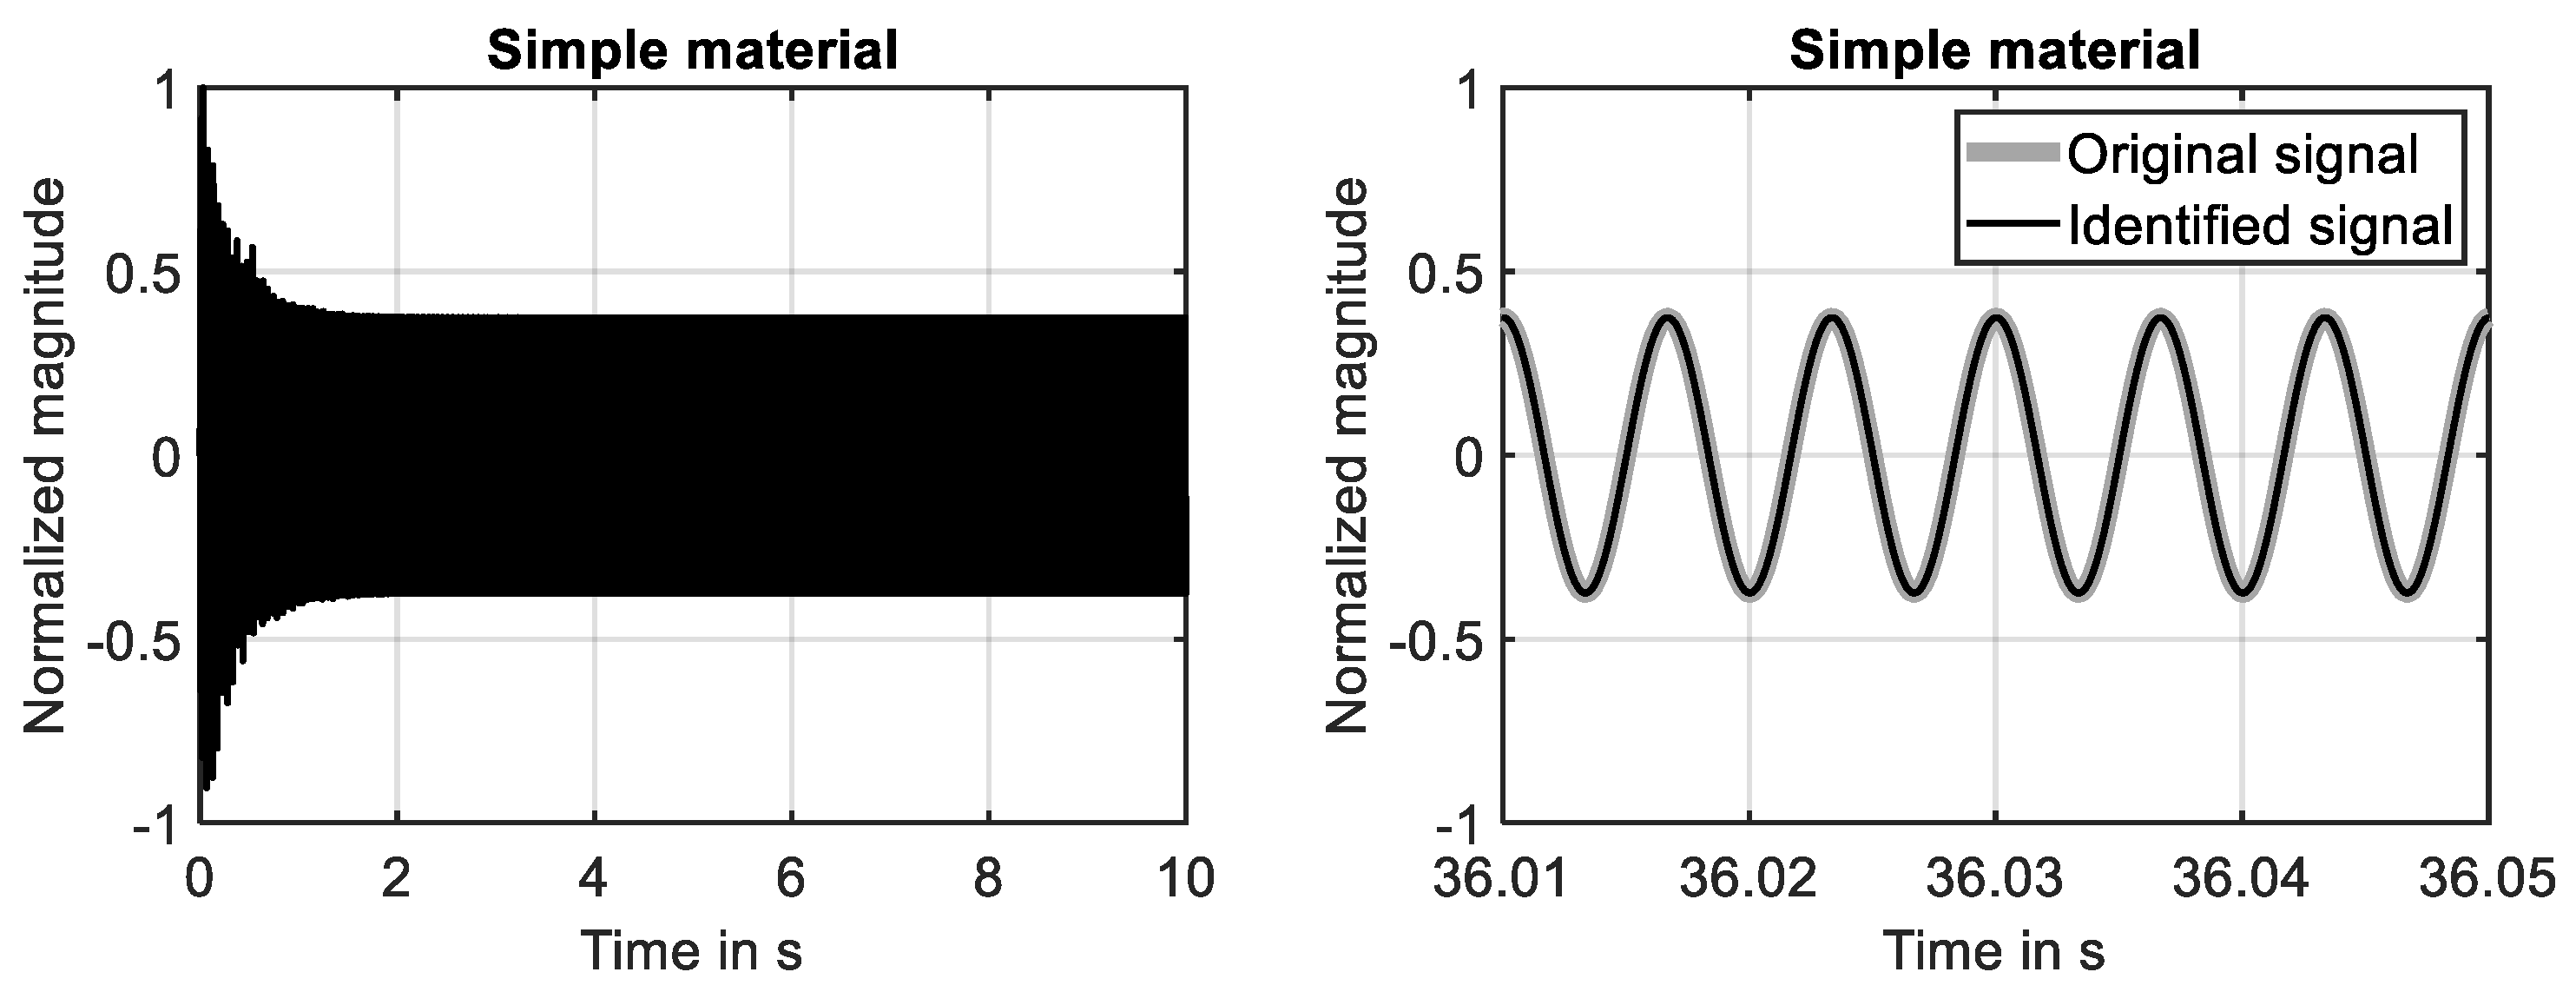
The time-harmonic response of the simple material is shown in
Figure 3 (left) for the first ten seconds of the simulation. The steady-state response is fully developed during the first two seconds. This finding is in agreement with decay of the associated impulse response, compare
Figure 1 (left). The results shown in
Figure 3 (right) clarify that the system response determined at the 29-th grid point is fully identified by the adaptive filter. The adaption process is illustrated by
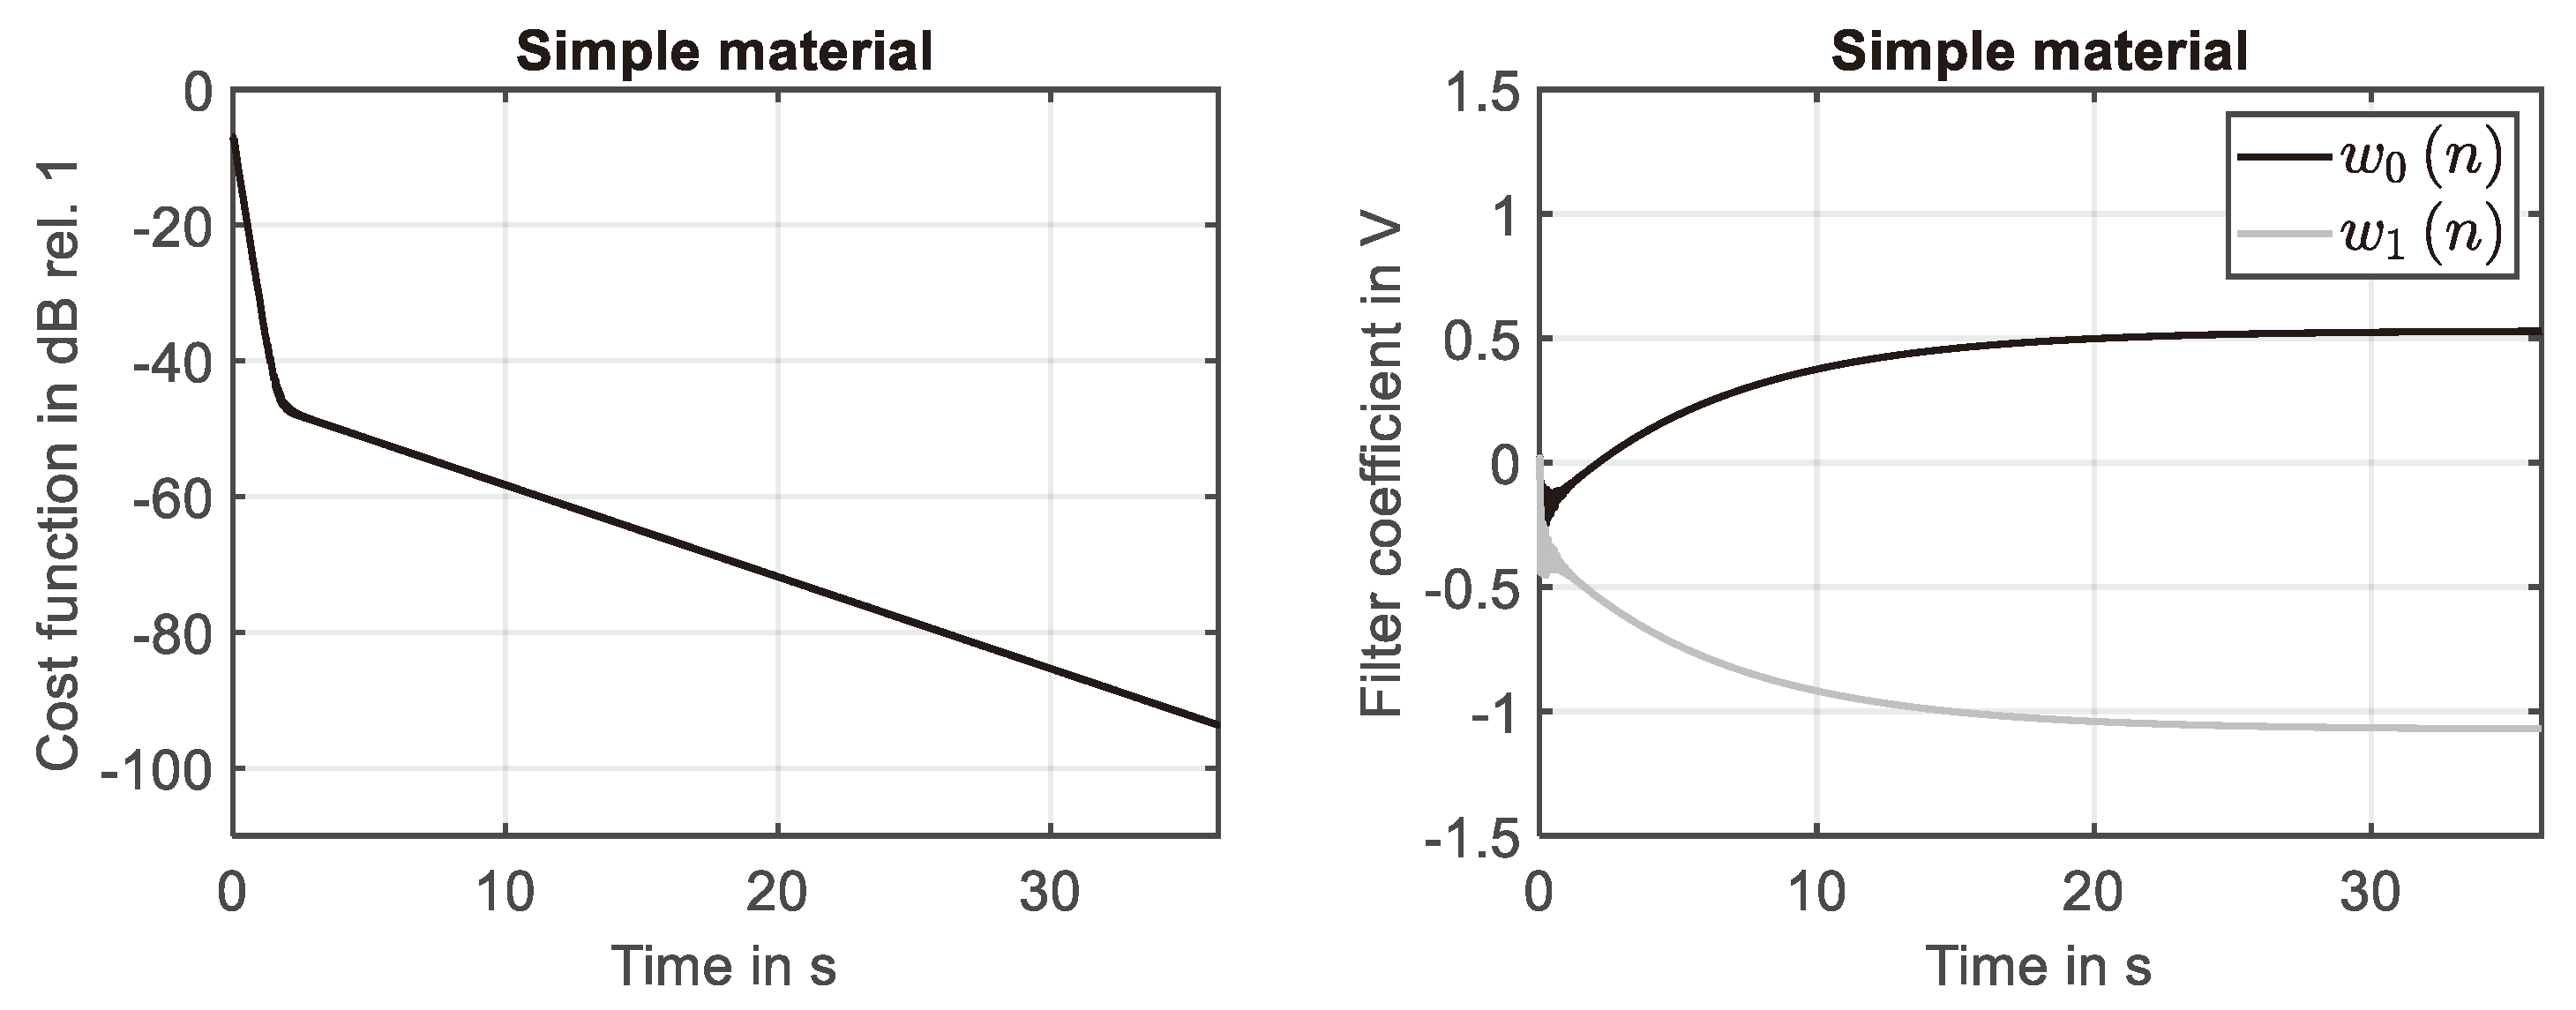
Figure 4. While the reduction of the cost function (learning curve) is shown in
Figure 4 (left), the development of the two filter coefficients is presented in
Figure 4 (right). It can been seen that using the NLMS a rapid convergence of the filter weights has been achieved.
The time-harmonic response of the second-order gradient material is presented in
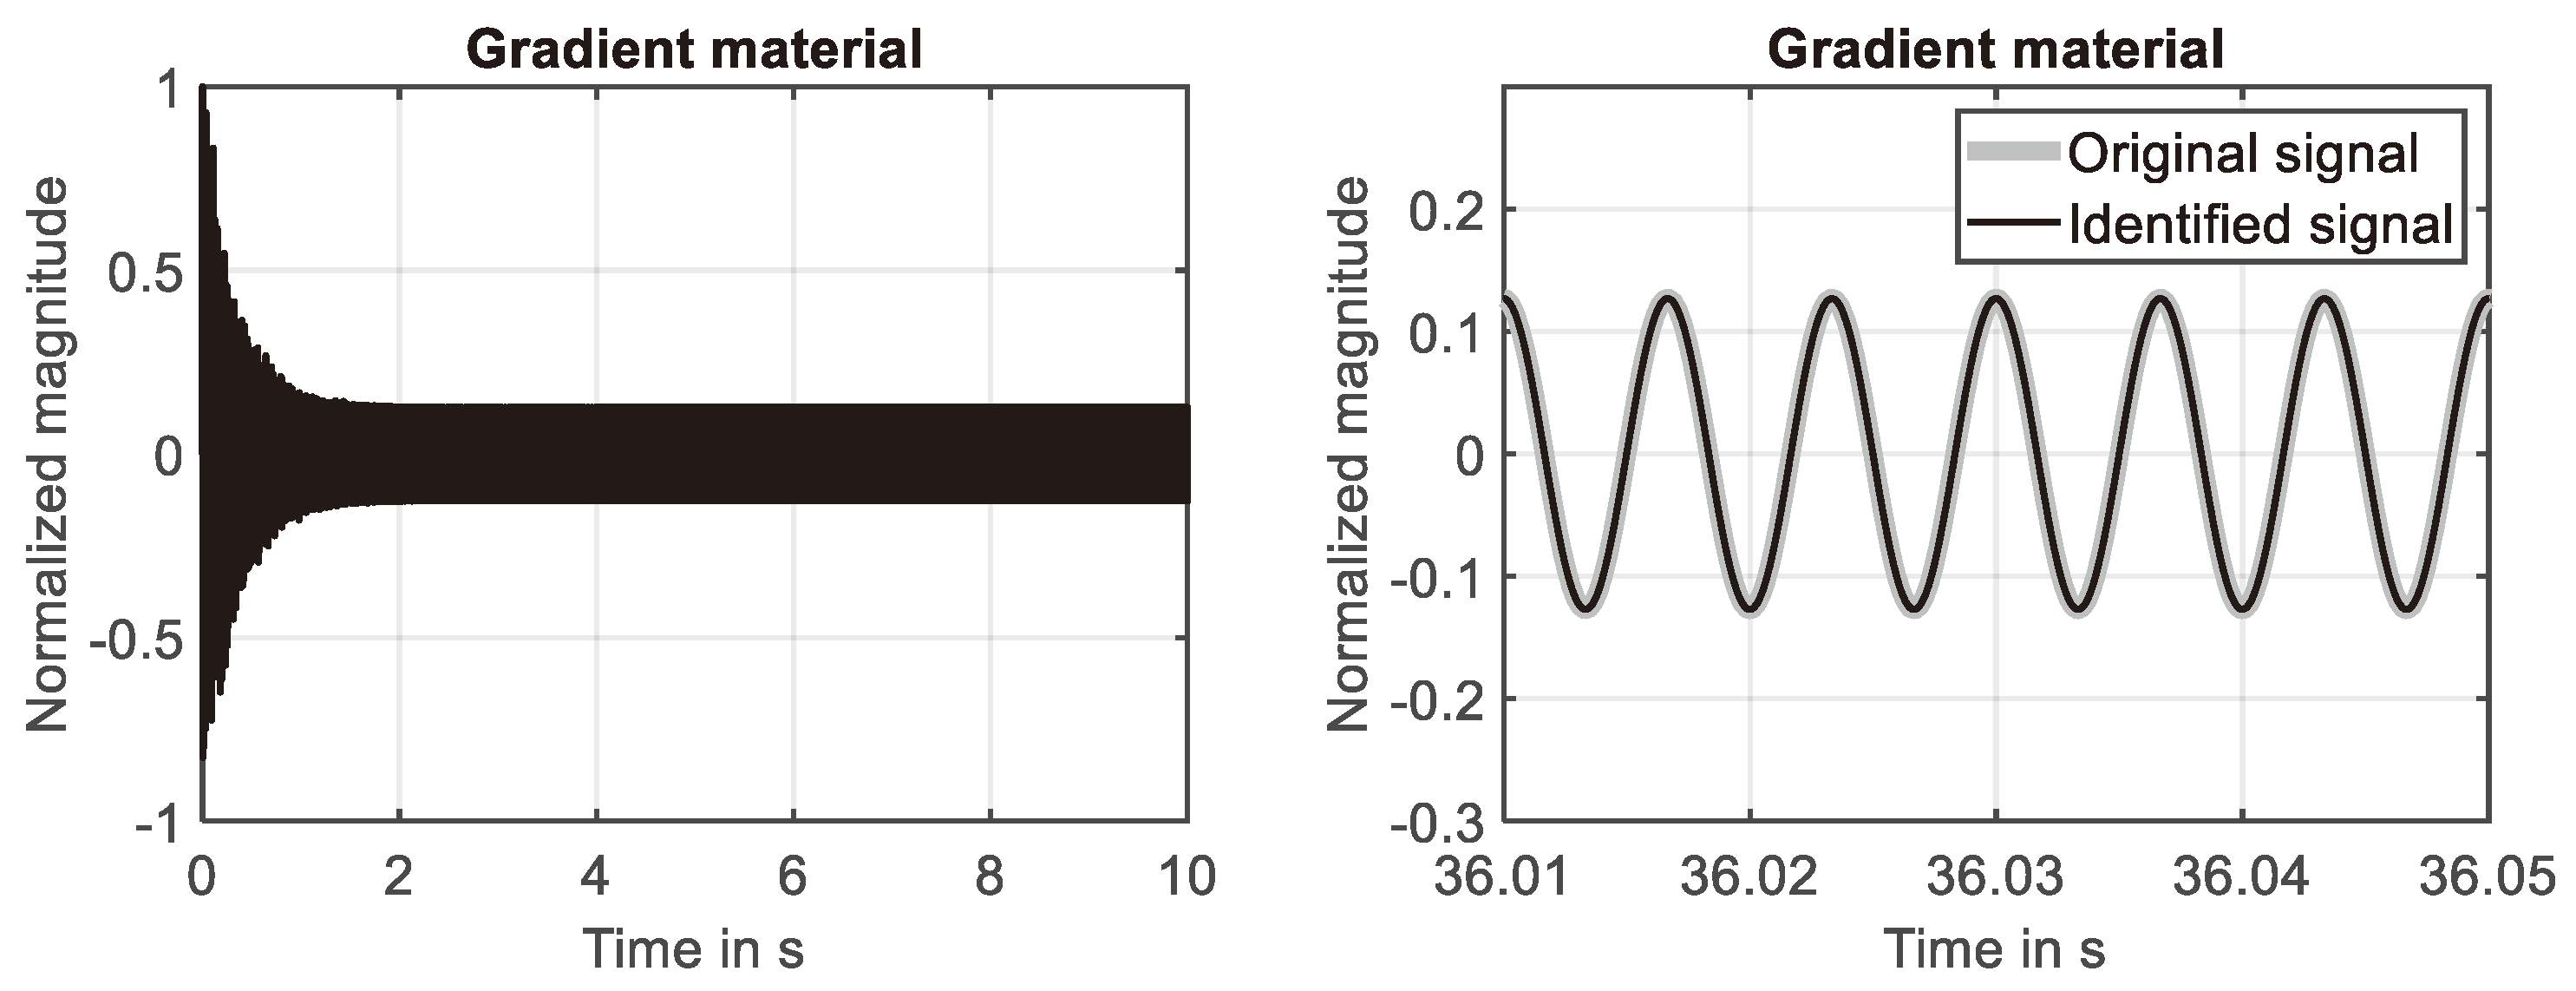
Figure 5 (left), considering again the first ten seconds of the simulation. Also for this material the steady-state response is fully developed after the first two seconds. This finding is in agreement with decay of the associated impulse response. The latter is shown in
Figure 2 (left).
The results shown in
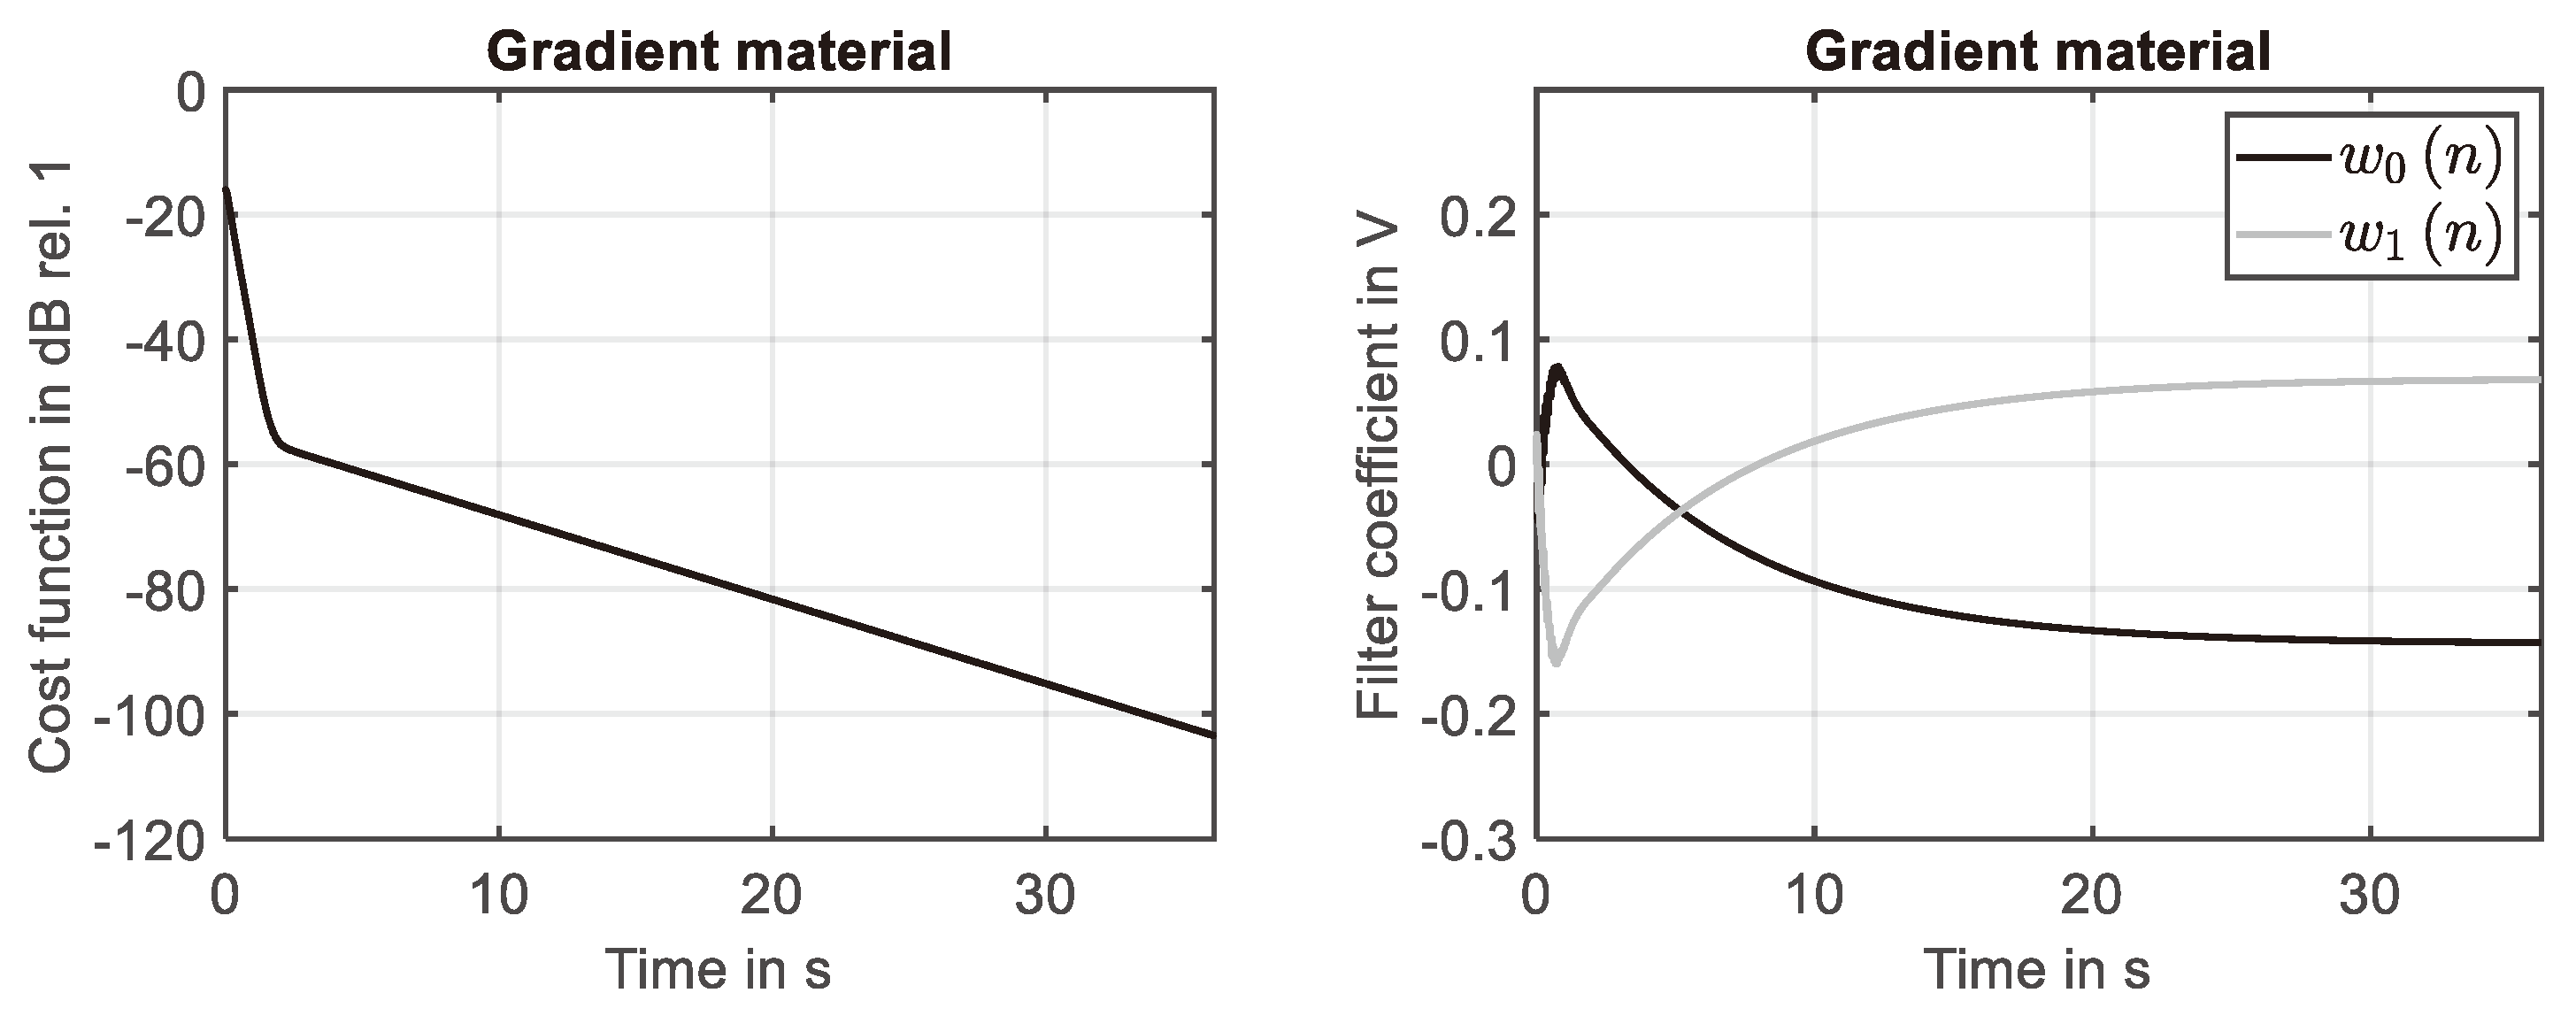
Figure 5 (right) prove that the system response determined for the second-order gradient material at the 29-th grid point is identified by the adaptive filter with high accuracy. The adaption process is illustrated by
Figure 6. The reduction of the cost function, shown in
Figure 6 (left), is similar to the learning curve of the simple material, compare
Figure 4 (left).
The development of the two filter coefficients is presented in
Figure 6 (right). As for the simple material, compare
Figure 4 (right), a fully converged filter is achieved at the end of the simulation. This clarifies that the NLMS algorithm can be applied to identify the time-harmonic response of LTI-systems that include higher gradient effects with the same accuracy known for LTI-systems based on simple materials.
Please notice that it has not been necessary to increase the filter length or to adjust the normalized step size of the self-adaptive algorithm. The same holds for the minimum of the reference signal power
and the normalized step size
. This implies that the same set of parameter that defines the process of adaptive filtering can be used to monitor changes in the material behavior. Because of the differences in the evolution of filter weights, compare
Figure 4 (right) and
Figure 6 (right), is possible to monitor a change in the material behavior that can be caused by the relevance of higher gradients.
4.3. Band-Limited Noise
In a third step adaptive filtering has been applied considering band limited Gaussian noise in the frequency range
. This reference signal has been used to excite the system at the position
. The damping parameter has been increased significantly to
. The boundary conditions used in this third step are summarized in equation (23)
where
represents the random excitation signal. The length of the adaptive filter has also been increased. It has been set to
. The minimum power of the reference signal and the normalized step size have not been altered. Thus the minimum power has again been set to
and
has again been used as normalized step size.
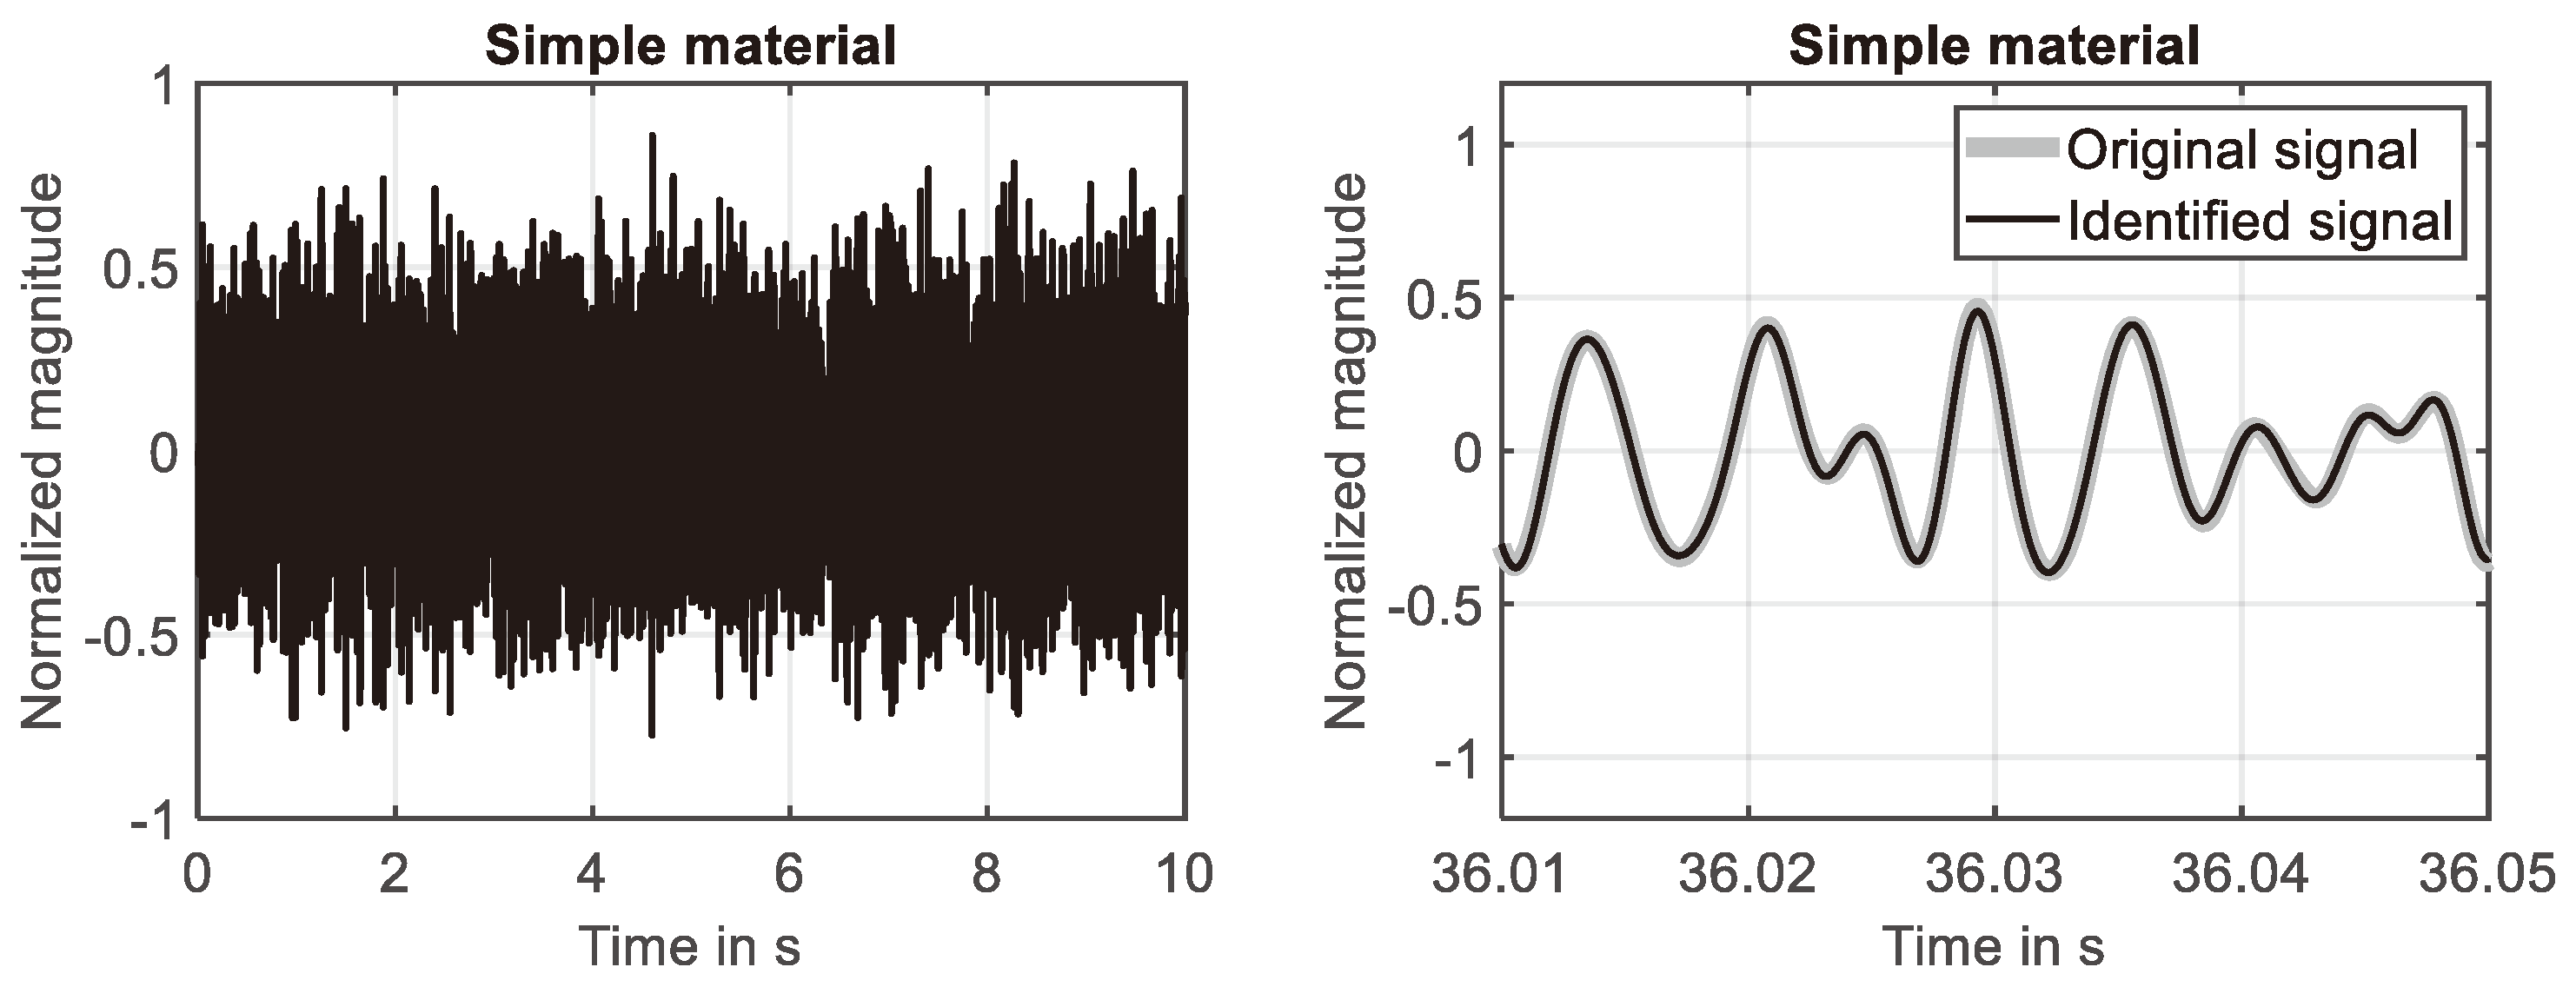
For the simple material the time domain response simulated in the first ten seconds is shown in
Figure 7 (left), while the converged state at the end of the simulation is shown in
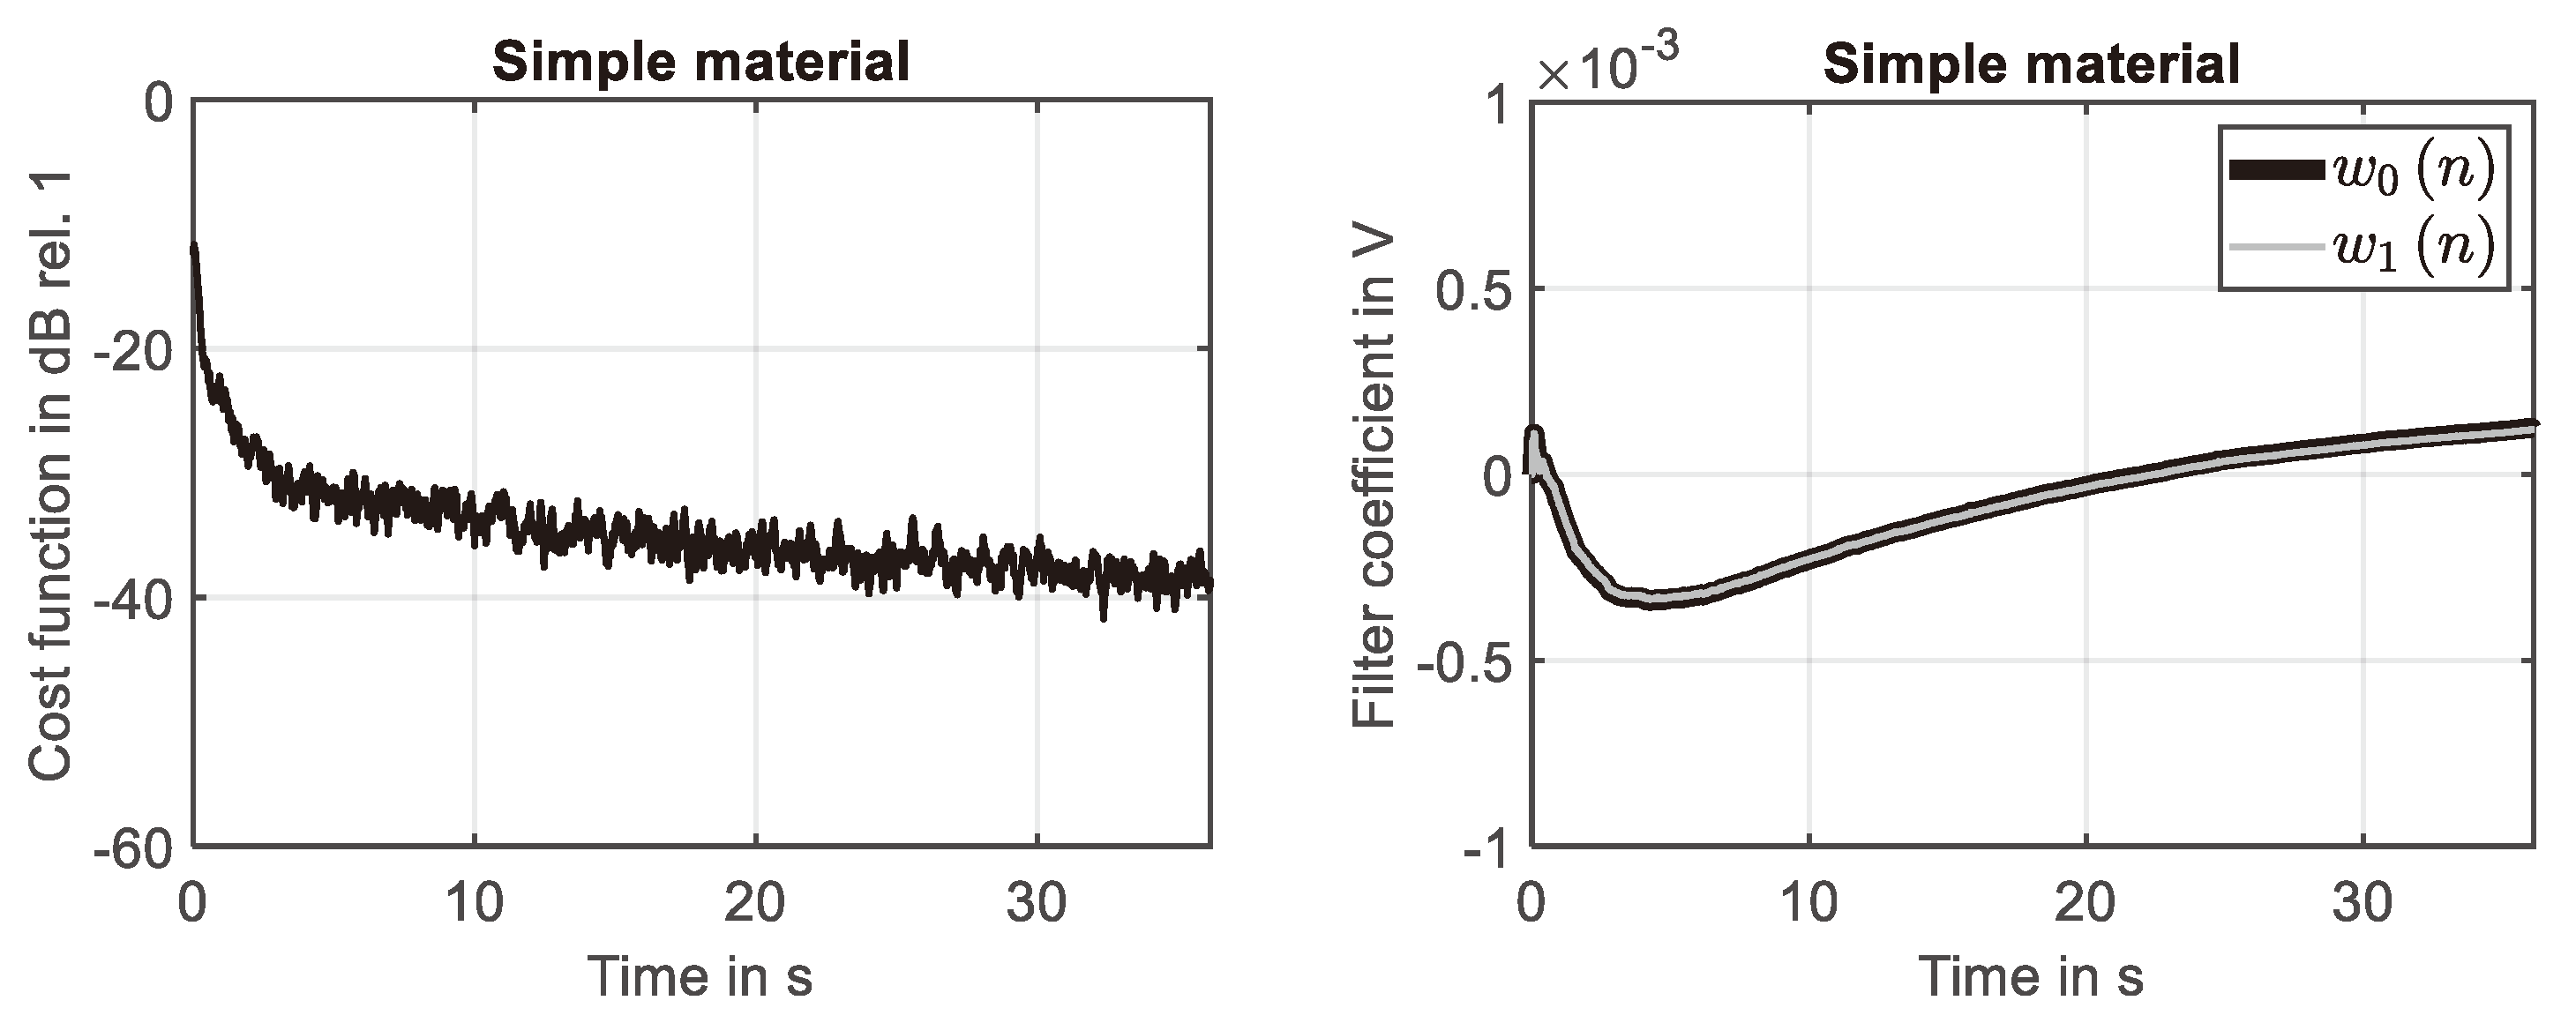
Figure 7 (right). The presented results prove that the system response is identified with high accuracy in the investigated frequency range. This finding is also supported by the learning curve shown
Figure 8 (left), because the squared error is reduced down to -40dB at the end of the simulation. The development of the first two filter weights are shown in
Figure 8 (right). It can be seen that these filter weights strive against constant values at the end of the simulation.
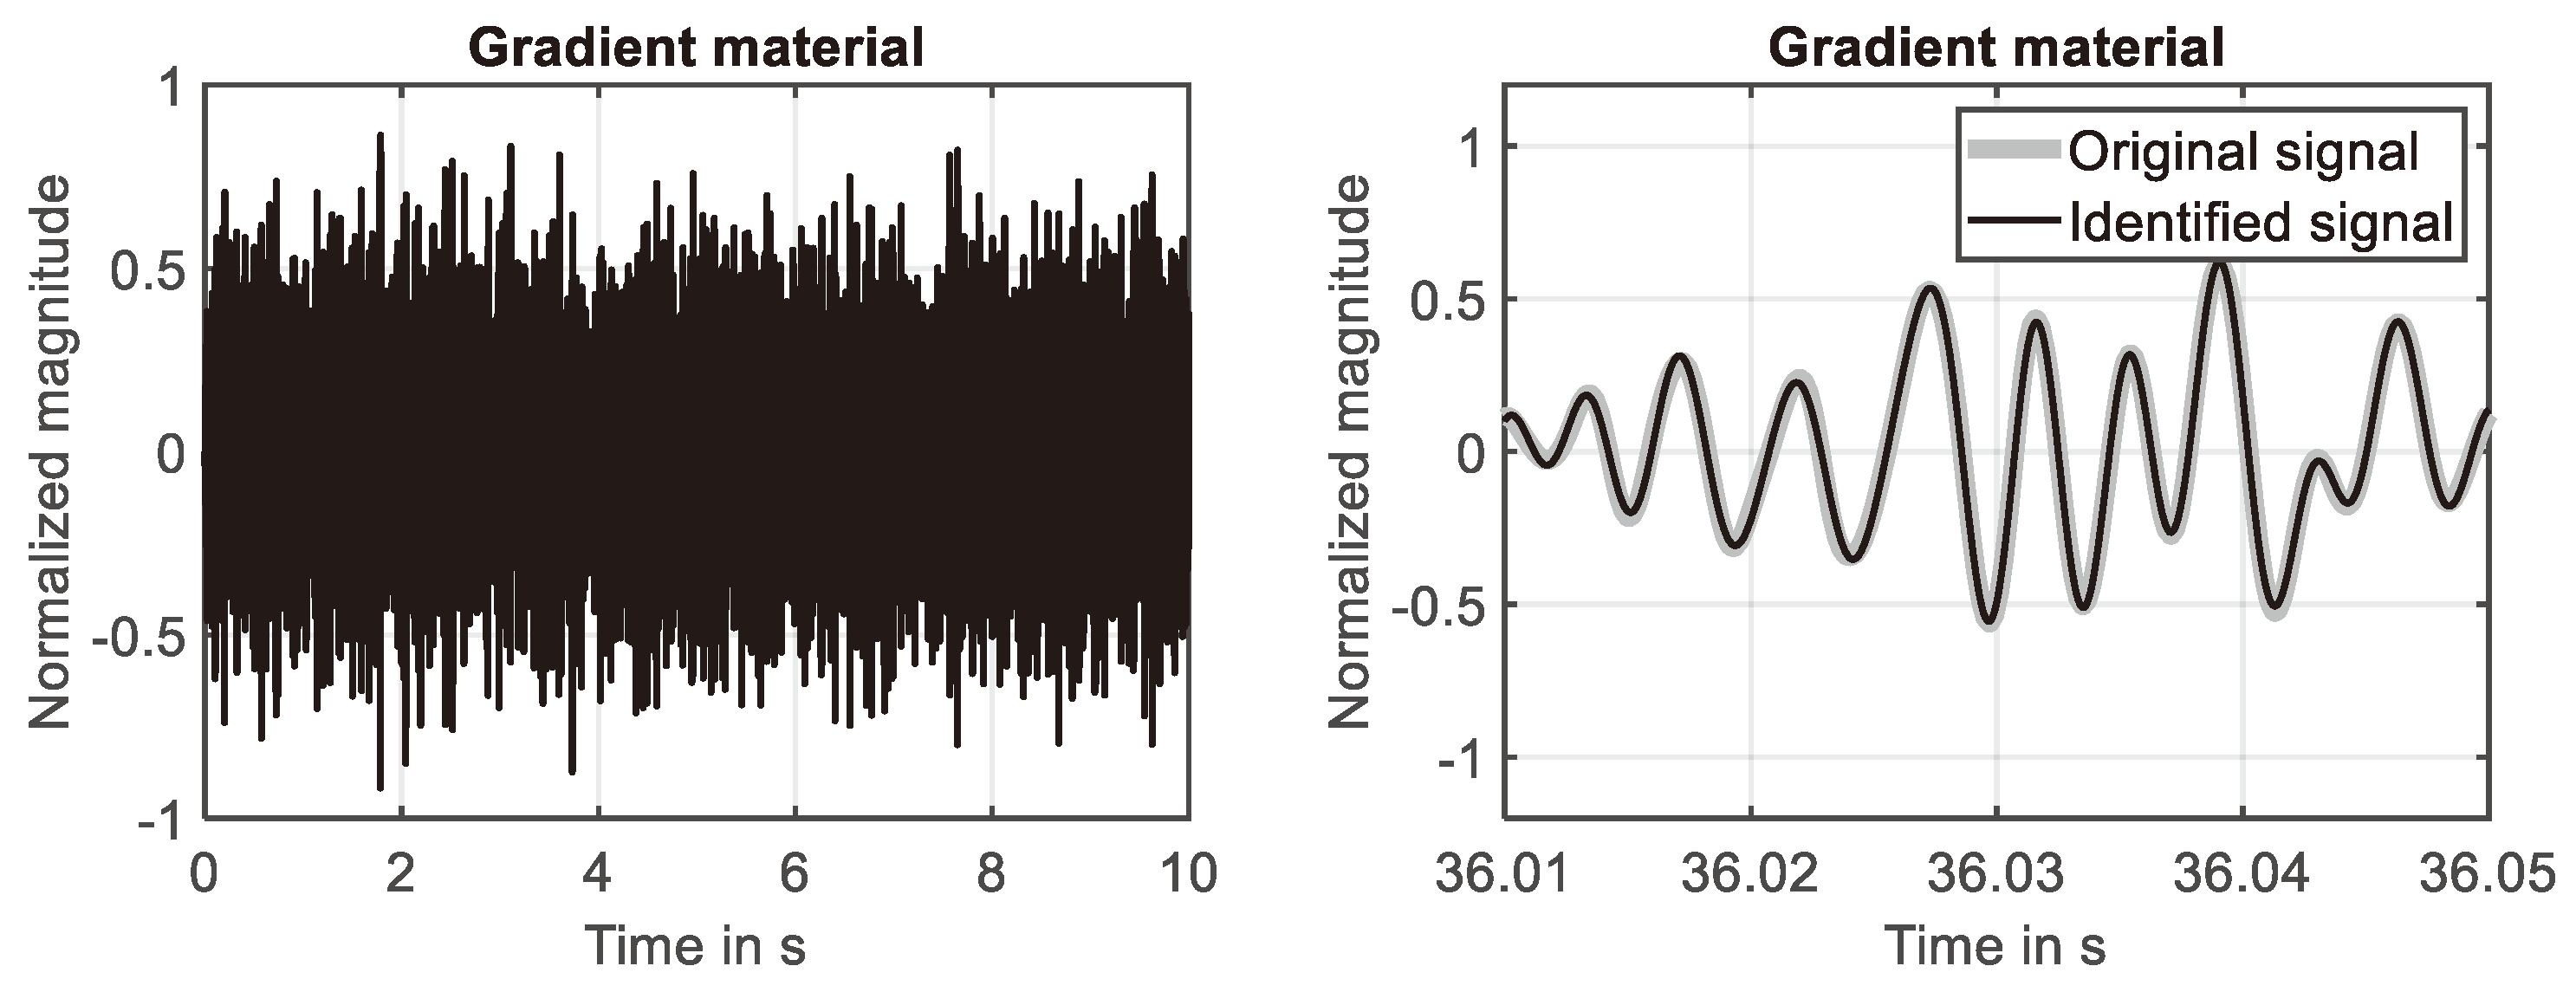
The time domain response of the second-order gradient material simulated in the first ten seconds is shown in
Figure 9 (left). As for the simple material the system is identified with high accuracy at the end of the simulation, compare
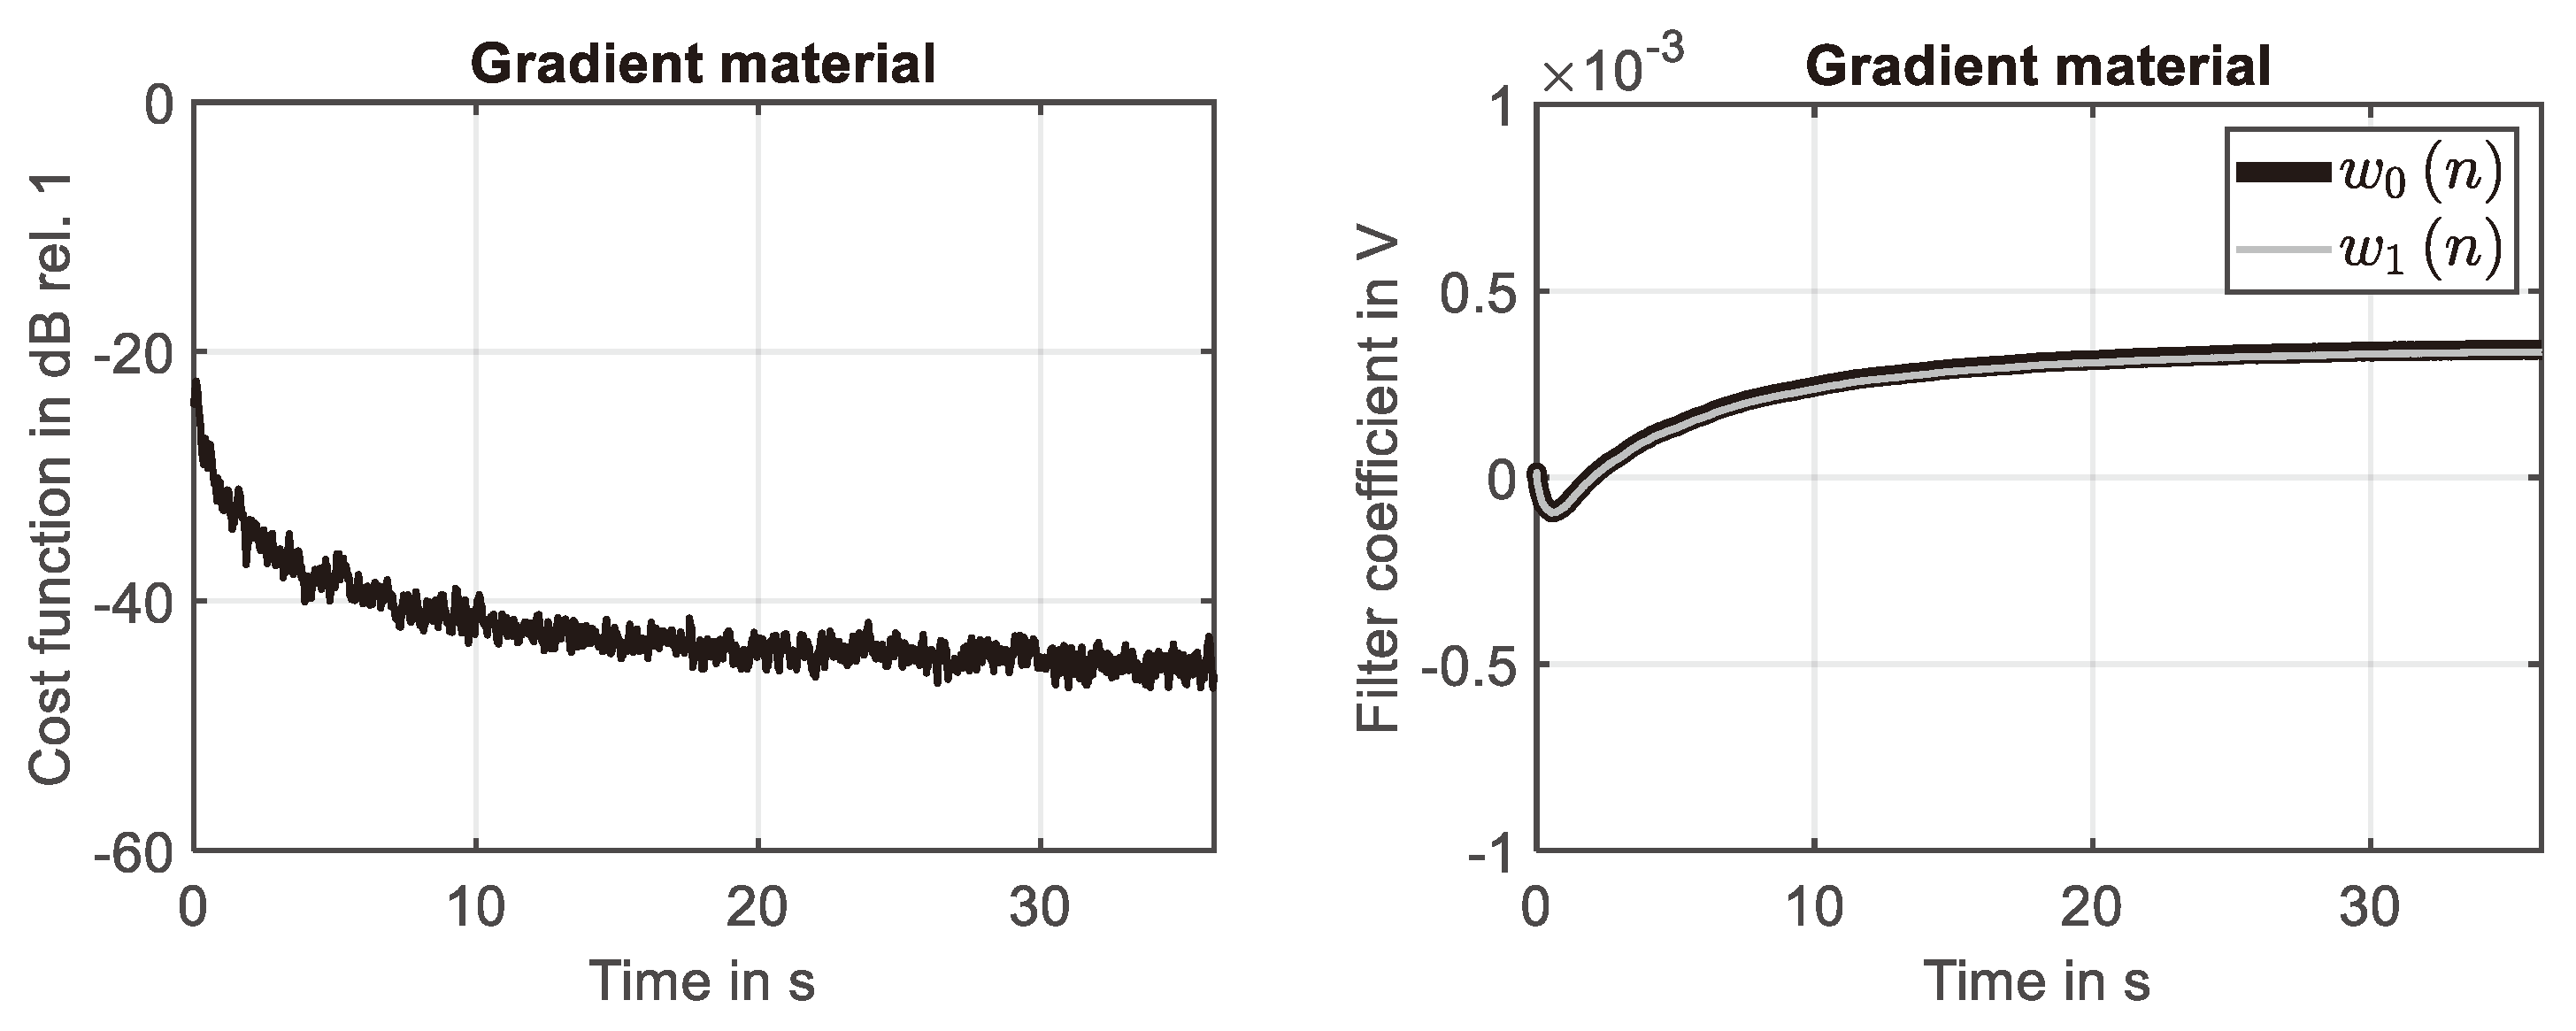
Figure 9 (right). This finding is again supported by the learning curve shown
Figure 10 (left), because the squared error is reduced down to -45dB at the end of the simulation. The development of the first two filter weights are shown in
Figure 10 (right). It can be seen that nearly constant values are reached at the end of the simulation.
In a converged state the coefficients of the adaptive filter represent the impulse response of the investigated system in the investigated frequency range. Using a normalization to the maximum of the absolute values the converged filter coefficients of the simple material are presented in
Figure 11 (left). The converged and normalized filter weights that have been identified for the second-order gradient materials are shown in
Figure 11 (right). For both materials, a stable impulse response has been identified in the investigated frequency range. Please notice that both impulse response curves tend to zero with an increasing filter weight number because viscous damping has been taken into account.
Because different systems based on different material models have been identified, the impulse response curves shown in
Figure 11 are not identical. However, as for the time-harmonic signal the parameter of the adaptive schema have been changed. This opens the possibility to use monitoring techniques such as online plant modelling [
28] to observe changings in the system behavior that could be caused by an increase in relevance of higher gradients in the material behavior.
5. Conclusions
For the first time system identification based on self-adaptive filtering has been applied to second-order gradient materials using numerical models. These models have been derived from thermodynamically consistent material models that are embedded into a general three-dimensional framework to gradient materials. For this reason is has not been necessary to consider parameter such as internal length scales that can be used to link the material behavior to a specific internal micro structure. Because of the thermodynamically consistent approach it has been possible to compare all results with the behavior of simple materials.
To obtain simple numerical models the FDM has been applied. System identification has been performed using the NLMS algorithm. All investigations have been restricted to vibrations in longitudinal wave guides. It has been found that in contrast to the classical theory of simple materials these kind of vibrations are describes by a fourth-order PDE. In agreement with the state of the art it has also been found that such a PDE can be solved analytically for a specific set of boundary conditions. The resulting solution allows for calculating natural frequencies that can differ significantly from the solution known for a simple material.
It has especially been found that the influence of second-order gradients of the kinematic variables results in higher values for the natural frequencies and a spacing of natural frequencies that is not equidistant in frequency. To observe such a characteristic in a frequency response curve can be relevant for the development of adequate continuum mechanical models.
The results of numerical investigation in combination with adaptive filtering applied for system identification prove that this technique can successfully applied also to gradient materials. However, compared to simple materials differences have been found especially in the evolution of the filter weights. These differences could be used for applications in the field of condition monitoring. For a practical approach to system identification and condition monitoring it is possible to formulate the following statements as the main findings:
Statement 1: If the investigated system behaves linear and time-invariant and is fully observable, the influence of higher gradients of the kinematic variables can be relevant for the development of system models, if the number of resonances in a certain frequency band is reduced and the spacing between single resonances increases with an increase in frequency.
Statement 2: If the investigated system behaves linear and time-invariant and is fully observable a change of the convergence characteristics of adaptive filter weights that is not caused by changing the parameter of the adaptive schema can indicate a change in the material behavior that can be caused by an increasing relevance of higher order gradients of the kinematic variables.
Statement 3: If the investigated system behaves linear and time-invariant and is fully observable a change in the impulse response (that might be observed in condition monitoring during online plant modelling) that is not caused by changing the parameter of the adaptive schema can indicate a change in the material behavior that can be caused by an increasing relevance of higher order gradients of the kinematic variables.
From the viewpoint of the author future work in this field should include experimental data observed in physical experiments. Furthermore, the field is open to derive more mathematical models that can be used to describe more sophisticated wave propagation phenomena (such as shear waves or bending waves) as well as to develop more advanced numerical models in order to guarantee stable integration schemas. Taking progress in these research directions into account self-adaptive filtering can become an interesting alternative to other identification methods, especially for dynamical problems.
Supplementary Materials
Please contact the author, if supplementary material is helpful for your academic work.
Funding
“This research received no external funding. “
Data Availability Statement
Please contact the author, if data exchange is helpful for your academic work.
Conflicts of Interest
Declare conflicts of interest or state “The authors declare no conflict of interest.” Authors must identify and declare any personal circumstances or interest that may be perceived as inappropriately influencing the representation or interpretation of reported research results. Any role of the funders in the design of the study; in the collection, analyses or interpretation of data; in the writing of the manuscript; or in the decision to publish the results must be declared in this section. If there is no role, please state “The funders had no role in the design of the study; in the collection, analyses, or interpretation of data; in the writing of the manuscript; or in the decision to publish the results”.
References
- Haupt, P. Continuum Mechanics and Theory of Materials, 1st ed.; Springer: Berlin, Germany, 2000. [Google Scholar]
- Bertram, A. Compendium on Gradient Materials, 1st ed.; Springer: Cham, Switzerland, 2023. [Google Scholar]
- Cordero, N.M.; Forest, S.; Busso, E.P. Second Strain Gradient Elasticity of Nano-Objects. J. Mech. Phys. Solids 2016, 97, 92–124. [Google Scholar] [CrossRef]
- Zhao, M.; Niu, J.; Lu, C.; Wang, B.; Fan, C. Effects of Flexoelectricity and Strain Gradient on Bending Vibration Characteristics of Piezoelectric Semiconductor Nanowires. J. Appl. Phys. 2021, 129. [Google Scholar] [CrossRef]
- Hosseini, S.M.J.; Torabi, J.; Ansari, R. Geometrically Nonlinear Nonlocal Strain Gradient Vibration of FG Shear Deformable Curved Nanobeams. Waves Random Complex Media 2022. [Google Scholar] [CrossRef]
- Yang, H.; Timofeev, D.; Giorgio, I.; Müller, W.H. Effective Strain Gradient Continuum Model of Metamaterials and Size Effects Analysis. Contin. Mech. Thermodyn. 2023, 35, 775–797. [Google Scholar] [CrossRef]
- Shishesaz, M.; Hosseini, M. Mechanical Behavior of Functionally Graded Nano-Cylinders Under Radial Pressure Based on Strain Gradient Theory. J. Mech. 2018, 35, 441–454. [Google Scholar] [CrossRef]
- Zhu, C.; Yan, J.; Wang, P.; Li, C. A Nonlocal Strain Gradient Approach for Out-of-Plane Vibration of Axially Moving Functionally Graded Nanoplates in a Hygrothermal Environment. Shock. Vib. 2021, 2021. [Google Scholar] [CrossRef]
- Voyiadjis, G.Z.; Song, Y. Strain Gradient Continuum Plasticity Theories: Theoretical, Numerical and Experimental Investigations. Int. J. Plast. 2019, 121, 21–75. [Google Scholar] [CrossRef]
- Bardella, L.; Niordson, C.F. Strain Gradient Plasticity: Theory and Implementation. In Mechanics of Strain Gradient Materials, 1st ed.; Bertram, A.; Forrest,S., Eds.; CISM International Centre for Mechanical Sciences (Courses and Lectures), Vol. 600, Springer, 2020; pp. 101–149. [CrossRef]
- Eremeyev, V.A. Local Material Symmetry Group for first- and second-order Strain Gradient Fluids. Math. Mech. Solid 2021, 8, 1173–1190. [Google Scholar] [CrossRef]
- Krawietz, A. Surface Phenomena of Gradient Materials. Contin. Mech. Thermodyn. 2021, 33, 2203–2212. [Google Scholar] [CrossRef]
- Krawietz, A. Surface Tension and Reaction Stresses of a Linear Incompressible Second Gradient Fluid. Contin. Mech. Thermodyn. 1027. [Google Scholar] [CrossRef]
- Askes, H.; Aifantis, E.C. Gradient Elasticity in Statics and Dynamics: An Overview of Formulations, Length Scale Identification Procedures, Finite Element Implementations and New Results. Int. J. Solids Struct. 2011, 48, 1962–1990. [Google Scholar] [CrossRef]
- Akgöz, B.; Civalek, Ö. Longitudinal Vibration Analysis for Microbars based on Strain Gradient Elasticity Theory. J. Vib. Control. 2014, 20, 606–616. [Google Scholar] [CrossRef]
- Jiang, J.; Wang, L. Analytical Solutions for the Thermal Vibration of Strain Gradient Beams with Elastic Boundary Conditions. Acta Mech. 2018, 229, 2203–2219. [Google Scholar] [CrossRef]
- Kletschkowski, T. Untersuchungen zur aktiven Lärmminderung in Gradientenmaterialien. In Proceedings of DAGA 2018, 44th German Annual Conference on Acoustics (DAGA), Germany, 19th–22nd, Mart, 2018.
- Zhu, G.; Droz, C.; Zine, A.; Ichchou, M. Wave Propagation Analysis for a Second Strain Gradient Rod Theory. Chin. J. Aeronaut. 2020, 33, 2563–2574. [Google Scholar] [CrossRef]
- Shodja, H.M.; Ahmadpoor, F.; Tehranchim, A. Calculation of the Additional Constants for fcc Materials in Second Strain Gradient Elasticity: Behavior of a Nano-Size Bernoulli-Euler Beam With Surface Effects. J. Appl. Mech. 2012, 79. [Google Scholar] [CrossRef]
- Olschewski, J. Die Ermittlung der elastischen Konstanten kubisch einkristalliner Stoffe als Beispiel einer Systemidentifikation. In Mechanik – Beiträge zu Theorie und Anwendungen, 1st ed.; Bertram, A., Nasseri, M., Sievert, R., Eds.; TU Berlin: Berlin, Germany, 1988; pp. 162–176. [Google Scholar]
- Bertram, A.; Han, J.; Olschewski, J.; Sockel, H.G. Identification of Elastic Constants and Orientation of Single Crystals by resonance measurements and FE analysis. In. J. Comp. Appl. Techn. 1994, 7, 285–292. [Google Scholar]
- Obermayer, T.; Krempaszky, C.; Werner, E. Determination of the Anisotropic Elasticity Tensor by Mechanical Spectroscopy. Contin. Mech. Thermodyn. 2022, 34, 165–184. [Google Scholar] [CrossRef]
- Widrow, B. Adaptive Filters. In Aspects of Network and System Theory, 1st ed.; Kalman, R.E.., DeClaris, N., Eds.; Holt, Rinehart, Winston: New York, USA, 1970; pp. 563–587. [Google Scholar]
- Challamel, N.; Picandet, V.; Collet, B.; Michelitsch, T.; Elishakoff, I.; Wang C., M. Revisiting Finite Difference and Finite Element Methods applied to Structural Mechanics within Enriched Continua. Eur. J. Mech.-A/Solids 2015, 53, 107–120. [Google Scholar] [CrossRef]
- Adak, M.; Mandal, A. Numerical Solution of Fourth-Order Boundary Value Problems for Euler–Bernoulli Beam Equation using FDM. Journal of Physics: Conference Series 2070 (ICAPSM 2021) 2021, 012052, 1–6. [Google Scholar] [CrossRef]
- Soroushian, A. A General Rule for the Influence of Physical Damping on the Numerical Stability of Time Integration Analysis. J. Appl. Comput. Mech. 2018, 4, 467–481. [Google Scholar]
- Slock, D.T.M. On the Convergence Behavior of the LMS and the Normalized LMS Algorithms. IEEE Trans. Signal Process. 1993, 41, 2811–2825. [Google Scholar] [CrossRef]
- Courant, R.; Friedrichs, K.; Lewy, H. On the Partial Difference Equations of Mathematical Physics. IBM J. Res. Dev. 1967, 11, 215–234. [Google Scholar] [CrossRef]
- Kuo, S.M.; Morgan, D.R. Active Noise Control Systems. Algorithms and DSP Implementations, 1st ed.; John Wiley & Sons, Inc. New York, USA, 1996.
|
Disclaimer/Publisher’s Note: The statements, opinions and data contained in all publications are solely those of the individual author(s) and contributor(s) and not of MDPI and/or the editor(s). MDPI and/or the editor(s) disclaim responsibility for any injury to people or property resulting from any ideas, methods, instructions or products referred to in the content. |
© 2024 by the authors. Licensee MDPI, Basel, Switzerland. This article is an open access article distributed under the terms and conditions of the Creative Commons Attribution (CC BY) license (http://creativecommons.org/licenses/by/4.0/).
