Preprint
Article

Exploring the Sustainable Development of Historical Areas Based on Color Visualization: A Case Study of Shiquan Street in Suzhou, China

Altmetrics

Downloads

142

Views

50

Comments

0

A peer-reviewed article of this preprint also exists.

This version is not peer-reviewed

Submitted:

26 January 2024

Posted:

08 February 2024

You are already at the latest version

Alerts
Abstract
Currently, historical areas in China are facing issues of color authenticity and excessive commercialization. Colors, as an important element of historical areas, reflect their history and culture. However, there are some flaws in the existing research methods, so a more scientific and systematic method is needed to obtain accurate and objective color visualization results to promote the sustainable development of historical areas. In order to explore the methods and applications of visualizing the environmental color genes of historical areas, Shiquan Street in Suzhou, China was taken as the research object, ArcGIS 10.5 was used to obtain the street veiw photo samples, Matlab was used to summarize the architectural colors of the historical areas, and K-means clustering was used to generate the central color card of the historical areas, thus completing the color visualization of the historical areas, followed by further searching for the color patterns and central colors, so as to explore the strategies for sustainable development of historical areas. The various quantified color models of historical areas can explore the regional uniqueness and color locality of historical areas, which avoids problems such as homogenization of block colors, unclear styles and features, and excessive proportion of commercial colors caused by poor color guidance and control in the design related to historical areas, providing approaches to the research on the harmonious unity of environmental colors and features related to historical areas.
Keywords: 
Subject: Arts and Humanities  -   Architecture

1. Introduction

1.1. Problems Existing in Historical Areas

The template As the treasures of a city, “historical areas(historical distrist)” are areas with concentrated distributions of architectural heritage, where the combination of the individual buildings forms a unique feature. As the witnesses of the history and splendid culture of a city, they also have extremely high protection value. However, in China, historical areas often face a series of challenges [1,2]. Firstly, the color authenticity of historical areas is mainly reflected in the protection of the original architectural culture. In the process of protecting and developing historical and cultural blocks, some regions haveneglected the overall inheritance of local traditional architectural culture, resulting in the loss of “authentic” cultural features in the newly built historical and cultural blocks [3]. In this case, the colors of the blocks may be unified, resulting in the loss of the original historical and cultural connotations in terms of facade colors [4]. This distorted color not only deprives the uniqueness of historical areas, but also greatly undermines the sustainability of theirhistorical value [5]. Secondly, excessive commercial development is also an important factor affecting the authenticity of color in historical areas [6]. Commercial development tends to change the original colors of blocks, making them look similar and undermining their sustainability [7]. For example, in order to attract tourists, some blocks may choose to use bright colors while ignoring the original historical colors, which not only affects the visual effect of the blocks, but also damages the historical and cultural continuity. Excessive commercialization makes the colors of the historical areas simple and lacking in vitality, thus losing the original living atmosphere [8]. At the same time, the loss of residents in historical areas can also affect their color authenticity [9]. Due to the damage to the original living environment during the renovation process of some historical areas, many indigenous residents have to leave, and the population loss lead to the hollowing out of the old streets. Moreover, the subsequent revitalization continues to carry out commercial oriented transformation, which makes the colors of the blocks lose their vitality, further degrading the features of the blocks.

1.2. Color Authenticity of Historical Areas

In the field of urban planning and conservation of historical areas, the color authenticity of historical areas is an important topic [10,11]. This authenticity is not only reflected in the authenticity of the architectural style, cultural connotations, and community life, but also in the authenticity of the colors. Colors, as an important element of historical areas, are an important manifestation of their authenticity [12]. The architectural colors of historical areas often retain their original color features, such as old red brick walls, time-honored blue flagstone (Qingshiban) pavement, and unique local cultural colors [13]. These color features are an important reflection of the color authenticity of historical areas, and are also an important component of their historical and cultural value [14]. In the study of architectural color in historical areas, it has found that different historical periods, geographical environments, and cultural backgrounds can all affect the architectural colors of historical areas [15]. For example, the historical areas of northern China in ancient times are often dominated by red and yellow colors. This is because the northern cities tended to be chosen as the capital cities of ancient Chinese dynasties, when red symbolized auspiciousness and yellow symbolized imperial power. On the other hand, the historical areas in the south of the lower reaches of the Yangtze River, mainly known as Jiangnan region, may be dominated by white and gray colors, because in the architectural tradition of Jiangnan region, white and gray are considered the colors closest to traditional Chinese ink painting. In addition, the architectural colors of historical areas will also be influenced by their functions and users [16]. For example, the architectural colors of commercial areas in historical areas may be more diverse and lively to attract customers, while the architectural colors in residential areas may be warmer and more comfortable to create a livable environment [17]. Therefore, the architectural colors of historical areas not only reflect their history and culture, but also their functions and users’ needs [18].
The protection and restoration of colors is an important task in the sustainable devel- opment of historical areas. Usually, detailed investigations and records of the architectural colors of historical areas are required to understand their original color features and changes [19]. Then, based on these investigations and records, a reasonable protection and restoration plan is developed to maintain the authenticity of the architectural colors of the historical areas [20]. It is noted that in the process of protecting and restoring architectural colors, protection and restoration do not mean being the same. On the contrary, attention should be paid to the modernization needs and development possibilities while preserving the authenticity of the architectural colors of historical areas. Therefore, the protection and restoration of architectural colors should be a sustainable process that not only respects history but also looks up to the future [21].

1.3. Quantitative Methods for Exploring True Colors

Under such background, it is meaningful to explore the true color patterns in historical areas from the perspective of sustainable development [22,23]. China has its own traditional color spectra, and these colors are also widely used in historical buildings. Exploring the colors of various parts of traditional architectures and color patterns of buildings in historical areas plays a positive role in the sustainable development of historical areas. In recent years, the advancement and development of computer technology have provided new possibilities for the research related to color visualization of historical areas, and the extraction of environmental colors has shifted from manual color suction tools to more scientific computer image processing technologies, including but not limited to mining methods for multi-sample urban data, flat image processing methods supported by machine learning technology, and color extraction applications supported by programming technology. More and more scholars are also trying to explore the correlation between digital media technology and the color visualization of building facades of historical areas using multiple methods. In terms of computer image processing, Gouaich et al. [24] established an HSV color space model, summarized the color composition of the M’zab Valley and Ksourian landscape in Algeria, and proved that Ksourian landscape and M’zab Valley had strong color consistency, providing approaches to the restoration of urban architectural heritage and regional feature color extraction in natural environment. Kishor et al. [25] compared K-means clustering algorithm, fuzzy C-means clustering algorithm, Henry gas solubility optimization algorithm, chaotic gravity search algorithm, and J-segmentation methods, and confirmed that K-means clustering algorithm performed better in cutting a large number of samples, providing methods for the extraction and application of color visualization. Based on Bertin semiotics theory, Jégou et al. [26] combined the theories related with aesthetic and graphic designs, explored image colors through computer tools, formed and generated multiple gradient colors, and applied them to the field of plane composition and color application in design. In terms of the acquisition of architectural samples, ZHONG et al. [27] proposed that street view images could be served as a carrier for identifying and extracting the dominant color tones of urban buildings. FU et al. [28] used street view photos as samples to extract the architectural colors in the main urban area of Changsha, China, and analyzed their color genes. In terms of the optimization of color sample extraction methods, MIAO et al. [29] replaced the traditional handheld cameras with ArcGIS and Python platforms to collect samples and completed a large-scale mining of architectural element samples on Zhongyang Street in Harbin, China, improving data acquisition speed. As for color clustering method selection and application, WU et al. [30] used K-means clustering to complete the color visualization of traditional Chinese painting, and applied the clustering results to related designs, achieving a tight connection from concrete objects to specific designs. As for the specific color design methods, CHEN et al. [31] constructed a complete system of traditional Chinese color schemes integrated with screening, application and post evaluation based on the PCSS color system and related clustering methods.
However, current research mainly focuses on exploring methods and approaches in a single field, and there is still a lack of interdisciplinary linkage thinking. At the same time, some methods and approaches are still not complete and scientific enough. For example, when obtaining and preprocessing large-scale samples, attention is only paid to the number of samples but not the quality of the samples; uncorrected architectural street view samples make it difficult to restore their original colors, and inadequately trained datasets make it difficult to fully and accurately segment various color elements, which can directly lead to inaccurate experimental results and thereby affecting the construction of subsequent color application strategies. Therefore, when focusing on the application of computer vision image processing technology supported by multi-source data, it is necessary to make each step as scientific and systematic as possible, in order to make the color visualization results more accurate and objective.
Given the above situations, it is easy to find that historical areas, as an importantcarrier of living environment and urban culture, not only carry daily residential functions but also reflect the expression of regional culture. As the newly emerging technologies and media, multi-source data and computer vision image processing methods provide technologies for large-scale sample acquisition and digital image processing, which can be used to explore the visual interaction of regional architecture. On the other hand, as an intuitive carrier of regional cultural expression, architectural colors not only carry the regional cultural information, but are also closely related to the experience of people. This study investigated the methods for the extraction and application of colors in historical areas. Through acquiring the street view photo samples, processing street view photo samples, and clustering the colors of street view photo samples, this study aims to provide ideas for color control in historical areas, color selection and application in the designs related to historical areas, and provide methodological insights for academic research practices such as color management and sustainable development of historical areas.

2. Introduction

2.1. Study area

With a length of 2063 m, Shiquan Street, Suzhou, China, stretches from Anli Bridge at Feng Gate in the east to Sanyuanfang of Renmin Road in the west (Figure 1). Shiquan Street, as a part of the cultural heritage of historical architectural blocks in Jiangnan region, carries rich historical and cultural connotations. Its architectural style is not only full of the features of Jiangnan water towns, but also a representative of ancient Jiangnan blocks in China. In the 1980s, the Suzhou Gusu District People’s Government carried out a comprehensive renovation of the original Shiquan Street after thorough re-planning while ensuring the original architectural style of Jiangnan in China.
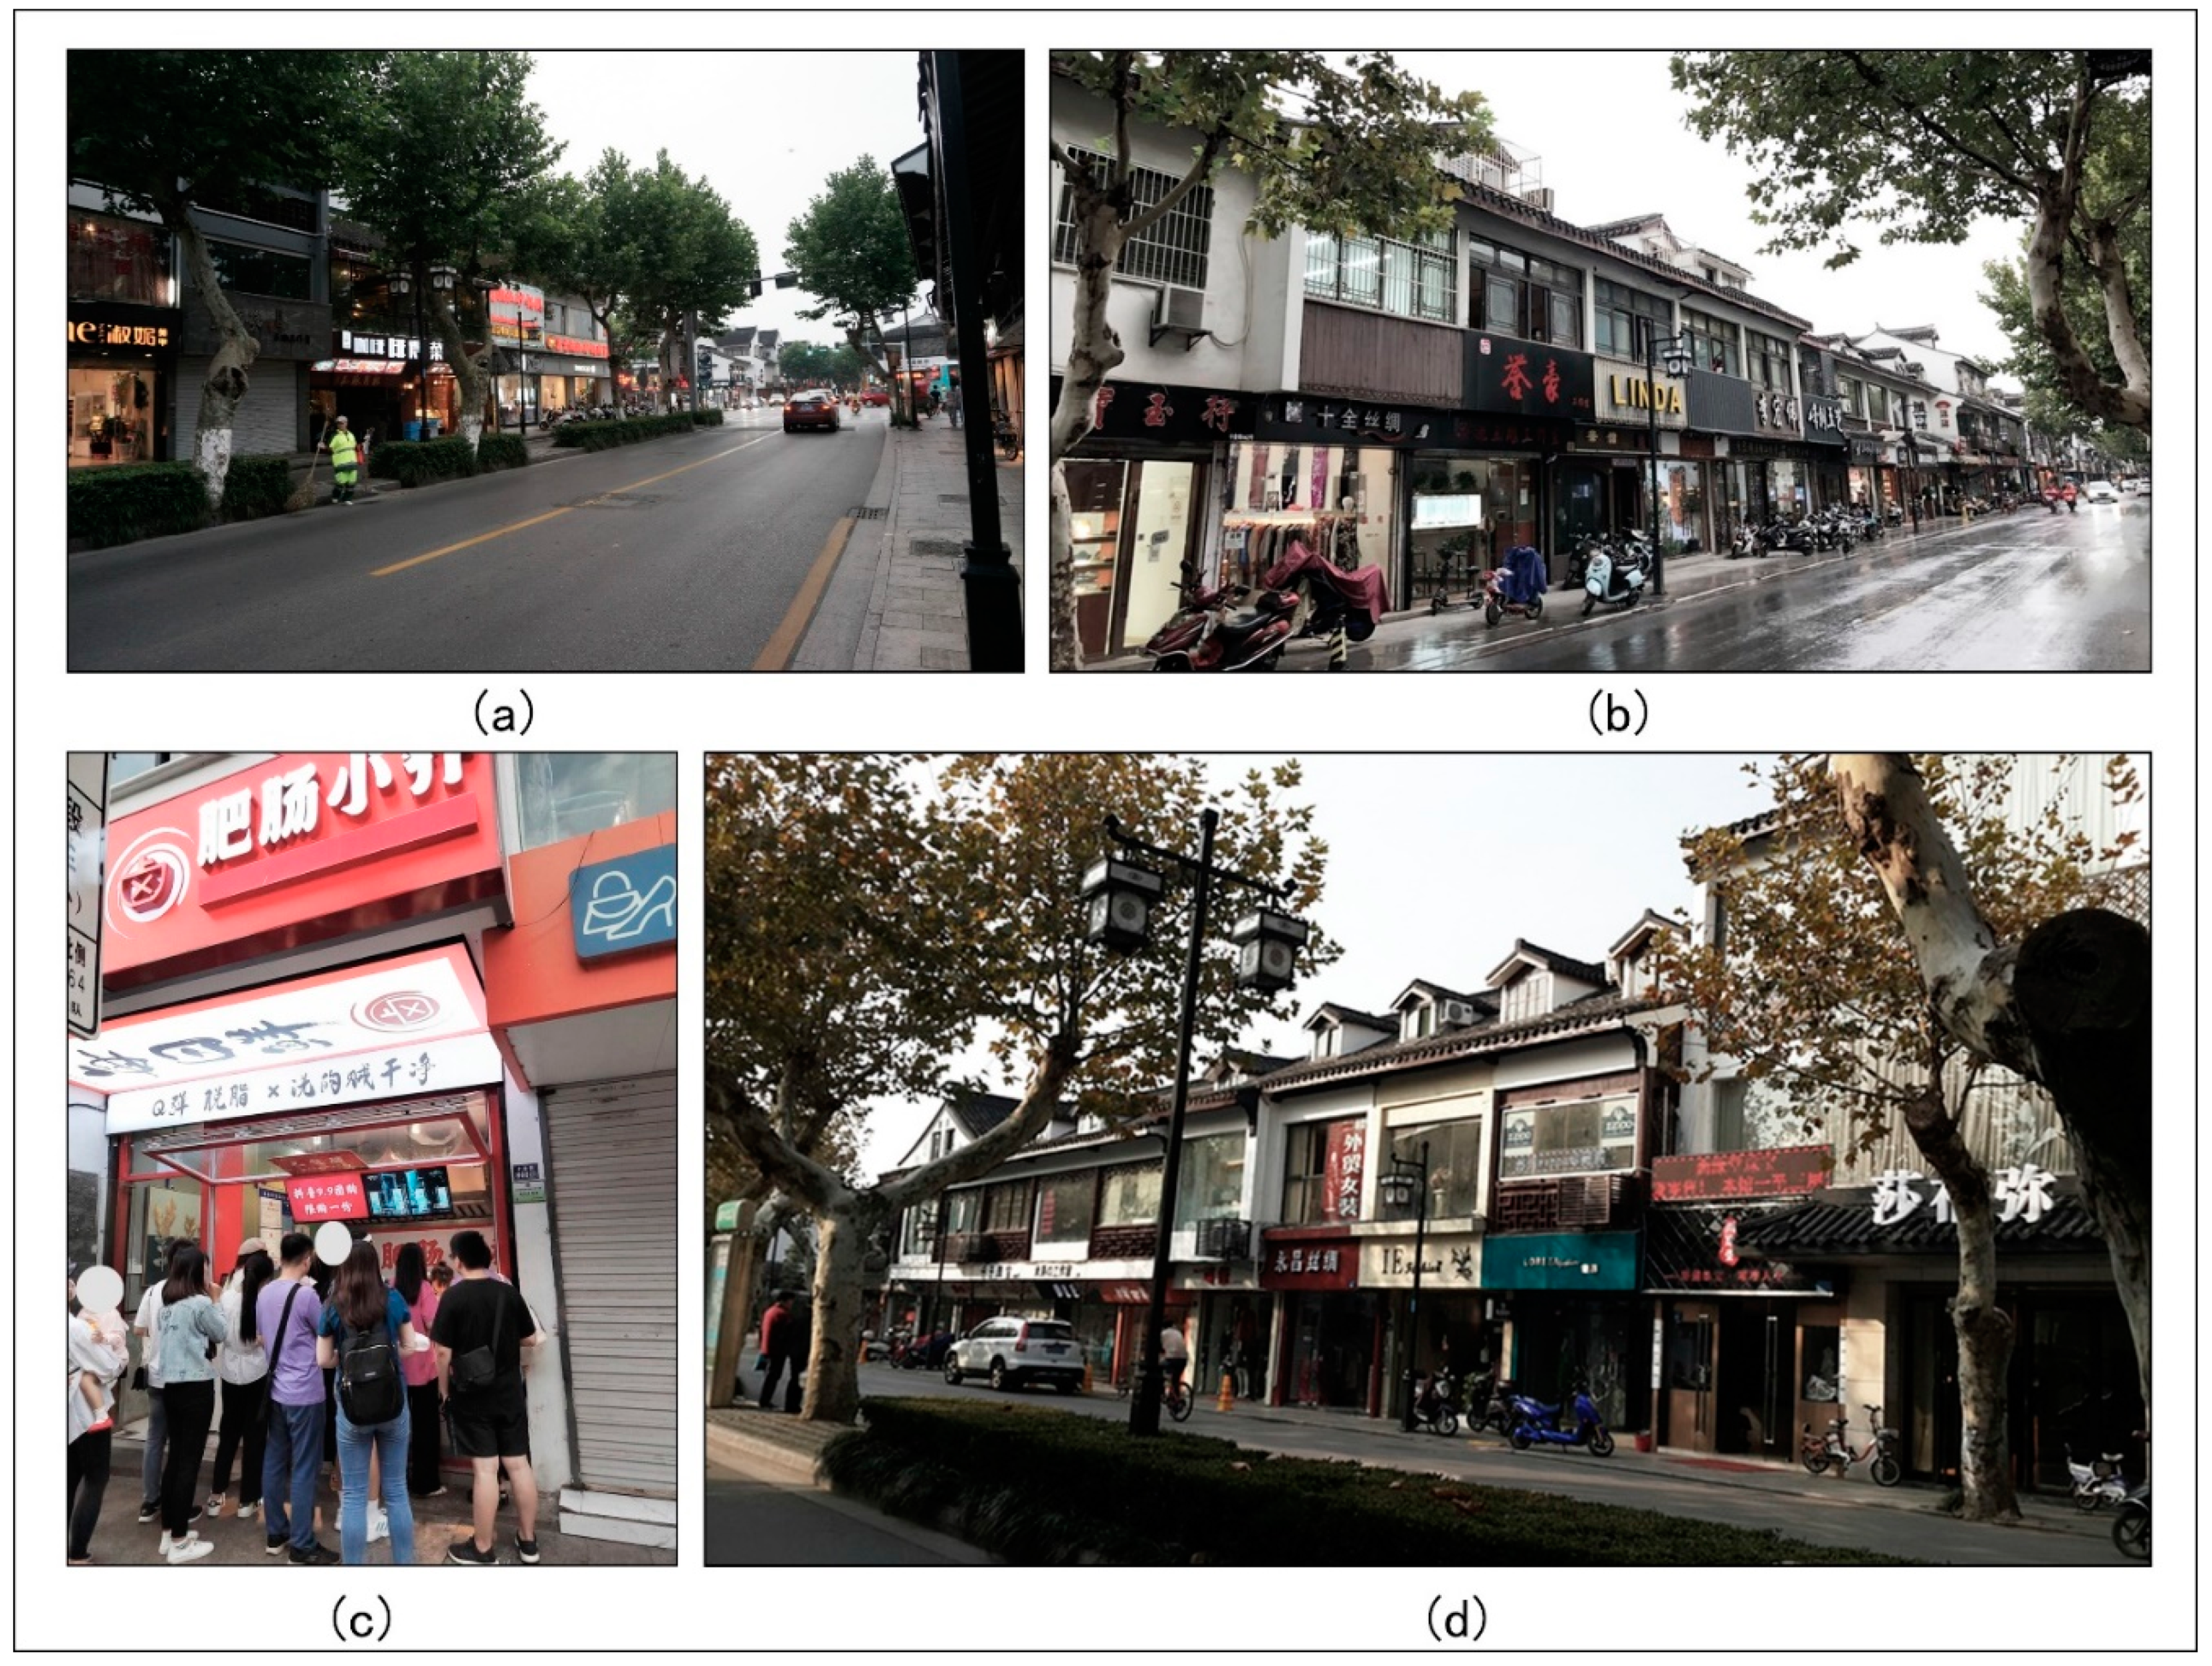
At present, Shiquan Street has developed into an important tourist attraction andcommercial district. There are many traditional handicraft shops, tea houses, cafes, and restaurants in the blocks, attracting a large number of tourists and local residents from other places to appreciate and shop. The Suzhou Municipal Government has also stepped up its efforts to protect and renovate Shiquan Street, and committed to maintaining the original style of the blocks, so as to improve its cultural value and tourist attraction. The color features still play a large part in the composition of the outlooks of Shiquan Street. Intraditional architectures, blue, white, and gray are the dominant colors, which are not only used in architecture, but also become important references for the design of historical areas. However, until today, the commercial use of colors in the historical areas of Shiquan Street has not been systematic and scientific, and the uses of colors are relatively disconnected from the street style, resulting in a weak sense of belonging in color design (Figure 2). The colors without scientific analysis and extraction have disrupted the overall outlooks of the blocks, making it difficult for tourists to experience the true style of the historical areas and falling into a poor sense of experience. Therefore, it is necessary to explore a scientific and efficient method to extract the colors of historical areas and propose relevant application strategies.

2.2. Research Methods

2.2.1. Overview of the Overall Research Process

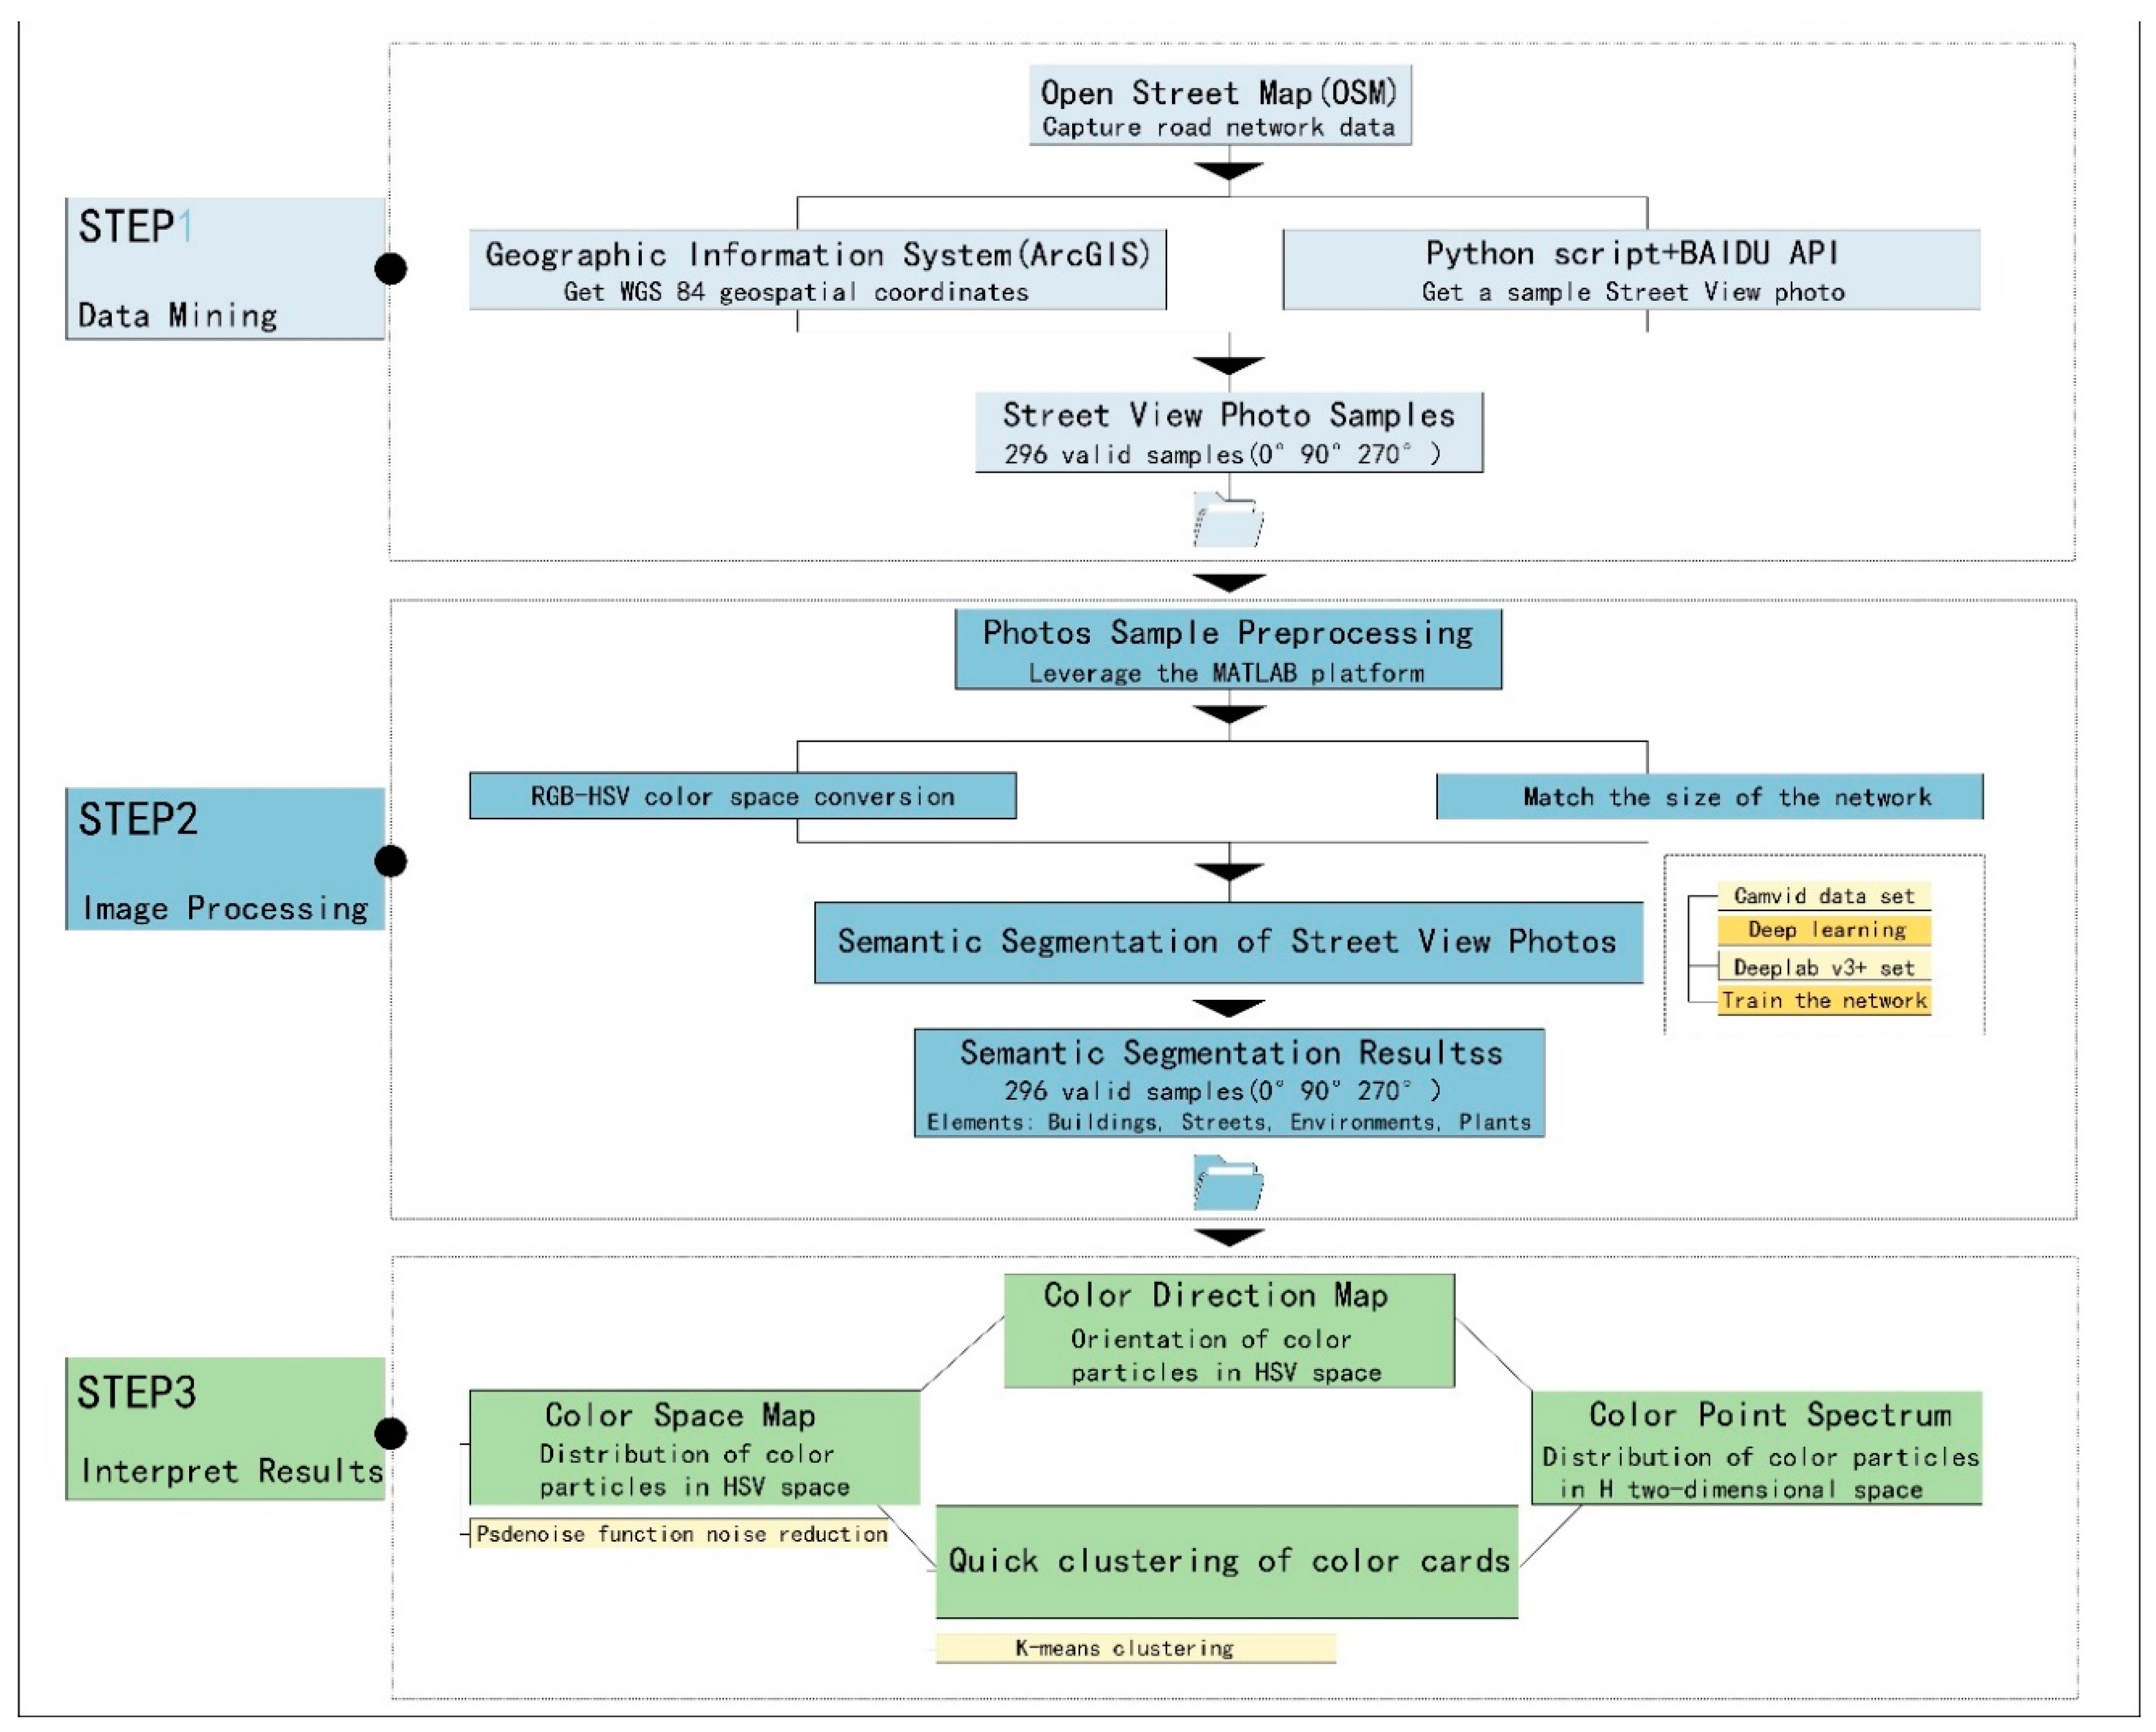
In terms of acquiring street view samples of historical areas, the original street view samples were obtained by capturing data from the historical areas of Shiquan Street, which provided sample support for subsequent research. The computer vision image processing technology was mainly used to complete the semantic segmentation of samples, including semantic segmentation and color correction of images using open source datasets, and then various color clustering were performed on various samples to provide technical support for the conclusion (Figure 3).

2.2.2. Street View Photo Sample Acquisition

The street view photo samples in the early stage was mainly acquired relying on the use of Open Street Map, ArcGIS and API platform of Baidu, which were used to acquire existing street view photo samples on a large scale and accurately. When collecting a large number of samples in historical areas, this method could replace handheld cameras to achieve more accurate and faster batch data collection.
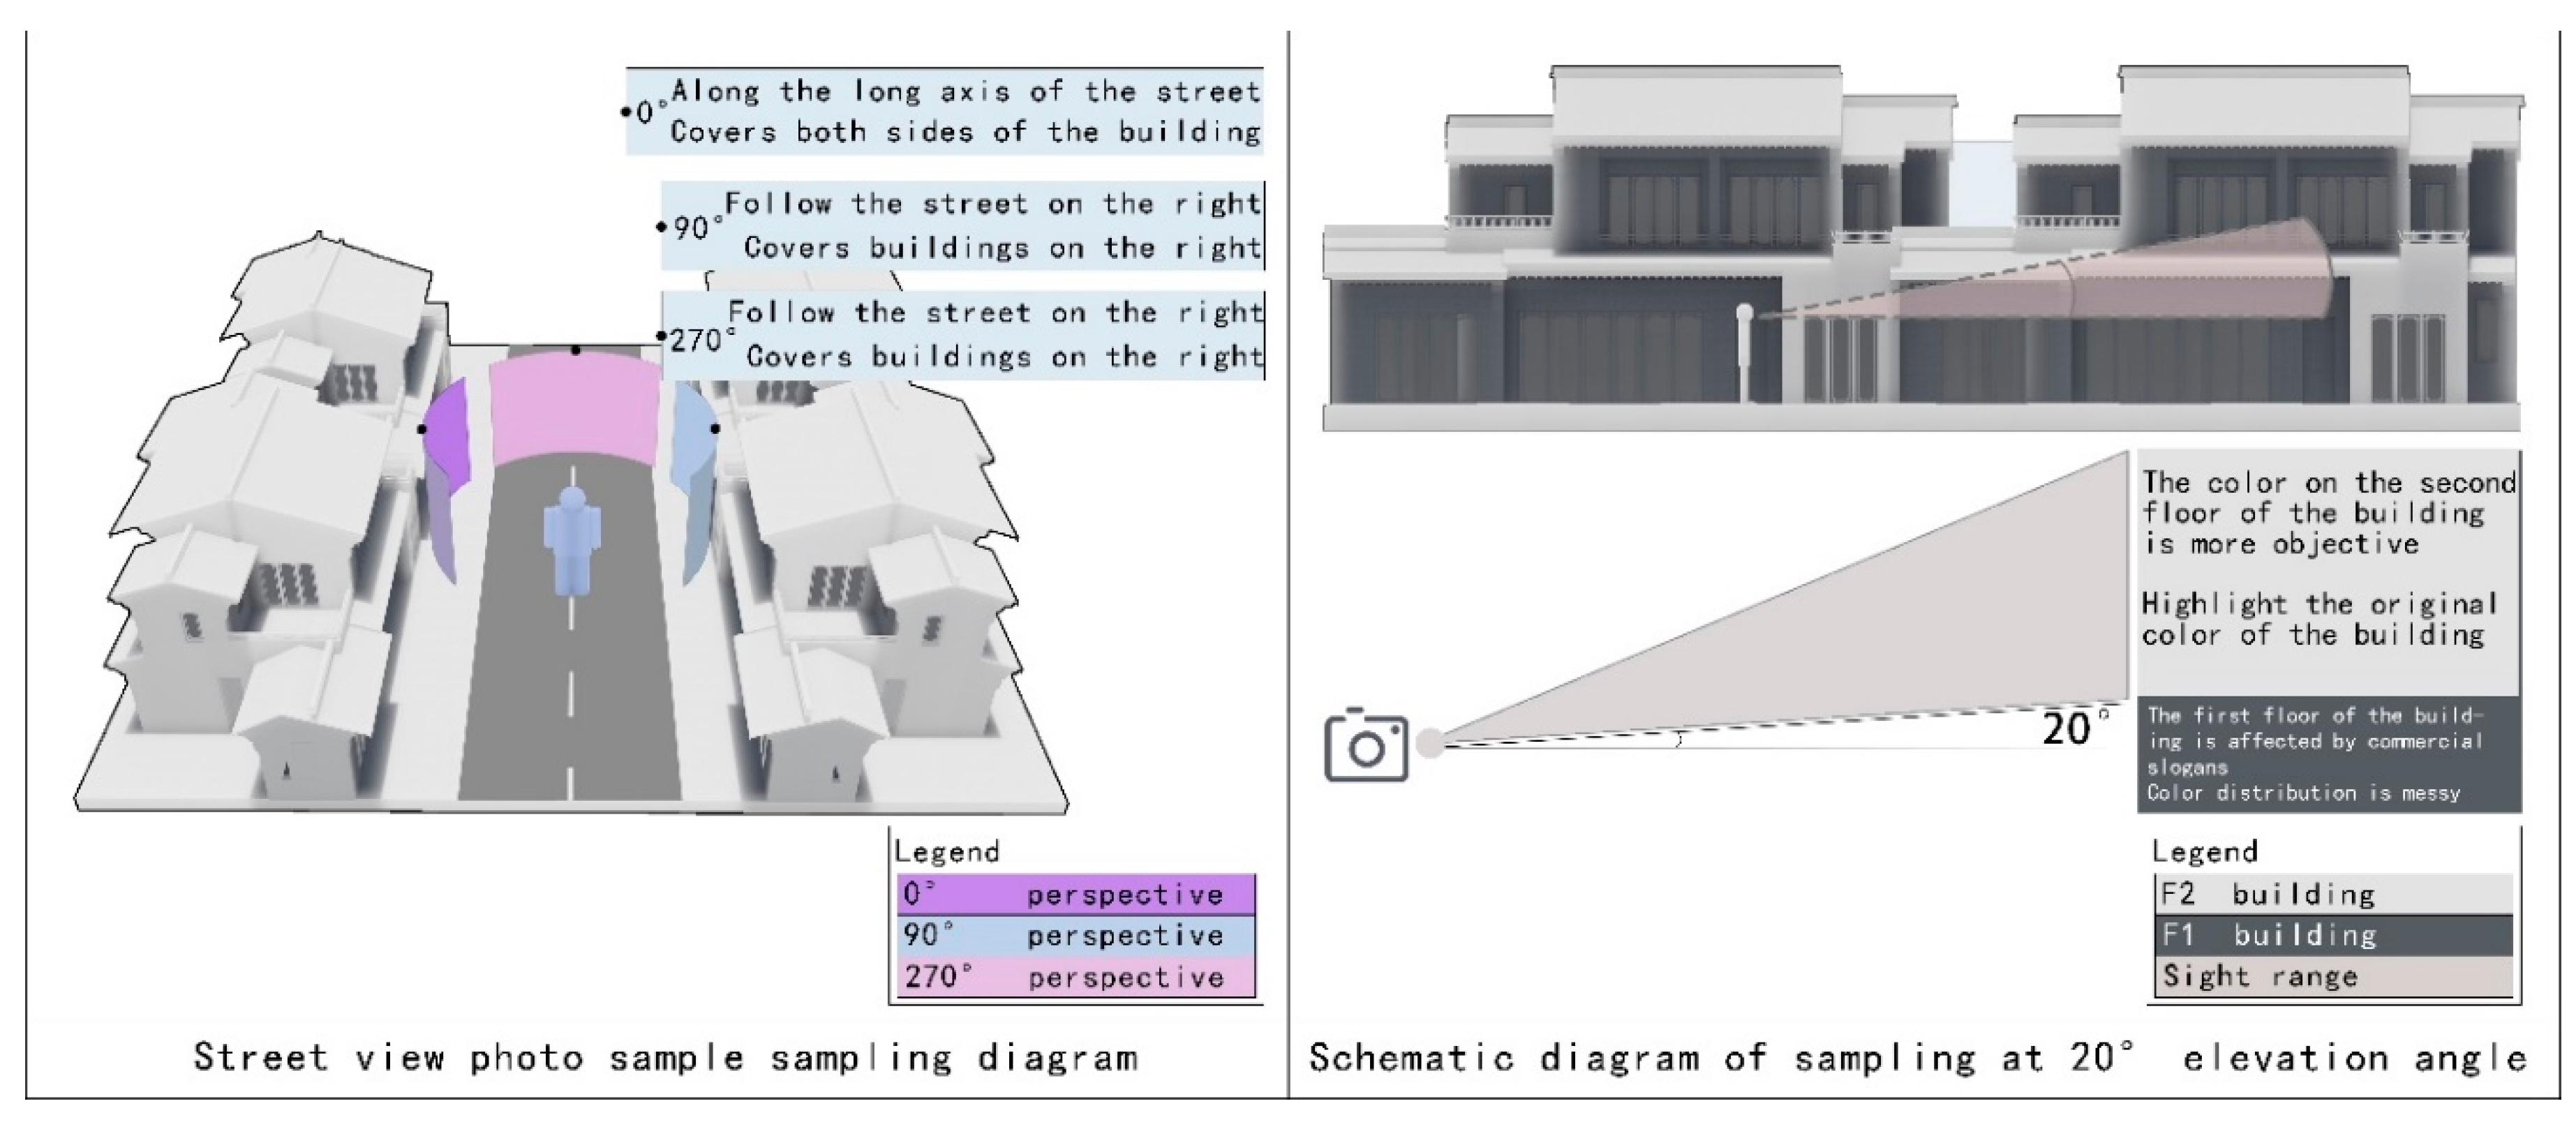
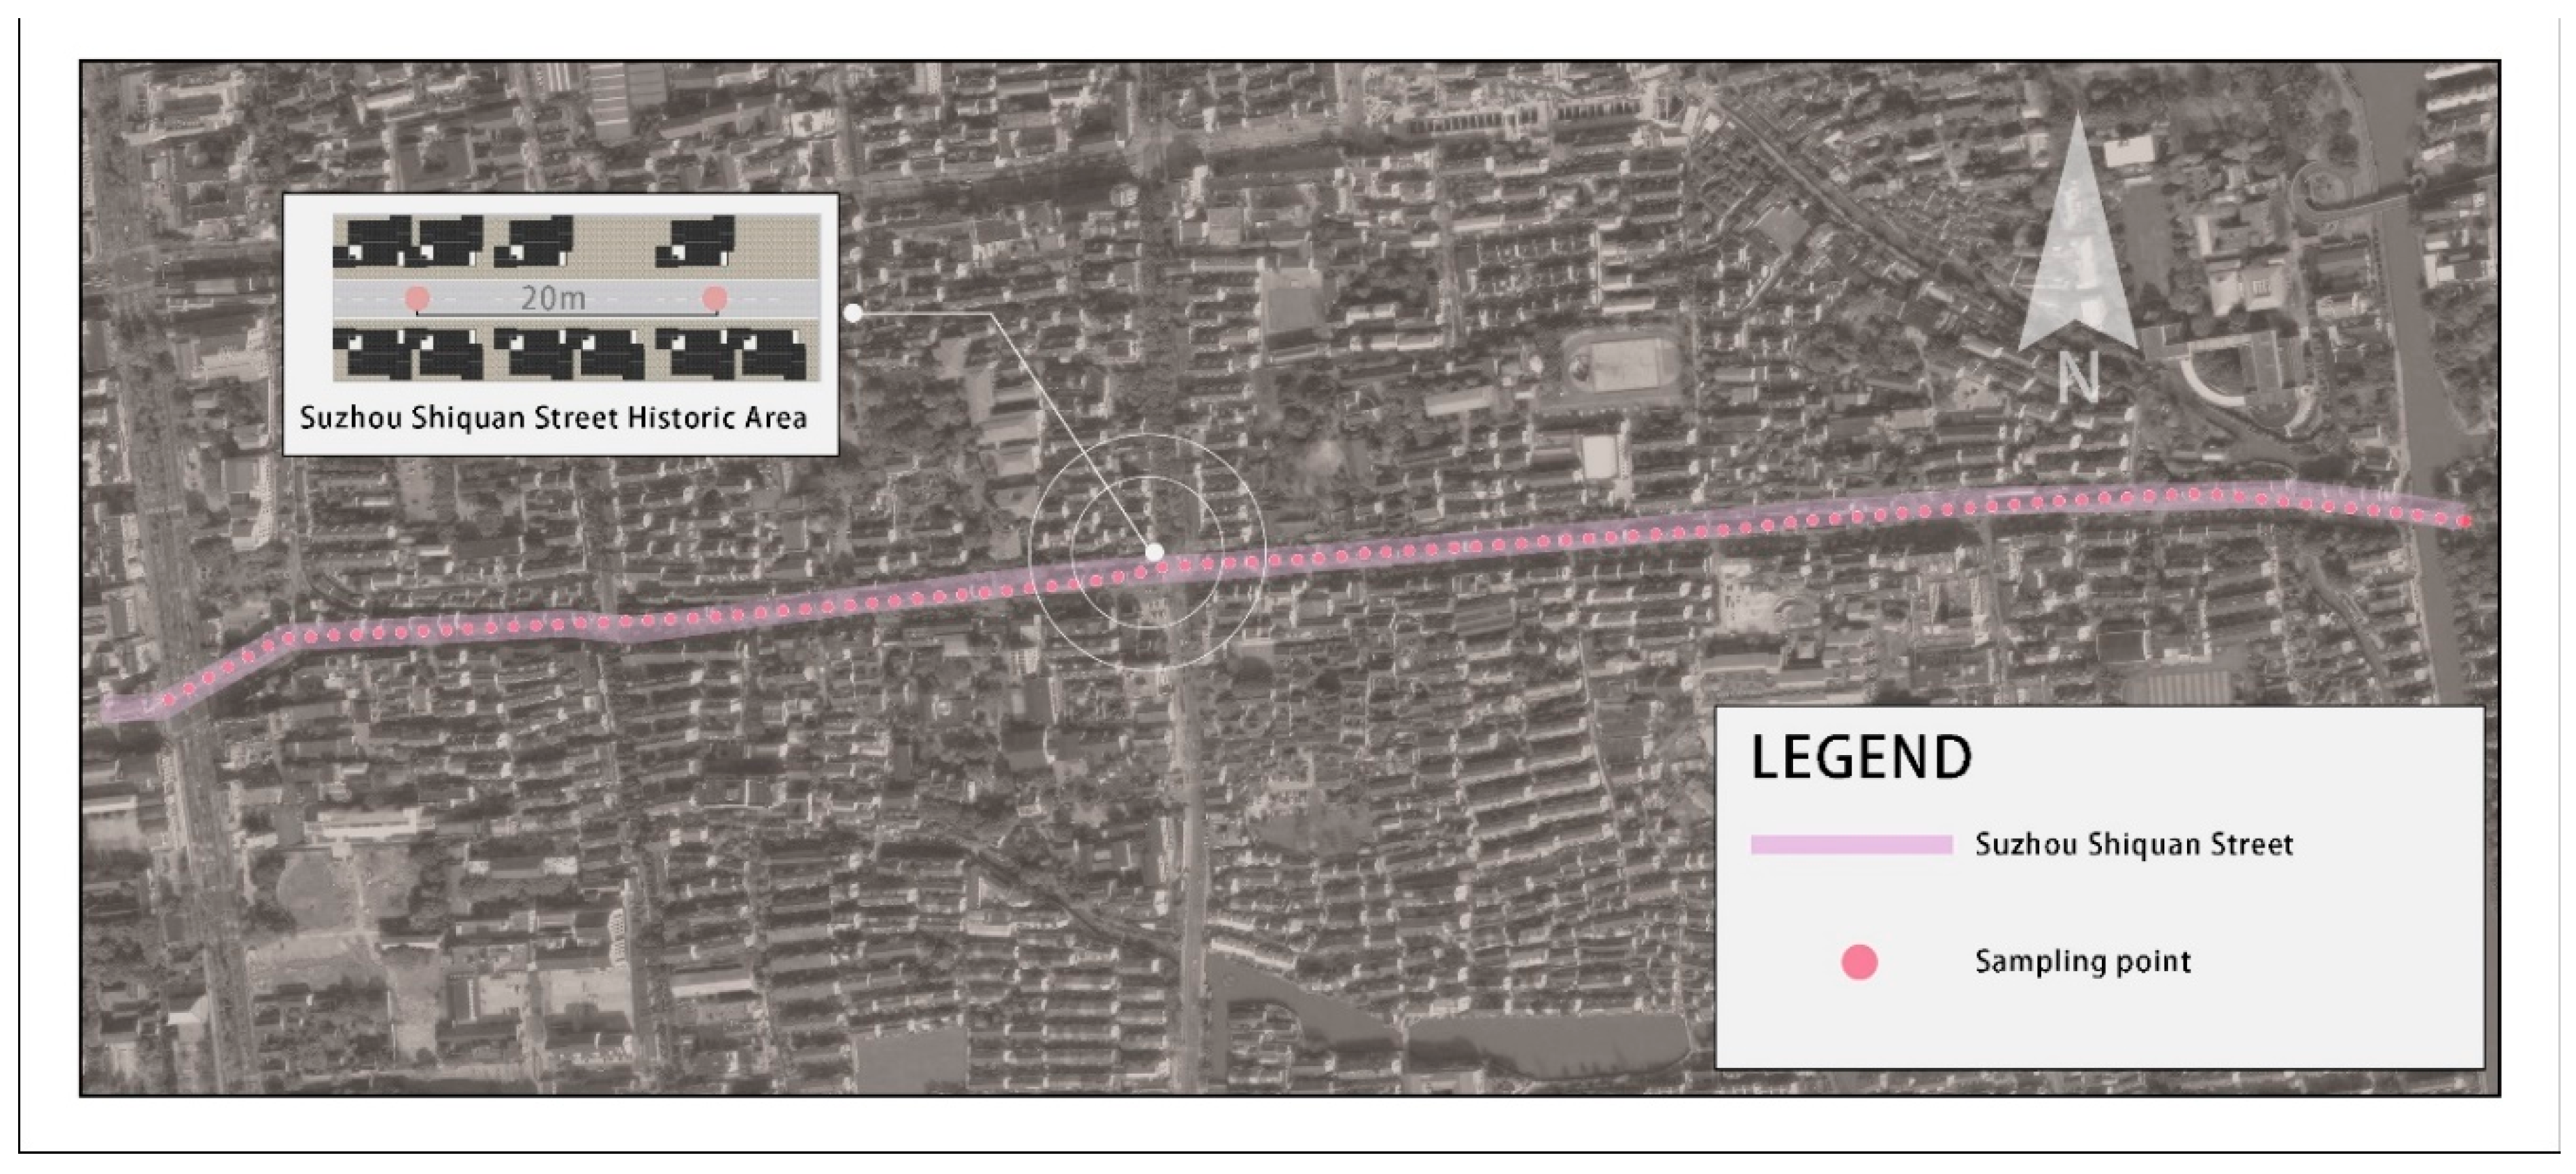
Firstly, the road line data of Shiquan Street was captured using the Open Street Map, and its built-in wgs84 coordinate system could directly match the ArcGIS10.5 geographic information system without the need for coordinate correction. After importing the road line data of Shiquan Street into the ArcGIS10.5 platform, the roads were segmented, and the roads were dotted every 20 m as the street view sampling points. Point positions were added and adjusted according to the actual situation, and a total of 105 effective coordinate points were obtained for subsequent sample extraction (Figure 4). Secondly, Python scripts were used to call the API platform of Baidu to acquire street view photo samples, and after coupling the coordinate data of 105 effective coordinate points, the street view photo samples of Shiquan Street were acquired. In order to better identify the building data in the street view photo samples for subsequent semantic segmentation, the street view photo samples were sampled at 20° elevation angle, and 3 sets of photos were set to the perspectives of 0°, 90°, and 270° (road front view, left side view, and right side view), respectively (Figure 5). By removing some invalid samples, a total of 296 street view photo samples were acquired.

2.2.3. Street View Photo Sample Processing

In this part, Matlab was mainly used to complete mid-term experiments, which were divided into two sections. The first section was for sample preprocessing and semantic segmentation, while the second section was for color clustering of samples. The experiments of both sections were conducted on the Matlab2020.
The preprocessing stage of the samples in the first section mainly included two steps. The first step was to carry out semantic segmentation to the existing street view samples into sizes matching the network Deeplab V3+ in Matlab, where the original street view sample image size is H × W , and the target size is H 0 × W 0   The calculation formula is:
v a l u e = H 0 W 0 × W H
The second step was to interpret the color space of the images. The color space of the street view photo samples was RGB color space, while the color space required for the research was HSV color space. Therefore, it was necessary to convert the color space of the street view photo samples on the Matlab platform. A three-dimensional coordinate system was established with 3 values of “ r , g , and b ”, which were real numbers with a value ranging between 0 and 1. At the same time, the max value was set to be the maximum value among the 3 values of r , g , and b , and the min value to be the minimum value among the 3 values of r , g , and b , The conversion formula is:
h = 0 , i f   m a x = m i n 60 × g b m a x m i n + 0 , i f   m a x = r   a n d   g b 60 × g b m a x m i n + 360 , i f   m a x = r   a n d   g < b 60 × b r m a x m i n + 120 , i f   m a x = g 60 × r g m a x m i n + 240 , i f   m a x = b
                                                                                                        s = 0 , i f   m a x = 0 m a x m i n m a x = 1 m i n m a x , o t h e r w i s e
    v = m a x
At this point, the preprocessing for the street view photo samples was completed, and the next step of the experiment could be carried out.
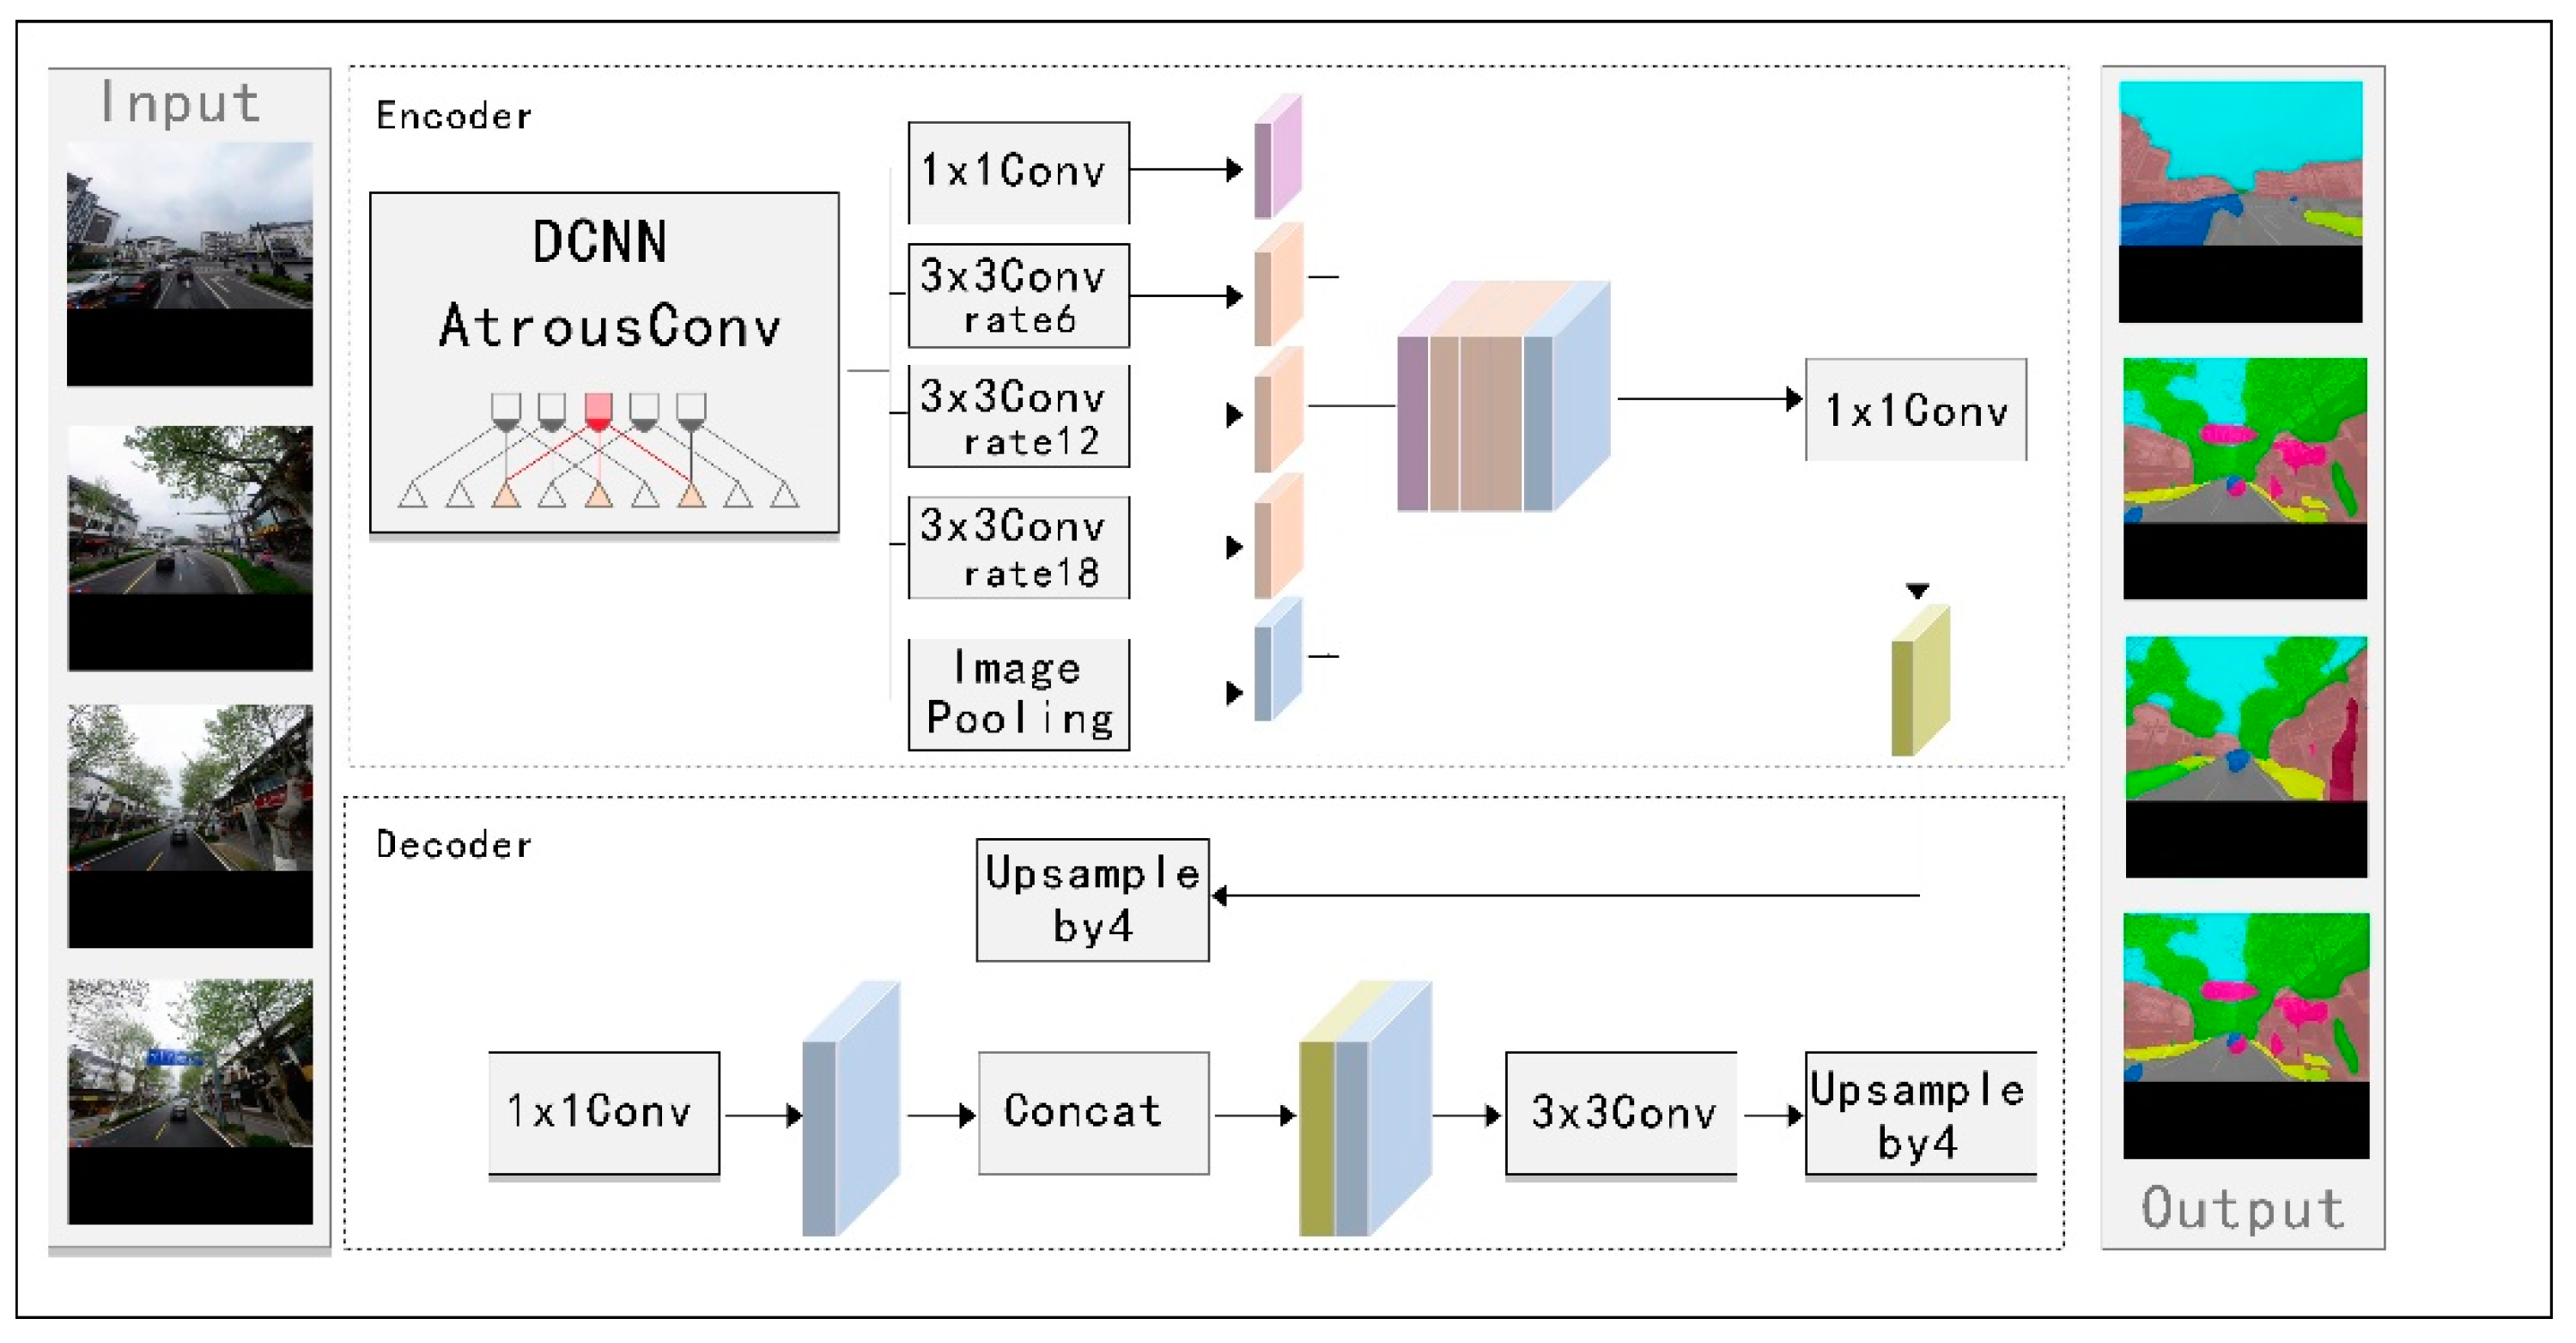
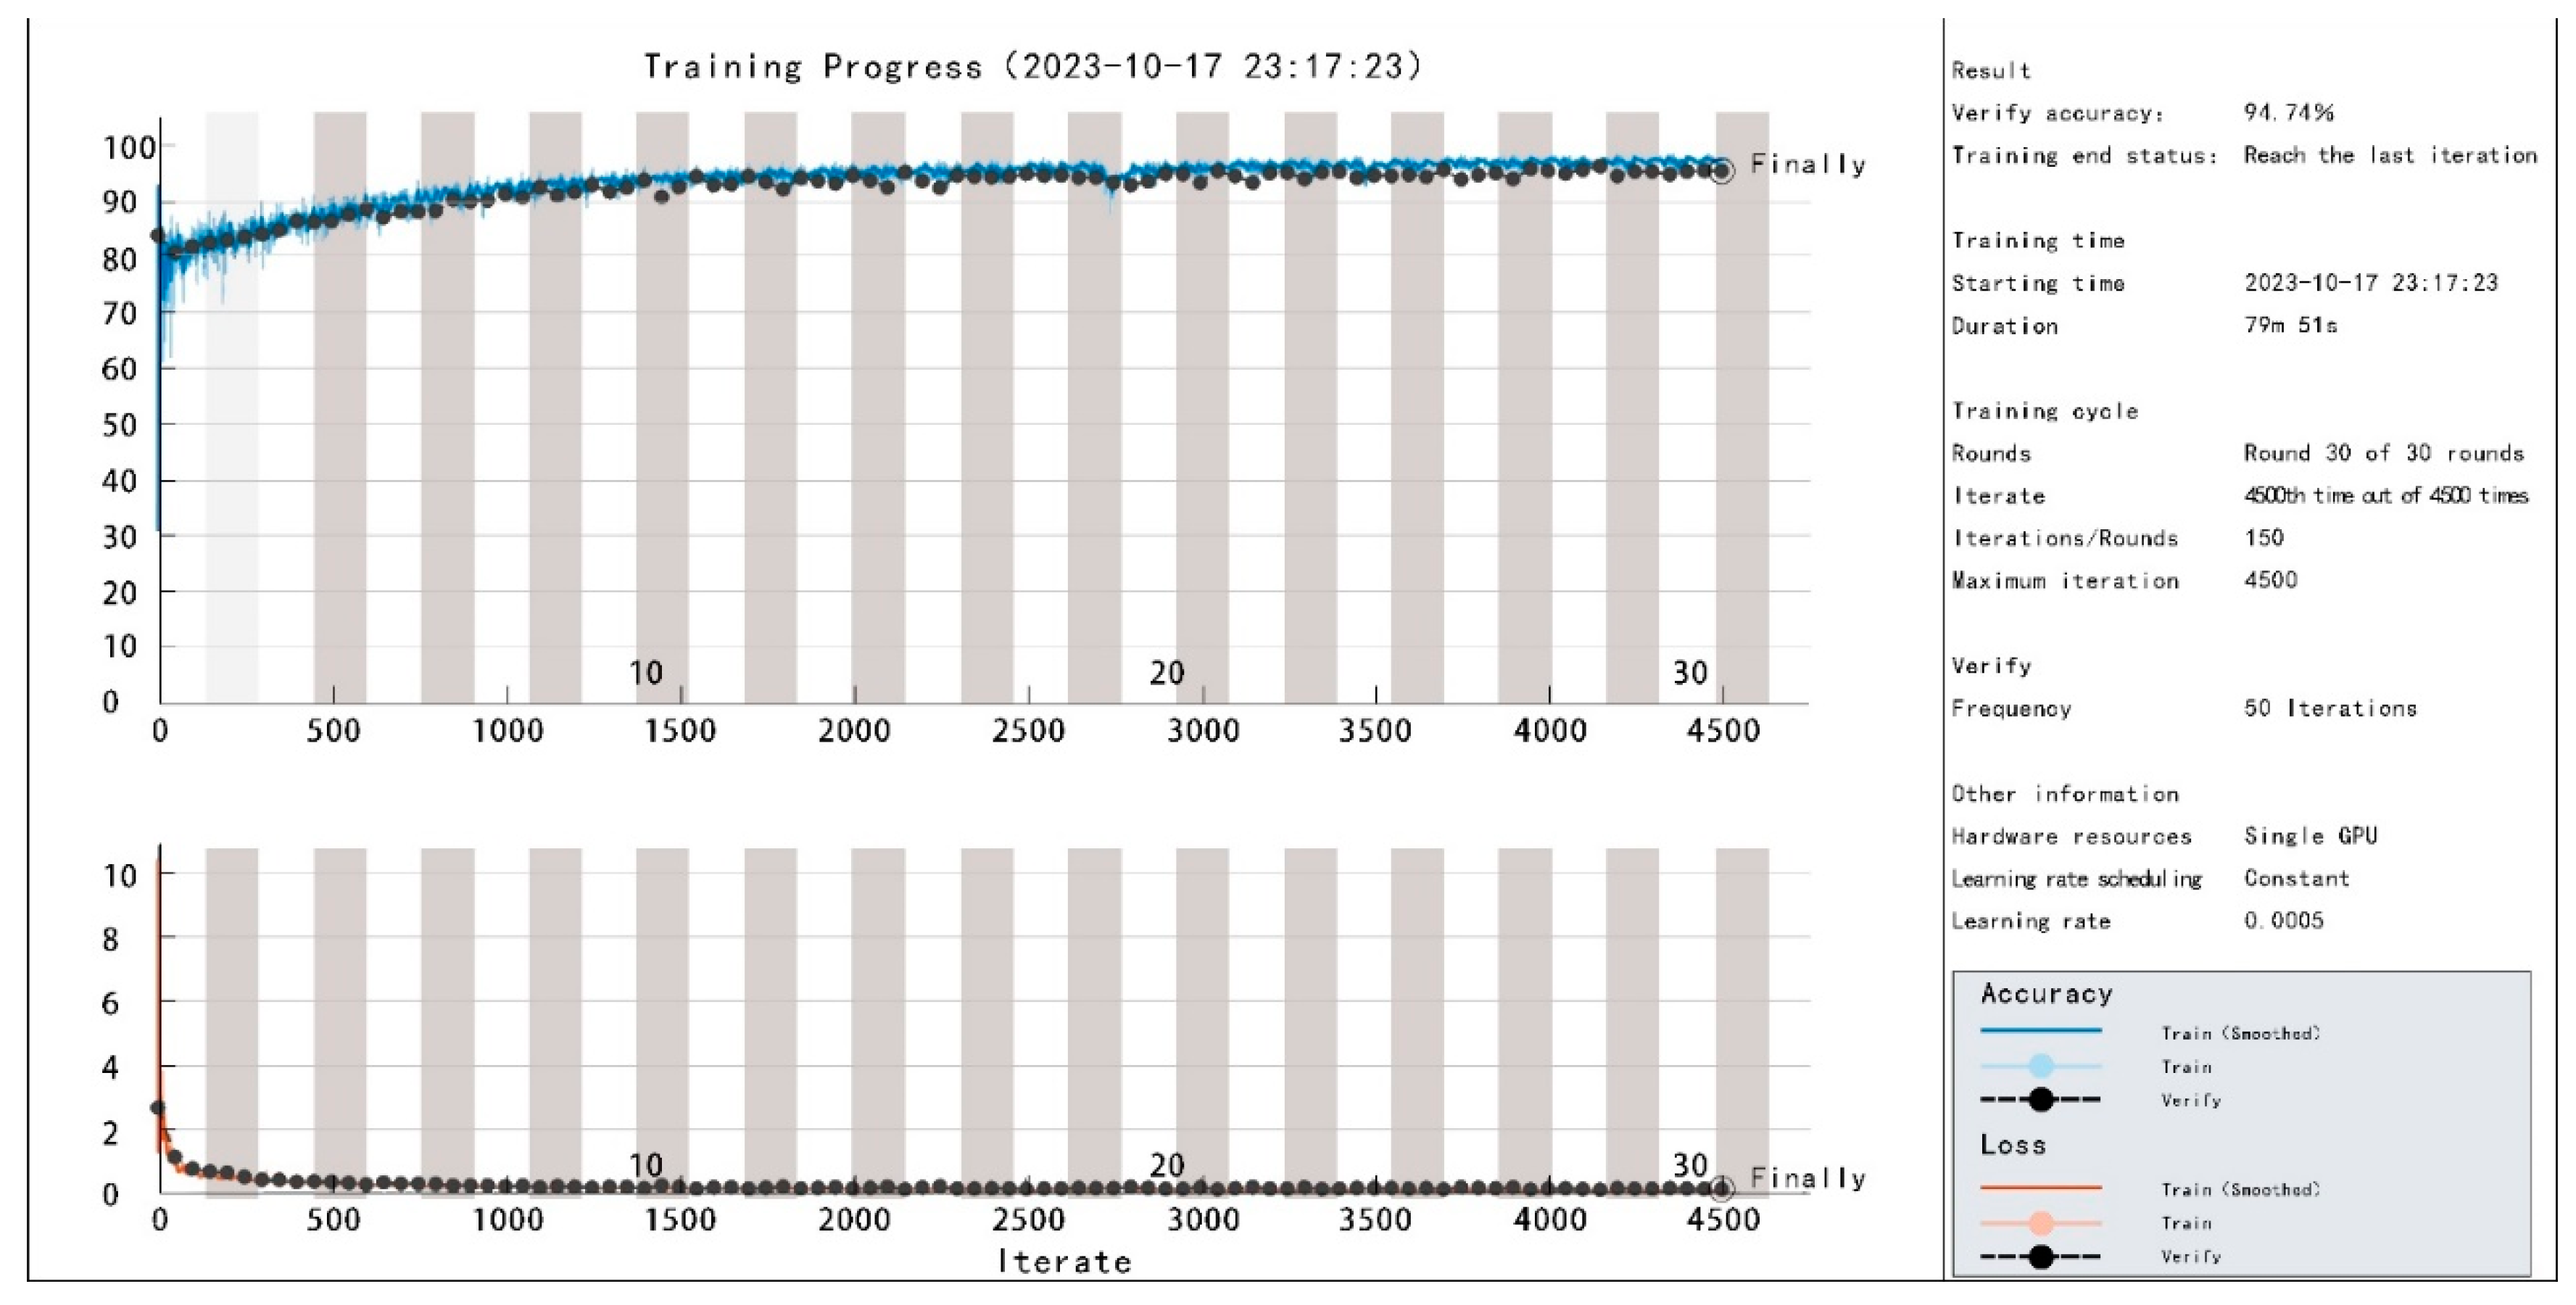
The semantic segmentation of samples in the first section was mainly completed relying on deep learning. In this section, CamVid dataset and Deeplab v3+ network were used for training. Open source datasets could quickly and extensively replace manual annotation and cooperate with training networks to complete semantic segmentation of samples. At the same time, compared with most commonly used open-source datasets in current research, the CamVid dataset was the first video set semantic segmentation dataset with target category semantic labels. Unlike various datasets widely used in existing visual research, the CamVid dataset is usually used in the field of autonomous driving abroad, and with high semantic segmentation ability, it can identify various elements in street view photo samples more clearly and accurately, avoiding the interference of other elements into the target elements, which may cause interference with the experimental results. In the deep learning part, the CamVid dataset was used for the deep learning training of the Deeplab v3+ network (Figure 6). The training iterations were set to 4500 times, and the accuracy after training reached 94.74 % , meeting the accuracy requirements for subsequent experiments (Figure 7).
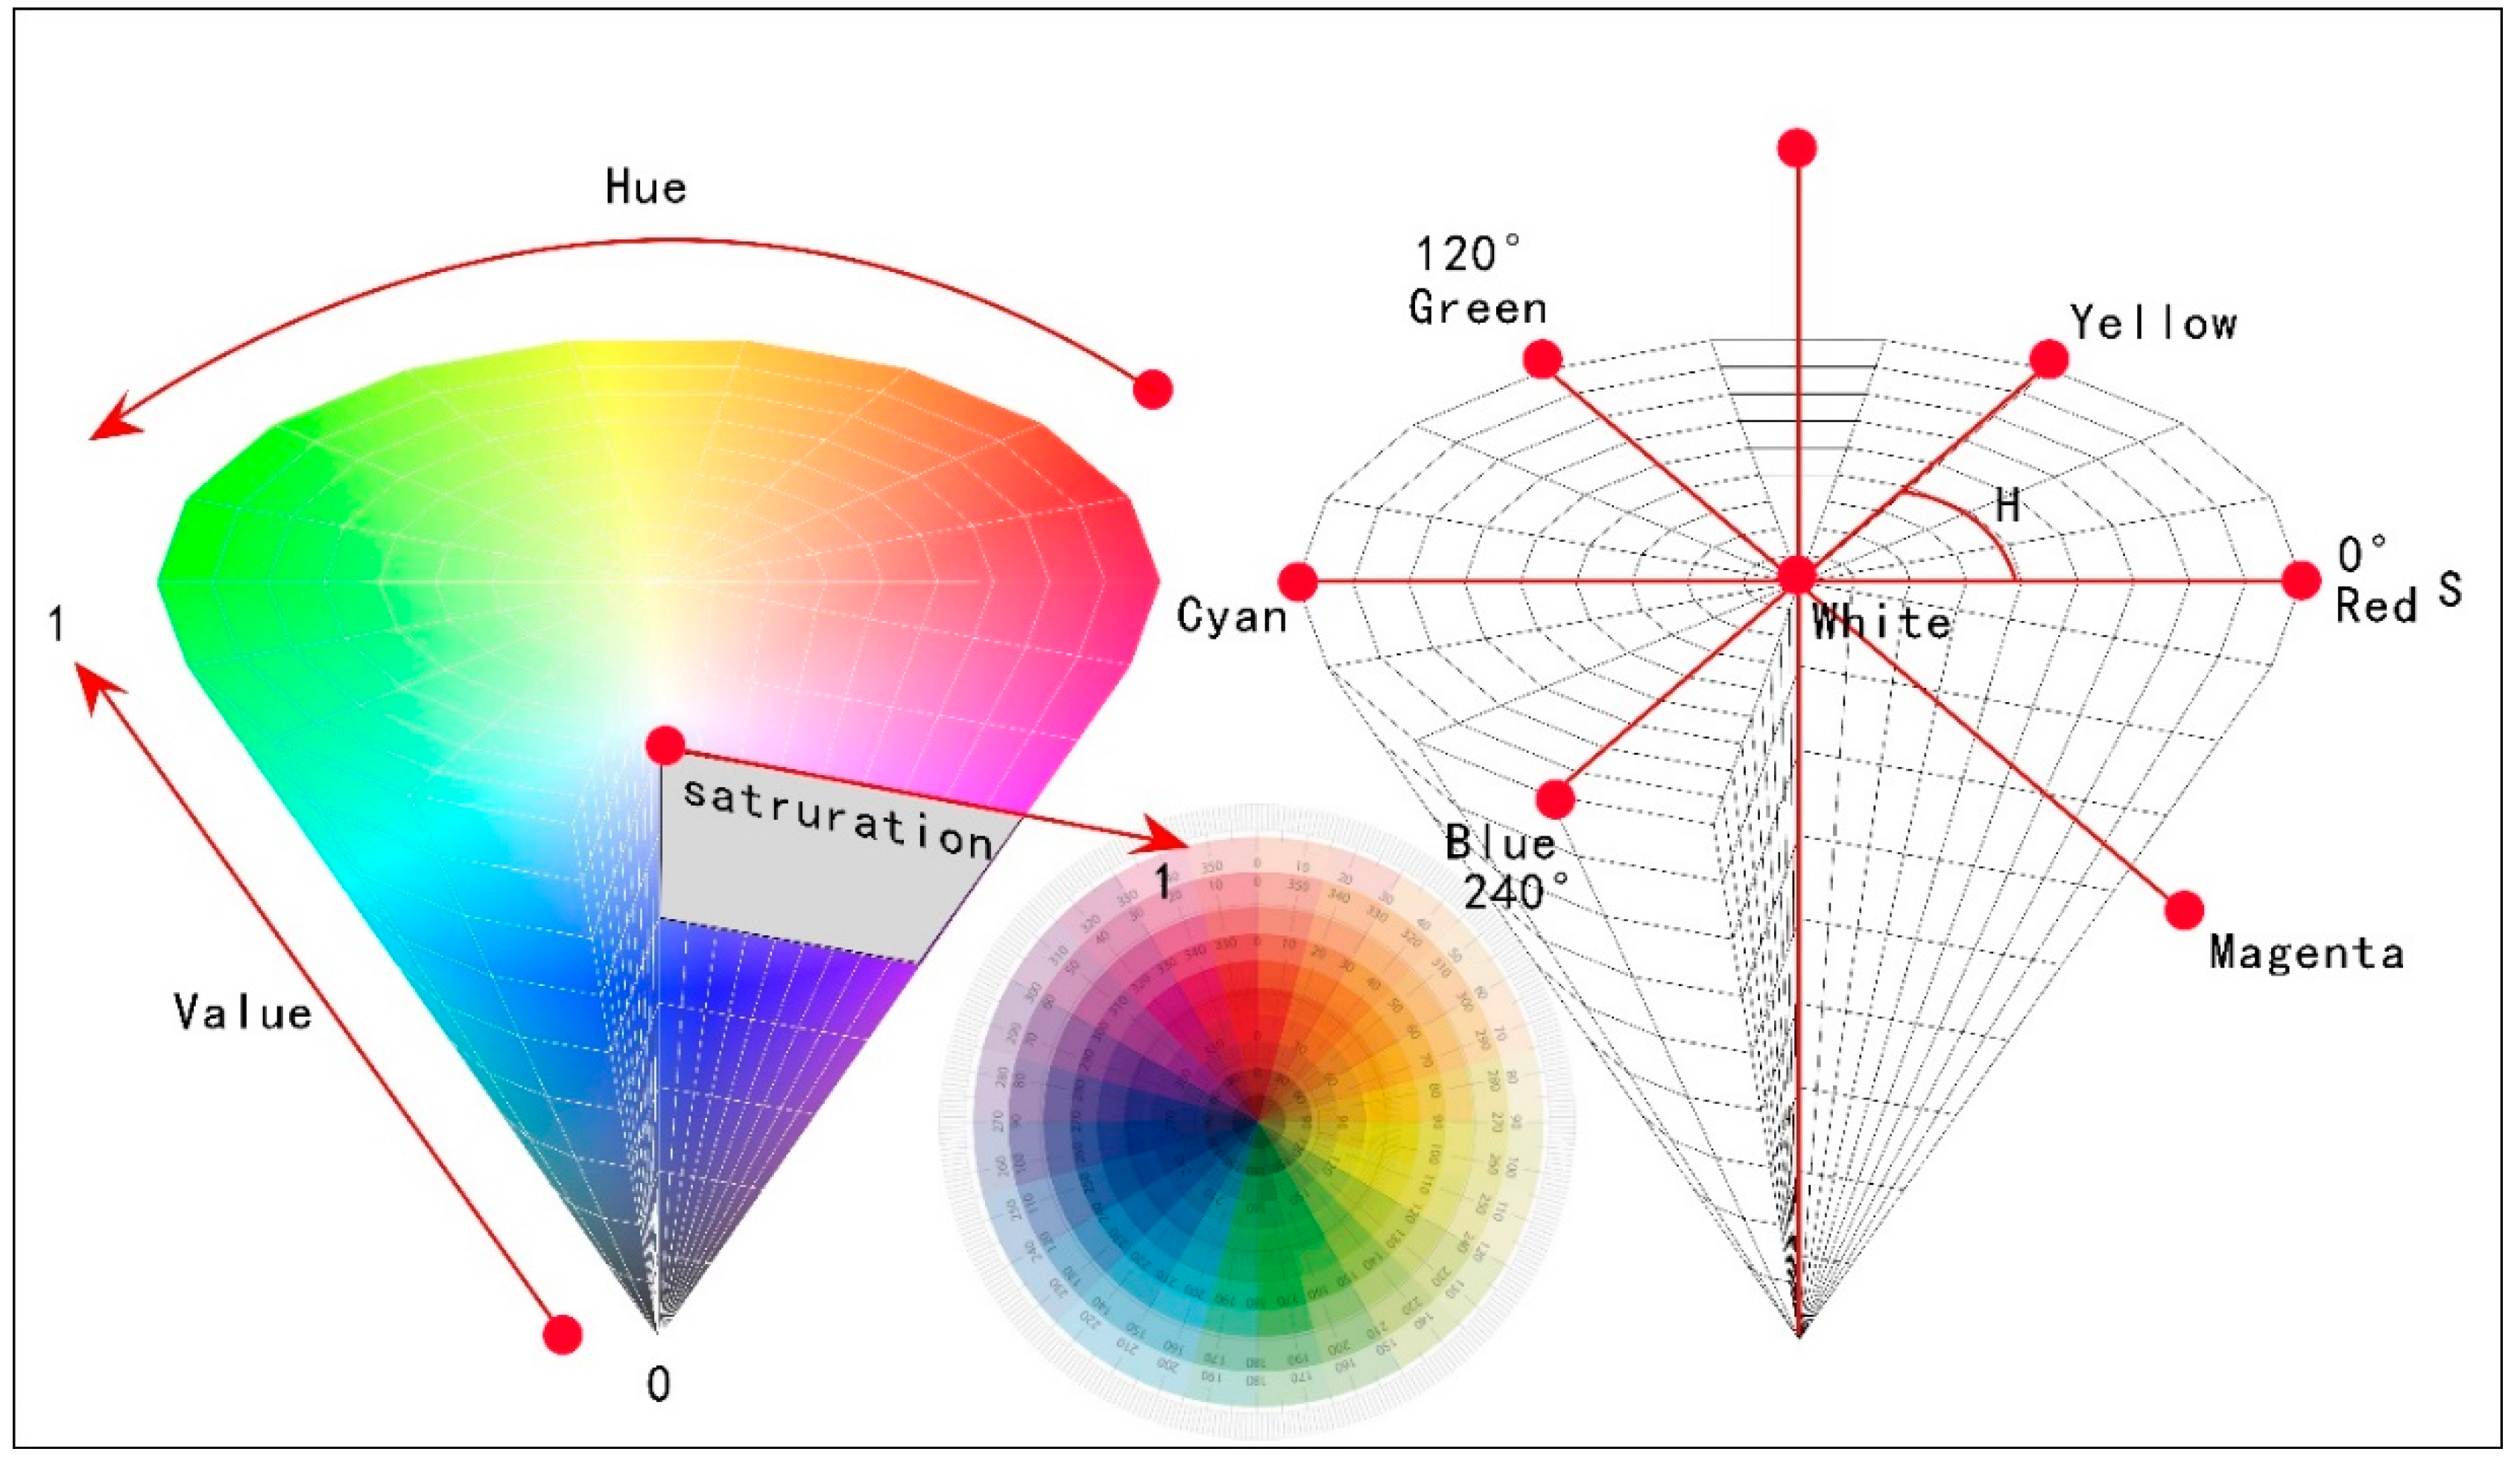
The color clustering of samples in the second section mainly referred to the basic color composition of target elements and the visual extraction and generation methods of various color clustering models proposed by Fu Qian [28] and Miao Mingrui [29]. The principle of this section was to extract the HSV color codes of each pixel after pixelization of the target elements, and a three-dimensional cylindrical coordinate system was established with the H value (hue) as the radius of the cylinder bottom pointing (0◦-360◦), the S value (saturation) as the length of the cylinder radius, and the V value (brightness) as the cylinder (Figure 8). The three-dimensional cylindrical coordinate system could be rearranged according to the HSV color codes, intuitively reflecting the position of color particles of each pixel in the color space, which helped to explore the architectural color composition of historical areas, and could further explore the spatial color context and color genes of historical areas. After comprehensive color visualization of the building, the results could be used in the design of historical areas. Selecting color particles from the experimental model for secondary color design could truly achieve the harmonious unity of architecture, environment, and color, and also highlighted the important significance of color in reflecting the unique features of historical areas and regional culture.

2.2.4. Block Color Model Generation

This part was divided into 3 sections in total:
The first section aimed to explore the color application strategies related to historical areas based on the colors of buildings on both sides of Shiquan Street. Matlab was used as the platform to rearrange the HSV color space of the architectural colors of Shiquan Street, and the color visualization results were presented in the forms of “color particle direction map” (hereinafter referred to as direction map) and “color particle space map” (hereinafter referred to as space map). The branch direction of the color bands in the direction map could show the dominant color range of the “H-S”-oriented design of Shiquan Street. For further exploration, the space map could be compared with street view photo samples to explore the distribution of overall color particles in the HSV color space, which could be used as interval color bands for color application strategies. It should be noted that the environment of Shiquan Street in Suzhou is different from that of other historical areas in cities. The buildings in the architectural street view photo samples are mostly white (visual colors not clustered colors). Therefore, to ensure the accuracy of color visualization, it was necessary to perform pcdenoise function denoising on the directional and spatial maps in the color visualization results. Different from ordinary image denoising, this function denoising determines whether the point is an outlier by calculating the average distance between each point and K-nearest neighbor point, which is compared with the average distance of all points and the threshold determined by the standard deviation. In this study, outliers were regarded as color particles that accidentally entered the segmented image, and had little reference value compared to mainstream architectural colors, which could be removed.
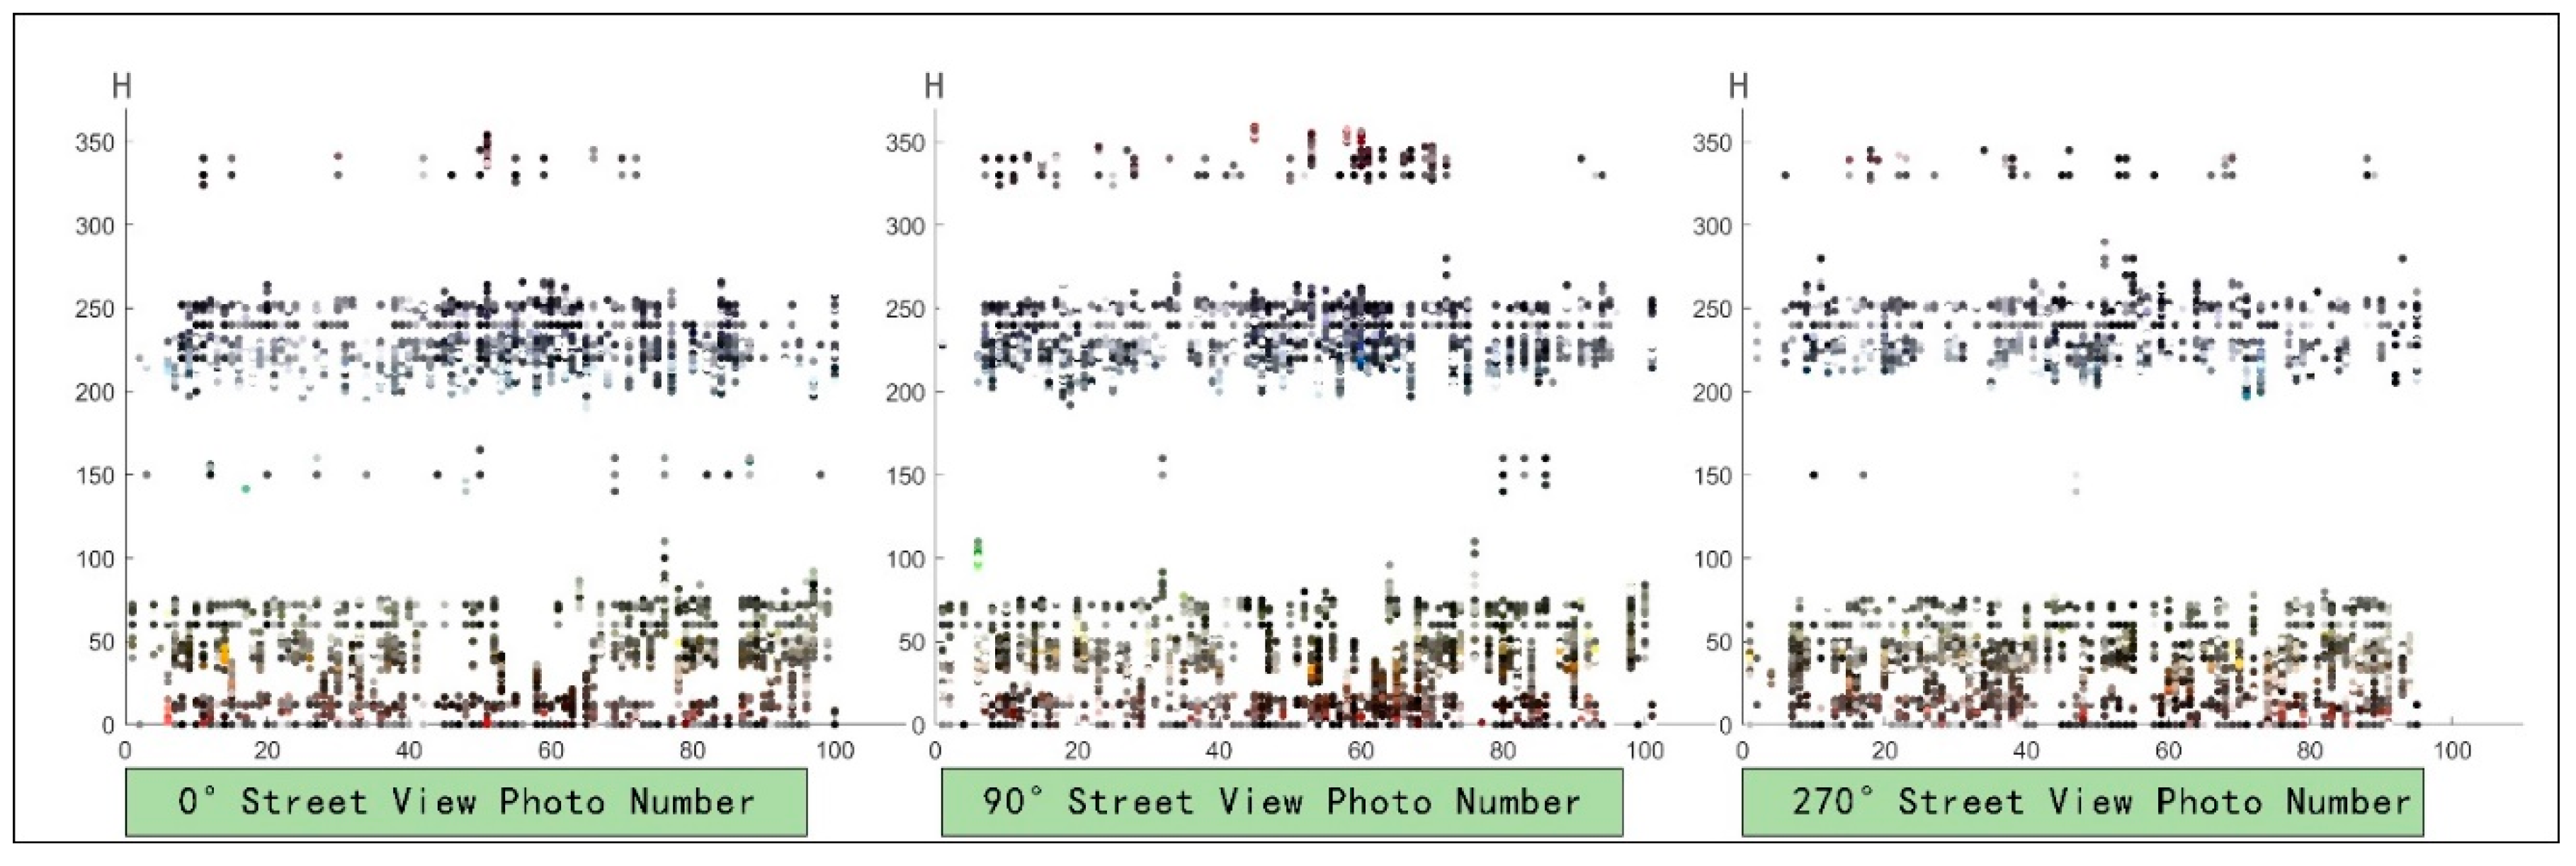
The second section aimed to better explore the color continuity of Shiquan Street. In order to further clarify and guide the design color of Shiquan Stree, the sample numbers of the 0° street view samples, 90° street view samples, and 270° street view samples were used as the axis X, and H values were used as the axis Y to generate building color point spectrum (hereinafter referred to as point spectrum). Point spectrum could simulate the overall color continuity and rhythm of Shiquan Street, which helped to couple the color matching scheme of architectural color selection and application, highlighting a certain degree of color interest and rhythm. In order to explore the continuous point spectrum and visualize the content more clearly, the study excluded color particles that accounted for less than 20% of the total color particles and retained color particles that accounted for a larger proportion.
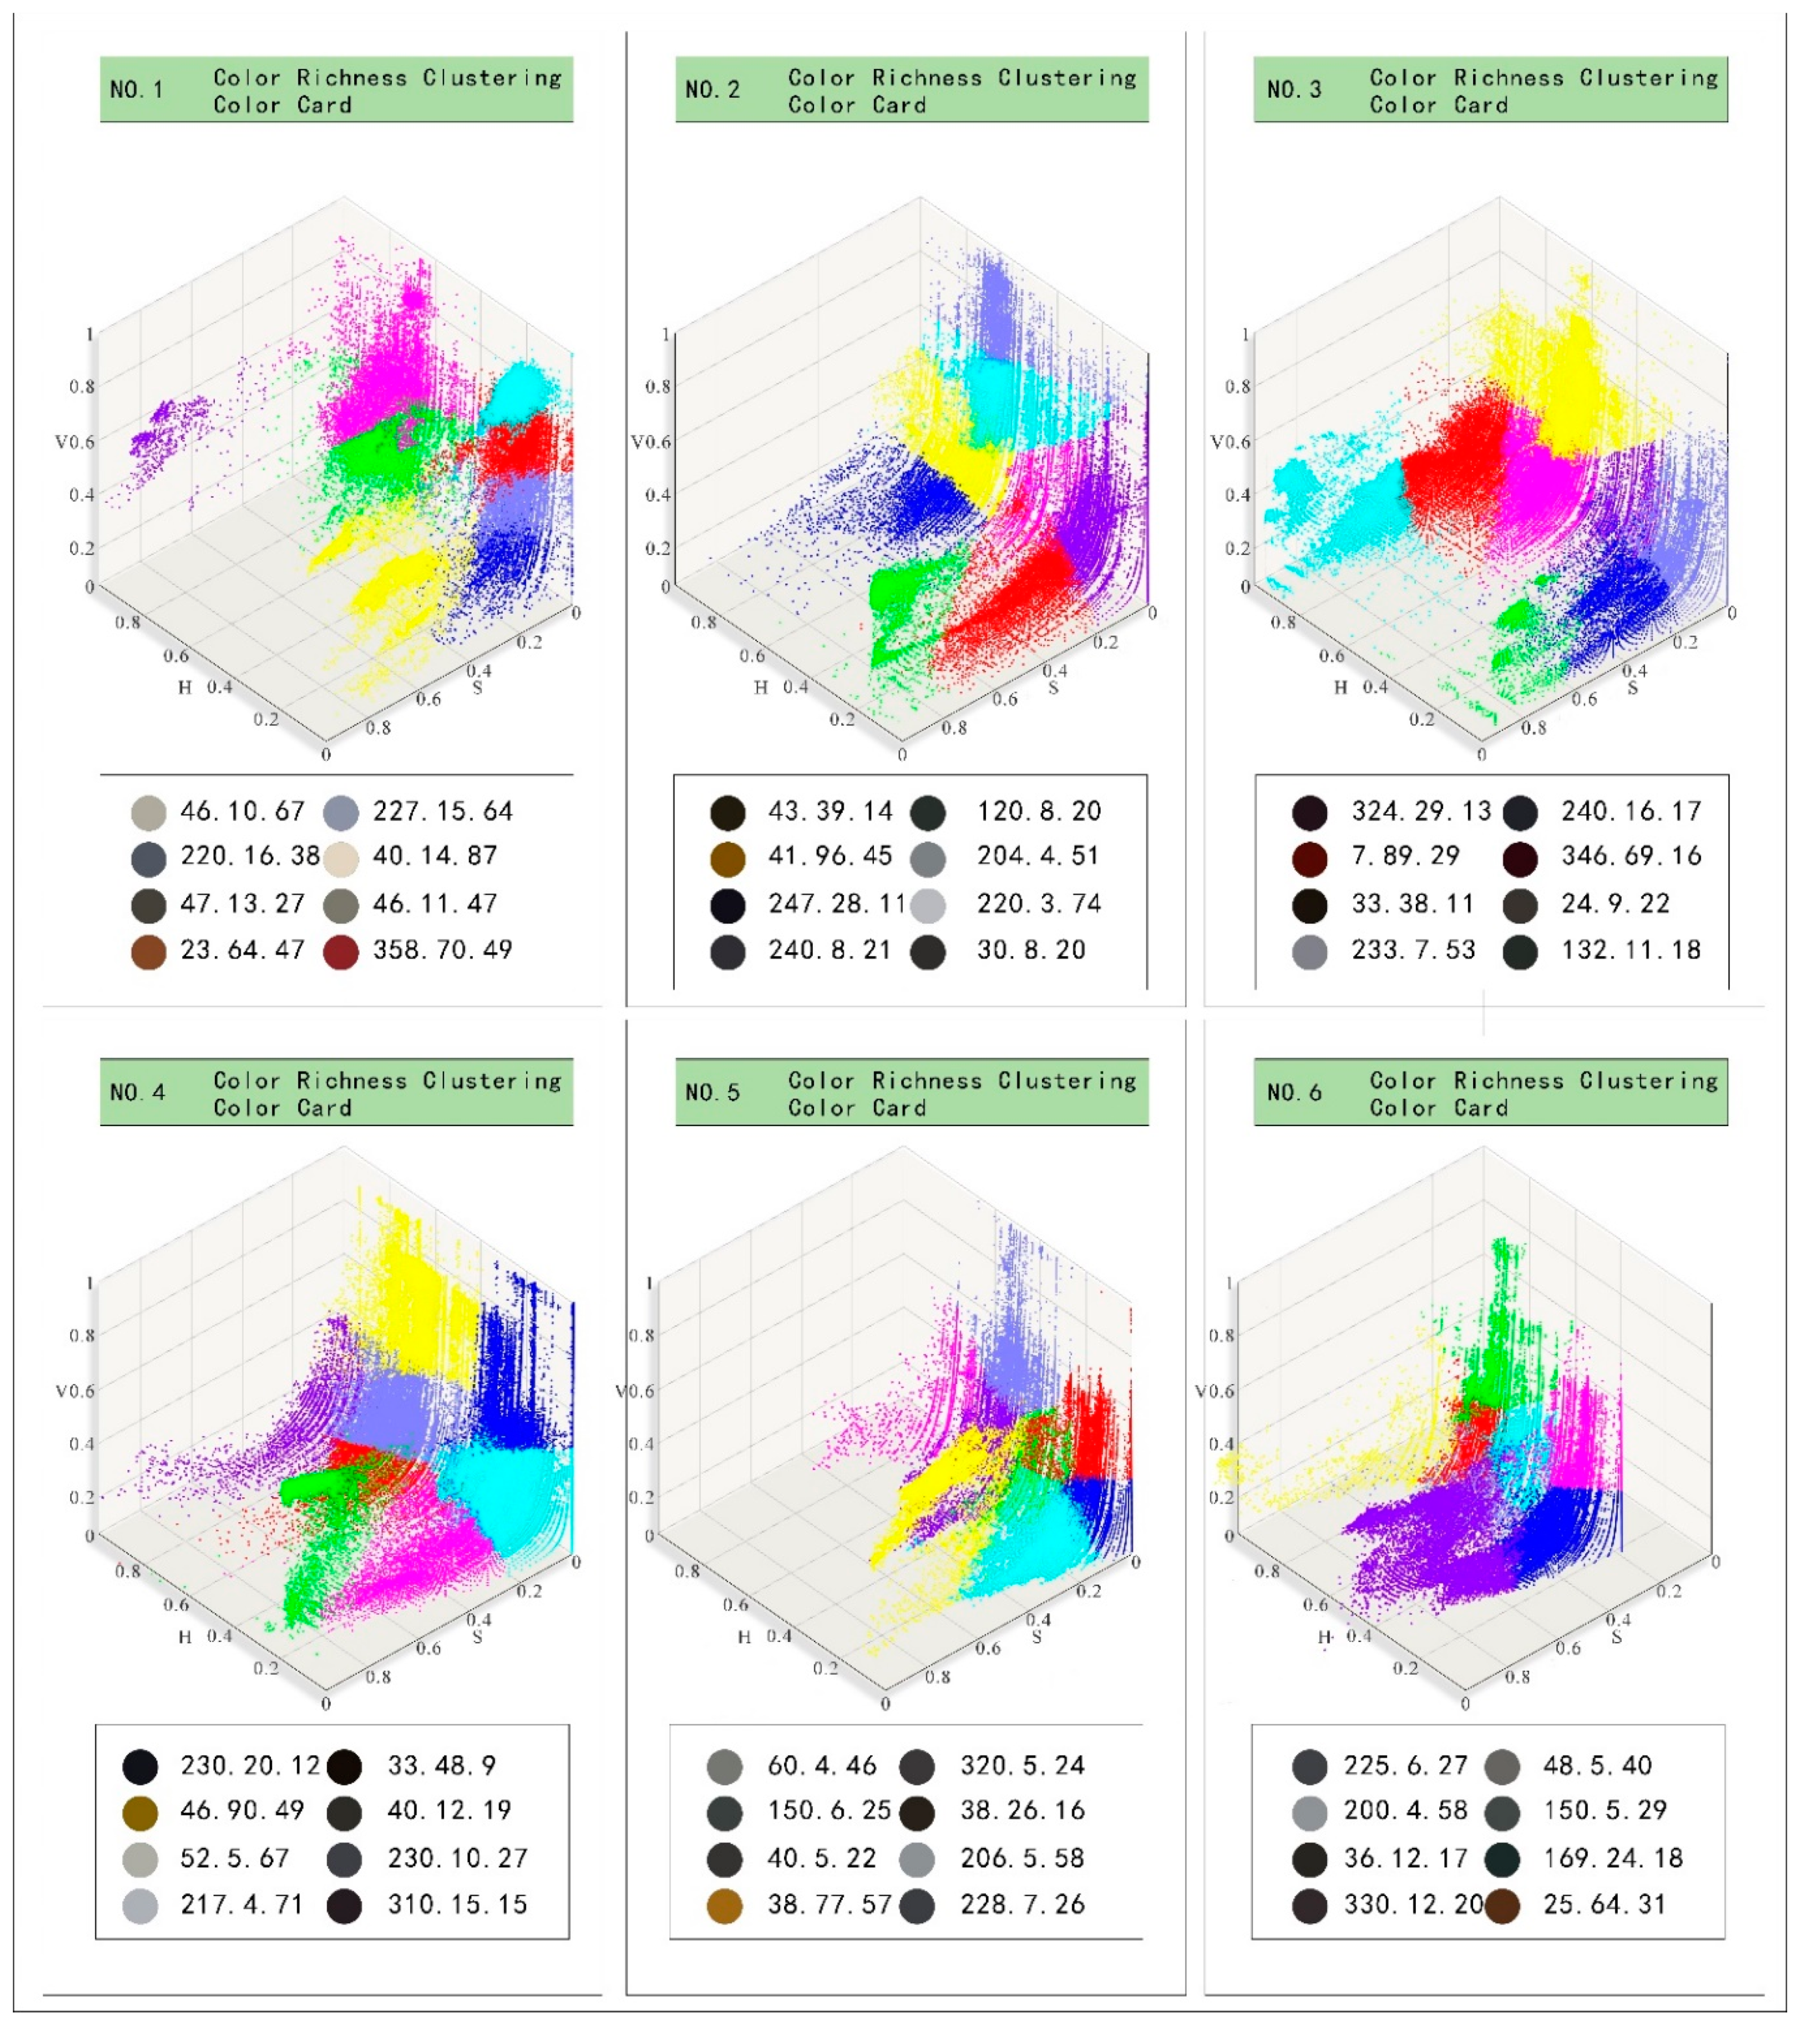
The third section was to better explore the central colors of the overall environment. First of all, it was necessary to search for the rich color nodes in Shiquan Street, that is, evaluate the color richness of all 0 street view samples, and then 6 of the richest street view photo samples were selected as the basic samples for extracting segment color cards. Among them, the color richness was evaluated by referring to the RGB color space image evaluation method proposed by Hasler et al. [32] and Jiang et al. [33].
The calculation formula is:
r g = R G
y b = 1 2 ( R + G ) B
where, “R, G, B” stand for red, green, and blue, respectively; r g is the difference between the red and green channels; y b is the sum of 1 / 2 of the red and green channel values minus the blue channel values. The standard deviation σ r g y b and mean μ r g y b are further calculated as follows.The calculation formula is:
σ r g y b = σ r g 2 + σ y b 2
μ r g y b = μ r g 2 + μ y b 2
Finally, the color richness C of the street view photo samples was calculated and 6 points with the best color richness were selected (street view photo samples).
The calculation formula is:
C = σ r g y b + 0.3 × μ r g y b
At this point, the color richness of the street view photo sample was calculated. Next, MATLAB was used to perform the K-means clustering analysis on the 6 samples with the best color richness. The K-means clustering method could quickly obtain color cards by clustering target pixels and finding center points. As shown in Figure 8, the several target pixels N obtained after completing architectural semantic segmentation were X i = ( H i , S i , V i ) , i = 1,2 , 3,4 N . Firstly, a target pixel X i was randomly selected as the first initial center, named C 1 , and the distance from the remaining pixels to X t was calculated, which was d .
The calculation formula is:
d = H i H j 2 + S i S j 2 + V i V j 2
Firstly, an initial center point C l was selected from the pixel set. Next, the distances between all other pixels and C 1 were calculated, and the pixel with the farthest distance from C l was selected as the next center point C 2 . This process repeated until reaching the center point K . Then the distances between each pixel and these K cluster centers were calculated, and each pixel was assigned to the category represented by the nearest cluster center. Once all pixels were assigned, the initial clustering result was obtained. Then the mean of pixels in each category was calculated to obtain a new cluster center, and the above steps were repeated to continuously update the cluster center until the iteration stop condition was met. Finally, K cluster centers were obtained, representing the main K colors in the image. K-means was commonly used for image segmentation and clustering, which helped to group pixels of similar colors in an image together, enabling image analysis and processing. In terms of the definition of K value, Wuet al. [34] believed that the acceptable number of colors for the human eyes was 4 8 . Therefore, 8 was chosen as the K value in this study, which meant clustering 8 colors from each street view photo sample with the best color richness as the final central color card.

3. Results

As shown in Figure 9, Figure 10 and Figure 11, it could observe the distributions of the architecture colors of Shiuan Street on HSV color space comprehensively and intuitively by the visualized clustering analysis of the semantic segmentation results of buildings at the perspectives of 0 , 90 , and 270 of Shiquan Street and constructing the “color particle direction map” and “color particle space map”, making it able to explore the design color application strategy guided by the facade colors of Shiquan.
Street scientifically and clearly, which was more conducive to enhancing the regional 343 uniqueness and color localization of design colors [34], thus providing clear ideas for color 344 visualization and color application strategies in historical areas.

3.1. Visualized Analysis of Environmental Colors in Street Block

3.1.1. Visualized Analysis of Color from View Angle 0°

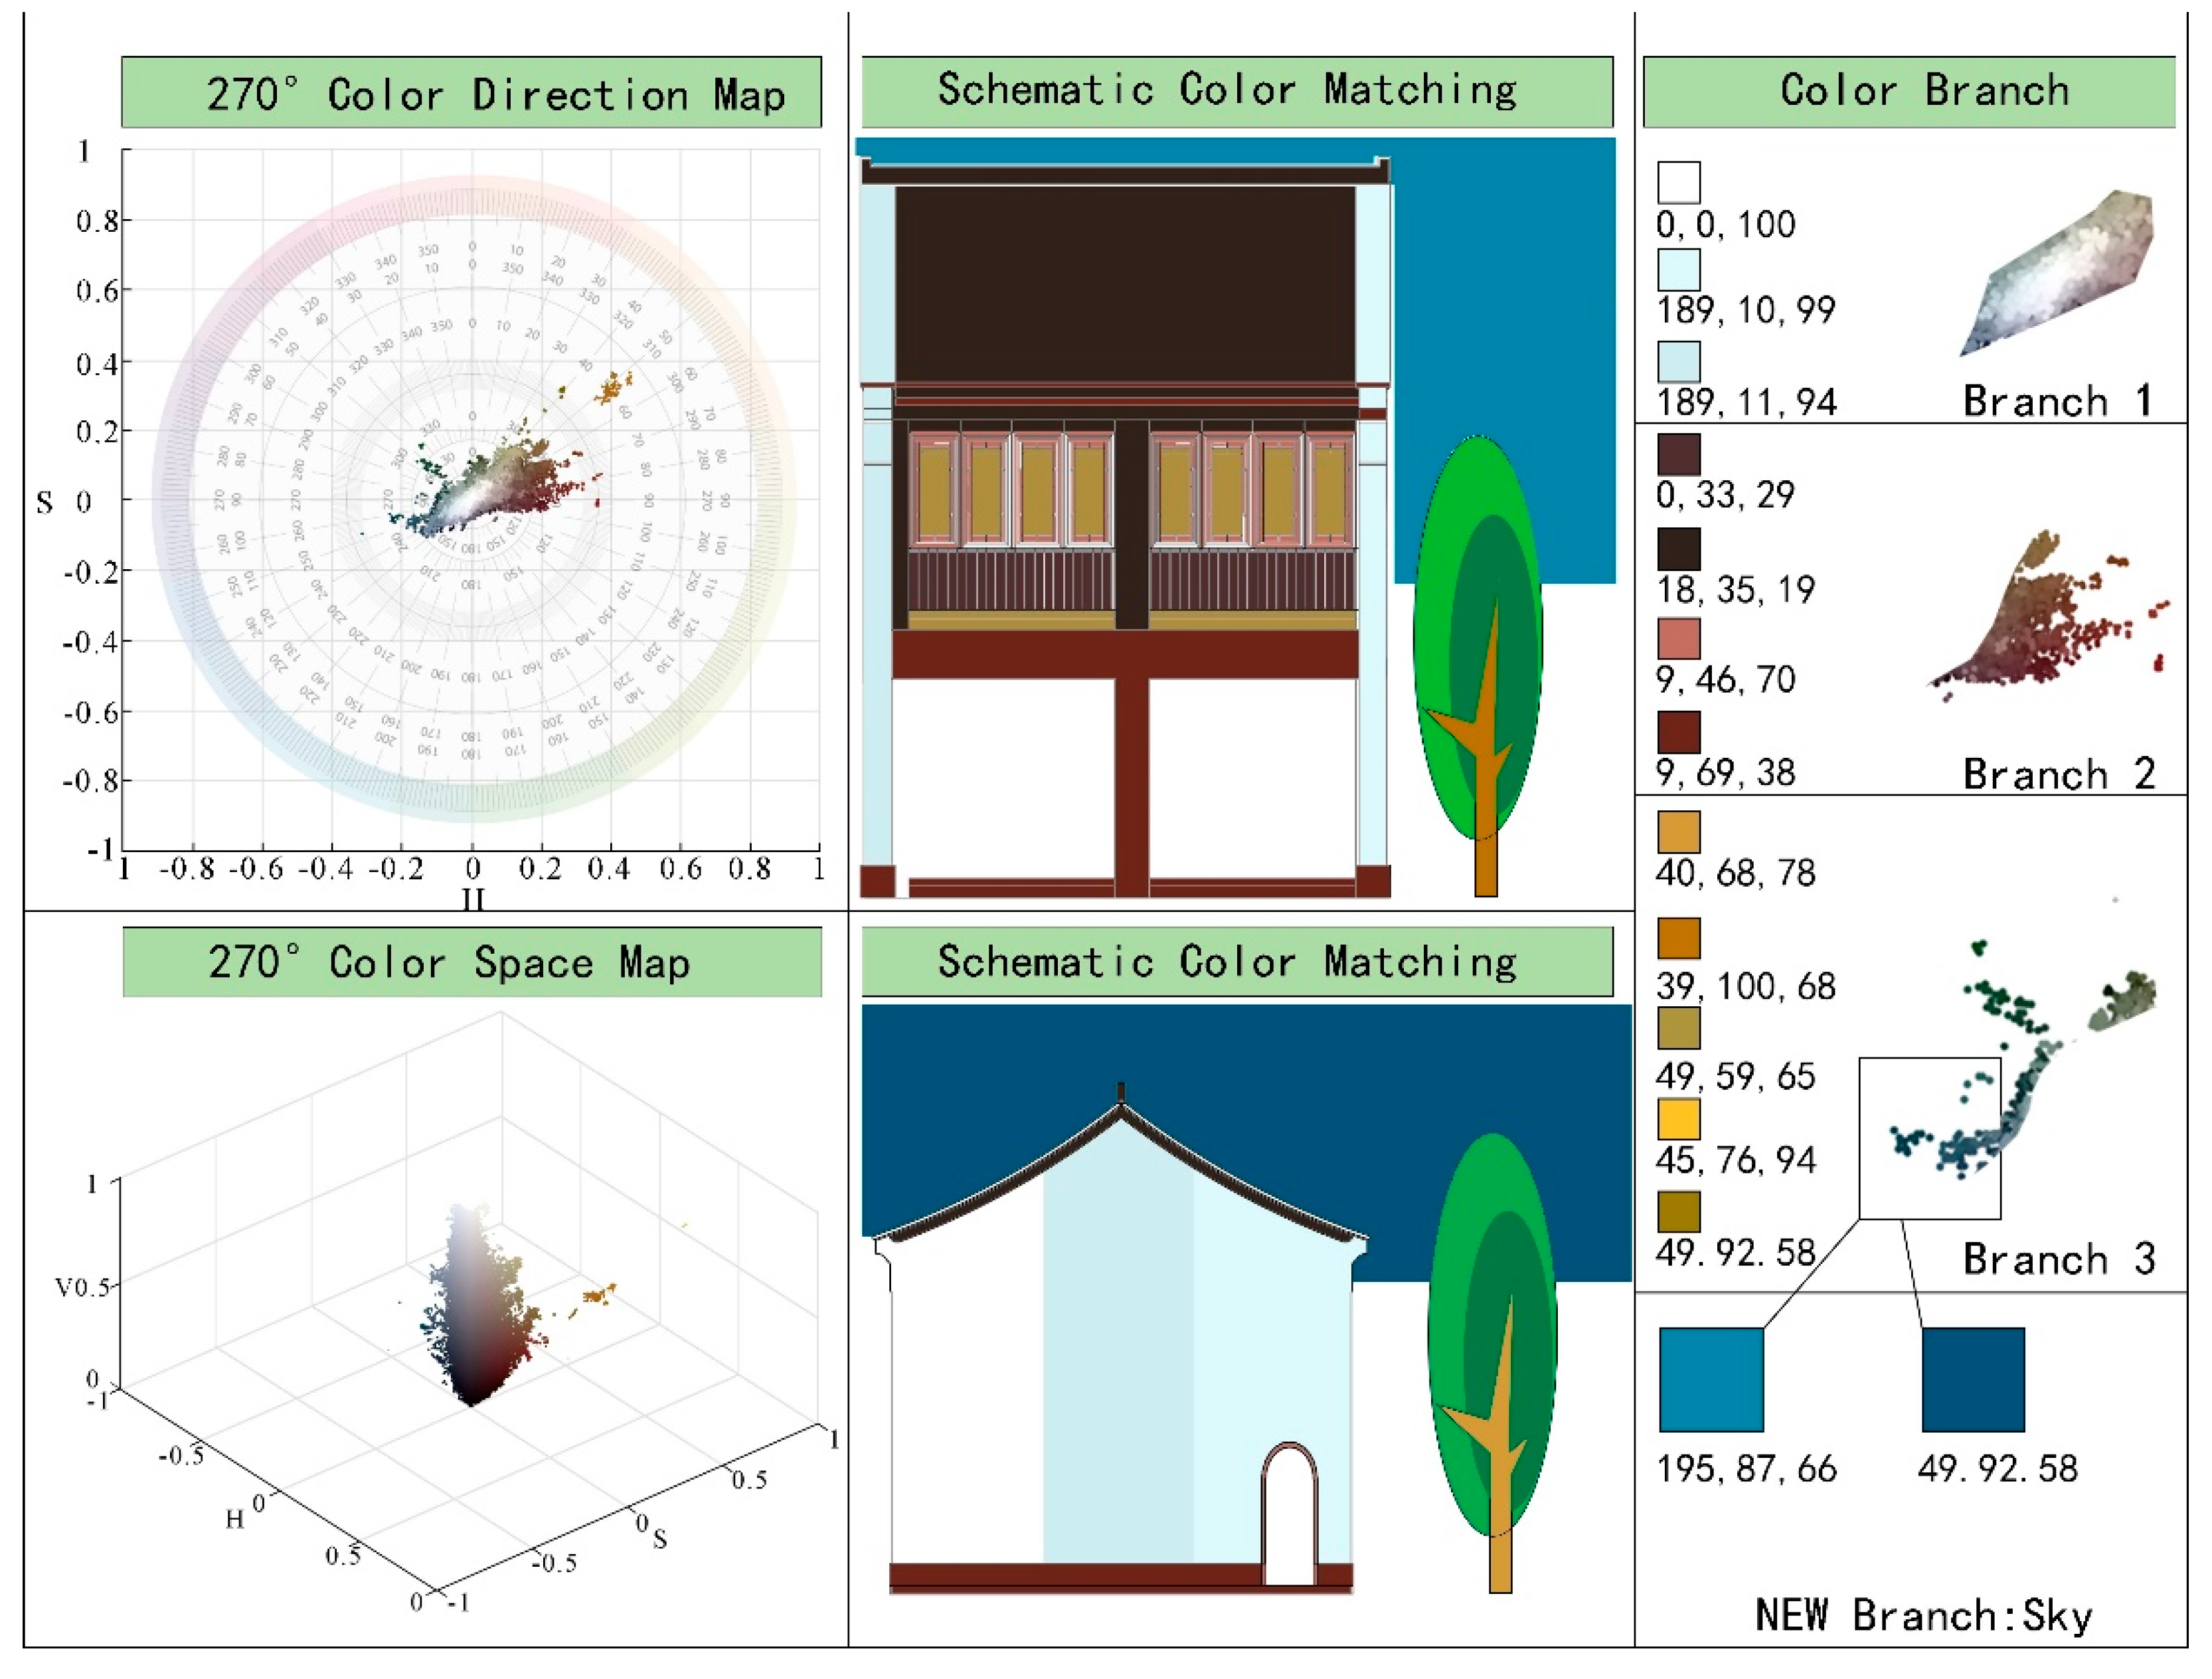
As shown in Figure 9, in order to study the color related application strategy with the 0 building facade of Shiquan Street as the color gene, the colors of the 0 building facade were extracted to establish the “color particle direction map” and “color particle space map” based on the HSV three-dimensional cylindrical coordinate system. In the direction map of the 0 building facade, there were 3 distinct branches, namely Branch 1 with an H value between 220 240 , Branch 2 with an H value between 70 90 , and Branch 3 with an H value between 45 55 . Further observation of the space map showed that Branch 1 had a relatively large proportion, with color particle ( 0,0 , 100 ) as the center point diverging outward. Its visualization effect was relatively strong, indicating that the colors in this range were the first dominant color in the 0 street view photo sample group and took up most of the area in the building segmentation results. Based on the comparative analysis of the comprehensive sample photos, the colors within this range were the colors of “exterior walls” in the architectural facades of Shiquan Street, including traditional Chinese colors such as “pure white ( 0,0 , 100 ) “ (Jingbai), “bright white ( 189,10,99 ) )” (Yingbai), and “bluish white ( 189,11,94 ) “ (Yuebai). The cold and warm combination of colors provided a reference for selecting the colors for architectural elements. Branch 2 accounted for the second largest proportion, with color particle ( 365,43,27 ) diverging outward. Its visualization effect was quite clear, indicating that the colors in this range was the second dominant colors in the 0 street view photo sample group. According to the comparative analysis of the comprehensive sample photos, the colors in this range were the colors of “traditional door headers” and “traditional window sills and eaves” in the facades of Shiquan Street, including traditional Chinese colors such as “agate ( 0,33,29 ) “ (Nao) and “coal black ( 18,35,19 ) “ (Meihei). The warm state of the colors provided a reference for selecting the colors for architectural decorative elements in historical areas. The visualization results of Branch 3 were relatively weak, with color particle ( 37,81,57 ) as the center and appearing as separate clusters. The distance from the center point was relatively discrete, indicating that this cluster was a collateral environmental color cluster that entered the semantic segmentation results. The comparative analysis of the comprehensive sample photos also confirmed this result, and the colors of the cluster was regarded as a relatively small proportion of environmental colors, including traditional Chinese colors such as “brown yellow ( 39,100,68 ) “ (Zonghuang), “dim yellow ( 40,68 , 78)” (Hunhuang), and “golden black ( 45,59 , 65 ) “ (Wujin), which provided references for selecting the colors for other environmental elements in historical areas.

3.1.2. Visualized Analysis of Colors at the Perspectives of 90° and 270°

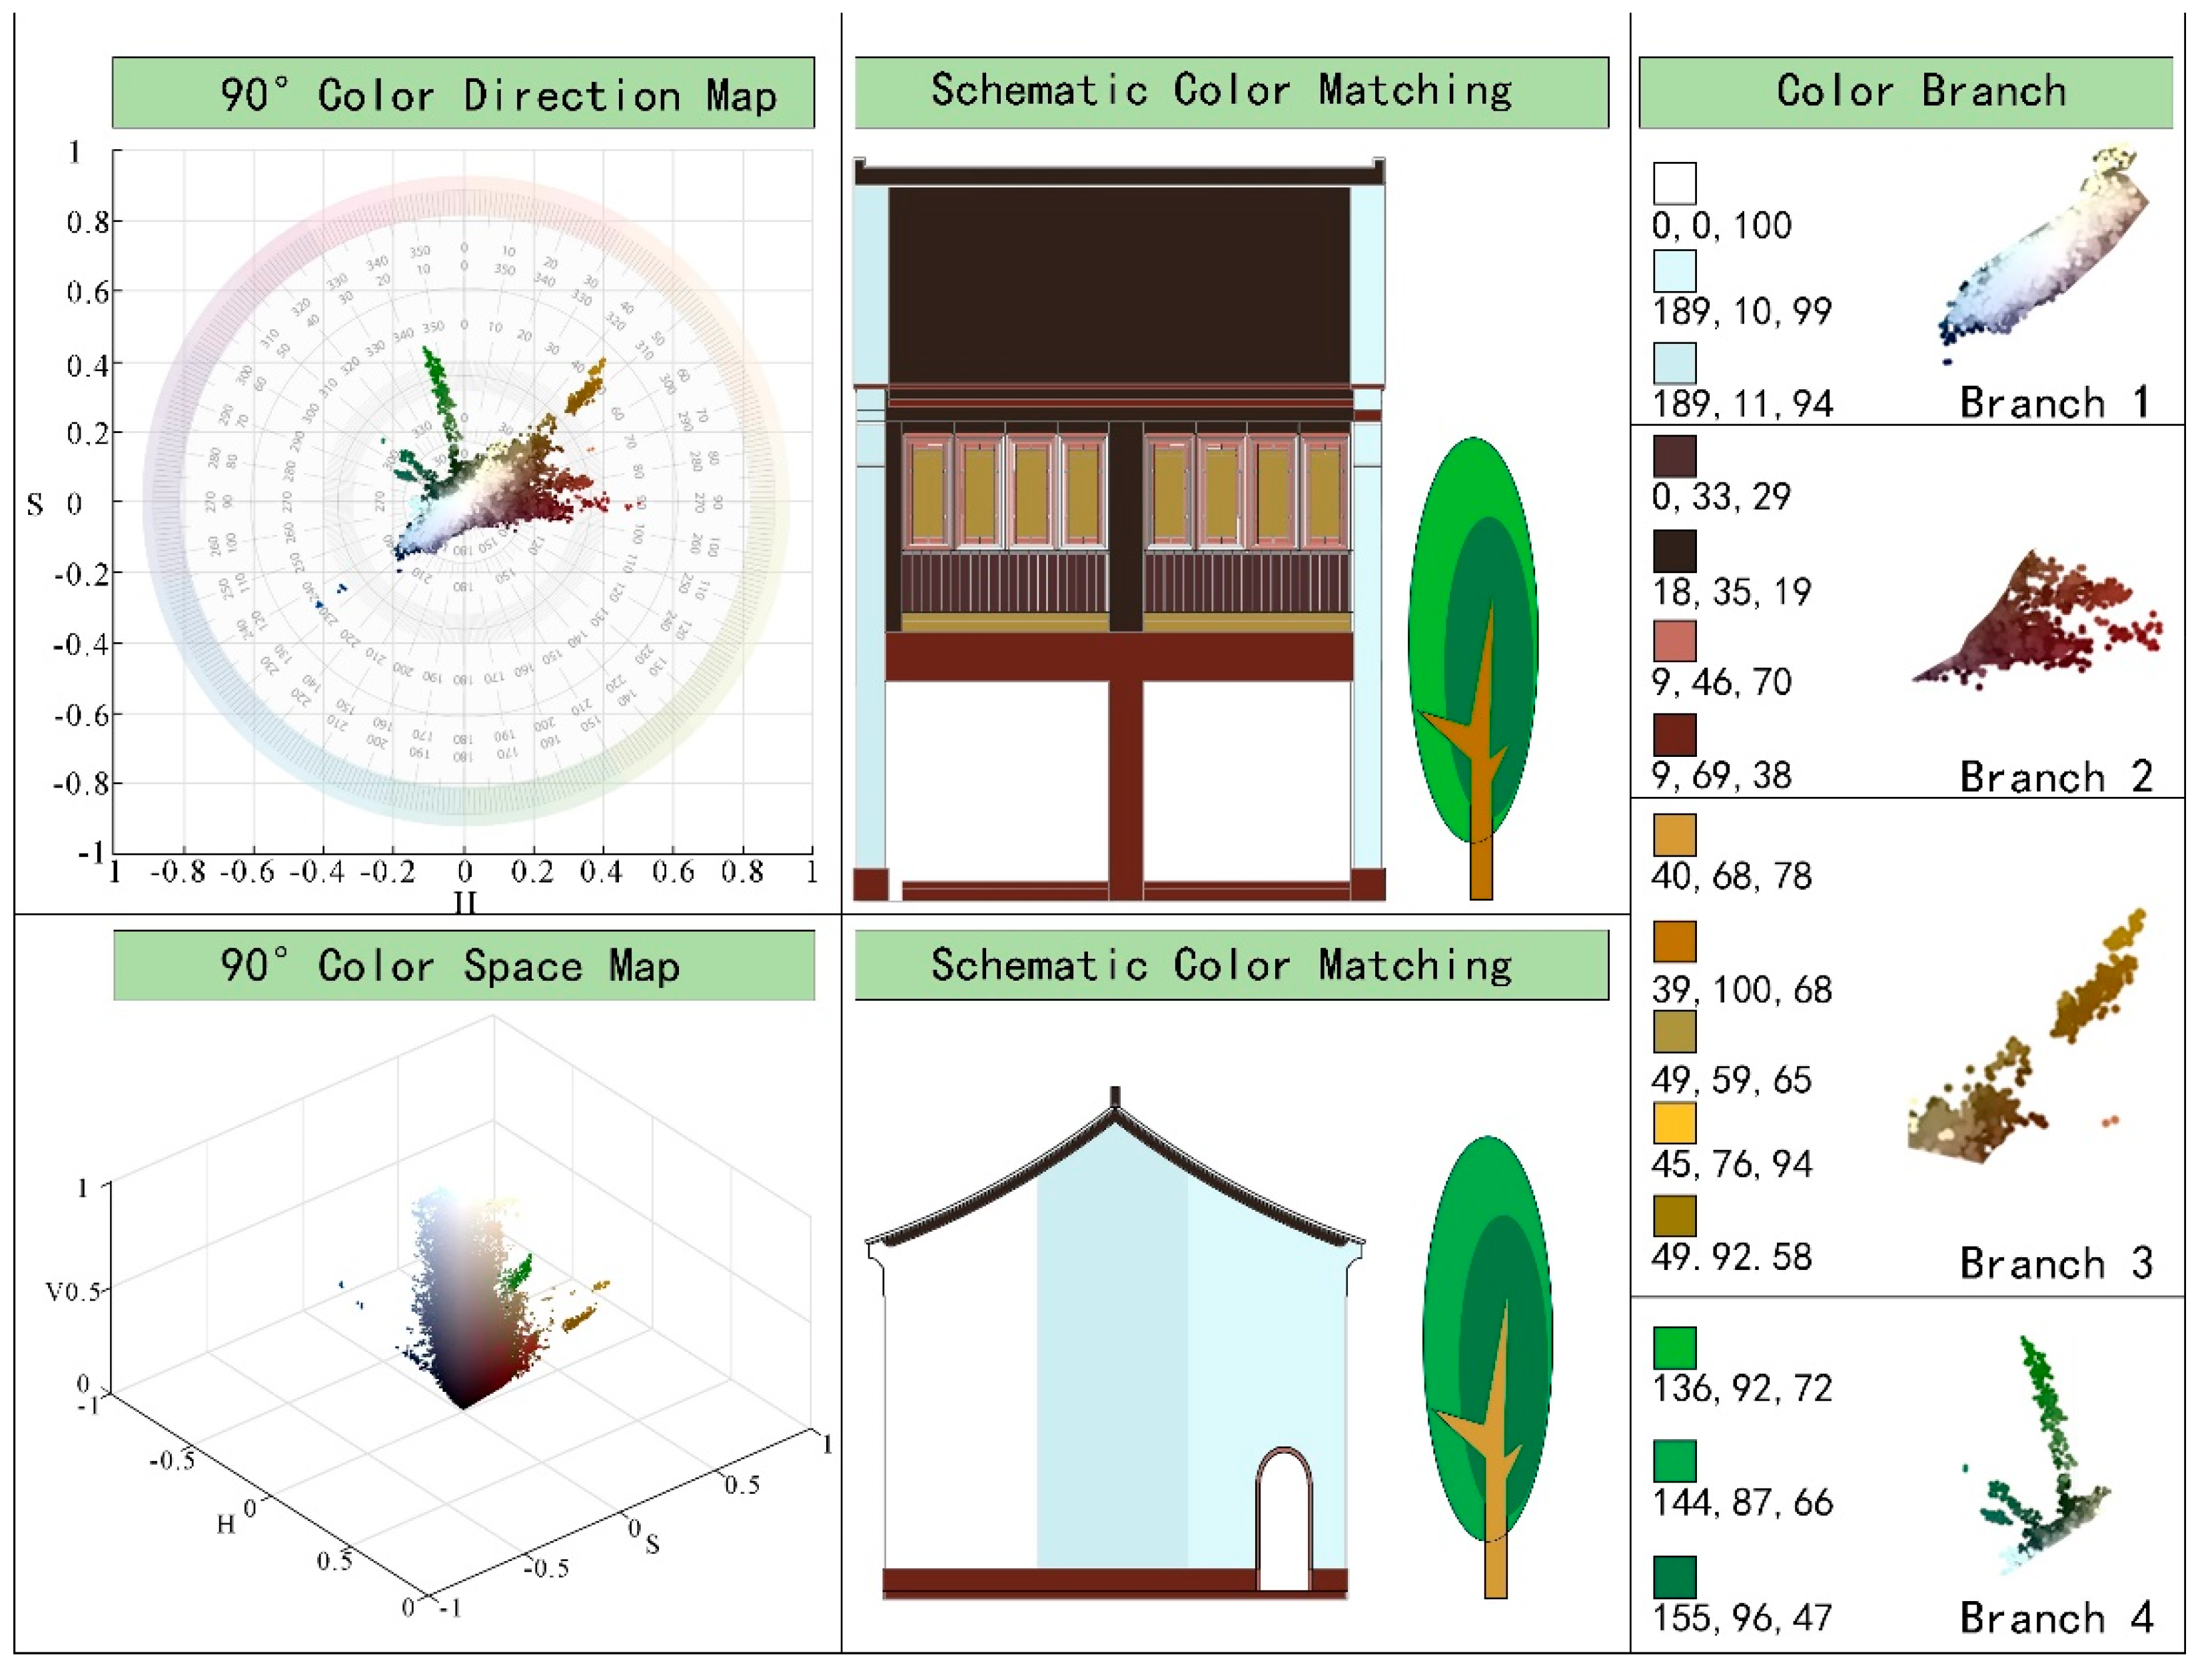
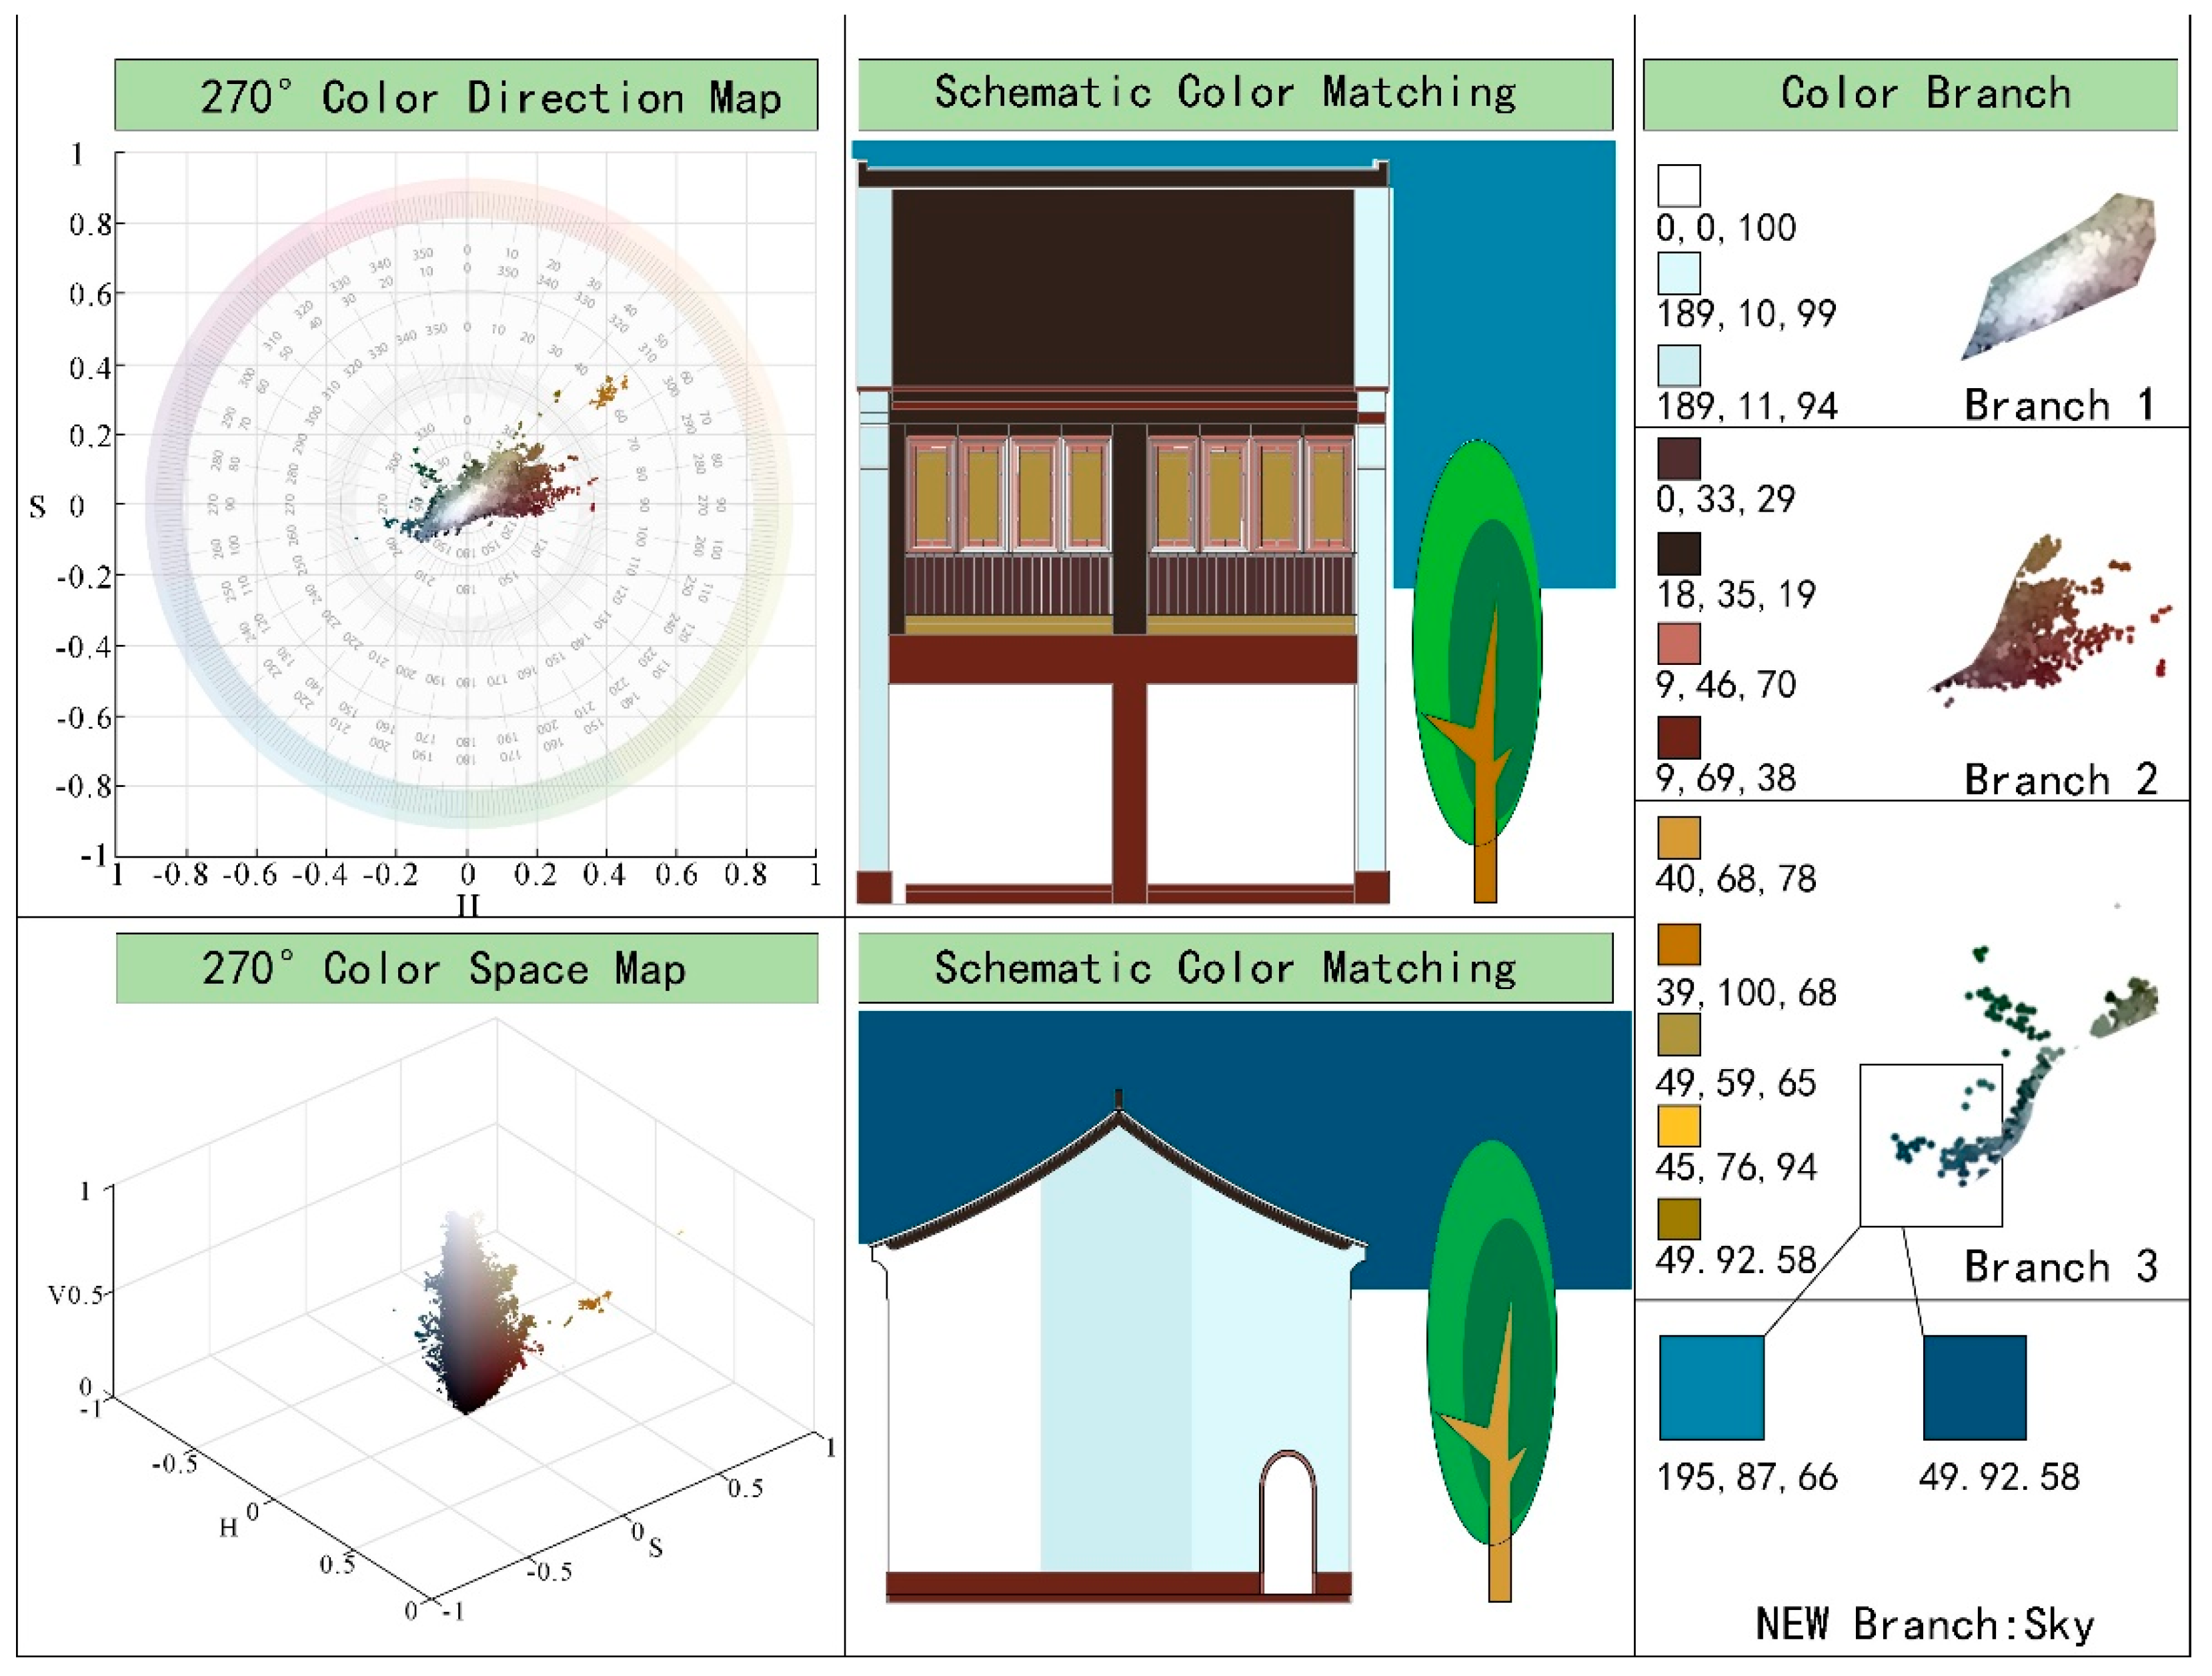
In order to study the color genes of the architectural facades of Shiquan Street in more detail, the 90 and 270 semantic segmentation samples were added as supplementary experiments to more accurately explore the colors of the architectural facades of Shiquan Street and compensate for incomplete architectural segmentation within the 0 perspective. As shown in Figure 10 and Figure 11, the architectural facade colors at the perspectives of 90 and 270 of Shiquan Street were extracted, and the HSV three-dimensional cylindrical coordinate system was used as the spatial basis to construct the “color particle direction map” and the “color particle space map”. In the direction map of the 90 building facade, there were 4 distinct branches, namely Branch 1 with H values in the range of 220 240 , Branch 2 with H values in the range of 40 60 , Branch 3 with H values in the range of 70 100 , and Branch 4 with H values in the range of 290 300 and 340 350 . The space map showed that Branch 1 still accounted for a relatively large proportion, with color particles ( 0,0 , 100 ) as the center point diverging outward. Its visualization effect was consistent with that of Branch 1 at 0 , indicating that the colors in this range were the first dominant colors in the 90 street view photo samples, and were also the dominant architectural colors in the overall street view photo samples, taking up most of the area. On the basis of Branch 2 of the 0 sample group, new clusters appeared in Branch 2 of the 90 sample group, including colors such as “light red ( 9,46,70 ) “ (Tan) and “reddish brown ( 9,69,38 ) “ (Li). Compared with Branch 3 of the 0 sample group, Branch 3 of the 90 sample group had more comprehensive colors, including colors such as “red golden ( 42,71,95 ) “ (Chijin), “Pale yellow ( 45,76,94 ) “ (Xiang), “Light tan ( 29,42,66 ) (Tuo), and “Golden yellow ( 49 , 92,58 ) “ (Qiuxiang) as environmental colors. What was worth noting was that there was a Branch 4 in the 90 sample group, which had clear direction. The branch diverged outward with color particle ( 92,58,19 ) and color particle ( 145,54,19 ) as the center points, resulting in a strong visualization effect. The comparative analysis of the comprehensive sample photos showed that the colors in this range were colors of “street plants” that were mistakenly included in the semantic segmentation of Shiquan Street. Although they were not the colors of the building facades, they were the colors of the “street interface”. The colors of this branch included traditional Chinese colors such as “Onion green (136, 92, 72)” (Congqian), “Stone green (144,87,66) “ (Shilv), “Mellow yellow ( 155,96,47 ) )” (Songhua). The combination of warm and cold colors provided a reference for the selection of colors of plants. As shown in Figure 11, the direction map of the 270 building facade showed that there were 3 distinct branches, and the results of Branches 1 and 2 were basically consistent with the 0 and 90 sample groups, while Branch 3 continued to extend within the H value range of 240 270 on the basis of Branch 1. The space map and comparison with street view photo samples showed that Branch 3 should be the colors of the “sky” that mistakenly entered into semantic segmentation. This branch included traditional Chinese colors such as “Stone blue ( 195,87,66 ) “ (Shiqing) and “Indigo ( 200,95,47 ) ) (Zhanlan). The cold color scheme provided references for the selection of colors for sky environment elements.

3.2. Visualized Analysis of Color Point Spectra in Shiquan Street

As shown in Figure 12, in order to better control the color of the historical areas of Shiquan Street, the color environment of the exterior facade of buildings was simulated. The dominant colors of each photo were extracted with the sample numbers (from beginning to end) of the 3 sets of photos with the view angles of 0 , 90 and 270 as the horizontal axis, and the H value of a single sample photo as the vertical axis, generating a color continuity point spectrum. As shown in Figure 12, there were 2 main color bands for the 3 elements. One of them had an H value between 0 and 100, and the overall color scheme was warm. It was a main color band consisting of building decoration colors, street plant colors, and environmental colors. The other had an H value between 200 and 300, and the overall color scheme was cold. It was a main color band consisting of building exterior wall colors, sky colors and environmental colors. The overall color distribution of the buildings in the historical areas of Shiquan Street was relatively clear, and the H value distribution was relatively concentrated. The point spectra and street view photo samples showed that although the color particles in the two color bands of Shiquan Street had rhythmic rhythms, they were all distributed within a controllable range of H -values, proving that the environmental colors of Shiquan Street should be selected and extended between the H values of 0 100 and 200 300 in order to best fit the tourist experience. When the on-site environmental experience of tourists was coupled with their own experience, a diverse localized color system could be shaped, avoiding the situation where the tourism experience was disconnected from the architectural style caused by the color singularity and homogenization.

3.3. Visualized Analysis of Nude Clustering Colors of Shiquan Street

As mentioned above, the colors of the exterior facades of Shiquan Street was relatively controllable, with good overall continuity. All color particles were arranged and moved within a controllable range of H values. To establish a fast, convenient, and visually strong color card for historical street blocks, the color richness of a total of 296 street view photo samples was evaluated based on RGB color space, and 6 street view photo samples with the richest color particles were selected (Figure 13). At the same time, K-means clustering analysis was performed on these 6 street view photo samples, and 8 was selected as the clustering value of the color card for a single street view photo sample. Since the clustering was carried out by scattering, rearranging, and finding enters, the color cards generated by this method had a high degree of color summarization and color centrality. On this basic color card, designers could combine the visualization results of branch maps, space maps and the visualized results of the point spectra to determine the color range, and perform color matching and selection of with this color card as the color center point within a controllable range. This method improved the quality and efficiency of the color card, making it able to achieve rapid sampling and analysis of the environment in a short period of time. This method could accurately capture color features and changes in the environment, thereby generating suitable color cards. Compared with traditional methods, this method not only had no effect on the continuity of color in historical areas, but also effectively selected color cards for historical areas, which saved time and cost, and improved the color style and features of historical areas.

4. Discussion on the Application of Traditional Chinese Colors in Suzhou Historical Block

Chinese traditional colors are rich and colorful, each with its own specific cultural and symbolic significance. In the historical areas of Suzhou, these traditional colors are widely used in traditional architecture, endowing buildings with unique beauty and cultural connotations [35].
(1) Colors of building facades
Through the visualization of colors, it is easy to find that pure white, bright white and bluish white are the 3 colors widely used in architecture. White, as the most frequently used building color, is widely used in facade colors [36]. Firstly, from the perspective of visual culture, white has profound symbolic significance in traditional Chinese culture [37]. In the Five Elements theory, white represents gold, symbolizing purity and nobility [38]. In Taoism, white symbolizes detachment and purity. Therefore, white is widely used in traditional architecture in Jiangnan region, aiming to create a pure, elegant, and transcendent atmosphere. In addition, the white walls complement the natural environment of Jiangnan region. Jiangnan region has distinct four seasons, and white walls can reflect the colors of the four seasons, integrating buildings with the natural environment [39].
Secondly, from a scientific perspective, the application of white walls also has practical considerations [40]. Jiangnan region belongs to a subtropical humid climate with high humidity and abundant rainfall. White walls can effectively reflect sunlight, reduce wall heat absorption, lower indoor temperature, and improve living comfort [41]. At the same time, the reflective performance of white walls can also improve indoor lighting, making the interior brighter. In addition, the materials used for white walls are generally lime and white clay, which have good breathability and moisture absorption, thus effectively regulating indoor humidity and preventing wall dampness. At the same time, these materials are also common in Jiangnan region, so they are easy to obtain, which reduces the cost of construction.
(2) Colors of the door header
Agate, coal black, light red, and reddish brown are colors widely used for door headers and exterior wall decoration, forming a sharp contrast with the white colors of the building facades [40]. Firstly, the widely used door headers in traditional architecture in Jiangnan region holds unique significance. In traditional Chinese culture, agate and coal black symbolize solemnity and stability, while light red and reddish brown symbolize mystery, which ares consistent with the cultural temperament and social customs of Jiangnan region [41]. They are in a sharp color contrast with pure white, bright white and bluish white, creating a street style similar to Chinese painting. From the perspective of visual effects, the door headers with agate, coal black, light red, and reddish brown are not only a visual feature of traditional architecture in Jiangnan region, but also a symbol of the culture and society of Jiangnan region [42].
Secondly, agate, coal black, light red, and reddish brown can summarize the colors of wood, which is a kin of widely used material in traditional Chinese architecture [43]. These colors not only reflect the colors of wood in Chinese architecture, but also often serve as natural paint colors for anti-corrosion of wood. In addition to creating a solemn, stable, and mysterious atmosphere, wood also has good insulation and moisture absorption properties. Due to weather conditions, the combination of wood and paints can effectively regulate the temperature and humidity of buildings [44], prevent cracking and deformation of door headers, effectively prevent direct sunlight exposure, reduce the heat absorption, and lower the temperature of the door headers, thereby extending the service life of the door headers [45].
(3) Colors of the environmental atmosphere
Under normal circumstances, environmental colors are not fixed and difficult to capture [46]. However, in this study, the colors captured through street view photo samples are compared with traditional Chinese color cards, providing a concrete summary of the environmental colors of the historic blocks of Shiquan Street in Suzhou. The environmental colors include green onion, stone green, mellow yellow appearing on street plants, stone blue, indigo blue appearing in the sky [47], as well as red golden, pale yellow and tan, golden yellow appearing in other surroundings, which are all classic and traditional Chinese colors [48].
As the commercialization of historical areas becomes increasingly severe, most of the buildings located within the blocks are adorned with attractive signs or slogans [49]. The emergence of these commercial elements is extremely detrimental to the creation of the traditional atmosphere of historical areas and undermines the continuity of their interfaces. Therefore, concretizing the presentation of environmental colors which are difficult to capture also provides an important basis for the selection of modern commercial colors of the interface of historical areas [50]. In the inevitable process of commercialization, it is necessary to maintain the original environmental color of historical areas as much as possible to maintain the authenticity of their historical appearance [51]. At the same time, consideration should also be given to the uniqueness of colors, which should present features that are easy to attract investment and customers without damaging the overall street interface [52].

5. Conclusions

The contradiction between the rapid progress of urbanization and the sustainable development of historical areas has posed new challenges to the conservation and revi- talization of cultural relics and buildings in China. How to achieve a balance between the continuation of traditional style and modern commercial development has become a research focus, especially in the typical historical areas of Jiangnan region in China. This article takes the historical areas of Shiquan Street in Suzhou as an example and proposes a visualization method and optimization strategy for the architectural colors of the histori- cal and cultural blocks of Shiquan Street in Suzhou. Based on the typical case, the mainfindings and inspirations are as follows:
(1) Adhering to and carrying over traditional color
Scientific and reasonable color control can integrate art and design into the overall environment while presenting the beauty of artistic creation, better conveying a more comprehensive and comfortable visual effect to the audience [53,54]. The establishment of color models plays a positive role in reshaping and maintaining the original cultural atmosphere of urban scenic spots and historical areas [55]. The traditional colors of Suzhou are an important component of its historical and cultural heritage. For example, the colors commonly used in traditional architecture in Suzhou, such as pure white, bright white, bluish white as well as agate, and coal black, can highly summarize the color impression of “green tiles and white walls” in Suzhou’s traditional architectures. This traditional color combination conveys a stable historical architectural intention. Therefore, in the selection of colors, it is necessary to uphold such color combination tradition, closely adhere to the color intention, ensure that the color information conveyed is in line with regional culture, and integrate it into the design, so as to carry over the traditional color style of Suzhou, inherit and promote the architectural color culture, and thereby achieving the sustainable development of historical areas.
(2) Expanding and innovating color combinations
Color design is an important element of building facades, and architecture is a visual representation of regional culture. Color aesthetics, as an art system that studies the relationship between color visual expression and culture, can enhance the visual beauty and cultural atmosphere of the design objects through its application [56]. On the basis of maintaining the original color impression of “green tiles and white walls” in Suzhou, expanding and matching the design colors can achieve innovative color design without departing from the original color style of the design object. For example, as shown in Figure 8, artistic matching of the color particles within a controllable range of H values can ensure the original impression of color while obtaining more color design choices. While respecting and retaining the traditional color style of Suzhou, the innovative color matching can make the design have both traditional color style and innovative color design, and make the audience’s experience not easily detached from regional culture. Therefore, it is necessary to further utilize the cultural transmission and emotional interaction features of colors to achieve the expansion and innovation of color matching on the basis of fitting the decorative and functional features of architectural colors [57]. This method not only retains the color impression of traditional culture, but also endows design works with new visual effects and aesthetic experiences, making it an innovative method that respects tradition.
(3) Establishing and planning color system
At present, the main problems faced by Chinese cities are the loss of urban features and the dilution of urban culture, which are reflected in the chaotic color management and pollution of urban interface colors [58]. Under such circumstances, it is difficult to ensure the authenticity of historical areas, and it is also difficult to continuously exude their unique charm in the city. Therefore, from a macro perspective, a color design system that highlights regional culture and regional style should be established, and urban color featured areas should be planned. From a micro perspective, a regional featured color model should be scientifically established for urban historical and cultural blocks, and its color gene library should be summarized. It is necessary to improve the color quantification technology routes to effectively control urban colors [59]. At the same time, a central color card should be constructed to achieve the goal of quickly selecting colors and fitting the regional style to the greatest extent possible, thereby achieving a scientific transformation of regional colors from sensibility to rationality, and from qualitative to quantitative.
(4) Innovation of this article
As for the methods selected in this article, the combination of open-source platforms, ArcGIS, and Python scripts can quickly and efficiently cope with the acquisition of large- scale historical street view photo samples, improving experimental accuracy and speed. Secondly, Matlab can perform batch color space interpretation of digital images and quickly construct visual color models. The excellent data visualization and color clustering capabilities of Matlab provide opportunities and possibilities for data processing of a large number and wide range of street view sample photos. Finally, compared with various color extraction methods, the strategies for obtaining and selecting environmental colors in historical areas summarized by the above methods are faster, more efficient and scientific in completing color extraction, and can make the design colors of historical areas tend to be localized within a controllable color range, highlighting the regional uniqueness of colors. In addition, the colors obtained in this article are compared and coupled with traditional Chinese color cards, figuring out the traditional Chinese colors commonly used in architectural decoration, which not only provides relevant color strategies for maintaining the overall color style of Shiquan Street of Suzhou, but also provides corresponding references for historical areas of the same style and type in Jiangnan region of China.

Author Contributions

Conceptualization, LuHang Feng; methodology, Mingrui Miao; software, Mingrui Miao; validation, Mingrui Miao; investigation, Yao Wu and Rong Zhu; resources, Yao Wu and Rong Zhu; data curation, Mingrui Miao; writing—original draft preparation, Mingrui Miao; writing—review and editing, Mingrui Miao. All authors have read and agreed to the published version of the manuscript.

Funding

This research was funded by Heilongjiang Social Philosophy and Social Science Research Planning Project, “Research on the Protection and Renewal of Historical and Cultural Blocks along the Middle East Railway in Heilongjiang Province” and Heilongjiang Provincial Economic and Social Development Key Research Project (Base Special) “Research on the Construction of Historical and Cultural Blocks along the Middle East Railway in Heilongjiang Province”

Acknowledgments

Thanks to Prof. Feng Luhang, Prof. Wu Yao, Prof. Zhu Rong and Prof. Xiong Jinghua for their guidance in my paper writing.

Conflicts of Interest

The authors declare that there are no relevant financial interests in this manuscript, nor any other potential conflicts of interest to disclose.

References

Disclaimer/Publisher’s Note: The statements, opinions and data contained in all publications are solely those of the individual author(s) and contributor(s) and not of MDPI and/or the editor(s). MDPI and/or the editor(s) disclaim responsibility for any injury to people or property resulting from any ideas, methods, instructions or products referred to in the content.
  1. Zhu, Y.; González Martínez, P. Heritage, values and gentrification: the redevelopment of historic areas in China. Int. J. Heritage Stud. 2022, 28, 476–494. [Google Scholar] [CrossRef]
  2. Qian, Z.H.U. Historic district conservation in China: assessment and prospects. Tradit. Dwellings Settlem. Rev. 2007, 19, 59–76. [Google Scholar]
  3. Salah, Ouf A.M. Authenticity and the sense of place in urban design. J. Urban Des. 2001, 6, 73–86. [CrossRef]
  4. Wang, F.; Liu, Z.; Shang, S.; et al. Vitality continuation or over-commercialization? Spatial structure characteristics of commercialservices and population agglomeration in historic and cultural areas. Tour. Econ. 2019, 25, 1302–1326. [Google Scholar] [CrossRef]
  5. Tong, B.; Wang, S.; Zhang, Y. Analysis of the Current Situation of Cultural Continuity in the Commercialization of Historical and Cultural Blocks. In Proceedings of the 2022 International Conference on Sport Science, Education and Social Development (SSESD 2022); Atlantis Press: Amsterdam, The Netherlands, 2022; pp. 4–15. [Google Scholar]
  6. Cheris, R.; Rosetia, A. Conservation and utilization on Sawahlunto ex mining area for cultural landscape. In Proceedings of the IOP Conference Series: Earth and Environmental Science. IOP Publishing 2022, 1041, 012049. [Google Scholar]
  7. Mehanna, W.A.E.H. Urban renewal for traditional commercial streets at the historical centers of cities. Alexandria Eng. J. 2019, 58, 1127–1143. [Google Scholar] [CrossRef]
  8. Furlan, R.; Petruccioli, A.; Jamaleddin, M. The authenticity of place-making: space and character of the regenerated historicdistrict in Msheireb, Downtown Doha (State of Qatar). Archnet-IJAR: Int. J. Archit. Res. 2019, 13, 151–168. [Google Scholar] [CrossRef]
  9. Abastante, F.; Lami, I.M.; Mecca, B. How to revitalise a historic district: A stakeholders-oriented assessment framework of adaptive reuse. In Values and Functions for Future Cities; Springer: Cham, Switzerland, 2020; pp. 3–20. [Google Scholar]
  10. Yu, Y.A.O. Research on planning environment of historical color surrounding the Imperial Palace. 2014.
  11. Al-hagla, K.S. Sustainable urban development in historical areas using the tourist trail approach: A case study of the Cultural Heritage and Urban Development (CHUD) project in Saida, Lebanon. Cities 2010, 27, 234–248. [Google Scholar] [CrossRef]
  12. Wang, S. Application of computer-aided CAD in urban planning heritage protection. Soft Comput. 2023, 1–10. [Google Scholar] [CrossRef]
  13. Hong, X.; Ji, X.; Wu, Z. Architectural colour planning strategy and planning implementation evaluation of historical and cultural cities based on different urban zones in Xuzhou (China). Color Res. Appl. 2022, 47, 424–453. [Google Scholar] [CrossRef]
  14. Teng, Y.; Yang, S.; Huang, Y.; et al. Research on space optimization of historic blocks on Jiangnan from the perspective of place construction. Appl. Math. Nonlinear Sci. 2021, 6, 201–210. [Google Scholar]
  15. Li, Z.; Sun, X.; Zhao, S.; et al. Integrating eye-movement analysis and the semantic differential method to analyze the visual effect of a traditional commercial block in Hefei, China. Front. Archit. Res. 2021, 10, 317–331. [Google Scholar]
  16. Leng, H.; Shi, T.; Zhao, J. Study on Authenticity Protection and Restoration of Residential Historic District. Appl. Mech. Mater. 2013, 357, 1886–1889. [Google Scholar]
  17. Li, H.Y.; Wang, F. Cultural Identity and Continuity-Case Study of Authentic Conservation of Xi’an Bei Yuan Men Historic District. Appl. Mech. Mater. 2013, 357, 1840–1846. [Google Scholar] [CrossRef]
  18. Santopuoli, N.; Pecoraro, I. Historic Centers Restoration and Ancient Buildings Energetic Efficiency Improvement. J. Build. Constr. Plan. Res. 2014, 2, 209. [Google Scholar] [CrossRef]
  19. Santopuoli, N.; Pecoraro, I. Historic Centers Restoration and Ancient Buildings Energetic Efficiency Improvement. J. Build. Constr. Plan. Res. 2014, 2, 209. [Google Scholar] [CrossRef]
  20. Hong, L.; Pang, S.; Geng, M.; et al. The GIS study on the spatial structure and visual perception of historical districts in winter cities. Arab. J. Geosci. 2021, 14, 1142. [Google Scholar]
  21. Grimmer A, E. The Secretary of the Interior’s standards for the treatment of historic properties: With guidelines for preserving, rehabilitating, restoring & reconstructing historic buildings; Government Printing Office, 2017.
  22. Diaz-Parra I, Jover J. Overtourism, place alienation and the right to the city: insights from the historic centre of Seville, Spain. Journal of Sustainable Tourism 2021, 29, 158–175. [Google Scholar] [CrossRef]
  23. Li K R, Yang Y Q, Zheng Z Q. Research on color harmony of building façades. Color Research & Application 2020, 45, 105–119. GOUAICH Y, MEBROUKI A, GHARIRI R, et al. A Novel Method for Assessing the Chromatic Integration of Architecture in the Ksourian Landscape of M’zab Valley, Algeria. Color Research & Application 2018, 43, 760–778.
  24. KISHOR Y N, MUKESH S. A Novel Fuzzy Clustering Based Method for Image Segmentation in RGB-D Images. Engineering Applications of Artificial Intelligence 2022, 111, 104709. [CrossRef]
  25. JÉGOU, L. Expanding the Sémiologie Graphique for contemporary cartography, some ideas from visual semiotics, art history and design. Cartography and Geographic Information Science 2019, 46, 182–188. [Google Scholar] [CrossRef]
  26. ZHONG T, YE C, WANG Z, et al. Cityscale mapping of urban façade color usingstreet-view imagery. Remote Sensing 2021, 13, 1591. [CrossRef]
  27. FU Qian, Wang Xuan, Huang Yujing, et al. Extraction and Analysis of Architectural Color Gene in the Main Urban Areas of Changsha City. Journal of Changsha University 2021, 35, 30–37.
  28. MIAO Ming-rui, XIONG Jing-hua, FENG Lu-hang, et al. Research on the application of color in paper packaging based on regional characteristics of multi-source data and K-means clustering. China Paper 2023, 42, 95–103.
  29. WU Kan, YANG Neng-hui. Analysis and application of color characteristics of Mawangdui silk painting based on K-means clustering. Packaging Engineering 2023, 44, 305–314.
  30. CHEN Tian-yu, XIAO Wang-qun. Product color design method based on PCCS color system and gray correlation analysis. Packaging Engineering 2023, 1–12.
  31. HASLER, D.; SUESSTRUNK, S.E. Measuring colorfulness in natural images. In: Human Vision and Electronic Imaging VIII. International Society for Optics and Photonics 2003, 5007, 87–95. [Google Scholar]
  32. JIANG Hao-bo, LU Shan, Xiao Yang. Method of Urban Color Evaluation for Historic and Cultural Areas in Shanghai Based on Street View Technology. Urban Planning Journal 2022, 111–118.
  33. WU Ze-yu, ZHANG Yu. Research on urban color quantification method based on large-scale streetscape images; Urban Planning Society of China, Hangzhou Municipal People’s Government, 2018; p. 8. [Google Scholar]
  34. HU Wei. Analysis on the characteristics of regional culture integration into decoration design based on visual communication design: A case study of Chengdu subway station. Urban Rail Transit Research 2023, 26, 301–302.
  35. Morton, W B. The Secretary of the Interior’s standards for rehabilitation and illustrated guidelines for rehabilitating historic buildings. National Park Service, 1992.
  36. Guthrie, S. Main Street Historic District, Van Buren, Arkansas: Using HCRS Grant-in-aid Funds for Storefront Rehabilitation/restoration Within a Districtwide Plan; US Department of the Interior, Heritage Conservation and Recreation Service, Technical Preservation Services, 1980.
  37. Bradecki T, Uherek-Bradecka B. Preservation, Reconstruction or Conversion-Contemporary Challenge for Historic Urban Areas and Historic Buildings. Advanced Engineering Forum. Trans Tech Publications Ltd. 2014, 12, 115–121. [Google Scholar]
  38. Santopuoli N, Pecoraro I. Historic Centers Restoration and Ancient Buildings Energetic Efficiency Improvement. Advanced Aspects of Engineering Research 2021, 8, 82–90. [Google Scholar]
  39. Garcia-Codoñer A, Verdu J L, Barchino A T, et al. Colour as a structural variable of historical urban form. Color Research & Application 2009, 34, 253–265. [Google Scholar]
  40. Chahardowli M, Sajadzadeh H. A strategic development model for regeneration of urban historical cores: A case study of the historical fabric of Hamedan City. Land Use Policy 2022, 114, 105993. [Google Scholar] [CrossRef]
  41. KOÇ C, KEJANLI D T. EVALUATION OF URBAN PRESERVATION IN HISTORICAL ENVIRONMENT BY VISUAL PERCEPTION: MIDYAT AND SURICI CASES. ARCHDESIGN’19/VI. INTERNATIONAL ARCHITECTURAL DESIGN CONFERENCE PROCEEDINGS; DAKAM Yayınları, 2019; p. 309. [Google Scholar]
  42. Doleżyńska-Sewerniak, E. Color of the façades of historic buildings from the turn of 19th and 20th centuries in northeast Poland. Color Research & Application, 2019, 44, 139–149. [Google Scholar]
  43. Zhao P, Liao W, Xue H, et al. Intelligent design method for beam and slab of shear wall structure based on deep learning. Journal of Building Engineering 2022, 57, 104838. [Google Scholar] [CrossRef]
  44. Metwally, E. Achieving the visual perception and gestalt psychology in sultan Hassan mosque building. Open Journal of Applied Sciences 2021, 11, 21–40. [Google Scholar] [CrossRef]
  45. Sultana R, Rashedi A, Khanam T, et al. Life cycle environmental sustainability and energy assessment of timber wall construction: A comprehensive overview. Sustainability 2022, 14, 4161. [Google Scholar] [CrossRef]
  46. Cabral M R, Blanchet P. A state of the art of the overall energy efficiency of wood buildings—An overview and future possibilities. Materials 2021, 14, 1848. [Google Scholar] [CrossRef]
  47. Du Y, He Y. Environment· Feature· Culture—Inheritance and Innovation of Traditional Regional Architecture in Jiangnan—Take Suzhou Museum as an Example. Academic Journal of Architecture and Geotechnical Engineering 2023, 5, 20–26. [Google Scholar]
  48. Gu, X. The Analysis of Architecture Design Elements of Jiangnan Traditional Residence Based on AHP. IOP Conference Series: Earth and Environmental Science. 2021, 768, 012137. [Google Scholar] [CrossRef]
  49. Xu H, Mamat M J. Showcasing Tradition, Innovative Design Regional Culture in Chinese Museum Interiors. Migration Letters 2023, 20, 1388–1400. [Google Scholar]
  50. Song Y, Liao C. Research on the Architectural Features and Artistic Elements of Traditional Buildings in Different Regions of Jiangxi, China. Buildings 2023, 13, 1597. [Google Scholar] [CrossRef]
  51. Bailey, B. The Army in the marketplace: Recruiting an all-volunteer force. The Journal of American History 2007, 94, 47–74. [Google Scholar] [CrossRef]
  52. Li Y, Xu Y. A Study on Landscape VR Design of Special Neighborhood Based on Traditional Culture. Wireless Communications and Mobile Computing 2022, 2022, 7596883. [Google Scholar] [CrossRef]
  53. CHEN Shao-hua. The application of regional characteristics in packaging design. Sichuan Drama 2018, 70–71. [Google Scholar]
  54. ZHU Rong. Urban Memory and Urban Form: Exploring the Continuity of Urban History and Culture from the Perspectives of Psychology and Sociology. Southern Architecture 2006, 5–9.
  55. WANG Juan. Innovative application of color elements in visual communication design, Packaging Engineering 2021, 42, 378–381.
  56. HAO Yong-chun, CHEN Fan. Research on the application of color aesthetics in building façade design. Building Science 2021, 37, 177. [Google Scholar]
  57. LIU Zhang-sheng, ZHANG Xiao-lu, ZHANG Li-wen, Research on the Progress and Trend of Architectural Color in China from the Perspective of Mapping Knowledge Domain. ZHUANGSHI 2022, 136–138.
  58. YANG Chun-feng. The art of architectural painting and its application of color. Architectural Journal 1992, 51–53. [Google Scholar]
  59. ZHANG Nan-nan. Exploration of urban color planning and management in Hangzhou. Planners 2009, 25, 48–52. [Google Scholar]
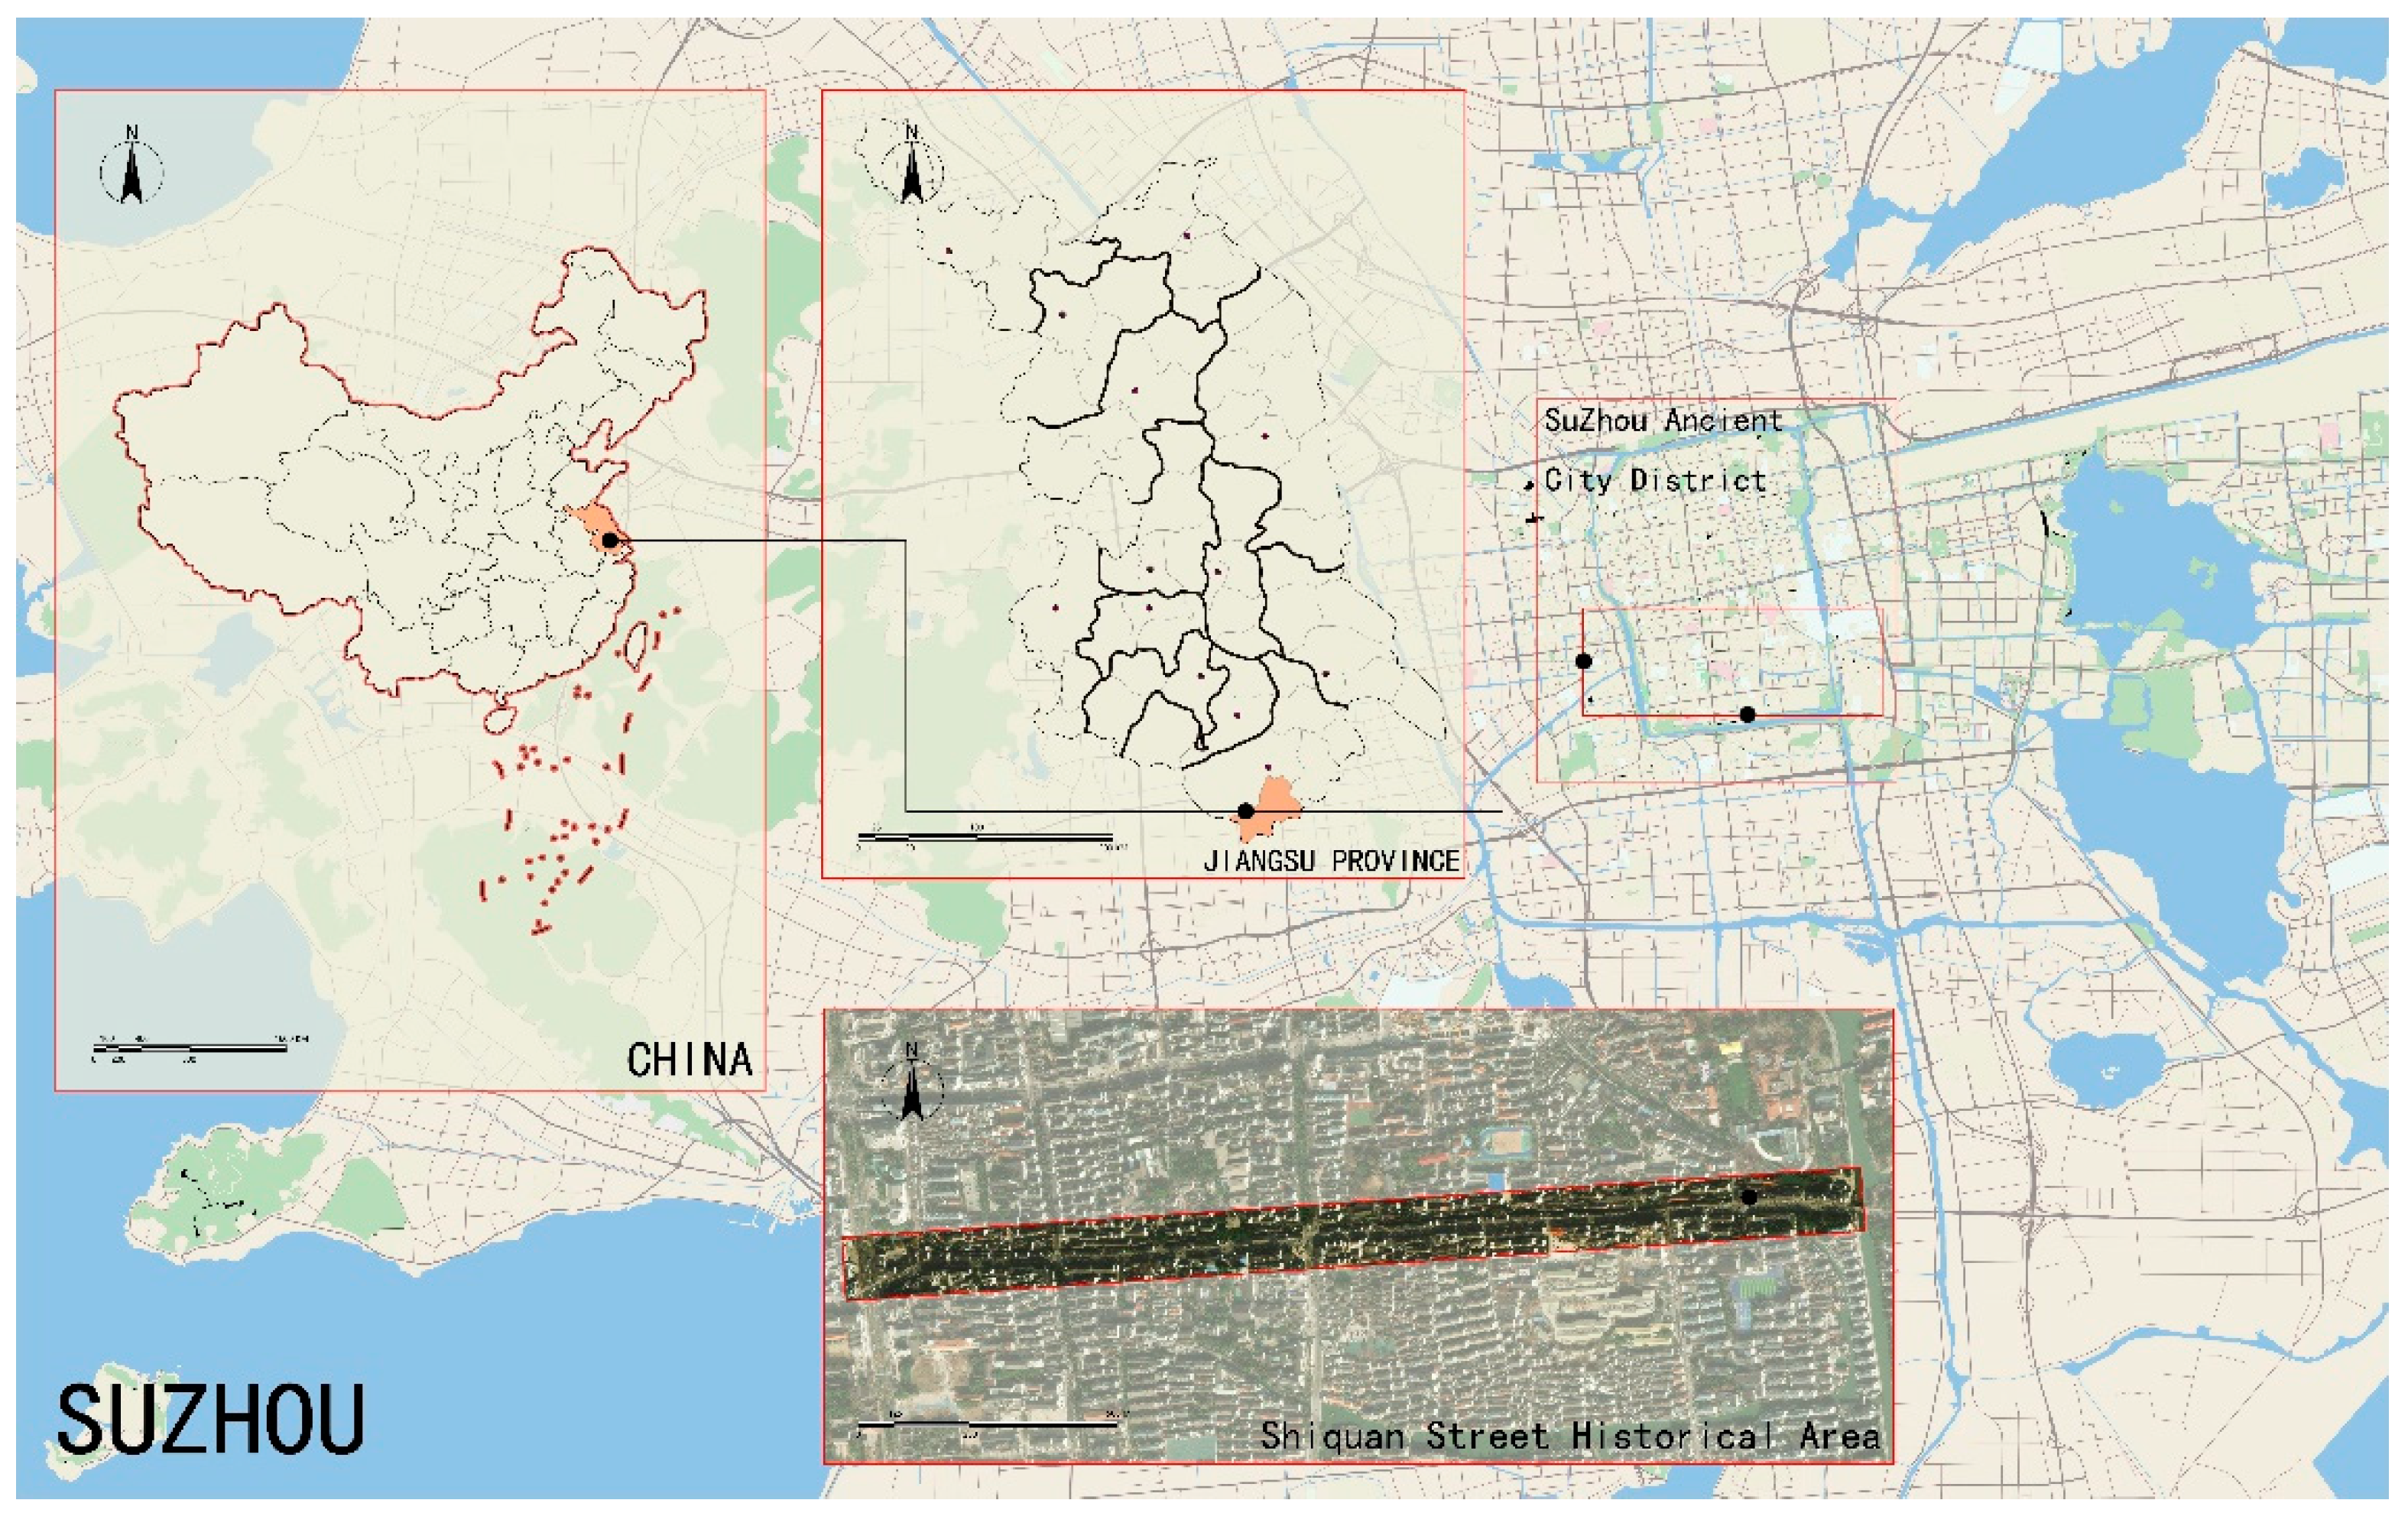
Figure 1. Historical areas of Shiquan Street in Suzhou.
Preprints 97396 g001
Figure 2. Current situation of Shiquan Street in Suzhou.
Preprints 97396 g002
Figure 3. Research flowchart.
Preprints 97396 g003
Figure 4. Sampling points.
Preprints 97396 g004
Figure 5. Street view photo sample sampling diagram.
Preprints 97396 g005
Figure 6. Deeplab v3+network.
Preprints 97396 g006
Figure 7. Deeplab v3+network training process.
Preprints 97396 g007
Figure 8. HSV color model.
Preprints 97396 g008
Figure 9. Color direction map, space map and schematic color matching at 0◦ perspective.
Preprints 97396 g009
Figure 10. Color direction map, space map and schematic color matching at 90◦ perspective.
Preprints 97396 g010
Figure 11. Color direction map, space map and schematic color matching at 270° perspective.
Preprints 97396 g011
Figure 12. Color point spectra of historical areas in Shiquan Street, Suzhou.
Preprints 97396 g012
Figure 13. Color point spectra of historical areas in Shiquan Street, Suzhou.
Preprints 97396 g013
Disclaimer/Publisher’s Note: The statements, opinions and data contained in all publications are solely those of the individual author(s) and contributor(s) and not of MDPI and/or the editor(s). MDPI and/or the editor(s) disclaim responsibility for any injury to people or property resulting from any ideas, methods, instructions or products referred to in the content.
Copyright: This open access article is published under a Creative Commons CC BY 4.0 license, which permit the free download, distribution, and reuse, provided that the author and preprint are cited in any reuse.
Prerpints.org logo

Preprints.org is a free preprint server supported by MDPI in Basel, Switzerland.

Subscribe

© 2024 MDPI (Basel, Switzerland) unless otherwise stated