1. Introduction
The T lymphocyte is the chief orchestrator of the adaptive immune system, coordinating and regulating the multi-level interactions and deployment of both cell-mediated immunity and antibody responses [
1]. T cells initiate the critical early stages of an immune response via the signaling reactions induced by T cell receptor (TCR) binding to an antigenic stimulus. A major component of the antigen-activated TCR signaling pathway is an early rapid increase in cytosolic Ca
2+ levels deriving from intracellular Ca
2+ storage sites as well as activation of tightly coupled Ca
2+ influx pathways [
2,
3,
4]. T cell activation, thus relies heavily on the functional integrity of intracellular Ca
2+ stores, generally thought to reside in the endoplasmic reticulum (ER). Regulation and maintenance of ER Ca
2+ levels is therefore essential for activation of the TCR pathway, and the central family of ion-transporting enzymes mediating these functions are the sarcoplasmic/endoplasmic reticulum Ca
2+-ATPases (SERCAs) [
4,
5,
6,
7]. The SERCA Ca
2+-ATPases or Ca
2+ pumps have attracted much interest as potential targets for drug modulation in disease states given their prominent role in contributing to Ca
2+ release/uptake events integrated within the TCR-induced signaling framework [
8,
9,
10,
11,
12,
13,
14,
15,
16].
In this study we have sought to further characterize the pharmacology of SERCA-regulated Ca
2+ stores in T lymphocytes. There is a clear imperative to gain a better understanding of the roles played by Ca
2+ stores as essential regulators of the complex spatiotemporal Ca
2+ signal underlying critical early signaling events driving T cell activation [
17,
18,
19]. A powerful approach to probing Ca
2+ store functions in T cell signaling networks is to modulate SERCA pump function using an array of small molecule pharmacological agents that can potentially provide a means for fine control of the various SERCA pump states as the primary regulators determining ER Ca
2+ store levels [
9,
11,
12,
16,
19].
Much has been learned about Ca
2+ stores regulation using the classic thapsigargin, cyclopiazonic acid and 2,5-di-(
tert butyl)-1,4-benzohydroquinone trio of SERCA blockers, clearly validating the profitable application of SERCA pharmacology in efforts to dissect Ca
2+ signaling mechanisms [
20,
21,
22,
23]. Thus to further augment our tools for SERCA pump modulation, there is compelling interest to complement the SERCA inhibitors with compounds that can increase SERCA activity. We can potentially achieve a greater insight into the complex roles and functions of ER Ca
2+ stores by utilizing pharmacological agents that can both downregulate as well as upregulate SERCA functional activity. At present, CDN1163 appears to be the best pharmacological agent with the capacity to increase SERCA activity, having been shown to exert a significant boost in SERCA enzymatic action in muscle and nonmuscle SERCA isoforms [
8,
12,
15,
19,
24,
25,
26]. We were thus motivated to examine the effects of CDN1163 on Ca
2+ stores in T cells, the critical central coordinator of the adaptive immune system with a uniquely pronounced dependency on ER Ca
2+ stores and Ca
2+ influx pathways underlying T cell activation.
3. Discussion
To better assess novel actions of potential SERCA activators within the Ca
2+ signaling landscape of T cell functions, we were motivated to extend seminal previous work characterizing the major intracellular Ca
2+ stores. We have employed the strategy of using low concentrations of TG and tBHQ in our experiments, an approach successfully applied to probe the functions SERCA 2b and SERCA 3- regulated Ca
2+ pools in human platelets. We applied this strategy using the Jurkat T lymphocyte model which has been used less extensively than platelets to characterize properties of the intracellular Ca
2+ stores. We identified the lowest concentrations of SERCA blockers that elicited measurable Ca
2+ release responses in cells incubated in Ca
2+-free media, thus providing greater assurances of using these agents to specifically modulate the SERCA 2b and SERCA 3 pump isoforms. We validated the use of the Jurkat T cell line by verifying that these same effects could be produced in primary lymphocytes isolated from rat splenocytes, confirming that Jurkat cells share the same pharmacological phenotype as primary T lymphocytes when treated with low dose TG and tBHQ. Indeed, use of the Jurkat T lymphocyte provides a significant experimental advantage given their clonal homogeneous responses and the ability to cultivate large numbers of cells, features which greatly assist analysis of measuring relatively weak signals due to modest SERCA perturbations. Moreover, Jurkat lymphocytes continue to be used as powerful T cell model systems given the strong validation and close overlap with primary T cells in the signaling representation of the TCR pathway as the primary upstream activator of ER Ca
2+ release along with the tightly coupled Ca
2+ influx pathway [
28,
30,
31,
46].
We have examined the Ca
2+ pool profile in Jurkat lymphocytes with the added discriminatory refinement of employing low concentrations of TG and tBHQ, referencing previous work in human platelets in which this approach has been productively used to gain insight into SERCA 2b and SERCA 3- regulated Ca
2+ stores [
36,
39,
40,
41,
51,
53]. Using low dose TG and tBHQ in Ca
2+-free cell suspensions we have determined Ca
2+ release specifically from SERCA 2b versus SERCA 3-regulated Ca
2+ stores in T lymphocytes. Indeed, our experiments extend earlier investigations to describe at least five distinct Ca
2+-releasable storage sites in T cells: a TG-sensitive SERCA 2b pool, a subcompartment of the TG-sensitive pool releasable by IP3, a tBHQ-sensitive SERCA 3 pool, a pool dischargeable by agonists of RyRs, a pool releasable by GPCR agonists and finally the remaining Ca
2+ storage pool releasable by ionomycin application. These are clearly approximate estimations given agonists, such as thrombin, can release Ca
2+ from multiple SERCA-controlled stores; and, moreover, Ca
2+ stores in T cells are likely to contain built-in interconnectivity with Ca
2+ release from one compartment being captured by a neighboring SERCA-regulated compartment, as has been shown for the RyR expressing Ca
2+ pools in T lymphocytes [
27,
28,
43,
56]. These observations suggest the intriguing scenario of a complex and dynamic interrelationship among the various intracellular Ca
2+ stores whereby rapid exchange and flow of Ca
2+ ions through discrete regional space of the larger ER organelle, whether phsyically separated or not, may establish
de novo spatially localized gradients adapted to accommodate specific T cell signaling functions. These experiments have further characterized the complex array of Ca
2+ storage compartments and functions in T lymphocytes and have provided a useful foundation of SERCA-specific actions (inducible via low dose TG and tBHQ) to examine the effects of the novel SERCA-activating compound CDN1163.
In contrast to most CDN1163 studies, we did not observe a clear and unambiguous stimulatory effect of the compound on T cell SERCA activity. Indeed, our experiments revealed a surprising short and long-term acting dichotomy in which an initial period of apparent SERCA inhibition and Ca
2+ stores depletion gradually shifts to SERCA activation and Ca
2+ stores repletion. This discrepancy with previous reports may be due to a more complex SERCA pump expression profile in T cells, given that these cells rely on a minimum of at least two distinct SERCA pump isoforms to manage intracellular Ca
2+ signaling dynamics. Jurkat T lymphocytes, an often used surrogate for T cell function, are well known for their expression of multiple SERCA isoforms with the predominant pump species being the SERCA 2b and SERCA 3 isoforms [
32,
57]. And although the specific protein functions are unknown, Jurkat T cells appear to tap into an extensive diversity in SERCA gene expression with earlier studies revealing the expression of all six SERCA 3 pump isoforms (SERCA 3a-f) along with the SERCA 2b isoform [
35,
58], which suggests a high degree of precisioned and specialized control built in for regulation of T cell Ca
2+ store functions.
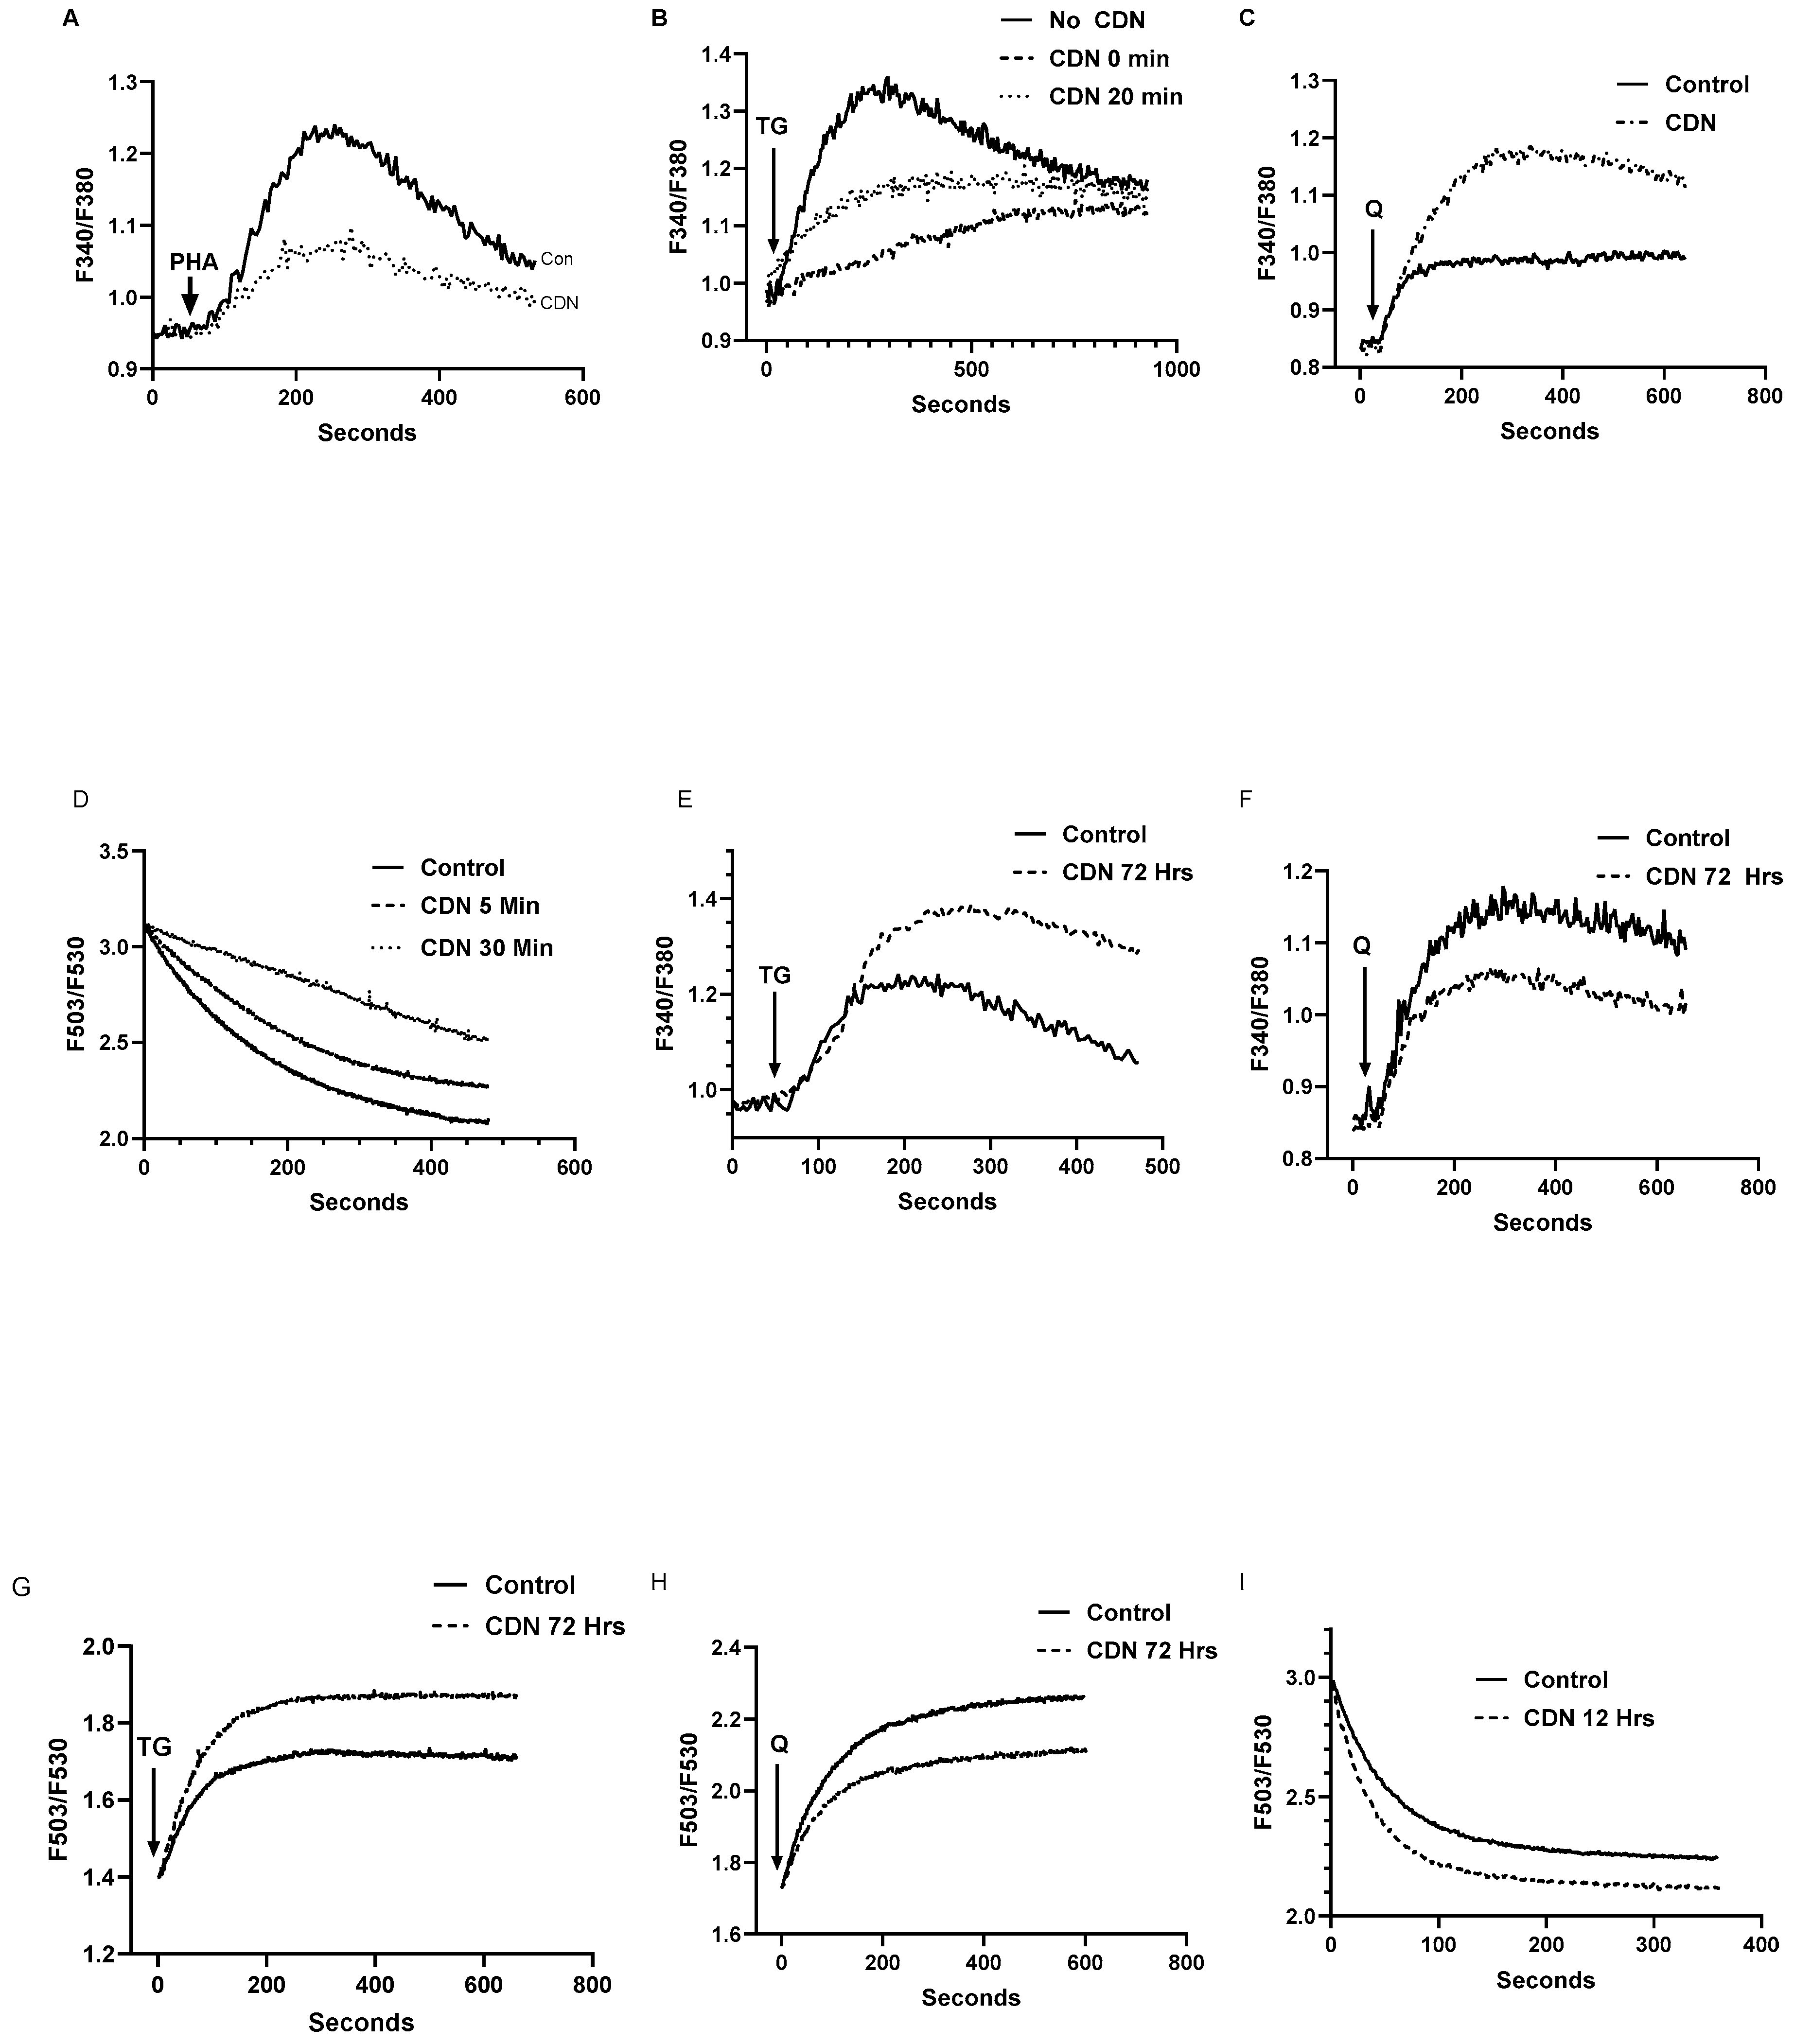
Indeed, some of the apparent incongruous effects we observe with CDN1163 may be due to this complex SERCA environment in T cells, with distinct pump isoforms working in diverse groups of interacting protein partners within heterogeneous ER/PM locales. We find, for example, that when Jurkat lymphocytes are exposed to the putative SERCA activator CDN1163 for short durations (≤ 30 minutes) Ca2+ release induced by the IP3 pathway or by low dose TG treatment are significantly reduced. We observed this effect in Ca2+ responses measured in both intact and permeabilized cells, a result which paradoxically suggests that CDN1163 may be acting to perturb SERCA function, initiate ER Ca2+ leak pathways and promote loss of ER Ca2+ levels. This interpretation is consistent with our experiments using permeabilized cells in which we observed that short duration CDN1163 exposure suppressed Ca2+ uptake. These actions of CDN1163 to impair ER Ca2+ uptake produced a gradual increase in Ca2+ release observable in our permeabilized cell assays which was the likely cause of reduced IP3 and TG- inducible Ca2+ release.
Our approach in this study to use low concentration TG and tBHQ to specifically target SERCA 2b and SERCA 3 has provided insight into the novel actions of CDN1163. We report here intriguing differences using these two SERCA blockers in the sensitivity of SERCA 2b and SERCA 3 to the effects of the SERCA activator CDN1163. In our experiments CDN1163 appears to perturb SERCA 2b regulated Ca
2+ stores to a greater extent than the low dose tBHQ sensitive SERCA 3 Ca
2+ store. It is worth noting that CDN1163 has been shown in previous studies to bind to and modulate SERCA 2 isoforms in various cells and tissues, but no clear evidence has emerged for the compound’s effects on the SERCA 3 isoform [
8,
12,
26]. Indeed, we find that CDN1163 attenuates the low dose tBHQ releasable Ca
2+ store albeit with a less pronounced effect as compared to the TG sensitive pool. Furthermore, we have reported that long-term (>24 hours) CDN1163 exposure fails to produce a stimulatory effect with improved Ca
2+ release inducible by tBHQ unlike what is observed in the long-term incubation experiments with the TG-releasable Ca
2+ pool. These findings suggest that there are likely not uniform stimulatory effects induced by CDN1163 across all SERCA pump isoforms; and indeed, these experiments suggest that clear unambiguous stimulation of SERCA function may be difficult to achieve in T cells and other cells that express multiple SERCA pump isoforms.
Our work does appear to align with previous investigations characterizing CDN1163 as a SERCA activator, albeit acting on an enigmatically slower timeframe in our T lymphocyte model. As mentioned, this effect may be attributable to differential actions of the compound on the different SERCA pump isoforms expressed in the T lymphocyte, with the global cellular SERCA activity being the sum of complex stimulatory and inhibitory effects on SERCA 2b and SERCA 3. Intriguingly, however, CDN1163’s time-dependent augmentation of SERCA 2b Ca
2+ stores may be hinting at the compound’s ability to react to and promote differential SERCA states and/or SERCA-pumping environments. Indeed, CDN1163 was initially identified in a chemical library screen for its ability to interfere with SERCA binding interactions with phospholamban [
8], the cardiac protein regulator of the SERCA 2a pump isoform. Perhaps CDN1163 is targeting a similar site of regulatory control in the SERCA 2b pump explaining an initial early period of perturbation on Ca
2+ transport activity with accompanying Ca
2+ leak expression; yet with prolonged incubation, regulatory control possibly arising from time-dependent SERCA-associated protein partners re-configures ER systems to enhance Ca
2+ uptake.
It has been reported that hematopoietic and other cell types can recruit opposing SERCA actions with downregulation of SERCA 3 activity linked to time-dependent upregulation of SERCA 2b expression/function, an observation clearly identified during T cell activation [
57,
59,
60]. Indeed, other studies have identified STIM1 as a candidate potential SERCA regulator, such that when ER Ca
2+ stores experience relative depletion STIM1, as an ER Ca
2+ sensor, may participate in SERCA activating functions to replenish ER Ca
2+ levels [
61]. This may also explain the time delay we observe in our T cell model given the initial CDN1163-mediated ER Ca
2+ leak as a relatively weak, gradual depletion-activating signal may utlimately couple to STIM1 or other protein regulators to promote greater SERCA activity with increased ER Ca
2+ transport. Thus, continued interrogation and characterization of CDN1163 may offer an additional SERCA pharmacological tool to probe novel SERCA regulatory networks that appear to play multi-layered Ca
2+ signaling roles in T lymphocyte signaling.
4. Materials and Methods
4.1. Materials
Fura 2/AM (fura 2 acetoxymethylester), Fluo-3 pentapotassium salt, pluronic acid, RPMI-160, fetal bovine serum (FBS), streptomycin, and penicillin were obtained from Thermo Fisher. Ryanodine, oligomycin, thapsigargin, cytochalasin D were obtained from Santa Cruz Biotechnology, Inc. (Dallas, Texas). D-myo-Inositol 1,4,5 trisphosphate K salt (IP3), nicotinic acid adenine dinucleotide phosphate sodium salt (NAADP), phytohemagglutinin (PHA), 2,5-di-(tert butyl)-1,4-benzohydroquinone (tBHQ), thrombin, creatine phosphokinase (CPK), phosphocreatine disodium salt hydrate, adenosine 5′-triphosphate disodium salt hydrate (ATP), DTT, and saponin were obtained from Sigma. Sterile Cell Strainers (100 μm), 50 ml syringe tubes and 60 mm cell culture dishes were from Fisher Scientific. CDN1163 was from Bio-Techne (Minneapolis, USA).
4.2. Cell Culture
Jurkat cells (Clone E6-1, ATCC TIB-152) were maintained in RPMI-1640 medium supplemented with 10% fetal bovine serum, 2 mM L-glutamine, penicillin (100 IU/ml), and streptomycin (100 μg/ml) and grown at 37 °C in a humidified atmosphere (95% air,5% CO2). Cells were maintained and expanded in either 25 cm2 (T25) or 75 cm2 (T75) tissue culture flasks (Fisher Scientific). Cell density was not allowed to exceed 3 X 10⁶ cells/mL and cultures were generally maintained at a cell concentration between 1 x 10⁵ and 1 X 10⁶ viable cells/mL. Fresh medium was added every 2 to 3 days depending on cell density.
4.3. Splenocyte Isolation
The use of animals for these experiments was conducted in accord with protocols approved by the institutional animal care and use committees at the University of the Pacific (IACUC #22R05). Spleen and lymph nodes were aseptically isolated from adult Sprague-Dawley (SD) rats (8 weeks old, N=4). Briefly, rats were anesthetized and spleens were aseptically removed and placed into 60-mm cell culture dishes containing ice-cold HBSS (Hanks Balanced Salt Solution) and minced into small pieces with a scissor. Tissue fragments were dissected and passed through a 100-μm cell strainer using a 10-ml syringe plunger and ice-cold HBSS into a 50-ml conical tube and then centrifuged (200g at 4°C) for 10 min. The supernatant was discarded, and the pellet was resuspended in 5 ml of a red blood cell (RBC) lysis buffer containing 155 mM NH4Cl (9 parts) in 130 mM Tris base pH 7.65 (1 part) and incubated at 37°C for 5 min. RBC lysis was halted by the addition of 10 ml ice-cold complete cell culture medium and cells were then centrifuged (200g at 4°C) for 10 min. The supernatant was discarded, and the pellet was resuspended in 10 ml complete cell culture medium and maintained in a humidified atmosphere (37°C, 95% air and 5% CO2).
4.4. Cell Calcium Assays
Cells (approximately 1×10⁶ cells/ml) were washed in Ca2+-containing (1.8 mM) HBSS (Hanks Balanced Salt Solution) and loaded with 1.5 μM fura-2/AM in 20% (w/v) Pluronic F-127 and incubated for one hour at 37°C. After loading, the cells were washed twice with HBSS and incubated at 37°C for an additional 30 min to allow for de-esterification of the dye. Cells loaded with fura 2/AM were kept in the dark at room temperature throughout the experiments. Changes in cytosolic Ca2+ were measured in cell population experiments using a fluorescence spectrophotometer equipped with a thermostatically controlled sample compartment, permitting continuous stirring of samples in the cuvette. All measurements were carried out at room temperature (25°C). To achieve Ca2+-free conditions, EGTA (2 mM) was added to chelate extracellular Ca2+ just before the addition of Ca2+ mobilizing agonists (1-2 min). Ca2+ changes in Jurkat cells and rat splenocytes loaded with fura 2/AM were measured via rapid alternation of the excitation monochromator between 340 and 380 nm, with fluorescence emission measured at 510 nm using a ratiometric spectrofluorimiter (PTI). Cytosolic Ca2+ responses are presented as the changes in the fluorescence ratio values measured at 340/380 nm for Fura-2, or as non-ratiometric Fluo-3 fluorescence changes for the excitation/emission (503/530 nm) wavelength pair. The data are reported as either peak amplitude changes in fluorescence values or as initial rates of fluorescence changes and presented as the means ± S.E.M., with the number of experimental repetitions indicated in parentheses.
4.5. Permeabilized Cell Assays
For preparation of permeabilized cells, 4×10⁷ cells were washed twice and resuspended in 2 ml of an intracellular-like medium (110 mM-KCl, 10 mM-NaCl, 2 mM-MgCl2, 20 mM-Hepes, 5 mM-KH2PO4, pH 7.5) in the presence of 1 mM DTT. Saponin (20 μg/ml) was added, and the cell suspension was incubated for 5 min at 37°C to complete permeabilization. An ATP-regenerating system consisting of creatine kinase (40 units/ml) and phosphocreatine (20 mM) was added. Oligomycin (10 μg/ml) was also included to inhibit the mitochondrial ATPase. Following cell permeabilization, Fluo-3 (0.5 μM), was added to the cuvette. Subsequent addition of ATP to a final concentration of 1 mM resulted in a decrease in the fluorescence, indicating Ca2+ uptake by the intracellular stores. After baseline stabilization, drugs were added according to the experimental plan. Ca2+ release from intracellular stores was measured from cells suspended in cuvettes using a fluorescence spectrophotometer equipped with a thermostatically controlled sample compartment maintained at 37°C with continuous stirring. Fluorescence changes with Fluo-3 in permeabilized cell suspensions were measured with excitation wavelength settings of 503 nm and 530 nm for the emission wavelength.
4.6. Statistical Analysis
Analysis of statistical significance was performed using the Student’s T test. P values ≤ 0.05 were considered to represent significant differences in the results.
Figure 1.
Low concentrations of the SERCA blockers thapsigargin (TG) and 2,5, di-(tert-butyl) 1,4-benzohydroquinone (tBHQ) can specifically induce Ca2+ release from distinct Ca2+ stores in Jurkat and rat T lymphocytes. For A and B, Jurkat T lymphocytes were loaded with Fura-2 and suspended in Ca2+-free media (balanced salt solution plus 2 mM EGTA). A, Jurkat cell Ca2+ release responses induced by the sequential application (arrows) of TG (100 pM), tBHQ (Q, 1 μM) and ionomycin (I, 1 μM) as determined by the ratio of fluorescence changes at 340 and 380 nm (F340/380). B, the same experiment as in A but with the reverse application to Jurkat cells of tBHQ (Q, 1 μM), TG (100 pM) and ionomycin (I, μM). C, the same experiment as in B but with consecutive tBHQ applications (Q, 2 μM) to deplete the tBHQ pool, followed by TG application (100 pM). D, Rat spleen T cells loaded with Fura 2 and stimulated with TG (100 pM), tBHQ (Q, μM) and ionomycin (I, μM) in a balanced salt solution containing Ca2+. E, Rat spleen T cells stimulated with tBHQ (Q, μM), TG (100 pM) and ionomycin (I, μM) in Ca2+-containing media. Fluorescence traces shown are representative of four to ten separate experiments.
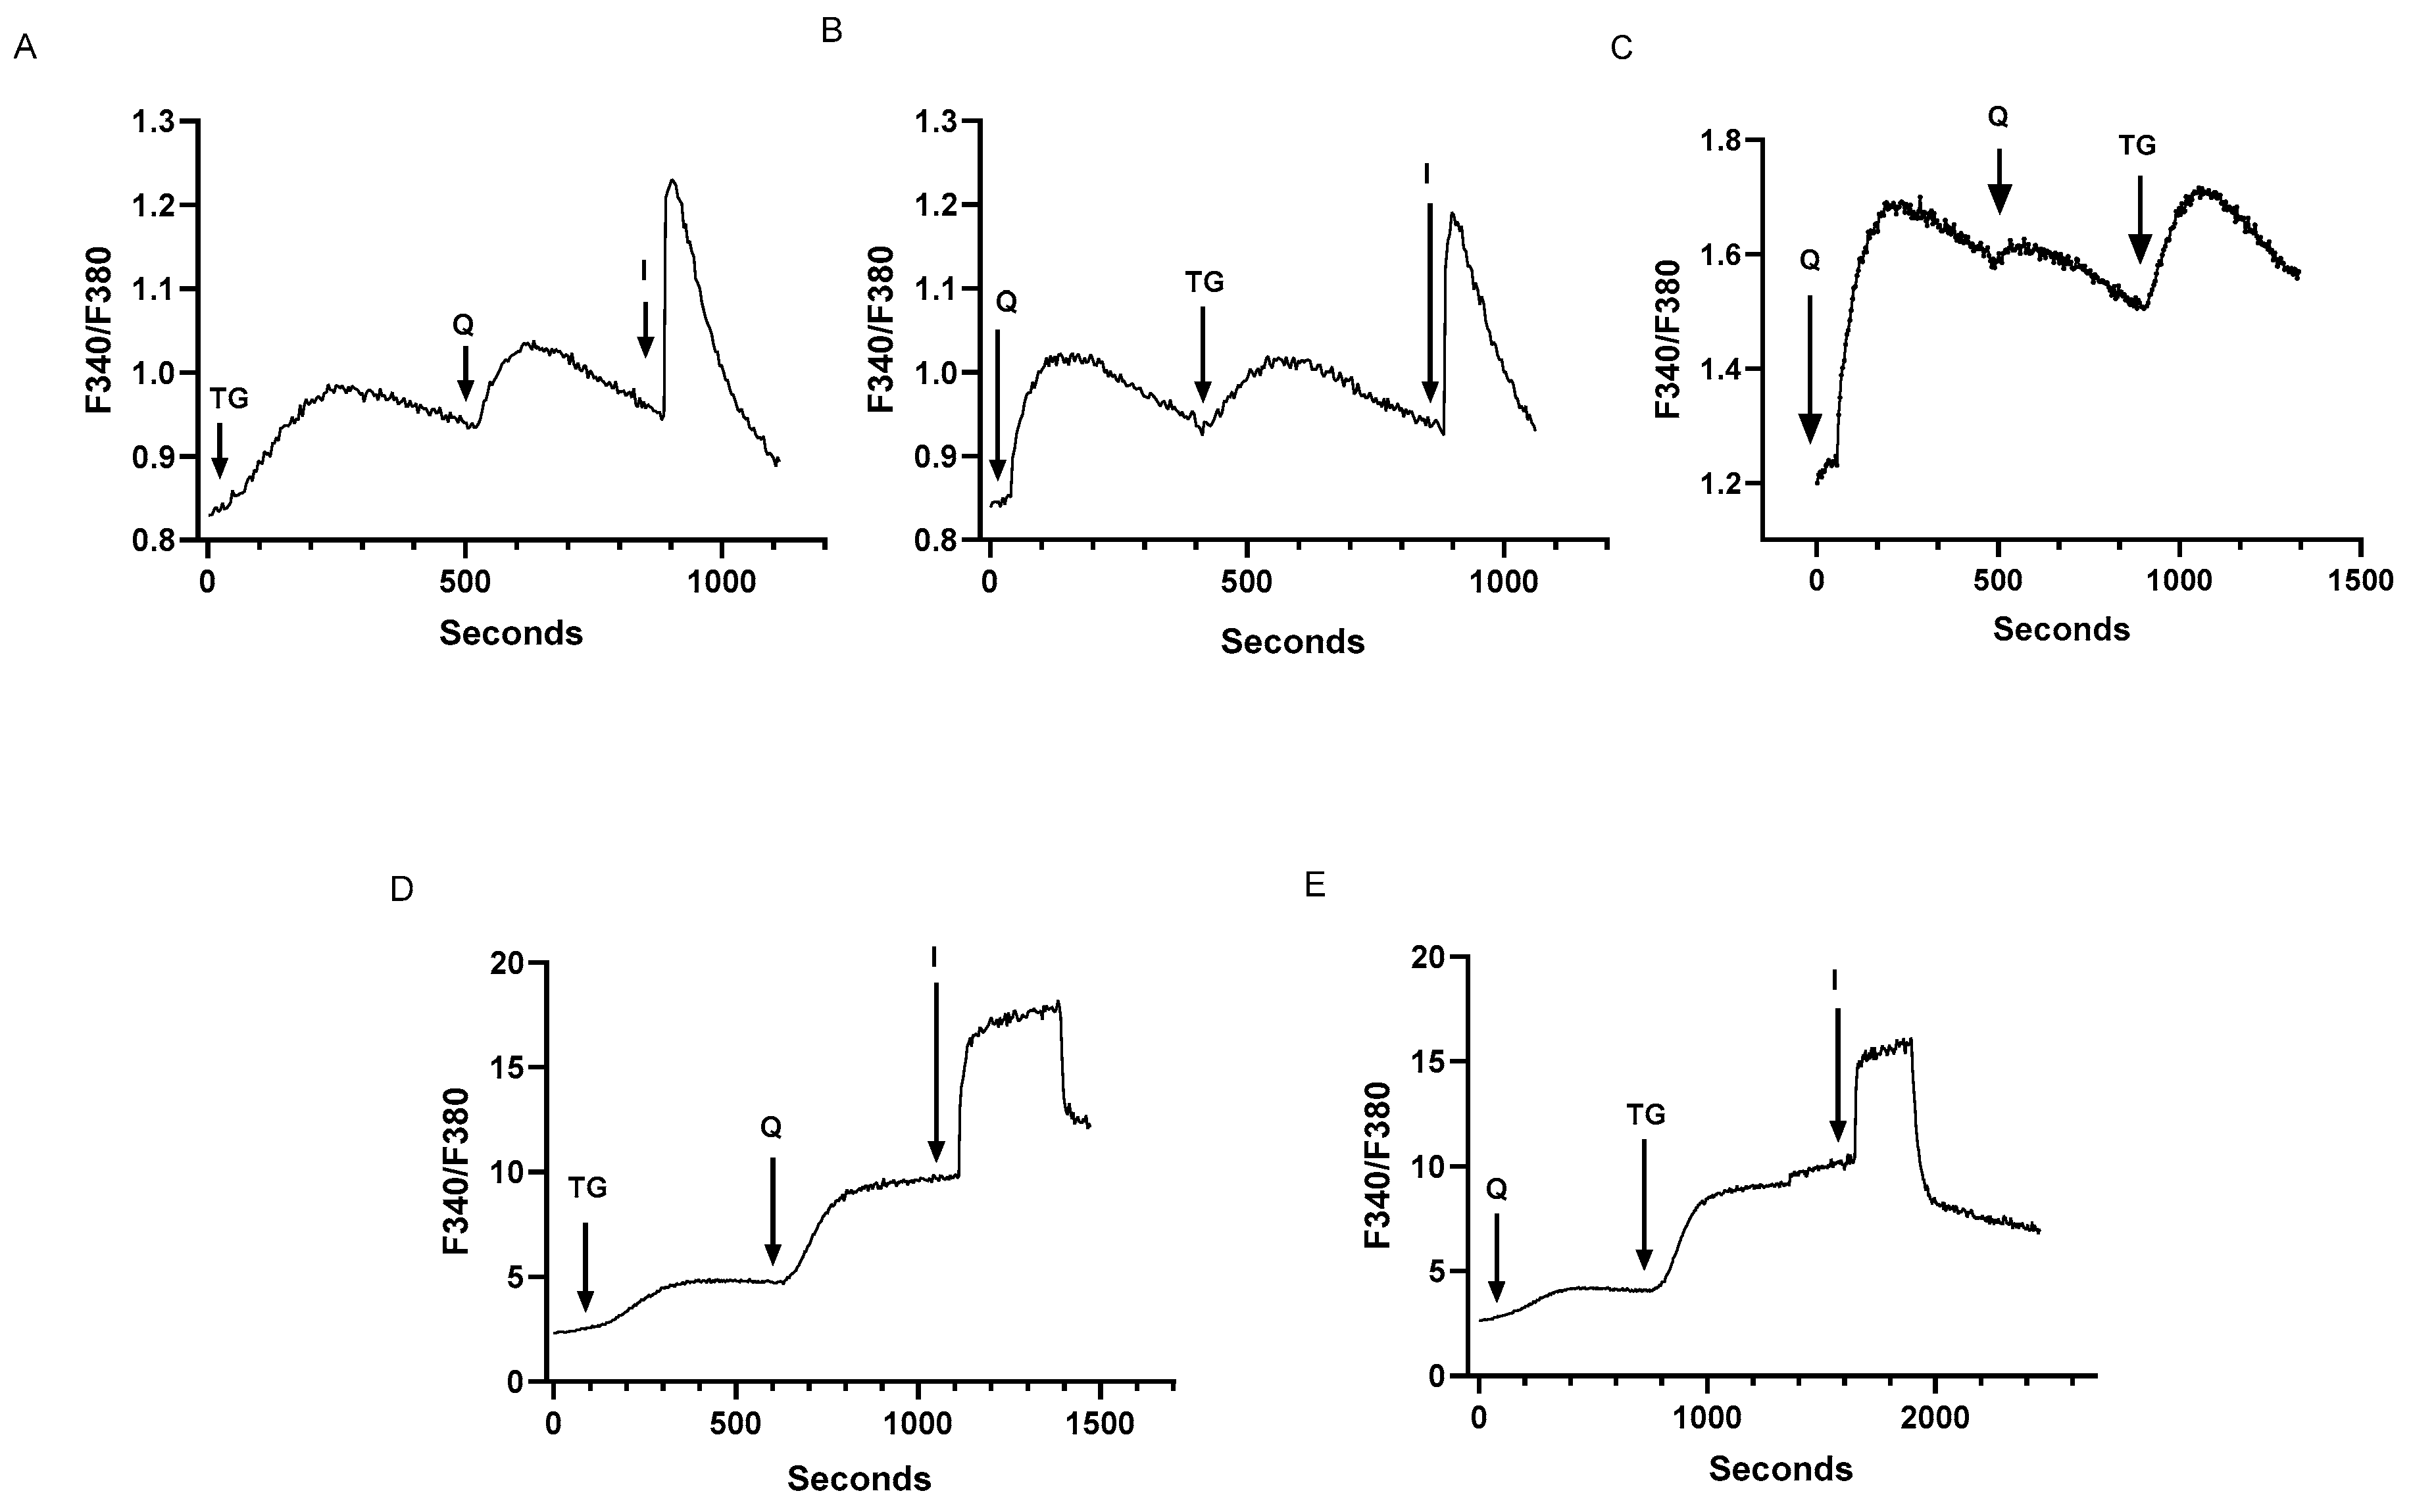
Figure 2.
Low dose SERCA blockers and Ca2+ release agonists reveal at least five distinct Ca2+ pools in intact and membrane permeabilized Jurkat T lymphocytes. For A and B, Jurkat T lymphocytes were loaded with Fura-2 and suspended in Ca2+-free media (balanced salt solution plus 2 mM EGTA). A, Jurkat cell Ca2+ release responses induced by the sequential application (arrows) of tBHQ (Q, 1 μM), TG (100 pM), PHA (10 μg/ml) and ionomycin (I, 1 μM) as determined by the ratio of fluorescence changes at 340 and 380 nm (F340/380). B, the same experiment as in A but with the sequential application to Jurkat cells of ryanodine (Ry, 30 μM), tBHQ (Q, 1 μM), TG (100 pM), PHA (10 μg/ml) and ionomycin (I, μM). C and D show experiments using saponin permeabilized Jurkat cells, depicting Ca2+ release responses as detected by Fuo-3 fluorescence changes. C, permeabilized cell responses to the sequential addition of NAADP (N, 400 μM), tBHQ (Q, 1 μM), IP3 (IP, 0.5 μM), TG (1.5 nM) and ionomycin (I, 1 μM). D. same experiment as shown in C but with the sequential addition of IP3 (IP, 0.5 μM), TG (1.5 nM), NAADP (N, 400 μM), tBHQ (Q, 1 μM) and ionomycin (I, 1 μM). Fluorescence traces shown are representative of six to ten individual experiments.
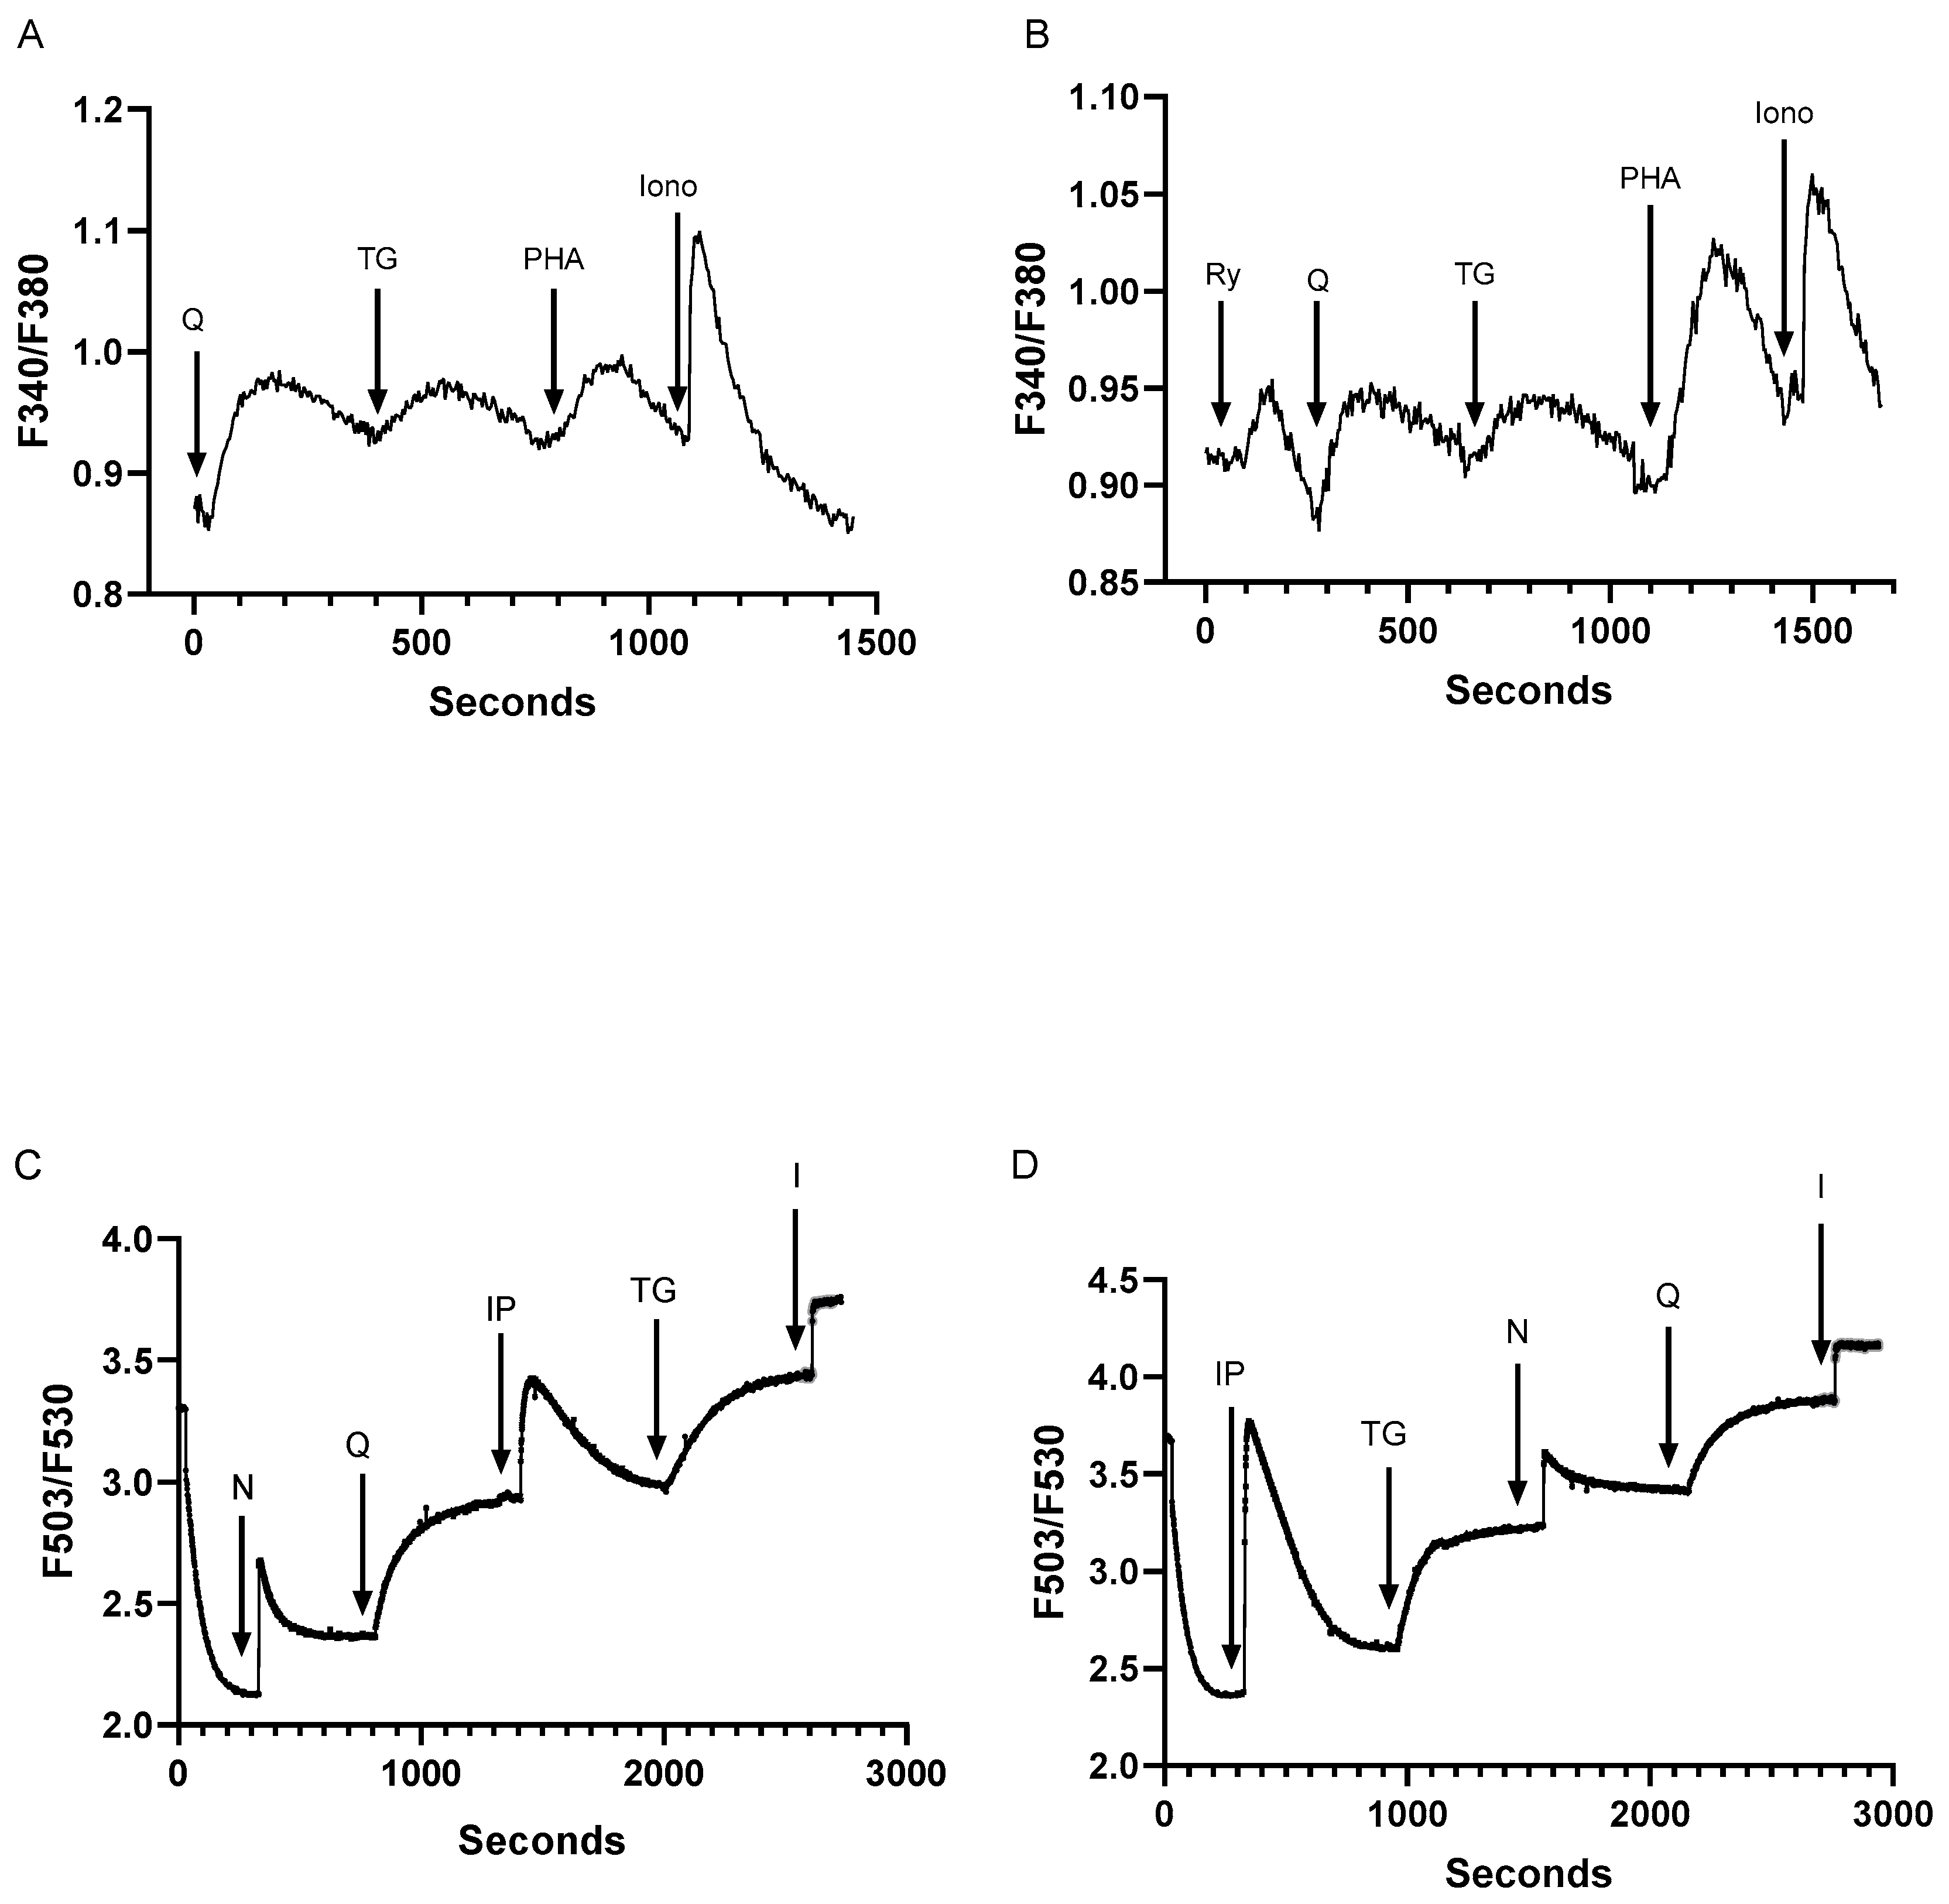
Figure 3.
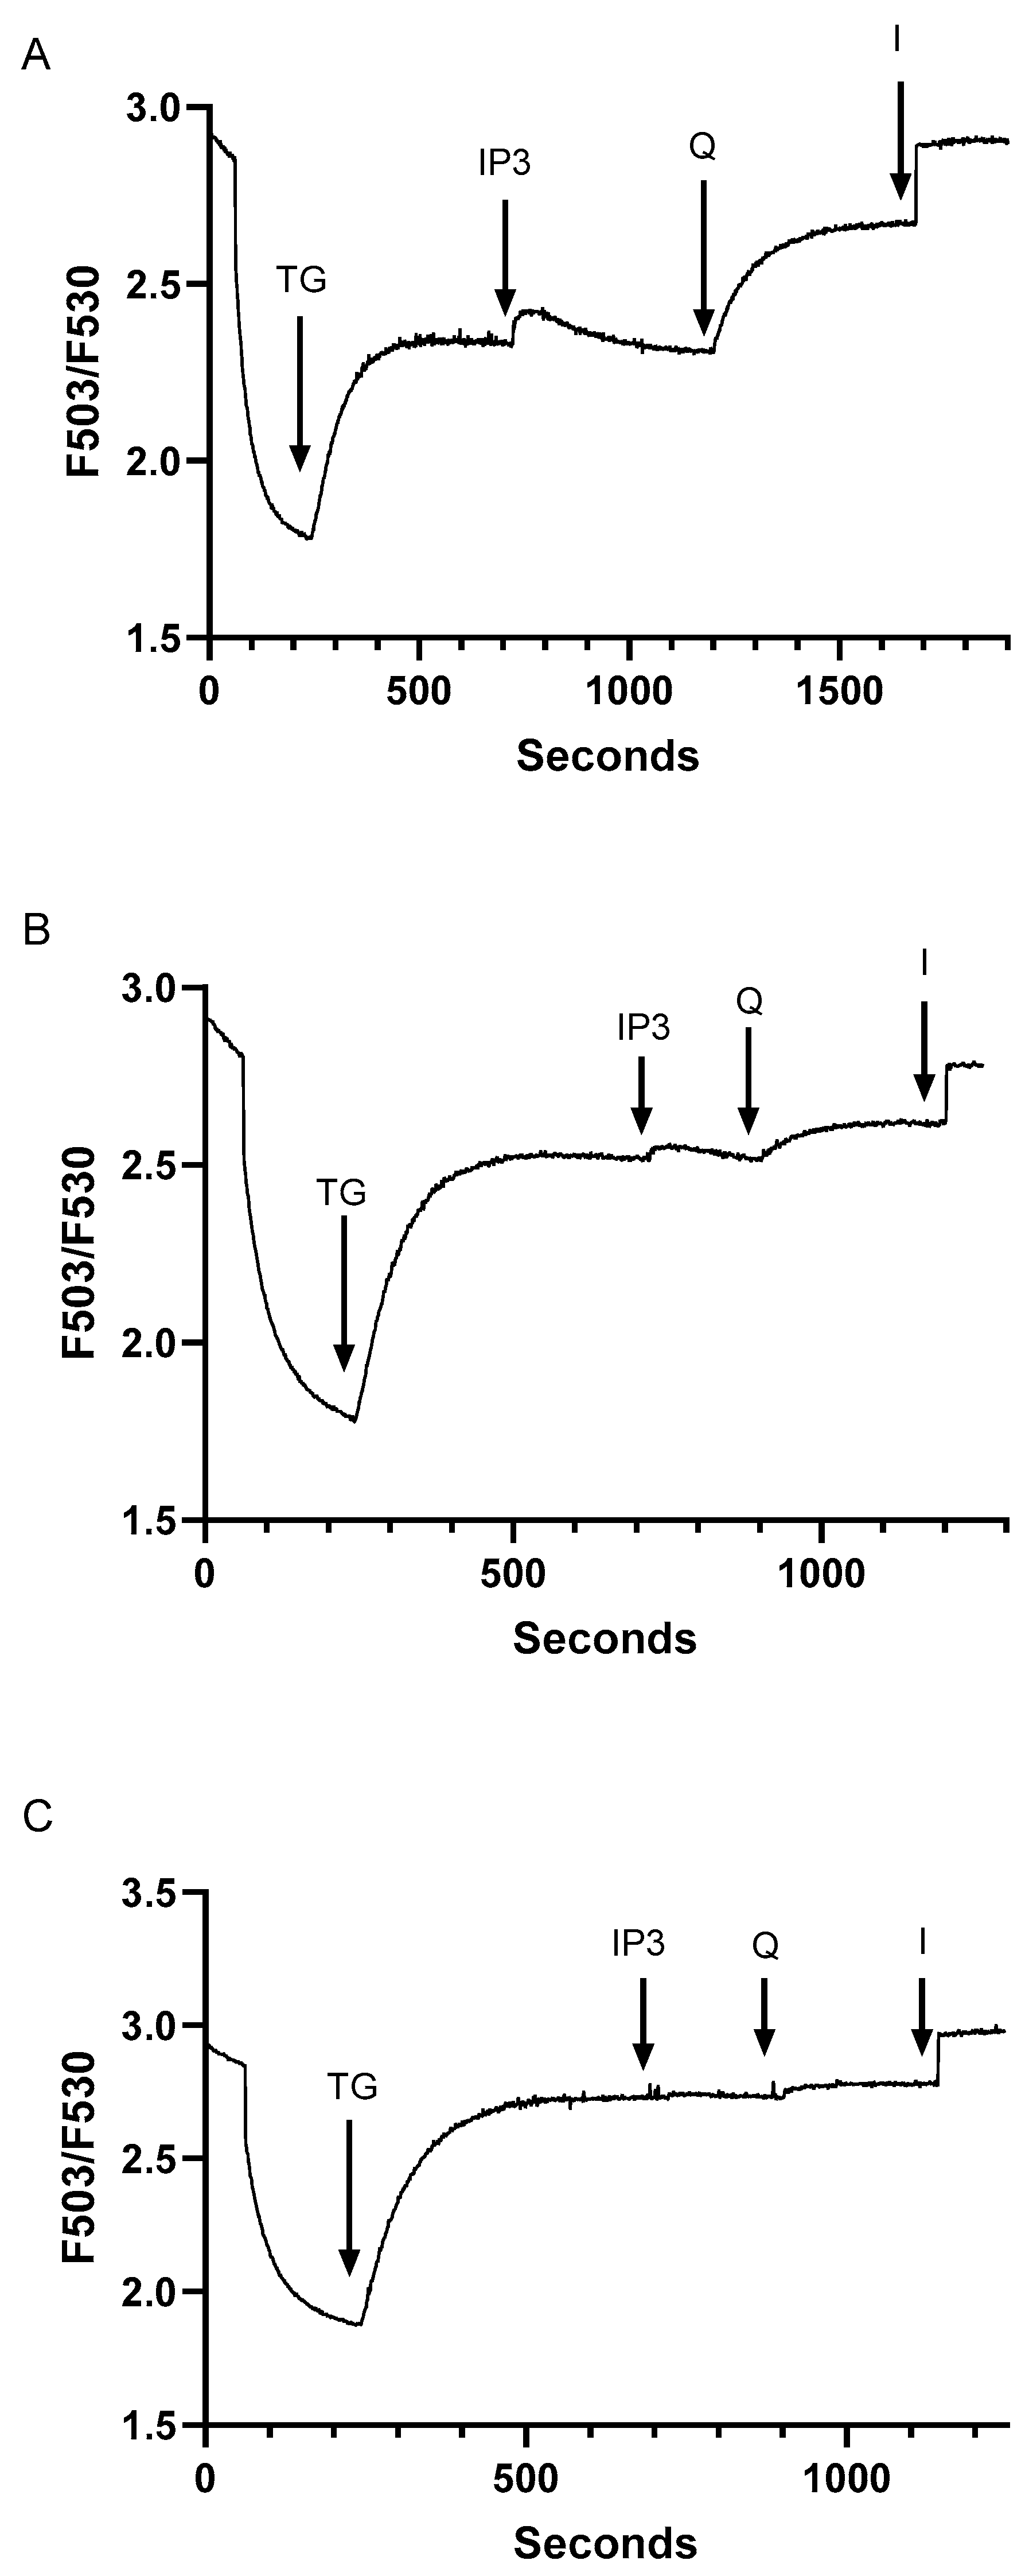
Increasing TG-induced SERCA inhibition depletes the IP3 and tBHQ- releasable Ca2+ pools establishing TG concentration range permitting SERCA pool specific modulation in Jurkat T lymphocytes. A-C show experiments using saponin permeabilized Jurkat cells, depicting Ca2+ release responses as detected by Fuo-3 fluorescence changes. A, permeabilized cell responses to the sequential addition of TG (2 nM), IP3 (0.5 μM), tBHQ (Q, 1 μM) and ionomycin (I, 1 μM). B, Ca2+ release responses induced in permeabilized Jurkat lymphocytes by the sequential application of TG (10 nM), IP3 (0.5 μM), tBHQ (Q, 1 μM), and ionomycin (I, 1 μM). C, Ca2+ release responses induced in permeabilized Jurkat lymphocytes by the sequential application of TG (15 nM), IP3 (0.5 μM), tBHQ (Q, 1 μM), and ionomycin (I, 1 μM). Fluorescence traces shown are representative of four to eight individual experiments.
Figure 4.
Relationships of the Ryanodine and Thrombin releasable Ca2+ pools to the low dose TG SERCA 2b and low dose tBHQ SERCA 3 regulated Ca2+ stores. For A-E, Jurkat T lymphocytes were loaded with Fura-2 and suspended in Ca2+-free media (balanced salt solution plus 2 mM EGTA). A, Jurkat cell Ca2+ release responses induced by the sequential application (arrows) of ryanodine (Ry, 30 μM) tBHQ (Q, 2 μM), TG (200 pM), and ionomycin (I, 1 μM) as determined by the ratio of fluorescence changes at 340 and 380 nm (F340/380). B, the same experiment as in A but with the sequential application to Jurkat cells of ryanodine tBHQ (Q, 2 μM), ryanodine (Ry, 30 μM), TG (200 pM), and ionomycin (I, μM). C, Ca2+ release responses to the sequential addition of tBHQ (Q, 2 μM), thrombin (Thr, 0.1 U/ml), TG (200 pM) and ionomycin (1 μM). D, Ca2+ release responses to the sequential addition of TG (200 pM), thrombin (Thr, 0.1 U/ml), tBHQ (Q, 2 μM), and ionomycin (1 μM). E, Ca2+ release responses to the sequential addition of tBHQ (Q, 2 μM), TG (200 pM), thrombin (Thr, 0.1 U/ml), and ionomycin (1 μM). Fluorescence traces shown are representative of four to seven individual experiments.
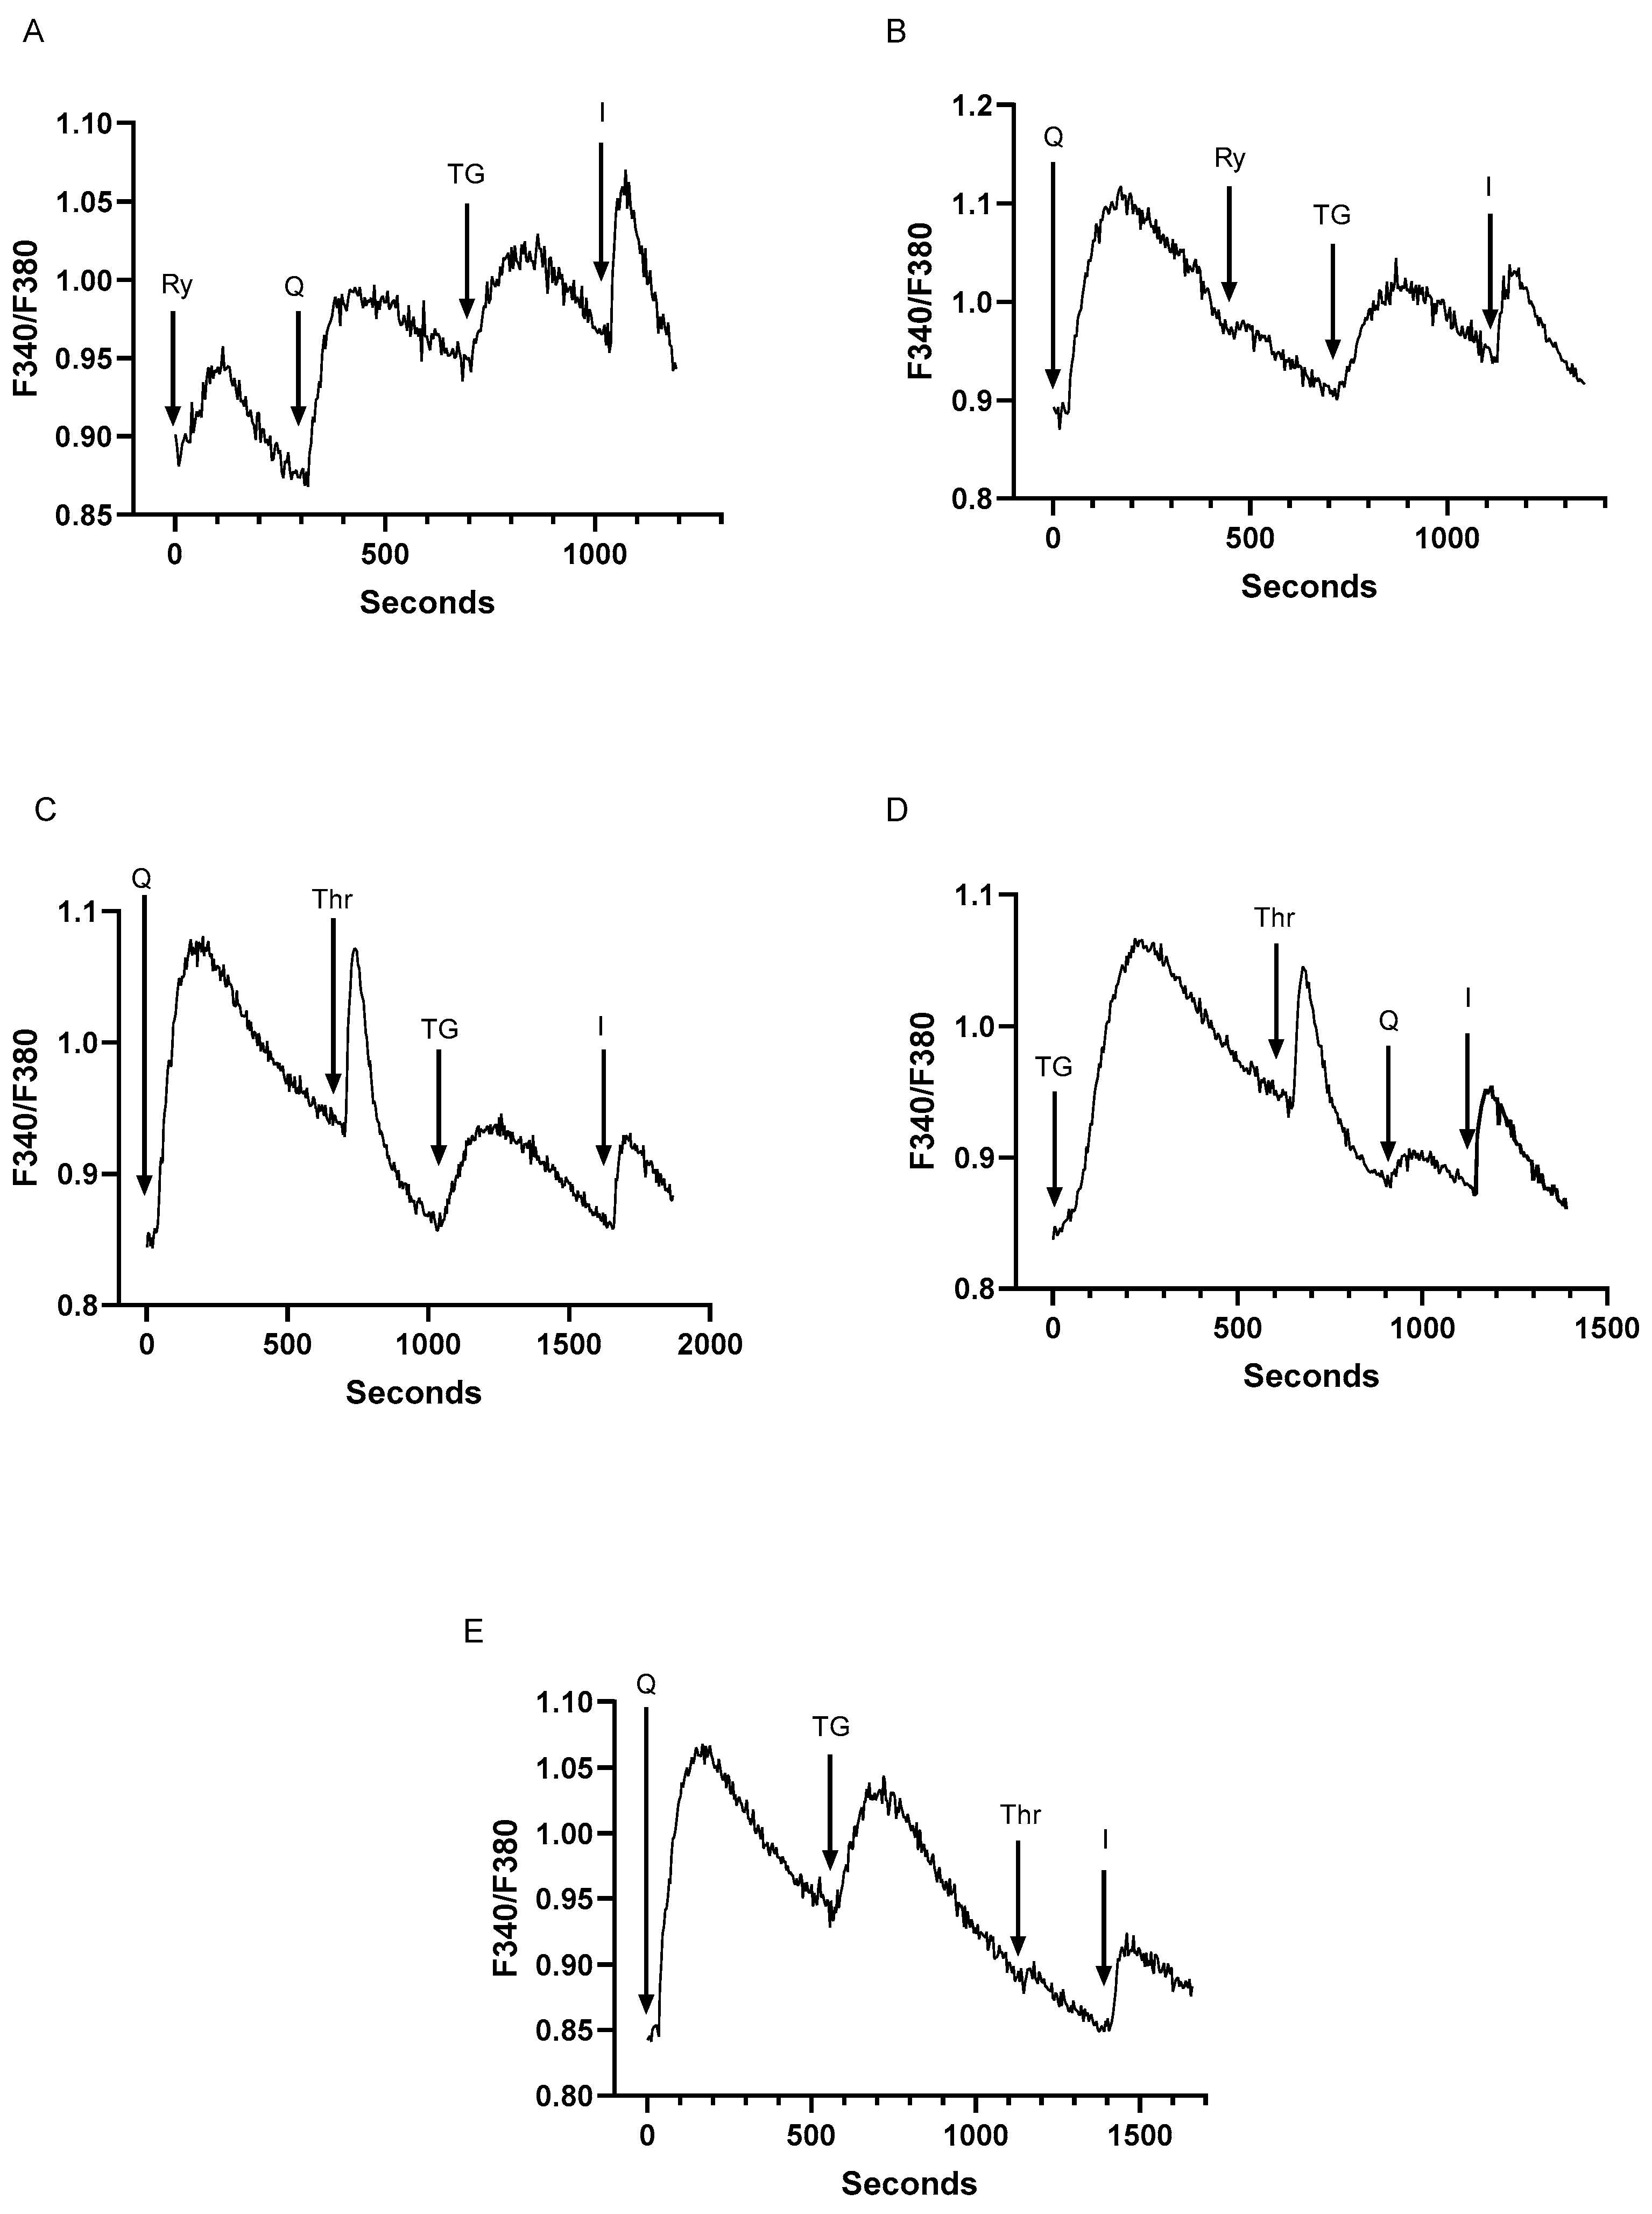
Figure 5.
T lymphocyte SERCA 2b and SERCA 3-regulated Ca2+ stores reveal similar sensitivities to cytoskeletal disruption with enhanced Ca2+ influx responses and reduced Ca2+ release activity. For A-E, Jurkat T lymphocytes were loaded with Fura-2 and suspended in Ca2+-free media (balanced salt solution plus 2 mM EGTA). A, Cells were suspended in Ca2+-free conditions (open bar) and stimulated (arrow) with TG (100 pM) or tBHQ (Q, 1 μM). After approximately 400 seconds of Ca2+ release activity, Ca2+ levels were increased to 2 mM to elicit Ca2+ influx responses (hatched bar). B and C, Ca2+ influx responses were induced as in A (hatched bars) in cell populations pre-incubated for 60 minutes in the presence (solid lines) or absence (dashed lines) of cytochalasin D (10 μM). D and E, Jurkat lymphocytes suspended in Ca2+-free media were stimulated with TG (D, 200 pM) and tBHQ (E, 2 μM) in the presence (CytD) or absence (Con) of cytochalasin D (60 min, 10 μM). Fluorescence traces shown are representative of four to six individual experiments.
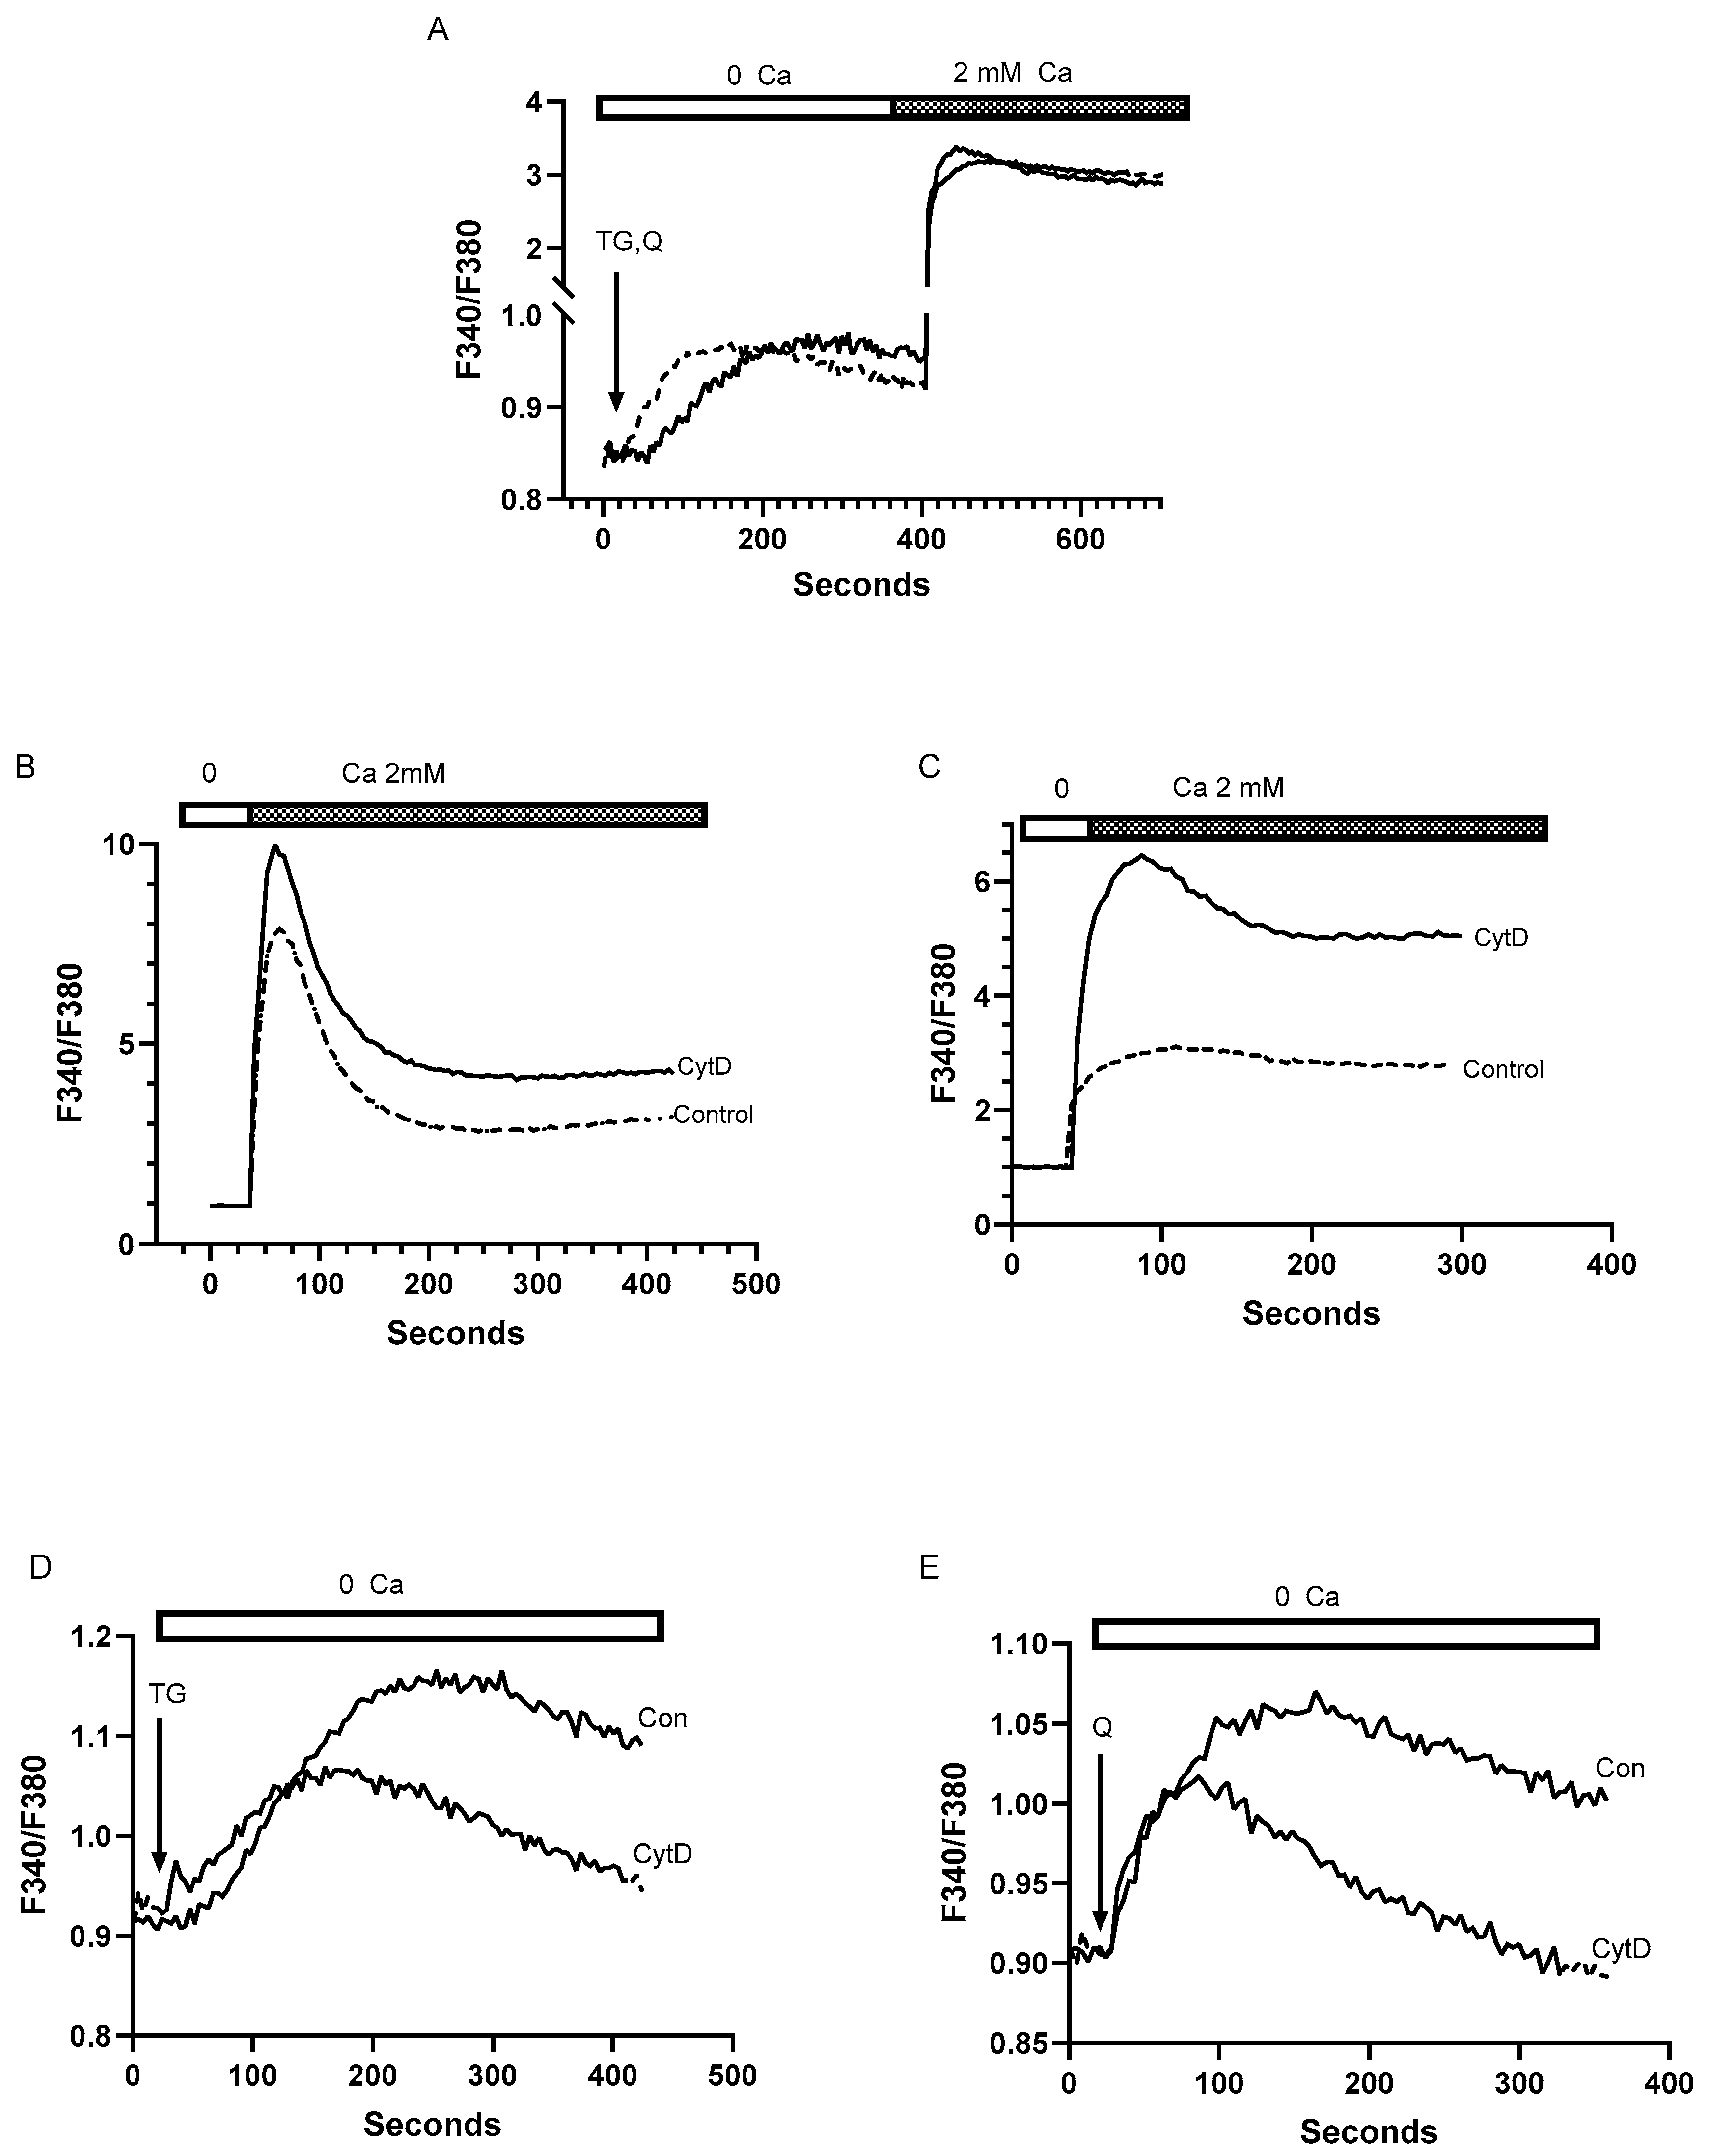
Figure 6.
The SERCA activator CDN1163 exerts differential time-dependent effects on T cell SERCA 2b and SERCA 3 Ca2+ stores. For A-C Jurkat T lymphocytes were loaded with Fura-2 and suspended in Ca2+-free media (balanced salt solution plus 2 mM EGTA). A, Ca2+ release responses induced by treatment with PHA (10 μg/ml) in the presence (dashed trace) or absence (solid trace) of CDN1163 (10 μM, 20 minutes). B, TG (100 pM) induced Ca2+ release in the presence (dashed traces, 0 and 20 min) or absence (solid trace) of CDN1163 (10 μM). C, tBHQ (1 μM) induced Ca2+ release in the presence (dashed trace, 20 min) or absence (solid trace) of CDN1163 (10 μM). D, Fluo-3 fluorescence Ca2+ uptake assay. Ca2+ uptake in ER stores was initiated by the addition of ATP (see Materials & Methods section) in saponin permeabilized Jurkat lymphocytes incubated in the presence (dashed curves, 5 and 30 minutes) or absence (solid curve) of CDN1163 (25 μM). Rate of Ca2+ uptake was estimated based on the linear intial rate of Fluo-3 fluorescene decay. E and F, Ca2+ release responses induced by TG and tBHQ in Jurkat lymphocytes incubated for longer durations with CDN1163. E, Ca2+ release induced by TG (100 pM) in the presence (dashed trace, 72 hours) or absence (solid trace) of CDN1163 (10 μM). F, Ca2+ release induced by tBHQ (1 μM) in the presence (dashed trace, 72 hours) or absence (solid trace) of CDN1163 (10 μM). G and H show experiments using saponin permeabilized Jurkat cells, depicting Ca2+ release responses as detected by Fuo-3 fluorescence changes. G, Ca2+ release induced in permeabilized cells treated with TG (1 nM) in the presence (dashed trace, 72 hours) or absence (solid trace) of CDN1163 (10 μM). H, Ca2+ release induced in permeabilized cells treated with tBHQ (1 μM) in the presence (dashed trace, 72 hours) or absence (solid trace) of CDN1163 (10 μM). I, Ca2+ uptake in ER stores was initiated by the addition of ATP (see Materials & Methods section) in saponin permeabilized Jurkat lymphocytes incubated in the presence (dashed curve, 12 hours) or absence (solid curve) of CDN1163 (25 μM). Rate of Ca2+ uptake was estimated based on the linear intial rate of Fluo-3 fluorescene decay. Fluorescence traces shown are representative of six to eight individual experiments for both permeabilized and intact cell assays.
