
Submitted:
09 February 2024
Posted:
09 February 2024
You are already at the latest version
Abstract
Chronic kidney disease (CKD) affects approximately 12% of the global population posing a significant health threat. Inflammation plays a crucial role in the uremic phenotype of CKD contributing to elevated cardiovascular and overall mortality in affected individuals. This study aimed to explore novel metabolic pathways in non-dialysis dependent stage 5 CKD patients using semitargeted metabolomics. In a prospective observational design involving 50 patients, blood samples collected before the initial hemodialysis session underwent liquid chromatography and high resolution mass spectrometer analysis. Univariate (Mann-Whitney test) and multivariate (logistic regression with LASSO regularization) methods identified metabolomic variables associated with inflammation. Notably, adenosine-5’-phosphosulfate (APS), dimethylglycine, pyruvate, lactate, and 2-ketobutyric acid exhibited significant differences in the presence of inflammation. Cholic acid, homogentisic acid, and 2-phenylpropionic acid displayed opposing patterns. Multivariate analysis indicated increased inflammation risk with certain metabolites (N-Butyrylglycine, dimethylglycine, 2-Oxoisopentanoic acid, and pyruvate), while others (homogentisic acid, 2-Phenylpropionic acid, and 2-Methylglutaric acid) suggested decreased probability. These findings unveil potential inflammation-associated biomarkers related to defective mitochondrial fatty acid beta oxidation and branched-chain amino acid breakdown in CKD, shedding light on cellular energy production and offering insights for further clinical validation.
Keywords:
inflammation
; ackd
; metabolomics
; energy metabolism
; uremic toxins
1. Introduction
Chronic kidney disease (CKD) represents a significant public health issue due to its substantial economic impact and its role as an independent risk factor for cardiovascular diseases. It is estimated to affect 12% of the global population with a proportion of 0,1% being in stage 5 (estimated glomerular filtration rate < 15%) [1].
However, even though therapy for anaemia, mineral and bone disorder (MBD) and other associated cardiovascular risks has significantly advanced in recent years (erythropoiesis-stimulating agents, calcimimetics etc.) [2,3,4], mortality remains notably elevated in individuals with stage 5 kidney disease.
The uremic phenotype results from the accumulation of metabolic waste, like urea, due to declining kidney function. This leads to a clinical presentation composed of symptoms such as nausea, vomiting, fatigue, anorexia, mental status changes and others, resulting in in a reduced quality of life and increased morbidity and mortality [5]. Concerning this matter, inflammation is one of the most significant contributing factors to the uremic phenotype and also plays a role in the increased cardiovascular and overall mortality [6].
CKD acts as mild but chronic and persistent inflammatory process akin to ‘inflammaging’ in which the tissues exhibit a low-grade, chronic, systemic inflammation, in the absence of a clear origin [7]. Inflammation has a multifactorial aetiology in CKD including exogenous factors (like the use of a central venous catheter, intestinal dysbiosis), tissue factors (like hypoxia, fluid and sodium overload), comorbidities (like congestive heart failure, diabetes and malnutrition) and uremic toxins. However, although several medium-sized molecules toxins have been recognized as key players in this pathology there are plenty of metabolic pathways that have not been well explored [6].
To discover new unexplored pathways, metabolomics may be the best suited method. Metabolomics, as a discipline within the ‘omics’ sciences, employs various analytical methods to detect small molecules (metabolites) in a given sample. Its primary objective is to evaluate these substances both quantitively and qualitatively to explore their potential applications in diagnosis, treatment, and prognosis [8]. These compounds, collectively referred to as the metabolome, are shaped by both internal factors, such as interactions between the proteome and the genome, and external influences like lifestyle, medications and underlying diseases. The metabolome is considered the most accurate representation of an individual’s phenotype and therefore well suited to evaluate the array of uremics toxins in the human body [9].
Targeted metabolomics has been used to assess changes in endocannabinoid and oxylipin levels in haemodialysis patients [10], relating them to their inflammatory process and untargeted metabolomics has been used to study the changes they undergo when suffering from critical conditions [11].
However, we believe that our approach to evaluate potential biological signature for inflammation in stage 5 patients through semi-targeted metabolomics is not described in the literature. Our goal is to describe the metabolic profile observed in non-dialysis dependant stage 5 patients, focusing on the metabolites associated with inflammation as they may be potential therapeutics goals beneficial in preventing cardiovascular complications and improving the survival of these group of patients [12].
2. Materials and Methods
Study design and participants
We aimed to examine the impact of various metabolites on the inflammation grade in patients with CKD stage 5. We established an observational, prospective, longitudinal unicentric study. While the study collected data before the first dialysis session.
First, a descriptive analysis of the population was conducted to identify its characteristics. The study cohort, with a mean age of 69,46 years (SD ±13,28), included 38% females, and exhibited an average height of 165,18 cm (SD ±8,83) and a mean weight of 75,51 kg (SD ±15,76), resulting in an average BMI of 27,61 (SD=4,71). Half of the subjects were smokers, and an equal percentage had type 2 diabetes. Hypertension was prevalent in 94% of the population, while 76% exhibited dyslipidaemia.
The summary of the demographic and clinical characteristics of the sample (n=50) can be found in Table 1.
Next, we explored the metabolomic profile of the patients before their first haemodialysis session.
All patients with stage 5 renal insufficiency who were to require renal replacement therapy in the near future and, in a voluntary and consensual manner with the healthcare team (physician and nurse) of the Advanced Chronic Kidney Disease Unit at Hospital La Fe (Valencia), opted for haemodialysis were evaluated. Inclusion criteria included being over 18 years of age and having scheduled initiation of the hemodiafiltration technique, while exclusion criteria involved suboptimal initiation of the technique due to clinical destabilization or life expectancy of less than one year.
Additionally, we collected information on inflammation in patients based on their blood analysis C-reactive protein values (CRP). Patients with CRP values ≤ 2 mg/dl were considered non-inflamed, while those with CRP> 2 mg/dl were considered inflamed. Only 30% were considered non inflamed (PCR<2 mg/dl).
Blood samples collection and preparation.
Blood samples were collected and stored for analysis. These samples were processed by centrifugation, with the resulting serum stored at -80ºC until study completion. Multiple biochemical parameters were assessed including CRP.
Afterwards, 180 µL of cold methanol (MeOH) was added to 20 µL of serum for protein precipitation and extraction of polar compounds.
After a double centrifugation at 13000 g (10 min, 4ºC), 20 µL of the supernatant were transferred to a 96-wells plate for liquid chromatography coupled to mass spectrometry (LC-MS) analysis. Then, 70 µL of H2O and 10 µL of internal standard mix solution (reserpine, leucine, enkephalin, phenylalanine-d5, 20 µM) were added to each sample. Quality control (QC) was prepared by mixing 10 µL from each serum sample. Blank was prepared replacing serum with ultrapure water in order to identify potential artefacts from the tube, reagents and other materials. Finally, plasma samples, QCs and blanks were injected in the chromatographic system. In order to avoid intrabatch variability, as well as to enhance quality and reproducibility, the scheme analysis consisted of random injection order and analysis of QC every 6 plasma samples. Blank analysis was performed at the end of the sequence.
UPLC-HRMS analysis
Samples were analysed on an Ultra-Performance Liquid Chromatography (UPLC) system coupled to an Orbitrap QExactive spectrometer (Thermofisher). The chromatographic separation was performed using a Xbridge BEH Amide column (150x2mm, 2.5 µm particle size; Waters) with a 25-minutes runtime, an injection volume of 5 µL, and a column temperature of 25ºC. The autosampler was set 4ºC, and a flow rate of 105 µL/min was used with water and 10 mM ammonium acetate as Mobile Phase A, and acetonitrile (ACN) as Mobile Phase B. The gradient was as follows: 0 min, 90% B, 2 min, 90% B; 3 min, 75%; 7 min, 75% B; 8 min, 70%, 9 min, 70% B; 10 min, 50%B; 12 min, 50%B; 13 min, 25% B;14 min, 25%B; 16 min, 0%B, 20.5 min, 0% B; 21 min, 90% B; 25 min, 90%B.
The electrospray ionization was employed in both positive and negative modes (ESI +/-), in full mass acquisition, with a resolving power of 140.000 and two events: mass ranges from 70-700; mass ranges from 700-1700 Da. Data were acquired in the centroid mode.
Data preprocessing
Raw data was converted to mzXML format using Mass Converter and then processed in EI-MAVEN software to generate a peak table containing m/z retention times and intensity of polar compounds. Peak areas were extracted and annotated using an in-house polar compound library. Data from positive and negative modes were merged for statistical analysis.
Before the statistical analysis, data quality (reproducibility, stability) was evaluated by means of internal standards stability and QC’s coefficients of variation (CV). Those molecular features with CV >30% were removed from the data matrix, and a normalization method (LOESS) was also used to eliminate intra-batch variability due to technical differences. Finally, the filtered peak table was used for statistical analysis.
Statistical analysis
First, we conducted a univariate analysis consisting in exploring which metabolomic variables were associated with the presence of an inflammatory process. To do this, we identified which metabolites were significantly upregulated with a fold change of 1,5 in the inflammatory group compared with the non-inflammatory group using a non-parametric Mann Whitney test (log2(fold change)=log2(MInflammation=1/MInflammation=0).)
In regard to the multivariable analysis, a logistic regression model, suitable for binary response variables, with the application of LASSO regularization was used. LASSO (least absolute shrinkage and selection operator) is a regularization technique that helps in both variable selection and regularization by shrinking some regression coefficients toward zero, contributing to a more interpretable model. This algorithm optimized for the coefficients of the logistic regression for each variable (metabolite) to improve performance, specifically reducing classification errors. It achieved this by progressively decreasing coefficients using a multiplier parameter in the algorithms cost function until they equalled zero, effectively eliminating the corresponding variable. The extent of coefficient minimization and elimination was determined by an additional parameter called lambda. A higher lambda value resulted in greater coefficient penalization, reducing their values to zero and, consequently, reducing the number of variables included in the model. The optimal lambda value was determined using Cross-Validation. Different models were fitted, with one group of subjects excluded in each iteration for estimating their classification into the ‘inflamed=no’ or ‘inflamed=yes’ group. The error for each case was calculated, and the lambda value minimizing this error was considered the optimal choice. In this model, k was set to 50, meaning one patient was excluded for estimation in each iteration, with a focus on minimizing classification errors. Standard coefficients (SC) and Odds Ratio (OR) were calculated for each variable.
The sign of the coefficients indicates how changes in variables affect the probability of being inflamed or not. Positive coefficients imply a higher probability of inflammation, while negative coefficients reduce the probability. Variables with larger absolute standardized coefficients are more important in the model, reflected in their odds ratios (OR=e^coefficient). ORs represent the multiplier for the probability of belonging to the ‘inflammation=yes’ group compared to ‘inflammation=no’ assuming a one standard deviation increase in the variable, as we use standardized coefficients.
3. Results
The study employed an observational prospective design to investigate metabolite impact on inflammation in 50 non-dialysis-dependent stage 5 CKD patients. Blood samples were collected before the start of the first haemodialysis session. A semitargeted metabolomic approach was followed, utilising liquid chromatography and high-resolution mass spectrometry with an in-house library of polar compounds. The results can be found in supplementary material. Univariate (Mann-Whitney test) and multivariate (logistic regression with LASSO regularization) analyses identified metabolomic variables associated with inflammation.
3.1. Univariate Analysis
The median concentration of homogentisic acid (p-value=0,0007), 3-indoxyl-sulfate (p-value=0,0087), 2-phenylpropionic acid (p-value=0,0351) and cholic acid (p-value=0,0165) significantly decreased in the presence of inflammation, as indicated by a statistically significant Mann-Whitney test. The magnitude of change was greater in cholic acid in which the median decreased by a factor of 2,79 in inflamed patients and lowest in homogentisic acid in which it was decreased by only a 1,60-factor.
On the other hand, the median concentration of dimethylgycine (p-value=0,0015), pyruvate (p-value=0,0066), lactate (p-value=0,0156), ketobutyric acid (p-value=0,0458), and adenosine 5-phosphosulfate (p-value=0,0211) significantly increased in the presence of inflammation. The magnitude of change was greater in adenosine 5-phosphosulfate, which was 0 in non-inflamed patients and almost negligible in lactate, where the median increased by a factor of 1,52 in inflamed patients.
3.2. Multivariate Analysis
N-Butyrylglycine (SC=0,63, OR 1,87), dimethylglycine (SC=0,60, OR 1,81), 2-oxoisopentanoic acid (SC=0,56, OR 1,76), pyruvate (SC=0,56, OR 1,76), and L-fucose (SC=0,2 OR 1,22) show positive standard coefficients and greater than 1 odds ratio, indicating a positive association with the outcome (inflammation=yes).
Meanwhile, homogentisic acid (SC=-0,33, OR 0,72), 2-phenylpropionic acid (SC=-0,26, OR 0,77), and 2-methylglutaric acid (SC=-0,26, OR 0,78) show negative standard coefficients and lower than 1 odds ratio, indicating a negative association with the outcome (inflammation=yes).
Notably, uric acid (SC=0,13, OR 1,14), adenosine 5’-phosphosulfate (SC=0,09, OR 1,09), nicotinuric acid (SC=0,08, OR 1,09), L-hydroxyproline (SC=0,03, OR 1,03) and lactate (SC=0,01, OR 1,01) have a small positive coefficient and odds ratio close to 1, indicating a minor positive influence on the outcome, whereas 3-indoxyl sulfate (SC=-0,08, OR 0,92), proline (SC=-0,07, OR 0,94), and nicotinamide (SC=-0,03, OR 0,97), have a small negative coefficient and odds ratio close to 1, in this case, indicating a minor negative influence on the outcome.
4. Discussion
Our goal was to describe the metabolic profile observed in non-dialysis dependant stage 5 patients, focusing on the metabolites associated with inflammation. Univariate and multivariate analyses identified significant associations. Adenosine-5’-phosphosulfate, dimethylglycine, and pyruvate showed increased probability of inflammation. Conversely, cholic acid, homogentisic acid and 2-phenylpropionic acid exhibited opposite patterns. The multivariate analysis indicated increased inflammation risk with N-butyrylglycine, dimethylglycine, 2-oxoisopentanoic acid and pyruvate, while homogentisic acid, 2-phenylpropionic acid and 2-methylglutaric acid suggested decreased probability.
If we focus on those that were associated with inflammation in both univariate and multivariate analyses, we find dimethyglycine and pyruvate.
Despite its prevalent promotion as a nutritional supplement, because of its fundamental functions in the biosynthesis of methionine and folic acid [13], dimethylgycine (DMG) is a known uremic toxin. It linked to homocysteine metabolism through the enzyme betaine-homocysteine methyl transfuse (BHMT) that converts glycine betaine to N,N, dimethylglycine. Accumulation of DMG in CKD can lead to hyperhomocystinemia by inhibiting BHMT activity. Homocysteine, a byproduct of methionine metabolism, oxidizes in plasma, generating free radicals that harm endothelial cells and promote LDL oxidation. It also elevates platelet aggregation, blood coagulation, and vascular smooth muscle growth in vitro [14]. Furthermore, dimethylglycine can induce reactive oxygen species (ROS) production in liver mitochondria through reverse electron transfer to complex I [15]. In a rat study inducing chronic inflammation through lipopolysaccharide administration, metabolic analysis revealed the dimethylglycine, among others was related to mitochondrial dysfunction and on carbon metabolism [16]. Another study investigated the association between the metabolic profile and inflammatory cytokines in new onset psoriasis, showing significant increases in DMG [17].
Pyruvate, on the other hand, is an alpha ketoacid that is key to the cellular metabolism, acting as a link between glycolysis and the tricarboxylic acid cycle (TCA) to provide energy. Once inside the mitochondria the majority of pyruvate undergoes oxidative phosphorylation to produce ATP, but firstly it is converted to acetyl-CoA through the pyruvate dehydrogenase complex [18]. Aberrant pyruvate metabolism plays an especially prominent role in cancer, neurodegeneration, heart failure and other conditions. For example, patients with heart failure have decreased levels of ATP and phosphocreatine levels, because the phosphorylation of pyruvate is decreased and this pattern is also observed in chronic progressive diseases such as chronic pulmonary disease (COPD), obesity, diabetes, and aging. It could be hypothesized that chronic kidney disease which has many metabolic similarities to the aforementioned situations could also present with aberrant pyruvate metabolism [19]. Indeed, a study performed with mice with a subtotal nephrectomy showed significant suppression of pyruvate dehydrogenase and suppression of proximal tubular mitochondrial respiration and ATP synthesis [20]. Another study performed in stage 4-5 CKD patients concluded that CKD patients had lower levels of pyruvate dehydrogenase and this correlated with muscle dysfunction measured by handgrip strength [21].
Also strongly correlated with inflammation in the multivariate analysis we found N-butyrilglycine, 2 -oxoisopentanoic acid and L-fucose.
N-Butyrylgycine belongs to the class of compounds known as acylglycines. Acyglycines are typically found in low concentrations as byproducts of fatty acid metabolism. However, individuals with certain inborn errors of metabolism, such as ethylmalonic encephalopathy, exhibit increased excretion of these compounds and the analysis of these metabolites in bodily fluids can be utilized for diagnosing disorders linked to mitochondrial fatty acid beta oxidation [22].
Acyglycines are created by the process of transesterification, where an acylcoA ester combines with glycine, and this reaction is facilitated by the enzyme acyl-COA-glycine-N-acyl-transferase, also known as glycine N-acylase. They have also been described to raise in congenital fatty oxidation diseases like SCAD (short-chain Acyl-CoA Dehydrogenase deficiency), in which there is an elevated presence of butyrilglycine in urinary excretion [23]. Another fatty acid oxidation disease (FAOD), multiple acyl-coA dehydrogenase deficiency hinders the beta oxidation of fatty acids as well as the breakdown of branched amino acids and has shown elevated plasma levels of acylglycines
These metabolic alterations cand lead to impaired gluconeogenesis, ureagenesis, and ketogenesis, resulting in hypoglycemia, lactic acidemia and hyperammonemia, which can be accompanied by hepatomegaly, steatosis and reduced ketone production. Muscle and cardiac tissues are notably affected due to their high energy demand from fatty acid oxidation [23].
Therefore, although the association of this metabolite with inflammation was not previously described in either the general population or CKD, it would make sense for it to be related to inflammation in CKD patients, through the affected organs and pathways.
It is interesting to highlight the relationship between metabolites butyrylglycine, dimethylglycine, and pyruvate (Figure 3). Butyrylglycine, an acylglycine, is considered a byproduct of faulty fatty acid beta-oxidation in which, due to a defect, acetyl-coA is not correctly produced for entry into the Krebs cycle and energy production. On the other hand, the increased levels of pyruvate and its connection with inflammation also may indicate and inability to produce acetyl-CoA and consequently, energy. Finally, dimethylglycine is linked to butyrylglycine due to its association with glycine, although its link to inflammation is attributed to its relationship with homocysteine.
2-oxoisopentanoic acid also known as alpha-ketoisovaleric acid is an abnormal metabolite (a branched chain ketoacid) resulting from the incomplete breakdown of branched chained amino acids, specifically valine (as shown in Figure 4). It acts as a neurotoxin and an acidogen. It is classified as metabotoxin and its elevated levels can lead to chronic health issues. This is what happens in maple syrup urine disease [22]. BCKAs disrupt brain energy metabolism by inhibiting crucial enzymes such as pyruvate dehydrogenase, alpha-ketoglutarate dehydrogenase, and mitochondrial respiration in rat models [24]. Furthermore, it has been observed that BCKA excess may induce mitochondrial oxidative stress, redox imbalance and cytokine release in macrophages of type 2 diabetes patients [25]. Once more, the study’s findings reveal a compromised energy metabolism.
L-fucose is a hexose deoxy sugar and is a common component of many glycans and glycolipids produced by mammalian cells [22]. As a free sugar is usually present at very low concentrations in humans, but elevated levels have been reported in the past in breast cancer, ovarian cancer, lung cancer and liver cancer [26,27,28].
However, at present time, its exogenous administration was also identified via neural network model using the Drug Signatures Database as a candidate for treating severe inflammation in IgAN by reducing the deposition of complement C3 [29] and its administration was also found to alleviate intestinal epithelial damage via upregulating FUT2 impending oxidative stress, mitochondrial dysfunction and cell apoptosis [30]. In kidney transplant it has been studied as a decoy molecule, significantly reducing ischemia reperfusion injury [31]. This phenomenon could be explained by considering the substance as one that naturally elevates in the context of inflammation, but whose exogenous administration has anti-inflammatory properties.
Finally, adenosine 5’-phosphosulfate (APS) was strongly correlated with inflammation in the univariate analysis. It is a type of purine ribonucleoside monophosphate, which is a nucleotide containing a purine base attached to a ribose with one monophosphate group [22]. It is a precursor in the biosynthesis of 3’-phosphoadenosine-5’-phosphosulfate (PAPS) which, in turn, is a universal sulfuryl donor in various biochemical pathways. This reaction is catalyzed by the enzyme 3’-phosphoadenosine-5’-phosphosulfate synthase (PAPSS), which has two human isoforms in humans, PAPSS 1 and PAPPS2, the latter of which is expressed predominantly in the liver, cartilage and adrenal glands [32].
When PAPSS2 is deficient, the conversion of APS to PAPS is impaired, leading to an accumulation of APS which can disrupt the normal sulfation processes in cells. It has been described that this deficiency can lead to osteochondrodysplasias [33].
Most recently, it has been described that PAPSS2 is decreased in colon cancers of mice and humans, correlating with a worse survival due to an increased intestinal permeability and bacteria infiltration [34].
Therefore, we may hypothesize increase in APS may be related to a decrease in PAPSS2, with the elevated inflammation observed being associated with increased intestinal permeability and bacterial infiltration.
However, several influential variables explaining the lack of inflammation were also detected. In the case of homogentisic acid (OR 0,71) and phenylpropionic acid (OR 0,77), the changes were significant in quantity and statistically significant in both univariate and multivariate analyses. Nevertheless, not all of them made sense at a pathophysiological level.
Homogentisic acid, an intermediate product of the tyrosine and phenylalanine metabolism, can act as and osteotoxin and a renal toxin when present at high levels. Elevated levels are linked to alkaptonuria, a rare genetic disorder. Mutations in homogentisate 1,2-dioxygenase can cause its accumulation, resulting in dark urine, cartilage damage, kidney stones and heart valve issues [35]. There is no existing literature that describes it as protective against inflammation, kidney disease, or cardiovascular disease. We conducted a thoroughly verification of the correct metabolite annotation and it seems the most likely candidate in terms of formula and retention time. Considering the hypothesis-generating nature of untargeted metabolomics, the actual relationship of this metabolite with inflammation should be tested.
2-Phenylpropionic acid, on the other hand, has been found to be produced by various kind of bacteria such as Acinetobacter, Bacteroides, Bifidobacterium, Clostridium, Enterococcus, Escherichia, Eubacterium, Klebsiella, Lactobacillus, Pseudomonas and Staphylococcus [22]. In a recent study conducted by Cho et al. in mice, it was discovered that mice exhibiting higher levels of phenylpropionic acids had a decreased susceptibility to acetaminophen induced hepatotoxicity and CYP2E1 mediated hepatotoxicity by carbon tetrachloride [36]. This kind of hepatotoxicity appears when acetaminophen, carbon tetrachloride and other compounds are converted to reactive metabolites, which can directly react with proteins introducing alterations in protein structure or folding. Subsequently, these proteins are processed by antigen presenting cells appearing ‘foreign’ to the immune system leading to an immune response [37]. Therefore, it would make sense that high levels of 2- phenylpropionic acid are associated with a decrease in the risk of presenting an inflammatory profile in our patients.
Also correlated with the lack of inflammation in the multivariate analysis we found 2-Methylglutaric acid.
2-Methylglutaric acid belongs to the class of organic compounds known as methylbranched fatty acids. These are fatty acids with an acyl chain that has a methyl branch. They are mainly produced by bacteria in the gut of ruminant animals and ingested by humans through dairy products [38]. Other methybranched fatty acids, such as phytanic acid, have been shown to have favorable effects on glucose metabolism, energy expenditure and immune functions when present in naturally occurring amounts. However, they could be toxic when found in excess (e.g., Refsum disease) [39].
And, finally, in the univariate analysis, cholic acid (p-value 0,02) was correlated with lack of inflammation.
Along with chenodeoxycholic acid, it constitutes one of the two major bile acids produced by the liver, derived from cholesterol. This compound is able to activate the farnesoid X receptor (FXR), which has a regulatory effect on bile acid production by repressing the novo bile acid synthesis. However, FXR has also role in the regulation of lipids and glucose metabolism. It is able to activate reverse cholesterol transportation, preventing the development of atherosclerosis and participates in fatty acids (FA) oxidation, preventing FA-induced lipotoxicity [40]. TGR5, another important bile acid receptor, promotes mitochondrial fission and induces thermogenic activity in adipocytes, thus preventing obesity and insulin resistance in mice. Although chenodeoxycholic acid and deoxycholic acid showed a higher potency in activating FXR and TGR5, they were regrettably not measured in our library.([30], p. 2)]
This study has several limitations. Firstly, our data only reveals trends or changes in response intensities, not exact concentrations. Secondly, we decided on the use of an inhouse library of polar compounds in order to limit non relevant results and simplify interpretation but this may have avoided the finding of several metabolites. Lastly, our sample size is limited due to time and economical constraints.
5. Conclusions
To conclude, the study aimed to identify potential biomarkers and metabolic pathways associated with inflammations in patients with stage 5 kidney disease. Dymethylglycine and pyruvate were identified as metabolites strongly correlated with inflammation. Dimethylglycine, a uremic toxin, may contribute to vascular damage, while pyruvate’s aberrant metabolism in heart failure and chronic kidney disease suggests an involvement in inflammation. N-butyrilglycine and 2-oxoisopentanoic acid were also linked to inflammation with specific associations. Adenosine 5-phosphosulfate correlated with inflammation and impacts in bone development and intestinal permeability.
Contrarywise, homogentisic acid and phenylpropionic acid were negatively correlated with inflammation. Although, at the pathophysiological level, the association of homogentisic acid with anti-inflammatory protection does not seem apparent, phenylpropionic acid does exhibit protective effects against hepatotoxicity by decreasing the immune response associated to it. 2-methylglutaric acid and cholic acid also showed negative correlations, suggesting potential roles in fatty acid metabolism and bile acid regulation.
Through semi-targeted metabolomics, we have identified multiple metabolites associated with inflammation, potentially indicating issues with mitochondrial fatty acid beta oxidation and incomplete breakdown of branched chain amino acids, which affect cellular energy production.
Supplementary Materials
The following supporting information can be downloaded at: www.mdpi.com/xxx/s1, Table S1: Polar metabolites.
Author Contributions
Conceptualization, M.P-F, M.R-M and J.H-J; methodology, M.P-F M.R-M, J.A-R and A.B-T.;.; software, M.R-M, J.A-R and A.B-T..; formal analysis, M.R-M, J.A-R and A.B-T.; investigation, M.P-F; writing—original draft preparation, M.P-F.; writing—review and editing, M.P-F, M.R-M, J.A-R, I.V-B and A.B-T.; visualization, M.P-F, M.R-M, J.A-R, I.V-B, A.B-T, J.H-J, R.D-S, A. S-O and P.S-P; supervision, J.H-J..; funding acquisition, M.P-F. All authors have read and agreed to the published version of the manuscript.
Funding
Part of the study has been funded by the Valencian Society of Nephrology through the María Isabel Burches Nephrology Research Scholarship.
Institutional Review Board Statement
The study was conducted in accordance with the Declaration of Helsinki, and approved by the Ethics Committee of Hospital Universitario y Politécnico la Fe (protocol code 2019-232-1 and date of approval 29th January 2020).
Informed Consent Statement
Informed consent was obtained from all subjects involved in the study.
Data Availability Statement
We encourage all authors of articles published in MDPI journals to share their research data. In this section, please provide details regarding where data supporting reported results can be found, including links to publicly archived datasets analyzed or generated during the study. Where no new data were created, or where data is unavailable due to privacy or ethical restrictions, a statement is still required. Suggested Data Availability Statements are available in section “MDPI Research Data Policies” at https://www.mdpi.com/ethics.
Acknowledgments
We want to express our gratitude to the patients who participated and the dedicated nursing staff of the Dialysis units and centres within the Department of Nephrology at Hospital Universitari I Politècnic la Fe for their generous and wholehearted support throughout the study.
Conflicts of Interest
The authors declare no conflicts of interest.
References
- Hill, N. R., Fatoba, S. T., Oke, J. L., Hirst, J. A., O’Callaghan, C. A., Lasserson, D. S., & Hobbs, F. D. R. Global Prevalence of Chronic Kidney Disease – A Systematic Review and Meta-Analysis. PLOS ONE 2016, 11, e0158765. [CrossRef]
- Kidanewold, A., Woldu, B., & Enawgaw, B. Role of Erythropoiesis Stimulating Agents in the Treatment of Anemia: A Literature Review. Clinical Laboratory 2021, 67. [CrossRef]
- Hou, Y.-C., Zheng, C.-M., Chiu, H.-W., Liu, W.-C., Lu, K.-C., & Lu, C.-L. Role of Calcimimetics in Treating Bone and Mineral Disorders Related to Chronic Kidney Disease. Pharmaceuticals 2022, 15, 952. [CrossRef]
- Skrabic, R., Kumric, M., Vrdoljak, J., Rusic, D., Skrabic, I., Vilovic, M., Martinovic, D., Duplancic, V., Ticinovic Kurir, T., & Bozic, J. SGLT2 Inhibitors in Chronic Kidney Disease: From Mechanisms to Clinical Practice. Biomedicines 2022, 10, 2458. [CrossRef]
- Rosner, M. H., Reis, T., Husain-Syed, F., Vanholder, R., Hutchison, C., Stenvinkel, P., Blankestijn, P. J., Cozzolino, M., Juillard, L., Kashani, K., Kaushik, M., Kawanishi, H., Massy, Z., Sirich, T. L., Zuo, L., & Ronco, C. Classification of Uremic Toxins and Their Role in Kidney Failure. Clinical Journal of the American Society of Nephrology 2021, 16, 1918. [CrossRef]
- Cobo, G., Lindholm, B., & Stenvinkel, P. Chronic inflammation in end-stage renal disease and dialysis. Nephrology Dialysis Transplantation 2018, 33 (Suppl 3), iii35–iii40. [CrossRef]
- Franceschi, C., & Campisi, J. Chronic inflammation (inflammaging) and its potential contribution to age-associated diseases. The Journals of Gerontology. Series A, Biological Sciences and Medical Sciences 2014, 69 (Suppl 1), S4-9. [CrossRef]
- Aderemi, A. V., Ayeleso, A. O., Oyedapo, O. O., & Mukwevho, E. Metabolomics: A Scoping Review of Its Role as a Tool for Disease Biomarker Discovery in Selected Non-Communicable Diseases. Metabolites 2021, 11, 418. [CrossRef]
- Guijas, C., Montenegro-Burke, J. R., Warth, B., Spilker, M. E., & Siuzdak, G. Metabolomics activity screening for identifying metabolites that modulate phenotype. Nature Biotechnology 2018, 36, 316–320. [CrossRef]
- Watkins, B. A., Friedman, A. N., Kim, J., Borkowski, K., Kaiser, S., Fiehn, O., & Newman, J. W. Blood Levels of Endocannabinoids, Oxylipins, and Metabolites Are Altered in Hemodialysis Patients. International Journal of Molecular Sciences 2022, 23, 9781. [CrossRef]
- Tsalik, E. L., Willig, L. K., Rice, B. J., van Velkinburgh, J. C., Mohney, R. P., McDunn, J. E., Dinwiddie, D. L., Miller, N. A., Mayer, E. S., Glickman, S. W., Jaehne, A. K., Glew, R. H., Sopori, M. L., Otero, R. M., Harrod, K. S., Cairns, C. B., Fowler, V. G., Rivers, E. P., Woods, C. W., … Langley, R. J. Renal systems biology of patients with systemic inflammatory response syndrome. Kidney International 2015, 88, 804–814. [CrossRef]
- Russa, D. L., Pellegrino, D., Montesanto, A., Gigliotti, P., Perri, A., Russa, A. L., & Bonofiglio, R. Oxidative Balance and Inflammation in Hemodialysis Patients: Biomarkers of Cardiovascular Risk? Oxidative Medicine and Cellular Longevity 2019, 2019, 8567275. [CrossRef]
- Wang, Z., Shao, D., Wu, S., Song, Z., & Shi, S. Heat stress-induced intestinal barrier damage and dimethylglycine alleviates via improving the metabolism function of microbiota gut brain axis. Ecotoxicology and Environmental Safety 2022, 244, 114053. [CrossRef]
- McGregor, D. O., Dellow, W. J., Lever, M., George, P. M., Robson, R. A., & Chambers, S. T. Dimethylglycine accumulates in uremia and predicts elevated plasma homocysteine concentrations. Kidney International 2001, 59, 2267–2272. [CrossRef]
- Mailloux, R. J., Young, A., Chalker, J., Gardiner, D., O’Brien, M., Slade, L., & Brosnan, J. T. Choline and dimethylglycine produce superoxide/hydrogen peroxide from the electron transport chain in liver mitochondria. FEBS Letters 2016, 590, 4318–4328. [CrossRef]
- Hernandez-Baixauli, J., Abasolo, N., Palacios-Jordan, H., Foguet-Romero, E., Suñol, D., Galofré, M., Caimari, A., Baselga-Escudero, L., Del Bas, J. M., & Mulero, M. Imbalances in TCA, Short Fatty Acids and One-Carbon Metabolisms as Important Features of Homeostatic Disruption Evidenced by a Multi-Omics Integrative Approach of LPS-Induced Chronic Inflammation in Male Wistar Rats. International Journal of Molecular Sciences 2022, 23, 2563. [CrossRef]
- Tarentini, E., Odorici, G., Righi, V., Paganelli, A., Giacomelli, L., Mirisola, V., Mucci, A., Benassi, L., D’Aversa, E., Lasagni, C., Kaleci, S., Reali, E., & Magnoni, C. Integrated metabolomic analysis and cytokine profiling define clusters of immuno-metabolic correlation in new-onset psoriasis. Scientific Reports 2021, 11, 10472. [CrossRef]
- Stacpoole, P. W., & McCall, C. E. The pyruvate dehydrogenase complex: Life’s essential, vulnerable and druggable energy homeostat. Mitochondrion 2023, 70, 59–102. [CrossRef]
- Gray, L. R., Tompkins, S. C., & Taylor, E. B. Regulation of pyruvate metabolism and human disease. Cellular and Molecular Life Sciences 2014, 71, 2577–2604. [CrossRef]
- Li, Y., Gu, W., Hepokoski, M., Pham, H., Tham, R., Kim, Y. C., Simonson, T. S., & Singh, P. Energy Metabolism Dysregulation in Chronic Kidney Disease. Kidney360 2023, 4, 1080–1094. [CrossRef]
- Xu, C., Kasimumali, A., Guo, X., Lu, R., Xie, K., Zhu, M., Qian, Y., Chen, X., Pang, H., Wang, Q., Fan, Z., Dai, H., Mou, S., Ni, Z., & Gu, L. Reduction of mitochondria and up regulation of pyruvate dehydrogenase kinase 4 of skeletal muscle in patients with chronic kidney disease. Nephrology (Carlton, Vic.) 2020, 25, 230–238. [CrossRef]
- Wishart, D. S., Guo, A., Oler, E., Wang, F., Anjum, A., Peters, H., Dizon, R., Sayeeda, Z., Tian, S., Lee, B. L., Berjanskii, M., Mah, R., Yamamoto, M., Jovel, J., Torres-Calzada, C., Hiebert-Giesbrecht, M., Lui, V. W., Varshavi, D., Varshavi, D., … Gautam, V. HMDB 5.0: The Human Metabolome Database for 2022. Nucleic Acids Research 2022, 50, D622–D631. [CrossRef]
- Ruiz-Sala, P., & Peña-Quintana, L. Biochemical Markers for the Diagnosis of Mitochondrial Fatty Acid Oxidation Diseases. Journal of Clinical Medicine 2021, 10, 4855. [CrossRef]
- Burrage, L. C., Nagamani, S. C. S., Campeau, P. M., & Lee, B. H. Branched-chain amino acid metabolism: From rare Mendelian diseases to more common disorders. Human Molecular Genetics 2014, 23, R1–R8. [CrossRef]
- Liu, S., Li, L., Lou, P., Zhao, M., Wang, Y., Tang, M., Gong, M., Liao, G., Yuan, Y., Li, L., Zhang, J., Chen, Y., Cheng, J., Lu, Y., & Liu, J. Elevated branched-chain α-keto acids exacerbate macrophage oxidative stress and chronic inflammatory damage in type 2 diabetes mellitus. Free Radical Biology & Medicine 2021, 175, 141–154. [CrossRef]
- Yamauchi, M., Kimura, K., Maezawa, Y., Ohata, M., Mizuhara, Y., Hirakawa, J., Nakajima, H., & Toda, G. Urinary level of L-fucose as a marker of alcoholic liver disease. Alcoholism, Clinical and Experimental Research 1993, 17, 268–271. [CrossRef]
- Sakai, T., Yamamoto, K., Yokota, H., Hakozaki-Usui, K., Hino, F., & Kato, I. Rapid, simple enzymatic assay of free L-fucose in serum and urine, and its use as a marker for cancer, cirrhosis, and gastric ulcers. Clinical Chemistry 1990, 36, 474–476.
- Keeley, T. S., Yang, S., & Lau, E. The Diverse Contributions of Fucose Linkages in Cancer. Cancers 2019, 11, 9. [CrossRef]
- Qing, J., Hu, X., Li, C., Song, W., Tirichen, H., Yaigoub, H., & Li, Y. Fucose as a potential therapeutic molecule against the immune-mediated inflammation in IgA nepharopathy: An unrevealed link. Frontiers in Immunology 2022, 13, 929138. [CrossRef]
- Wang, Z., Tan, C., Duan, C., Wu, J., Zhou, D., Hou, L., Qian, W., Han, C., & Hou, X. FUT2-dependent fucosylation of HYOU1 protects intestinal stem cells against inflammatory injury by regulating unfolded protein response. Redox Biology 2023, 60, 102618. [CrossRef]
- Howard, M. C., Nauser, C. L., Vizitiu, D. A., & Sacks, S. H. Fucose as a new therapeutic target in renal transplantation. Pediatric Nephrology (Berlin, Germany) 2021, 36, 1065–1073. [CrossRef]
- Venkatachalam, K.V. Human 3’-phosphoadenosine 5’-phosphosulfate (PAPS) synthase: Biochemistry, molecular biology and genetic deficiency. IUBMB Life 2003, 55, 1–11. [Google Scholar] [CrossRef] [PubMed]
- Paganini, C., Gramegna Tota, C., Superti-Furga, A., & Rossi, A. Skeletal Dysplasias Caused by Sulfation Defects. International Journal of Molecular Sciences 2020, 21, 8. [CrossRef]
- Xu, P., Xi, Y., Zhu, J., Zhang, M., Luka, Z., Stolz, D. B., Cai, X., Xie, Y., Xu, M., Ren, S., Huang, Z., Yang, D., York, J. D., Ma, X., & Xie, W. Intestinal Sulfation Is Essential to Protect Against Colitis and Colonic Carcinogenesis. Gastroenterology 2021, 161, 271–286. [CrossRef]
- Ranganath, L. R., Norman, B. P., & Gallagher, J. A. Ochronotic pigmentation is caused by homogentisic acid and is the key event in alkaptonuria leading to the destructive consequences of the disease-A review. Journal of Inherited Metabolic Disease 2019, 42, 776–792. [CrossRef]
- Cho, S., Yang, X., Won, K.-J., Leone, V. A., Chang, E. B., Guzman, G., Ko, Y., Bae, O.-N., Lee, H., & Jeong, H. (s. f.). Phenylpropionic acid produced by gut microbiota alleviates acetaminophen-induced hepatotoxicity. Gut Microbes 2023, 15, 2231590. [CrossRef]
- Attia, S.M. Deleterious effects of reactive metabolites. Oxidative Medicine and Cellular Longevity 2010, 3, 238–253. [Google Scholar] [CrossRef]
- Berriozabalgoitia, A., Gordoa, J. C. R. de, Renobales, M. de, Amores, G., Barron, L. J. R., Amiano, P., Dorronsoro, M., Perea, Z., & Virto, M. The Sum of Plasma Fatty Acids iso16:0, iso17:0, trans11-18:1, cis9, trans11-CLA, and cis6-18:1 as Biomarker of Dairy Intake Established in an Intervention Study and Validated in the EPIC Cohort of Gipuzkoa. Nutrients 2021, 13, 702. [CrossRef]
- Taormina, V. M., Unger, A. L., Schiksnis, M. R., Torres-Gonzalez, M., & Kraft, J. Branched-Chain Fatty Acids—An Underexplored Class of Dairy-Derived Fatty Acids. Nutrients 2020, 12, 2875. [CrossRef]
- Guan, B., Tong, J., Hao, H., Yang, Z., Chen, K., Xu, H., & Wang, A. Bile acid coordinates microbiota homeostasis and systemic immunometabolism in cardiometabolic diseases. Acta Pharmaceutica Sinica. B 2022, 12, 2129–2149. [CrossRef]
Figure 1.
Volcano plot of metabolomic variables. The horizontal black line represents the limit of statistical significance; values above it indicates variables with significantly different medians. The vertical black lines represent a log2(fold change) of -0,6 and +0,6. Values above +0,6 represent variables with a median for inflammation=yes that is 1,5 greater in magnitude than for inflammation=no (in blue). Values below -0,6 represent variables with a median for inflammation=no that is 1,5 times greater in magnitude than for inflammation=yes (in red).
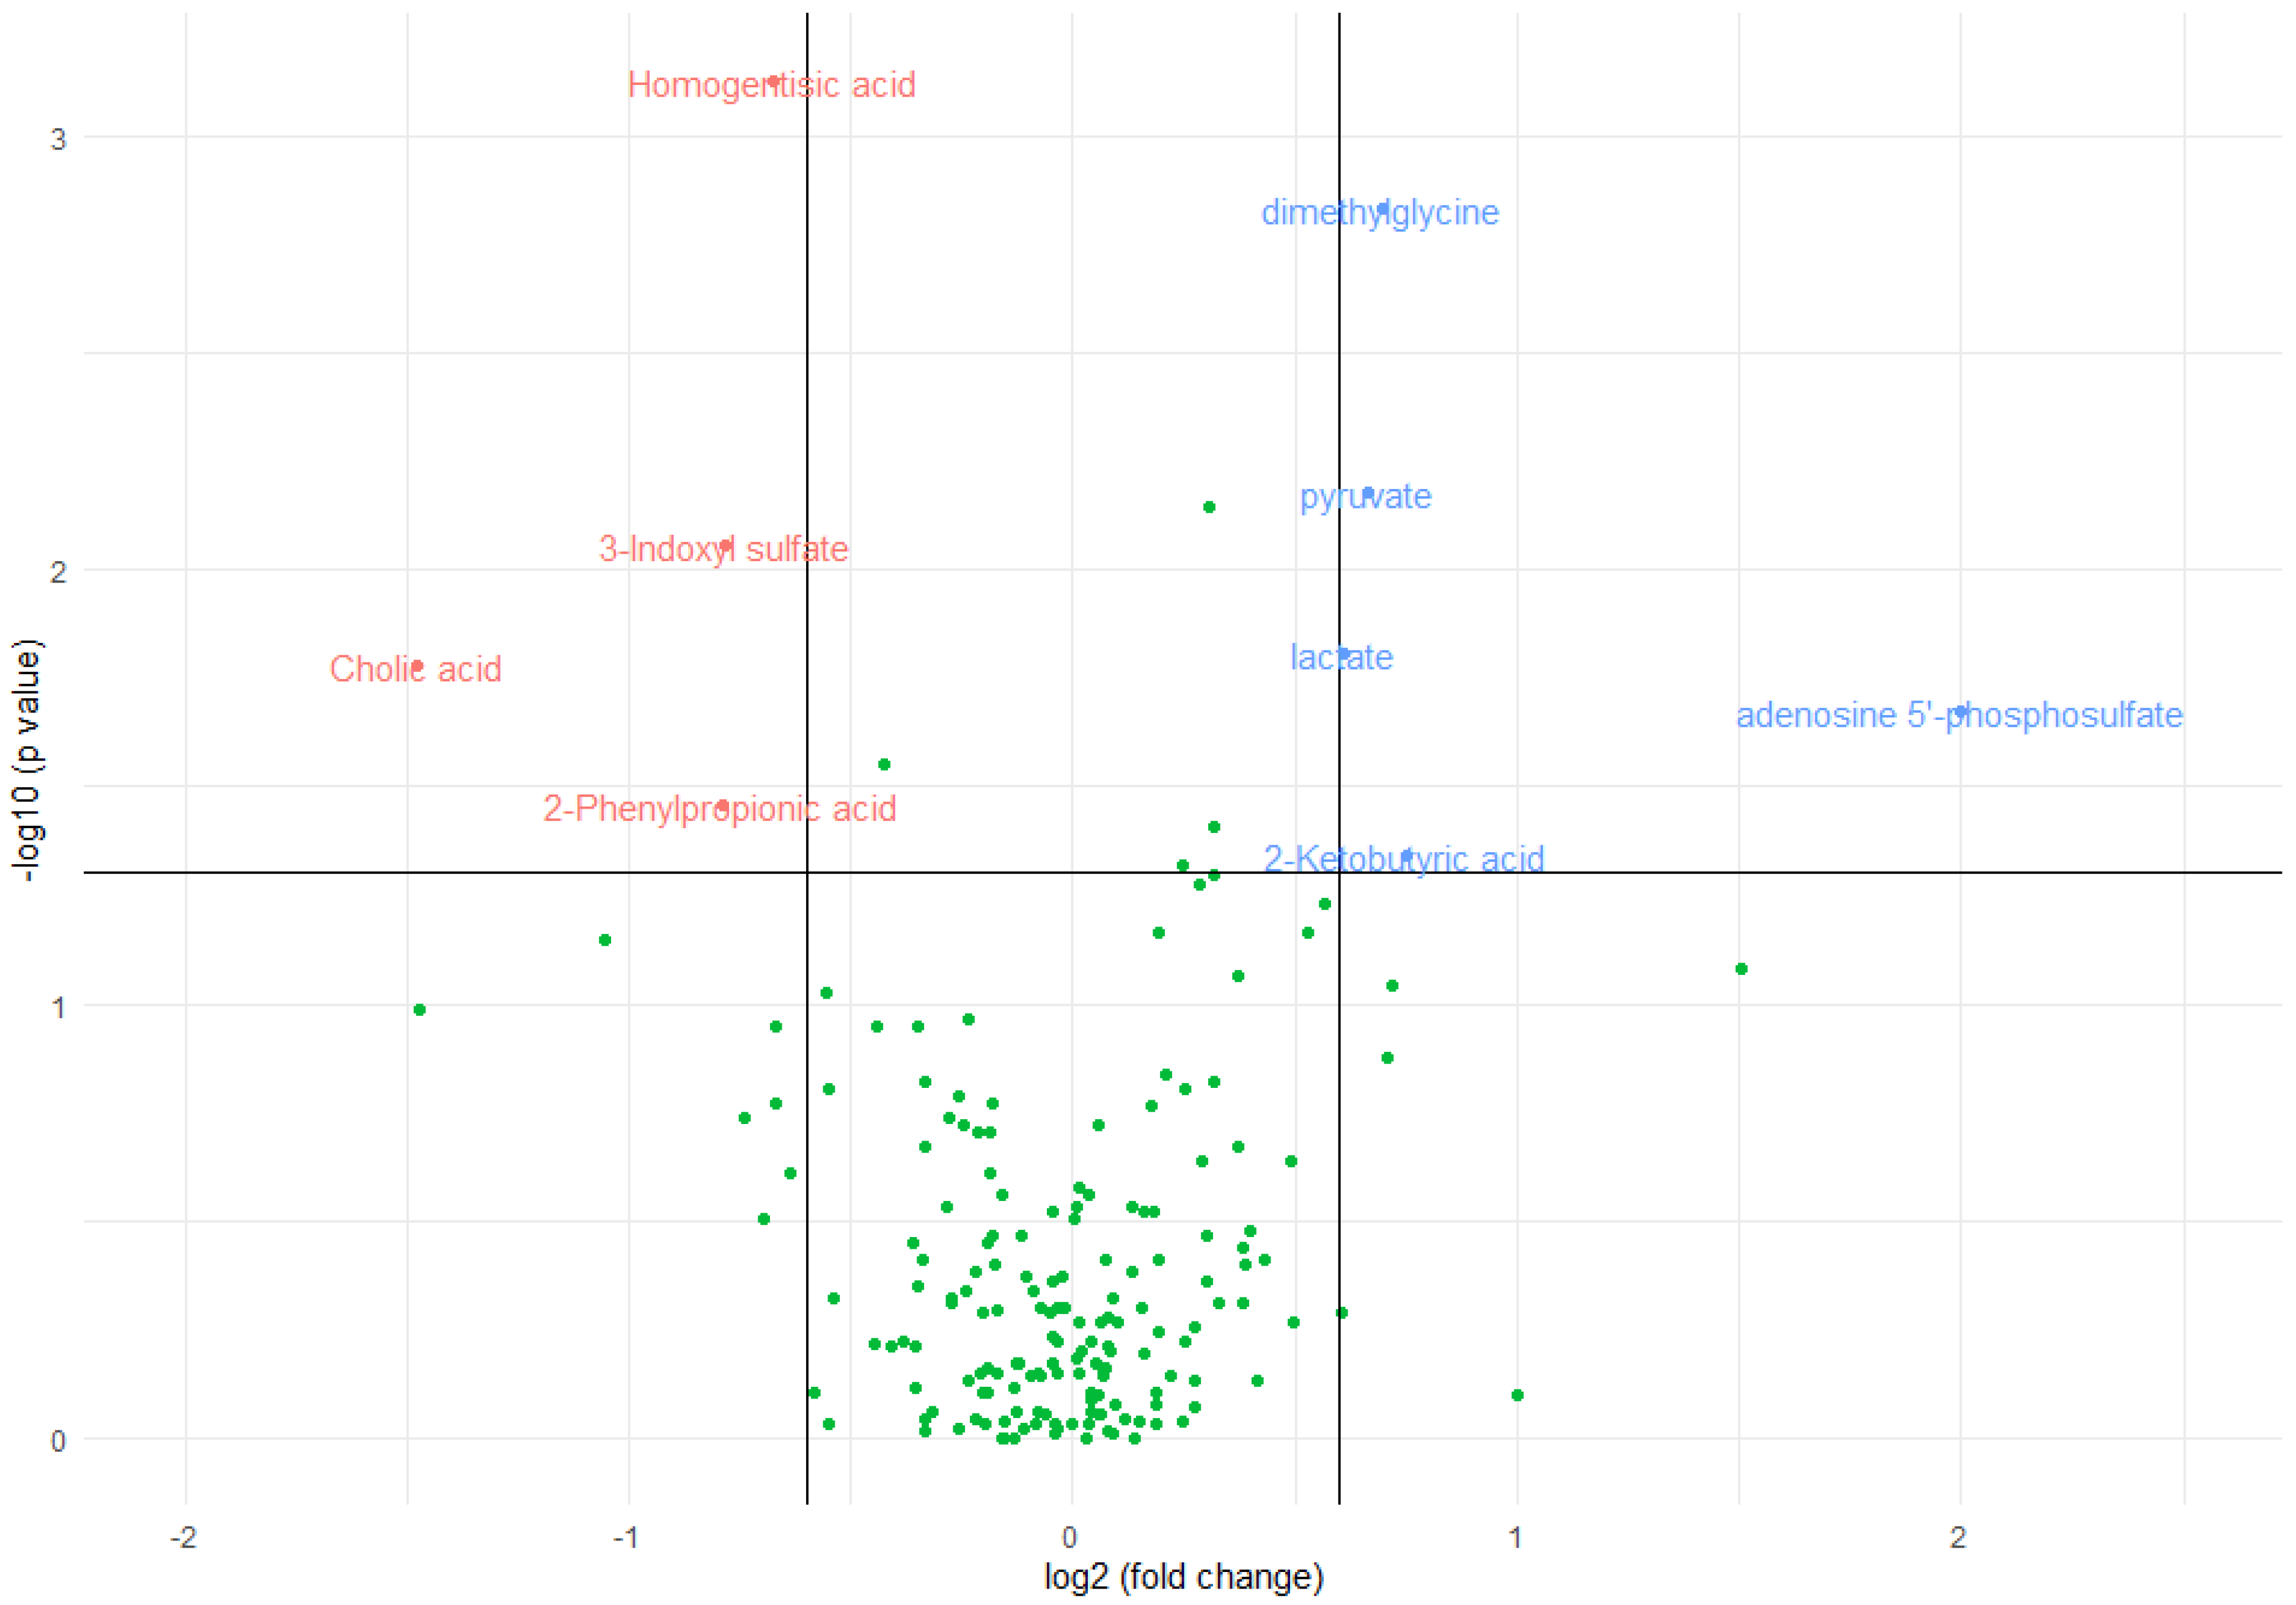
Figure 2.
Graphical representation of the Odds Ratios (OR) obtained in the logistic-LASSO model. ORs close to 1 (red vertical line) indicate variables with a lesser effect on the model.
Figure 2.
Graphical representation of the Odds Ratios (OR) obtained in the logistic-LASSO model. ORs close to 1 (red vertical line) indicate variables with a lesser effect on the model.
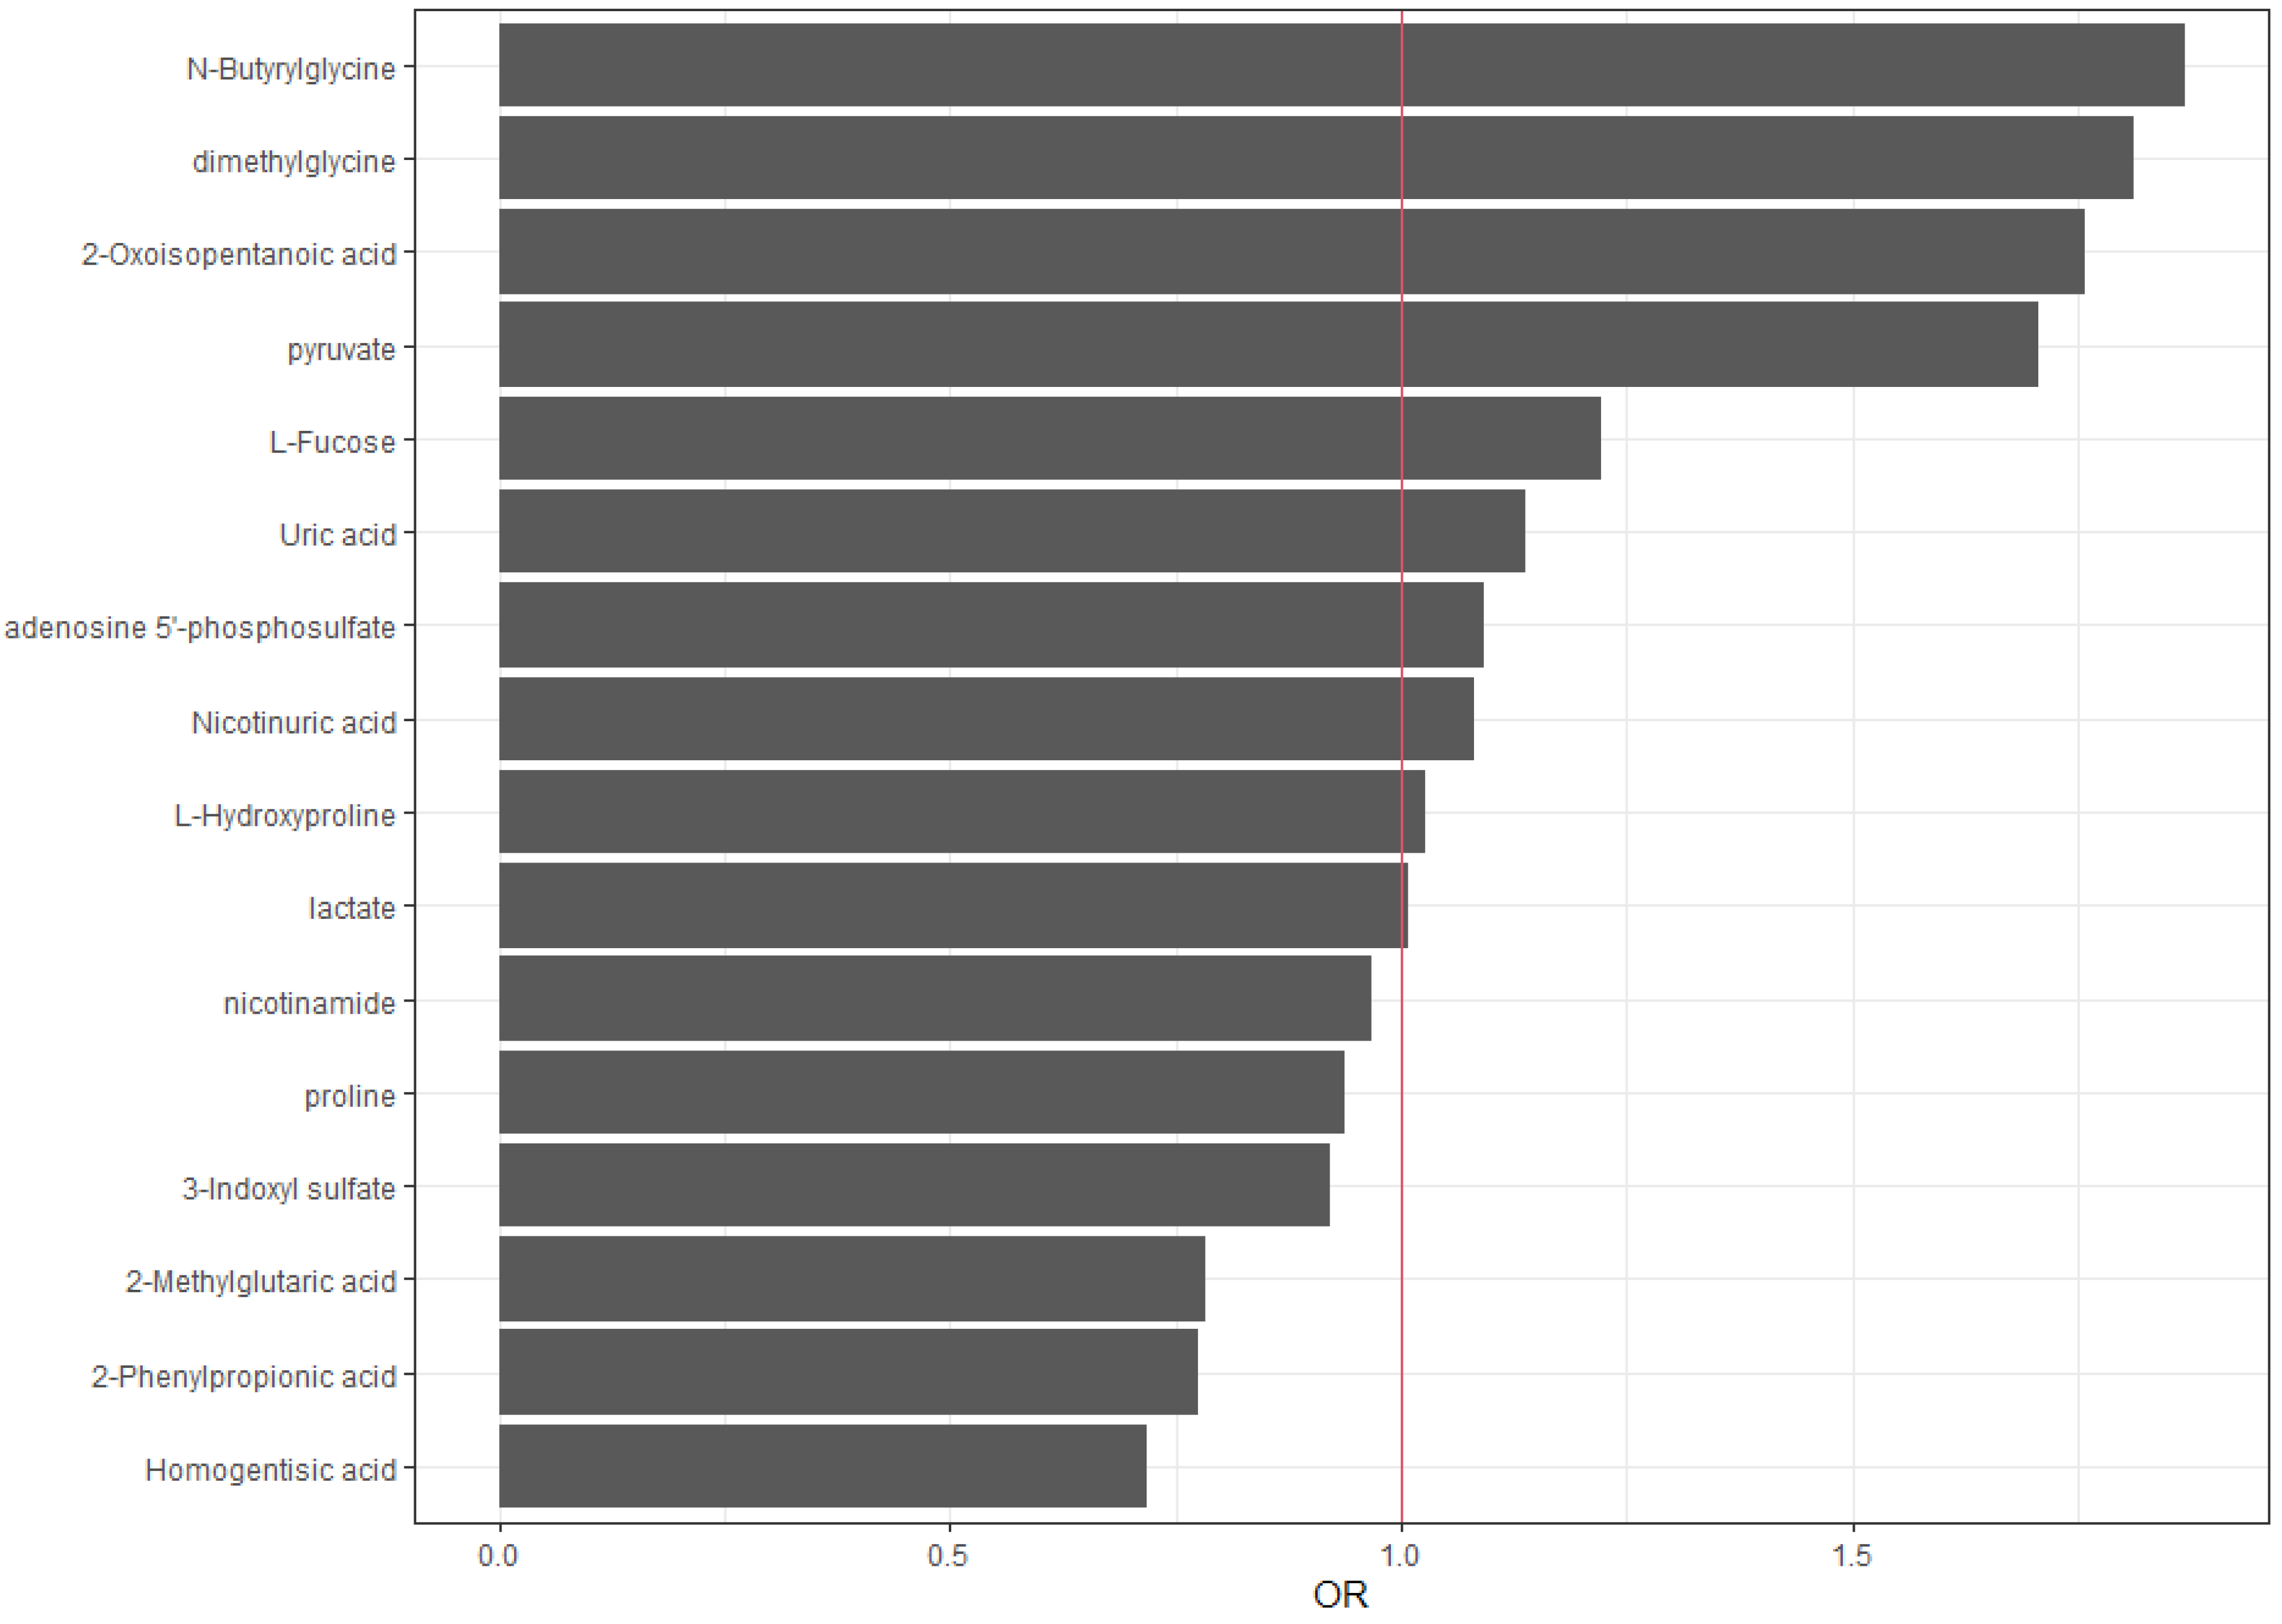
Figure 3.
Graphical representation of the metabolic relationship between butyrylglycine, dimethylglycine, and pyruvate.
Figure 3.
Graphical representation of the metabolic relationship between butyrylglycine, dimethylglycine, and pyruvate.
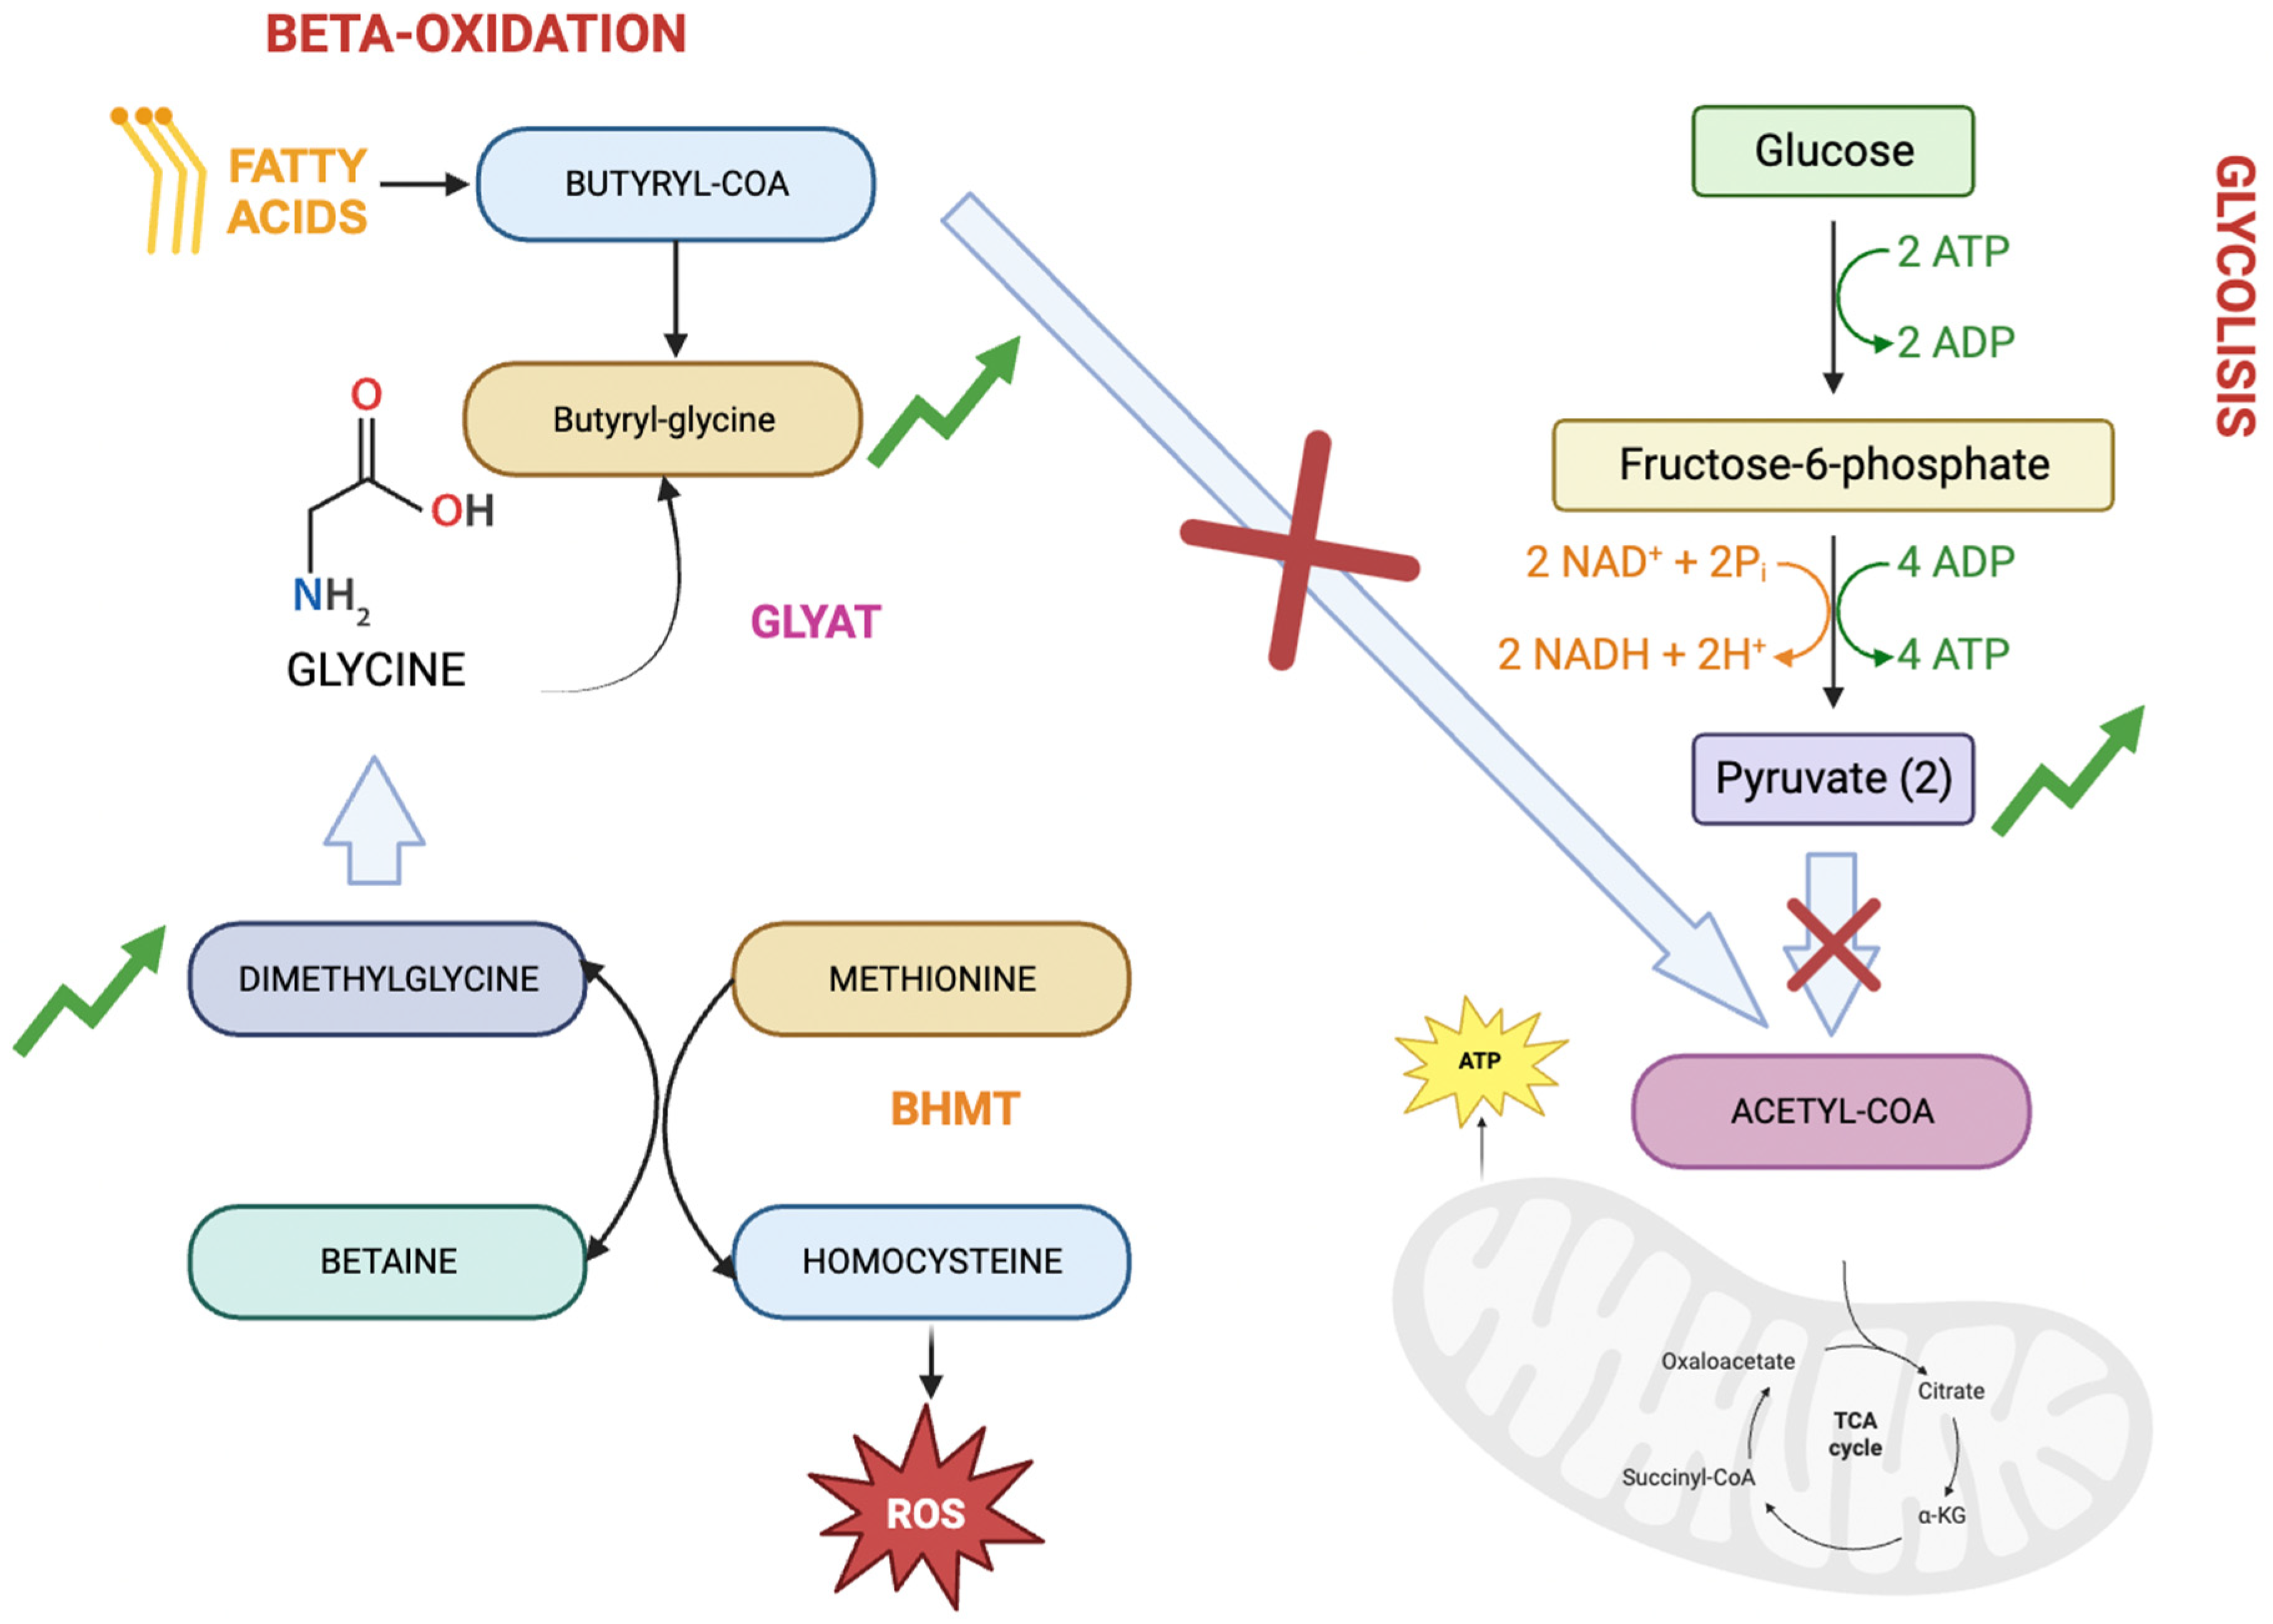
Figure 4.
Graphical representation of the metabolic pathway involving alpha keto isovalerate.
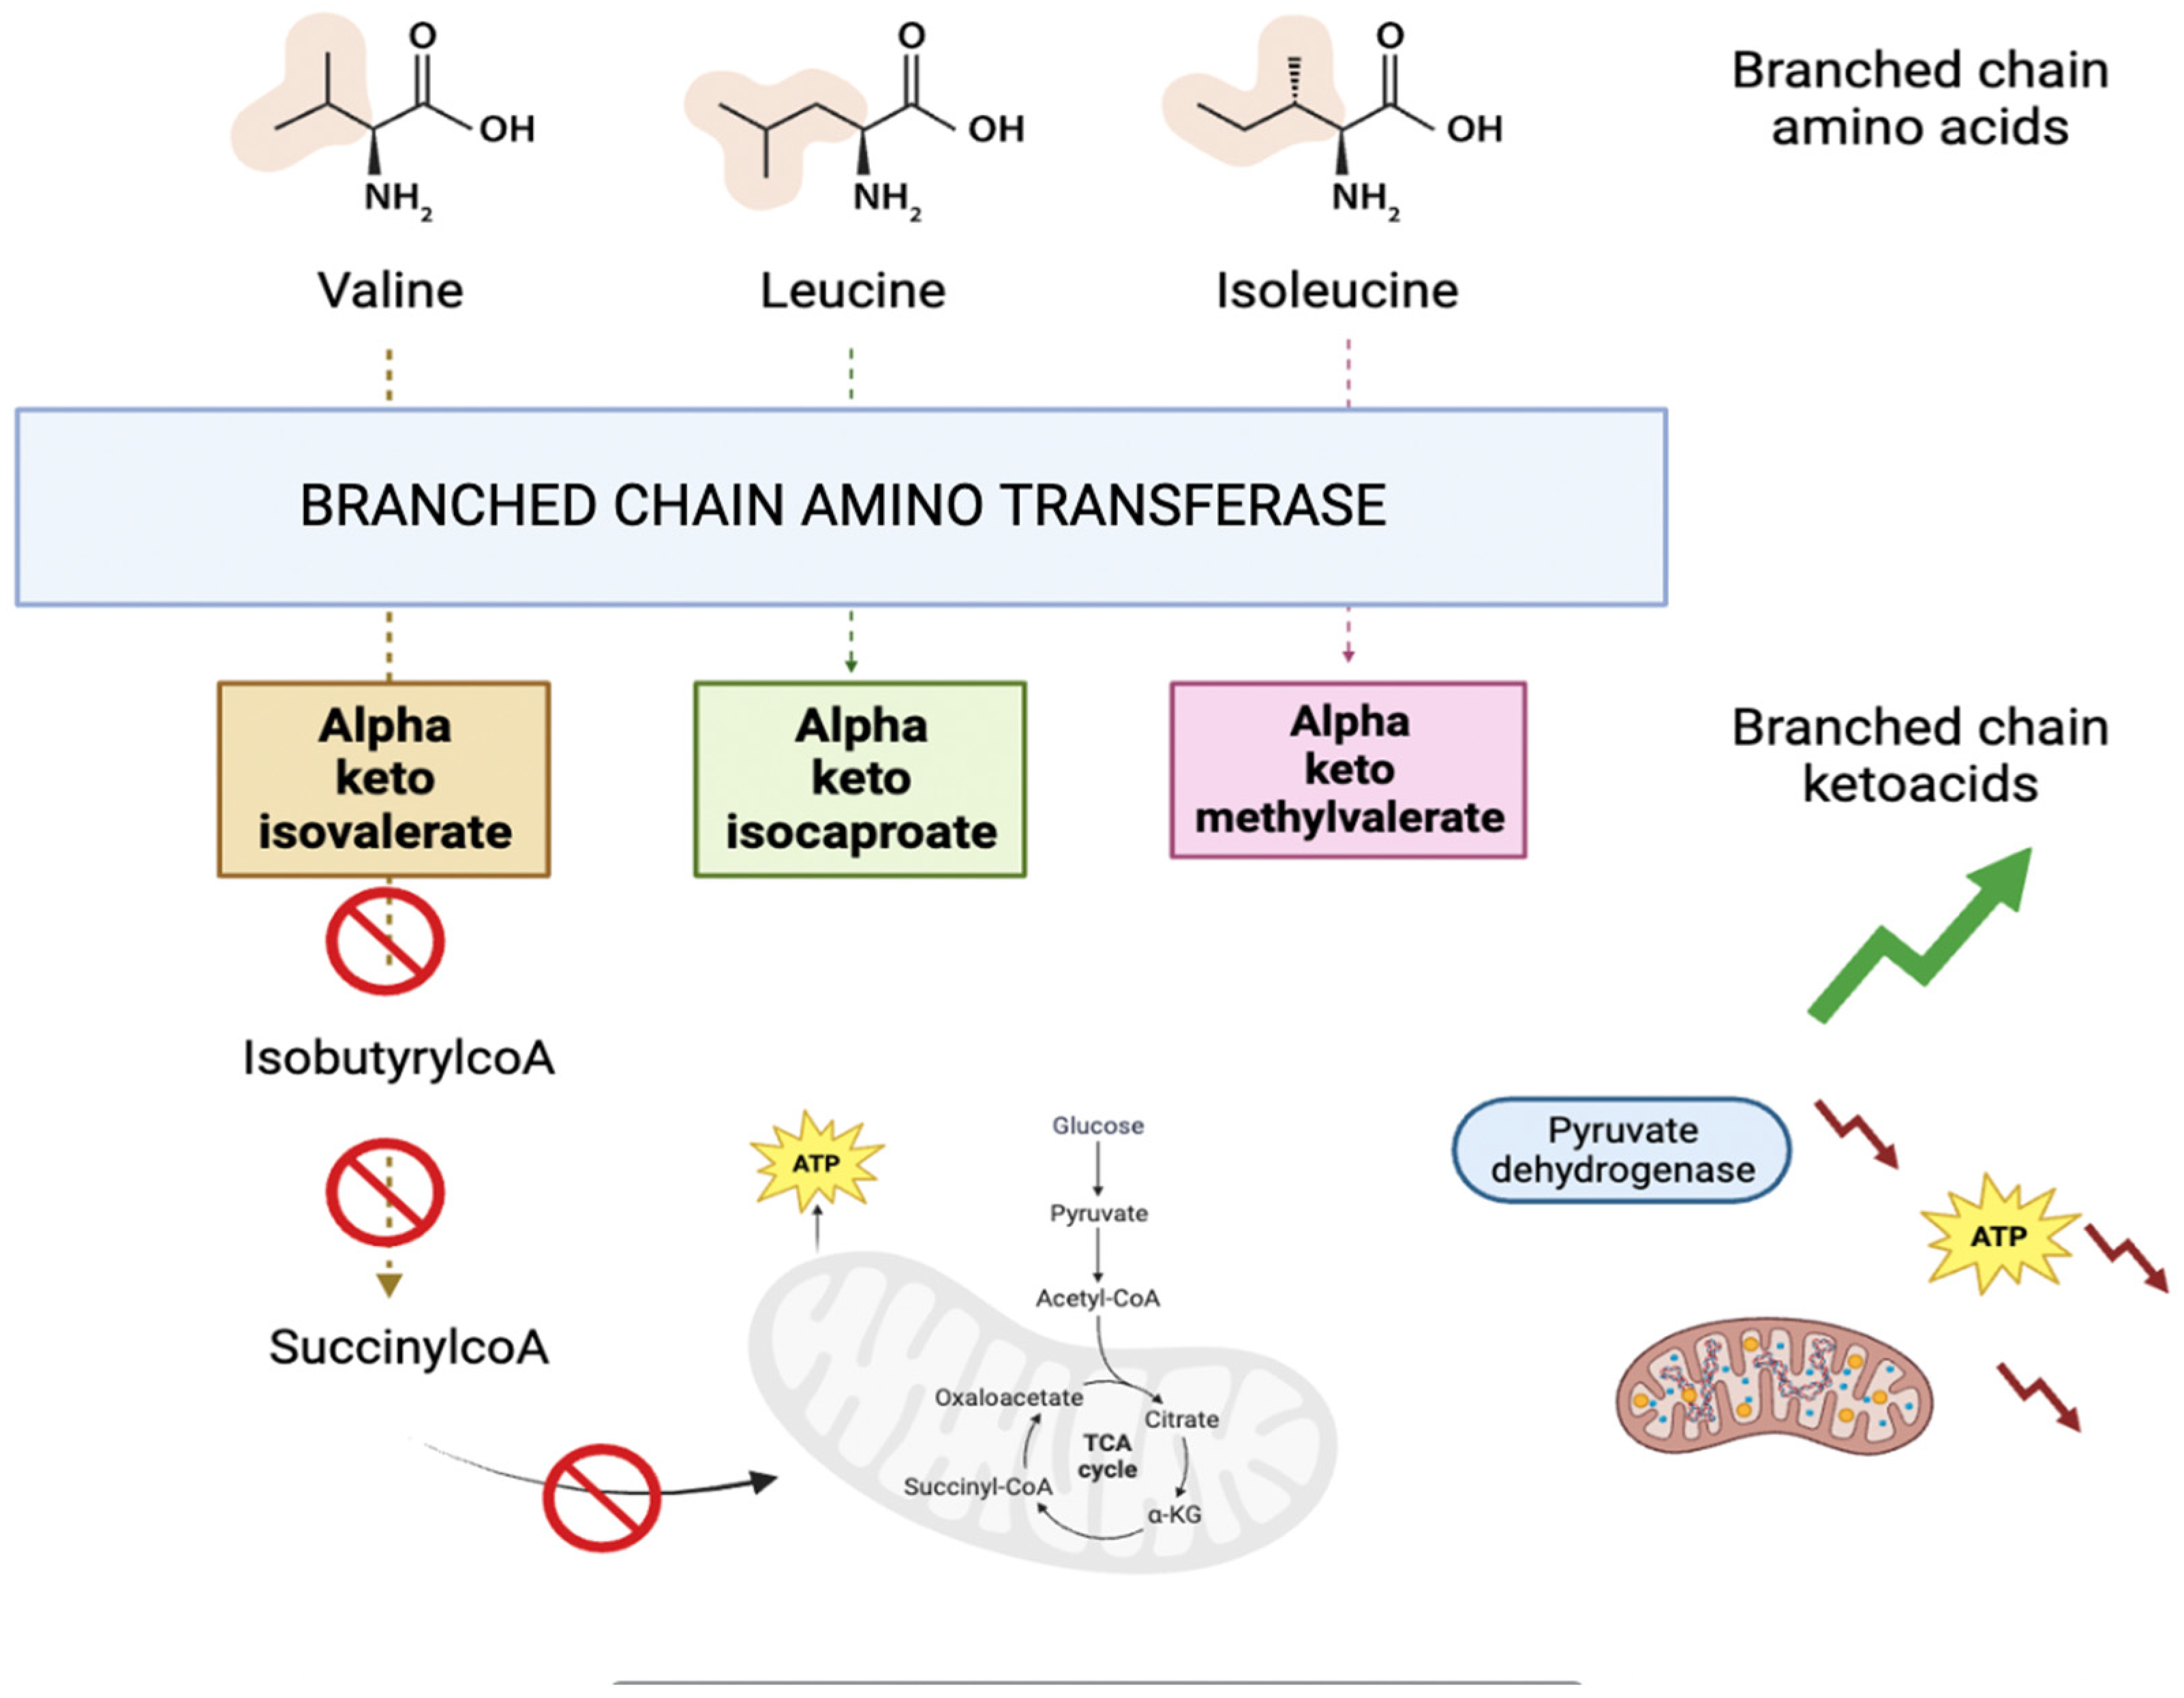

Table 1.
Demographic characteristics of the sample.
| Age (years) (mean ± SD) | 69.46 ± 13.28 |
| Female gender, n (%) | 19 (38%) |
| Height (cm) (mean ± SD) | 165.18 ± 8.83 |
| Weight (kg) (mean ± SD) | 75.51 ± 15.76 |
| BMI (mean ± SD) | 27.61 ± 4.71 |
| Smoker, n (%) | 25 (50%) |
| Type 2 diabetes, n (%) | 25 (50%) |
| Hypertension, n (%) | 47 (94%) |
| Dyslipidemia, n (%) | 38 (76%) |
Table 2.
Numerical summary of metabolomic variables with significant differences in their medians based on inflammation=no and inflammation=yes.
Table 2.
Numerical summary of metabolomic variables with significant differences in their medians based on inflammation=no and inflammation=yes.
| Variable | Median inflammation =No | IQR Inflammation =No | Median Inflammation =Yes | IQR inflammation =Yes | Mann-Whitney statistic | p-value |
| Homogentisic acid | 658062 | 340396 | 412251 | 244065 | 417 | 0.0007 |
| dimethylglycine | 125416 | 69804 | 203207 | 189224 | 116 | 0.0015 |
| pyruvate | 71565240 | 20799310 | 113500840 | 111279800 | 136 | 0.0066 |
| 2-Oxoisopentanoic acid | 10934585 | 2820924 | 13506204 | 3898370 | 137 | 0.0071 |
| 3-Indoxyl sulfate | 207231408 | 124405200 | 120266360 | 89655840 | 385 | 0.0087 |
| lactate | 80909480 | 44669740 | 123676000 | 58251360 | 149 | 0.0156 |
| Cholic acid | 84849 | 181404 | 30452 | 59027 | 375 | 0.0165 |
| adenosine 5’-phosphosulfate | 0 | 0 | 33309 | 76439 | 162 | 0.0211 |
| Kynurenic acid | 791827 | 358109 | 590577 | 401863 | 366 | 0.0281 |
| 2-Phenylpropionic acid | 424658 | 237796 | 246110 | 303895 | 362 | 0.0351 |
| Uric acid | 9967433 | 3054808 | 12411336 | 4516135 | 165 | 0.0391 |
| 2-Ketobutyric acid | 663583 | 806580 | 1117340 | 859427 | 168 | 0.0458 |
| L-Hydroxyproline | 719050 | 233060 | 851651 | 257328 | 169 | 0.0482 |
Table 3.
Variables, standardized coefficients, and Odds Ratios obtained (LASSO).
| Variables | Standard.coefficients | Odds Ratio |
| N-Butyrylglycine | 0.6252470 | 1.8687074 |
| dimethylglycine | 0.5952781 | 1.8135351 |
| 2-Oxoisopentanoic acid | 0.5640526 | 1.7577816 |
| pyruvate | 0.5341265 | 1.7059575 |
| Homogentisic acid | -0.3305017 | 0.7185631 |
| 2-Phenylpropionic acid | -0.2552945 | 0.7746883 |
| 2-Methylglutaric acid | -0.2450682 | 0.7826511 |
| L-Fucose | 0.2005541 | 1.2220797 |
| Uric acid | 0.1293206 | 1.1380549 |
| adenosine 5’-phosphosulfate | 0.0880096 | 1.0919986 |
| 3-Indoxyl sulfate | -0.0827405 | 0.9205900 |
| Nicotinuric acid | 0.0795591 | 1.0828095 |
| proline | -0.0650603 | 0.9370110 |
| nicotinamide | -0.0329016 | 0.9676337 |
| L-Hydroxyproline | 0.0277108 | 1.0280983 |
| lactate | 0.0097718 | 1.0098197 |
Disclaimer/Publisher’s Note: The statements, opinions and data contained in all publications are solely those of the individual author(s) and contributor(s) and not of MDPI and/or the editor(s). MDPI and/or the editor(s) disclaim responsibility for any injury to people or property resulting from any ideas, methods, instructions or products referred to in the content. |
© 2024 by the authors. Licensee MDPI, Basel, Switzerland. This article is an open access article distributed under the terms and conditions of the Creative Commons Attribution (CC BY) license (http://creativecommons.org/licenses/by/4.0/).
Copyright: This open access article is published under a Creative Commons CC BY 4.0 license, which permit the free download, distribution, and reuse, provided that the author and preprint are cited in any reuse.


