1. Introduction
Actual evapotranspiration (ETa) measurements in the field or estimation by any respective conventional method (Kumar et al. 2011) are needed in irrigation scheduling at large-scale irrigation schemes as well as in a farmyard, water balance works in hydrologic studies, the accurate design of hydraulic structures related to irrigation schemes, etc. By introducing a two-step procedure (Cetin 2020), ETa, in other words, crop evapotranspiration ETc, is estimated under standard conditions (Allen et al. 1998), i.e., well-watered and optimal agronomic conditions. On the other hand, ETa is an essential component of the water budget, hydrological modeling, and irrigation water management in arid and semi-arid regions of the world. Nevertheless, it is not an easy task to acquire a representative ETa value for it can be determined directly using either a lysimeter or water balance work/approach which are rather labor-intensive, time-consuming, in turn, very expensive. As stated clearly by Allen et al. (1998), Rawatet al. (2017), Gharbia et al. (2018), and Alsenjar et al. (2023a), among others, ETa describes the physical processes of the amount of water that can occur either evaporation or transpiration according to climatic conditions, crop types, and soil status. Since direct methods of ETa calculation focus only on one point or parcel, in turn, they have limitations in showing the variation of ETa spatially and temporally at a large scale (Zhang et al. 2011), particularly in areas with large irrigation schemes of >100 000 ha as in Turkiye. Therefore, accurately estimating ETa is of utmost importance as well as a critical issue in water balance methods and agricultural water management at the irrigation scheme level. In this regard, the remote sensing (RS)-based surface energy balance models are one of the indirect methods to estimate spatially ETa over large-scale irrigation catchments with a high spatial and temporal resolution (Alsenjar et al. 2023b; Alsenjar and Cetin 2023c; Cetin et al. 2023a, 2023b).
Several researchers have estimated ETa based on the RS-based surface energy balance models such as the Surface Energy Balance Algorithm for Land (SEBAL) (Bastiaanssenet al. 1998a, 1998b), Mapping EvapoTranspiration at high Resolution and with Internalized Calibration, i.e., METRIC (Allen et al. 2007a, 2007b), and Surface Energy Balance System (SEBS) (Su 2002). These models normally use Landsat satellite Imagery or Moderate Resolution Imaging Spectroradiometer (MODIS) which include more required RS data alongside weather parameters (Allen et al. 2007a; Alsenjar et al. 2023b; Cetin et al. 2023a, 2023b), among others. However, as pointed out by Bachour et al. (2014), among others, RS technology has some limitations. Therefore, some of these data cannot be provided due to cloud cover and the unavailability of all relevant climatic data. For example, the implemented METRIC model to estimate ETa requires more of the input parameters of Landsat satellite data (net radiation flux (Rn), soil heat flux (G), sensible heat flux (H), latent heat flux (LE), leaf area index (LAI), land surface temperature (LST), surface albedo (α), normalized difference vegetation index (NDVI), to name but a few).
In addition, H calculation in the METRIC model is based on the anchoring pixels, i.e., hot and cold, so there are complexities involved in sensitivity selecting anchor pixels for improved estimation of H and LE fluxes (Singh and Irmak 2011). Moreover, Landsat satellite data with 30 m by 30 m spatial resolution are normally available every 16 days for satellite scenes (Alsenjar et al. 2023b; Cetin et al. 2023a, 2023b). As such, the methodology obtained by Allen et al. (2007a) has been used to estimate ETa based on the METRIC model for each pixel during the satellite image overpass date. In this regard, to determine ETa values based on the METRIC model for a predetermined period, i.e., month or season, Allen et al. (2007a) have applied the procedure by making the interpolation of daily reference evapotranspiration fraction (ETrF) or crop coefficient (Kc) values between two satellite images and multiplying by reference evapotranspiration, i.e., ETo, for each day and then integrated for a specific period of time. However, the accepted method by Allen et al. (2007a) has some gaps or limitations in showing the effect of precipitation or irrigation precisely on the daily growth stages and NDVI of crops between two satellite image overpasses. As known, both ETa and ETo have a nonlinear character in nature (ASCE 2000a), and in turn, is a complex phenomenon. Therefore, more nonlinearity exists in the evapotranspiration process due to its stochastic behavior (ASCE 2000b). Thus, over the past few decades, artificial neural networks (ANNs) have been successfully utilized in modelling reference evapotranspiration, i.e., ETo (ASCE 2000a, 2000b; Kumar et al. 2011). As such, the idea of artificial neural networks usage in engineering applications goes back to the 1940s (ASCE 2000a), it has been widely used in hydrological practices, particularly in the estimations of reference evapotranspiration, since the early nineties. Contrary to this, the literature review revealed that there have been hardly ever studies on estimating METRIC-based actual evapotranspiration values by ANN models.
The most significant merit of the ANN models is to solve complex problems using fewer inputs by adjusting the weights to be able to predict the correct output of the input parameters. Recently, the ANN algorithm has been applied to estimate reference evapotranspiration (ETo) and crop evapotranspiration (ETc) for wheat, maize, and potato, in different regions of the world (Bruton et al. 2000; Odhiambo et al. 2001; Kumar et al. 2002; Dehbozorgi and Sepaskhah 2011; Khoshhal and Mokarram 2012; Abrishami et al. 2019; Yamac and Todorovic 2020). As for ANN-based ET estimation, rarely studies used land surface parameters calculated from RS data, including but not limited to land surface temperature, vegetation indices, etc., and limited meteorological parameters as inputs in the ANN model (Virnodkar et al. 2020).
ETa estimation by the ANN model can be beneficial and powerful for using it as an input factor in water balance calculations at large-scale irrigation catchments since, as claimed by Kumar et al. (2011), theoretically, ANN is expected to produce better results than a regression model for the same data length. The novelty of this study is to establish a new methodology for generating daily actual evapotranspiration (ETa) series based on the ANN model using some of the parameters of MODIS data coupled with availably daily moderate spatial and less input of weather variables as compared to the existing methods of ETa-based surface energy balance models estimation. Therefore, this study aims to use an artificial neural network (ANN) approach to estimate daily actual evapotranspiration (ETa) values in large-scale irrigation catchments using two parameters of MODIS data, i.e., NDVI and LST, coupled with limited site-specific climatic variables at a large-scale irrigation scheme located in the Lower Seyhan Plain irrigation project area with >210 000 ha land (Cetin et al. 2023b). Furthermore, this paper is the first attempt to generate a new model using the ANN algorithm as an alternative to the existing methods of actual evapotranspiration estimation in a large-scale irrigation district in the Eastern Mediterranean Region of Turkiye. Moreover, this methodology can be generalized for estimating daily ETa using the ANN model to different climate regions and zones of the world.
2. Materials and Methods
2.1. Study area And Its Characteristics
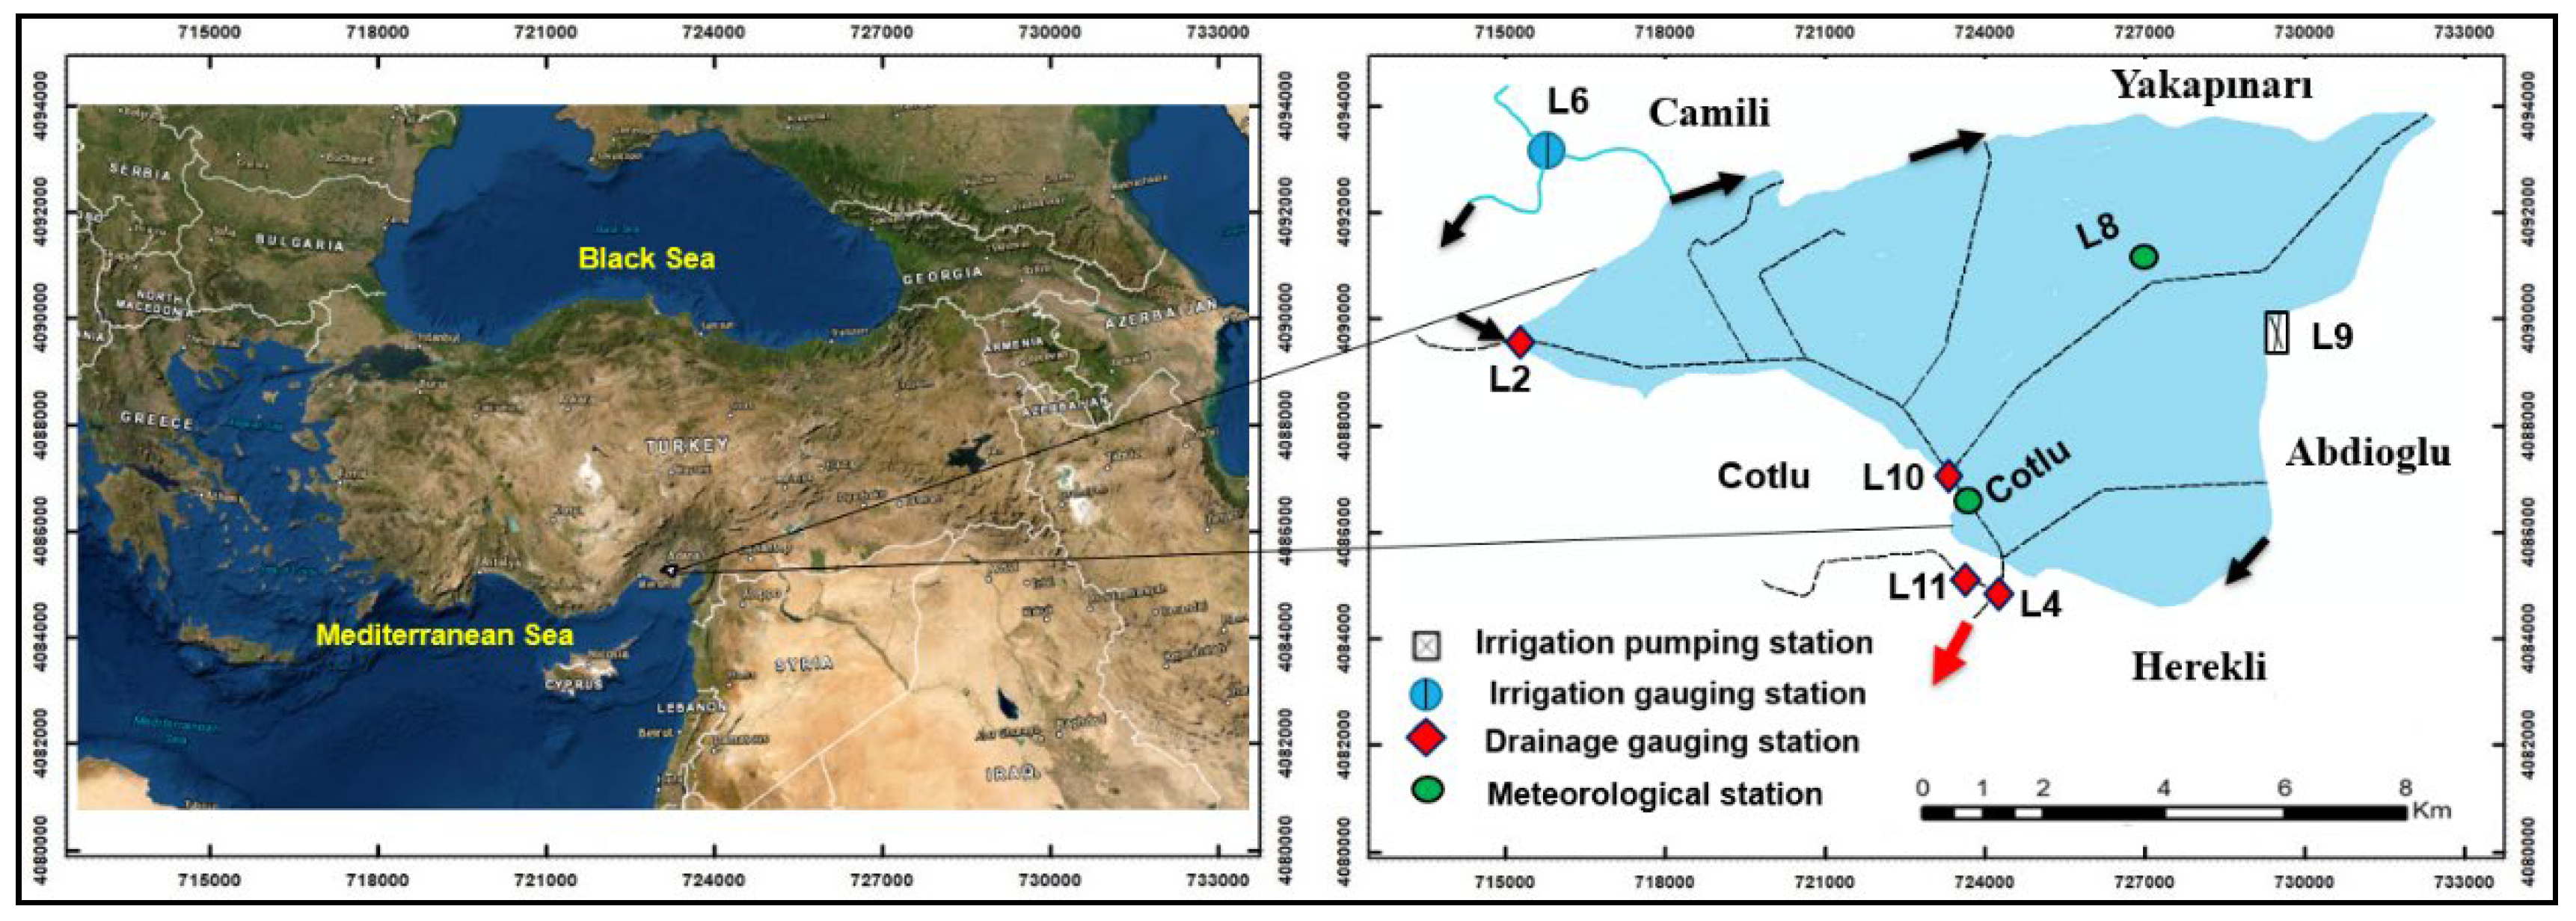
The research area that has gained popularity under the name Akarsu Irrigation District (hereafter, AID, A=9495 ha≈95 km
2,
Figure 1) in the studies carried out so far is located in the
Lower Seyhan Plain (LSP) in the southeastern part of the Mediterranean region of Turkiye. The LSP shows typical characteristics of a deltaic plain with a rather flat topography (a slope of 1% or less) and a large-scale irrigation and drainage network (Alsenjar et al. 2023a, b; Cetin et al. 2023a, b). The Mediterranean climate, characterized by warm and rainy in the winter season whereas dry and hot in the summer season, prevails utterly in the LSP and, in turn, in the study area. The average annual precipitation of the basin is around 650 mm (Cetin et al. 2020). In the LSP of Turkiye, there is a very remarkable difference in temperature and evaporation values in the irrigation season, in July and August in particular, compared to those in the winter season, specifically in December, January, and February (Alsenjar et al. 2023b; Cetin et al. 2020, 2023a). As reported by Alsenjar et al. (2023b), due to meteorological and geographical factors, the definition of the water year, i.e., hydrological year, varies from region to region. It has been defined as the period, with a length of 365-day, between October 1st of one year and September 30th of the next, as late September to early October is the time for many drainage areas or catchments in Turkiye to have the lowest stream flows and consistent groundwater levels.
2.2. Remote Sensing Data Used
2.2.1. Landsat Satellite Imagery
To run the METRIC model and for the actual evapotranspiration (ETa) estimations, a total of 38 clear-sky Landsat satellite images were downloaded from the USGS website (
http://earthexplorer.usgs.gov) (path 175, row 34) and used in this research (
Table 1). These images are Landsat 7, Landsat 8, and Landsat 9 with 30 m by 30 m spatial resolution. General characteristics of the Landsat satellite images are given in
Table 1. The Environment for Visualizing Images (ENVI) software program was applied to perform a cloud mask for one satellite image on May 1, 2022, i.e., DOY 121, of grayscale fill, as shown in
Table 1.
2.2.2. Moderate Resolution Imaging Spectroradiometer (MODIS) Products
Two parameters of MODIS data, i.e., normalized difference vegetation index (NDVI) and land surface temperature (LST) were downloaded by the Google Earth engine (‘MODIS/MOD09GA_006_NDVI’; ‘MODIS/061/MOD11A1_LST’) to apply the artificial neural network (ANN) for estimating daily ETa values for the entire study area. Typical characteristics of MODIS data are illustrated in
Table 2 along with the spatial and temporal resolutions. Daily NDVI and LST data sets were used as casual variables in the modelling practice.
2.3. In-Situ Meteorological Observations
In this research, hourly and daily climatic variables (minimum and maximum temperatures (Tmin, Tmax), wind speed (U), solar radiation (Rs), minimum and maximum relative humidity values (RHmin and RHmax), and precipitation (P)) acquired from two meteorological stations, i.e., L8 and Cotlu meteorological stations established in the AID, were used (
Figure 1). Before using any climatic data observed in L8 and Cotlu meteorological stations, quality controls, i.e., QC (gaps in the data, outliers, constant values, jumps, etc.) were checked thoroughly. No consistency was found in the meteorological data sets. Climatic data sets cover from September 16, 2020, to October 24, 2022, i.e., 769 daily data sets.
2.4. Reference Evapotranspiration (ETo) Estimation
Reference evapotranspiration (ETo in mm day
−1 unit) is defined and computed using the FAO-Penman-Monteith approach given by Allen et al. (1998). Equation 1 was developed for short grass; the albedo was 0.23, whilst the aerodynamic resistance was 70 s m
-1.
where ETo is the reference evapotranspiration (mm day
−1), R
n is the net radiation at the crop surface (MJ m
−2day
−1), G is the soil heat flux density (MJ m
−2 day
−1), T is the mean daily air temperature at 2 m height (°C), u
2 is the wind speed at 2 m height (m s
−1), e
s is the saturation vapor pressure (kPa), e
a is the actual vapor pressure (kPa), e
s−e
a is the saturation vapor pressure deficit (kPa), Δ slope (kPa °C
−1) is the vapor pressure curve and γ the psychrometric constant (kPa °C
−1).
2.5. METRIC Model
The METRIC model was applied to estimate a) surface energy balance components (
SEB), i.e., latent heat (
LE), net radiation (
Rn), the sensible heat (H), and soil heat flux (
G) in Equation 2, b) ETa for each pixel, and the whole study area by using Landsat satellite imagery and meteorological stations, i.e., L8 and Cotlu at the time of satellite overpass, primarily based on Allen et al. (2007a, 2007b) through R-METRIC model using a water package in the
R program (Olmedo et al. 2016) and LandMOD ET mapper-MATLAB (Bhattarai et al. 2017).
All the fluxes are in the unit of watt per meter square (i.e., W m−2). Further information on the METRIC model and equations, i.e., step-by-step ETa calculation, as well as the FAO-Penman-Monteith approach are given by Allen et al. (2007a).
2.6. Developing an ANN Model for Actual Evapotranspiration (ETa) Estimation
Artificial Neural Networks (ANNs) are mathematical models that resemble biological neural networks. ANNs can learn from examples and adapt solutions over time by recognizing patterns in data, along with rapidly processing information (Jain et al. 2008). In essence, ANNs are tools to mimic the underlying likely relationship between input and output variables in the hand adequately.
Water resources and hydrological processes are often complex, multivariable, and nonlinear. ANNs exhibit a flexible structure to address these complex relationships, making them capable of learning and integrating complex relationships by using various input data. Therefore, in recent times, ANNs have been increasingly utilized in hydrology and water resource management. ANNs might be considered as flexible modeling tools and can theoretically model any type of relationship with good accuracy. With ANNs, there is no need to make specific assumptions about the models and the underlying relationships; the underlying relationship is determined solely through data mining procedures.
This data-driven approach is one of the most significant advantages of ANNs in solving various complex real-world prediction problems. ANNs have been used in a whole range of hydrological applications, including reference evapotranspiration estimations and predicting groundwater levels (Coppola et al. 2003; Daliakopoulos et al. 2005), flood forecasting simulations (Karahan et al. 2014), rainfall and streamflow modeling (Luk et al. 2000), and aquifer parameter estimations (Garcia and Shigidi 2006; Karahan and Ayvaz 2006).
Models for calculating ETo and plant water requirements involve a myriad of variables such as meteorological data, soil properties, plant type, and climate conditions. ANNs have a significant advantage in handling these complexities due to their ability to use a large amount of data. Particularly, when trained with large datasets, these networks have a better capacity to learn complex relationships and patterns. Predicting future changes in water resources and plant water requirements due to climate change is becoming increasingly important. In ET modeling, machine learning algorithms are being used more and more as an alternative to traditional methods (Granata 2019; Tikhamarine et al. 2019). These algorithms can be used as alternatives to traditional equations for ETc and/or ETo predictions. They also provide insights into how ET behaves over time and space (Madugundu et al. 2017; Tang et al. 2018). ANNs can be trained and adapted to be used in different geographical areas, allowing for customized predictions based on different plant species and climatic conditions.
Despite their mentioned advantages, ANNs have some important disadvantages. They require a significant amount of data to learn complex relationships and to determine the optimal network architecture (Karahan and Ayvaz 2008). To create the network structure, the number of hidden layers in the model and the optimal number of neurons in each layer need to be determined. In most of the ANN studies in the literature, a trial-and-error procedure is used to determine the network architecture, which is a time-consuming process. According to Maier and Dandy (2000), in most water resources problems, using a single hidden layer is sufficient. Therefore, in this study, a single hidden layer is used in ETa estimation.
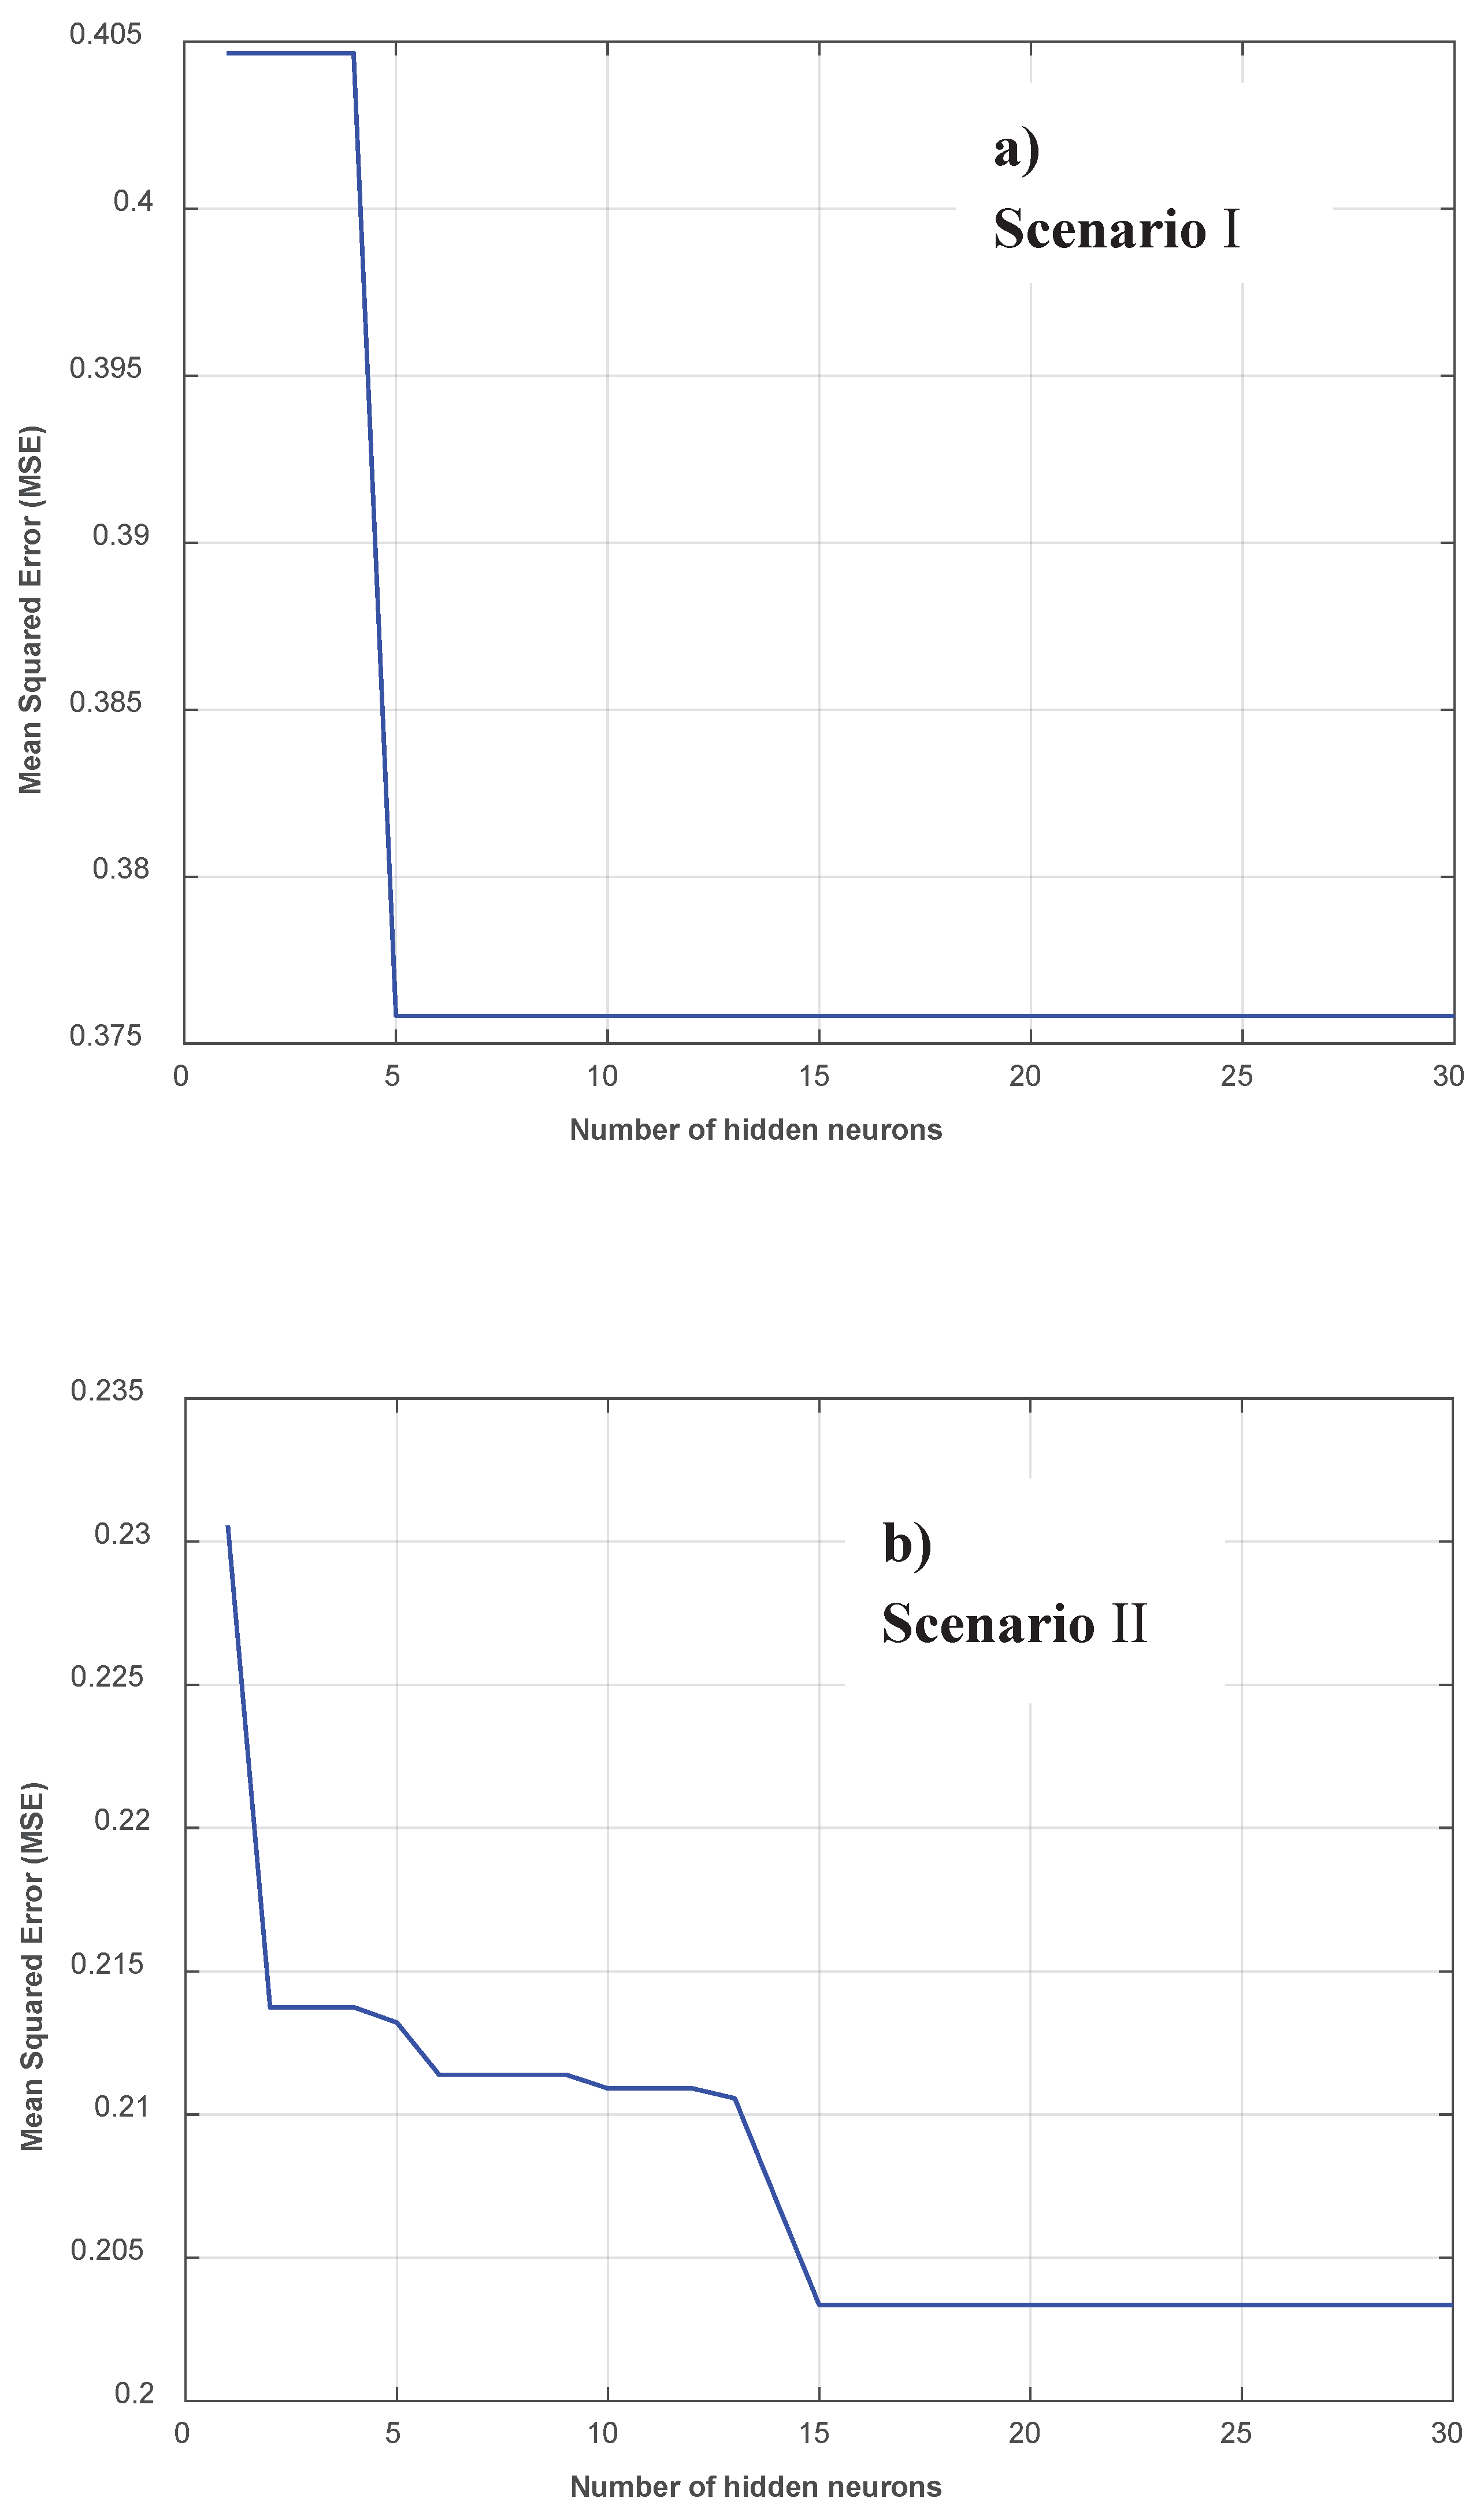
To determine the optimal number of neurons in the hidden layer, 80% of the data was used for training the network, and 20% was used for testing. This process was repeated for 100 different randomly selected training and testing datasets, and the Mean Squared Error (MSE) value was calculated. This process was repeated in a loop from 1 to the maximum number of neurons, which is 30 in this study, and the number of neurons that yielded the minimum MSE value was selected as the optimal number of neurons, and the analyses were conducted accordingly.
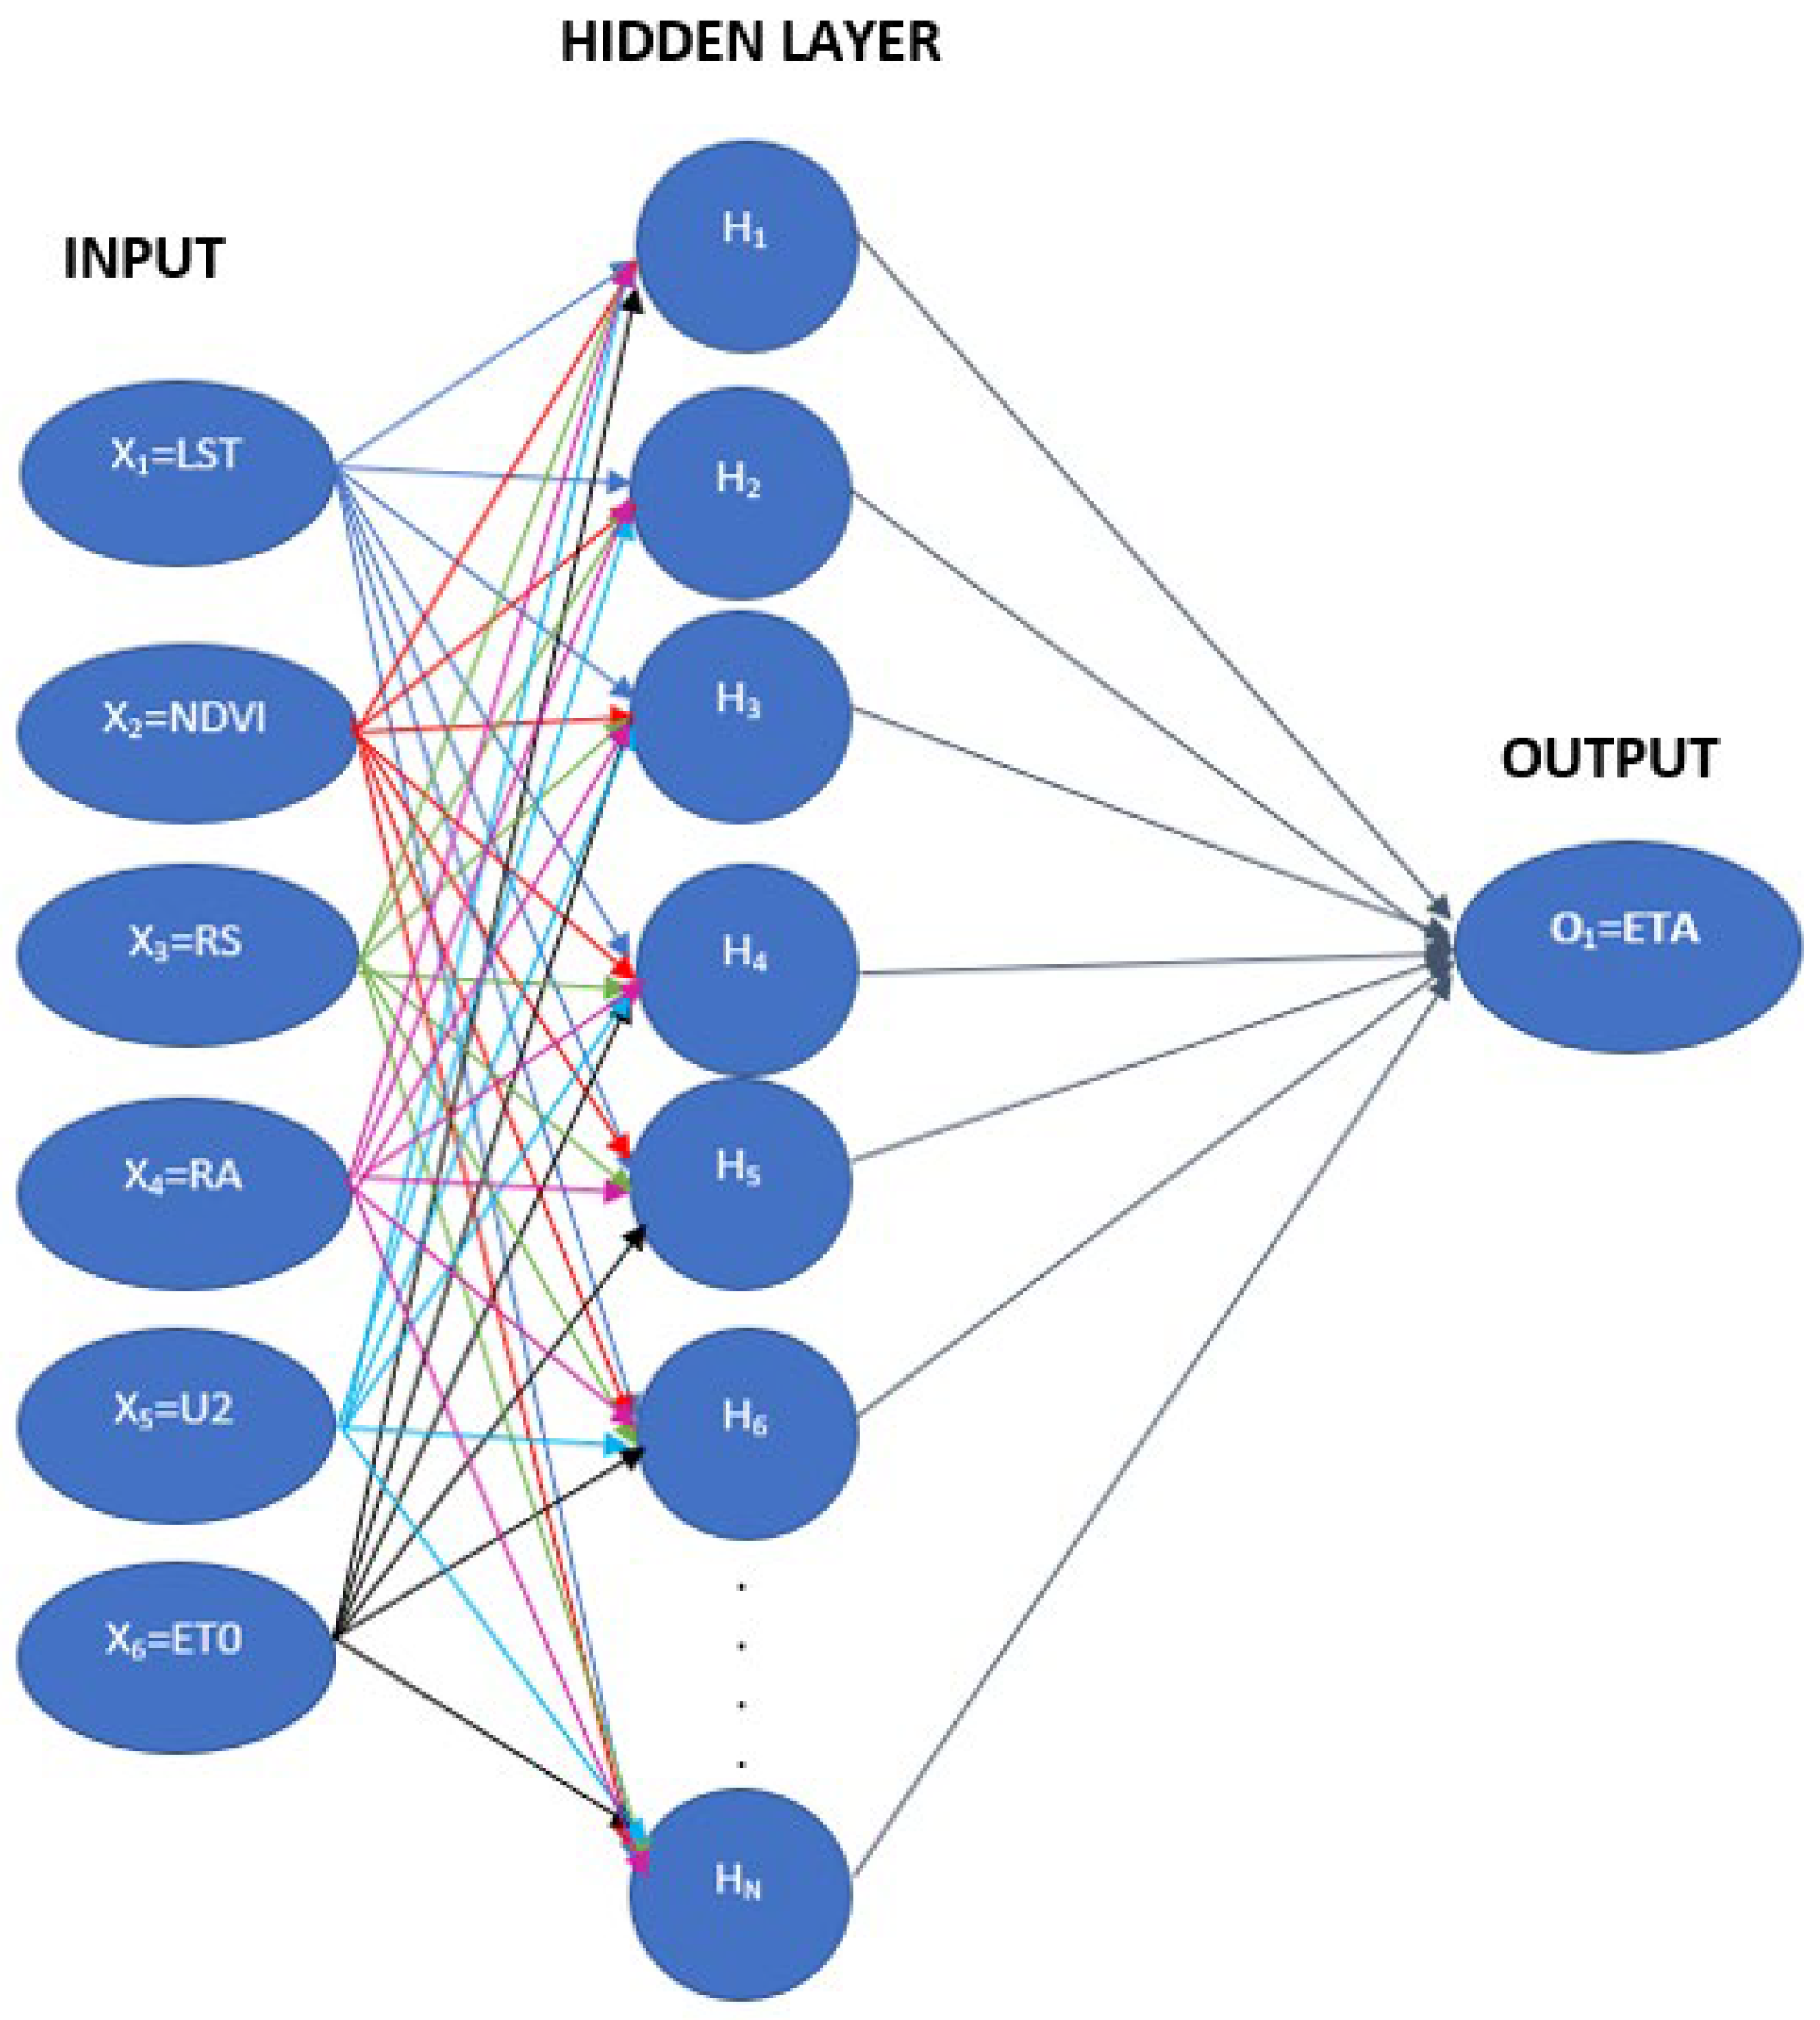
Figure 2 illustrates the typical structure of multi-layer ANNs. The input layer consists of 6 nodes, 4 parameters acquired by the two meteorological stations (
Figure 1) installed in the study area and two variables downloaded from MODIS satellite data. In situ-climatic observations are solar radiation (Rs), extraterrestrial radiation (Ra), wind speed (u2) at 2 m height, and the reference evapotranspiration values, i.e., ETo, were calculated by the standard FAO-Penman-Monteith approach through following Allen et al. (1998). The connections between the input layers and 30 hidden layers take different weights and are trained depending on the required output of daily ETa.
3. Results
3.1. Implementation of the ANN Model
The ANN model has been applied to two different scenarios. In the training of Scenario I, data from only the 38 days of satellite observations listed in
Table 1 were used, while the data from the other days were used as test data. In Scenario II, 80% of the total data set was used for training, and the remaining 20% was used for testing.
For both scenarios, firstly, the network architecture was created, and the change in the MSE value concerning the number of neurons is presented in
Figures 3a and 3b. As seen from
Figure 3, the optimum number of neurons obtained for Scenario I and II is 5 and 15, respectively.
3.1.1. Scenario I
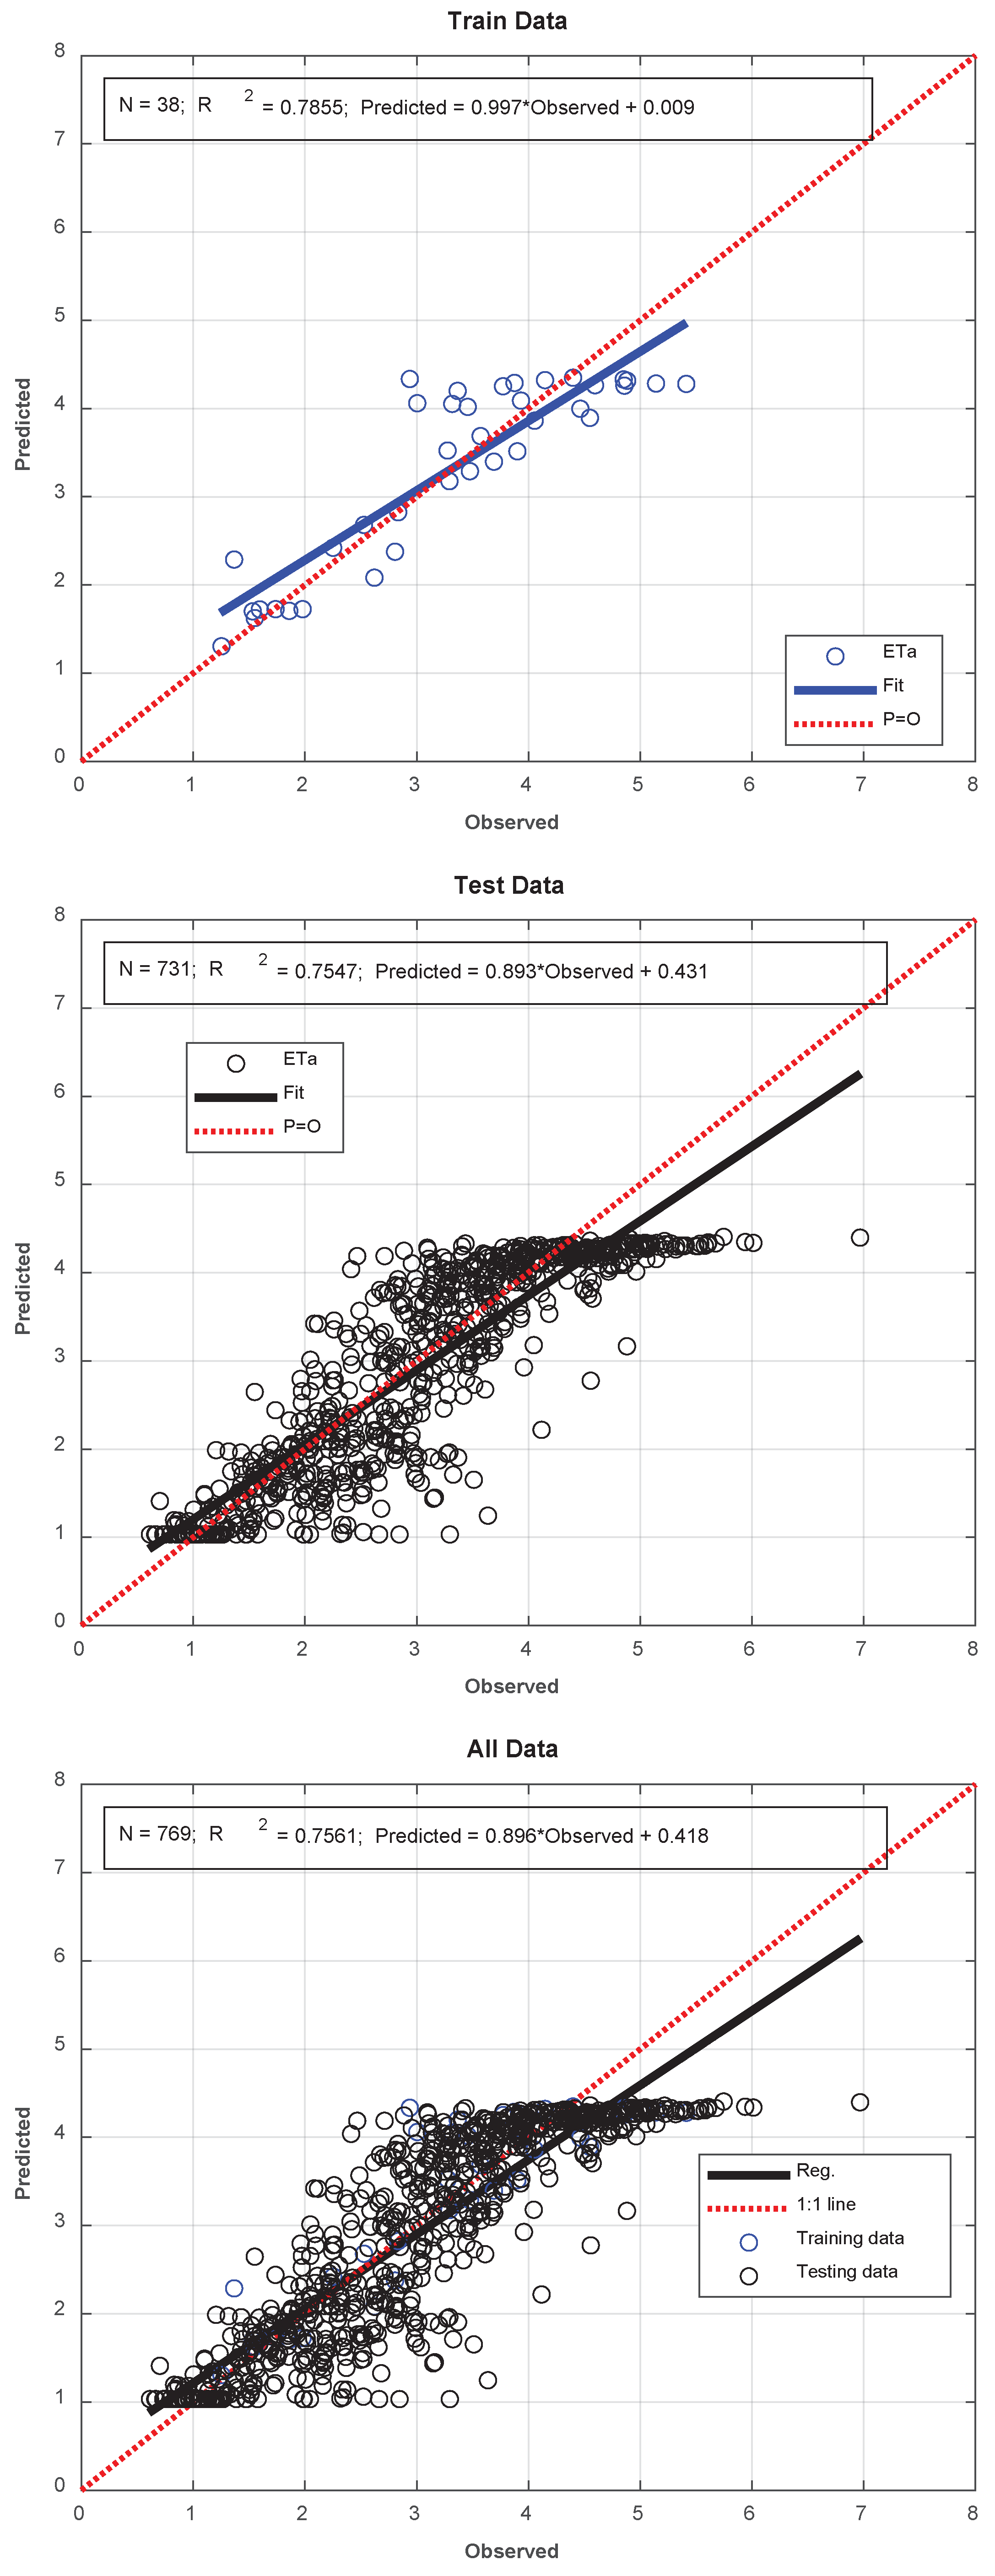
The developed model was applied to Scenario I, and the model results are summarized in
Figure 4. As seen from
Figure 4, even though the data used in the model training accounts for approximately 5% of the total data, the R-squared value is 0.7547 for the test data and 0.7561 for the total data. This indicates that the developed model has quite good with respect to the learning stage and prediction ability; however, it also shows an increased error rate in predicting high ETa values. This result is a natural consequence of the need for a substantial amount of data for ANN models to learn complex relationships in complex problems, as mentioned above. In the following section, this situation will be evaluated in more detail.
3.1.2. Scenario II
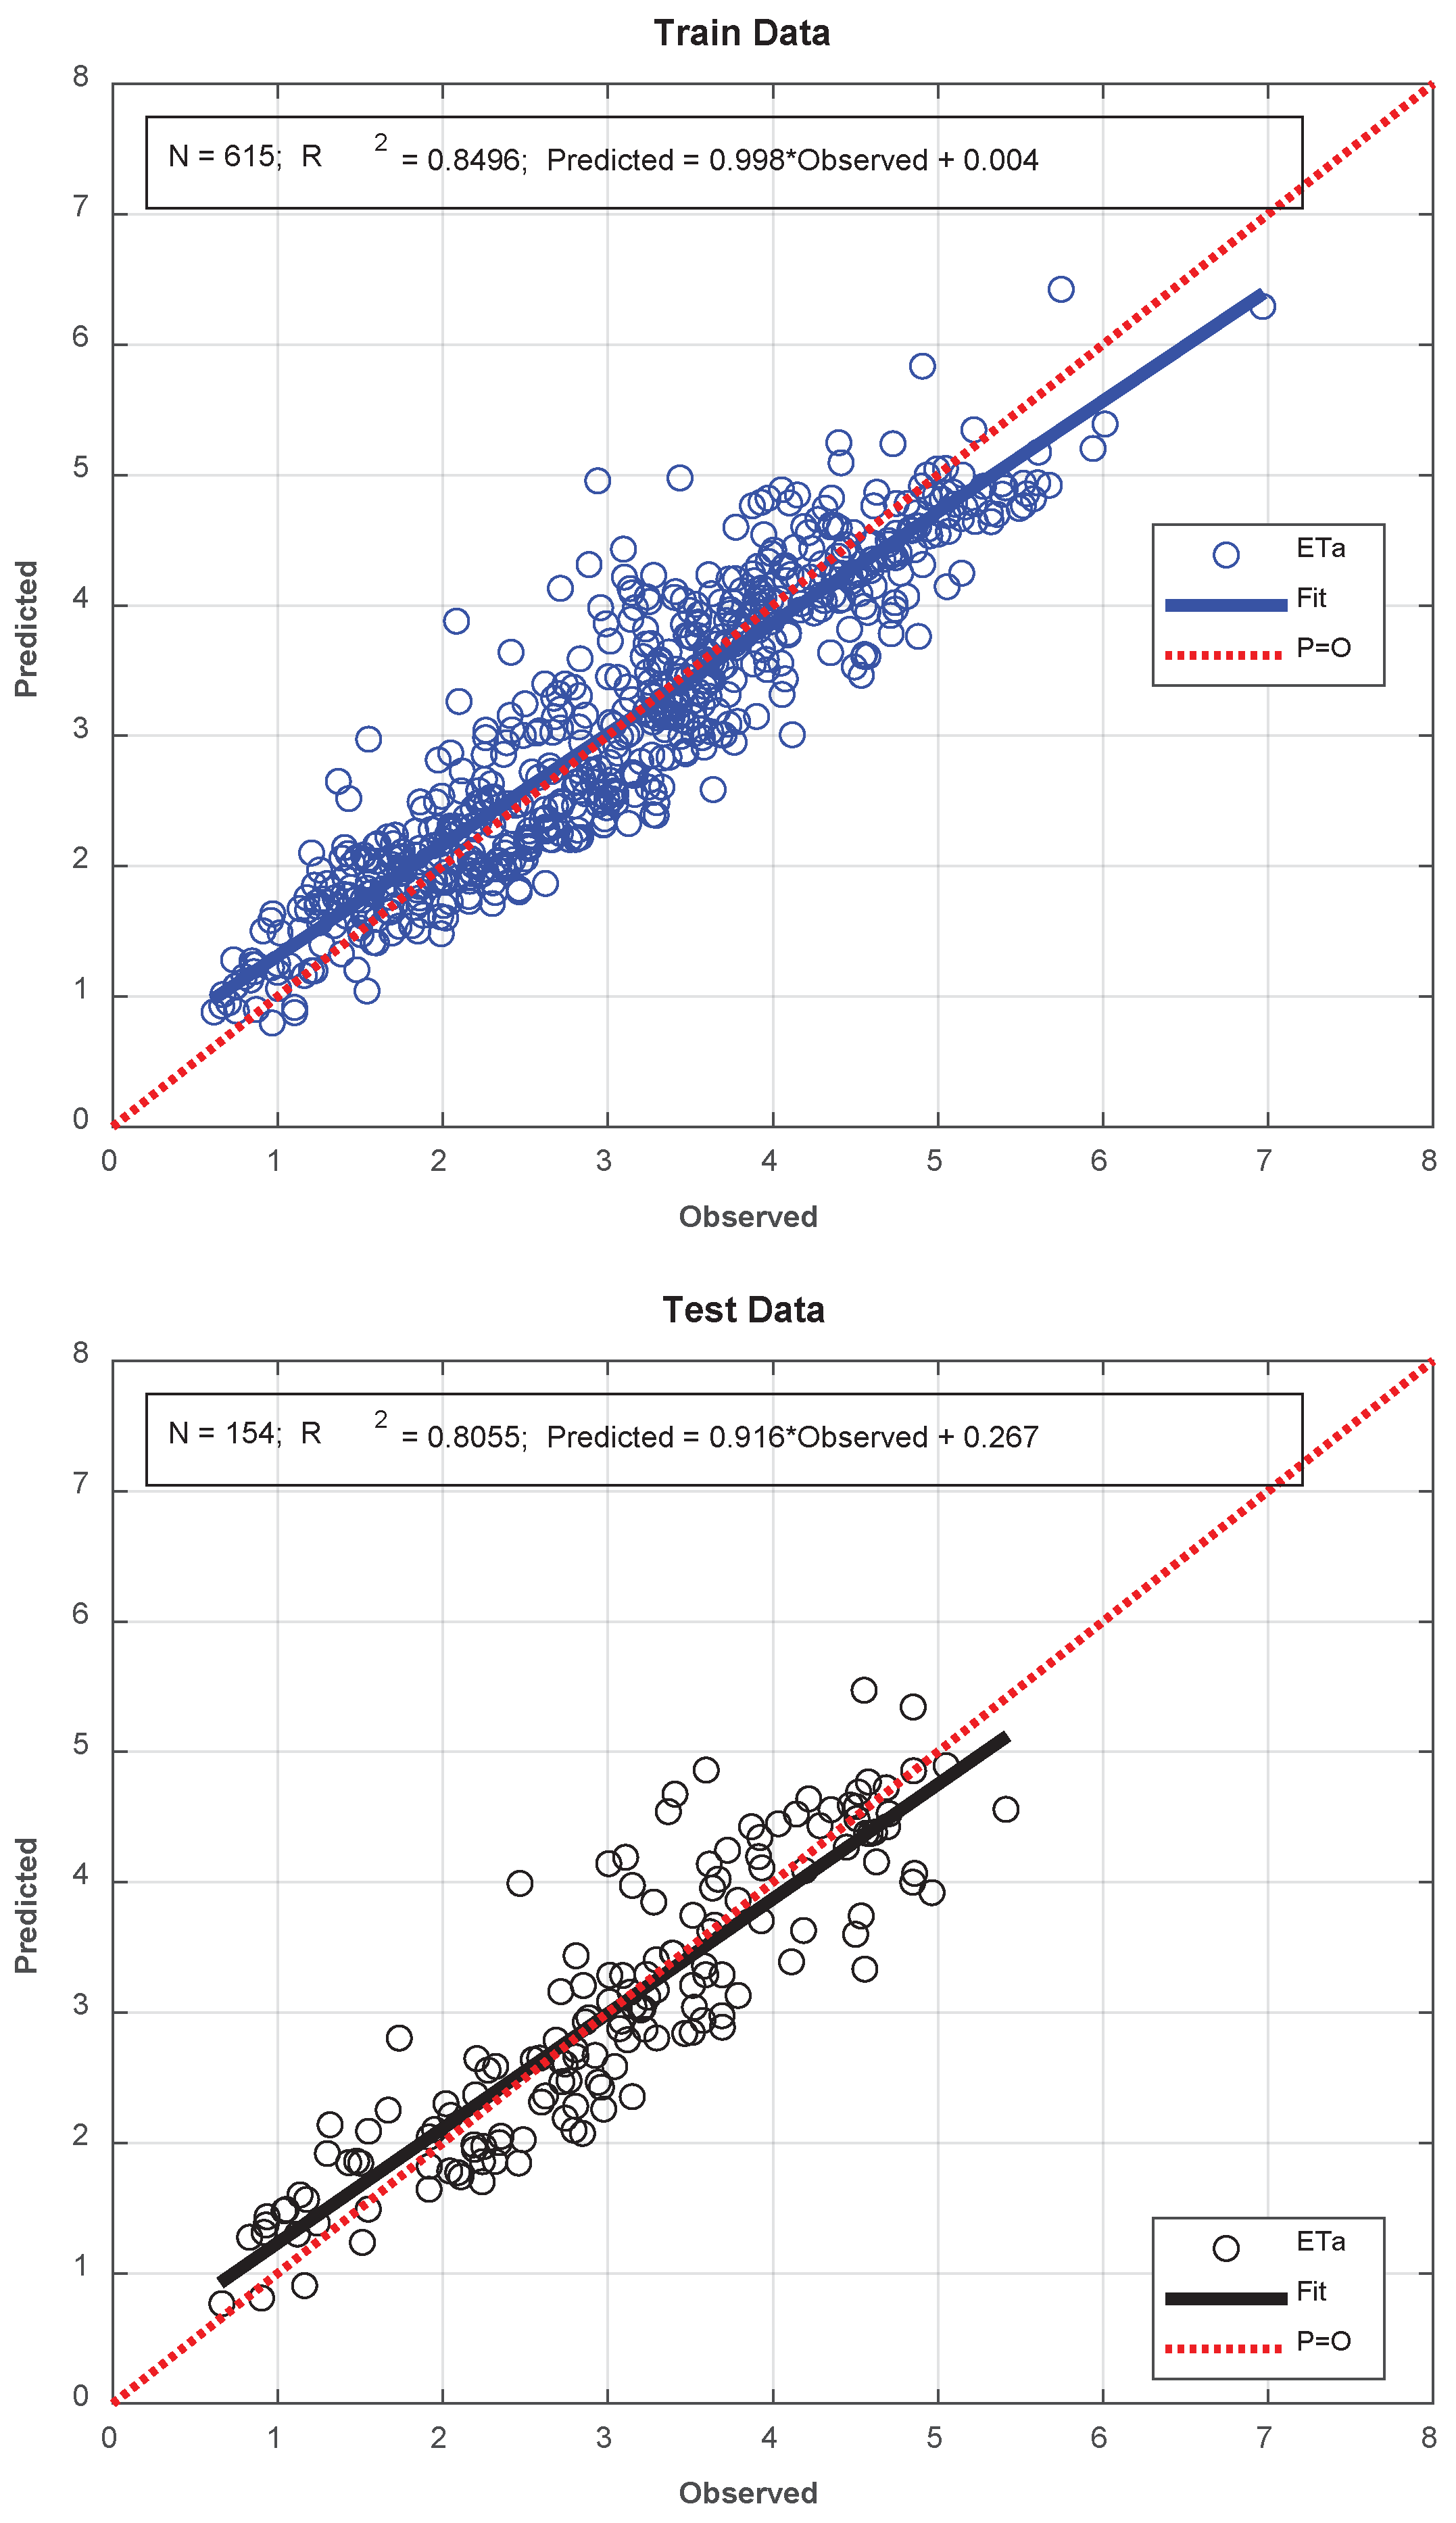
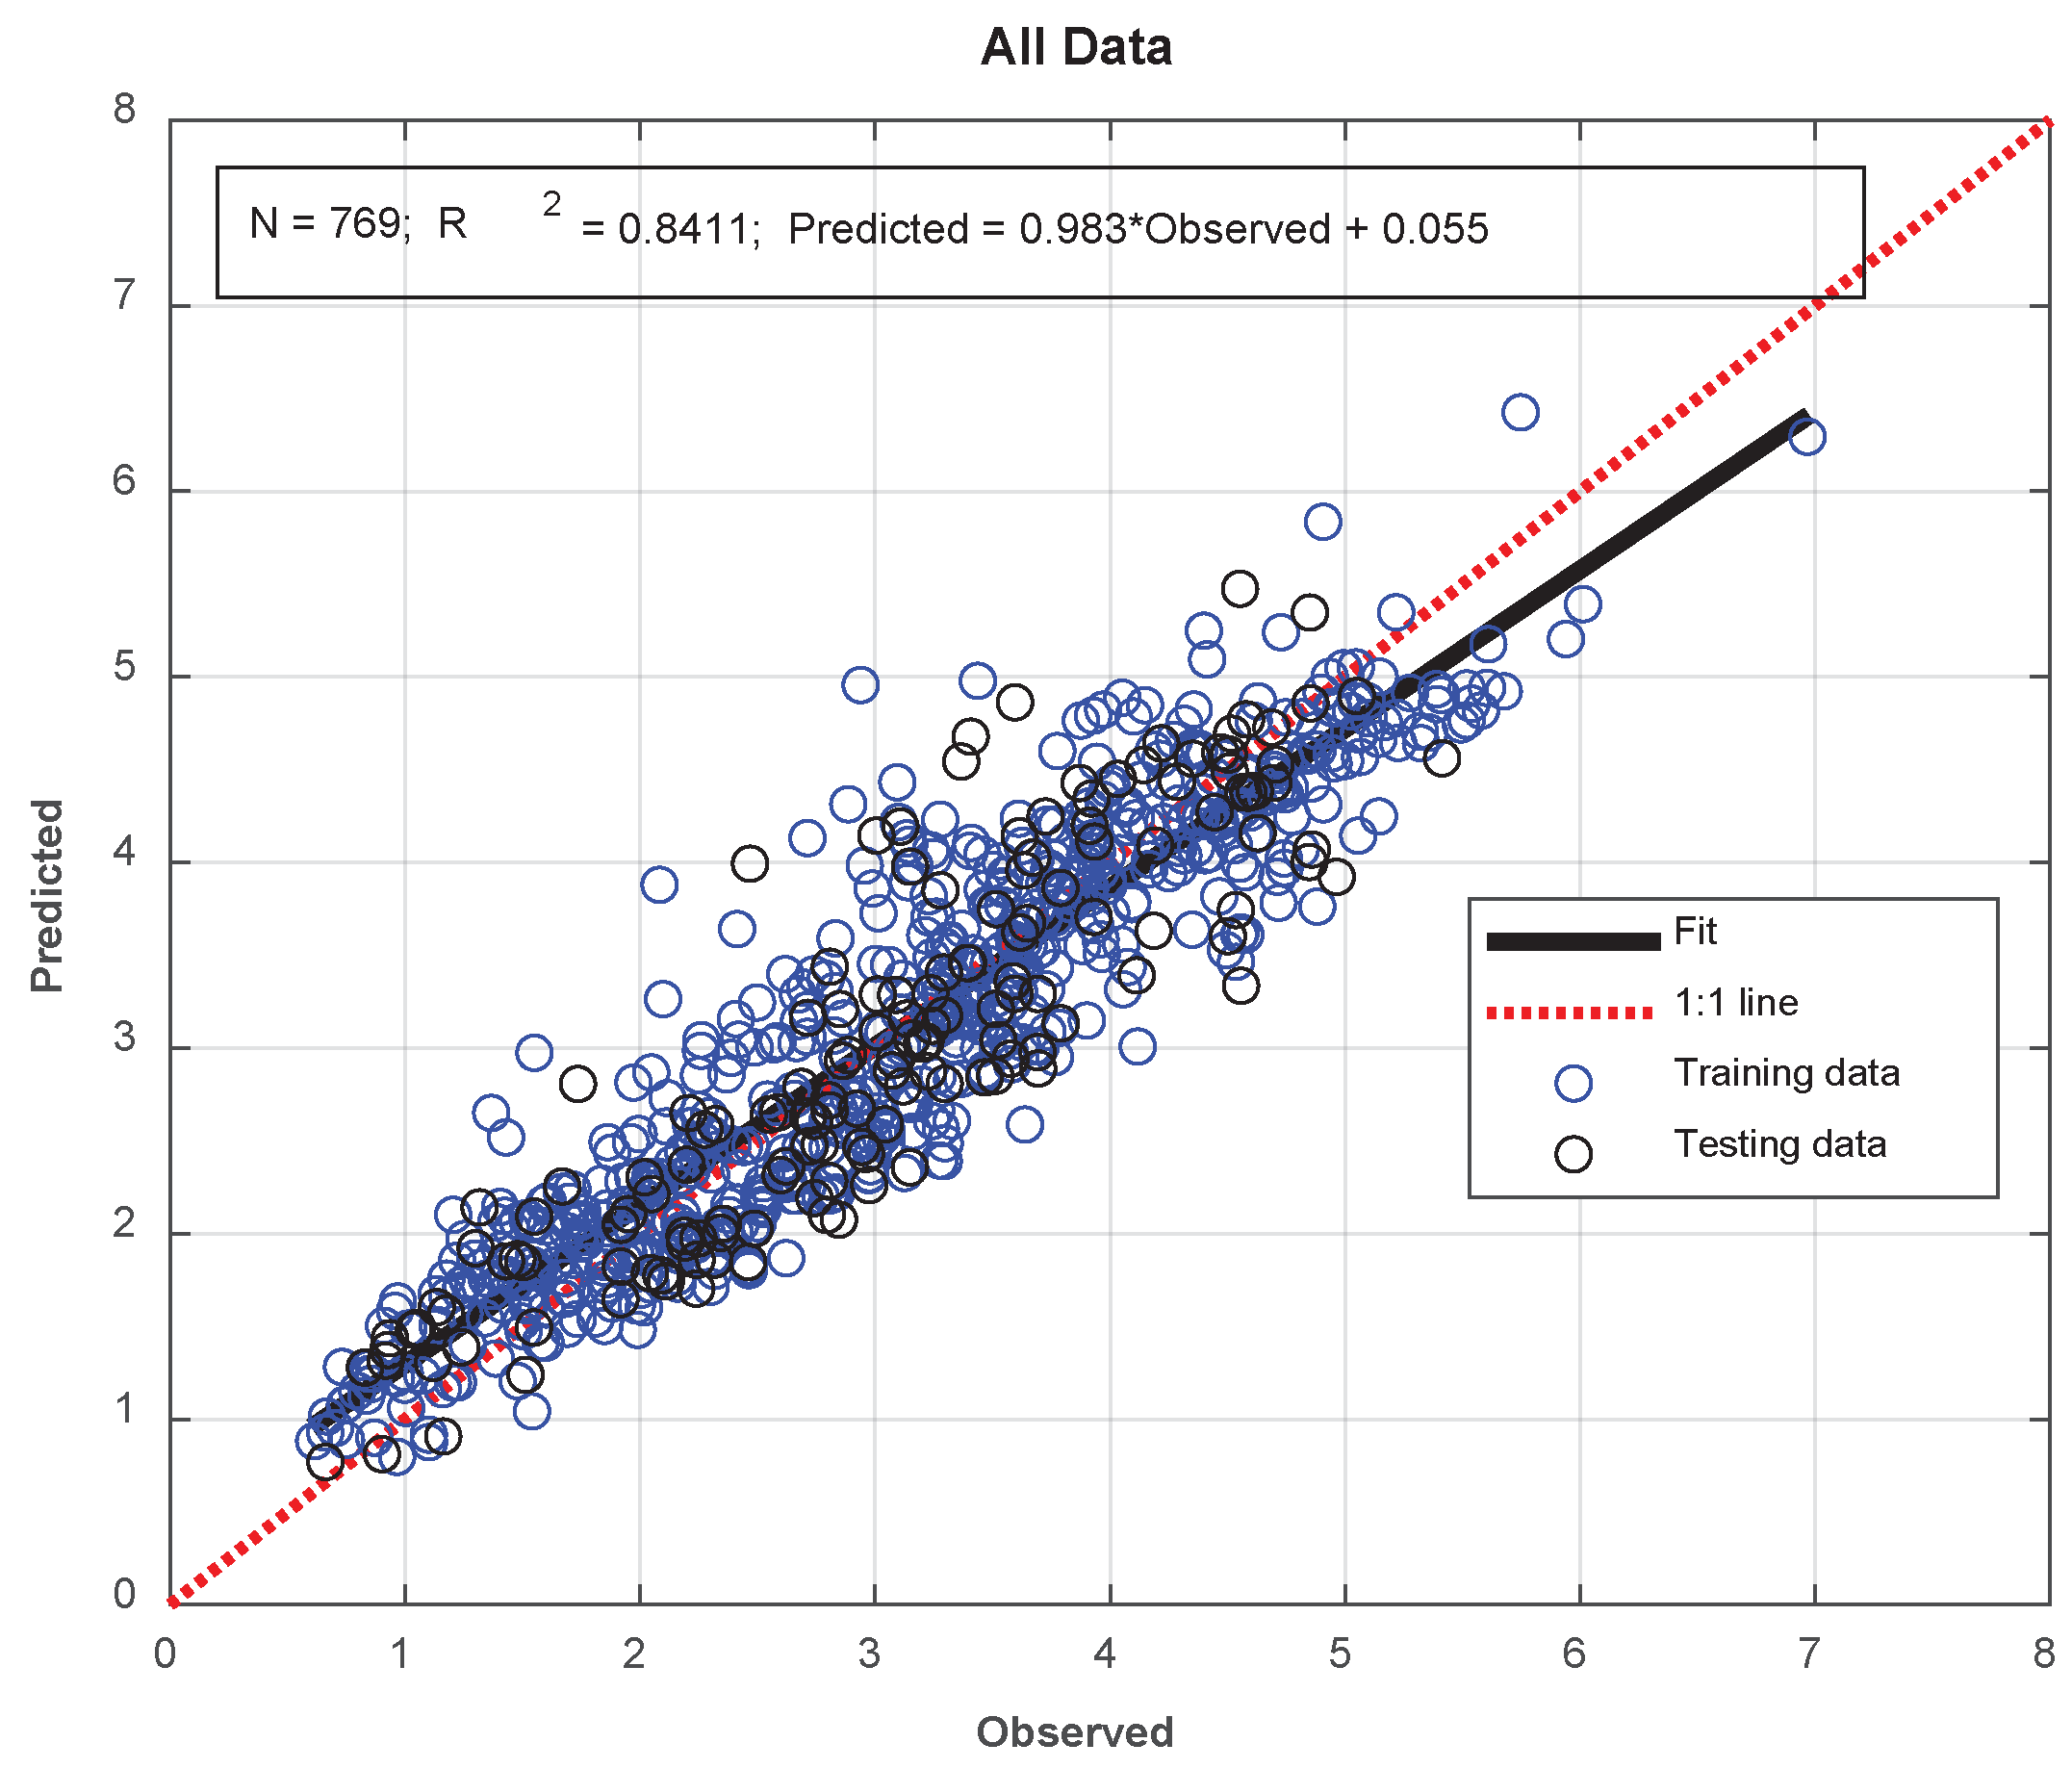
Figure 5 shows the model results of the developed model for Scenario II. As seen in
Figure 5, the number of data points used in the model training is 615, which constitutes 80% of the total data. During the training phase, the R-squared value is 0.8496, while for the test data, it is 0.8055, and for the total data, it is 0.8411. These results indicate that the developed model has a very good learning and prediction ability.
4. Discussion
The primary objective of this study was to develop a methodology for estimating daily ETa values for large irrigation areas based on artificial neural networks using some parameters of MODIS data and climatic variables with ETo values. It is important to highlight that ETo estimations will be an easy task provided that climatic data required by the standard FAO-Penman-Monteith approach are available at the study site. In our study, there are two meteorological stations for collecting data. However, the problem is that Landsat satellite images are available with a 16-day repeat cycle. Therefore, ETa values for the days of no satellite overpass should be estimated by using an appropriate methodology such as ANNs. To this end, the developed methodology consists of two main parts. In the first stage of the methodology, daily ETo values calculated using the FAO-Penman-Monteith approach detailed in Allen et al. (1998) are combined with MODIS data to create the input data for the model. These values are based on observations from a meteorological station established in the study area. Additionally, observed ETa values are calculated based on Allen et al. (2007a, 2007b) using L8 and Cotlu meteorological station data for each pixel at satellite overpass times and other times. This completes the data set required for the training and testing stages of the developed ANN model.
After completing the data set, calculations are performed in two different scenarios. In Scenario I, only data acquired for the days with satellite imagery are used for model training, while in Scenario II, a randomly selected 80% portion of the total data set is used. It should be noted that the input and output layers of both scenarios are the same, as shown in
Figure 2. The optimal number of neurons in the hidden layer is determined to be 5 for Scenario I and 15 for Scenario II, as detailed in the previous section. After determining the appropriate network architecture, detailed analyses were conducted for both scenarios.
In the model training, the goal was to minimize the MSE values as the objective function, and the results obtained for training, testing, and the entire dataset were provided graphically in the previous section. In the relevant graphs, the number of data points used, the R2 value, and the regression relationships between predicted values and observed values are presented.
As seen in
Figure 4, in Scenario I, even though approximately 5% of the total dataset was used for model training, high R
2 values of 0.7855, 0.7547, and 0.7561 were achieved for training, testing, and the entire dataset, respectively. However, it can be observed from the relevant graphs that despite the overall high model performance, the model’s prediction ability in Scenario I decreases unexpectedly if the ETa values are around 4 mm day
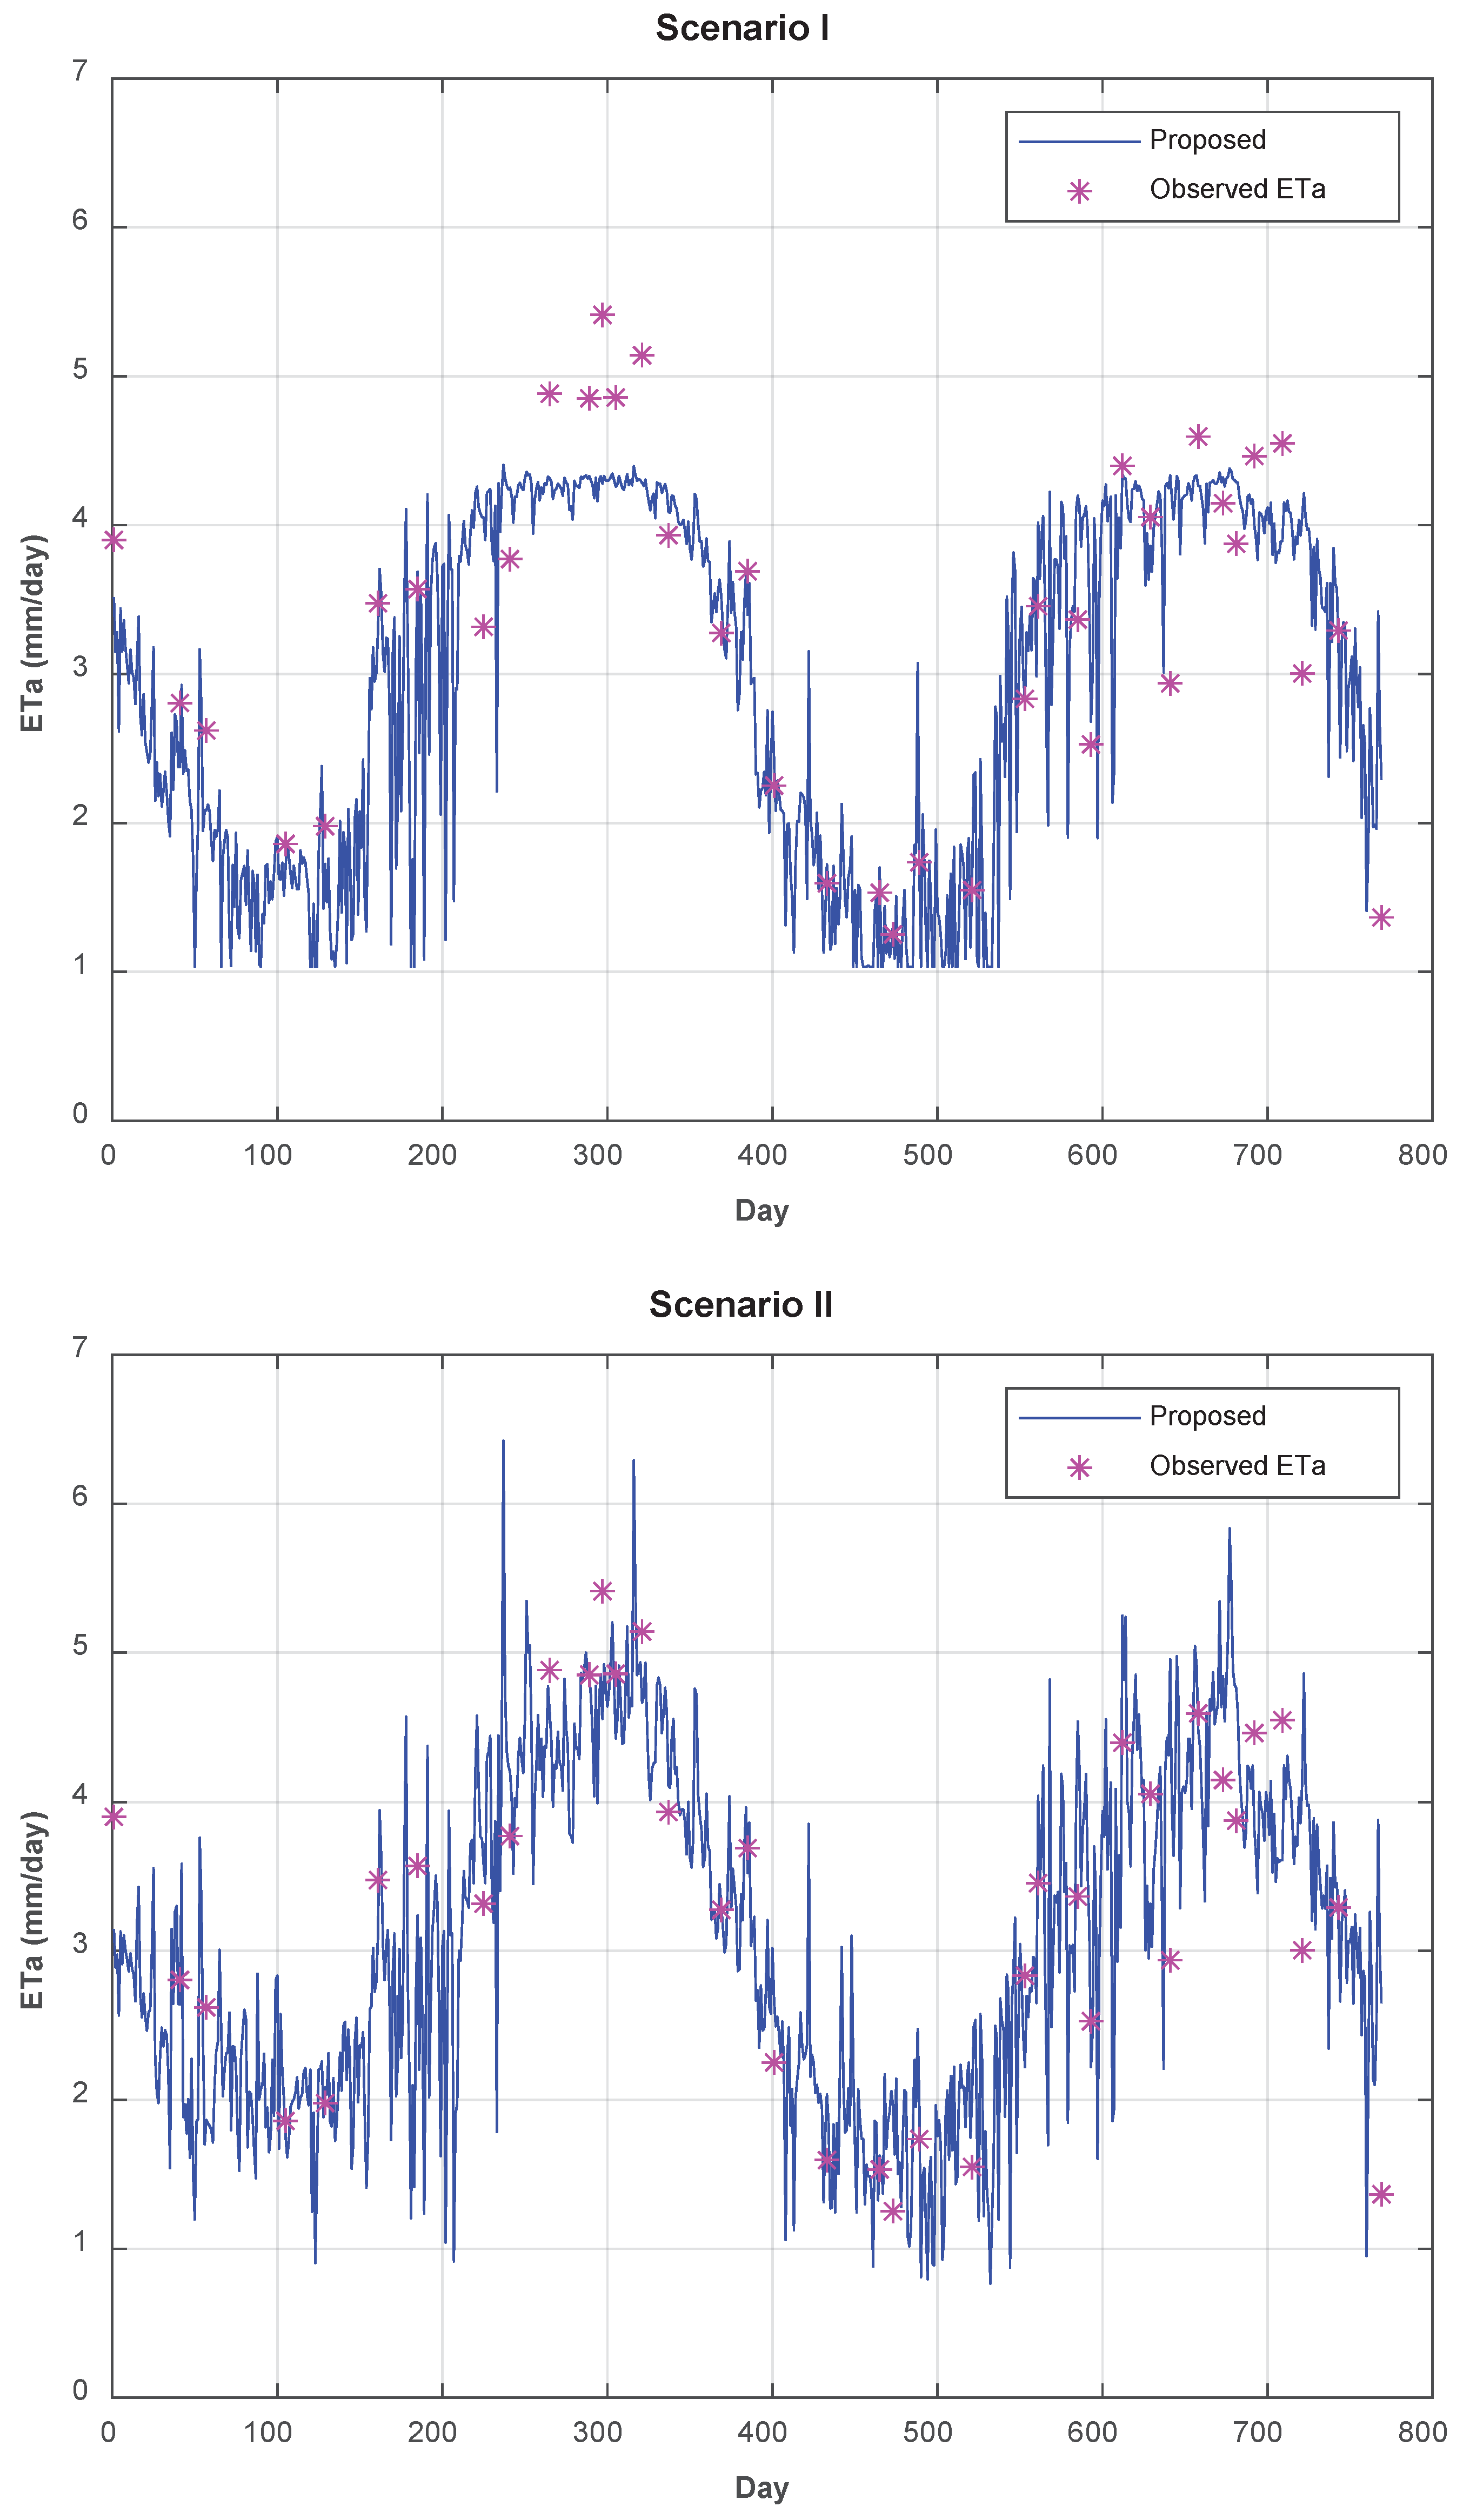
-1 or greater, indicating conspicuous underestimates at high for high actual evapotranspiration rates. In Scenario I, the model fails to mimic the high actual evapotranspiration rates. This can be seen more clearly in
Figure 6, where the model results are presented graphically for both scenarios in comparison with ETa values calculated based on Allen et al. (2007a, 2007b). As clearly visible in the respective Figure, although the general trend is captured in both scenarios, it is noteworthy that the error rate in predicting values, especially those greater than 4, increases in Scenario I. It is believed that this is due to the low number of satellite observations (only 38 daily data) available for training the ANN model. Scatter plots provided in
Figure 5 for Scenario II, as well as the temporal ETa values presented in
Figure 6, support this hypothesis. Most studies in the literature also support this argument by allocating 80% of the total dataset for training and the remaining 20% for testing when training ANN models.
5. Conclusions
This study presents a novel approach that allows daily ETa estimation using a new ANN model in a large-scale irrigation scheme using limited climatic data and MODIS satellite data. The study demonstrated that the daily ETa predicted values are comparable with the ETa which is estimated by the RS-based surface energy balance models. Furthermore, this methodology is the first attempt to generate a new model using the ANN algorithm as an alternative to the existing methods of ETa estimation in a large-scale irrigation district in the Eastern Mediterranean Region of Turkiye. In this context, the results of the new model in two implemented scenarios in this study showed acceptable agreement with ETa values estimated by the METRIC model at the large irrigation scale. Thus, this work is considered a significant contribution to obtaining reliable results without the need for lengthy and labor-intensive processes for complex equations as in RS-based surface energy balance models. This study revealed that the proposed model is a powerful tool for estimating daily actual ET using the limited meteorological observations and some of the parameters of remote sensing in arid and semi-arid regions as well as in different climate regions and zones of the world.
Research Impact Statement: The proposed methodology is promising to generate a new ANN model for estimating daily ETa as an alternative to the conventional ETa estimation procedures in large-scale irrigation schemes.
Data Availability: Data is available on request from the authors.
Acknowledgments
The authors thank the Scientific and Technological Research Council of Turkiye [TUBITAK, Project number: 122Y007] and the Scientific Research Projects (BAP) Coordination Unit of Cukurova University [Project Number: FDK-2022-14907] for getting financial support for this work.
Declarations: Conflict of interest The authors declare that they have no competing interests.
References
- Abrishami N, Sepaskhah A.R, Shahrokhnia, M.H (2019) Estimating wheat and maize daily evapotranspiration using artificial neural network. Theoret. Appl. Climatol. 135 (3), 945–958. [CrossRef]
- Allen R, Tasumi M, Morse A, Trezza R, Wright J.L, Bastiaanssen W, Kramber W, Lorite L, Robison C.W (2007a) Satellite-based energy balance for mapping evapotranspiration with internalized calibration, METRIC (applications). J Irrig Drain Eng 133:395–406.
- Allen R.G, Pereira L.S, Raes D, Smith M (1998) Crop evapotranspiration guidelines for computing crop water requirements, FAO Irrigation and Drainage Paper 56. FAO, Rome.
- Allen R.G, Tasumi M, Trezza R (2007b) Satellite-based energy balance for mapping evapotranspiration with internalized calibration, METRIC (model). J Irrig Drain Eng 133:380–394. [CrossRef]
- Alsenjar O, Cetin M (2023c) Comparison of actual evapotranspiration by the Google Earth Engine Evapotranspiration Flux (EEFlux) to the METRIC model using remote sensing data and in-situ climate observations. The 3rd International Conference on Research of Agriculture and Food Technologies (I-CRAFT-2023), October 04 06, 2023, Adana, Türkiye, Proceedings Book of the Abstracts and/or Full Texts for Oral Presentations, pp. 140-145.
- Alsenjar O, Cetin M, Aksu H, Akgul M.A, Golpinar M.S (2023a) Cropping Pattern Classification Using Artificial Neural Networks and Evapotranspiration Estimation in the Eastern Mediterranean Region of Turkey. Journal of Agricultural Sciences (Tarim Bilimleri Dergisi), 29(2):677-689. [CrossRef]
- Alsenjar O, Cetin M, Aksu H, Golpinar M.S, Akgul M.A (2023b) Actual evapotranspiration estimation using METRIC model and Landsat satellite images over an irrigated field in the Eastern Mediterranean Region of Turkey. Mediterranean Geoscience Reviews (2023) 5:35–49. [CrossRef]
- Antonopoulos V.Z, Antonopoulos A.V (2017) Daily reference evapotranspiration estimates by artificial neural networks technique and empirical equations using limited input climate. Computers and Electronics in Agriculture. 2017; 132: 86–96. [CrossRef]
- ASCE Task Committee on Application of Neural Networks in Hydrology (2000a) Artificial neural network in hydrology. I: preliminary concepts. J Hydrol Eng ASCE 5(2):115–123.
- ASCE Task Committee on Application of Neural Networks in Hydrology (2000b) Artificial neural network in hydrology. II: hydrologic application. J Hydrol Eng ASCE 5(2):124–137.
- Bachour R, Walker W, Ticlavilca A, McKee M, Maslova I (2014) Estimation of spatially distributed evapotranspiration using remote sensing and a relevance vector machine. Journal of Irrigation and Drainage Engineering, 140 (8): 04014029, 2014. [CrossRef]
- Bastiaanssen W.G.M, Menenti M, Feddes R.A, Holtslag A.A.M (1998a) A remote sensing surface energy balance algorithm for land (SEBAL): 1. Formul J Hydrol 212–213:198–212.
- Bastiaanssen W.G.M, Pelgrum H, Wang J, Ma Y, Moreno J.F, Roerink GJ, van der Wal T (1998b) A surface energy balance algorithm forland (SEBAL): 2. Validation. J Hydrol 212–213:213–229.
- Bhattarai N, Quackenbush L.J, Im J, Shaw S. B (2017) A new optimized algorithm for automating endmember pixel selection in the SEBAL and METRIC models. Remote Sensing of Environment, 196, 178-192. [CrossRef]
- Bruton J.M, McClendon R.W, Hoogenboom G (2000) Estimating daily pan evaporation with artificial neural networks. Trans ASABE 43: 491–496.
- Cetin M (2020) Agricultural Water Use. In Harmancioglu, N., Altinbilek, D. (Eds.), Water Resources of Turkey: World Water Resources, Vol. 2, Springer, Cham, 257-302.
- Cetin M, Alsenjar O, Aksu H, Golpinar M.S, Akgul M.A (2023b) Estimation of crop water stress index and leaf area index based on remote sensing data 2023. Water Supply 00:1. [CrossRef]
- Cetin M, Alsenjar O, Aksu, H, Golpinar M.S, Akgul, M.A (2023a) Comparing actual evapotranspiration estimations by METRIC to in-situ water balance measurements over an irrigated field in Turkey. Hydrological Sciences Journal. [CrossRef]
- Cetin M, Kaman H, Kirda C, Sesveren S (2020) Analysis of Irrigation Performance in Water Resources Planning and Management: A Case Study. Fresenius Environmental Bulletin (FEB), vol 29. 05: 3409-3414.
- Coppola Jr.E, Szidarovszky F, Poulton M, Charles E (2003) Artificial neural network approach for predicting transient water levels in a multilayered groundwater system under variable state, pumping, and climate conditions. Journal of hydrologic engineering, 8(6), 348-360.
- Daliakopoulos I.N, Coulibaly P, Tsanis I.K (2005) Groundwater level forecasting using artificial neural networks. Journal of hydrology, 309(1-4), 229-240.
- Dehbozorgi F, Sepaskhah A.R (2011) Comparison of artificial neural networks and prediction models for reference evapotranspiration estimation in a semi-arid region. Arch Agron Soil Sci 58:477–497.
- Ferreira L.B, Cunha F.F (2020) New approach to estimate daily reference evapotranspiration based on hourly temperature and relative humidity using machine learning and deep learning. Agricultural Water Management. 2020; 234: 106–113. [CrossRef]
- Garcia L. A, Shigidi, A. (2006) Using neural networks for parameter estimation in groundwater. Journal of Hydrology, 318(1-4), 215-231.
- Gharbia S.S, Smullen T, Gill L, Johnston P, Pilla F (2018) Spatially distributed potential evapotranspiration modeling and climate projections. Sci Tot Environ 633:571–592. [CrossRef]
- Granata F (2019) Evapotranspiration evaluation models based on machine learning algorithms: A comparative study. Agricultural Water Management. 2019; 217: 303–315. [CrossRef]
- Jain S.K, Nayak P.C, Sudheer K.P. (2008) Models for estimating evapotranspiration using artificial neural networks, and their physical interpretation. Hydrological Processes: An International Journal, 22(13), 2225-2234
.
- Karahan H, Ayvaz M.T (2006) Forecasting aquifer parameters using artificial neural networks. J Porous Media 9(5):429–444.
- Karahan H, Ayvaz M.T (2008) Simultaneous parameter identification of a heterogeneous aquifer system using artificial neural networks. Hydrogeology Journal, 16, 817-827.
- Karahan H, Iplikci S, Yasar M, Gurarslan G (2014) River flow estimation from upstream flow records using support vector machines. Journal of Applied Mathematics, 2014.
- Khoshhal J, Mokarram M (2012) Model for prediction of evapotranspiration using MLP neural network. Inter J Environ Sci 3:1000–100.
- Kumar M, Raghuwanshi N, Singh R, Wallender W, WO P (2002) Estimating evapotranspiration using artificial neural network. J Irrig Drain Eng 128:224–233.
- Kumar M, Raghuwanshi N.S, Singh R (2011) Artificial neural networks approach in evapotranspiration modeling: a review. Irrig Sci 29(1):11–25. [CrossRef]
- Luk K.C, Ball J.E, Sharma A (2000) A study of optimal model lag and spatial inputs to artificial neural network for rainfall forecasting. Journal of Hydrology, 227(1-4), 56-65.
- Madugundu R, Al-Gaadi K.A, Tola E, Hassaballa A.A, Patil V.C (2017) Performance of the METRIC model in estimating evapotranspiration fluxes over an irrigated field in Saudi Arabia using Landsat-8 images. Hydrology and Earth System Sciences. 2017; 21: 6135–6151. [CrossRef]
- Maier H. R, Dandy G.C (2000) Neural networks for the prediction and forecasting of water resources variables: a review of modelling issues and applications. Environmental modelling software, 15(1), 101-124.
- Mattar M.A (2018) Using gene expression programming in monthly reference evapotranspiration modeling: a case study in Egypt. Agricultural Water Management. 2018; 198: 28–38. [CrossRef]
- Odhiambo L.O, Yoder R.E, Yoder D.C, Hines J.W (2001) Optimization of fuzzy evapotranspiration model through neural training with input–output examples. Trans ASABE 44:1625–1633.
- Rawat K.S, Bala A, Singh S.K, Pal R.K (2017) Quantification of wheat crop evapotranspiration and mapping: a case study from bhiwani district of Haryana, India. Agric Water Manag 187:200–209. [CrossRef]
- Singh R.K, Irmak A (2011) Treatment of anchor pixels in the METRIC model for improved estimation of sensible and latent heat fluxes, Hydrological Sciences Journal, 56:5, 895-906. [CrossRef]
- Su Z (2002) The surface energy balance system (SEBS) for estimation of turbulent heat fluxes. Hydrol Earth Syst Sci 6:85–100.
- Tang D, Feng Y, Gong D, Hao W, Cui N (2018) Evaluation of artificial intelligence models for actual crop evapotranspiration modeling in mulched and non-mulched maize croplands. Computers and Electronics in Agriculture. 2018; 152: 375–384. [CrossRef]
- Tikhamarine Y, Malik A, Kumar A, Souag-Gamane D, Kisi O (2019) Estimation of monthly reference evapotranspiration using novel hybrid machine learning approaches. Hydrological Sciences Journal. 2019; 64: 1824–1842. [CrossRef]
- Virnodkar S.S, Pachghare V.K, Patil V.C, Jha S.K (2020) Application of Machine Learning on Remote Sensing Data for Sugarcane Crop Classification: A Review. In: Fong, S., Dey, N., Joshi, A. (eds) ICT Analysis and Applications. Lecture Notes in Networks and Systems, vol 93. Springer, Singapore. [CrossRef]
- Yamac S.S, Todorovic M (2020) Estimation of daily potato crop evapotranspiration using three different machine learning algorithms and four scenarios of available meteorological data. Agric. Water Manag. 228, 105875.
- Zhang X.C, Wu J.W, Wu H.Y, Li Y (2011) Simplified SEBAL method for estimating vast areal evapotranspiration with MODIS data. WaterSci Eng 4:24–35. [CrossRef]
|
Disclaimer/Publisher’s Note: The statements, opinions and data contained in all publications are solely those of the individual author(s) and contributor(s) and not of MDPI and/or the editor(s). MDPI and/or the editor(s) disclaim responsibility for any injury to people or property resulting from any ideas, methods, instructions or products referred to in the content. |
© 2024 by the authors. Licensee MDPI, Basel, Switzerland. This article is an open access article distributed under the terms and conditions of the Creative Commons Attribution (CC BY) license (http://creativecommons.org/licenses/by/4.0/).
