
Submitted:
09 February 2024
Posted:
12 February 2024
You are already at the latest version
Abstract
Mutations in epidermal growth factor receptor (EGFR) occur in about 48% of Asian and 19% of Western patients with lung adenocarcinoma (LUAD), leading to its constitutive activation and subsequent uncontrolled cell proliferation. To counteract this, tyrosine kinase inhibitors (TKIs) have been developed, targeting EGFR activity. However, the emergence of metastases and resistance mutations often undermines the durability of the treatment response. Knowledge-based mechanistic models that replicate existing clinical trial outcomes, tailored to specific population characteristics, provide invaluable assistance in designing future clinical trials. These models are particularly effective in identifying optimal responders to specific treatments, thereby enhancing therapeutic efficacy. We have developed physiologically based pharmacokinetic (PBPK) models for gefitinib and osimertinib, representing two distinct generations of EGFR TKIs, to accurately simulate the drugs’ distribution within the primary tumor and metastatic sites following oral administration. These models were integrated with a pathophysiological mechanistic model of EGFR-mutant LUAD, enabling the representation of the effects of both gefitinib and osimertinib on EGFR activation-induced signaling pathways. This comprehensive model outputs detailed evolutions of the primary tumor and each metastatic site, facilitating the evaluation of patient progression in alignment with RECIST guidelines (version 1.1). Notably, the model encapsulates the heterogeneity within the tumor, through the representation of various subclones, each characterized by unique mutation profiles, thereby reflecting differential responses to treatment. Calibration of the model was achieved using publicly available data from the NEJ002 and FLAURA clinical trials. Rigorous visual predictive checks and statistical tests were employed to ensure the proper behavior of the model. The model adeptly replicated the time to progression observed in real clinical trials in EGFR-mutant LUAD patients receiving gefitinib or osimertinib as first-line therapy. In addition, the model was able to reproduce the results from a retrospective study comparing gefitinib and osimertinib, a study that was not used to inform the model. With a consistent virtual population as a reference, the combined model facilitated a comparative analysis of the efficacy of both treatments, thereby underscoring its utility in evaluating therapeutic strategies. The faithful replication of real-world data significantly enhances the credibility of our model, rendering it a vital investigational tool for deriving pertinent insights and informing treatment strategies, particularly in identifying optimal responders to various generations of EGFR TKIs. Following its consecutive prospective validations in the FLAURA2 and MARIPOSA trials, the model is poised to facilitate the generation of synthetic control arms in future clinical trials. This advancement promises a more nuanced analysis of covariate relationships, especially when comparing investigational treatments to established standards of care. Additionally, it potentially reduces the required patient cohort size in such trials, optimizing resource utilization.
Keywords:
Lung adenocarcinoma
; EGFR TKI
; precision oncology
; in silico
; computational oncology
1. Introduction
Lung cancer remains the leading cause of cancer-related deaths globally, with over 1.8 million deaths and 2.2 million new cases yearly [1]. The high mortality rate is largely attributed to late-stage diagnosis despite advances in screening [1]. Non-small cell lung cancer (NSCLC) constitutes 80% of cases, with about 40% being lung adenocarcinoma (LUAD) [2]. Driver mutations, like the mutation of the epidermal growth factor receptor (EGFR) gene, prevalent in 48% of Asian and 19% of Western LUAD patients, play a crucial role in tumor growth and invasiveness [3]. EGFR mutations, commonly either the exon 21 L858R insertion or deletion on exon 19, trigger uncontrolled activation of the EGFR receptor, promoting cancer cell growth and survival [4]. This understanding has led to targeted therapies focusing on these driver mutations, offering an alternative to traditional chemotherapy. Targeted therapies specifically target driver mutations and disrupt their ability to drive tumor proliferation and metastasis’ apparition. Since 2015, EGFR tyrosine kinase inhibitors, which compete with ATP at the intracellular kinase domain of EGFR, inhibiting its auto-phosphorylation and constitutive downstream pathways’ activation, have been approved by the Food and Drug Administration (FDA) to treat LUAD patients with an EGFR driver mutation. The first generation TKIs, namely erlotinib and gefitinib, are reversible inhibitors meaning that once the drug unbinds its target, the effects of the drug disappear, in contrary to second generation TKIs afatinib and dacomitinib that are irreversible inhibitors. Osimertinib, a third generation TKI, was later developed to overcome resistance to 1st and 2nd generation EGFR TKIs, as it targets both common EGFR mutations and the T790M resistance mutation, an EGFR mutation on exon 20 that frequently appears during treatment with 1st or 2nd generation TKIs and that causes resistance to these treatments [5] . Despite these advancements in targeted therapies, predicting patient response to specific EGFR-TKIs remains a challenge , especially because resistance to treatment is almost inevitable [6]. This lack of response predictability underscores the need for more refined decision-making tools in clinical practice. Here, we propose the application of a Knowledge-Based Model (KBM) as a potential solution [7]. The KBM can simulate the responses of a specific patient population to different TKIs targeting the same receptor, thereby enabling comparative analysis of various treatment strategies and sequences and offering insights into optimal patient-specific therapeutic approaches. To achieve this, we refined a KBM named ISELA-V1, that we previously developed [8] and which mechanistically represents the main biological phenomena related to EGFR-mutant LUAD disease, and combined it with physiologically-based pharmacokinetics models of osimertinib and gefitinib that incorporate data on these two EGFR TKIs and their mode of action. Using this updated model, named ISELA-V2, we simulated responses to both EGFR TKI in the same patient population and compared the outcomes and efficacy of both treatments. This article details the methodology behind this approach and demonstrates how it can be used to inform treatment choices, filling the gaps in the current understanding of differential treatment responses and potentially guiding more effective clinical decision-making for LUAD patients.
2. Materials and Methods
2.1. Construction of the ISELA-V2 Model
In order to evaluate the impact of a treatment on LUAD evolution, we first need a model of this disease compatible with treatment models. To develop this disease model, we used the ISELA-V1 model presented by L’Hostis et al. [8] and whose credibility has already been assessed. This disease model was then improved in order to represent in more detail biological phenomena that are essential to better grasp the complexity of tumoral characteristics, namely the neoangiogenesis, the cell cycle and death, and the formation of metastases. On top of this disease model, we added PBPK treatment models combined with the implementation of their mechanism of action for the two EGFR-TKI gefitinib and osimertinib. All these additions are presented in the supplementary materials 1. The combination of the improved disease model with gefitinib and osimertinib treatment options has been named ISELA-V2. Its outputs are notably composed of the time to progression as defined by the RECIST criteria version 1.1 [9].
2.2. PBPK Model of Osimertinib and Gefitinib
In order to have access to the concentration of the TKI present in the tumor tissues that will contribute to reducing growth signals, we developed two PBPK models, one for gefitinib and one for osimertinib. PBPK models rely on the known physiology to predict how a drug will be absorbed, distributed, metabolized and eliminated (ADME) by the body depending on its physico-chemical properties. Those models are particularly useful in our context because they estimate the concentration of the drug in all the main organs of the body and therefore in all the organs that carry the primary tumor or a metastasis. Moreover, even if their structure is complex, it stays the same between two drugs that are similar in terms of physicochemical properties. For this reason, the PBPK models of gefitinib and osimertinib were built using the same equations. Nonetheless, a particularity of osimertinib is that one of its metabolites, AZ5104, also acts as an EGFR TKI [10]. The metabolization of osimertinib to AZ5104 in the liver has therefore been modeled, as well as the equations of distribution of AZ5104 from the liver to the different tissues and tumors. The structure of the PBPK models is presented in more detail in the supplementary materials (Section 2). The equations of the PBPK models regulate the pharmacokinetics of the drugs and grant access to the concentration of the drug in each of the main organs of the body. For the distribution of the drug in the tumors (primary tumor or metastasis), it was assumed that the concentration of drug in the tumor is directly proportional to its concentration in the organ the tumor is located in. Because the quantitative public data on osimertinib and gefitinib mechanism of action were found mainly in mice, a mice setting was included in the model, keeping all the equations but changing all the physiological parameters to correspond to a mouse. The parameters to calibrate related to the pharmacokinetics of the drugs were calibrated separately in mice and humans to reproduce the plasmatic profile of the drug after administration in both species.
2.3. Modeling TKI Mechanism of Action
The disease model has been developed in the context of EGFR mutated LUAD, and the modeling of the growth factors signaling, thus including the signals arising from EGFR activation, follows the activation pathways depicted in Figure 1.
Once activated, the phosphorylation of EGFR activates MAPK and PI3K/AKT downstream pathways, eventually leading to cell proliferation and survival. Not all intermediaries have been modeled, the first modeled actors being RAS and PI3K. Of note, there exist several other tyrosine kinase receptors that would activate the same downstream pathways as EGFR [11]. Among them, we chose to model MET and VEGFR receptors, as they would play specific roles in phenomena of interest for the context of use of the model: the resistance of a tumor to EGFR TKI treatment can be caused by an amplification of the MET receptor [6] and VEGFR is a receptor playing a role in the neoangiogenesis of the tumor [12]. The activation of RAS and PI3K by EGFR, VEGFR and MET are respectively depicted in Equation (1) and (2).
The model represents the different states of EGFR: Inactivated, activated and phosphorylated: The parameter propPhosphoEgfrActive corresponds to the proportion of activated EGFR that are phosphorylated. It multiplies the concentration of activated EGFR to model the concentration of EGFR activating downstream pathways. It includes the mechanism of action of tyrosine kinase inhibitors that will impact the strength of the signal by competing with ATP in the intracellular domain and preventing the phosphorylation of the receptor. It is defined by:
The value of the ATP affinity with EGFR intracellular domain can vary among the existing EGFR mutations, as well as the inhibition coefficient of the tyrosine kinase inhibitor [13,14,15]. The values of the inhibition coefficient are given in Table 1:
As expected, the T790M mutation that causes resistance to gefitinib treatment is linked to a high ratio for gefitinib compared to other sensitive mutations. The exon 20 resistant mutation that causes resistance to both gefitinib and osimertinib also presents a high ratio for gefitinib and osimertinib.
2.4. Mechanisms of Resistance
The two EGFR TKI models built are using the same model structure, whether it be for the mechanism of action of the drug or the pharmacokinetic model. Some elements still allow distinguishing those two models, which are the inhibition constant for ATP binding in the tumor site (Table 1) and the PK data the models are calibrated on (Section 2.4). But what is more important to differentiate osimertinib and gefitinib is the mechanisms that will grant the tumor resistance to the treatment. In most cases, the development of a resistance mechanism is marked by a regrow of the tumor after a phase of decline. Whether those mechanisms of resistance appear during the treatment or are already in place but only for a limited number of cells which are then selected by the treatment is uncertain and may depend on each patient and each mechanism of resistance [16,17]. In our approach, for simplification purposes, we chose the second option and assumed that a limited number of cell bearing resistance mechanisms are already present in the tumor when starting the treatment. Gefitinib and osimertinib, even though they have an identical mechanism of action, have similar but also distinct mechanisms of resistance [18]. What also differentiates the two treatments is the frequency of apparition of the mechanisms of resistance, which can also be impacted by whether the treatment is given in first or second line [19,20]. For each treatment, we have implemented the most prevalent associated mechanisms of resistance namely EGFR alteration (amplification, T790M mutation loss and C797S mutation), MET amplification, KRAS mutation or amplification and PIK3CA mutation or amplification for osimertinib [19] and T790M EGFR mutation and MET amplification for gefitinib (listed in decreasing order of frequency) [21]. Note that some mechanisms of resistance to osimertinib would also provide resistance to gefitinib treatment but they were not implemented in the model as their prevalence is negligible compared to the other resistance mechanisms to gefitinib.
In order to be able to represent both the tumor heterogeneity and the dynamic of resistance to a treatment, each tumor is divided into separate subclones that are distinct subpopulations of tumor cells each carrying their own set of mutations. Among those subclones is a resistant subclone that can carry the resistance mechanisms described above. This subclone is initialized with a negligible size compared to other subclones but if it carries a mechanism of resistance, it will grow to the point that it will predominate over the other subclones, which in contrast are declining in response to the treatment. To reproduce the variability of response to EGFR TKI, more than 70 patient descriptors were introduced with the complete list available in the supplementary materials (spreadsheet). As an example, regarding the resistance to treatment, for each virtual patient the presence or absence of each resistance mechanism in the resistant subclone is drawn from a Bernoulli distribution, whose parameter has been informed by the literature [19,21,22,23]. The presence of a resistance mechanism in the primary tumor does not necessarily mean that all the metastases will carry this resistance. Therefore, we introduced a parameter that either ensures the same mechanism of resistance in all the tumors and metastases (with a 70% probability) or allows for independent mechanisms of resistance between the primary tumor and the metastases (with a 30% probability). The assumption that in 70% of EGFR mutated LUAD cases, the mechanisms of resistance are the same in tumor and metastases has been made based on discussions with clinicians.
2.5. Data for Model Calibration
2.6. Comparison of Model Prediction with a Retrospective Study
The retrospective study presented by Li et al. [33] compares the efficacy of osimertinib and gefitinib and was not used for calibration purposes. Therefore, we were able to use this study to confront the model predictions with real-life data . This study included 102 patients with stage III-B or IV NSCLC, of whom 49 were treated with osimertinib and 53 with gefitinib. The PFS was measured and will serve as a comparative endpoint for our model. Table 3 summarizes the characteristics of the patients that participated in this study and that were used to create the associated virtual population.
2.7. Effect Model
Lastly, we performed an in silico clinical trial to compare the efficacy of gefitinib and osimertinib in the same virtual population. By doing so, we can assess for each patient his time to progression whether he is treated with osimertinib or with gefitinib. The population chosen to perform this trial is summarized in Table 4 and contains the default distribution for each of the patient’s descriptors to represent a generic EGFR mutated LUAD population. The number of virtual patients has been set to 10 times the number of patients in the retrospective study in order to have enough variability in the virtual population as well as enough statistical units to use bootstrapped approaches. This method has been described by Boissel et al. as a way to give insights on treatment efficacy and best responders characteristics [34].
3. Results
3.1. Reproducing Pharmacokinetic Data of Gefitinib and Osimertinib
After calibration, the PBPK models of gefitinib and osimertinib were able to reproduce the plasmatic concentrations of the drugs both in mice and in humans (Figure 2). All the simulated data points are within the range defined by the standard deviation.
3.2. Reproducing the Mechanism of Action of Gefitinib and Osimertinib
After calibration, the model was also able to reproduce the tumor volume evolution after gefitinib or osimertinib treatment in mice transplanted with xenografts bearing an EGFR exon 19 deletion (Figure 3) but also with xenograft bearing both an EGFR exon 19 deletion and a PIK3CA mutation (Palgen et al. [24]). The model also reproduced the dynamics of the tumor without treatment (Palgen et al. [24]), ensuring that the treatment is indeed responsible for the shrinkage of the tumor when administered. The Table 5 summarizes the calibration results in mice.
Using population characteristics composed of generic information such as age and gender as well as disease specific information such as initial cancer stage and EGFR mutation, the model was able to reproduce the probability of tumor progression as measured in the FLAURA and NEJ002 clinical trials. In order to achieve these results, several parameters of the model that could not be informed by in vitro experiments or via animal testing were calibrated, such as the initial size of the micrometastases, the initial size of the resistant subclone, the reduced impact of the immune system in the metastases compared to the primary tumor [35] and the scaling factor regulating the distribution of the treatments in the tumors. To compare the goodness of fit of the simulated Kaplan-Meier curve with the one from the associated clinical trial, bootstrapped combined weighted log-rank tests were performed using 5000 bootstraps with subsamples containing a tenth of the global population. This statistical methodology has been described by Jacob et al. [32]. The threshold of the ratio of non-significant tests required to consider that the two curves are similar was set to 80% and was largely exceeded for the two simulations (99.86% for the population treated with osimertinib and 98.42% for the population treated with gefitinib).
3.3. Reproducing the Results from a Retrospective Study
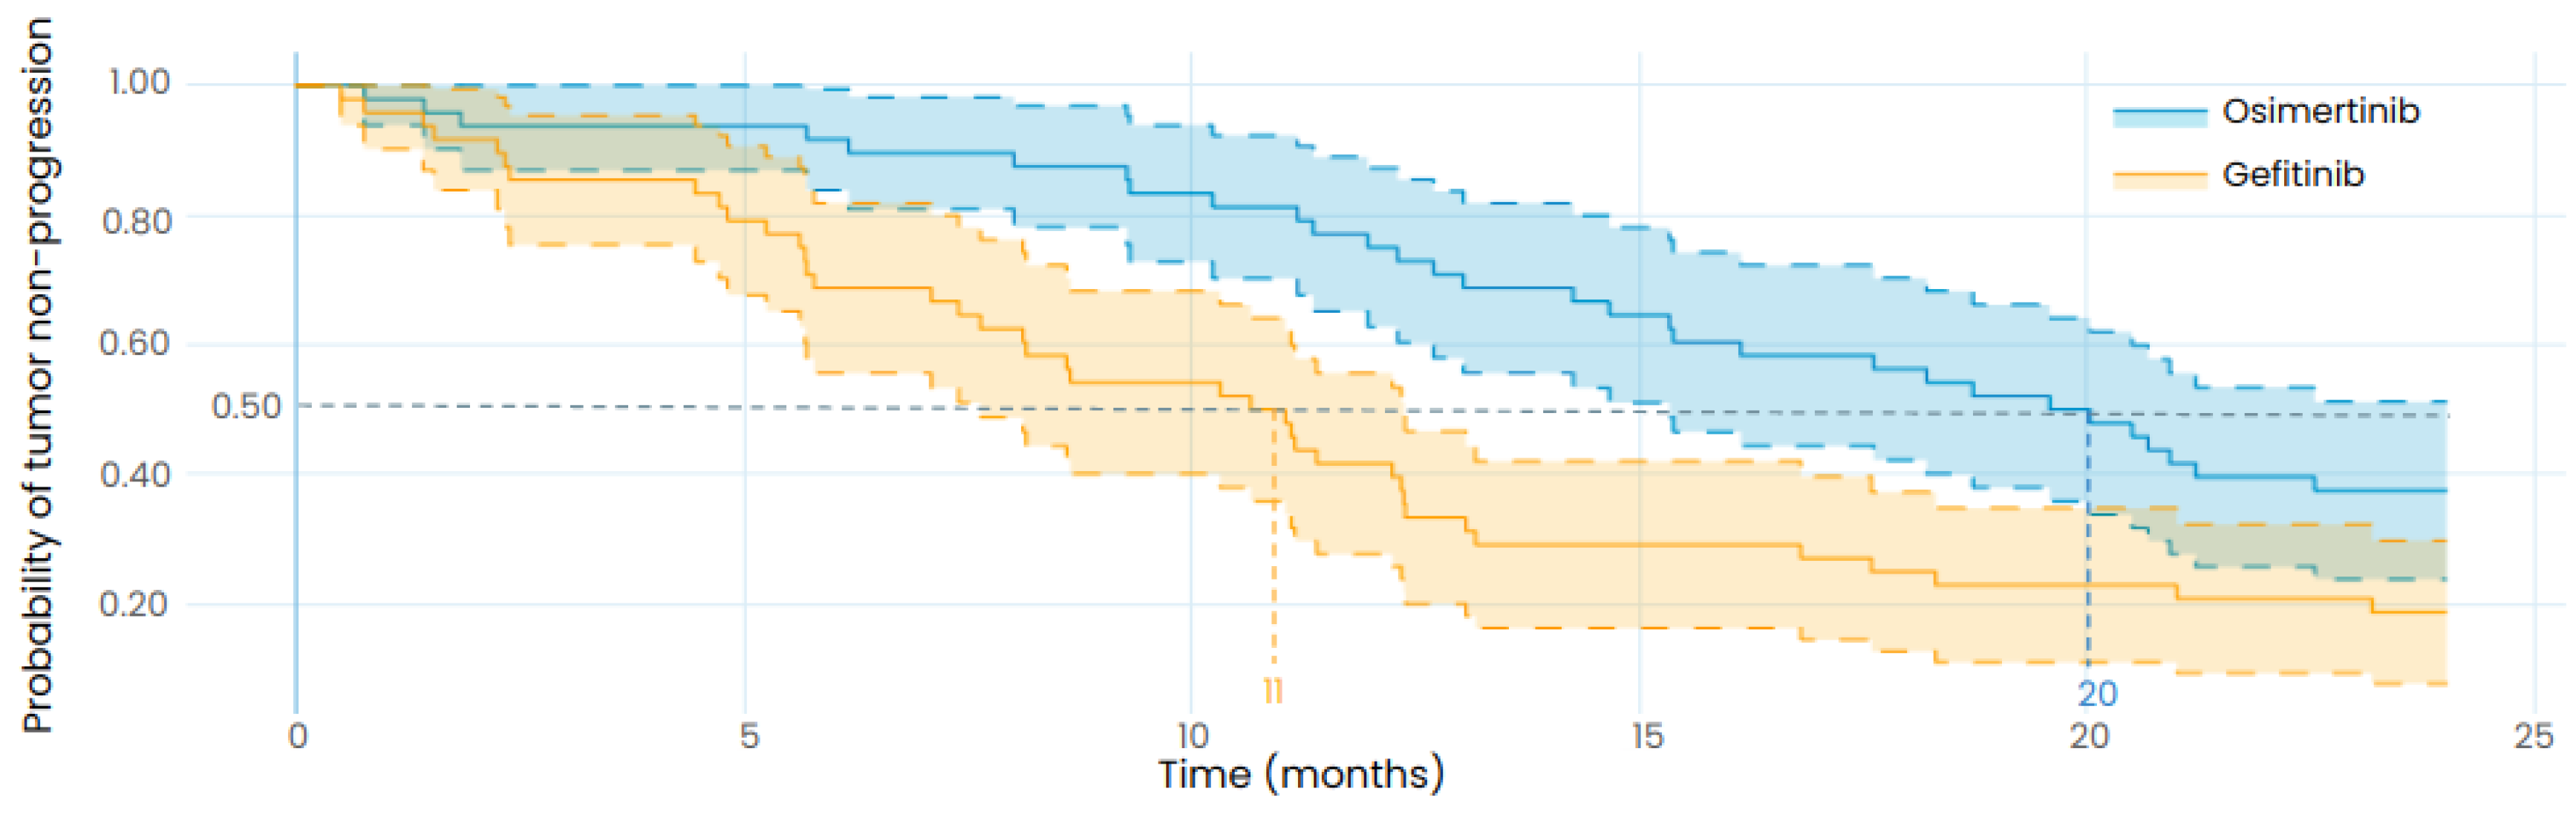
To compare the efficacy of gefitinib and osimertinib in treating EGFR mutated LUAD, we simulated a clinical trial with virtual patients representing the participants of the retrospective study from Li et al. [33]. In contrast to the previous results, no parameter was changed to fit the outcome of the retrospective study, only the patients’ characteristics were updated to match the ones of the real population described in this study. As presented in Table 6, the results of the in silico clinical trial show that osimertinib is associated with longer TTP than gefitinib for the designed population with a median TTP of 20 months (95%CI: 15-24) for osimertinib and 11 months (95% CI: 7.5-12) for gefitinib. The retrospective study reported a median PFS of 18.1 months (95% CI: 15.4-20.7) for osimertinib and 10.7 months (95% CI: 9.9-11.4) for gefitinib, in coherence with the TTP results of our in silico clinical trial, although the endpoints are not identical as the model predicts the TTP while the retrospective study reports the PFS. This highlights the robustness of the model to predict the efficacy of osimertinib and gefitinib in EGFR mutated LUAD patients.
Figure 5.
Exploratory in silico clinical trial: comparison of gefitinib and osimertinib performed with the LUAD model and with the same patient baseline characteristics as the retrospective study from Li et al. The uncertainty intervals stand for the 95% confidence intervals of the progression curves. The dotted lines represent the median TTP. Patients were orally treated with 250mg of gefitinib daily in the gefitinib arm (in orange) and with 80 mg of osimertinib daily in the osimertinib arm (in blue). Both treatments are starting at t=0.
3.4. Effect Model
By simulating the time to progression for each patient of the virtual population whether they are treated with osimertinib or gefitinib, we can directly compare the efficacy of the two treatments by plotting an effect model (Figure 6). This effect model suggests that treatment with osimertinib is linked to a longer TTP for the majority of patients. This result is even more accentuated for patients carrying an exon 20 mutation, which should however be interpreted with caution as the data that was used to calibrate the model did not contain any patients carrying exon 20 mutations. Only patients who progressed when treated with both gefitinib and osimertinib were included in the effect model but it is interesting to note that out of the 1020 virtual patients, 329 did not progress during the 24 months of simulation when treated with osimertinib while there were only 119 for gefitinib. This is an additional prediction towards the superior efficacy of osimertinib.
4. Discussion and Conclusions
The success of the calibration to reproduce the pharmacokinetics and drug effect of gefitinib and osimertinib in mice and humans constitutes evidence of the credibility of the model [36]. The model credibility is also increased by the reproduction of the retrospective study, containing patient data not used during the calibration process, using only the patient’s characteristics at the population level. This constitutes evidence that knowledge based mechanistic models are able to grasp the complexity of biological phenomena to predict the result of experiments or clinical trials by using previously gathered knowledge and data. Such models could play a major role in the development of new therapies [37]. They could be used to identify patients that would respond the best to a given treatment by analyzing the correlations of patient’s characteristics with treatment outcome. This would help guide the recruitment of patients for clinical trials, a recruitment whose quality can dictate the outcome of the trial and that can be challenging depending on the rarity of the disease [38]. Another attractive aspect of such models is the ability to generate control arms for clinical trials. Indeed, the model we developed was able to predict the response to osimertinib and gefitinib, two standards of care, in an EGFR mutated NSCLC population. By generating virtual patients representative of the target population, the model could create a control arm with simulated patients receiving either osimertinib or gefitinib. This virtual control arm could then be compared to an arm of real patients receiving an investigational treatment, allowing for a more accurate assessment of the investigational treatment’s efficacy. While the model introduced in this article holds promise for EGFR mutated LUAD patients, its applicability beyond this specific context remains limited. Any simulations performed outside of this intended use, while potentially yielding intriguing perspectives, should be approached with caution due to the inherent credibility gap compared to predictions within its domain of application [36]. In addition, the model still presents some shortcomings that could be solved with more development time. As an example, the PBPK models are based on the physiology of healthy patients while it is known that patients carrying a tumor can suffer from many symptoms such as renal impairment that can affect the pharmacokinetics of the drug and therefore its effect [39]. Another limiting point is that the model is not able to predict death, as the exact mechanisms leading to the death of a patient during the follow-up period are unknown and depend on a variety of factors that are difficult to assess (adverse effect of a treatment, exhaustion, metastases). The model only reproduces the time to progression of patients, which has to be compared to the more standard clinical endpoints that are the overall survival and the progression free survival with caution. Nevertheless, the model presented here is on the path to become an invaluable asset in the search of new therapeutic strategies in EGFR mutated lung cancer and has even recently been used to predict with success the results of a Phase III clinical trial whose results were not published yet, a first in the in silico industry [40,41].
Supplementary Materials
The following supporting information can be downloaded at the website of this paper posted on Preprints.org.
Author Contributions
All authors substantially contributed to the drafting of the manuscript. Each author also provides approval for publication of the content. HD, PM, AN, AN, LV, DF, CC, BM, JLP, CM and ALH contributed to the systematic literature review and the mathematical modeling. EJ is responsible for the statistical analysis. M.D. are responsible for the validation of the knowledge and the data assembled in the final knowledge-based mechanistic disease model. HD, PM, CM and ALH are responsible for the design of the work.
Funding
This research received no external funding.
Institutional Review Board Statement
Not applicable.
Informed Consent Statement
Not applicable.
Data Availability Statement
The datasets generated and/or analyzed during the current study are available from the corresponding author on reasonable request. The code utilized during the current study can be made available in jinkō.ai platform from the corresponding author on reasonable request.
Acknowledgments
The authors would like to thank Nicoletta Ceres, Firas Hammami, and Angélique Perrillat-Mercerot for their participation in the development of the model.
Conflicts of Interest
The authors declare the following financial competing interests: HD, PM, AN, LV, DL, CC, BM, EJ, JLP, CM, and AL were employed by Novadiscovery SA at the time the model was developed, and they were involved in the production and analysis of the results. MD reports receipt of honoraria for academic/accredited talks from AstraZeneca, Guardant Health, MSD Oncology, BMS, Takeda. M.D. reports membership of an advisory board and consultancy for AstraZeneca, MSD Oncology, BMS, Pfizer, Roche, Takeda, Boehringer Ingelheim, Janssen Oncology, Amgen, AbbVie, Elevation Oncology, Eli Lilly. MD reports receipt of research grants (funds to institution) from Eli Lilly and Nanostring.
Abbreviations
| ADME | Absorption Distribution Metabolism Elimination |
| AKT | Protein Kinase B |
| DNA | Deoxyribonucleic acid |
| EGFR | Epidermal Growth Factor Receptor |
| ERK | Extracellular signal-regulated kinase |
| ISELA | In Silico EGFR Lung Adenocarcinoma |
| LUAD | Lung Adenocarcinoma |
| MT | Metastasis |
| PK | Pharmacokinetics |
| PBPK | Physiologically based pharmacokinetics |
| PT | Primary tumor |
| RECIST | Response Evaluation Criteria In Solid Tumors |
References
- Pirlog, R.; Chiroi, P.; Rusu, I.; Jurj, A.M.; Budisan, L.; Pop-Bica, C.; Braicu, C.; Crisan, D.; Sabourin, J.C.; Berindan-Neagoe, I. Cellular and Molecular Profiling of Tumor Microenvironment and Early-Stage Lung Cancer. Int. J. Mol. Sci. 2022, 23, 5346. [Google Scholar] [CrossRef]
- Myers, D.J.; Wallen, J.M. Lung adenocarcinoma. In StatPearls; StatPearls Publishing, 2023. [Google Scholar]
- Chevallier, M.; Borgeaud, M.; Addeo, A.; Friedlaender, A. Oncogenic driver mutations in non-small cell lung cancer: Past, present and future. World J. Clin. Oncol. 2021, 12, 217–237. [Google Scholar] [CrossRef]
- Pines, G.; Köstler, W.J.; Yarden, Y. Oncogenic mutant forms of EGFR: Lessons in signal transduction and targets for cancer therapy. FEBS Lett. 2010, 584, 2699–2706. [Google Scholar] [CrossRef] [PubMed]
- Yuan, M.; Huang, L.L.; Chen, J.H.; Wu, J.; Xu, Q. The emerging treatment landscape of targeted therapy in non-small-cell lung cancer. Signal Transduct. Target. Ther. 2019, 4, 61. [Google Scholar] [CrossRef] [PubMed]
- Shah, R.; Lester, J.F. Tyrosine Kinase Inhibitors for the Treatment of EGFR Mutation-Positive Non–Small-Cell Lung Cancer: A Clash of the Generations. Clin. Lung Cancer 2020, 21, e216–e228. [Google Scholar] [CrossRef] [PubMed]
- Viceconti, M.; Emili, L.; Afshari, P.; Courcelles, E.; Curreli, C.; Famaey, N.; Geris, L.; Horner, M.; Jori, M.C.; Kulesza, A.; Loewe, A.; Neidlin, M.; Reiterer, M.; Rousseau, C.F.; Russo, G.; Sonntag, S.J.; Voisin, E.M.; Pappalardo, F. Possible Contexts of Use for In Silico Trials Methodologies: A Consensus-Based Review. IEEE J. Biomed. Health Informatics 2021, 25, 3977–3982. [Google Scholar] [CrossRef] [PubMed]
- L’Hostis, A.; Palgen, J.L.; Perrillat-Mercerot, A.; Peyronnet, E.; Jacob, E.; Bosley, J.; Duruisseaux, M.; Toueg, R.; Lefèvre, L.; Kahoul, R.; Ceres, N.; Monteiro, C. Knowledge-based mechanistic modeling accurately predicts disease progression with gefitinib in EGFR-mutant lung adenocarcinoma. Npj Syst. Biol. Appl. 2023, 9, 37. [Google Scholar] [CrossRef] [PubMed]
- Eisenhauer, E.; Therasse, P.; Bogaerts, J.; Schwartz, L.; Sargent, D.; Ford, R.; Dancey, J.; Arbuck, S.; Gwyther, S.; Mooney, M.; Rubinstein, L.; Shankar, L.; Dodd, L.; Kaplan, R.; Lacombe, D.; Verweij, J. New response evaluation criteria in solid tumours: Revised RECIST guideline (version 1.1). Eur. J. Cancer 2009, 45, 228–247. [Google Scholar] [CrossRef]
- Ishikawa, E.; Yokoyama, Y.; Chishima, H.; Kasai, H.; Kuniyoshi, O.; Kimura, M.; Hakamata, J.; Nakada, H.; Suehiro, N.; Nakaya, N.; Nakajima, H.; Ikemura, S.; Kawada, I.; Yasuda, H.; Terai, H.; Jibiki, A.; Kawazoe, H.; Soejima, K.; Muramatsu, H.; Suzuki, S.; Nakamura, T. Population Pharmacokinetics, Pharmacogenomics, and Adverse Events of Osimertinib and its Two Active Metabolites, AZ5104 and AZ7550, in Japanese Patients with Advanced Non-small Cell Lung Cancer: A Prospective Observational Study. Investig. New Drugs 2023, 41, 122–133. [Google Scholar] [CrossRef]
- Du, Z.; Lovly, C.M. Mechanisms of receptor tyrosine kinase activation in cancer. Mol. Cancer 2018, 17, 58. [Google Scholar] [CrossRef]
- Bremnes, R.M.; Camps, C.; Sirera, R. Angiogenesis in non-small cell lung cancer: The prognostic impact of neoangiogenesis and the cytokines VEGF and bFGF in tumours and blood. Lung Cancer 2006, 51, 143–158. [Google Scholar] [CrossRef]
- Eck, M.J.; Yun, C.H. Structural and mechanistic underpinnings of the differential drug sensitivity of EGFR mutations in non-small cell lung cancer. Biochim. Et Biophys. Acta (BBA) - Proteins Proteom. 2010, 1804, 559–566. [Google Scholar] [CrossRef]
- Masuzawa, K.; Yasuda, H.; Hamamoto, J.; Nukaga, S.; Hirano, T.; Kawada, I.; Naoki, K.; Soejima, K.; Betsuyaku, T. Characterization of the efficacies of osimertinib and nazartinib against cells expressing clinically relevant epidermal growth factor receptor mutations. Oncotarget 2017, 8, 105479–105491. [Google Scholar] [CrossRef]
- (EMA), E.M.A. Tagrisso Epar - Public Assessment Report - EMA/CHMP/134310/2017. Technical report, 2017.
- Dökümcü, K.; Farahani, R.M. Evolution of Resistance in Cancer: A Cell Cycle Perspective. Front. Oncol. 2019, 9, 376. [Google Scholar] [CrossRef]
- Sarmento-Ribeiro, A.B.; Scorilas, A.; Gonçalves, A.C.; Efferth, T.; Trougakos, I.P. The emergence of drug resistance to targeted cancer therapies: Clinical evidence. Drug Resist. Updat. 2019, 47, 100646. [Google Scholar] [CrossRef]
- Santoni-Rugiu, E.; Melchior, L.C.; Urbanska, E.M.; Jakobsen, J.N.; Stricker, K.d.; Grauslund, M.; Sørensen, J.B. Intrinsic Resistance to EGFR-Tyrosine Kinase Inhibitors in EGFR-Mutant Non-Small Cell Lung Cancer: Differences and Similarities with Acquired Resistance. Cancers 2019, 11, 923. [Google Scholar] [CrossRef]
- Lazzari, C.; Gregorc, V.; Karachaliou, N.; Rosell, R.; Santarpia, M. Mechanisms of resistance to osimertinib. J. Thorac. Dis. 2019, 12, 2851–2858. [Google Scholar] [CrossRef] [PubMed]
- Ramalingam, S.; Cheng, Y.; Zhou, C.; Ohe, Y.; Imamura, F.; Cho, B.; Lin, M.C.; Majem, M.; Shah, R.; Rukazenkov, Y.; Todd, A.; Markovets, A.; Barrett, J.; Chmielecki, J.; Gray, J. Mechanisms of acquired resistance to first-line osimertinib: Preliminary data from the phase III FLAURA study. Ann. Oncol. 2018, 29, viii740. [Google Scholar] [CrossRef]
- Morgillo, F.; Corte, C.M.D.; Fasano, M.; Ciardiello, F. Mechanisms of resistance to EGFR-targeted drugs: Lung cancer. ESMO Open 2016, 1, e000060. [Google Scholar] [CrossRef]
- Schoenfeld, A.J.; Chan, J.M.; Kubota, D.; Sato, H.; Rizvi, H.; Daneshbod, Y.; Chang, J.C.; Paik, P.K.; Offin, M.; Arcila, M.E.; Davare, M.A.; Shinde, U.; Pe’er, D.; Rekhtman, N.; Kris, M.G.; Somwar, R.; Riely, G.J.; Ladanyi, M.; Yu, H.A. Tumor Analyses Reveal Squamous Transformation and Off-Target Alterations As Early Resistance Mechanisms to First-line Osimertinib in EGFR-Mutant Lung Cancer. Clin. Cancer Res. 2020, 26, 2654–2663. [Google Scholar] [CrossRef] [PubMed]
- Leonetti, A.; Sharma, S.; Minari, R.; Perego, P.; Giovannetti, E.; Tiseo, M. Resistance mechanisms to osimertinib in EGFR-mutated non-small cell lung cancer. Br. J. Cancer 2019, 121, 725–737. [Google Scholar] [CrossRef]
- Palgen, J.L.; Perrillat-Mercerot, A.; Ceres, N.; Peyronnet, E.; Coudron, M.; Tixier, E.; Illigens, B.M.W.; Bosley, J.; L’Hostis, A.; Monteiro, C. Integration of Heterogeneous Biological Data in Multiscale Mechanistic Model Calibration: Application to Lung Adenocarcinoma. Acta Biotheor. 2022, 70, 19. [Google Scholar] [CrossRef]
- Kang, H.N.; Choi, J.W.; Shim, H.S.; Kim, J.; Kim, D.J.; Lee, C.Y.; Hong, M.H.; Park, S.Y.; Park, A.Y.; Shin, E.J.; Lee, S.Y.; Pyo, K.H.; Yun, M.R.; Choi, H.M.; Lee, S.S.; Kim, S.Y.; Lee, H.; Paik, S.; Cho, B.C.; Lee, J.G.; Kim, H.R. Establishment of a platform of non-small-cell lung cancer patient-derived xenografts with clinical and genomic annotation. Lung Cancer 2018, 124, 168–178. [Google Scholar] [CrossRef]
- Wang, S.; Zhou, Q.; Gallo, J.M. Demonstration of the equivalent pharmacokinetic/pharmacodynamic dosing strategy in a multiple-dose study of gefitinib. Mol. Cancer Ther. 2009, 8, 1438–1447. [Google Scholar] [CrossRef]
- Yates, J.W.; Ashton, S.; Cross, D.; Mellor, M.J.; Powell, S.J.; Ballard, P. Irreversible Inhibition of EGFR: Modeling the Combined Pharmacokinetic–Pharmacodynamic Relationship of Osimertinib and Its Active Metabolite AZ5104. Mol. Cancer Ther. 2016, 15, 2378–2387. [Google Scholar] [CrossRef] [PubMed]
- Bergman, E.; Forsell, P.; Persson, E.M.; Knutson, L.; Dickinson, P.; Smith, R.; Swaisland, H.; Farmer, M.R.; Cantarini, M.V.; Lennernäs, H. Pharmacokinetics of gefitinib in humans: The influence of gastrointestinal factors. Int. J. Pharm. 2007, 341, 134–142. [Google Scholar] [CrossRef] [PubMed]
- Zhao, H.; Cao, J.; Chang, J.; Zhang, Z.; Yang, L.; Wang, J.; Cantarini, M.; Zhang, L. Pharmacokinetics of Osimertinib in Chinese Patients With Advanced NSCLC: A Phase 1 Study. J. Clin. Pharmacol. 2018, 58, 504–513. [Google Scholar] [CrossRef] [PubMed]
- Ramalingam, S.S.; Vansteenkiste, J.; Planchard, D.; Cho, B.C.; Gray, J.E.; Ohe, Y.; Zhou, C.; Reungwetwattana, T.; Cheng, Y.; Chewaskulyong, B.; Shah, R.; Cobo, M.; Lee, K.H.; Cheema, P.; Tiseo, M.; John, T.; Lin, M.C.; Imamura, F.; Kurata, T.; Todd, A.; Hodge, R.; Saggese, M.; Rukazenkov, Y.; Soria, J.C.; Investigators, F. Overall Survival with Osimertinib in Untreated, EGFR-Mutated Advanced NSCLC. New Engl. J. Med. 2019, 382, 41–50. [Google Scholar] [CrossRef]
- Inoue, A.; Kobayashi, K.; Maemondo, M.; Sugawara, S.; Oizumi, S.; Isobe, H.; Gemma, A.; Harada, M.; Yoshizawa, H.; Kinoshita, I.; Fujita, Y.; Okinaga, S.; Hirano, H.; Yoshimori, K.; Harada, T.; Saijo, Y.; Hagiwara, K.; Morita, S.; Nukiwa, T.; Group, f.t.N.E.J.S. Updated overall survival results from a randomized phase III trial comparing gefitinib with carboplatin–paclitaxel for chemo-naïve non-small cell lung cancer with sensitive EGFR gene mutations (NEJ002). Ann. Oncol. 2013, 24, 54–59. [Google Scholar] [CrossRef]
- Jacob, E.; Perrillat-Mercerot, A.; Palgen, J.L.; L’Hostis, A.; Ceres, N.; Boissel, J.P.; Bosley, J.; Monteiro, C.; Kahoul, R. Empirical methods for the validation of time-to-event mathematical models taking into account uncertainty and variability: Application to EGFR + lung adenocarcinoma. BMC Bioinform. 2023, 24, 331. [Google Scholar] [CrossRef]
- Li, X.; Zhai, Z.; Zhu, Y.; Zhou, H. Comparison of Gefitinib in the treatment of patients with non-small cell lung cancer and clinical effects of Osimertinib and EGFR Gene mutation. Pak. J. Med Sci. 2022, 38, 1589–1594. [Google Scholar] [CrossRef] [PubMed]
- Boissel, J.P.; Kahoul, R.; Marin, D.; Boissel, F.H. Effect Model Law: An Approach for the Implementation of Personalized Medicine. J. Pers. Med. 2013, 3, 177–190. [Google Scholar] [CrossRef] [PubMed]
- Lee, W.C.; Reuben, A.; Hu, X.; McGranahan, N.; Chen, R.; Jalali, A.; Negrao, M.V.; Hubert, S.M.; Tang, C.; Wu, C.C.; Lucas, A.S.; Roh, W.; Suda, K.; Kim, J.; Tan, A.C.; Peng, D.H.; Lu, W.; Tang, X.; Chow, C.W.; Fujimoto, J.; Behrens, C.; Kalhor, N.; Fukumura, K.; Coyle, M.; Thornton, R.; Gumbs, C.; Li, J.; Wu, C.J.; Little, L.; Roarty, E.; Song, X.; Lee, J.J.; Sulman, E.P.; Rao, G.; Swisher, S.; Diao, L.; Wang, J.; Heymach, J.V.; Huse, J.T.; Scheet, P.; Wistuba, I.I.; Gibbons, D.L.; Futreal, P.A.; Zhang, J.; Gomez, D.; Zhang, J. Multiomics profiling of primary lung cancers and distant metastases reveals immunosuppression as a common characteristic of tumor cells with metastatic plasticity. Genome Biol. 2020, 21, 271. [Google Scholar] [CrossRef] [PubMed]
- FDA. Assessing the Credibility of Computational Modeling and Simulation in Medical Device Submissions - Guidance for Industry and Food and Drug Administration Staff. 2023. [Google Scholar]
- Pappalardo, F.; Russo, G.; Tshinanu, F.M.; Viceconti, M. In silico clinical trials: Concepts and early adoptions. Briefings Bioinform. 2019, 20, 1699–1708. [Google Scholar] [CrossRef]
- Brøgger-Mikkelsen, M.; Zibert, J.R.; Andersen, A.D.; Lassen, U.; Hædersdal, M.; Ali, Z.; Thomsen, S.F. Changes in key recruitment performance metrics from 2008–2019 in industry-sponsored phase III clinical trials registered at ClinicalTrials.gov. PLoS ONE 2022, 17, e0271819. [Google Scholar] [CrossRef]
- Lameire, N.H.; Flombaum, C.D.; Moreau, D.; Ronco, C. Acute renal failure in cancer patients. Ann. Med. 2005, 37, 13–25. [Google Scholar] [CrossRef]
- Novadiscovery. Novadiscovery Announces Success of First-of-its-Kind Clinical Trial Simulation to Accurately Predict Findings of Phase III Clinical Study. 2024. Available online: https://www.novadiscovery.com/novadiscovery-announces-success-of-first-of-its-kind-clinical-trial-simulation-to-accurately-predict-findings-of-phase-iii-clinical-study/ (accessed on 12 September 2023).
- Novadiscovery. New Demonstration of the Predictive Power of an In Silico Clinical Trial in Oncology. 2024. Available online: https://www.novadiscovery.com/new-demonstration-of-the-predictive-power-of-an-in-silico-clinical-trial-in-oncology/ (accessed on 13 November 2023).
Figure 1.
Downstream pathways following EGFR activation, either after activation by EGF or via constitutive activation caused by a mutation. Created with Biorender.com.
Figure 1.
Downstream pathways following EGFR activation, either after activation by EGF or via constitutive activation caused by a mutation. Created with Biorender.com.
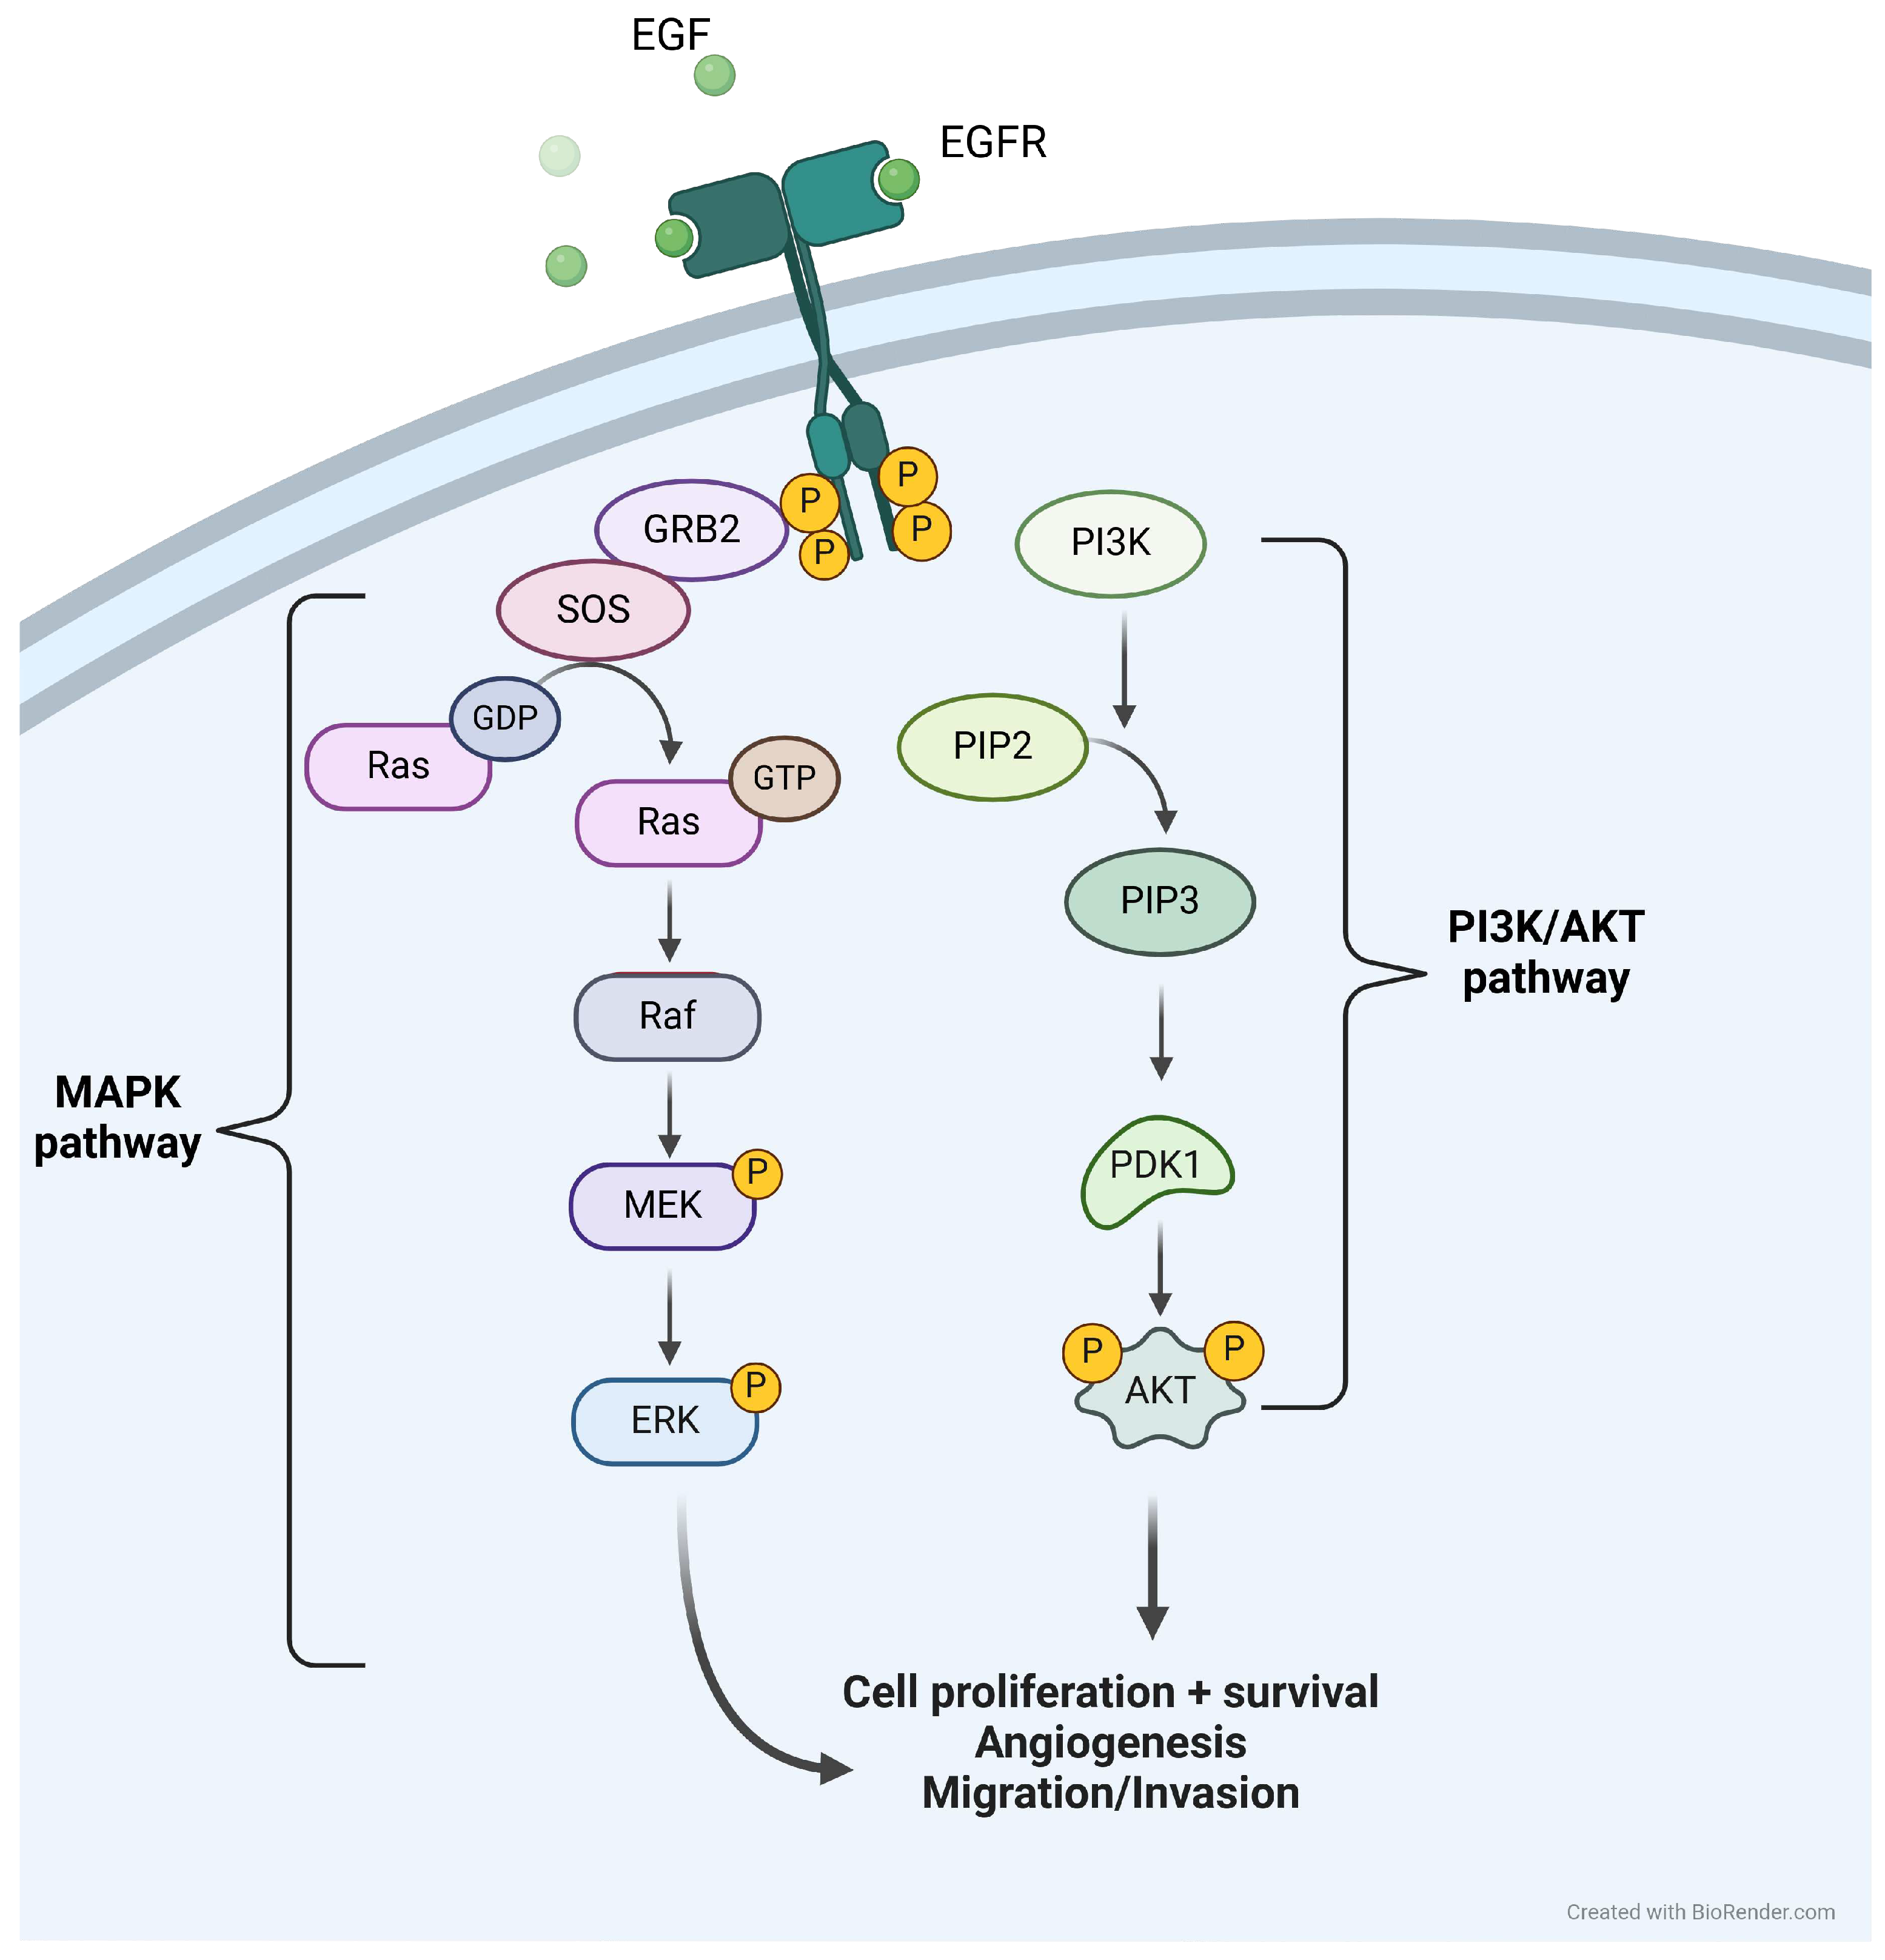
Figure 2.
TKI plasma concentration in mice after an oral administration of respectively 5 mg/kg of osimertinib (A) or 50 mg/kg of gefitinib (B). TKI plasma concentration in humans after an oral administration of respectively 80 mg of osimertinib (C) or 250 mg of gefitinib (D). In gray is represented the observed values with the standard deviation (A: Yates et al. [27] B: Wang et al [26]), C: Zhao et al [29] D: Bergman et al. [28]) and in color is represented the simulated plasmatic concentration of the drug with the PBPK models. The administration is given at t=0. .
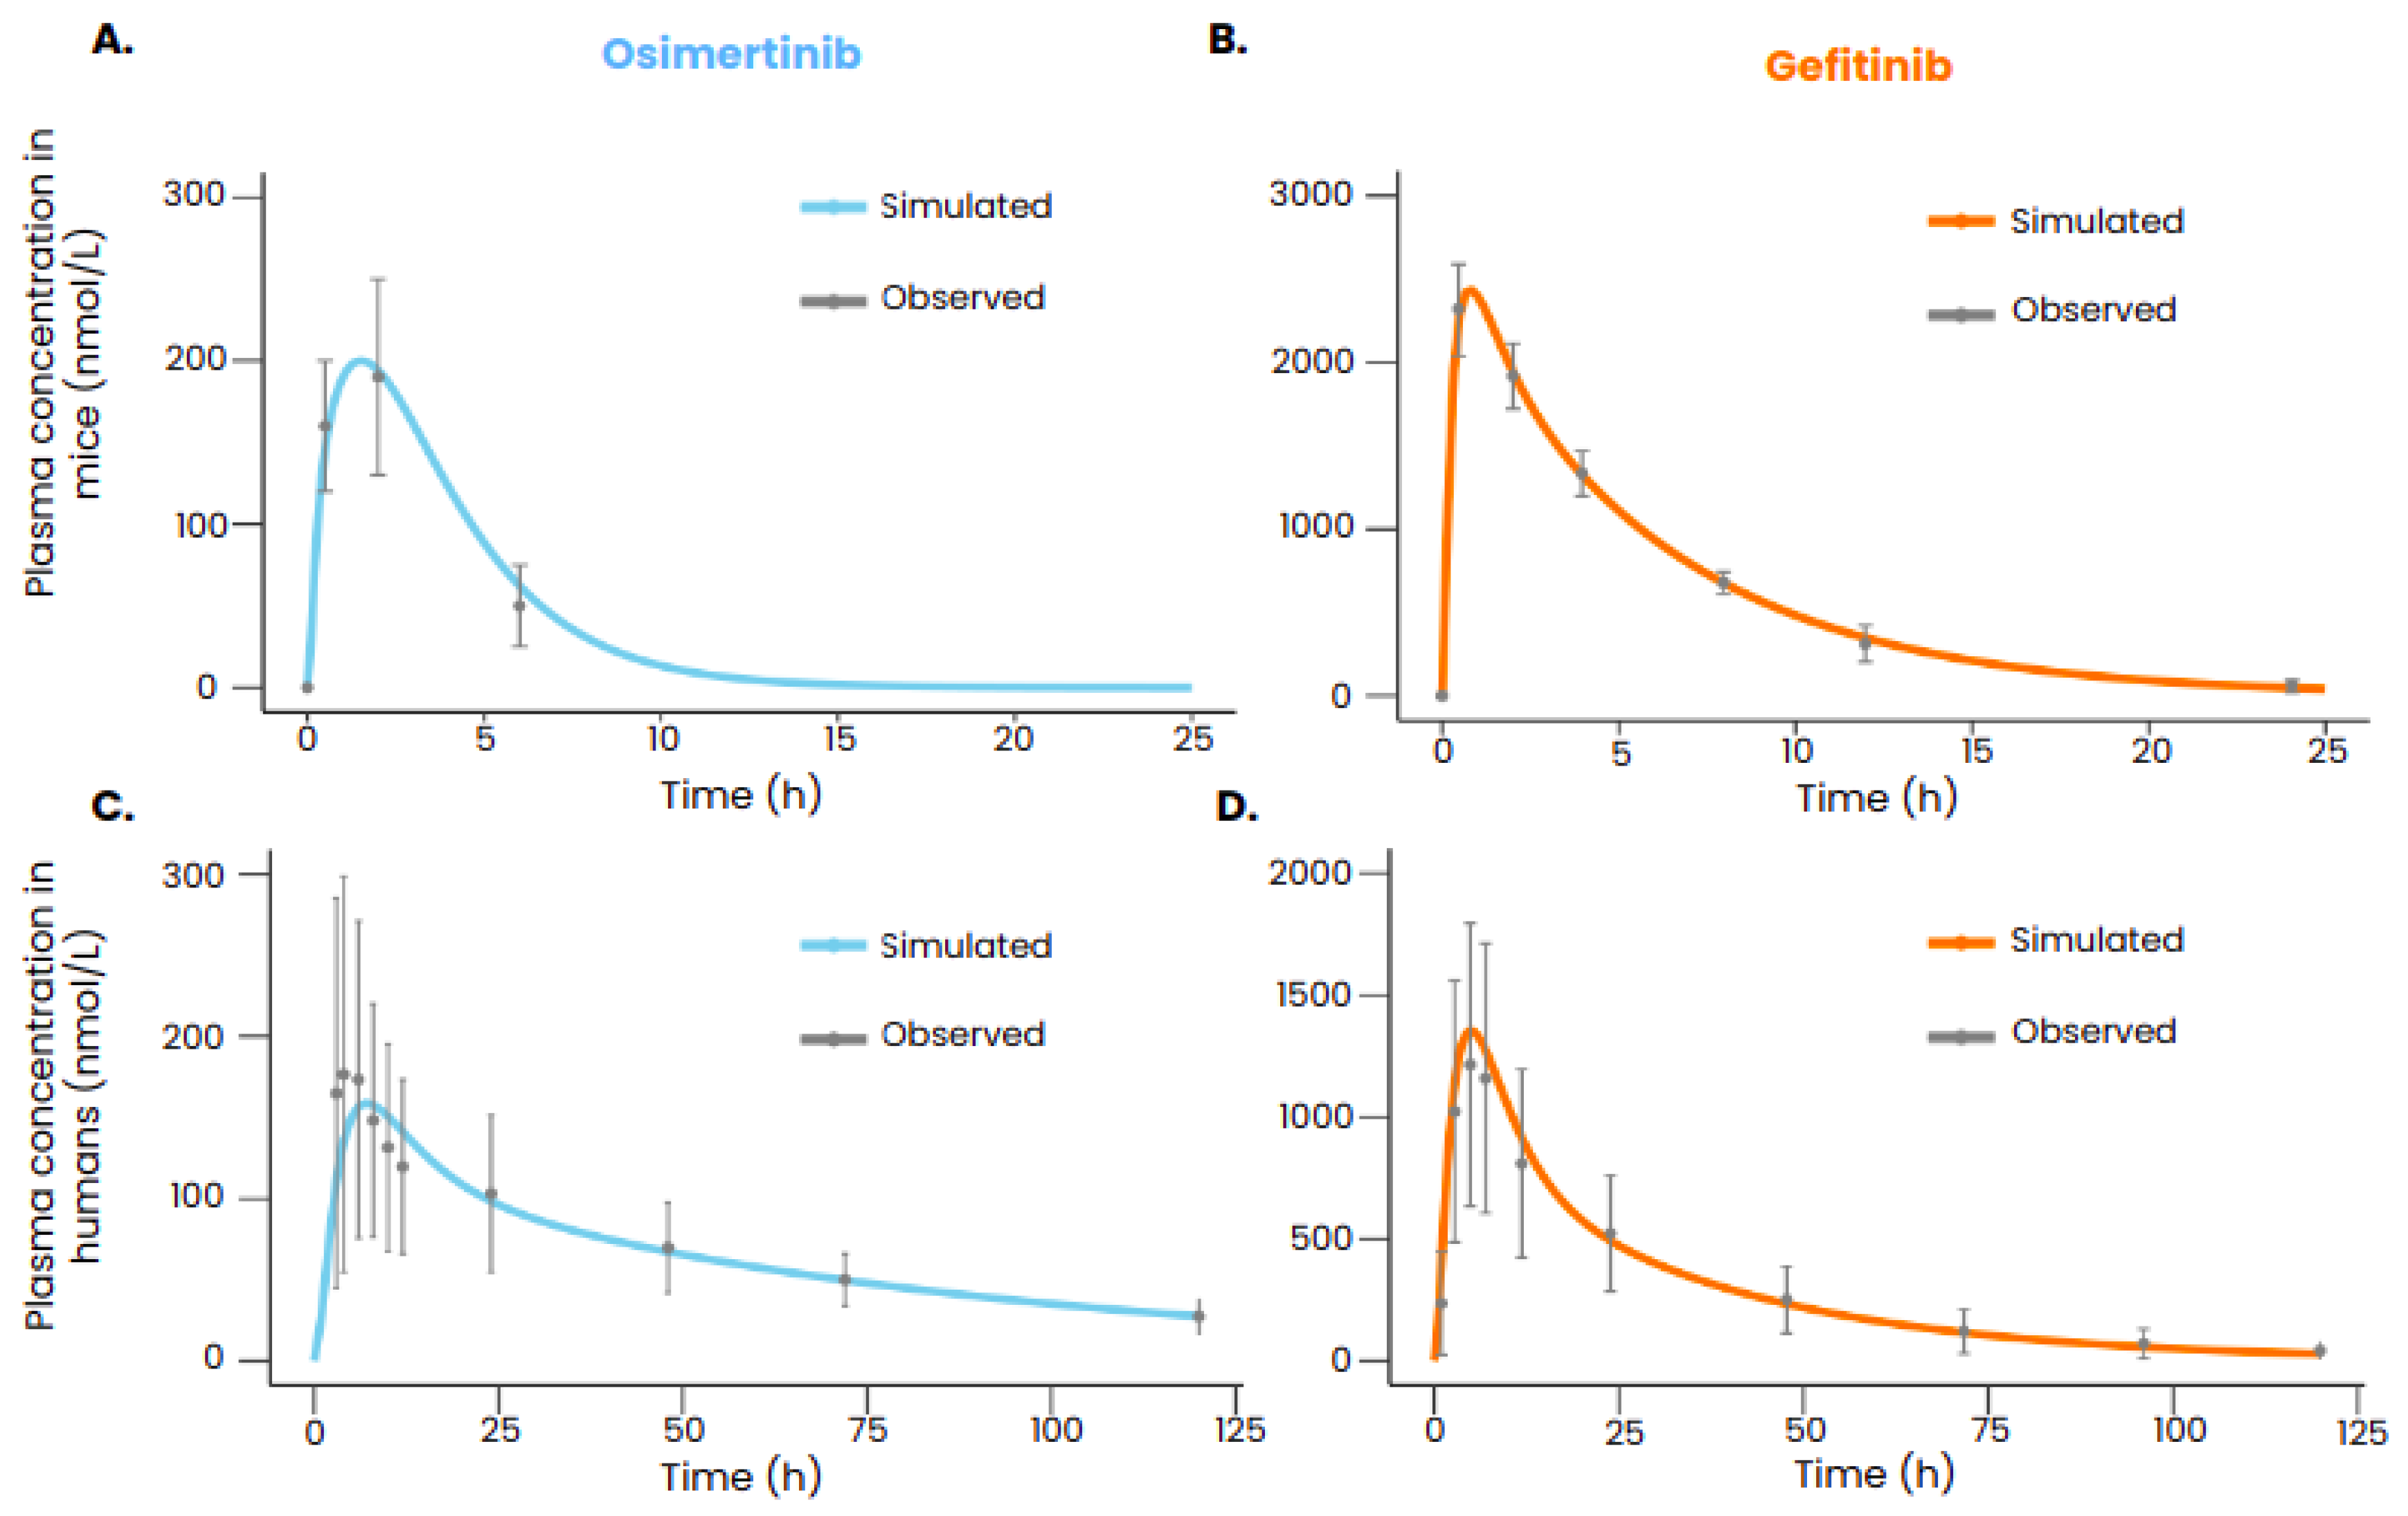
Figure 3.
Tumor volume evolution in mice implanted with a tumor carrying an exon 19 deletion mutation and treated with osimertinib (A) and gefitinib (B). In gray is represented the observed data (Kang et al [25]) with the standard deviation and in color is represented the tumor volume predicted with the models. Drugs were administered orally starting at t=0 with a posology of 25 mg/kg daily for gefitinib and 6.25 mg/kg daily for osimertinib.
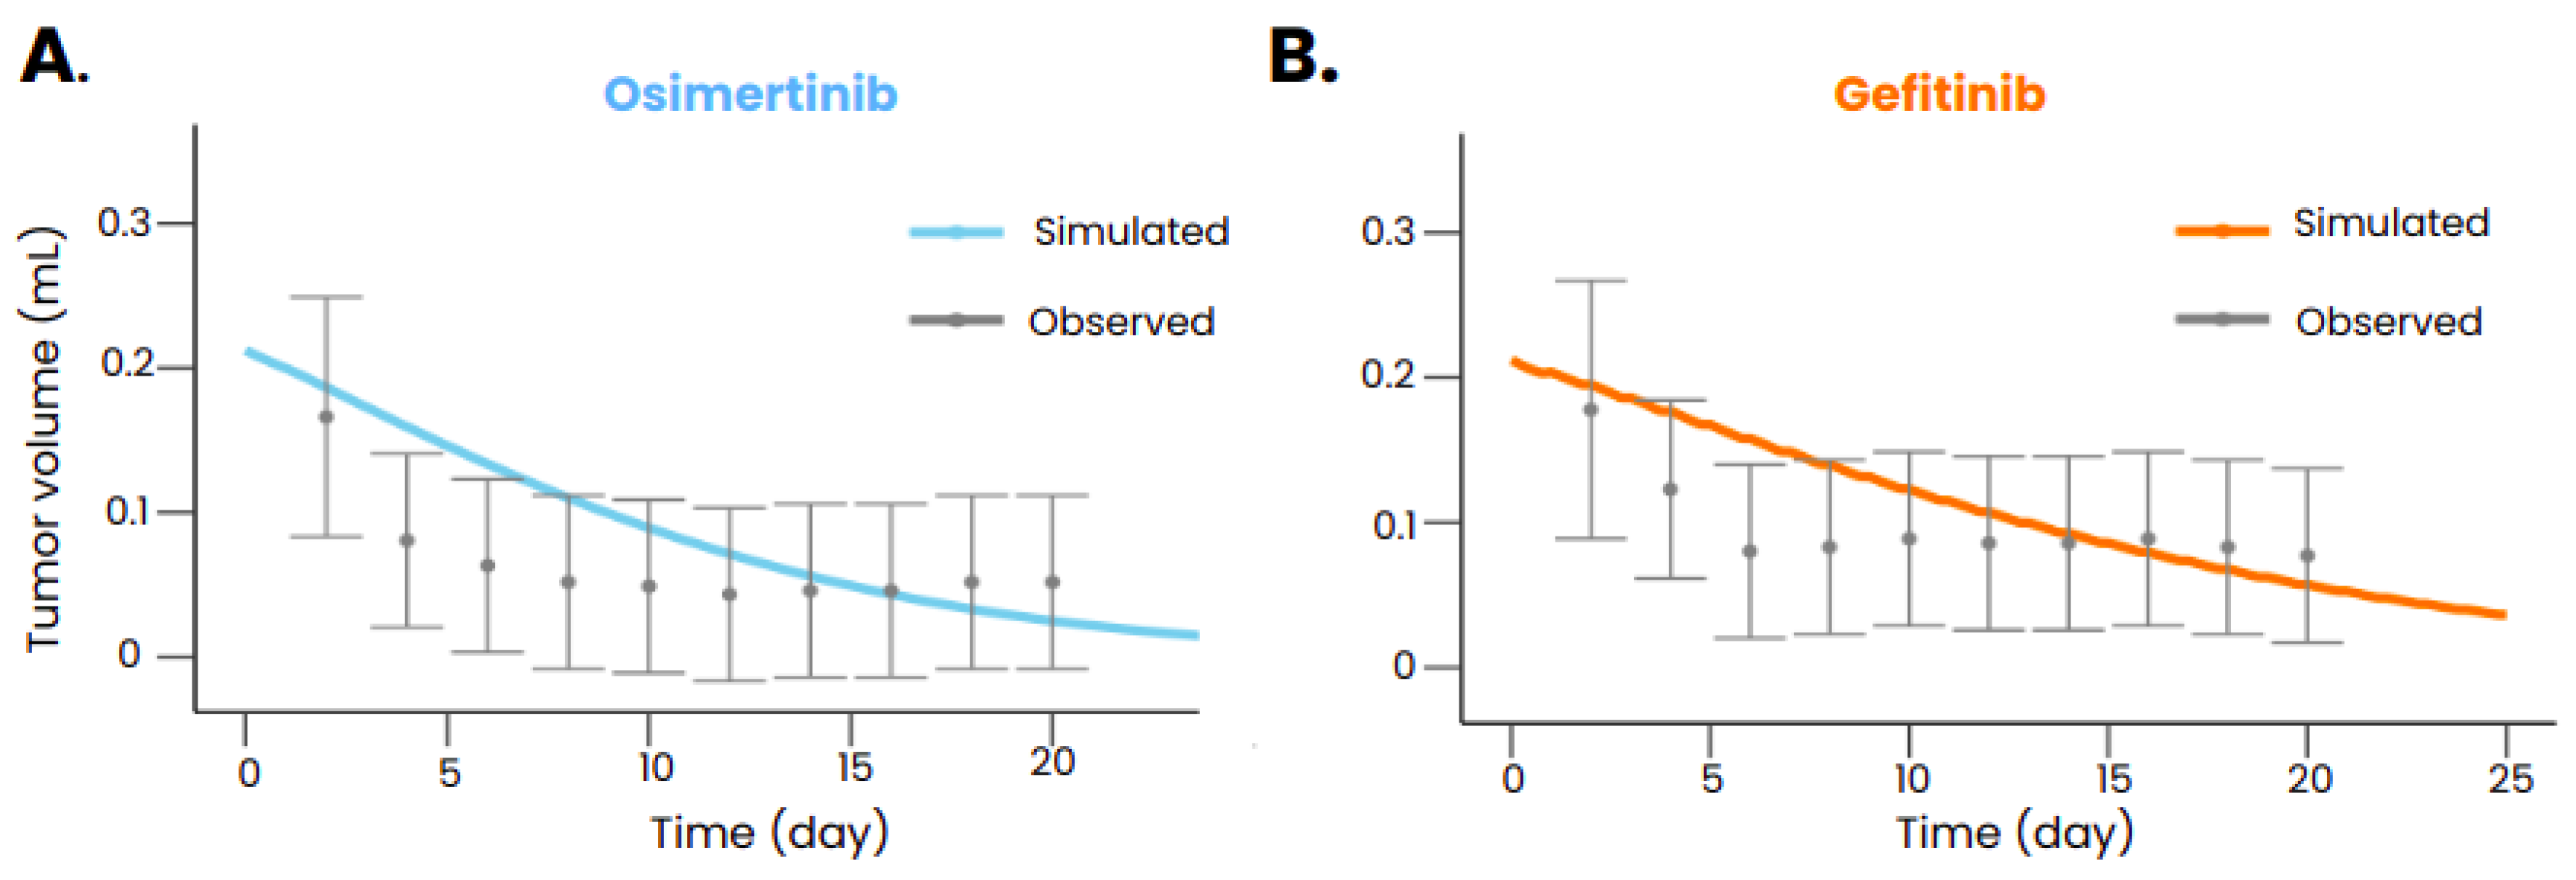
Figure 4.
Kaplan-Meier curves of time to progression obtained in the in silico clinical trials performed with the ISELA-V2 model and compared to real clinical trial data (A: FLAURA clinical trial; B: NEJ002 clinical trial). The uncertainty interval of the simulated curve corresponds to the variability obtained from bootstrapping the virtual population while the one of the observed curve stands for the 95% confidence interval. In the Flaura study, patients are treated with 80 mg of osimertinib administered orally daily and in the NEJ002 study, patients are treated with 250mg of gefitinib orally daily. Both treatments start at t=0.
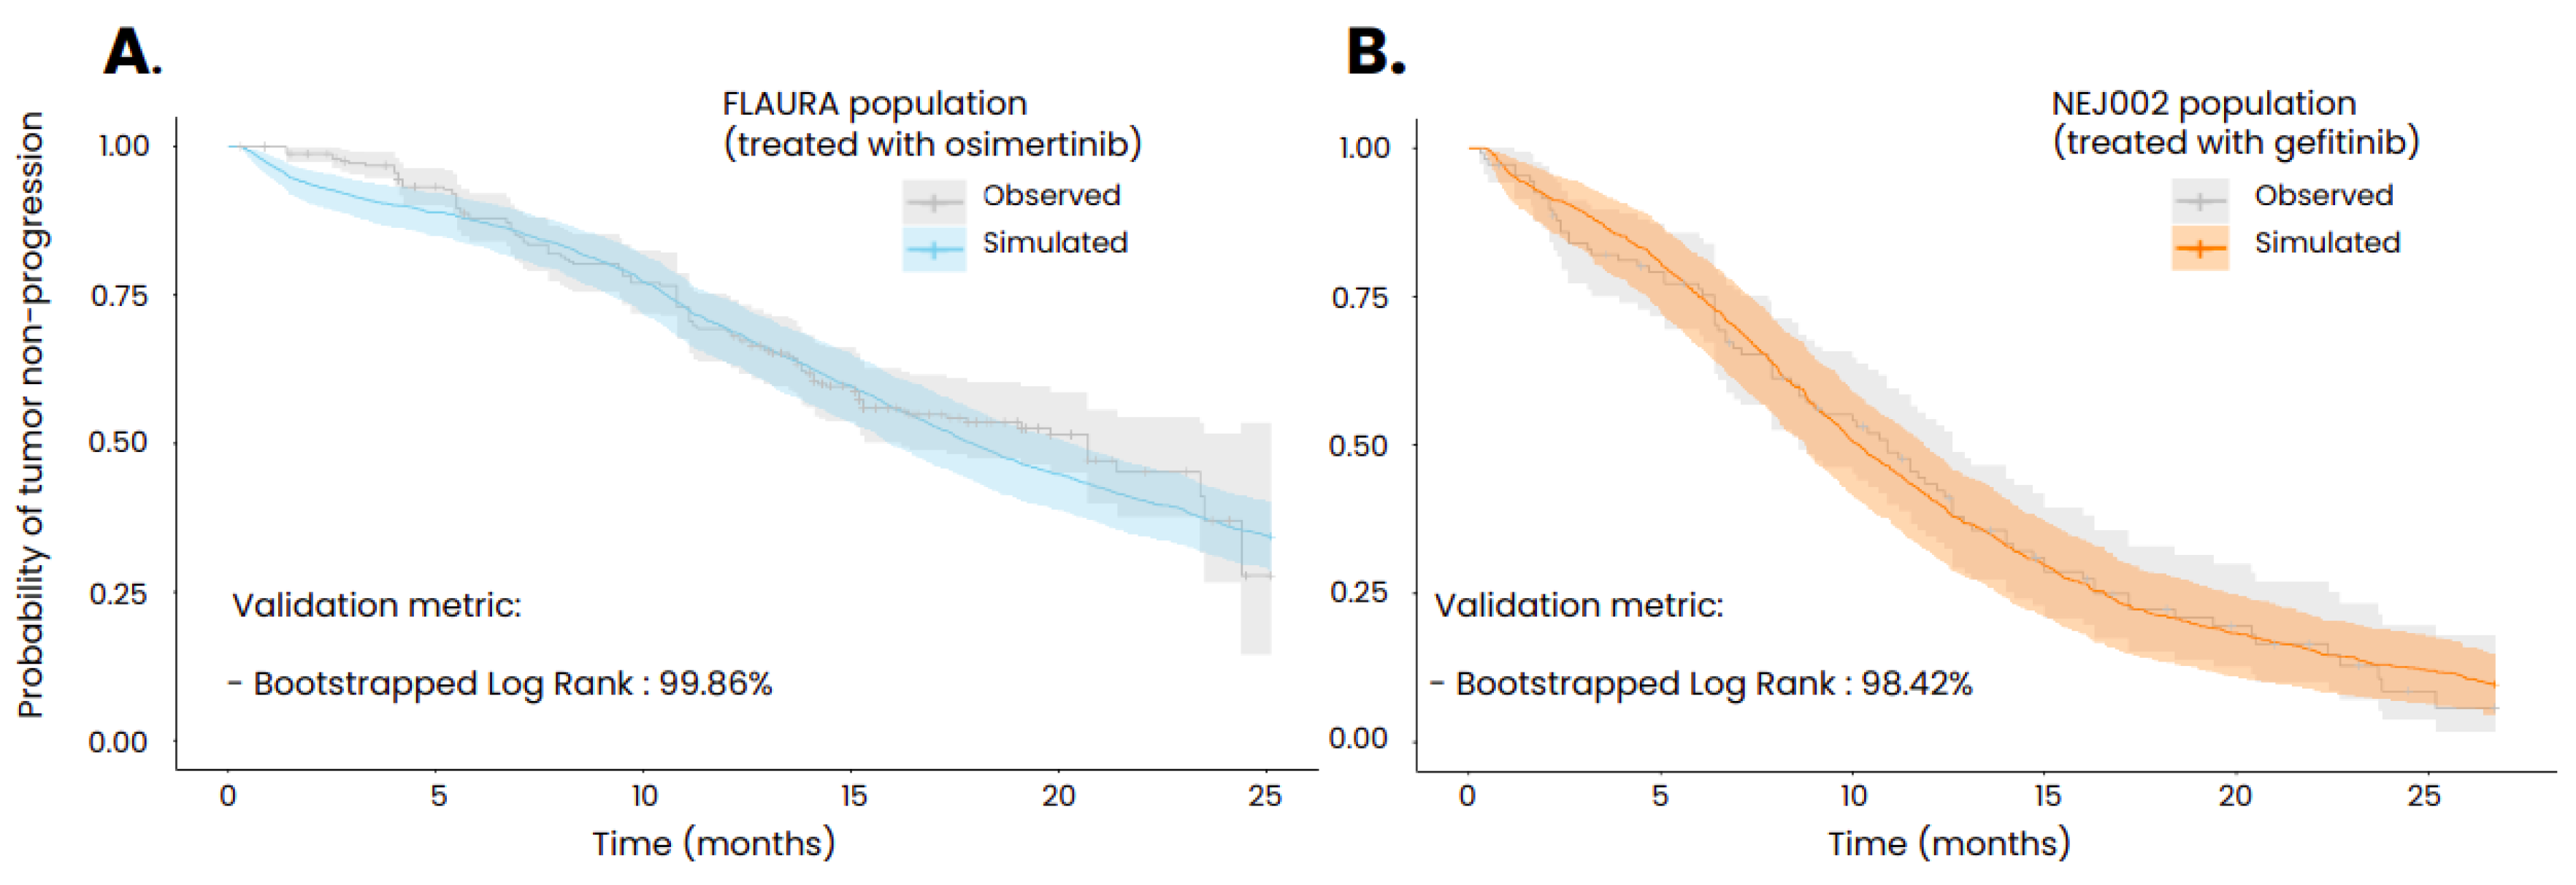
Figure 6.
Effect model comparing the effect of osimertinib and gefitinib in terms of time to progression (TTP). Only patients that progressed within the 24 months of the in silico trial with both osimertinib and gefitinib are plotted (691 patients out of the 1020 that were simulated). Each point corresponds to one patient defined by its time to progression when treated with osimertinib and when treated with gefitinib. The circled areas correspond to confidence ellipse computed using pearson coefficient with the function described here (the number of standard deviations was set to 1).
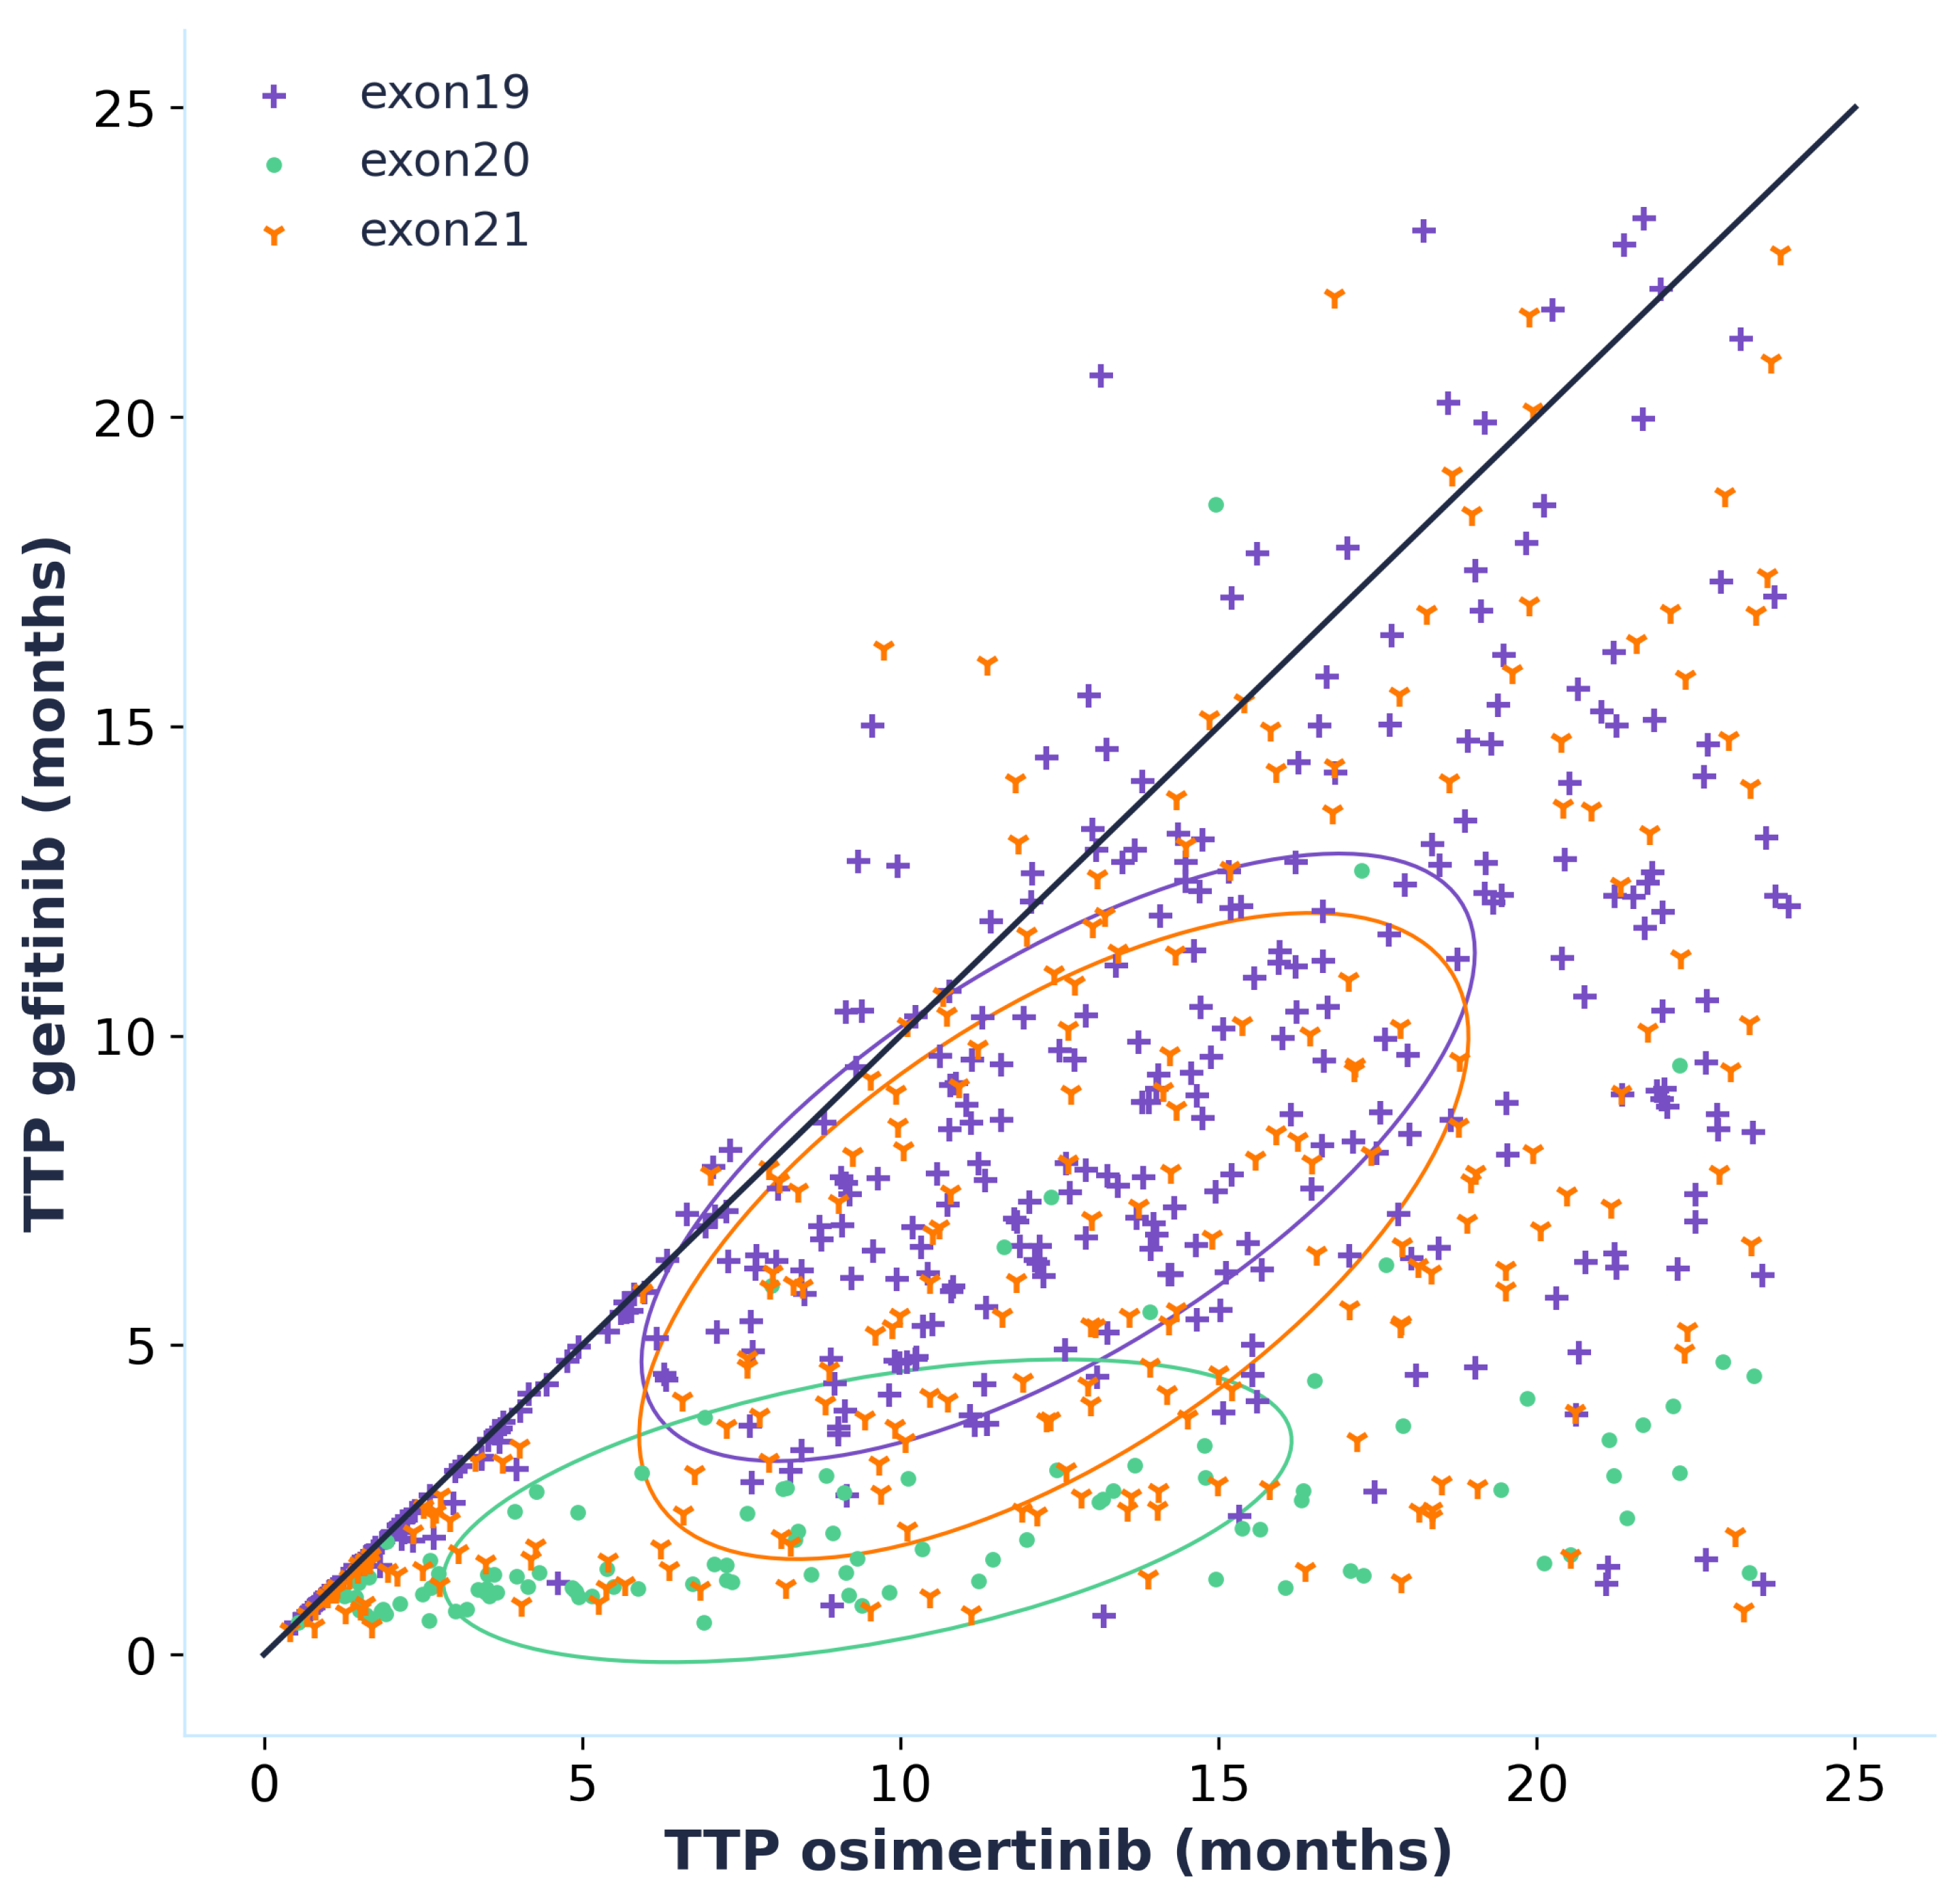

Table 1.
Values of the inhibition constant of gefitinib and osimertinib for the binding of ATP to the intracellular domain of EGFR, depending on the EGFR mutation. Values have been taken from or computed from Eck et al [13] (gefitinib) and Masuzawa et al. [14], EMA report [15] (osimertinib). Note: AZ5104, the most active metabolite of osimertinib that was included in the model, has been assumed to have the same Ki values as osimertinib. .
| EGFR mutation | Tyrosine kinase Inhibitor | (nmol/L) | (*1e-3) |
|---|---|---|---|
| Exon 19 deletion + T790M resistance mutation | Gefitnib | 4.3e1 | 5.1 |
| Osimertinib | 3.2e-2 | 3.8e-3 | |
| Exon 21 insertion + T790M resistance mutation | Gefitinib | 2.9e1 | 3.4 |
| Osimertinib | 9.4e-3 | 1.1e-3 | |
| Exon 19 deletion mutation | Gefitnib | 8.3e1 | 6.5e-3 |
| Osimertinib | 1.1 | 8.5e-3 | |
| Exon 20 sensitive mutation | Gefitinib | 2.5 | 1.3e-1 |
| Osimertinib | 5.9e-1 | 3.1e-2 | |
| Exon 20 resistant mutation | Gefitnib | 2.6e1 | 7.0e-1 |
| Osimertinib | 6.2 | 1.7e-1 | |
| Exon 21 insertion mutation | Gefitinib | 6.4 | 4.3e-2 |
| Osimertinib | 9.7e-1 | 6.5e-3 | |
| Wild type | Gefitnib | 1.6e1 | 3.2 |
| Osimertinib | 3.3 | 6.4e-1 |
Table 2.
Data used during the calibration of the model, for the pharmacokinetics of the drugs and their mechanism of action.
Table 2.
Data used during the calibration of the model, for the pharmacokinetics of the drugs and their mechanism of action.
| Study | Biological process to reproduce | Experimental conditions | Treatment | Species |
|---|---|---|---|---|
| Kang et al [25] | Tumor volume evolution after treatment administration |
Mouse PDX model YHIM-1003 cells harbors EGFR exon 19 deletion. Mouse PDX model YHIM-1009 cells harbors EGFR exon 19 deletion and PIK3CA E542K mutation. Treated with gefitinib or osimertinib. |
Gefitinib, osimertinib | Mice |
| Wang et al. [26] | Gefitinib plasmatic profile | Tumor bearing mice that have been administered 50 mg/kg of gefitinib orally |
Gefitinib | Mice |
| Yates et al. [27] | Osimertinib and AZ5104 plasmatic profile | Tumor bearing mice that have been administered 5 mg/kg of osimertinib orally |
Osimertinib | Mice |
| Bergman et al. [28] | Gefitinib plasmatic profile | Healthy human that have been administered 250 mg of gefitinib orally | Gefitinib | Humans |
| Zhao et al. [29] | Osimertinib and AZ5104 plasmatic profile | EGFR mutated NSCLC patients that have been administered 40 mg or 80 mg of osimertinib orally |
Osimertinib | Humans |
| FLAURA [30] | Time to progression (computed from OS and PFS curves1) | Patients with an advanced stage of NSCLC and harboring an EGFR mutation are treated as first line with 80mg/day of osimertinib |
Osimertinib | Humans |
| NEJ002 [31] | Time to progression (computed from OS and PFS curves1) | Patients with an advanced stage of NSCLC and harboring an EGFR mutation are treated as first line with 250mg/day of gefitinib |
Gefitnib | Humans |
1 The methodology used to determine the time to progression is explained by Jacob et al. [32].
Table 3.
Characteristics of the patients from the retrospective study that were used to create the related virtual population. Values taken from Li et al. [33].
Table 3.
Characteristics of the patients from the retrospective study that were used to create the related virtual population. Values taken from Li et al. [33].
| Treated with osimertinib (n=49) | Treated with gefitinib (n=53) | |
|---|---|---|
| Sex (M/F) | 24/25 | 26/27 |
| Age (<65/ >65) | 27/22 | 25/28 |
| Smoking status (Y/N) | 38/11 | 35/18 |
| Cancer stage (IIIb/IV) | 30/19 | 35/18 |
Table 4.
Characteristics of the virtual population used to make the effect model..
| Virtual population | |
|---|---|
| Sex (M:F ratio) | 1:2 |
| Age (mean,sd) | (67,11) |
| Smoking status (Never,Former,Current) | (28%, 34%, 38%) |
| Etnicity (Asian, Other) | (55%, 45%) |
| Egfr mutation (19, 20, 21) | (51.6%, 13.2%, 35.2%) |
Table 5.
Calibration results for the mechanisms of action of osimertinib and gefitinib, based on mice experiments (Kang et al [25]).
Table 5.
Calibration results for the mechanisms of action of osimertinib and gefitinib, based on mice experiments (Kang et al [25]).
| Mutation | Ratio of points wihthin the standard deviation | ||
|---|---|---|---|
| Control | Gefitinib | Osimertinib | |
| Exon 19 deletion mutation | 100% | 90% | 80% |
| Exon 19 deletion mutation + PI3KCA mutation | 80% | 100% | 100% |
Table 6.
Results from the retrospective study made by Li et al. [33] and from the in silico clinical trial made with the ISELA-V2 with the same patient’s characteristic as the retrospective.
Table 6.
Results from the retrospective study made by Li et al. [33] and from the in silico clinical trial made with the ISELA-V2 with the same patient’s characteristic as the retrospective.
| Retrospective study | In silico clinical trial with the same patient’s characteristics | |
|---|---|---|
| Osimertinib | PFS: 18.1 months (95%CI: 15.4-20.7) | TTP: 20 months (95%CI: 15-24) |
| Gefitnib | PFS: 10.7 months (95%CI: 9.9-11.4) | TTP: 11 months (95%CI: 7.5-12) |
Disclaimer/Publisher’s Note: The statements, opinions and data contained in all publications are solely those of the individual author(s) and contributor(s) and not of MDPI and/or the editor(s). MDPI and/or the editor(s) disclaim responsibility for any injury to people or property resulting from any ideas, methods, instructions or products referred to in the content. |
© 2024 by the authors. Licensee MDPI, Basel, Switzerland. This article is an open access article distributed under the terms and conditions of the Creative Commons Attribution (CC BY) license (http://creativecommons.org/licenses/by/4.0/).
Copyright: This open access article is published under a Creative Commons CC BY 4.0 license, which permit the free download, distribution, and reuse, provided that the author and preprint are cited in any reuse.


