Preprint
Article

Mono-Specific Data Deficient Saltmarsh Species Has Climate Relevant Carbon Stocks From the East Coast of India

Altmetrics

Downloads

150

Views

57

Comments

0

Submitted:

09 February 2024

Posted:

12 February 2024

You are already at the latest version

Alerts
Abstract
Despite saltmarshes being considered as nature-based solutions (NbS) towards climate change mitigation, India’s saltmarsh ecosystems are least studied. This study quantifies the seasonal variation in carbon stocks mono-specific saltmarsh species (Porteresia coarctata) and its potential to play an important role in India’s climate change mitigation plans. Seasonal (pre-and post-monsoon) sampling of P. coarctata surface water, biomass and 30 cm sediment core was collected across four locations on the east coast of India to quantify sediment dry bulk density (DBD), organic matter (OM%), organic carbon (Corg%), Corg stocks of sediment and biomass, total carbon (C%) and nitrogen (N%) and stable isotopes of δ13C and δ15N. In general, the sediment DBD, OM and Corg of P. coarctata meadows was higher in post-monsoon and was influenced by salinity and pH changes. Isotope (δ13C) modelling of various sediment C sources suggested, particulate organic matter (POM) contribution was highest (0.04-0.79%) followed by P. coarctata (0.01–052%) and other macrophytes across our study locations. The seasonal variation of δ13C showed increased contribution of marine derived particulate and dissolved organic matter into P. coarctata meadows in post-monsoon season. Heavier δ15N values were observed in post-monsoon season suggesting anthropogenic input, that was utilized by P. coarctata to increase its above and below-ground biomass and shoot density. The combined ecosystem (30 cm sediment + biomass) Corg stocks of P. coarctata was 1.7-fold higher in post-monsoon (4021.20± 917 Mg C) compared to pre-monsoon (2297.36 ±647 Mg C) season among the four locations with a sediment Corg contribution >70%. Based on the International Panel for Climate Change Tier II assessment the P. coarctata meadows (443 ha) can help in avoiding the pre and post-monsoon emissions of 8431.34 and 14757.84 Mg CO2 respectively. The combined price of the total CO2 equivalent stored in P. coarctata meadows in pre- and post-monsoon is US$ 14.50 and US$ 25.38 million respectively. Further studies quantifying the NbS potential of P. coarctata mono-specific and mixed meadows of India’s coast is needed along with integration of saltmarsh ecosystems into India’s National Action Plan on Climate Change.
Keywords: 
Subject: Environmental and Earth Sciences  -   Ecology

1. Introduction

Marine forests (i.e., mangroves, saltmarsh and seagrass) are considered as important nature-based solutions (NbS) to capture CO2 and store carbon (i.e., blue carbon) over a long period of time compared to the land forests (Mishra et al., 2023; Stankovic et al., 2023). Saltmarshes are one of the keystones coastal macrophytic plants, that inhabit the land and sea interface (Levin et al., 2001). These ecosystems are distributed worldwide (Mcowen et al., 2017) and provide an array of ecosystem services (Ermagassen et al., 2021). These ecosystem services include food and habitat provisioning for variety of fish and invertebrate species (Jinks et al., 2020; Whitfield, 2017), improved water quality and shoreline protection through sediment accretion and plays an important role in climate change mitigation through blue carbon sequestration (Campbell et al., 2022a; Ermgassen et al., 2021; Gilby et al., 2021; Rendón et al., 2019). However, due to various human induced habitat disturbances related to marine food provisioning (such as aquaculture and grazing), coastal developmental activities (port development, mangrove plantation, tourism activities) and climate change (such as sea level rise and temperature change effects) impacts, these ecosystems are getting lost at alarming rates (0.28% yr-1) in the last decade (Campbell et al., 2022a), leading to loss of ecosystem services (such as blue carbon) and biodiversity assemblages (Campbell et al., 2022b; Mason et al., 2023a; Mishra and Farooq, 2022a; Perera et al., 2022). Despite saltmarsh ecosystems being ecologically important in climate change mitigation, there is a significant lack of studies on assessing their carbon storage potential in the Indian subcontinent (Bal and Banerjee, 2019; Mishra and Farooq, 2022a; Stankovic et al., 2023).
India’s saltmarsh ecosystems cover 1% (1611.14 km2) of the total wetland area consisting of more than 45 species (National Wetland Atlas, 2011). These saltmarsh species of India are part of the 18 species found in South Asia and inhabit the intertidal mudflat zone of India’s coastal ecosystems that are frequently inundated by spring and neap tides (Gopi et al., 2019; Mcowen et al., 2017; Viswanathan et al., 2020). However, lack of studies on ecological aspects has hindered the conservation and management of saltmarsh ecosystems across various coastal states, leading to loss and die-off of India’s saltmarsh ecosystems. For example, the saltmarsh plant Porteresia coarctata and Sporobolus virginicus has been extensively removed for mangrove restoration, leading to severe loss of these ecologically important ecosystems (Begam et al., 2017; Mishra and Farooq, 2022a). However, both P. coarctata and S. virginicus plants modify the surrounding sediment biogeochemistry, that not only helps in sediment accretion but also in successful restoration of mangroves, as observed in the ecosystems of Sundarbans, India (Begam et al., 2017). Despite saltmarsh ecosystems being important carbon storage systems and are distributed across east and west coast of India, studies on carbon stocks of saltmarsh ecosystems of India are minimal and mostly restricted to the east coast of India (Mishra and Farooq, 2022a, 2022b; Stankovic et al., 2023). For P. coarctata there are only two studies from the east coast of India showing a carbon storage range from 7 to 44.79 Mg C ha-1 within the top 10 cm of the sediment (Banerjee et al., 2022; Chowdhury et al., 2018). Similarly, there is a single study from the east coast of India showing carbon stocks potential of mixed saltmarsh species (i.e., Suaeda maritima, Sesuvium portulacastrum, Arthrocnemum indicum, Salichornia brachiata) present in the upper intertidal zone with sediment carbon stocks potential of 8.42 to 54.6 Mg C ha-1 (Kaviarasan et al., 2019). However, previous studies of P. coarctata carbon stocks on the east coast were limited only to protected coastal areas (such as Bhitarkanika National Park in Odisha and the Sundarbans World Heritage Site in West Bengal), where the species is found associated with mangrove ecosystems (Banerjee et al., 2022; Mishra and Farooq, 2022b). Other than these protected areas, P. coarctata is also found inhabiting various estuaries along the east coast of India without mangroves, which are ecologically important marine habitats for endangered fish and horseshoe crabs (Misra et al., 1988). These ecologically important P. coarctata meadows are traditionally overlooked and anthropogenically modified for mangrove restoration, jetty building, port development, coastal road infrastructure and coastal aquaculture (Begam et al., 2017; Mishra and Farooq, 2022a, 2022b). How these anthropogenic activities combined with seasonal changes can alter the carbon storing capacity of these mono-specific P. coarctata meadows along the east coast of India is less understood. Furthermore, India under its “Blue Economy” push is going to make significant stride towards its coastal infrastructure that will alter the coastal saltmarsh ecosystems and create additive pressure on conservation and management of the least studied saltmarsh ecosystems.
Therefore, this study aims to i) quantify the organic carbon stocks of a mono-specific saltmarsh species (i.e., P. coarctata) from the coast of Odisha and assess the socio-economic benefits of this carbon storage, ii) evalute the effects of seasonal variation in Corg stocks, and iii) the contribution of various Corg sources into these saltmarsh ecosystems by using stable isotopes of carbon (13C). This study will help in showcasing the importance of P. coarctata ecosystems towards India’s climate change mitigation plans and the need for conservation of these ecosystems. We hypothesize that seasonal influence of nutrient and OM positively influences sediment carbon stocks in these saltmarsh ecosystems.

2. Materials and Methods

2.1. Study Area

This study surveyed four major estuarine areas of the state of Odisha, i.e., Chandipur (200 ha), Dhamra (93 ha), Astaranga (110 ha) and Rushikulya (30 ha) that have the presence of mono-specific meadows of P. coarctata (Figure 1). These study locations cover the north to south latitudinal gradient of estuaries in the state of Odisha that drain into the Bay of Bengal on the east coast of India and are considered as one of the Important Coastal and Marine Biodiversity Areas (ICMBA, 2021) other than the protected Bhitarkanika National Park. The Chandipur and Dhamra estuarine areas are important breeding and feeding habitats for endangered horse-shoe crabs (Chatterji et al., 2003), whereas Rushikulya and Astaranga estuarine areas are important mass nesting sites of Olive ridley sea turtles (Mishra et al., 2022).
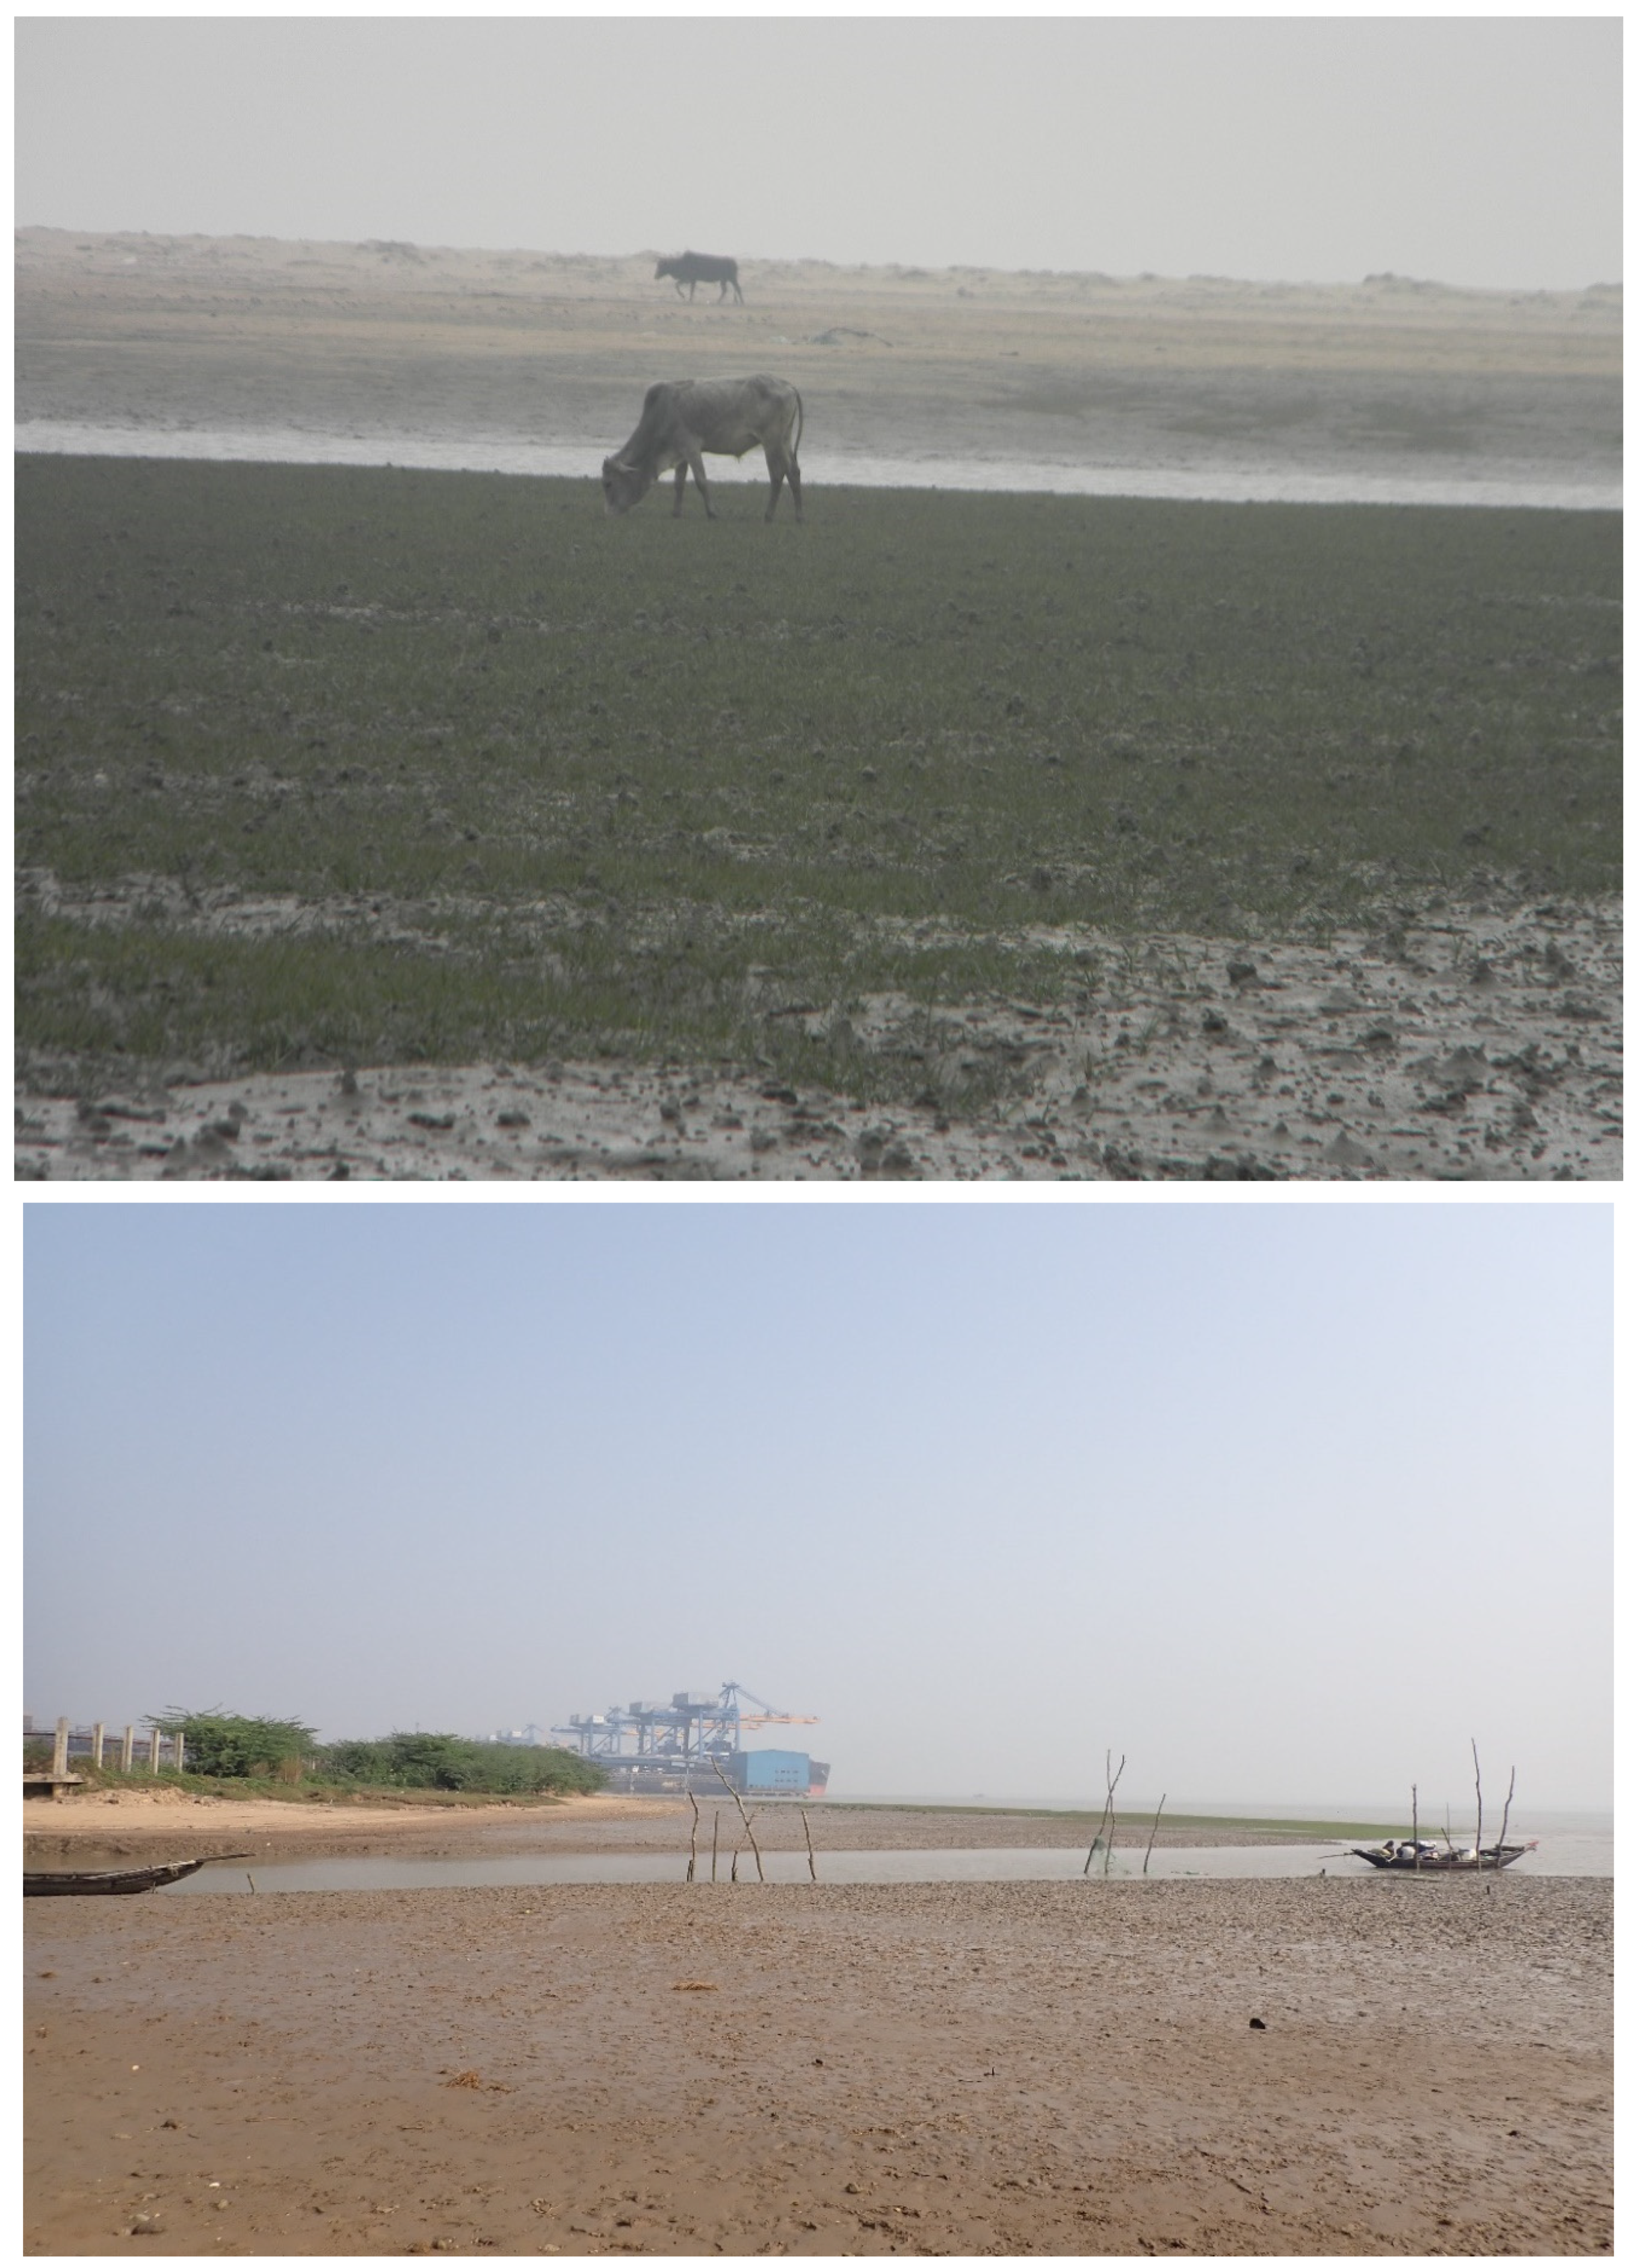
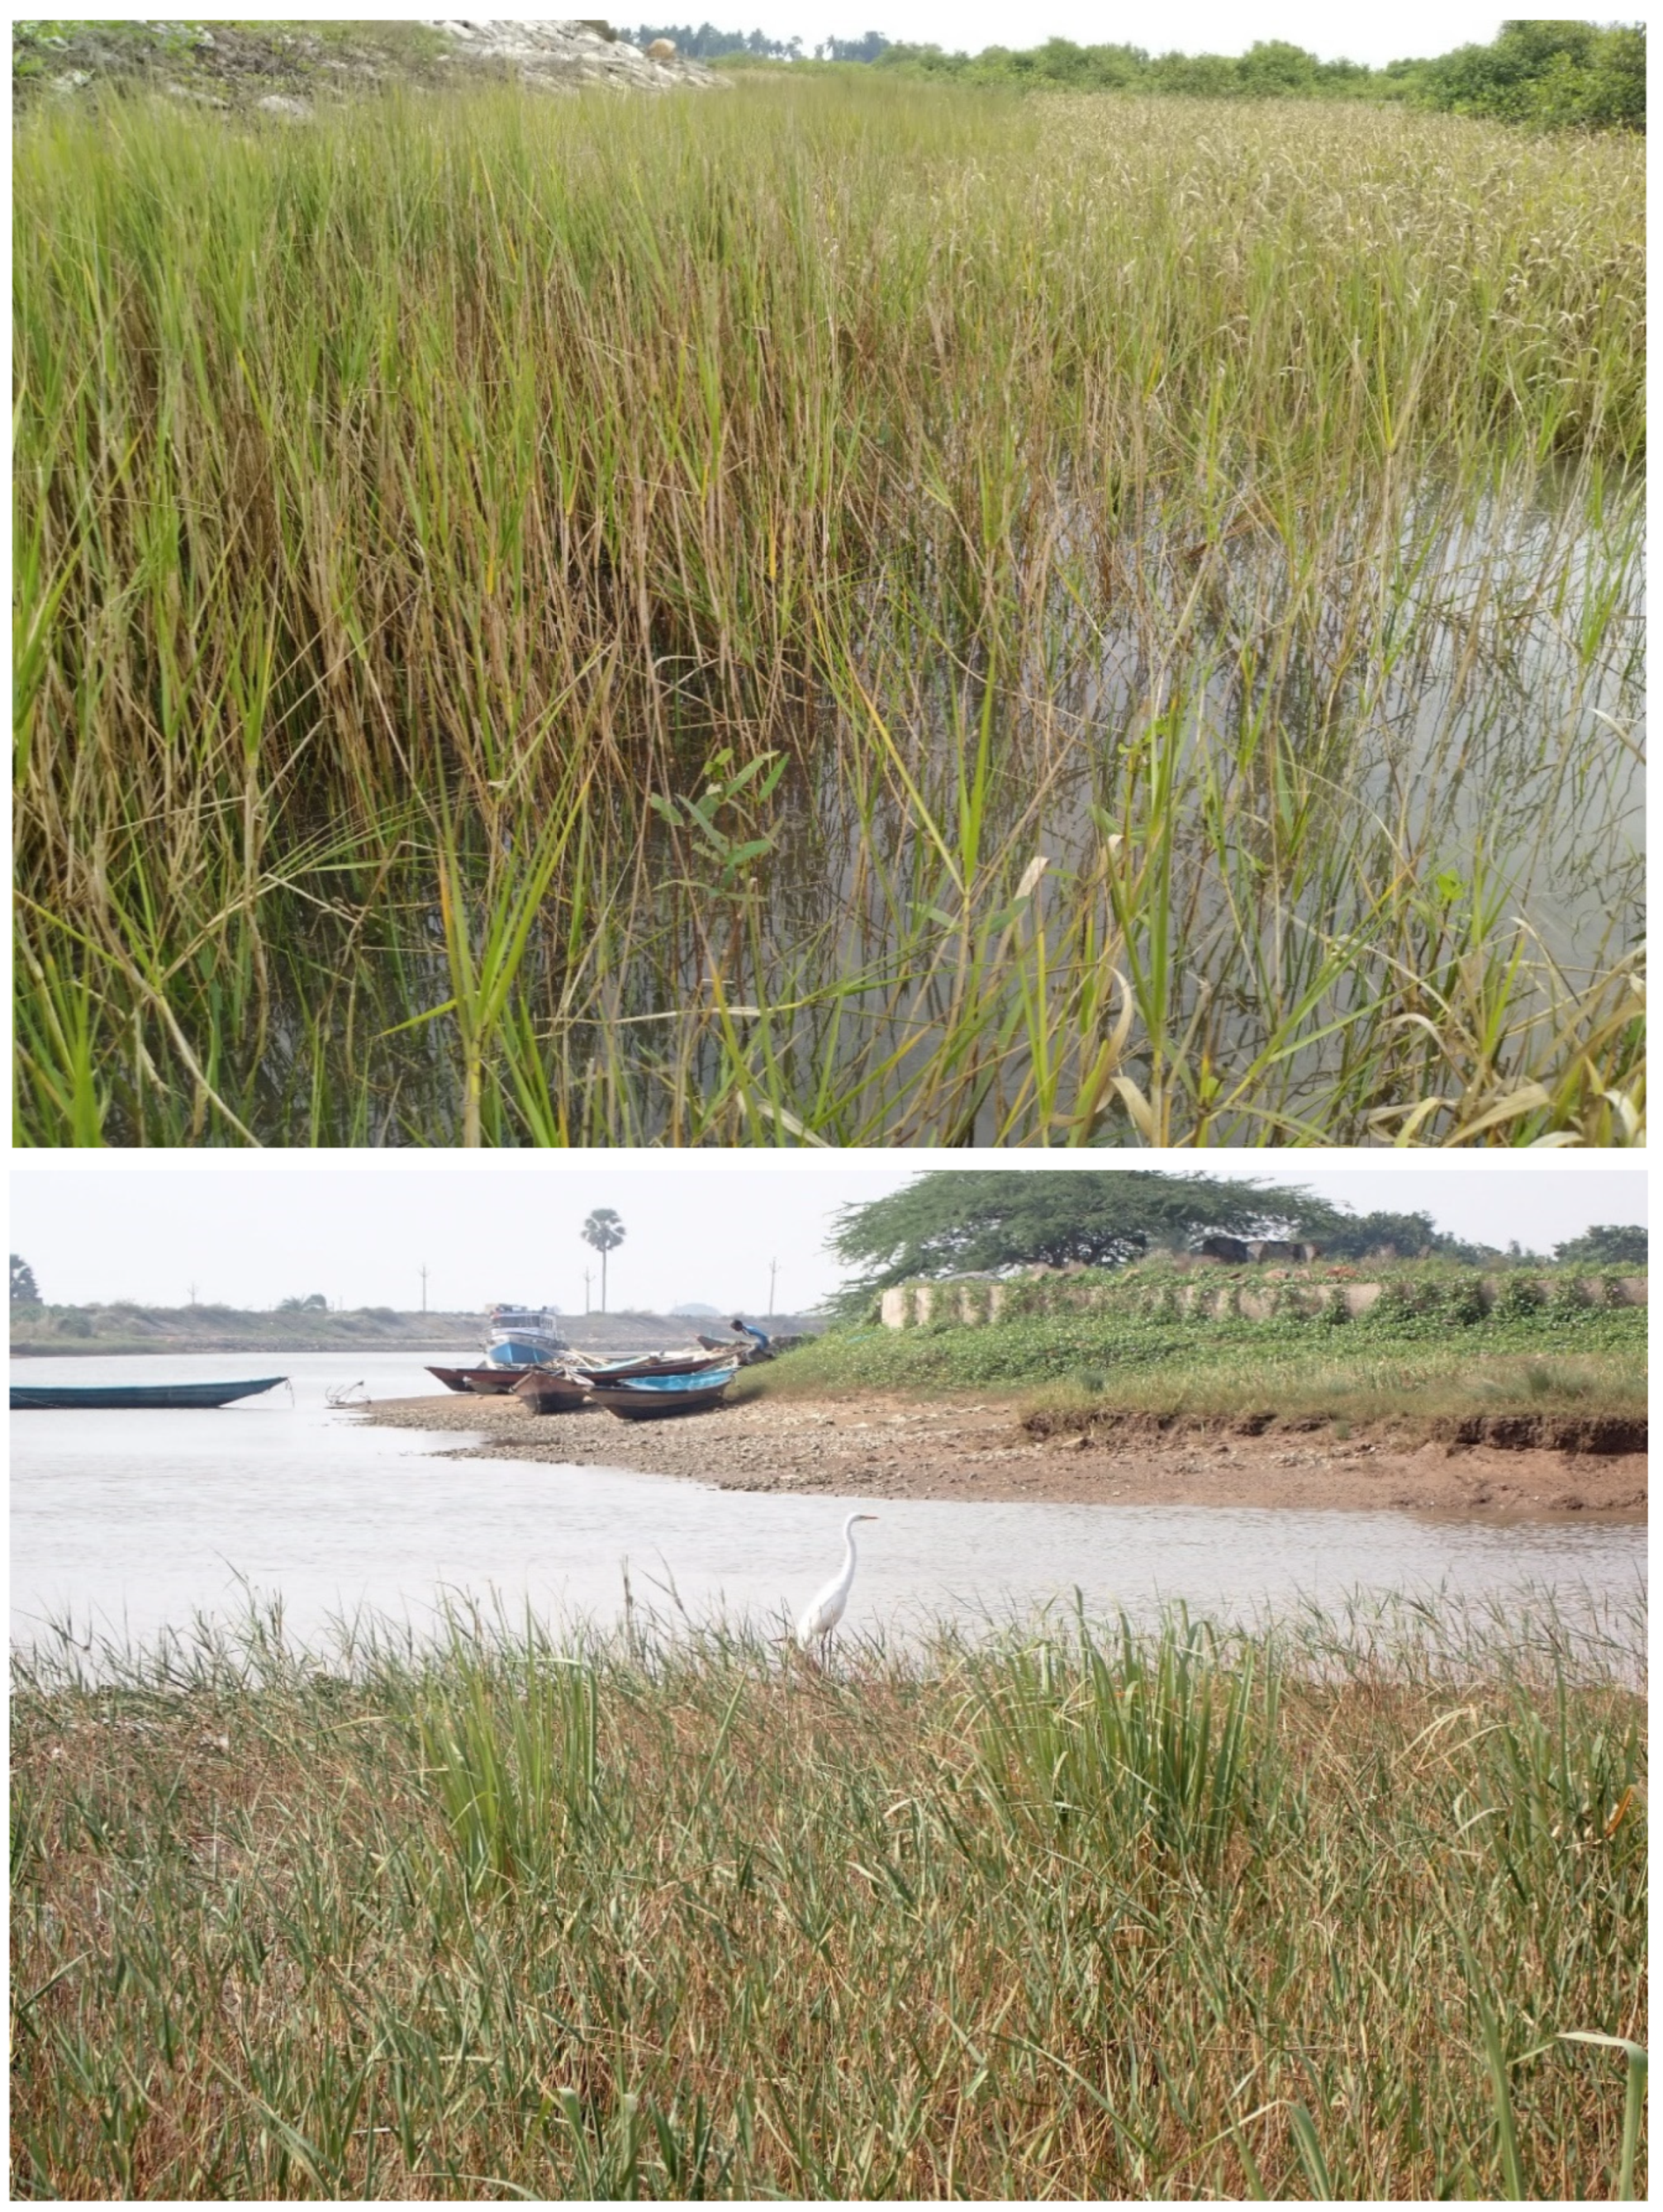
We used a hand-held GPS to mark the total P. coarctata meadow area during seasonal sampling. The mono-specific P. coarctata meadows was found mostly present in the lower intertidal zone that received daily tidal flooding with occasional presence of another saltmarsh species such as Myrostachia wightiana, that was present only at Astaranga and Rushikulya locations (Figure 2). Except Astaranga, all other three estuarine area receives anthropogenic input and are subjected to habitat modification and land use changes for coastal development, such as port development and dredging (i.e., at Dhamra Port), beach modification for development of stone walls and coastal roads (i.e., at Chandipur and Rushikulya). Seasonal sampling of sediment and saltmarsh plants (for biomass) was collected once in pre-monsoon (February-May 2021) and post-monsoon (November-January 2022). Surface water (n=5) above saltmarsh ecosystems of each location was measured for pH and temperature (HI991301P, Hannah Instruments) and salinity (HI98203, Hannah Instruments) using hand held probes in each season.

2.2. Sediment Sampling and Analysis

Five replicate cores at least 1m apart, were collected from P. coarctata meadows using a stainless-steel sediment core (30 cm long and 5cm diameter) across the four study locations. The sediment core compaction was measured in the field and capped at both ends, stored in dark ice boxes and transported to the laboratory. In the laboratory, the total length of the sediment cores was measured and then sectioned at 5 cm intervals (5, 10, 15, 20, 25, 30 cm). Then each section was oven dried at 60°C for 48 hr to derive the sediment dry bulk density (DBD: g DW cm-3; Eq.1) following the blue carbon manual (Howard et al., 2014). The sediment Corg density (SCD; g cm-3; Eq.2) was calculated by multiplying the DBD with sediment Corg content (%). Sediment samples were then homogenized using a grind mill (Retsch, RS 200, USA). From this homogenized sediment 5 g was used in a muffle furnace at 550° C for 6 hr to determine the percentage loss on ignition (LOI%; Eq.3) of organic matter (OM) for each fraction of the sediment core.
D B D = ( w e i g h t   o f   d r y   s e d i m e n t ) / ( c o r e   v o l u m e )
S C D = D B D   x   % C o r g
L O I   ( % ) = [ A B A ] 100
Where A is the initial weight of the sample and B is the amount of sample left after LOI test.
From the remaining homogenized sediment for each fraction 0.30 mg was acidified (1M HCl) to remove carbonates from the sediment. After the addition of HCl, the sediment samples were stored in a fume hood chamber, till no further bubble formation was detected. Then the sediment samples were placed in hot air oven at 60°C for 24 hours untill it completely dried. These dried sediment samples were analyzed in duplicate for composition of carbon (C), nitrogen (N) elemental concentrations and stable isotopes (13C and 15N) using a Flash Elemental Analyzer coupled to a Delta V IRMS {Isotope mass ratio spectrometer, Euro Vector (EA3028 EA-Nu)}. In-house standards, acetanilide (Iacet#1, δ15N= 1.18‰, δ13C=-29.53‰) were used for calibration and determination of the precision (0.2‰). Ratios of 13C/12C and 15N/14N were expressed as the relative difference (‰) between the sample and the conventional standard, Vienna Pee Dee Belemnite (VPDB) and atmospheric air for C and N respectively.
The IsoSource software (version 1.3.1) developed by the Environmental Protection Agency of the United States was used to estimate the contribution of various sources of Corg to the sediment OM of P. coarctata meadows across the four locations and both seasons (Phillips et al., 2005; Phillips and Gregg, 2001). A standard linear mixing model was used to find the source proportions that maintain the mass balance of all isotopes (Phillips and Gregg, 2001). This model calculates the ranges of all relative proportions of various sources to a mixture by evaluating all feasible combinations of each contributing source (0 to 100%), which are evaluated in small 1% increments. The δ13C values of P. coarctata (-28.5‰), C4 plants (-14.5‰), particulate organic matter (POM; -21.4‰) are used to estimate the relative contribution from three sources to the bulk OM in P. coarctata sediment beds. The δ13C values for POM and C4 plants were derived from other studies related to the coast of Odisha (Saha et al., 2022). For running the model, two parameters were set: the source increment set at 1% and the other was mass balance tolerance, which was set at 0.01‰ (Zhang et al., 2020). The mass balance tolerance at 0.01‰ indicates that the difference between the sum of the weighted isotopic values for each source and the acceptor isotopic values does not exceed 0.01‰.
The total Corg (Mg C ha-1) in the sediment was calculated by adding the total Corg of each sediment core fraction of the individual saltmarsh species (Howard et al., 2014).
Sediment carbon stocks (g C m-2)
= A m o u n t   o f   c a r b o n   i n   c o r e   s e c t i o n   A   ( g c m 2 ) = A m o u n t   o f   c a r b o n   i n   c o r e   s e c t i o n   B   ( g c m 2 )
+ A m o u n t   o f   c a r b o n   i n   c o r e   s e c t i o n   C   ( g c m 2 )
Total core carbon (Mg C ha-1)
= S u m m e d   c o r e   c a r b o n   { A + B + C ( g m 2 ) ( M g 1000,000 ) ( 100,000,000 h a ) }

2.3. Saltmarsh Plant Sampling and Analysis

Five random quadrats (20 cm x 20 cm) at least 1m apart from the four locations was sampled to collect saltmarsh biomass samples across each season. From each quadrat the saltmarsh plants were dug up using a hand-held spade from 10 cm depth. Then these plant samples with their roots attached were washed of any debris in the field with saltwater and stored in zip-locked plastic bags and brought to the laboratory. In the laboratory, plant samples were washed again with distilled water and any epiphytes on the leaf or shoot surface was cleaned off with a glass slide. Shoot density (individual shoots m-2) was quantified by counting the total number of plant individual shoots per quadrat. Then the plant was separated in above-ground (AG: leaves) and below-ground (BG: roots+ rhizomes) biomass and oven dried at 60° C for 72 hr. These dried biomass samples were weighed first for dry biomass values (g DW m-2) and then homogenized in the grind mill(model??). Duplicate homogenized samples of 0.5 mg were used to derive the elemental and isotopic C and N composition following the methods described for the sediment samples above.
The total carbon stocks in the biomass of the P. coarctata meadow area were calculated by multiplying the mean Corg present in saltmarsh biomass and the meadows size for that location.
Biomass   carbon   stocks   ( Mg   C   ha - 1 ) = B i o m a s s   ( g   / m 2 ) C ( % ) ( M g 1000000 ) ( 10000 h a ) .  
The total carbon stock in the biomass and in the sediment core (30 cm) was added to calculate the total carbon stock in these saltmarsh ecosystems. The carbon dioxide (CO2) equivalent (Mg CO2 ha-1) was calculated by multiplying the CO2 conversion factor (3.67) by the mean carbon stocks of the saltmarsh ecosystems (Howard et al., 2014) and upscaled towards the total P. coarctata meadow area for each location.

2.4. Valuation of Carbon Stocks

The social cost of carbon (SSC) indicates the economic cost associated with climate change related damage (or benefit) as a result of emission of one ton of CO2 or its equivalent (Nordhaus, 2017; Ricke et al., 2018). This present study utilizes the regional approach to estimate SSC, rather than the global approach, as country level regional estimates allow better understanding of regional impacts of carbon emissions and are important for better adaptation and compensation measures (Ricke et al., 2018). We used the recent estimate of SSC for India which is US$ 86 per ton of CO2 used (Ricke et al., 2018. Recent US$ to Indian rupees (INR conversion (USD$1= 83.11 INR) was used to estimate the price of CO2 in INR.

2.6. Statistics

A two-way ANOVA was used to assess the statistical significance between, surface water physical parameters, sediment OM, total C and N content, stable isotopes (δ15N and δ13C), Corg stocks, saltmarsh plant shoot densities, biomass and Corg stocks using the locations and seasons as fixed factors. All data was pre-checked for normality and homogeneity of variance using a Shapiro-Wilk and Levine’s test respectively. In case of non-homogenous variances, data were ln (x+1) transformed. Pearson correlation was used to derive seasonal relationship between abiotic factors of surface water of P. coarctata meadows and the sediment OM and Corg content of only top 10 cm. All statistical tests were conducted at a significance level of p<0.05. Graph pad Prism software (Ver. 10.1.0) was used for all statistical analysis. Data is presented as mean and standard deviation (SD).

3. Results

3.1. Seasonal Variation in Physical Parameters

The physical parameters of the surface water column of P. coarctata varied significantly for both season and locations except for pH, which was only significantly different seasonally (two-way anova; F 1, 32 = 55.47, p<0.001) between locations (Table 1). In general, the pH was lower in post-monsoon compared to pre-monsoon season. The lowest pH of surface water in pre-monsoon was observed at the Astaranga (7.96 ± 0.07), whereas the lowest pH in post-monsoon was observed at the surface waters of Dhamra (7.65 ± 0.24) (Table 1). The salinity was higher in pre-monsoon season compared to post-monsoon across the four study locations. The lowest and the highest salinity across the four locations in each season was observed at Astaranga (24.6 ±0.41; 9.37 ±1.91) and at Rushikulya (30.91 ± 0.77; 22 ± 1.10) respectively (Table 1). Surface water temperature of P. coarctata meadows followed a gradient in both seasons from low temperature in the north (Chandipur) to higher temperature in the south (Rushikulya) study locations (Table 1). The lowest (22.84 ± 1.39; 20.20 ± 0.37) and the highest (33.50 ± 1.16; 31.78 ± 0.78) temperature in pre- and post-monsoon season was observed at Chandipur and Rushikulya respectively (Table 1).

3.2. Seasonal Variation in P. coarctata Sediment Variables and Carbon Stocks

The sediment DBD varied significantly with depth across season (F 11,192=18.71, p<0.001) and locations (F 3,192=103.1, p< 0.0001) (See Supplementary S1). The DBD of the sediment was 1.2-fold higher in post-monsoon season compared to the pre-monsoon. In both seasons, the highest DBD was observed in the sediment section of Astaranga (at upper 5cm depth) and the lowest in the sediment section of Chandipur at 25-30 cm depth (Supplementary S1).
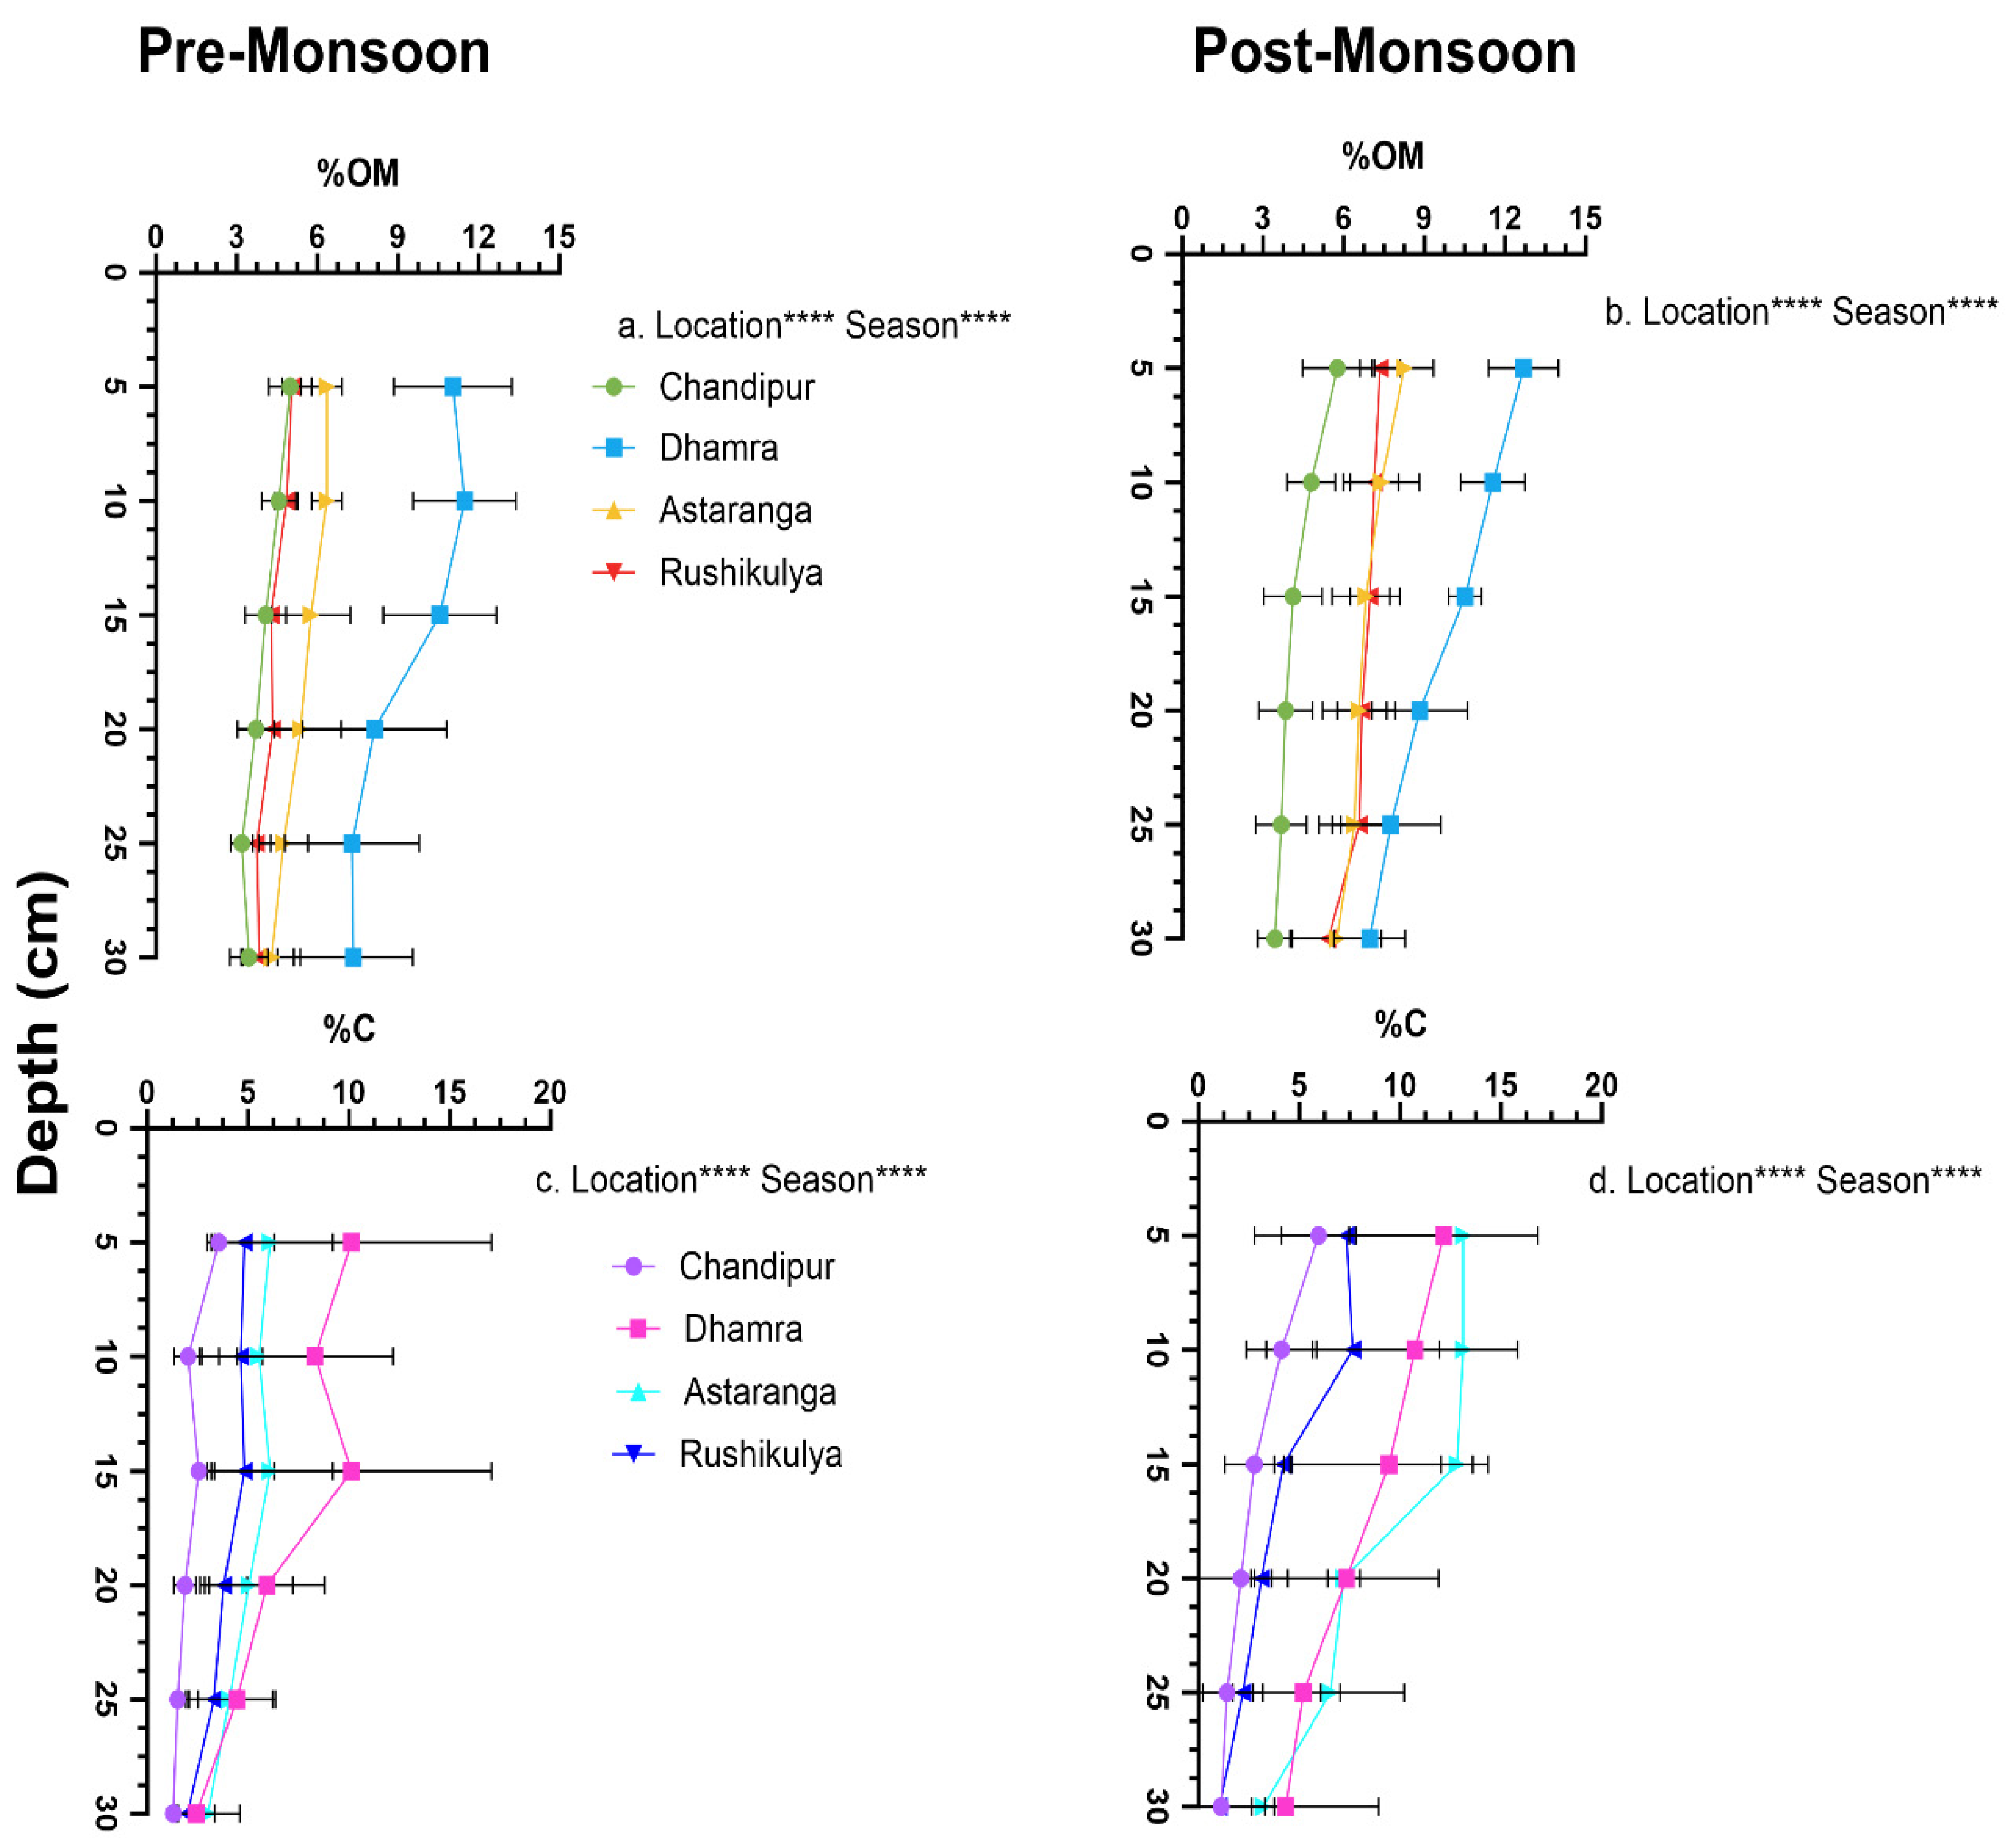
The sediment OM varied significantly with depth across seasons (F 11,92=13.81, p<0.0001) and locations (F 3, 192= 168.5, p<0.0001) (Figure 3). The sediment OM content was 1-fold higher in post-monsoon season compared to pre-monsoon across depths (Figure 3a &b). The highest sediment OM content was observed in the upper 10 cm (11.47 ± 1.92% OM) and 5cm (12.68 ± 1.30% OM) depth of the sediment core sections at Dhamra in preand post-monsoon season respectively, whereas the lowest sediment OM content (3.19–3.44% OM) was observed in the depth of 25 to 30 cm in sediment sections of Chandipur across both seasons (Figure 3 a &b).
The sediment OM content influenced the sediment Corg, that varied significantly with depth across seasons (F 33, 190= 1.8, p=0.006) and locations (F 3,190=72.4, p<0.0001) (Figure 3). The sediment Corg was 1.2-fold higher across depths in post-monsoon compared to pre-monsoon season throughout the locations. The highest sediment Corg content in pre-and post-monsoon was observed in the 15cm depth (12.31 ± 0.78 %C) and 5cm depth (13.14 ± 0.30% C) of the core sections respectively from Astaranga (Fig3c &d). Similarly, the lowest Corg content in pre- and post-monsoon was observed at Chandipur at core sections 10 (2.03 ± 0.68 %C) and 25 cm (2.41 ± 0.78 %C) depth respectively (Figure 3c&d). The sediment Corg stocks, varied significantly between seasons (F 1,32= 22.05, p<0.0001) and locations (F 3,32=18.6, p<0.0001) and were 1.8-fold higher in post-monsoon compared to pre-monsoon season across the four locations (Supplementary S2). Interestingly the sediment N content was very low (0.01%) across locations and seasons.
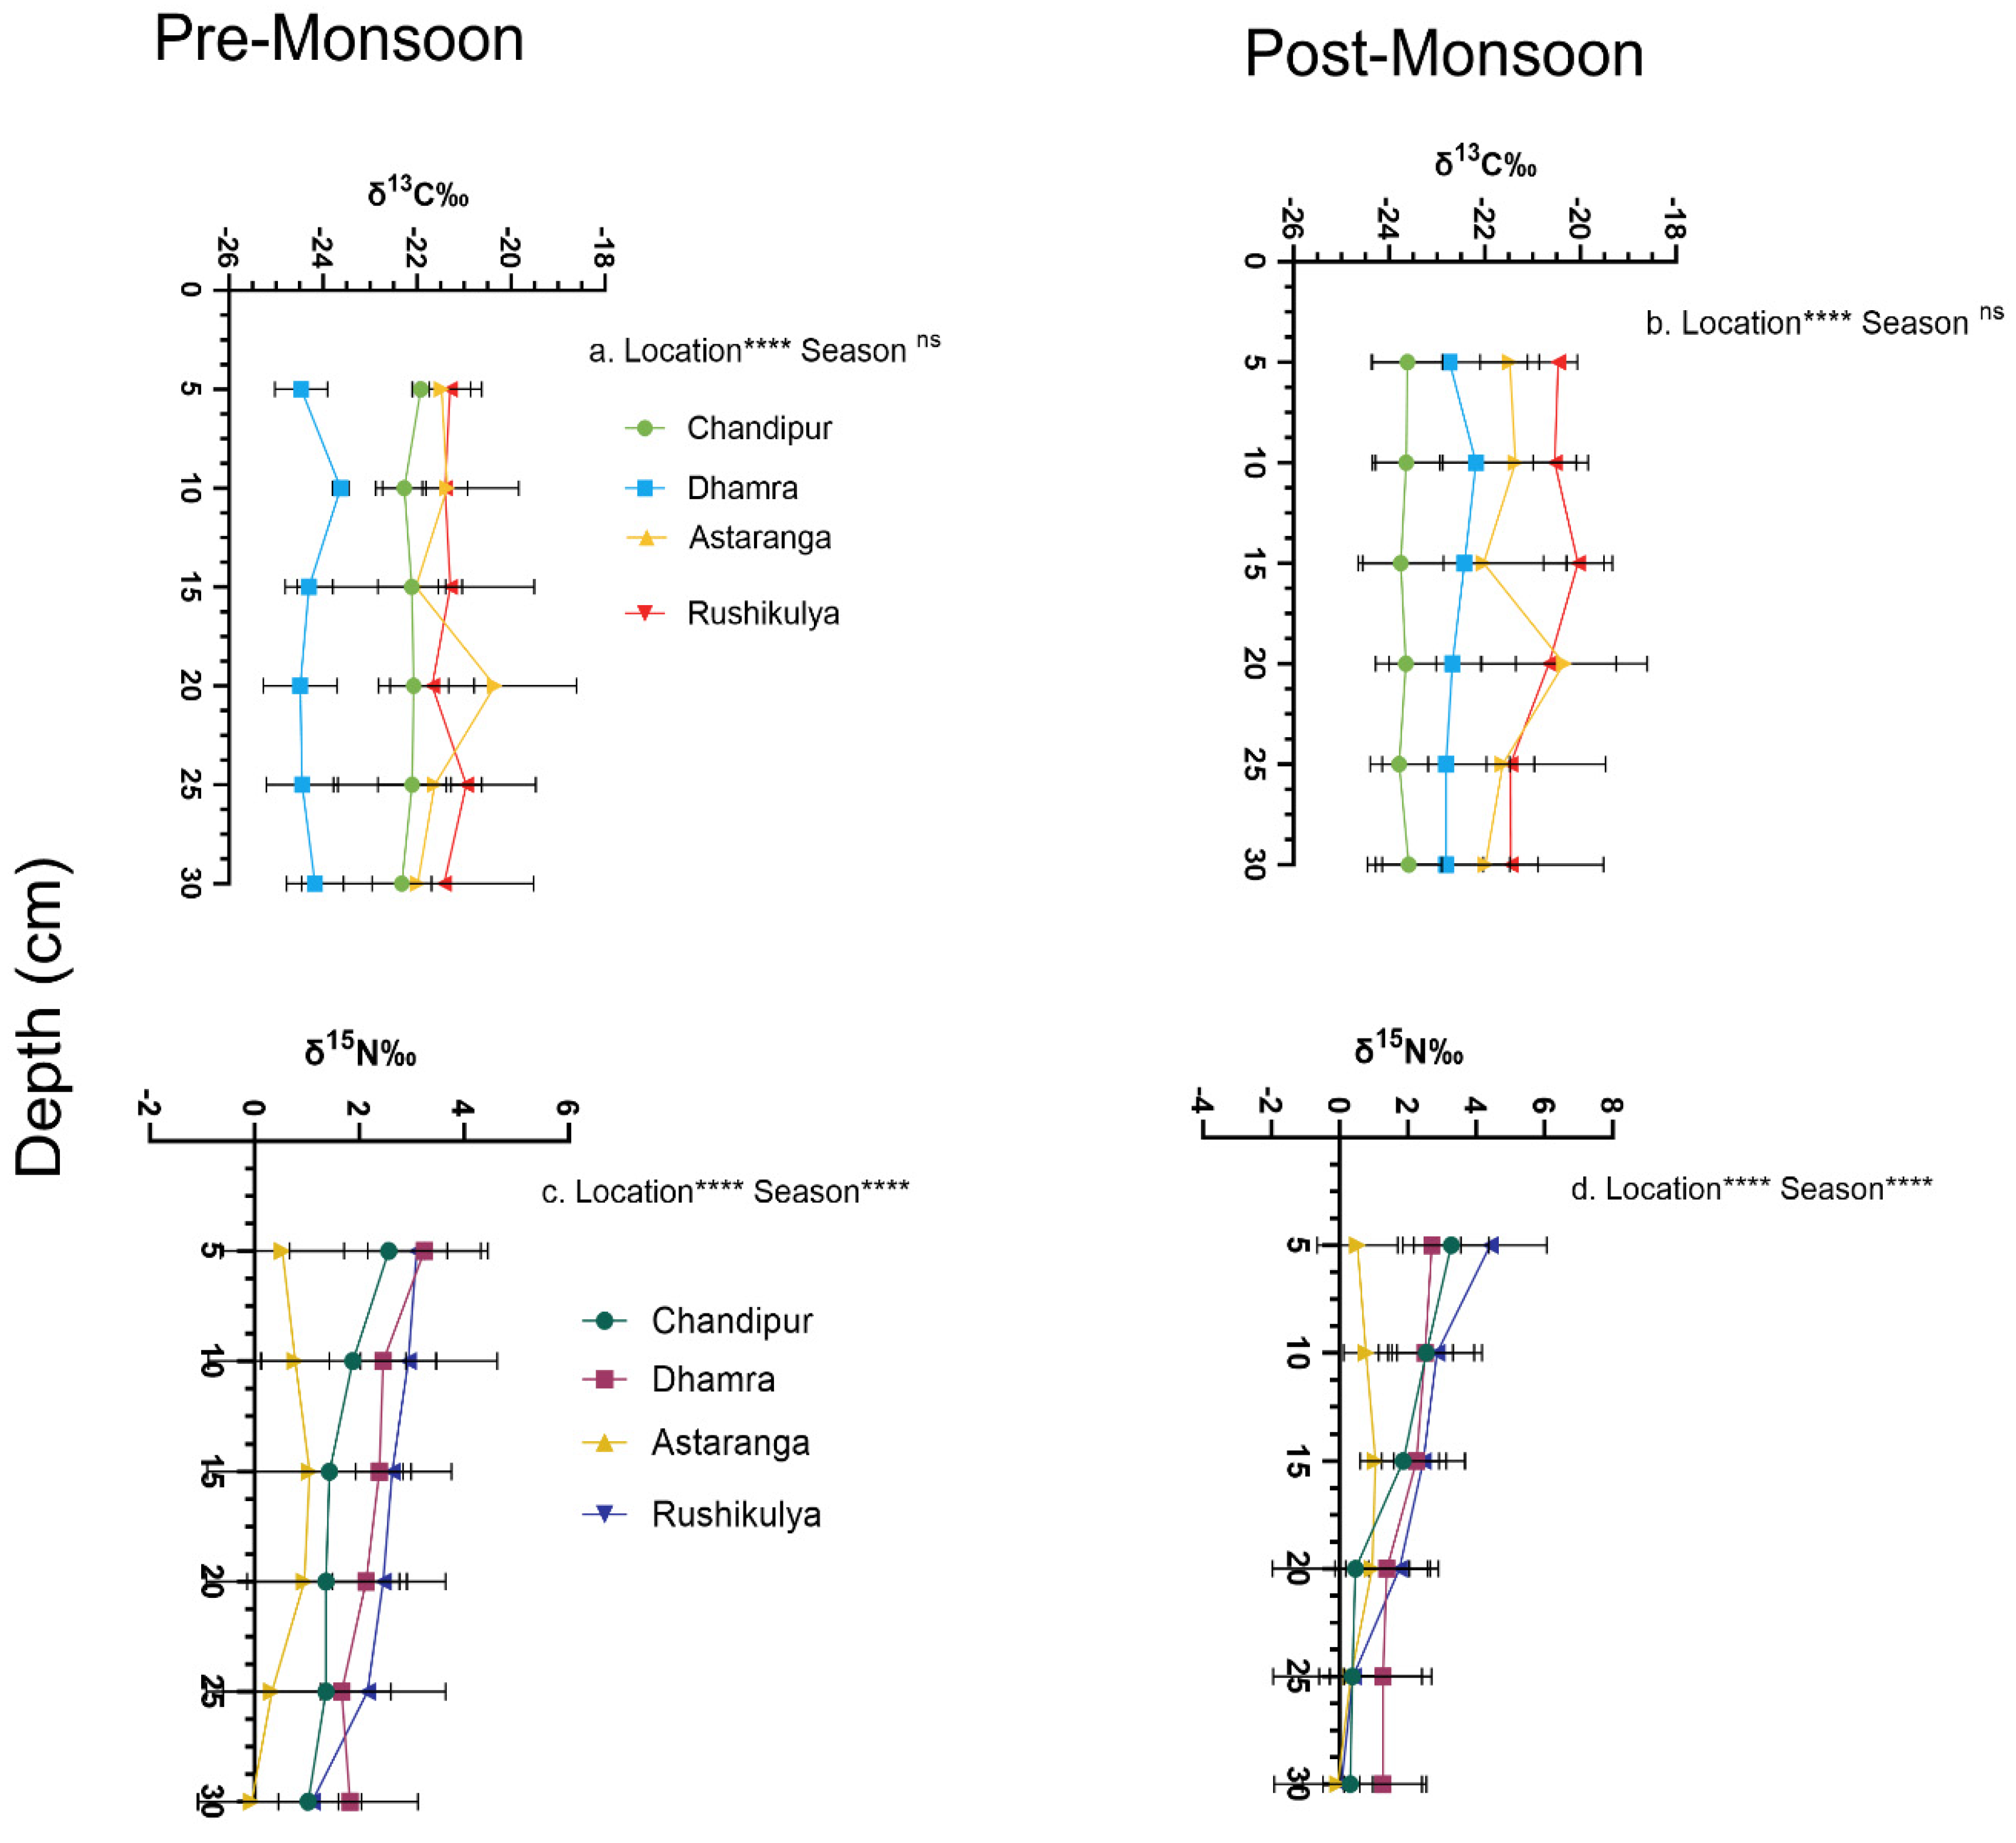
The δ13C values of the sediment core sections varied significantly only across locations (F 3,192 = 49.00, p<0.001), with no significant seasonal effect (Figure 4). The heavier and lighter isotopes of δ13C in post-monsoon were observed in the sediment section at15 cm (-20.04 ± 0.72 ‰) and 25 cm (-23.79 ± 0.61‰) respectively at Rushikulya. Interestingly, the heavier and lighter isotopes of δ13C in pre-monsoon were observed at the sediment core section of 20 cm at Astaranga (-20.34 ± 1.73 ‰) and Dhamra (-24.48 ±0.78 ‰) respectively. The δ15N values of the sediment core sections varied significantly across both locations (F 3,192 = 19.26, p<0.001) and seasons (F 11, 192= 6.17, p<0.001) (Figure 4). In general, heavier δ15N isotopes were observed in post-monsoon compared to pre-monsoon season. The heavier isotopes of δ15N in pre-and post-monsoon season were observed at the upper 5cm of the core section at Dhamra (3.24 ± 1.08 ‰) and Rushikulya (4.41 ±1.66 ‰). Interestingly, for both seasons the lighter N isotopes were observed at 30 cm of the core section at Astaranga within a range of -0.05 to -0.04 ‰ (Figure 4). The fractional contribution of various C sources showed to the sediment Corg of P. coarctata meadows across seasons are presented in Figure 5. The contribution of POM is higher followed by P. coarctata (autochthonous) and contributions of C4 plants (i.e., M. wightiana).
The corelationship of surface water column abiotic parameters on sediment OM and C was location-specific and significant in both seasons (Supplementary S4). In general, surface water salinity showed negative corelationship with sediment Corg (-0.87; p=0.04) and OM (-0.86; p=0.05) at Chandipur in both pre-monsoon and post-monsoon respectively. The surface water column pH showed positive corelationship with sediment Corg at Chandipur (0.95; p=0.005) and Astaranga (0.86; p=0.01) only in post-monsoon season. The surface water temperature showed positive corelationship with sediment Corg only in post-monsoon season at Dhamra (0.86, p=0.05) (Supplementary S4).

3.3. Seasonal Variation in P. coarctata Density, Biomass and Carbon Stocks

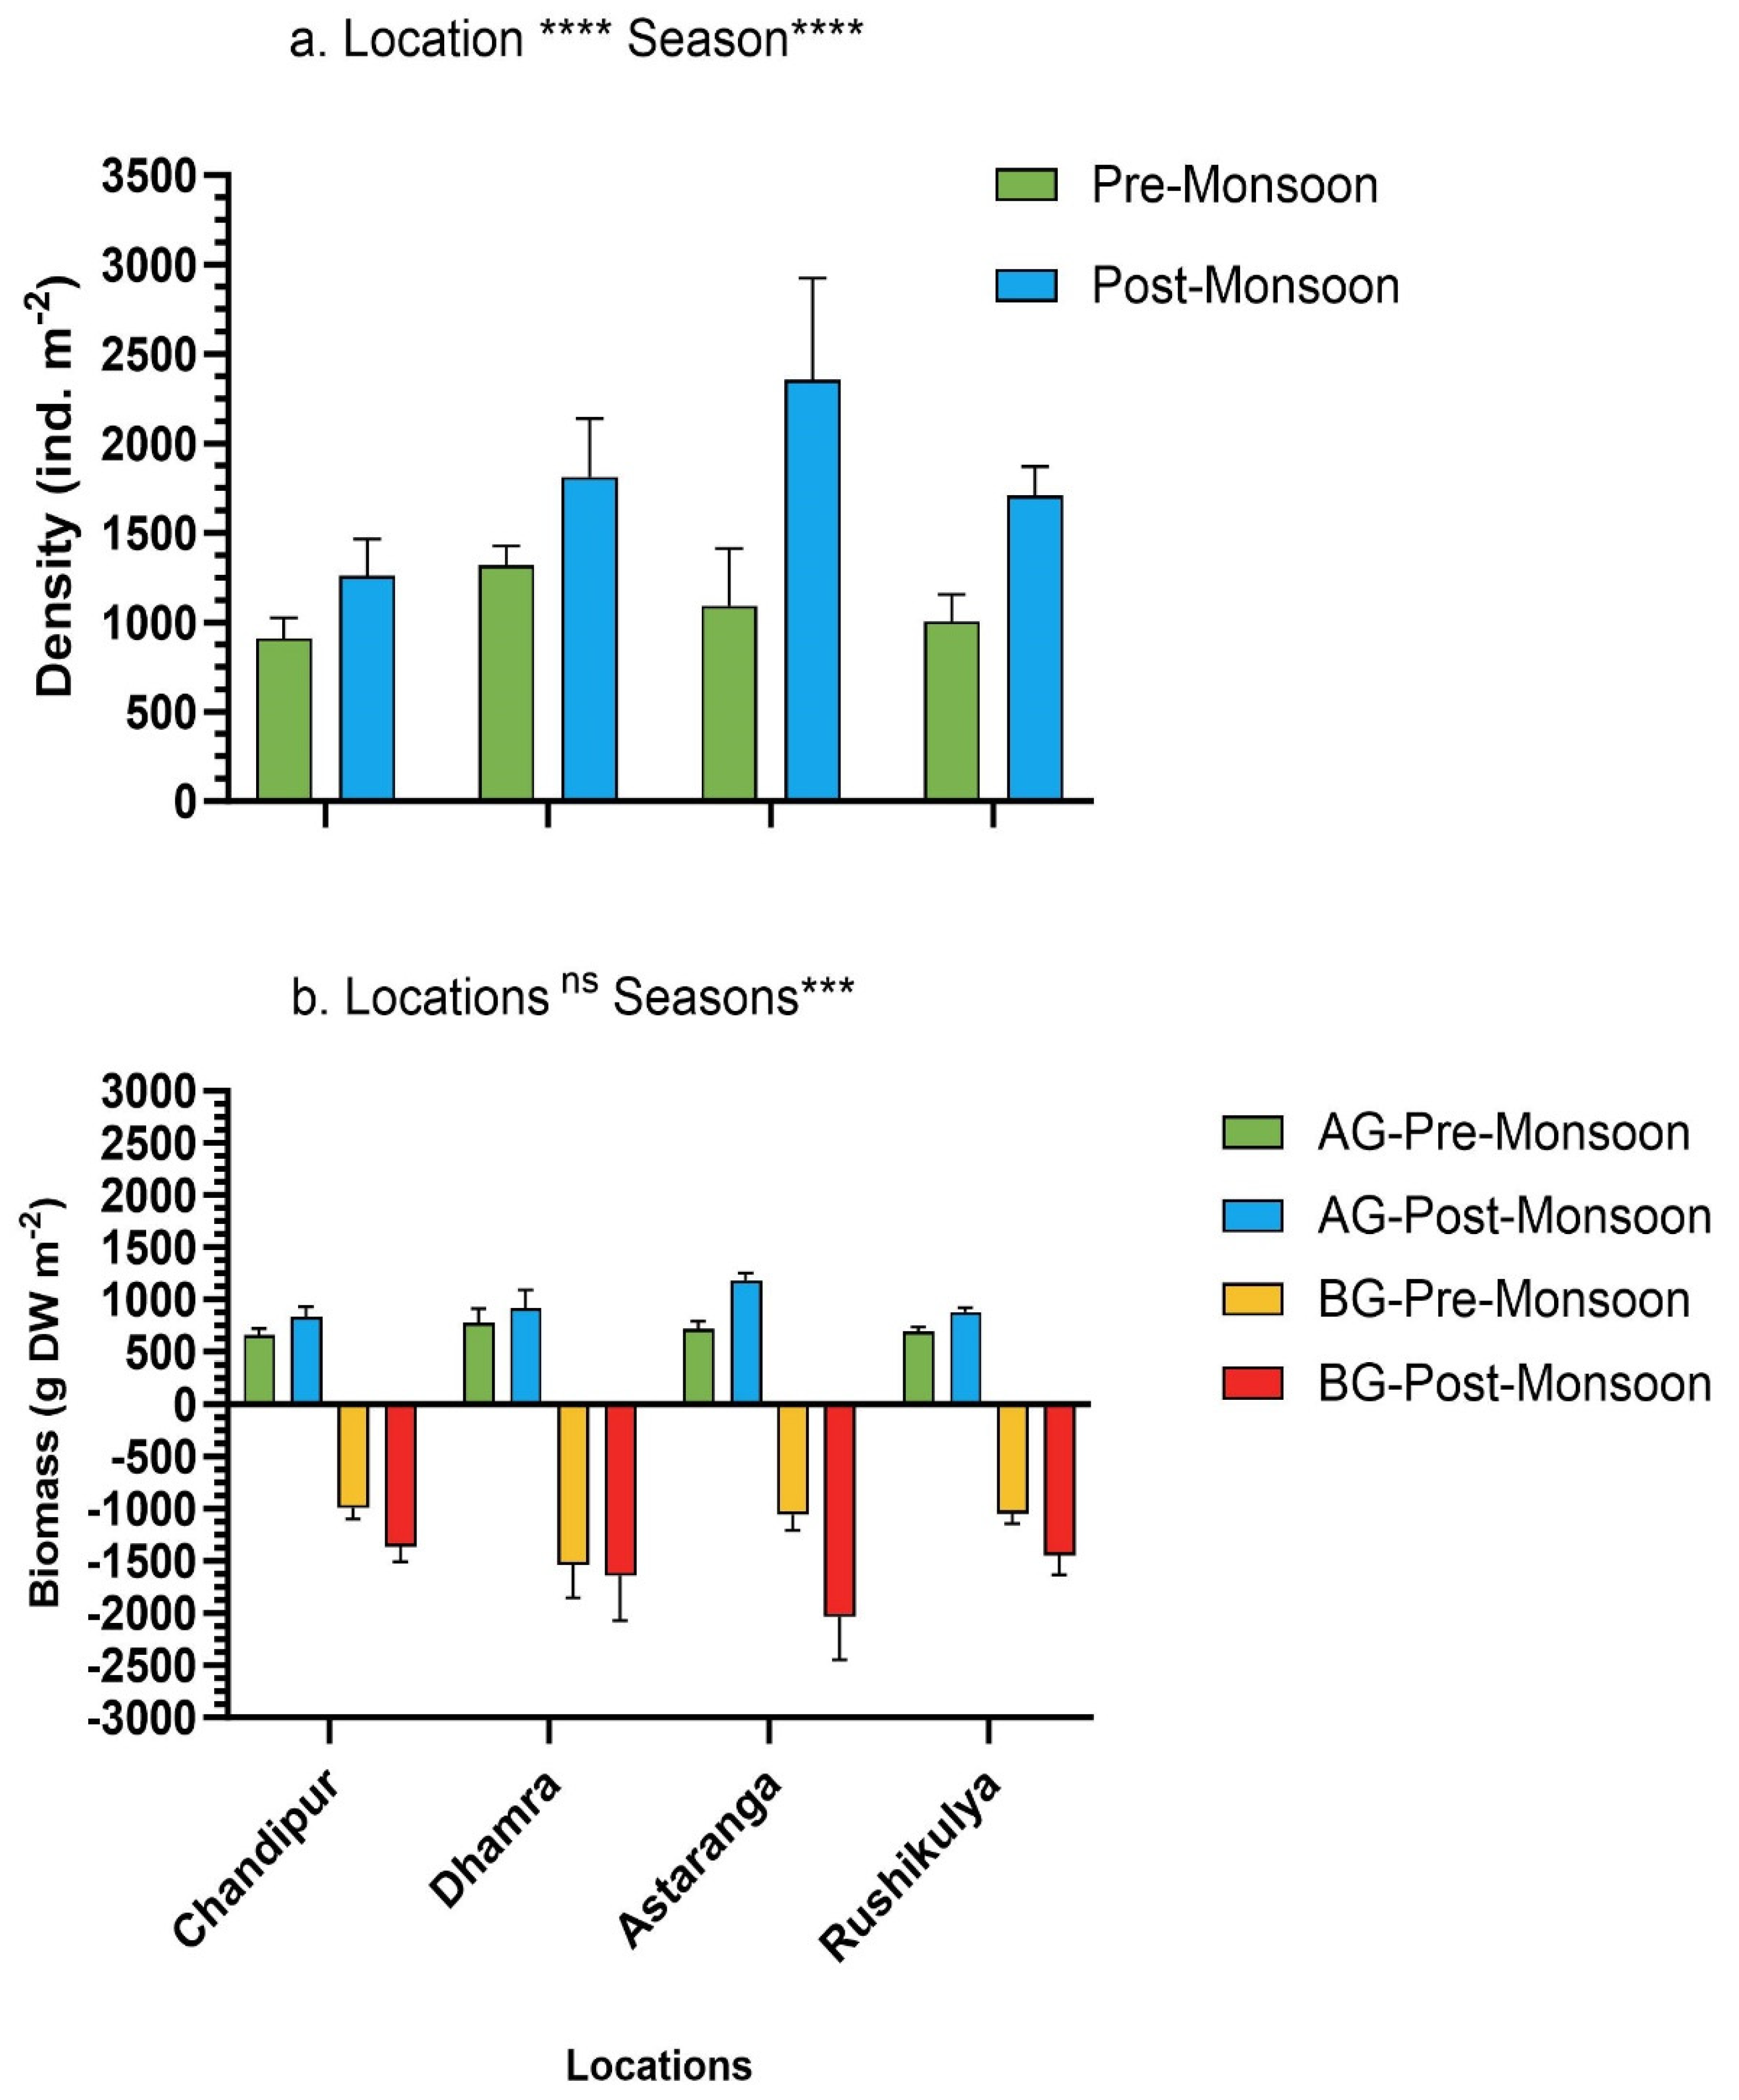
The shoot density of P. coarctata varied significantly across both seasons (F 1,72 =127.5, p<0.001) and the four locations (F 3,72= 17.97, p<0.001) (Figure 6a). In general, the shoot density of P. coarctata in post-monsoon season was 1.6-fold higher compared to pre-monsoon season (Figure 5). The highest density of P. coarctata in pre-monsoon and post-monsoon season was observed at Dhamra (1319.28 ± 109.86 ind. m-2) and Astaranga (2354.76 ± 570.29 ind.m-2) locations respectively. In contrast, the lowest density of P. coarctata in both seasons was observed at Chandipur (Figure 6).
The AG- and BG-biomass of P. coarctata varied significantly only between seasons (F 3,64 = 864.4, p<0.0001) and not between locations (Figure 6b). In general, the AG and BG-biomass of P. coarctata was 1.3-fold and 1.4-fold higher in post-monsoon compared to pre-monsoon season (Figure 6b). The highest and lowest AG and BG-biomass was observed at Astaranga (1180.55 ± 71.59 g DW m-2; 2038.03 ± 407.44 g DW m-2) and Chandipur (836.66 ± 92.54 g DW m-2; 1361.75 ± 147.53 g DW m-2) respectively in each season (Figure 5b). The total biomass Corg stocks were 1.4-fold higher in the post-monsoon season compared to pre-monsoon. (Supplementary S2).
The δ13C showed no variation between seasons, whereas δ15N in the biomass of P. coarctata were significant and different between locations (F 3,64=8.48, p<0.0001) and seasons (F 3,64 = 8.34, p<0.0001) (Supplementary S3). The heavier δ15N were observed in post-monsoon compared to pre-monsoon season in both AG and BG-biomass of P. coarctata. In AG-biomass the heavier isotopes of N were observed at Astaranga (7.19 ± 0.05 ‰) and in BG-biomass it was observed at Chandipur (6.02 ± 0.65 ‰) (Supplementary S3).

3.4. Ecosystem Carbon Stocks and Different Source Contribution to Sediment Organic Carbon Pool

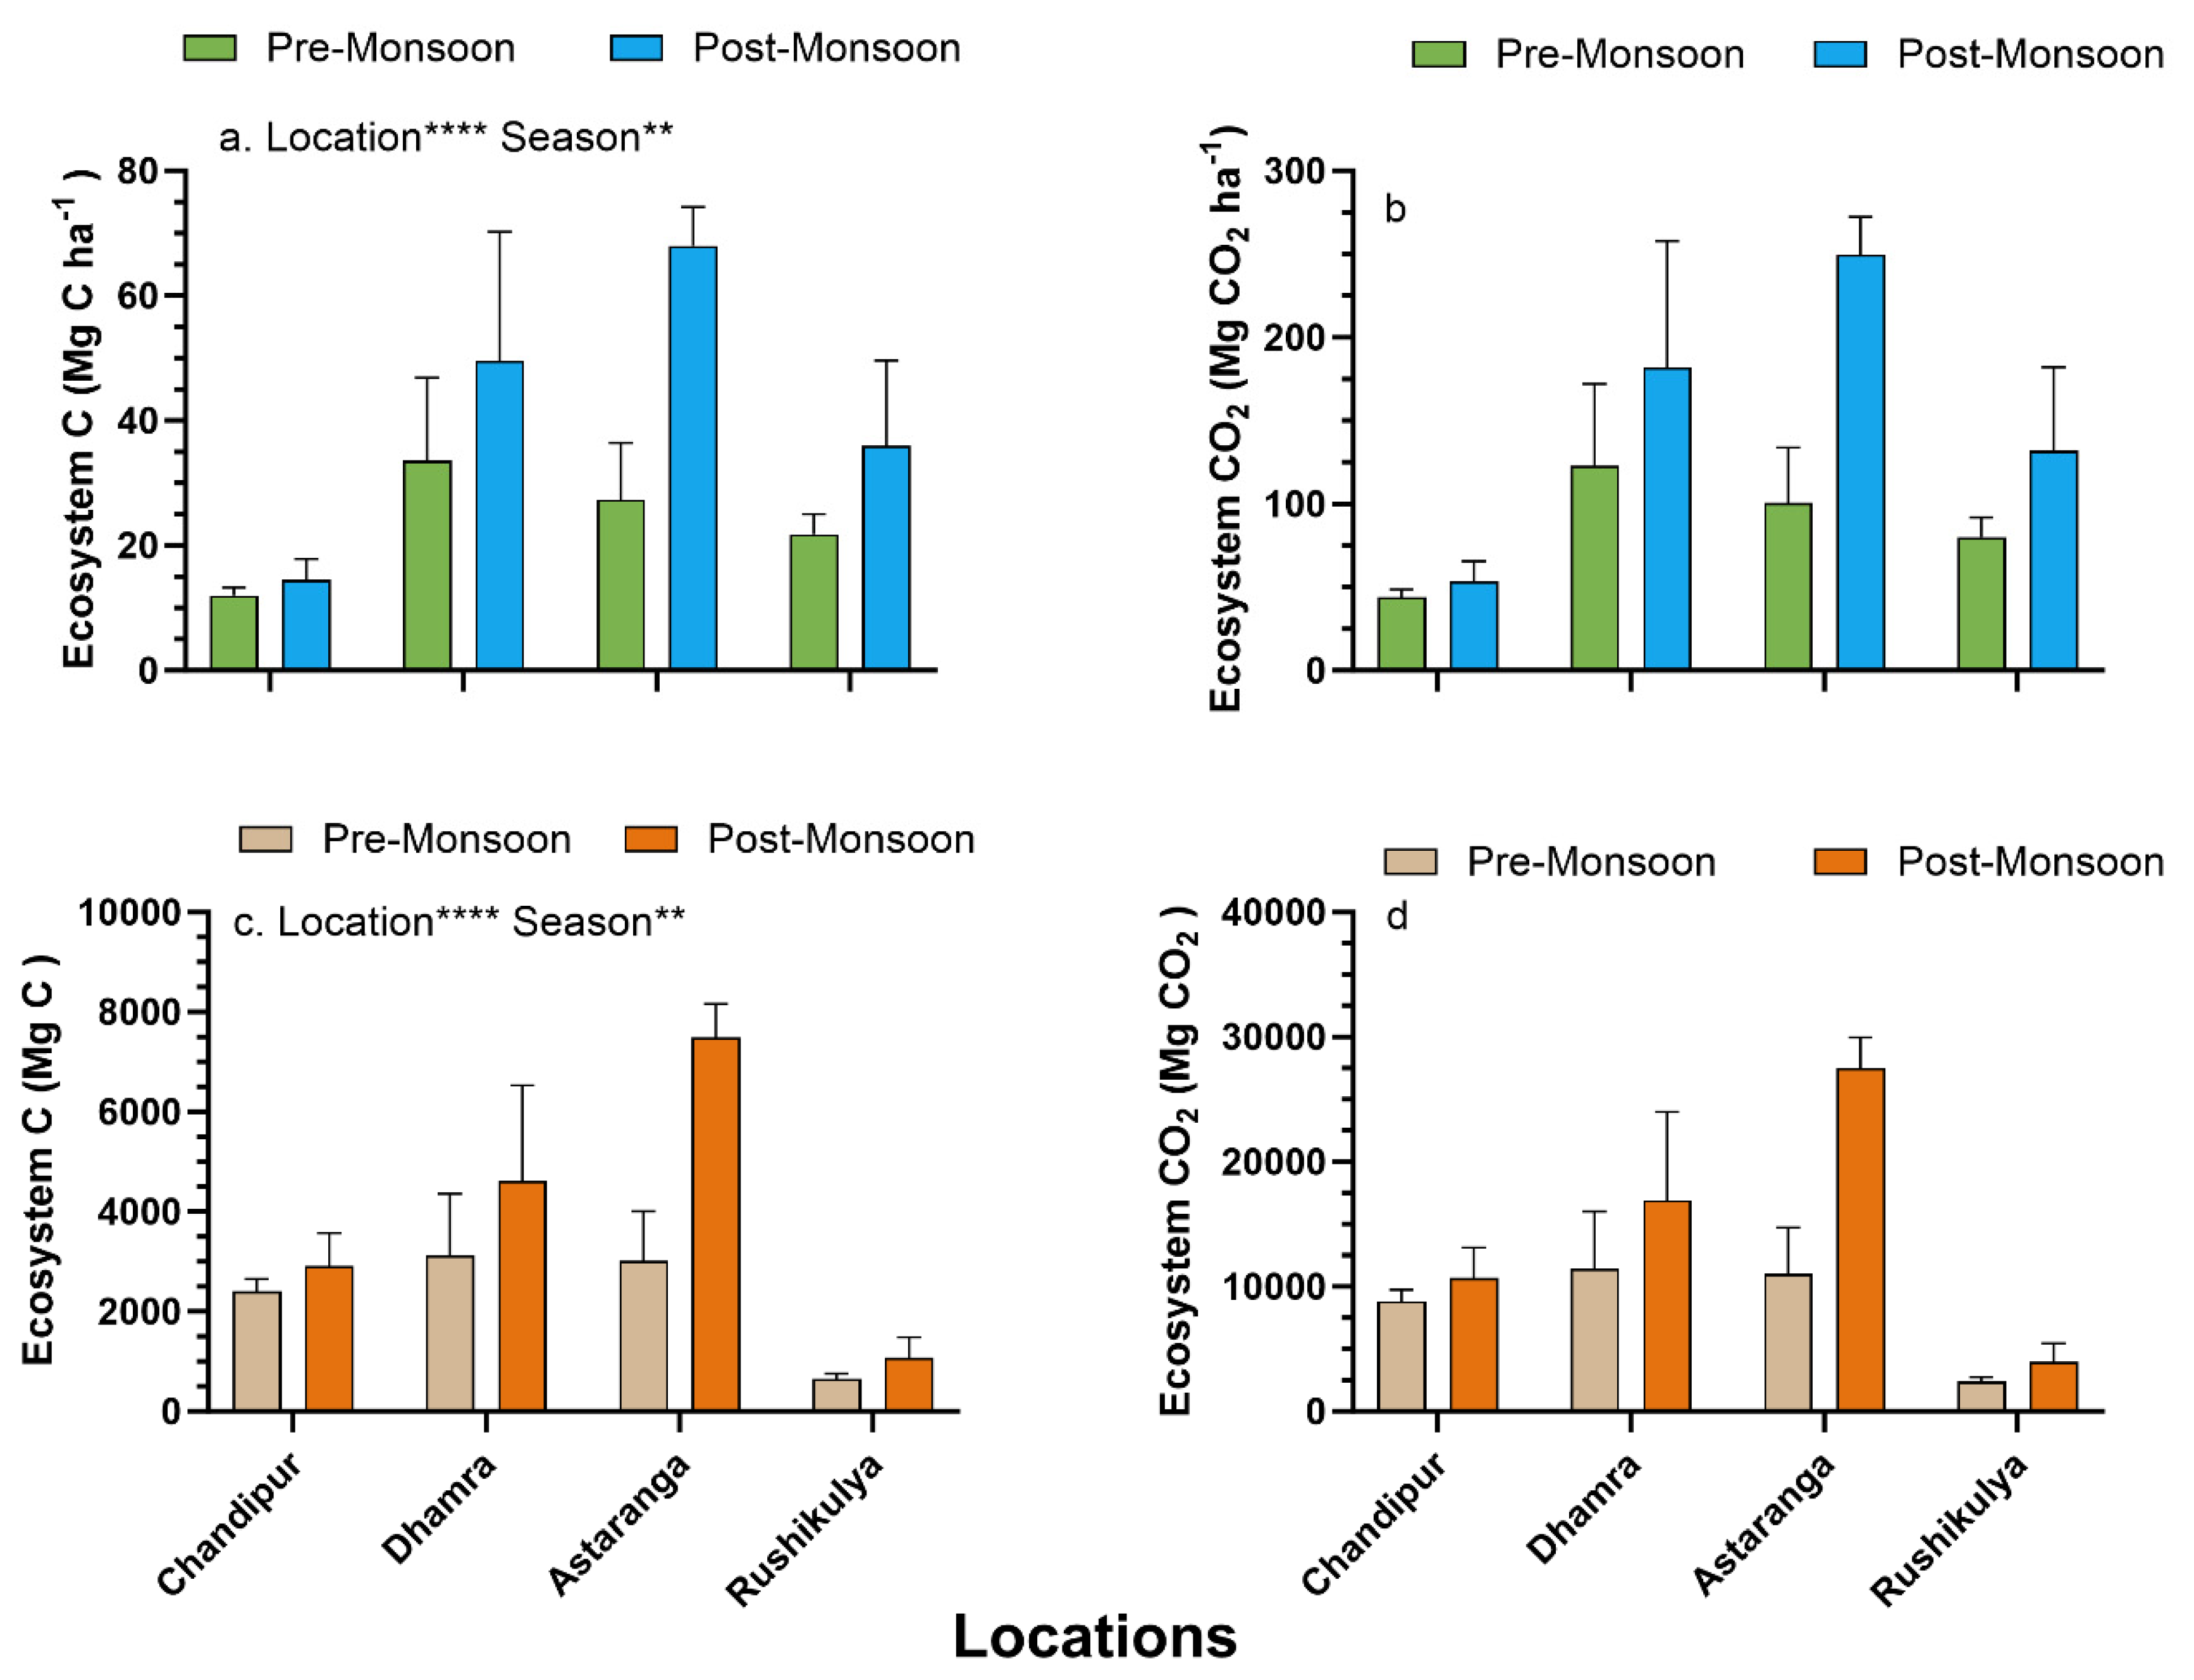
The P. coarctata ecosystem (sediment up to 30 cm + biomass) Corg stocks varied significantly between seasons (F 1,32= 32.22, p<0.001) and location (F 3,32 = 37.47, p<0.001) (Figure 7). In general, the mean ecosystem Corg stocks of P. coarctata was 1.7-fold higher in post-monsoon compared to pre-monsoon season across the four locations. Among the four locations, the highest and lowest Corg stocks in pre-monsoon were observed at Dhamra (33.53 ± 13.37 Mg C ha-1) and Rushikulya (12.01 ± 1.25 Mg C ha-1) (Figure 6a). Consequently, in post-monsoon, the highest and lowest ecosystem Corg stocks were observed at the P. coarctata meadows of Astaranga (68.04 ± 6.16 Mg C ha-1) and Chandipur (14.55 ± 3.29 Mg C ha-1) respectively.
The mean CO2 equivalent in P. coarctata ecosystem ranged from 44.08 to 123 Mg C ha-1 in pre-monsoon to 53.42 to 249 Mg CO2 ha-1 in post-monsoon across the four locations (Figure 7b). The total CO2 equivalent stocks across 433 ha of P. coarctata meadows across the four locations were highest in post-monsoon (14757.84 ± 9606.39 Mg CO2) compared to pre-monsoon season (8431.34 ± 4606 Mg CO2). The combined total price of CO2 stocks in 433 ha of P. coarctata meadows in pre-monsoon is US$ 14.50 million and post-monsoon is US$ 25.38 million. The price in INR for pre-monsoon is 1205.25 million and that of post-monsoon is 2109.61 million (Supplementary S4).

4. Discussion

Carbon stocks in saltmarsh ecosystems is considered as Nature-based Solution (NbS) towards climate change mitigation (Chowdhury et al., 2023; Mason et al., 2023b; Stankovic et al., 2023), but lack of regional scale information on saltmarsh carbon stocks data hinders their integration into intended nationally determined contributions (NDCs) under Paris Climate Agreement, 2015 (Dencer-Brown et al., 2022). Further research gaps also include, few well -studied locations globally (e.g., Western Atlantic saltmarshes of the United States, North-western European saltmarshes), that are often contextualized as being comparable to other saltmarsh areas in the tropical settings. Consequently, this generalization also hampers generating data on saltmarsh species-specific carbon stocks and the local seasonal effects and habitat settings on carbon storage in these coastal ecosystems (McMahon et al., 2023; Quevedo et al., 2023; Yando et al., 2023). This study addressed these knowledge gaps for P. coarctata, that has 84% of its distribution as mono-specific patches across the east coast of India as compared to its distribution in areas with other saltmarsh species and mangrove ecosystems (Begam et al., 2017; Mishra and Farooq, 2022b; Viswanathan et al., 2020; Yando et al., 2023). Our results indicate, there is an increase in seasonal nutrient input during monsoon season along the coast of Odisha that is reflected in the post-monsoon (Saha et al., 2022; Samantaray and Sanyal, 2022; Srinivasan et al., 2013), resulting in increase in biomass and carbon storage capacity (Figure 6). Consequently, seasonal change in nutrients and OM also positively influenced the sediment carbon stocks in the P. coarctata meadows along the coast of Odisha, India (Figure 7).

4.1. Influence of Physical Parameters on the Sediment Variables (DBD, OM, Corg%) and Carbon Stocks of P. coarctata Meadows

The surface water quality of saltmarsh ecosystems of our study locations is influenced by the seasonal (effect of monsoon) changes in water quality of the north-western Bay of Bengal and the local riverine input. The general trend of increase in pH, temperature and salinity in pre-monsoon and decrease in post-monsoon of the surface water in P. coarctata meadows across our study locations, concur with similar observations for Chandipur, Dhamra, Astaranga and Rushikulya estuarine areas from the coast of Odisha (Ambade et al., 2022; Mohanty et al., 2019; Shaik et al., 2015; Shrinivas et al., 2023; Sundaray et al., 2006; Swain et al., 2021). These changes in salinity and pH are a result of high influx of riverine freshwater into the estuarine areas resulting in decrease of salinity and pH during monsoon and the subsequent increase of salinity and pH in post-monsoon as the effect of monsoon driver dilution weakens (Bhadury and Sen, 2020; Shrinivas et al., 2023).
In our study, surface water salinity was negatively correlated with sediment OM and Corg at Chandipur and Rushikulya locations (Table 1). This correlation was previously observed for the P. coarctata meadows of Chandipur and for the estuarine areas of Rushikulya (Naik et al., 2020; Saha et al., 2022), where the daily tidal influx resulted in deposition of increased coarse grain fraction into the P. coarctata meadows. Subsequently, the high tidal flow and low residence time of water in the P. coarctata meadows also resulted in washing out of sedimentary OM resulting in low sediment Corg. This effect is clearly observed in our studies, as P. coarctata meadows in this study inhabited the low tidal zones that received daily tidal forcing and the subsequent loss of sediment OM resulting in low sediment Corg. However, riverine input in monsoon deposits a large influx of land derived OM into these saltmarshes, but during post-monsoon season when the riverine water flow reduces, the tidal influx and loss of OM mechanism takes over these open saltmarshes resulting in low sediment Corg. Secondly, salinity induces salt ion toxicity that have detrimental effects on plant productivity and subsequent contribution of autochthonous OM into the P. coarctata meadows (Saha et al., 2022). This was evident in our study where the salinity showed negative corelationship with sediment OM in the top 10 cm (Supplementary S3).
Consequently, grazing by cattle is an important factor in the P. coarctata meadows of Chandipur and Rushikulya (Figure 2a), which reduces significantly the canopy height (<5 cm) of the plants (authors personal observation). Despite P. coarctata being considered as highly efficient in sediment trapping, the reduction in canopy height by cattle grazing also significantly reduces this eco-engineering trait of the species as observed for other marine macrophytes and saltmarsh ecosystems globally (Islam et al., 2022; Mishra and Apte, 2020; Mishra et al., 2021; Tessier et al., 2003), thus reducing their capacity to filter particulate OM during daily tidal influx. This reduction due to grazing also affects the P. coarctata density which is lowest at Chandipur and Rushikulya compared to the other two locations. However, grazing at these two locations is halted during the monsoon (due to flooding risks to cattle’s), which helps the P. coarctata meadows to avoid the grazing pressure and increase their density and biomass, as observed in the post-monsoon season (Figure 6).
The sediment OM range observed from surface to 30 cm depth in pre-monsoon (3.12–11.47%) and post-monsoon (3.44–12.68%) seasons in this study are within and higher than the sediment OM range observed for other saltmarsh species (4.13–7.13%) from the east coast of India (Kaviarasan et al., 2019), but lower than sediment OM (4.9-16.9 %) observed from Gulf of Kutch, Gujarat on India’s west coast (Jagtap et al., 2002). Similarly, the variation observed in this study for high sediment Corg in post-monsoon (2.42–13.44%) compared to pre-monsoon season (2.03–12.31%) has also been observed in the P. coarctata meadows from the Bhitarkanika National Park (0.64-2.71%), from Sundarbans (2.0–4.0%) (Banerjee et al., 2022; Chowdhury et al., 2023), and other mixed saltmarsh species (2.18-3.81%) ecosystems of India (Kaviarasan et al., 2019). The higher sediment Corg in our study sites could be due to higher autochthonous contribution from P. coarctata associated plant materials (roots, rhizomes and leaves) and sediment trapping capacity of these plants due to their high densities at locations like Dhamra and Astaranga. It is also important to note here that these high sediment Corg in both seasons were mostly observed at Dhamra and Astaranga locations, which have local anthropogenic impacts. In Dhamra, there is a continuous bottom dredging (due to the presence of port) and associated OM deposition to P. coarctata meadows, whereas in Astaranga there is agricultural and aquaculture run-off into P. coarctata meadows and associated increase of primary productivity that contributed towards high sediment OM and Corg (Akhtar et al., 2021; Pradhan et al., 2009; Pramanik, 2019). These dense P. coarctata meadows at Astaranga also trap inflowing mangrove leaves and decaying matter (observed during field sampling) that can enrich the sediment Corg. Conversely, these dense P. coarctata meadows also trap high amount of autochthonous OM derived from P. coarctata biomass, that may have contributed towards the high Corg in the sediment. This relationship between high OM input resulting in high Corg was observed in our study (Supplementary S5). Consequently, various saltmarsh species inhabiting the low intertidal areas and have demonstrated high sediment Corg globally (Chen et al., 2016; Miller et al., 2023; Qu et al., 2019; Yuan et al., 2022).
In our results, there is a positive influence of sediment OM on P. coarctata sediment C content in post-monsoon season, when nutrient inflow from different sources is higher from riverine and land run-off resulting in high primary productivity and generation of marine POM (Figure 5b). These different sources of OM input in the sediment are clearly inferenced from the sediment δ13C isotopic signatures, showing presence of marine particulate organic carbon (POC) and dissolved organic carbon (DOC) (Figure 5b). Seasonal influence showcasing input of marine POC and DOC has been observed for the P. coarctata meadows of Chandipur from the east coast of India, but for Dhamra, Astaranga and Rushikulya these are first time inferences (Saha et al., 2022).
In general, the contribution of sediment Corg to the total ecosystem carbon stocks is higher compared to plant biomass contributions in blue carbon ecosystems (Human et al., 2022; Miller et al., 2022; Nazneen et al., 2022; Perera et al., 2022; Stankovic et al., 2023). This study, followed a similar pattern for blue carbon ecosystems, with sediment Corg contributing >70% of the ecosystem Corg stocks, and P. coarctata total biomass (AG +BG) contributing 30% in pre-monsoon and 29% in post-monsoon season (Figure 7). This variation in sediment and biomass contribution towards total ecosystem carbon stocks has also been observed for P. coarctata meadows along the east coast that are adjacent to mangrove ecosystems (Banerjee et al., 2022; Begam et al., 2017; Chowdhury et al., 2023) and with other mixed saltmarsh species from the coast of India (Kaviarasan et al., 2019). In this study, the highest mean sediment Corg stocks were observed in the mono-specific patches of P. coarctata meadows of Astaranga (57.04 ±5.99 Mg C), which is 1.3-fold higher than previously observed sediment Corg stocks for P. coarctata meadows of the Mahanadi delta (44.79 ± 0.23) and the Bhitarkanika National Park (42.08 ± 1.15) that are adjacent or mixed with various mangrove species (Table 2). One of the reasons for these differences in sediment Corg stocks is the sediment core depth sampled. In this study we have used sediment core depth till 30 cm (thus including the long-term Corg stocks) and the other authors have used sediment Corg from the top 10 cm only, which is very dynamic and subjected to significant loss of OM and associated Corg due to tidal fluctuations and decompositions (Campbell et al., 2022b; Mason et al., 2023a; McMahon et al., 2023; Perera et al., 2022). Consequently, the other difference between mono-specific and adjacent/mixed with mangrove P. coarctata meadows may be the vegetation structure of P. coarctata, which is low when present with mangroves (due to shading, grazing or competition with other saltmarsh species) compared to mono-specific meadows, where the plant canopy height can reach 60 cm in post-monsoon with dense shoots and roots (Mishra and Farooq, 2022a). The role of dense AG and BG vegetation cover is directly proportional to the higher accumulation and burial of sediment Corg compared to low dense vegetation areas (Alongi, 2020; Mcleod et al., 2011).
Similarly, the P. coarctata sediment Corg stocks observed in this study are also similar to sediment Corg stocks (at 30 cm) of mixed mangrove ecosystems of the Mahanadi delta (54.3 ± 7.4 Mg C) and Bhitarkanika Mangrove (54.3 ±3.0 Mg C) ecosystems and 3-fold higher than Bhitarkanika Mangrove ecosystems of the east coast of India, that are subjected to continuous wood harvesting and anthropogenic habitat disturbances (Bhomia et al., 2016; Pattnayak et al., 2019; Rasquinha and Mishra, 2021; Sahu et al., 2016). This suggests mono-specific dense P. coarctata meadows can have similar sediment Corg stocks that of mixed mangrove ecosystems, which informs about the ecological importance of P. coarctata meadows towards climate change mitigation.
The total meadow area of the P. coarctata at each location also influenced the total Corg stocks on ecosystem scale with Astaranga (110 ha) having the highest (10497 Mg C) and Rushikulya (30 ha) the lowest (1734.91 Mg C) Corg stocks across both seasons, even though Chandipur (200 ha) had the lowest mean sediment and biomass Corg stocks among the four locations (Figure 6a).

4.2. Influence of Seasonality on P. coarctata Traits and Carbon Stocks

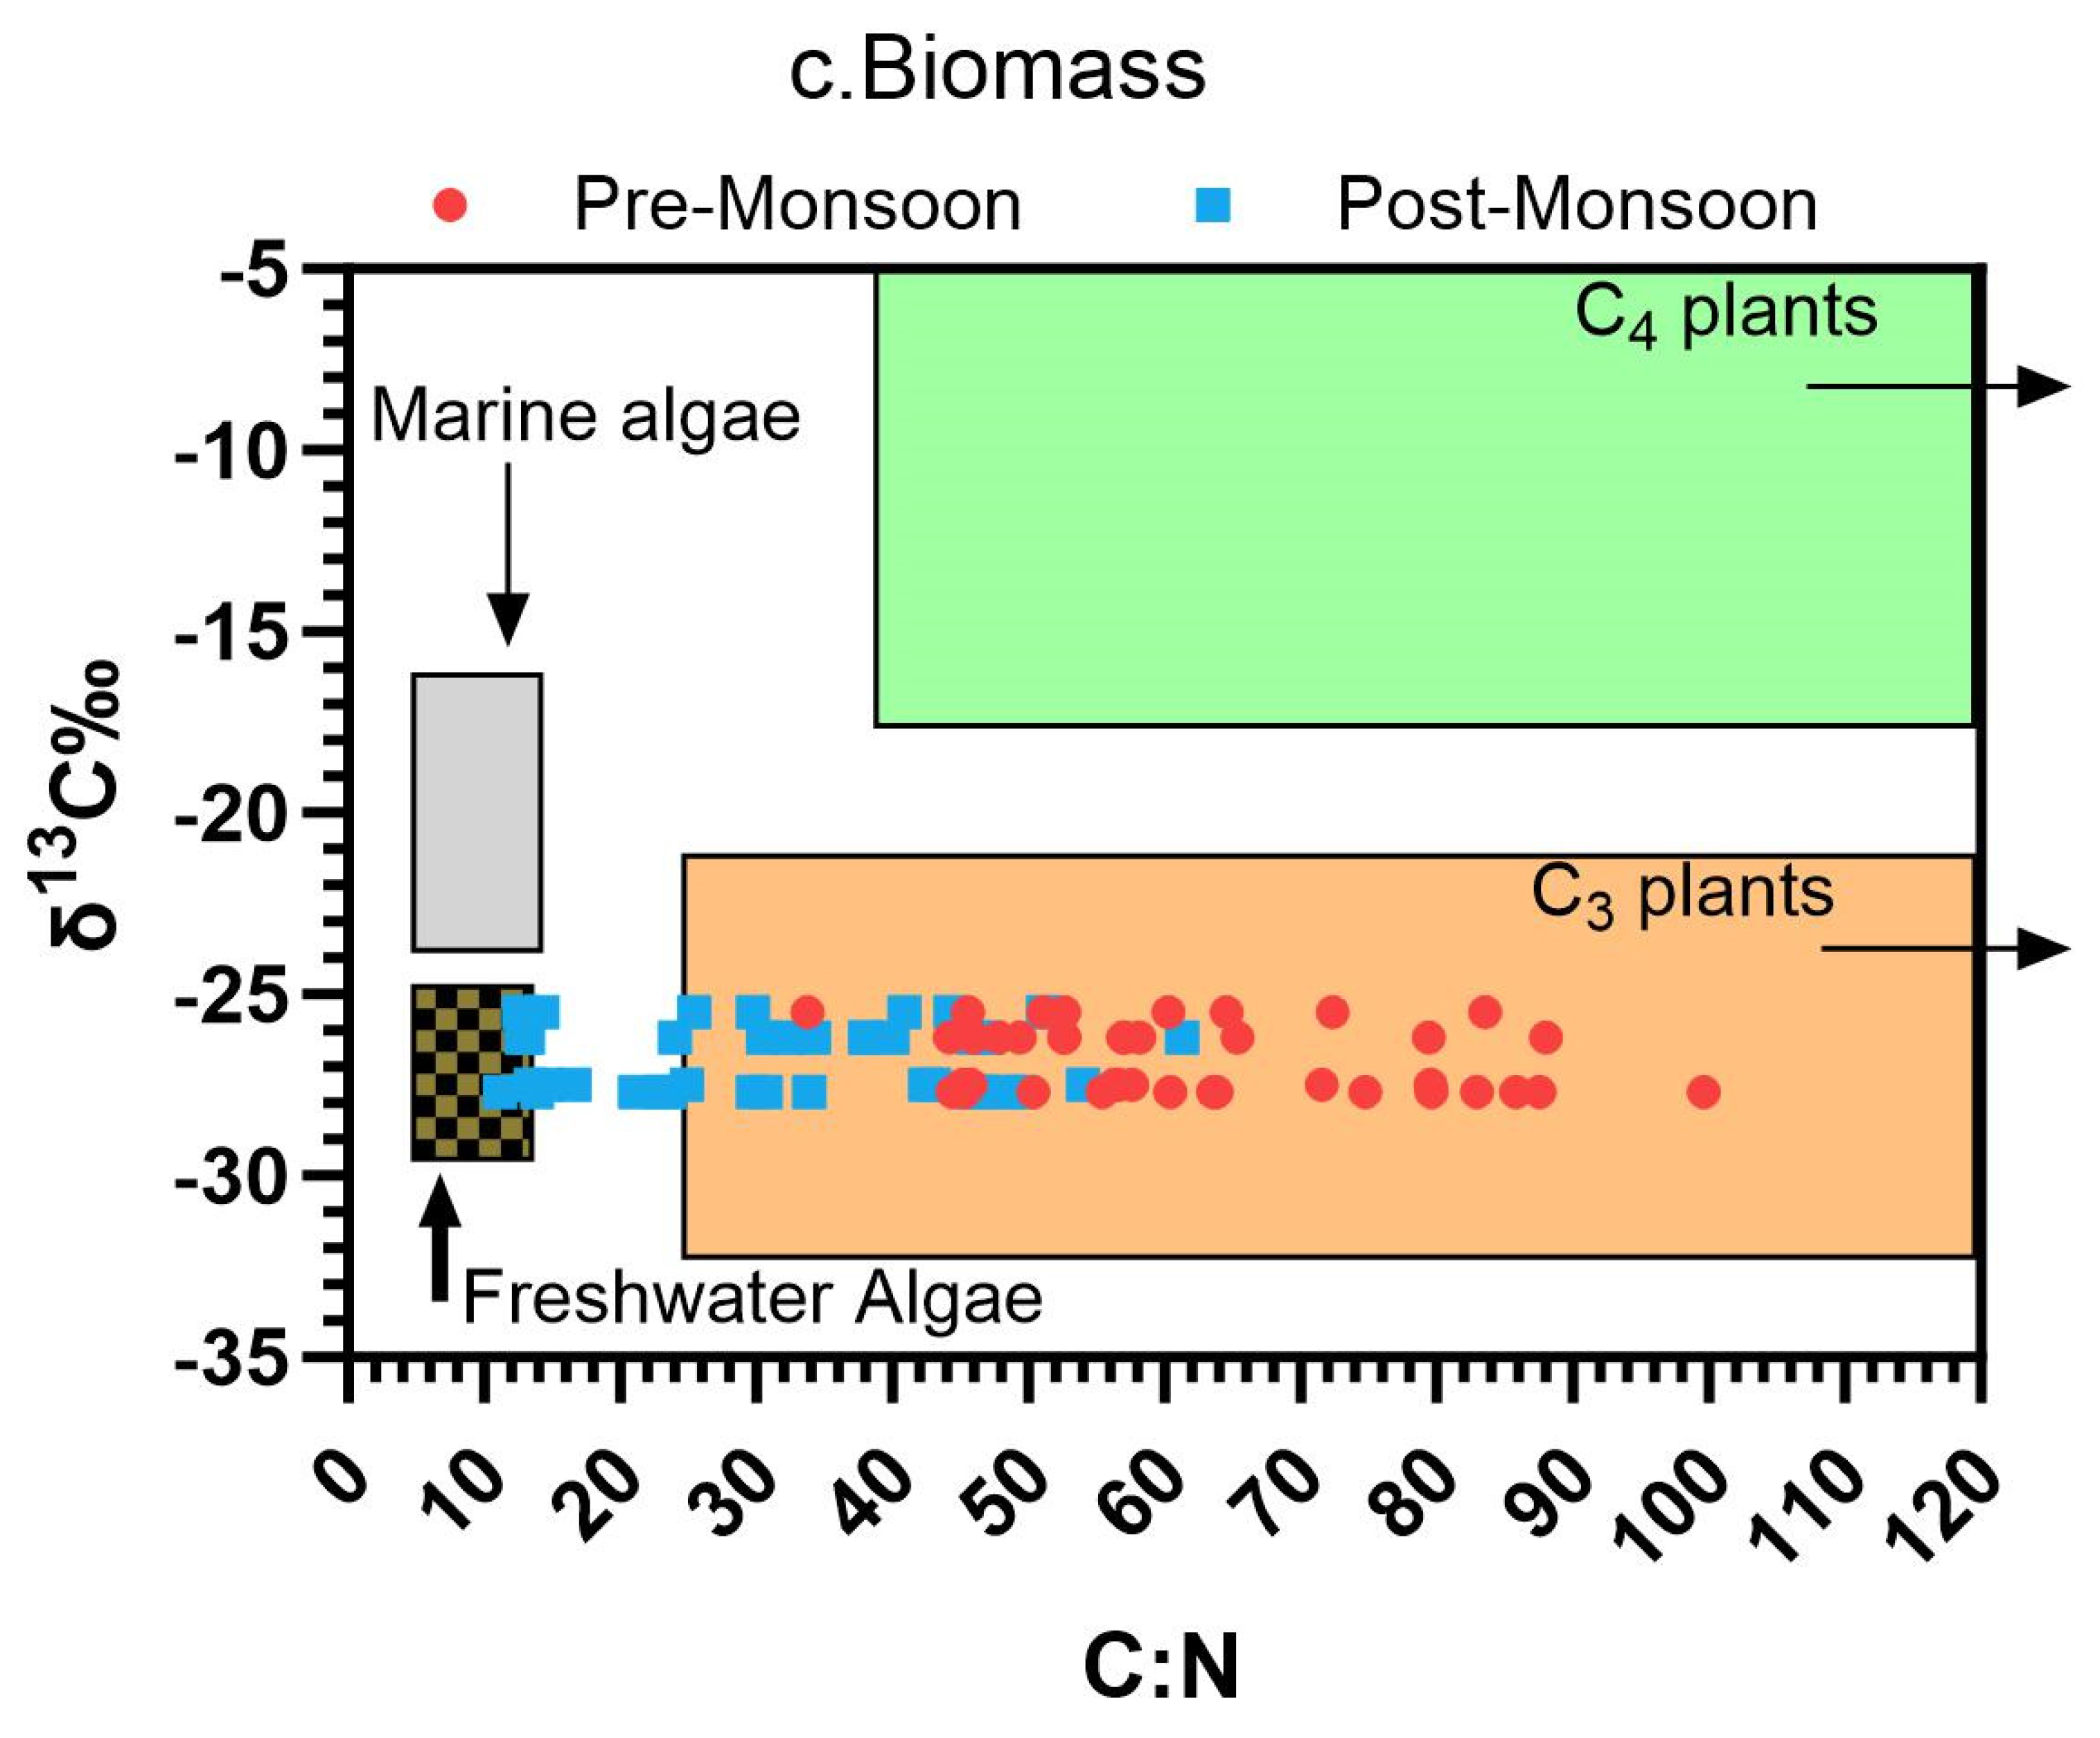
Even though the majority of the C stocks are stored in the sediment, the vegetative component is still an important part of the overall Corg stocks assessment of estuarine systems (Nazneen et al., 2022; Radabaugh et al., 2017; Stankovic et al., 2023). This was observed in our study, where P. coarctata biomass contributed 30% towards the total ecosystem Corg stocks in both seasons. The BG-biomass of P. coarctata, contributed 1.6-fold higher biomass than AG-biomass towards the ecosystem Corg stocks and this contribution was higher in post-monsoon season (Figure 6). This is a direct influence of sediment deposition (during monsoon) or erosion (during pre-monsoon) at these study locations, which leads to P. coarctata investing increased amount of energy towards BG-structures to survive in the changing environment. This behaviour of P. coarctata has not been previously reported from India, but P. coarctata meadows from the coast of Bangladesh and other saltmarsh species from the coast of the USA have shown this unique feature of increase BG-biomass growth in response to sediment deposition or erosion (Hughes et al., 2018; Mariotti and Carr, 2014; Rahaman et al., 2013; Tang et al., 2020; Wu et al., 2021). This BG-biomass growth is also supported by increase in nutrient input in the monsoon and its subsequent utilization in post-monsoon season as evidenced by total N content in biomass of P. coarctata (Supplementary S7). This external N input is also further supported by the δ15N values which were heavier in post-monsoon season and values >5‰ in biomass (5.2–7.8‰) indicated anthropogenic input (Supplementary S3). This external N input was higher in Chandipur, Dhamra and Rushikulya locations of our study, through riverine input, whereas at Astaranga, this external N input was dominated by aquaculture outflows (Akhtar et al., 2021; Pradhan et al., 2009). Similar influence of external N input and variation in stable isotope signatures have been observed from the coast of India for P. coarctata (Saha et al., 2022) and from the coast of China for invasive saltmarsh species like Spartina alterniflora and other seagrass species (Du et al., 2019; Jiang et al., 2019; Lin et al., 2021). This external N input also supported the growth of salt-tolerant estuarine micro and macroalgae that were attached to the P. coarctata leaf and rhizome structures as epiphytes, as inferenced from δ13C isotopes of biomass (Figure 5c). This showcases, the influence of seasonality on the P. coarctata biomass generation and its contribution towards the total ecosystem Corg stocks, which has been observed for saltmarsh ecosystems around South Asia (Billah et al., 2016; Hena et al., 2007; Hossain et al., 2016; Perera et al., 2022; Prasad et al., 2014) and in other areas (Chen et al., 2016; Human et al., 2022; Miller et al., 2023; Qu et al., 2019; Yuan et al., 2022).

4.3. Total Carbon Stocks of P. coarctata Ecosystems

The P. coarctata ecosystem (sediment 30 cm + biomass) Corg stocks showed high standard deviation between the four locations in post-monsoon compared to pre-monsoon season (Figure 7) because of the Corg differences in saltmarsh sediment and biomass. Secondly, the total meadow size of P. coarctata for each of the four locations [i.e., Chandipur (200 ha), Dhamra (93 ha), Astaranga (110 ha) and Rushikulya (30 ha)] were different. For example, the total ecosystem Corg stocks in Chandipur was lowest (12-14 Mg C ha-1) among the four locations in both seasons, but when extrapolated to the total meadow size, the P. coarctata meadows of Rushikulya was observed with lower Corg stocks (Figure 7). This suggests that the total area of the saltmarsh meadow plays an important role while quantifying the ecosystem wide Corg stocks (Campbell et al., 2022b; Human et al., 2022; McMahon et al., 2023; Perera et al., 2022; Saha et al., 2022). A similar impact of saltmarsh meadow size affecting the ecosystem Corg stocks has been observed for P. coarctata meadows from the east coast of India that were associated with mangroves(Banerjee et al., 2022; Begam et al., 2017; Chowdhury et al., 2023).
The total Corg stock in our studies is limited to the top 30 cm of sediment depth across mono-specific P. coarctata meadows and the recommended standard extrapolation to sediment depth of 1m was avoided. Similarly, in terms of saltmarsh meadow perspective, the estimated Corg stocks is only for 443 ha, as the total area of P. coarctata meadows for the coast of Odisha is not available. Avoiding this extrapolation was necessary, because in India there is significant lack of species-specific studies on saltmarsh Corg stocks and this extrapolation would have provided biased information about P. coarctata Corg storage potential, as saltmarsh carbon storage is a species-specific trait as observed from the current available literature (Table 2). Other than species-specific traits the Corg stocks in saltmarsh ecosystems is also dependent on local abiotic factors, hydrodynamics, land runoff, anthropogenic habitat disturbances, and grazing (Cruz de Carvalho et al., 2020; Di Bella et al., 2015; Gorham et al., 2020a; Islam et al., 2022; Radabaugh et al., 2017; Yang et al., 2020). Based on the International Panel for Climate Change (IPCC, 2014) Tier II assessment the P. coarctata meadows (443 ha) of the four locations in pre-monsoon and post-monsoon can help in avoiding the emissions of 8431.34 and 14757.84 Mg CO2 respectively (Howard et al., 2014). Based on the amount of Corg stored in the P. coarctata meadows from the coast of Odisha, the price of CO2 stored is around US$39.88 million and INR 3314.87 million. Our values are for the first time estimate the CO2 equivalent storage potential for saltmarsh ecosystems of India.

4.4. P. coarctata Ecosystem Carbon Stocks and Their Role in India’s NDC

India, has pledged to reduce 33-35% of its CO2 emissions by 2030 under its Intended Nationally Determined Contributions (INDC) commitment under Paris Climate Agreement (UNFCC, 2015). The National Action Plan on Climate Change (NAPCC) has emphasized on the importance of conservation and management of India’s blue carbon ecosystems towards achieving the NDC’s, where mangrove ecosystems are in focus. This study showcases that, saltmarsh ecosystems of India have similar potential for carbon storage as that of mangroves, when least disturbed. According to this study, the total CO2 equivalent reduction potential across pre and post-monsoon season for P. coarctata meadows from the coast of Odisha (Chandipur + Dhamra + Astaranga + Rushikulya= 443 ha) is 8431.34 and 14757.84 Mg CO2. However, it is important to note here that P. coarctata meadows of this study represent only 443 ha area of India’s coastal area and have the potential to accumulate 0.0009% (23189.18 tons) of India’s current 2.5 billion tons of CO2 emissions per year (Karstensen et al., 2020). This fraction is very small considering India’s total CO2 emissions. However, it is important to note here the P. coarctata meadows of this study only represent 443 ha of India’s 290 km2 of saltmarsh ecosystems which will showcase a different carbon storage and emission avoidance capacity. It is further important to map out the mono-specific meadows of P. coarctata and the P. coarctata meadows that are associated with other saltmarsh or mangrove ecosystems along the coast of India to quantify their carbon storage potential as seascape connectivity between coastal ecosystems plays an important role in increasing carbon stocks (Banerjee et al., 2017; Begam et al., 2017; Mishra and Apte, 2020; Mishra et al., 2023).
Furthermore, the blue carbon storage potential of species-specific saltmarsh ecosystems needs more detailed studies where the influence of anthropogenic pollution, habitat disturbances and the effects of climate change on carbon storage potential can be explored. Saltmarsh ecosystems of India are also missing in any of the climate change mitigation plans (Koshy et al., 2018; Ramesh et al., 2018; Stankovic et al., 2023), whereas mangroves are considered as the sole NbS towards climate change mitigation. Recent studies have showcased that both saltmarsh and seagrass ecosystem of India have significant capacity to store carbon in their ecosystems (Bal and Banerjee, 2019; Banerjee et al., 2022; Mishra et al., 2023; Stankovic et al., 2023)and combined with mangroves they can help in achieving India’s NDCs. However, this study showcases the importance of mono-specific saltmarsh meadows that inhabits the lower intertidal zone, whereas there are other saltmarsh species that inhabits the high tide zone (Gopi et al., 2019; Mishra and Farooq, 2022b, 2022a; Viswanathan et al., 2020) and have significant carbon storage capacity and also are associated with mangroves along the coast of India. Loss of these saltmarsh ecosystems can turn these carbon sink ecosystems as carbon sources to fuel up the climate change (Campbell et al., 2022b; Gorham et al., 2020b; Perera et al., 2022; Serrano et al., 2019). Therefore, these blue carbon ecosystems need better protection and management and can be added into the Mangroves for the Future programs of the NAPCC. Therefore, together will mangroves and seagrass, these saltmarsh ecosystems can play an important role as NbS towards climate change mitigation and adaptation plans of India (Mishra and Farooq, 2022a; Perera et al., 2022; Stankovic et al., 2023)

5. Conclusion

This study for the first time estimated the Corg stocks in mono-specific meadows of P. coarctata meadows without adjacent mangrove ecosystems across pre-monsoon and post-monsoon seasons from the coast of Odisha, India. This study addressed one of the important knowledge gaps (having an IPCC Tier-II assessment) in saltmarsh blue carbon research in India, showcasing the carbon storage potential of an ecologically important yet data deficient saltmarsh species (Mishra and Farooq, 2022a; Phillips, J., & Yang, 2017). There is a significant loss of these ecosystems towards coastal development and mangrove restoration (Begam et al., 2017; Mishra and Farooq, 2022a), despite these mono-specific patches of P. coarctata meadows have similar or higher range of climate relevant Corg stocks compared to mangroves. Notably for the first time this study provides information about the CO2 equivalent in P. coarctata meadows and the social cost of carbon for saltmarsh ecosystems of India. Further studies are required to analyse the effects of various anthropogenic disturbances and habitat connectivity between saltmarsh and mangrove ecosystems, particularly as NbS for climate change mitigation plans for the state of Odisha and India. Integration of saltmarsh ecosystem services with NAPCC is essential and important for better management of non-mangrove ecosystems from India’s coast.

Funding

The project received funding from the Science and Engineering Board, Government of India, file number PDF/2020/000540.

Acknowledgement

We are thankful to Anil Kumar Behera for his support during field work activities. We are thankful to IIT Bhubaneswar for providing laboratory facilities. We are thankful to the Stable Isotope Laboratory of the University of Hong Kong for stable isotope analysis.

References

  1. Akhtar, S., Equeenuddin, Sk.Md., Bastia, F., 2021. Distribution of pCO2 and air-sea CO2 flux in Devi estuary, eastern India. Applied Geochemistry 131, 105003. [CrossRef]
  2. Alongi, D.M., 2020. Carbon balance in salt marsh and mangrove ecosystems: A global synthesis. J Mar Sci Eng 8, 1–21. [CrossRef]
  3. Ambade, B., Sethi, S.S., Kurwadkar, S., Mishra, P., Tripathee, L., 2022. Accumulation of polycyclic aromatic hydrocarbons (PAHs) in surface sediment residues of Mahanadi River Estuary: Abundance, source, and risk assessment. Mar Pollut Bull 183, 114073. [CrossRef]
  4. Bal, G., Banerjee, K., 2019. Carbon storage potential of tropical wetland forests of South Asia: a case study from Bhitarkanika Wildlife Sanctuary, India. Environ Monit Assess 191. [CrossRef]
  5. Banerjee, K., Mallik, K., Sahoo, C.K., Paul, R., 2022. Aquatic and edaphic determinants influencing carbon storage in a salt marsh grass, Porteresia coarctata, of the Bhitarkanika wildlife sanctuary and the Mahanadi estuary. Environmental Quality Management 31, 11–28. [CrossRef]
  6. Banerjee, K. Banerjee, K., Sappal, S.M., Ramachandran, P., Ramesh, R., 2017. Salt Marsh: Ecologically Important, Yet Least Studied Blue Carbon Ecosystems in India. Journal of Climate Change 3, 59–72. [CrossRef]
  7. Begam, M.M., Sutradhar, T., Chowdhury, R., Mukherjee, C., Basak, S.K., Ray, K., 2017. Native salt-tolerant grass species for habitat restoration, their acclimation and contribution to improving edaphic conditions: a study from a degraded mangrove in the Indian Sundarbans. Hydrobiologia 803, 373–387. [CrossRef]
  8. Bhadury, P., Sen, A., 2020. Understanding Impact of Seasonal Nutrient Influx on Sedimentary Organic Carbon and Its Relationship With Ammonia spp. in a Coastal Lagoon. Front Mar Sci 7. [CrossRef]
  9. Bhomia, R.K., Mackenzie, R.A., Murdiyarso, D., Sasmito, S.D., Purbopuspito, J., 2016. Impacts of land use on Indian mangrove forest carbon stocks: Implications for conservation and management. Ecological Applications 26, 1396–1408. [CrossRef]
  10. Billah, M.M., Zamal, H., Mustafa Kamal, A.H., Hoque, A.T.M.R., Rahman, M.M., Hoque, M.M., Akhtar, A., Hoque, M.N., 2016. Saltmarsh and seagrass beds on the south-eastern coast of Bangladesh: vegetation characteristics and adjacent fisheries diversity. Zoology and Ecology 26, 313–322. [CrossRef]
  11. Campbell, A.D., Fatoyinbo, L., Goldberg, L., Lagomasino, D., 2022a. Global hotspots of salt marsh change and carbon emissions. Nature 612, 701–706. [CrossRef]
  12. Campbell, A.D., Fatoyinbo, L., Goldberg, L., Lagomasino, D., 2022b. Global hotspots of salt marsh change and carbon emissions. Nature 612, 701–706. [CrossRef]
  13. Chatterji, A., Kotnala, S., Mathew, R., 2003. Effect of salinity on larval growth of horseshoe crab, Tachypleus gigas (Müller) 2002–2004.
  14. Chen, S., Torres, R., Goñi, M.A., 2016. The Role of Salt Marsh Structure in the Distribution of Surface Sedimentary Organic Matter. Estuaries and Coasts 39, 108–122. [CrossRef]
  15. Chowdhury, A., Naz, A., Bhattacharyya, S., Sanyal, P., 2018. Cost–benefit analysis of ‘Blue Carbon’ sequestration by plantation of few key mangrove species at Sundarban Biosphere Reserve, India. Carbon Manag 9, 575–586. [CrossRef]
  16. Chowdhury, A., Naz, A., Dasgupta, R., Maiti, S.K., 2023. Blue Carbon: Comparison of Chronosequences from Avicennia marina Plantation and Proteresia coarctata Dominated Mudflat, at the World’s Largest Mangrove Wetland. Sustainability (Switzerland) 15. [CrossRef]
  17. Cruz de Carvalho, R., Feijão, E., Kletschkus, E., Marques, J.C., Reis-Santos, P., Fonseca, V.F., Papenbrock, J., Caçador, I., Duarte, B., 2020. Halophyte bio-optical phenotyping: A multivariate photochemical pressure index (Multi-PPI) to classify salt marsh anthropogenic pressures levels. Ecol Indic 119, 106816. [CrossRef]
  18. Dencer-Brown, A.M., Shilland, R., Friess, D., Herr, D., Benson, L., Berry, N.J., Cifuentes-Jara, M., Colas, P., Damayanti, E., García, E.L., Gavaldão, M., Grimsditch, G., Hejnowicz, A.P., Howard, J., Islam, S.T., Kennedy, H., Kivugo, R.R., Lang’at, J.K.S., Lovelock, C., Malleson, R., Macreadie, P.I., Andrade-Medina, R., Mohamed, A., Pidgeon, E., Ramos, J., Rosette, M., Salim, M.M., Schoof, E., Talukder, B., Thomas, T., Vanderklift, M.A., Huxham, M., 2022. Integrating blue: How do we make nationally determined contributions work for both blue carbon and local coastal communities? Ambio. [CrossRef]
  19. Di Bella, C.E., Rodríguez, A.M., Jacobo, E., Golluscio, R.A., Taboada, M.A., 2015. Impact of cattle grazing on temperate coastal salt marsh soils. Soil Use Manag 31, 299–307. [CrossRef]
  20. Du, J., Chen, Z., Xie, M., Chen, M., Zheng, X., Liao, J., Chen, B., 2019. Analysis of organic carbon sources in tropical seagrass fish: a case study of the east coast of Hainan Province. Marine Biology Research 15, 513–522. [CrossRef]
  21. Ermgassen, P.S.E., Baker, R., Beck, M.W., Dodds, K., Ermgassen, S.O.S.E., Mallick, D., Taylor, M.D., Turner, R.E., 2021. Ecosystem Services : Delivering Decision-Making for Salt Marshes Why Quantify the Value of Ecosystem. Estuaries and Coasts 44, 1691–1698.
  22. Gilby, B.L., Weinstein, M.P., Baker, R., Cebrian, J., Alford, S.B., Chelsky, A., Colombano, D., Connolly, R.M., Currin, C.A., Feller, I.C., Frank, A., Goeke, J.A., Goodridge Gaines, L.A., Hardcastle, F.E., Henderson, C.J., Martin, C.W., McDonald, A.E., Morrison, B.H., Olds, A.D., Rehage, J.S., Waltham, N.J., Ziegler, S.L., 2021. Human Actions Alter Tidal Marsh Seascapes and the Provision of Ecosystem Services. Estuaries and Coasts 44, 1628–1636. [CrossRef]
  23. Gopi, M., Pravin Kumar, M., Joyson Joe Jeevamani, J., Raja, S., Muruganandam, R., Deepak Samuel, V., Simon, N.T., Viswanathan, C., Abhilash, K.R., Krishnan, P., Purvaja, R., Ramesh, R., 2019. Distribution and biodiversity of tropical saltmarshes: Tamil nadu and Puducherry, southeast coast of India. Estuar Coast Shelf Sci 106393. [CrossRef]
  24. Gorham, C. Gorham, C., Lavery, P., Kelleway, J.J., Salinas, C., Serrano, O., 2020a. Soil Carbon Stocks Vary Across Geomorphic Settings in Australian Temperate Tidal Marsh Ecosystems. Ecosystems. [CrossRef]
  25. Gorham, C., Lavery, P., Kelleway, J.J., Salinas, C., Serrano, O., 2020b. Soil carbon stocks vary across geomorphic settings in Australian temperate tidal marsh ecosystems. Ecosystems In review. [CrossRef]
  26. Hena, M.K.A., Short, F.T., Sharifuzzaman, S.M., Hasan, M., Rezowan, M., Ali, M., 2007. Salt marsh and seagrass communities of Bakkhali Estuary, Cox’s Bazar, Bangladesh. Estuar Coast Shelf Sci 75, 72–78. [CrossRef]
  27. Hossain, M., Saha, C., Rubaiot Abdullah, S.M., Saha, S., Siddique, M.R.H., 2016. Allometric biomass, nutrient and carbon stock models for Kandelia candel of the Sundarbans, Bangladesh. Trees - Structure and Function 30, 709–717. [CrossRef]
  28. Howard, J., Hoyt, S., Isensee, K., Pidgeon, E., Telszewski, M., 2014. Coastal Blue Carbon. National Wetlands Newsletter 36, 5–7.
  29. Hughes, A.R., Cebrian, J., Heck, K., Goff, J., Hanley, T.C., Scheffel, W., Zerebecki, R.A., 2018. Effects of oil exposure, plant species composition, and plant genotypic diversity on salt marsh and mangrove assemblages. Ecosphere 9. [CrossRef]
  30. Human, L.R.D., Els, J., Wasserman, J., Adams, J.B., 2022. Blue carbon and nutrient stocks in salt marsh and seagrass from an urban African estuary. Science of the Total Environment 842, 156955. [CrossRef]
  31. Islam, M.S., Pervez, A., Asseri, A.H., Al-Mutair, M., Sumon, M.A.A., Taleb, M.A., Ashik, A.A., Rahman, M.A., Molla, M.H.R., 2022. Diversity and seasonal succession of resident and migratory macrobenthic fauna of saltmarsh restoration site at Sonadia Island, Cox’s Bazar, Bangladesh. Reg Stud Mar Sci 53, 102460. [CrossRef]
  32. Jiang, Z., Zhao, C., Yu, S., Liu, S., Cui, L., Wu, Y., Fang, Y., Huang, X., 2019. Contrasting root length, nutrient content and carbon sequestration of seagrass growing in offshore carbonate and onshore terrigenous sediments in the South China Sea. Science of The Total Environment 662, 151–159. [CrossRef]
  33. Jinks, K.I., Rasheed, M.A., Brown, C.J., Olds, A.D., Schlacher, T.A., Sheaves, M., York, P.H., Connolly, R.M., 2020. Saltmarsh grass supports fishery food webs in subtropical Australian estuaries. Estuar Coast Shelf Sci 238, 106719. [CrossRef]
  34. Karstensen, J., Roy, J., Deb Pal, B., Peters, G., Andrew, R., 2020. Key drivers of Indian greenhouse gas emissions. Econ Polit Wkly 55, 46–53.
  35. Kaviarasan, T., Dahms, H.U., Gokul, M.S., Henciya, S., Muthukumar, K., Shankar, S., Arthur James, R., 2019. Seasonal Species Variation of Sediment Organic Carbon Stocks in Salt Marshes of Tuticorin Area, Southern India. Wetlands 39, 483–494. [CrossRef]
  36. Koshy, N.E., Bhatt, J.R., Vakily, J.M., 2018. Synthesis of the Conference on Management and Conservation of Seagrass Ecosystems in India. Ocean Coast Manag 159, 3–6. [CrossRef]
  37. Lamb, A.L., Wilson, G.P., Leng, M.J., 2006. A review of coastal palaeoclimate and relative sea-level reconstructions using d 13 C and C / N ratios in organic material 75, 29–57. [CrossRef]
  38. Lin, J., Liu, X., Lai, T., He, B., Du, J., Zheng, X., 2021. Trophic importance of the seagrass Halophila ovalis in the food web of a Hepu seagrass bed and adjacent waters, Beihai, China. Ecol Indic 125, 107607. [CrossRef]
  39. Mason, V.G., Burden, A., Epstein, G., Jupe, L.L., Wood, K.A., Skov, M.W., 2023a. Blue carbon benefits from global saltmarsh restoration. Glob Chang Biol 1–29. [CrossRef]
  40. Mason, V.G., Burden, A., Epstein, G., Jupe, L.L., Wood, K.A., Skov, M.W., 2023b. Blue carbon benefits from global saltmarsh restoration. Glob Chang Biol 1–29. [CrossRef]
  41. Mcleod, E., Chmura, G.L., Bouillon, S., Salm, R., Björk, M., Duarte, C.M., Lovelock, C.E., Schlesinger, W.H., Silliman, B.R., 2011. A blueprint for blue carbon: toward an improved understanding of the role of vegetated coastal habitats in sequestering CO 2. Front Ecol Environ 9, 552–560. [CrossRef]
  42. McMahon, L., Ladd, C.J.T., Burden, A., Garrett, E., Redeker, K.R., Lawrence, P., Gehrels, R., 2023. Maximizing blue carbon stocks through saltmarsh restoration. Front Mar Sci 10, 1–16. [CrossRef]
  43. Mcowen, C.J., Weatherdon, L. V., Van Bochove, J.W., Sullivan, E., Blyth, S., Zockler, C., Stanwell-Smith, D., Kingston, N., Martin, C.S., Spalding, M., Fletcher, S., 2017. A global map of saltmarshes. Biodivers Data J 5. [CrossRef]
  44. Miller, C.B., Rodriguez, A.B., Mctigue, N.D., Bost, M.C., Mckee, B.A., n.d. Carbon accumulation rates are highest at young and expanding salt marsh edges. [CrossRef]
  45. Miller, L.C., Smeaton, C., Yang, H., Austin, W.E.N., 2023. Carbon accumulation and storage across contrasting saltmarshes of Scotland. Estuar Coast Shelf Sci 282, 108223. [CrossRef]
  46. Mishra, A., Apte, D., 2020. Ecological connectivity with mangroves influences tropical seagrass population longevity and meadow traits within an island ecosystem. Mar Ecol Prog Ser 644, 47–63. [CrossRef]
  47. Mishra, A.K., Acharya, P., Apte, D., Farooq, S.H., 2023. Seagrass ecosystem adjacent to mangroves store higher amount of organic carbon of Andaman and Nicobar Islands, Andaman Sea. Mar Pollut Bull 193, 115135. [CrossRef]
  48. Mishra, A.K., Farooq, S.H., 2022a. Lack of ecological data hinders management of ecologically important saltmarsh ecosystems: A case study of saltmarsh plant Porterasia coarctata (Roxb.). J Environ Manage 321, 115957. [CrossRef]
  49. Mishra, A.K., Farooq, S.H., 2022b. Trace metal accumulation in seagrass and saltmarsh ecosystems of India: comparative assessment and bioindicator potential. Mar Pollut Bull 174, 113251. [CrossRef]
  50. Mishra, A.K., Narayana, S., Apte, D., 2021. Loss of Dugong Grass [Halophila Ovalis (R. Brown)] Population Structure Due to Habitat Disturbance in an Island Ecosystem. Indian Journal of Geo-Marine Sciences 50, 115–121.
  51. Mishra, R.K., Naik, S., Mishra, S., Mahapatro, D., Khadanga, M.K., 2022. Mass nesting of sea turtles along the east coast of India: A sustainable environmental management approach. Ecol Inform 69, 101648. [CrossRef]
  52. Misra, S., Choudhury, A., Chattopadhyay, S., Ghosh, A., 1988. Lipid composition of Porteresia coarctata from two different mangrove habitats in India. Phytochemistry 27, 361–364. [CrossRef]
  53. Mohanty, B., Nayak, A., Dash, B., Rout, S.S., Charan Kumar, B., Patnaik, L., Dev Roy, M.K., Raman, A., Raut, D., 2019. Biodiversity and ecological considerations of brachyuran crabs (Crustacea: Decapoda) from Devi estuary–mangrove region on the east coast of India. Reg Stud Mar Sci 32, 100865. [CrossRef]
  54. Naik, S., Mishra, R.K., Sahu, K.C., Lotliker, A.A., Panda, U.S., Mishra, P., 2020. Monsoonal Influence and Variability of Water Quality, Phytoplankton Biomass in the Tropical Coastal Waters – A Multivariate Statistical Approach. Front Mar Sci 7, 1–14. [CrossRef]
  55. Nazneen, S., Kumar, A., Raju, N.J., Mehmood, G., 2022. Coastal macrophytes as bioindicators of trace metals in the Asia ’ s largest lagoon ecosystem. Mar Pollut Bull 178, 113576. [CrossRef]
  56. Nordhaus, W.D., 2017. Revisiting the social cost of carbon. Proc Natl Acad Sci U S A 114, 1518–1523. [CrossRef]
  57. Pattnayak, S., Kumar, M., Sahu, S.C., Dhal, N.K., Behera, R.K., 2019. Comparison of soil characteristics and carbon content of contrastingly different moist-mixed deciduous and evergreen mangrove forest in Odisha, India. Geology, Ecology, and Landscapes 3, 239–246. [CrossRef]
  58. Perera, N., Lokupitiya, E., Halwatura, D., Udagedara, S., 2022. Quantification of blue carbon in tropical salt marshes and their role in climate change mitigation. Science of the Total Environment 820, 153313. [CrossRef]
  59. Phillips, D.L., Gregg, J.W., 2001. Uncertainty in source partitioning using stable isotopes. Oecologia 127, 171–179. [CrossRef]
  60. Phillips, D.L., Newsome, S.D., Gregg, J.W., 2005. Combining sources in stable isotope mixing models: alternative methods. Oecologia 144, 520–527. [CrossRef]
  61. Phillips, J.,& Yang, L., 2017. Oryza coarctata. The IUCN Red List of Threatended Species 2017.
  62. Pradhan, U.K., Shirodkar, P. V., Sahu, B.K., 2009. Physico-chemical characteristics of the coastal water off Devi estuary, Orissa and evaluation of its seasonal changes using chemometric techniques. Curr Sci 96, 1203–1209.
  63. Pramanik, D.S., 2019. Fish species diversity and their assemblages of Devi estuary in north east coast of India. Int J Fish Aquat Stud 7, 265–273.
  64. Prasad, M.B.K., Kumar, A., Datta, D.K., Ramanathan, L., 2014. Spectrofluorometric analysis of organic matter in the Sundarban mangrove, Bangladesh. Indian Journal of Geo-Marine Sciences 43, 999–1006.
  65. Qu, W., Li, J., Han, G., Wu, H., Song, W., Zhang, X., 2019. Effect of salinity on the decomposition of soil organic carbon in a tidal wetland 609–617.
  66. Quevedo, J.M.D., Uchiyama, Y., Kohsaka, R., 2023. Progress of blue carbon research: 12 years of global trends based on content analysis of peer-reviewed and ‘gray literature’ documents. Ocean Coast Manag 236, 106495. [CrossRef]
  67. Radabaugh, K.R., Powell, C.E., Bociu, I., Clark, B.C., Moyer, R.P., 2017. Plant size metrics and organic carbon content of Florida salt marsh vegetation. Wetl Ecol Manag 25, 443–455. [CrossRef]
  68. Rahaman, S.M.B., Sarder, L., Rahaman, M.S., Ghosh, A.K., Biswas, S.K., Siraj, S.M.S., Huq, K.A., Hasanuzzaman, A.F.M., Islam, S.S., 2013. Nutrient dynamics in the Sundarbans mangrove estuarine system of Bangladesh under different weather and tidal cycles. Ecol Process 2, 1–13. [CrossRef]
  69. Ramesh, R., Banerjee, K., Paneer Selvam, A., Lakshmi, A., Krishnan, P., Purvaja, R., 2018. Legislation and policy options for conservation and management of seagrass ecosystems in India. Ocean Coast Manag 159, 46–50. [CrossRef]
  70. Rasquinha, D.N., Mishra, D.R., 2021. Impact of wood harvesting on mangrove forest structure, composition and biomass dynamics in India. Estuar Coast Shelf Sci 248, 106974. [CrossRef]
  71. Rendón, O.R., Garbutt, A., Skov, M., Möller, I., Alexander, M., Ballinger, R., Wyles, K., Smith, G., McKinley, E., Griffin, J., Thomas, M., Davidson, K., Pagès, J.F., Read, S., Beaumont, N., 2019. A framework linking ecosystem services and human well-being: Saltmarsh as a case study. People and Nature 1, 486–496. [CrossRef]
  72. Ricke, K., Drouet, L., Caldeira, K., Tavoni, M., 2018. Country-level social cost of carbon. Nat Clim Chang 8, 895–900. [CrossRef]
  73. Saha, K., Sanyal, P., Saha, S., 2022. Source assessment of tropical-marshland sediment for evaluating seawater intrusion in Chandipur, India: An integrated granulometric and stable isotope approach. Estuar Coast Shelf Sci 278, 108096. [CrossRef]
  74. Sahu, S.C., Kumar, M., Ravindranath, N.H., 2016. Carbon stocks in natural and planted mangrove forests of Mahanadi Mangrove Wetland, East Coast of India. Curr Sci 110, 2253–2260. [CrossRef]
  75. Samantaray, S., Sanyal, P., 2022. Sources and fate of organic matter in a hypersaline lagoon: A study based on stable isotopes from the Pulicat lagoon, India. Science of the Total Environment 807, 150617. [CrossRef]
  76. Serrano, O., Lovelock, C.E., B. Atwood, T., Macreadie, P.I., Canto, R., Phinn, S., Arias-Ortiz, A., Bai, L., Baldock, J., Bedulli, C., Carnell, P., Connolly, R.M., Donaldson, P., Esteban, A., Ewers Lewis, C.J., Eyre, B.D., Hayes, M.A., Horwitz, P., Hutley, L.B., Kavazos, C.R.J., Kelleway, J.J., Kendrick, G.A., Kilminster, K., Lafratta, A., Lee, S., Lavery, P.S., Maher, D.T., Marbà, N., Masque, P., Mateo, M.A., Mount, R., Ralph, P.J., Roelfsema, C., Rozaimi, M., Ruhon, R., Salinas, C., Samper-Villarreal, J., Sanderman, J., J. Sanders, C., Santos, I., Sharples, C., Steven, A.D.L., Cannard, T., Trevathan-Tackett, S.M., Duarte, C.M., 2019. Australian vegetated coastal ecosystems as global hotspots for climate change mitigation. Nat Commun 10, 1–10. [CrossRef]
  77. Shaik, A. ur R., Biswas, H., Reddy, N.P.C., Srinivasa Rao, V., Bharathi, M.D., Subbaiah, C. V., 2015. Time series monitoring of water quality and microalgal diversity in a tropical bay under intense anthropogenic interference (SW coast of the Bay of Bengal, India). Environ Impact Assess Rev 55, 169–181. [CrossRef]
  78. Shrinivas, S., Sumitra, P., Sangeeta, N., Bhabani, M., Panda, S., Mahala, S.S., 2023. A comprehensive study of the estuary sea environment in the Bay of Bengal, near the Mahanadi River confluence. Discover Water. [CrossRef]
  79. Srinivasan, V., Natesan, U., Parthasarathy, A., 2013. Seasonal Variability of Coastal Water Quality in Bay of Bengal and Palk Strait, Tamilnadu, Southeast Coast of India 56, 875–884.
  80. Stankovic, M., Mishra, A.K., Rahayu, Y.P., Lefcheck, J., Murdiyarso, D., Friess, D.A., Corkalo, M., Vukovic, T., Vanderklift, M.A., Farooq, S.H., Gaitan-Espitia, J.D., Prathep, A., 2023. Blue carbon assessments of seagrass and mangrove ecosystems in South and Southeast Asia: Current progress and knowledge gaps. Science of The Total Environment 904, 166618. [CrossRef]
  81. Sundaray, S.K., Panda, U.C., Nayak, B.B., Bhatta, D., 2006. Multivariate statistical techniques for the evaluation of spatial and temporal variations in water quality of the Mahanadi river-estuarine system (India) - A case study. Environ Geochem Health 28, 317–330. [CrossRef]
  82. Swain, S., Sahu, B.K., Pattanaik, S., Sahoo, R.K., Majhi, A., Satapathy, D.R., Panda, C.R., Roy, R., Choudhury, S.B., 2021. Anthropogenic influence on the physico-chemical parameters of Dhamra estuary and adjoining coastal water of the Bay of Bengal. Mar Pollut Bull 162, 111826. [CrossRef]
  83. Tang, H., Xin, P., Ge, Z., Gong, Z., Yang, Y., Zhang, Y., 2020. Estuarine, Coastal and Shelf Science Response of a salt marsh plant to sediment deposition disturbance. Estuar Coast Shelf Sci 237, 106695. [CrossRef]
  84. Tessier, M., Vivier, J.P., Ouin, A., Gloaguen, J.C., Lefeuvre, J.C., 2003. Vegetation dynamics and plant species interactions under grazed and ungrazed conditions in a western European salt marsh. Acta Oecologica 24, 103–111. [CrossRef]
  85. Viswanathan, C., Purvaja, R., Joyson Joe Jeevamani, J., Deepak Samuel, V., Sankar, R., Abhilash, K.R., Gejo Anna Geevarghese, Muruganandam, R., Gopi, M., Raja, S., Rocktim Ramen Das, Shesdev Patro, Krishnan, P., Ramesh, R., 2020. Salt marsh vegetation in India: Species composition, distribution, zonation pattern and conservation implications. Estuar Coast Shelf Sci 242, 106792. [CrossRef]
  86. Mariotti, G., Carr, J., 2014. Dual role of salt marsh retreat: Long-term loss and short-term resilience. Water Resour Res 50, 2963–2974. [CrossRef]
  87. Whitfield, A.K., 2017. The role of seagrass meadows, mangrove forests, salt marshes and reed beds as nursery areas and food sources for fishes in estuaries. Rev Fish Biol Fish 27, 75–110. [CrossRef]
  88. Wu, F., Pennings, S.C., Ortals, C., Ruiz, J., Farrell, W.R., Mcnichol, S.M., Angelini, C., Spivak, A.C., Alber, M., Tong, C., 2021. Disturbance is complicated : Headward-eroding saltmarsh creeks produce multiple responses and recovery trajectories 1–15. [CrossRef]
  89. Yando, E.S., Jones, S.F., James, W.R., Colombano, D.D., Montemayor, D.I., Nolte, S., Raw, J.L., Ziegler, S.L., Chen, L., Daffonchio, D., Fusi, M., Rogers, K., Sergienko, L., 2023. An integrative salt marsh conceptual framework for global comparisons. Limnol Oceanogr Lett. [CrossRef]
  90. Yang, D., Miao, X.Y., Wang, B., Jiang, R.P., Wen, T., Liu, M.S., Huang, C., Xu, C., 2020. System-specific complex interactions shape soil organic carbon distribution in coastal salt marshes. Int J Environ Res Public Health 17, 1–11. [CrossRef]
  91. Yuan, Y., Li, X., Xie, Z., Xue, L., Yang, B., Zhao, W., Craft, C.B., 2022. Annual Lateral Organic Carbon Exchange Between Salt Marsh and Adjacent Water: A Case Study of East Headland Marshes at the Yangtze Estuary. Front Mar Sci 8, 1–15. [CrossRef]
  92. Zhang, Z., Zhang, H., Yu, D., Song, J., Zhou, J., Liu, H., Zhao, X., Jiang, Y., Wang, M., 2020. Influence of spatial heterogeneity of artificial reefs on food sources and trophic levels of marine animals based on stable isotope ratios. Ecol Indic 118, 106779. [CrossRef]
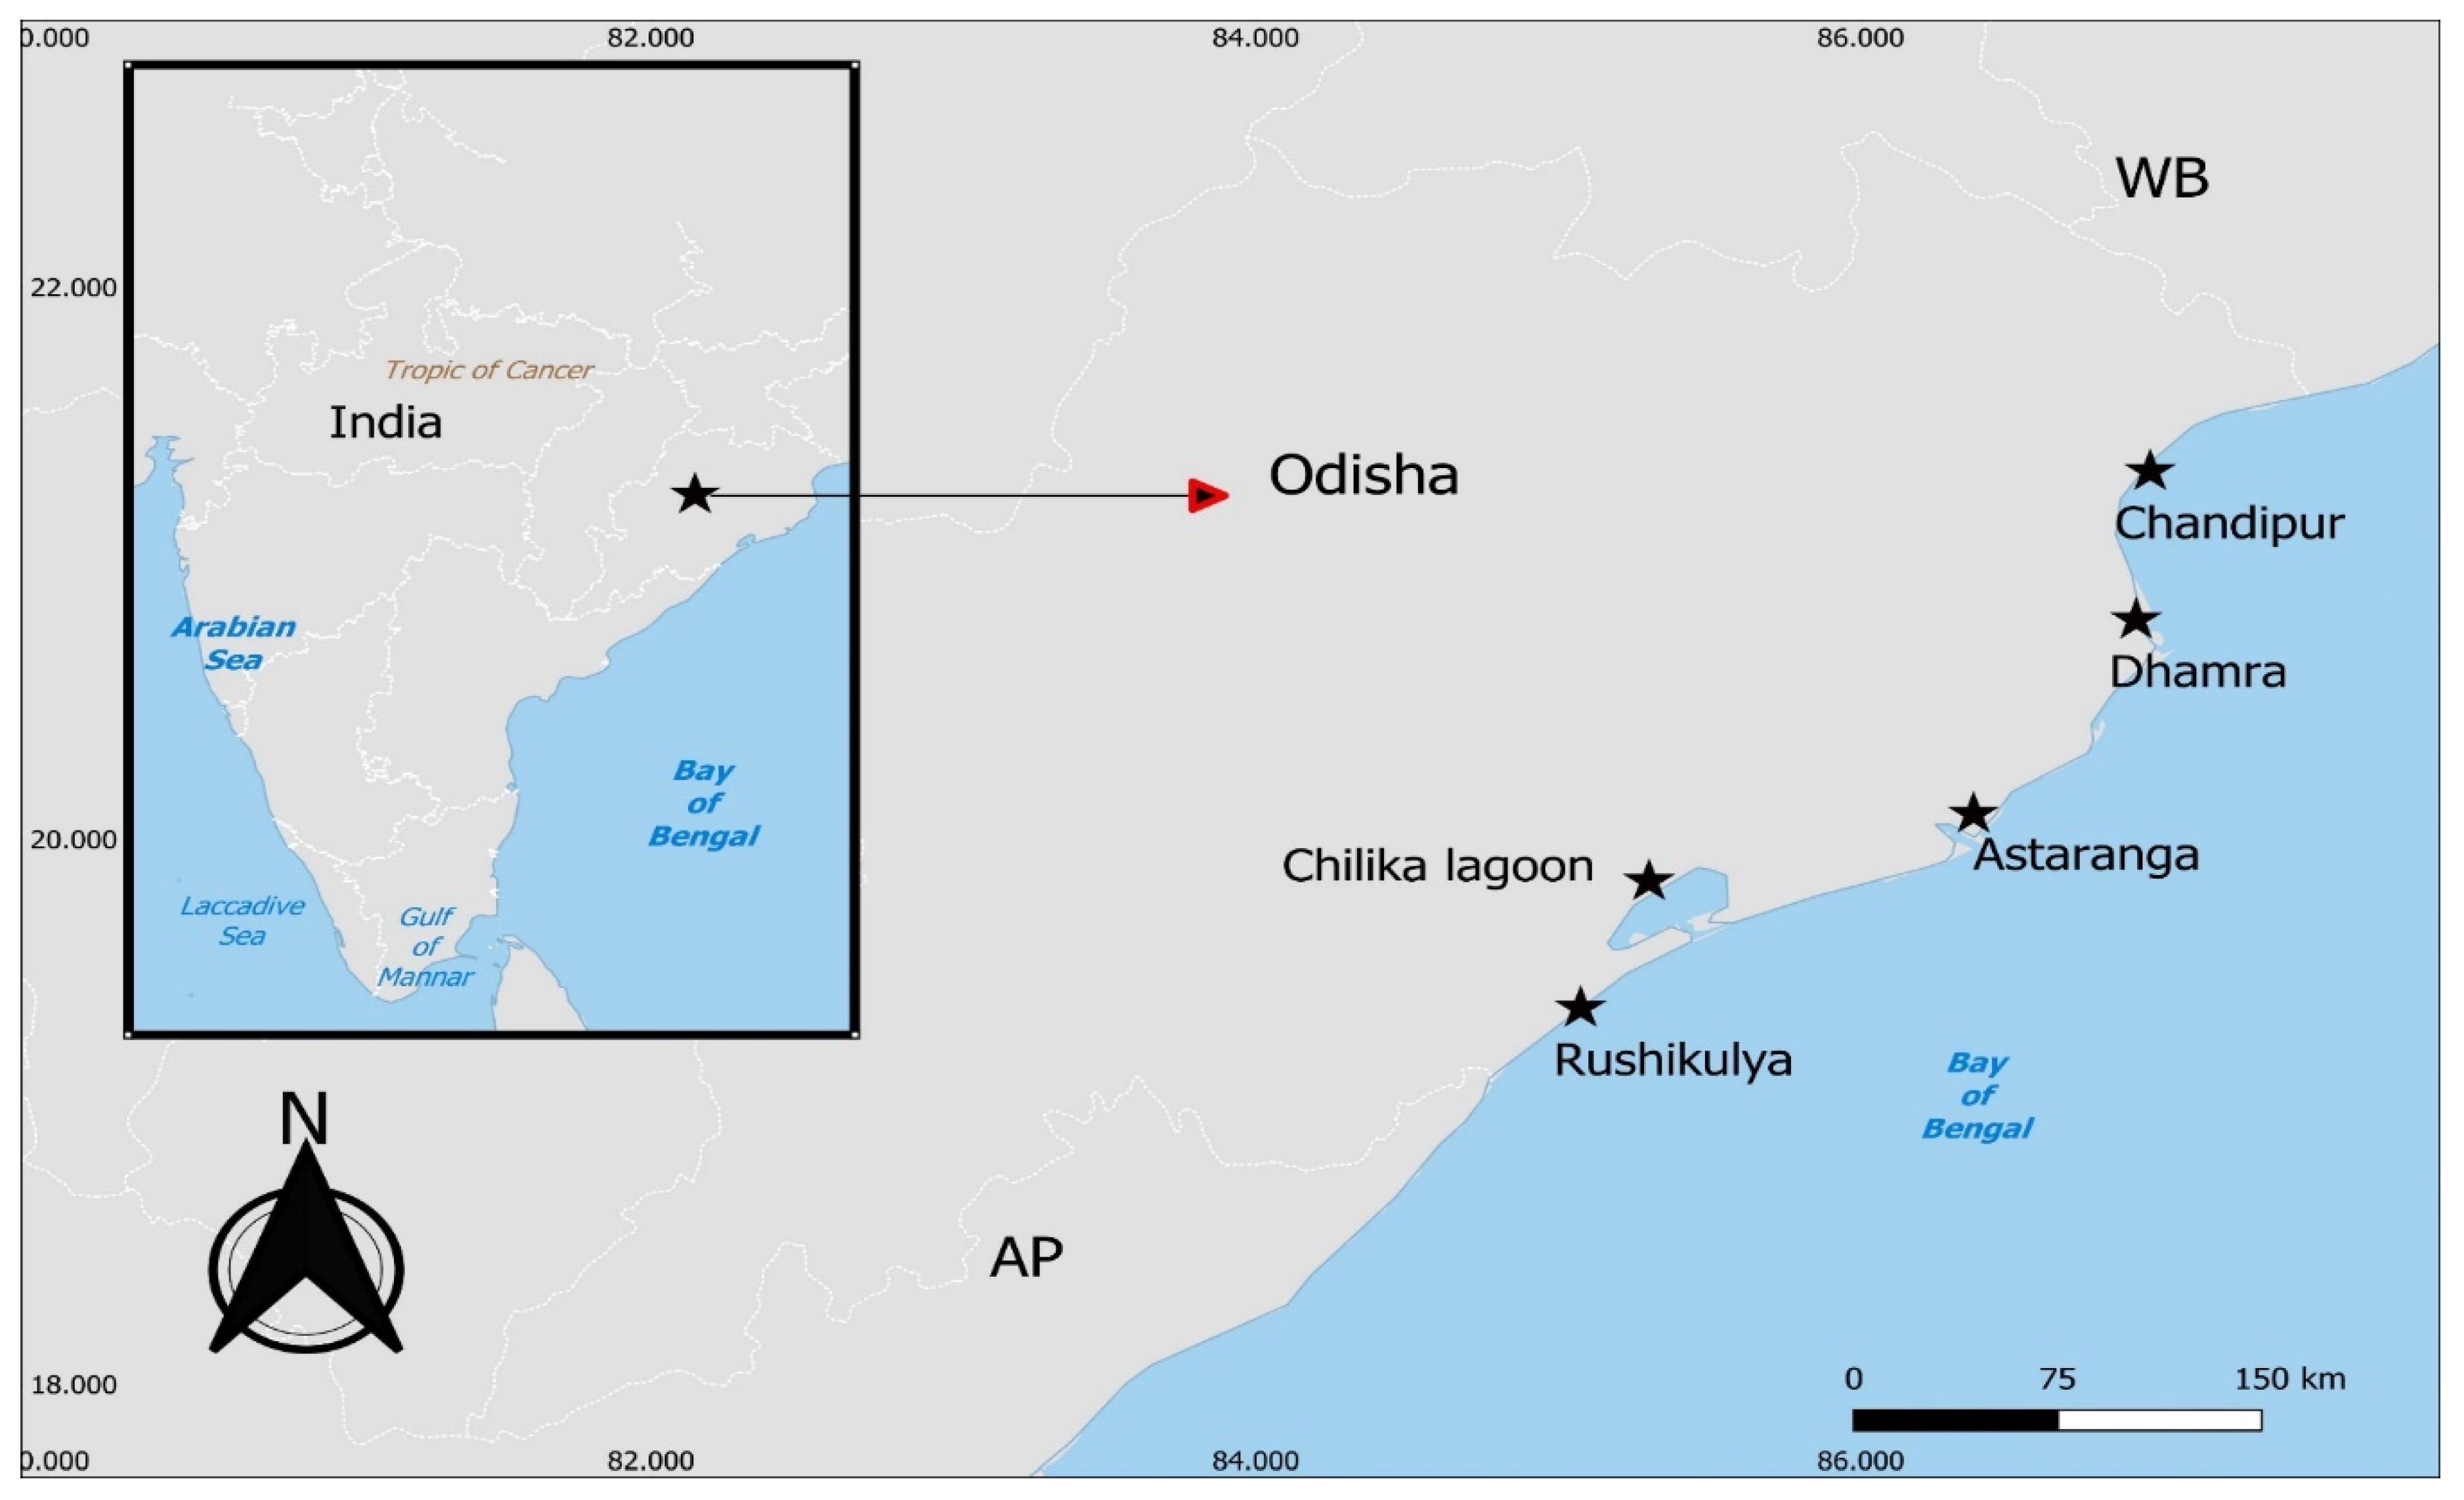
Figure 1. Map showing the study sites in the state of Odisha on the east coast of India. West Bengal (WB) and Andhra Pradesh (AP) are the neighboring coastal states of Odisha on the east coast of India.
Preprints 98624 g001
Figure 2. P. coarctata meadows across the four locations of the study sites, a) Chandipur, b) Dhamra, c) Astaranga and d) Rushikulya across the state of Odisha, India.
Preprints 98624 g002aPreprints 98624 g002b
Figure 3. Seasonal variation in the sediment core sections for, a) organic matter (OM%) content and b) organic carbon (Corg%) in P. coarctata ecosystems across the four locations of the coast of Odisha, India. Statistical significance (p<0.05) was derived from two-way ANOVA analysis using locations and seasons as fixed factors. (p<0.0001****, p<0.001***, not significant ns).
Preprints 98624 g003
Figure 4. Seasonal variation in the sediment core sections for stable isotopes of δ13C (a &b) and δ15N (c & d), in P. coarctata ecosystems across the four locations of the coast of Odisha, India. Statistical significance (p<0.05) was derived from two-way ANOVA analysis using locations and seasons as fixed factors. (p<0.0001****, p<0.001***, not significant ns).
Preprints 98624 g004
Figure 5. Contribution of a) C sources to sediment Corg in the P. coarctata meadows form the coast of Odisha. M. wightiana (C4 plant), P. coarctata (C3 plant) and particulate organic matter (POM) using IsoSource mixing, and the scatter plots of δ13C versus total C: N ratio of b) sediment (Sd) and c) saltmarsh biomass in pre-and post-monsoon seasons of Odisha coast. Representative δ13C and C: N ratio for organic matter inputs to coastal ecosystems from marine and freshwater macrophytes and particulate organic carbon (POC), and dissolved organic carbon (DOC) are imported from Lamb et al., (2006).
Preprints 98624 g005aPreprints 98624 g005b
Figure 6. Seasonal variation in P. coarctata a) shoot density (individuals m-2) and b) biomass (g DW m-2) across the four study locations of the coast of Odisha, India. Statistical significance (p<0.05) was derived from two-way ANOVA analysis using locations and seasons as fixed factors. (p<0.0001****, p<0.001***).
Preprints 98624 g006
Figure 7. Seasonal variation in P. coarctata total carbon stocks (a & c) and CO2 equivalent (b & d) across the four study locations of the coast of Odisha, India. Statistical significance (p<0.05) was derived from two-way ANOVA analysis using locations and seasons as fixed factors. (p<0.0001****, p<0.001***). No statistical significance was carried out for CO2 equivalent data.
Preprints 98624 g007
Disclaimer/Publisher’s Note: The statements, opinions and data contained in all publications are solely those of the individual author(s) and contributor(s) and not of MDPI and/or the editor(s). MDPI and/or the editor(s) disclaim responsibility for any injury to people or property resulting from any ideas, methods, instructions or products referred to in the content.
Copyright: This open access article is published under a Creative Commons CC BY 4.0 license, which permit the free download, distribution, and reuse, provided that the author and preprint are cited in any reuse.
Prerpints.org logo

Preprints.org is a free preprint server supported by MDPI in Basel, Switzerland.

Subscribe

© 2024 MDPI (Basel, Switzerland) unless otherwise stated