Submitted:
12 February 2024
Posted:
12 February 2024
You are already at the latest version
Abstract
Keywords:
1. Introduction
2. Related Work
3. Methodology
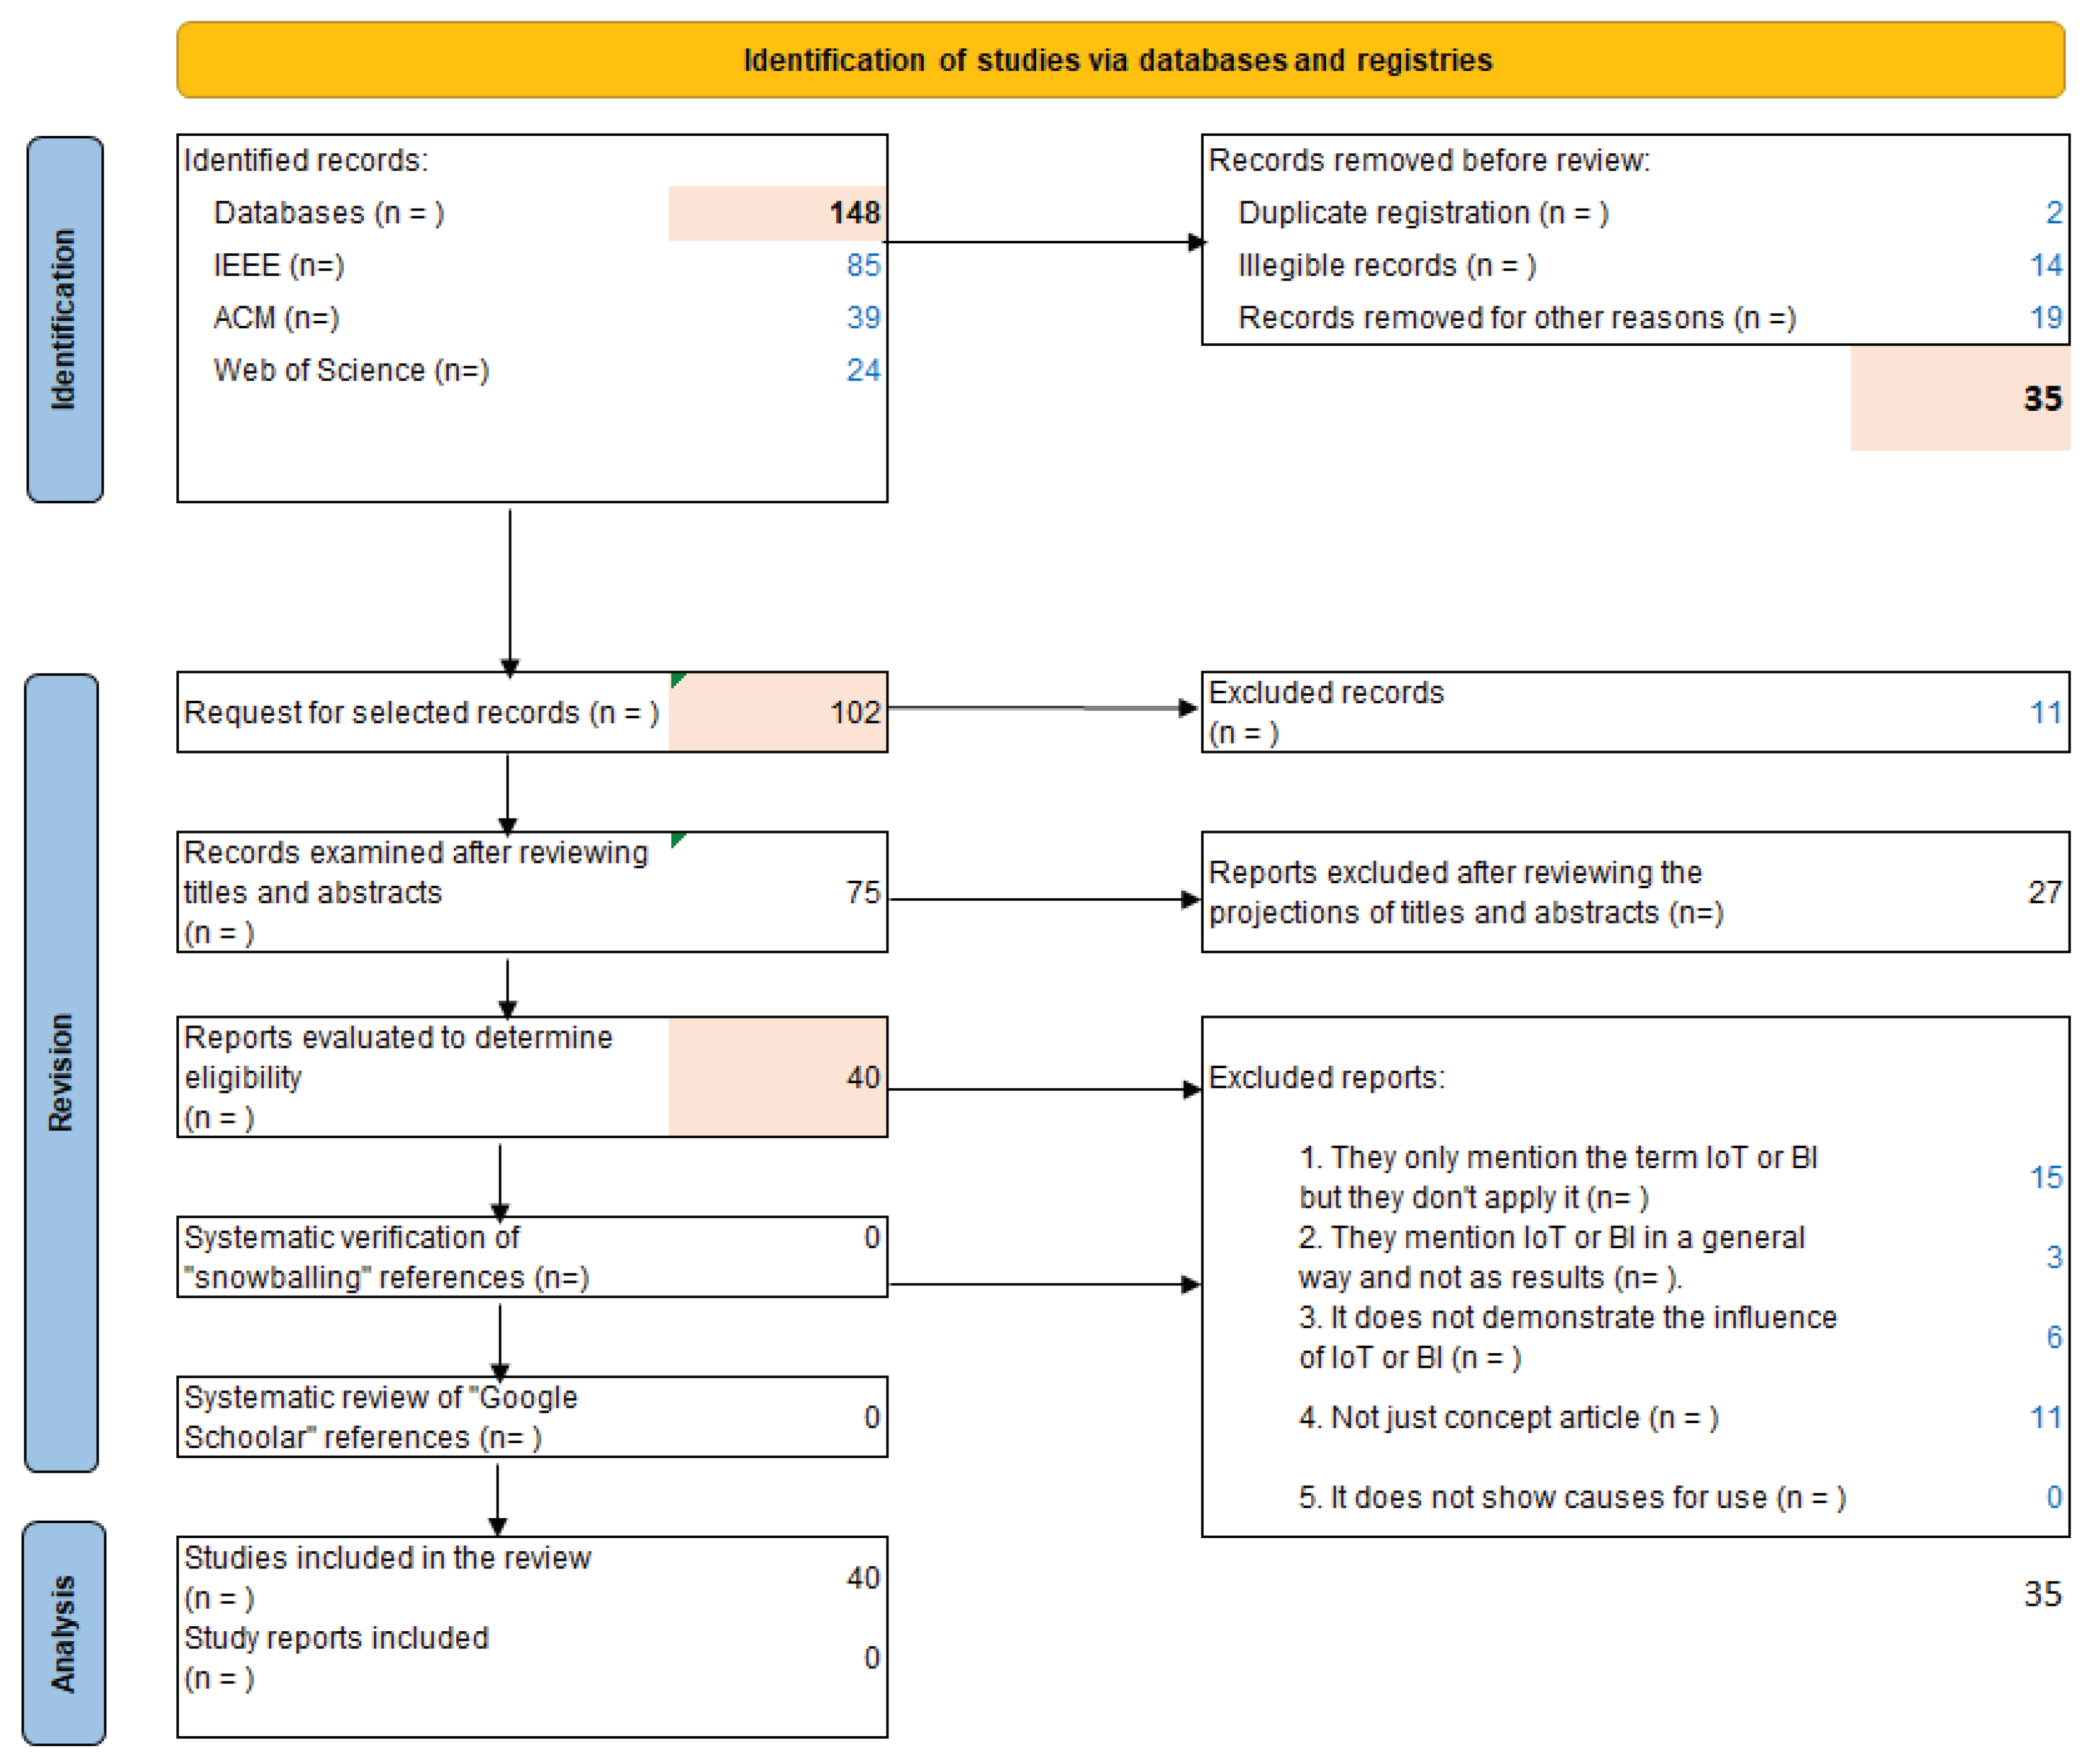
- Identification of studies: it is based on a search in one or several library databases; IEEE, ACM Digital Library, and Web of Science are considered; peer-reviewed articles are used. Mendeley software is used to eliminate duplicate articles. The filtering keywords are IoT, Business Intelligence, and LPG.;
-
Eligibility criteria: It is necessary to define the types of studies that could be considered for this study. The inclusion criteria for eligibility are as follows: The article is scientific. It is Written in English. The Content is on IoT or Business Intelligence in LPG management. The exclusion criteria are as follows: The article is younger than 2018. It is in a language other than English. It is an Abstract article. It is a Paid article.The following research questions (PI) are defined:
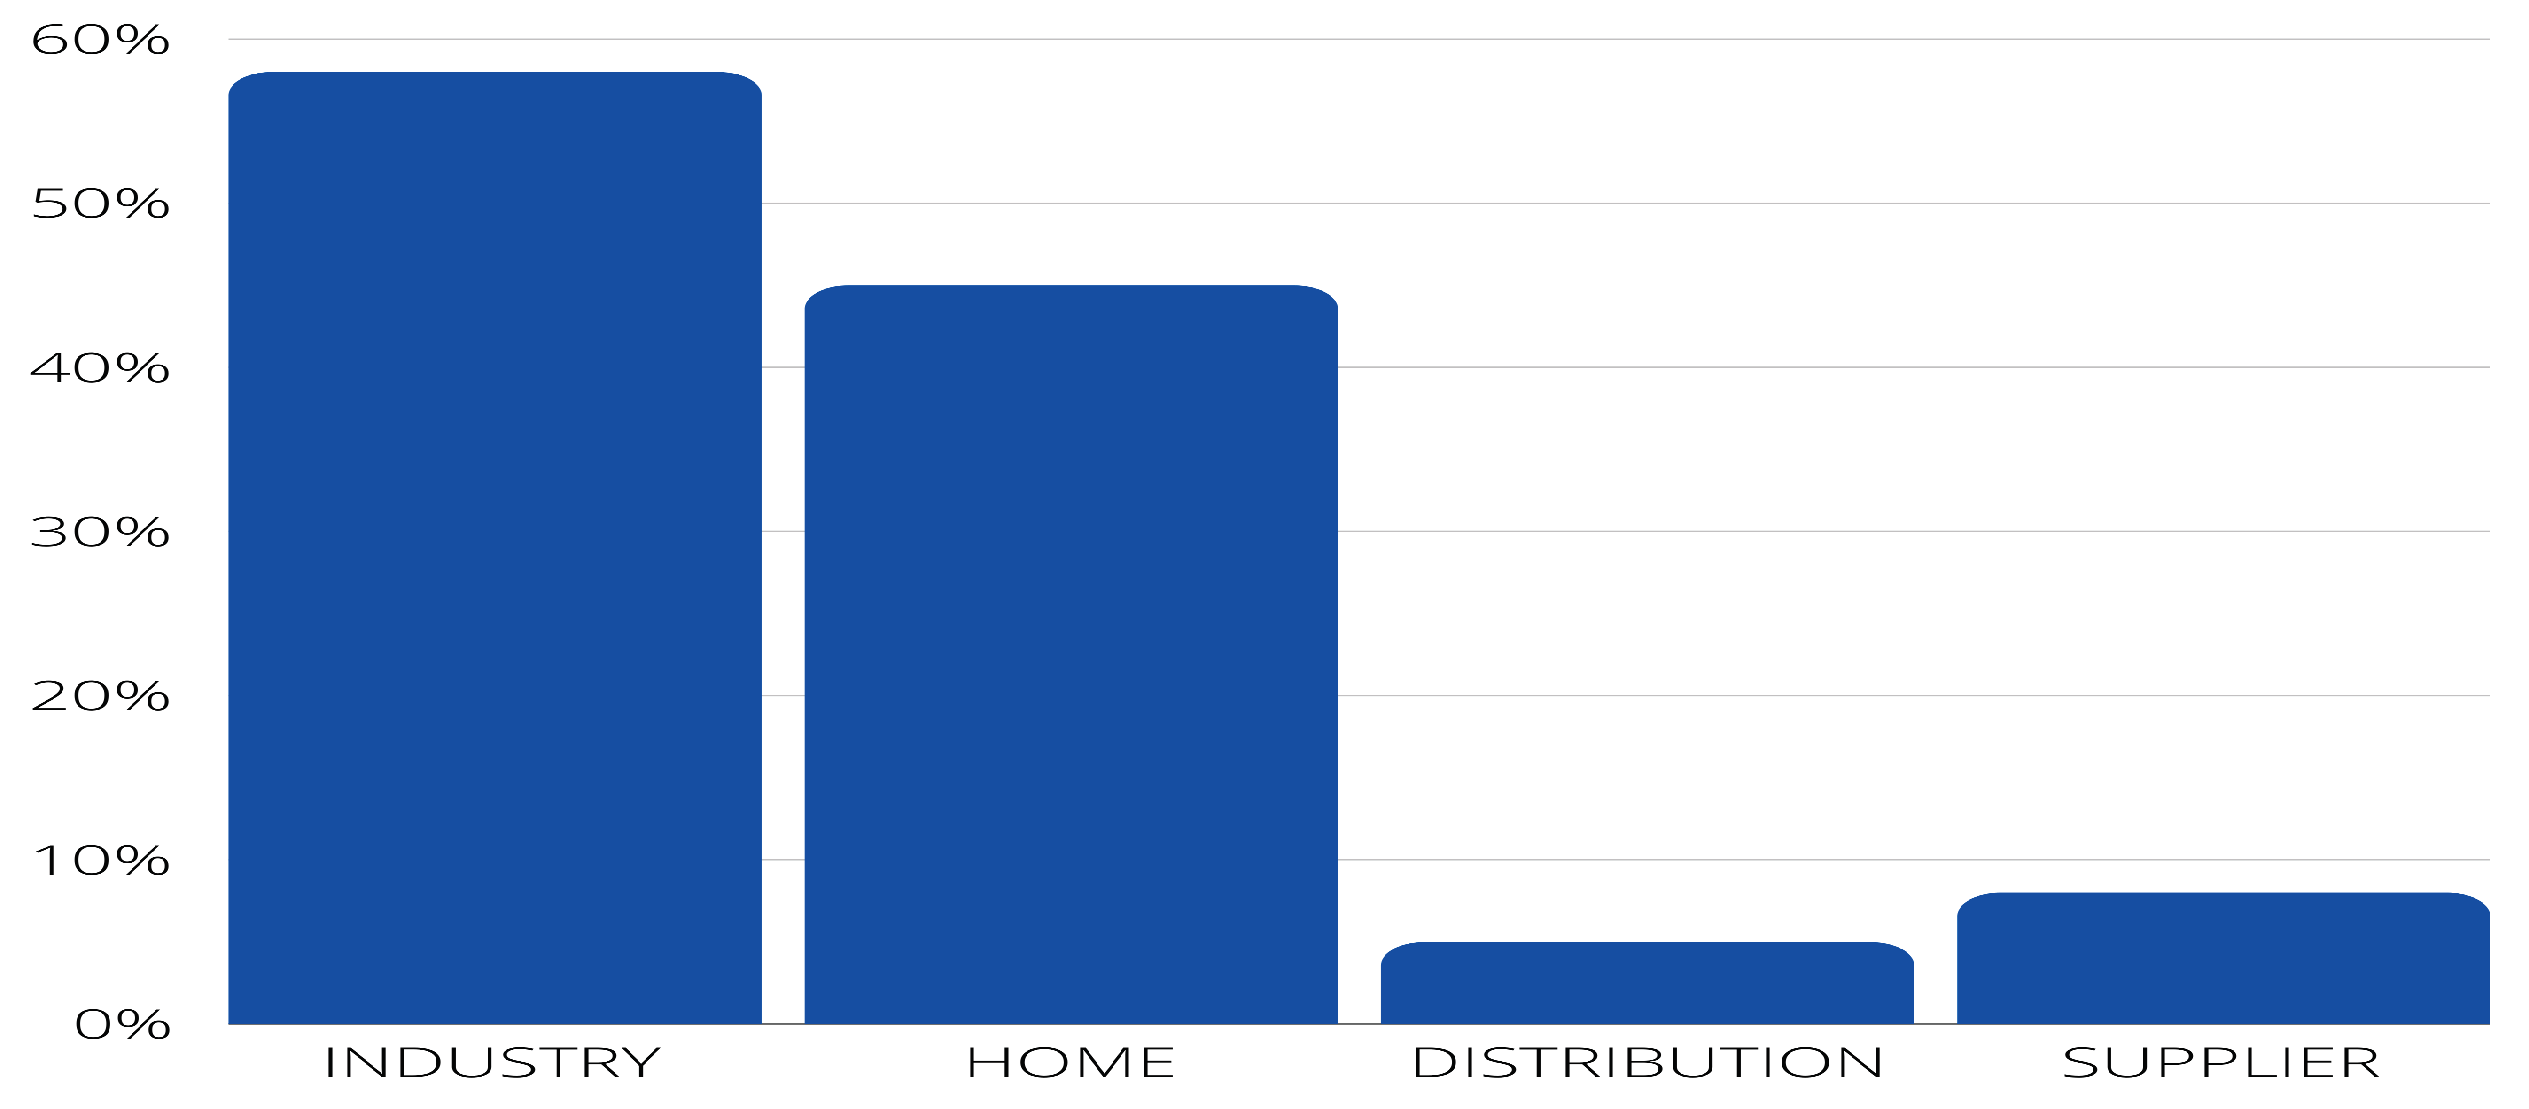
- PI1: In which scenarios is IoT used (e.g., industry, household, housing estates, distribution, supplier)?
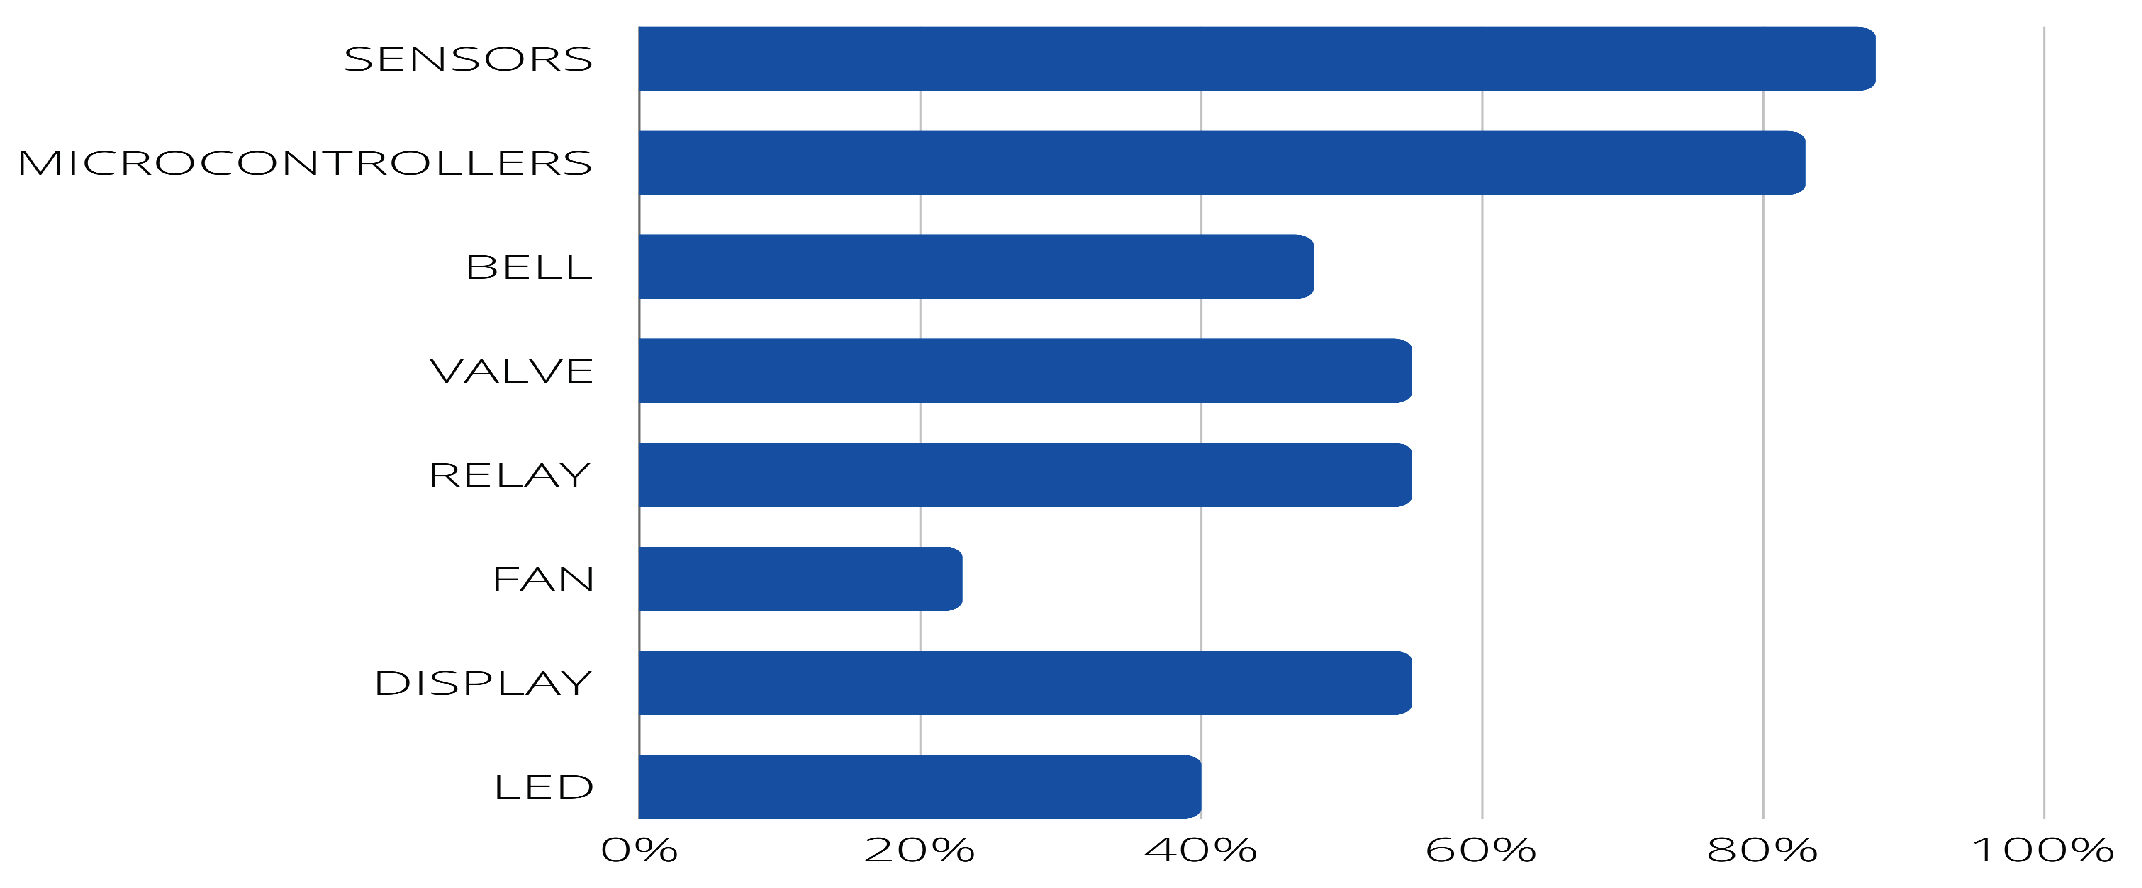
- PI2: What devices are used in LPG monitoring (e.g., sensors, microcontrollers, buzzers)?
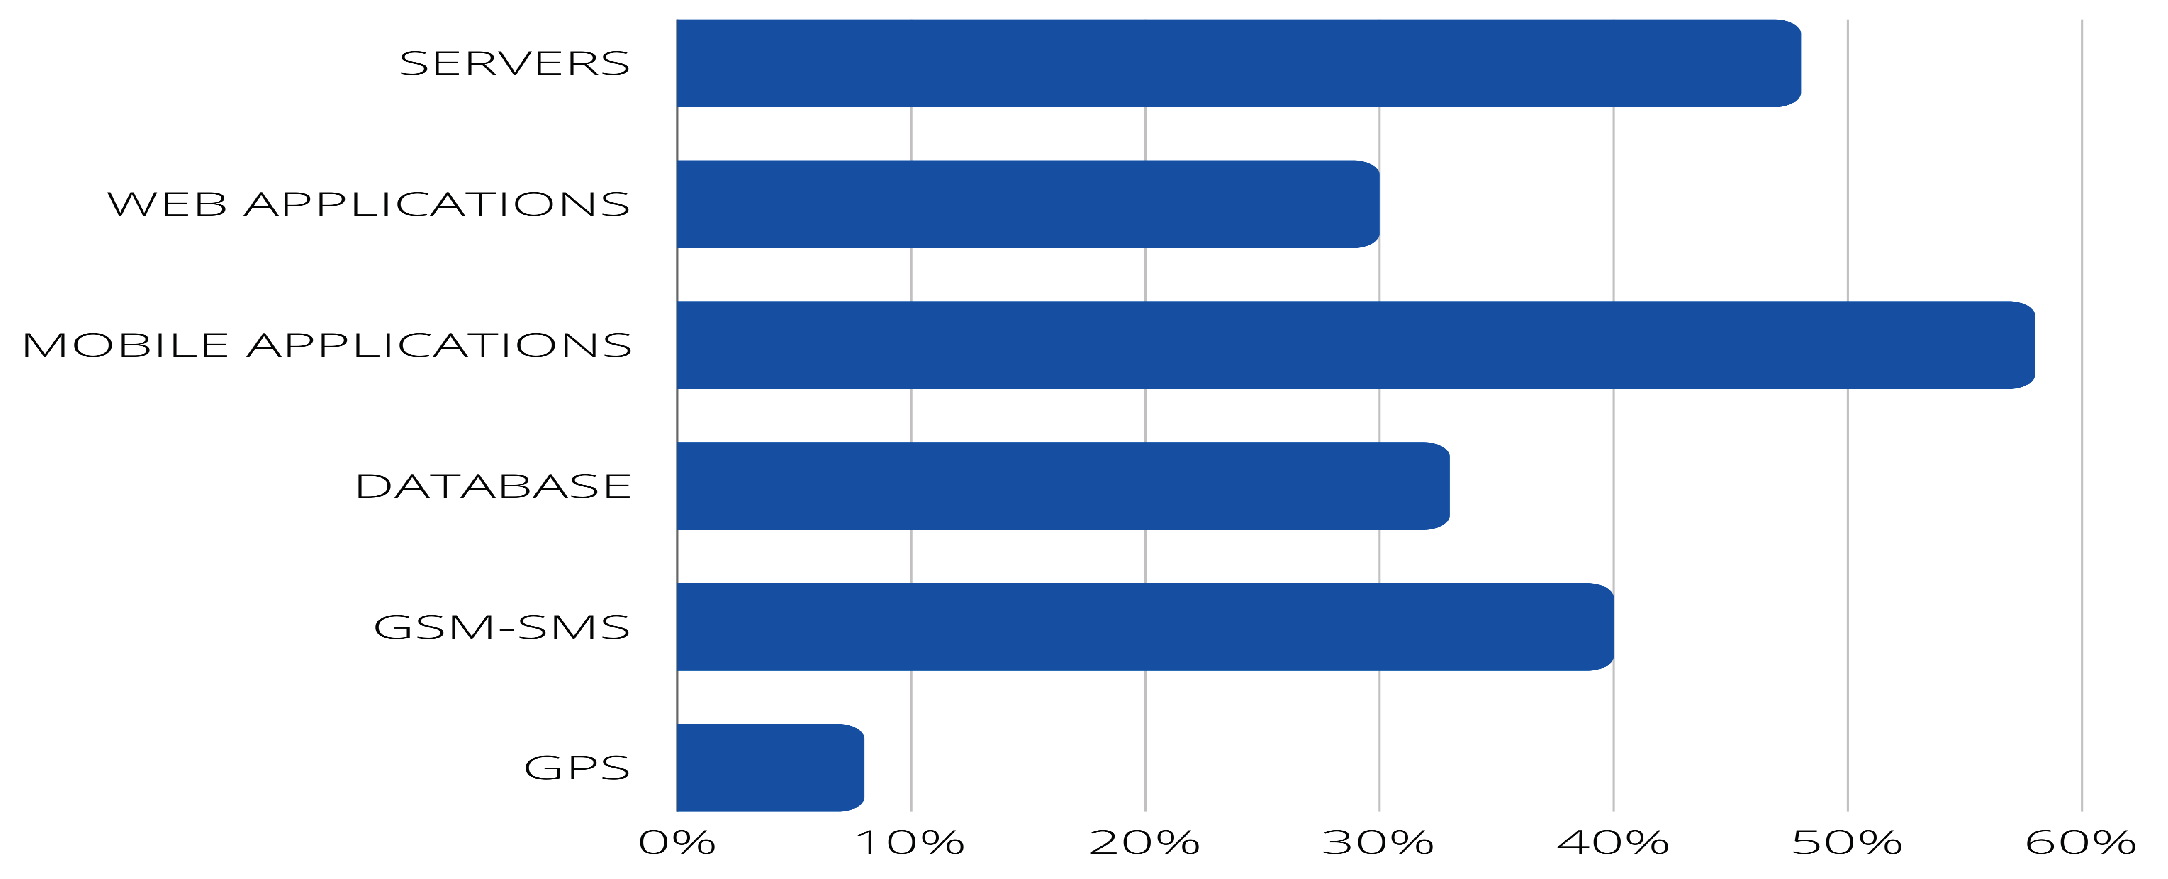
- PI3: What other components are used (e.g., server, web application, mobile application)?
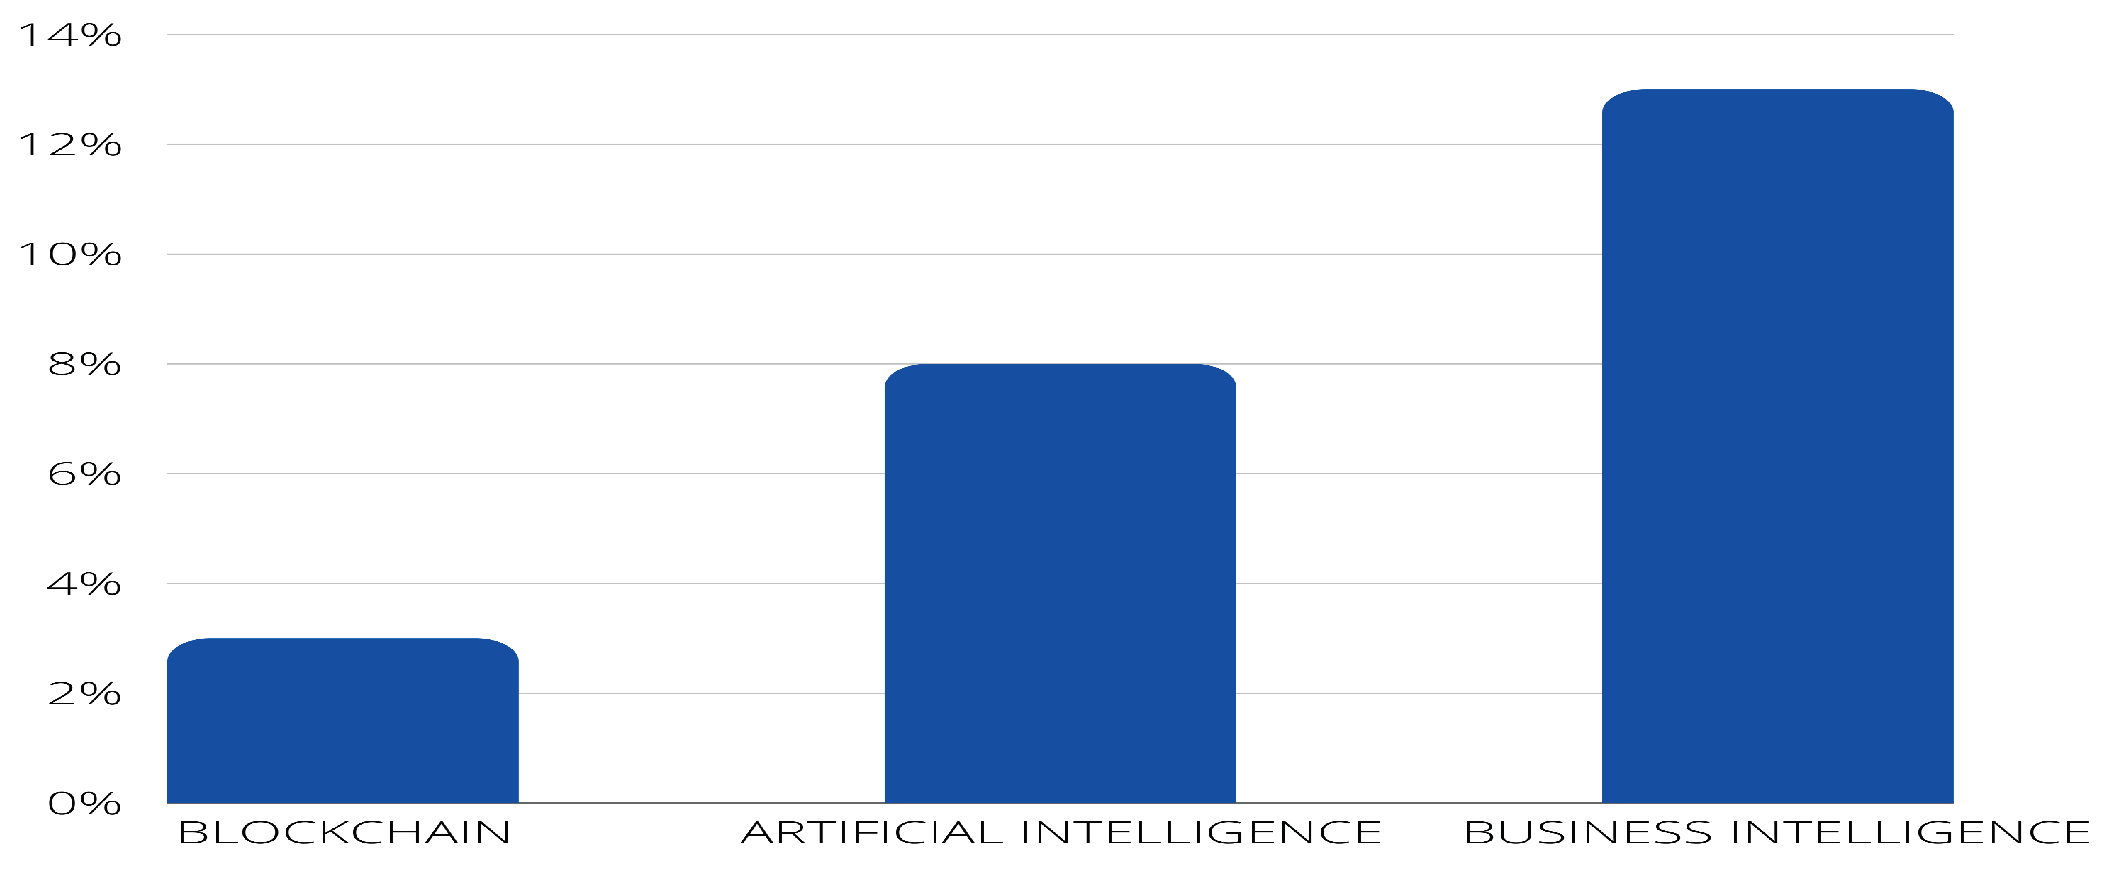
- PI4: Are other technologies used for LPG monitoring (e.g., Blockchain, AI, Big Data)?
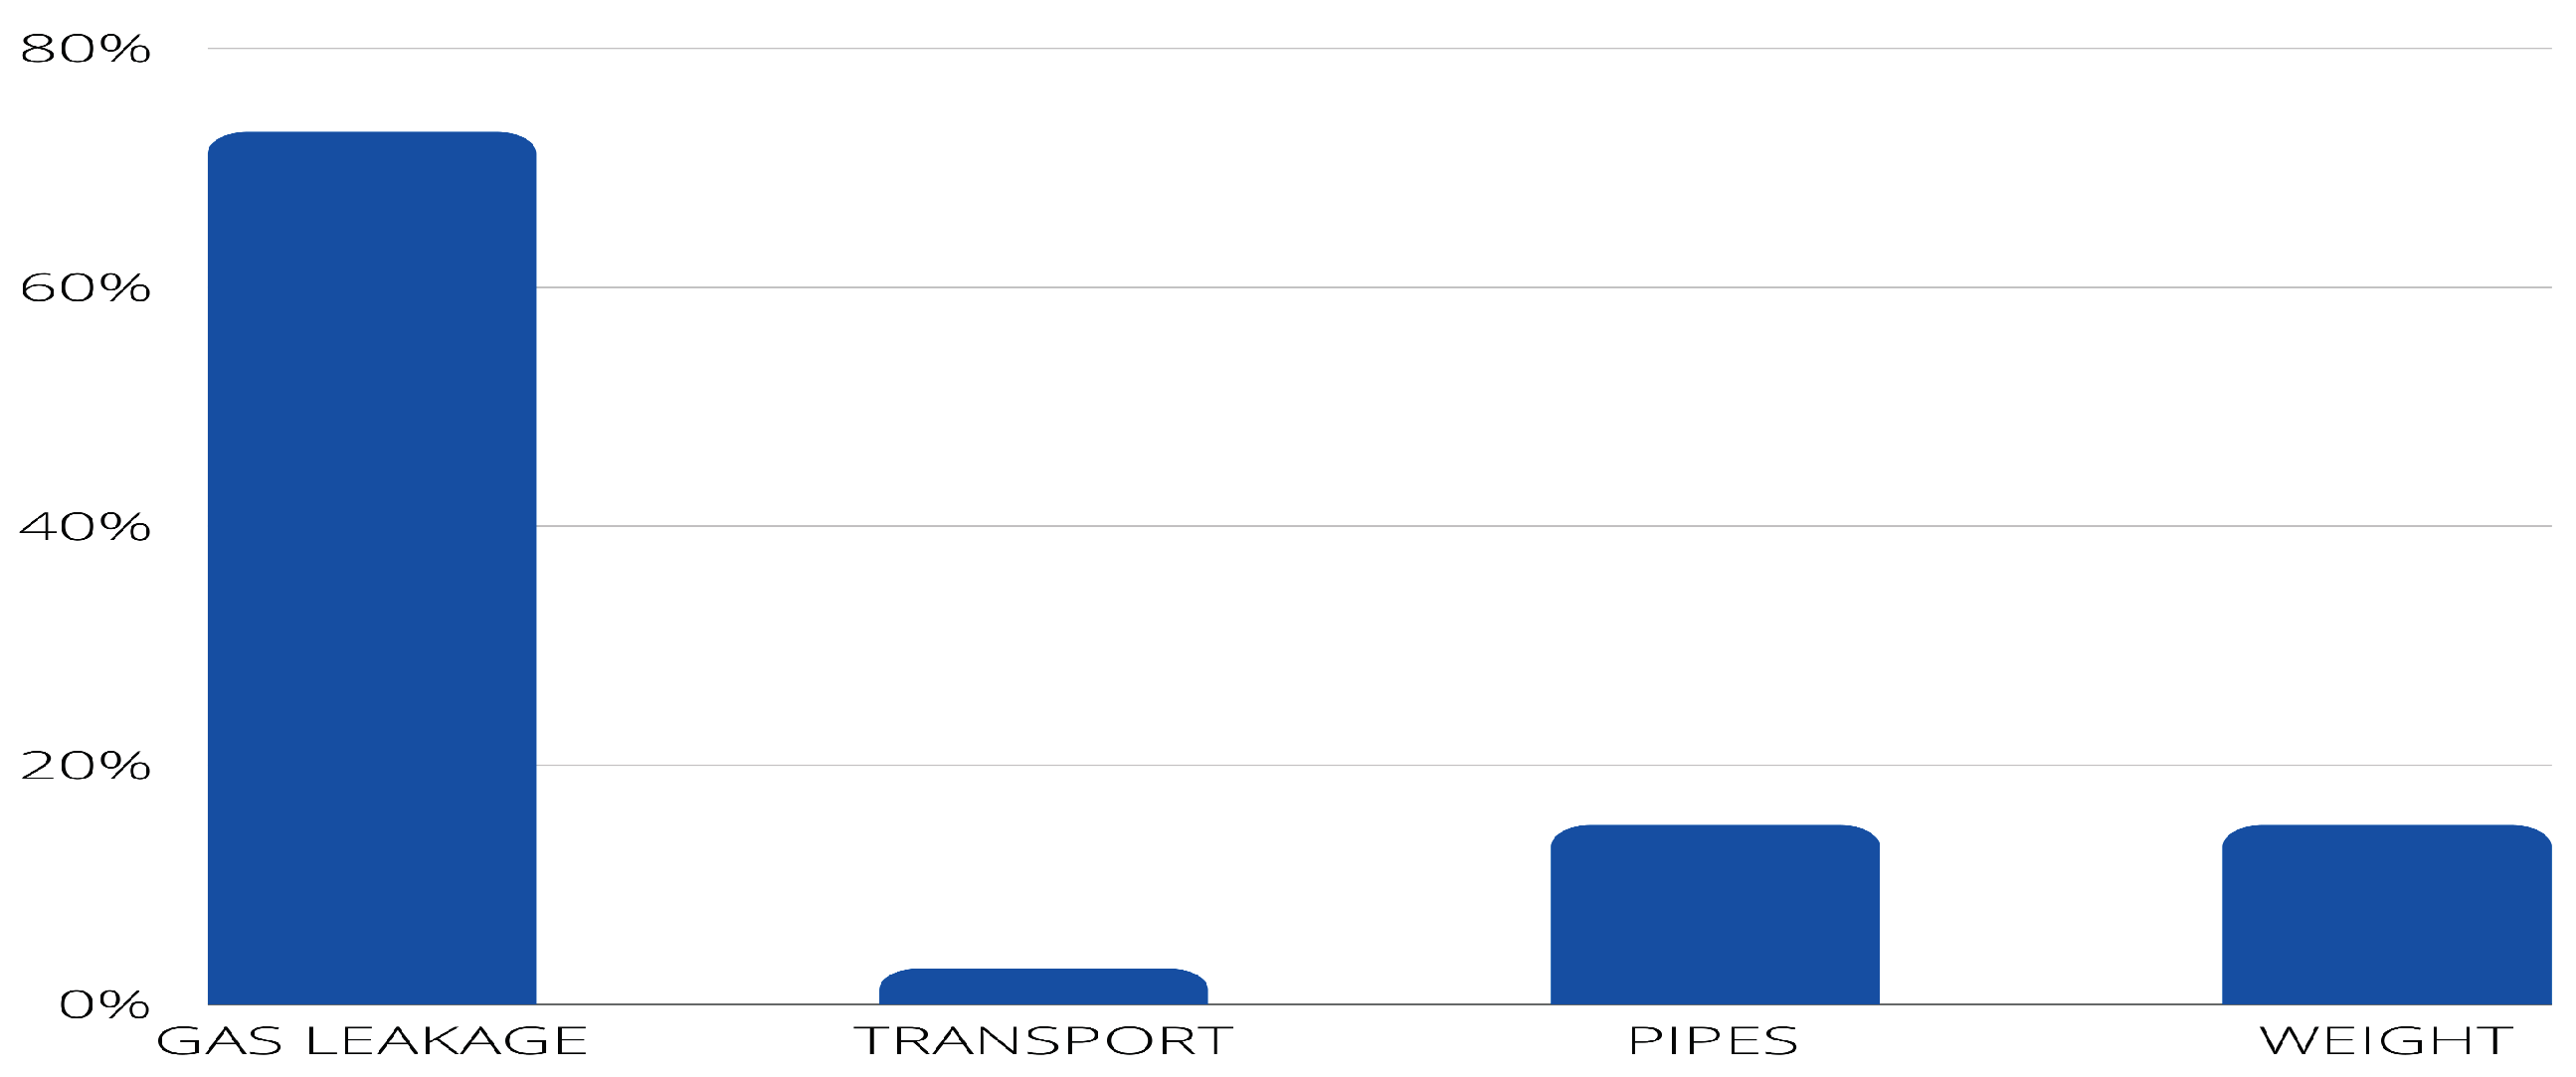
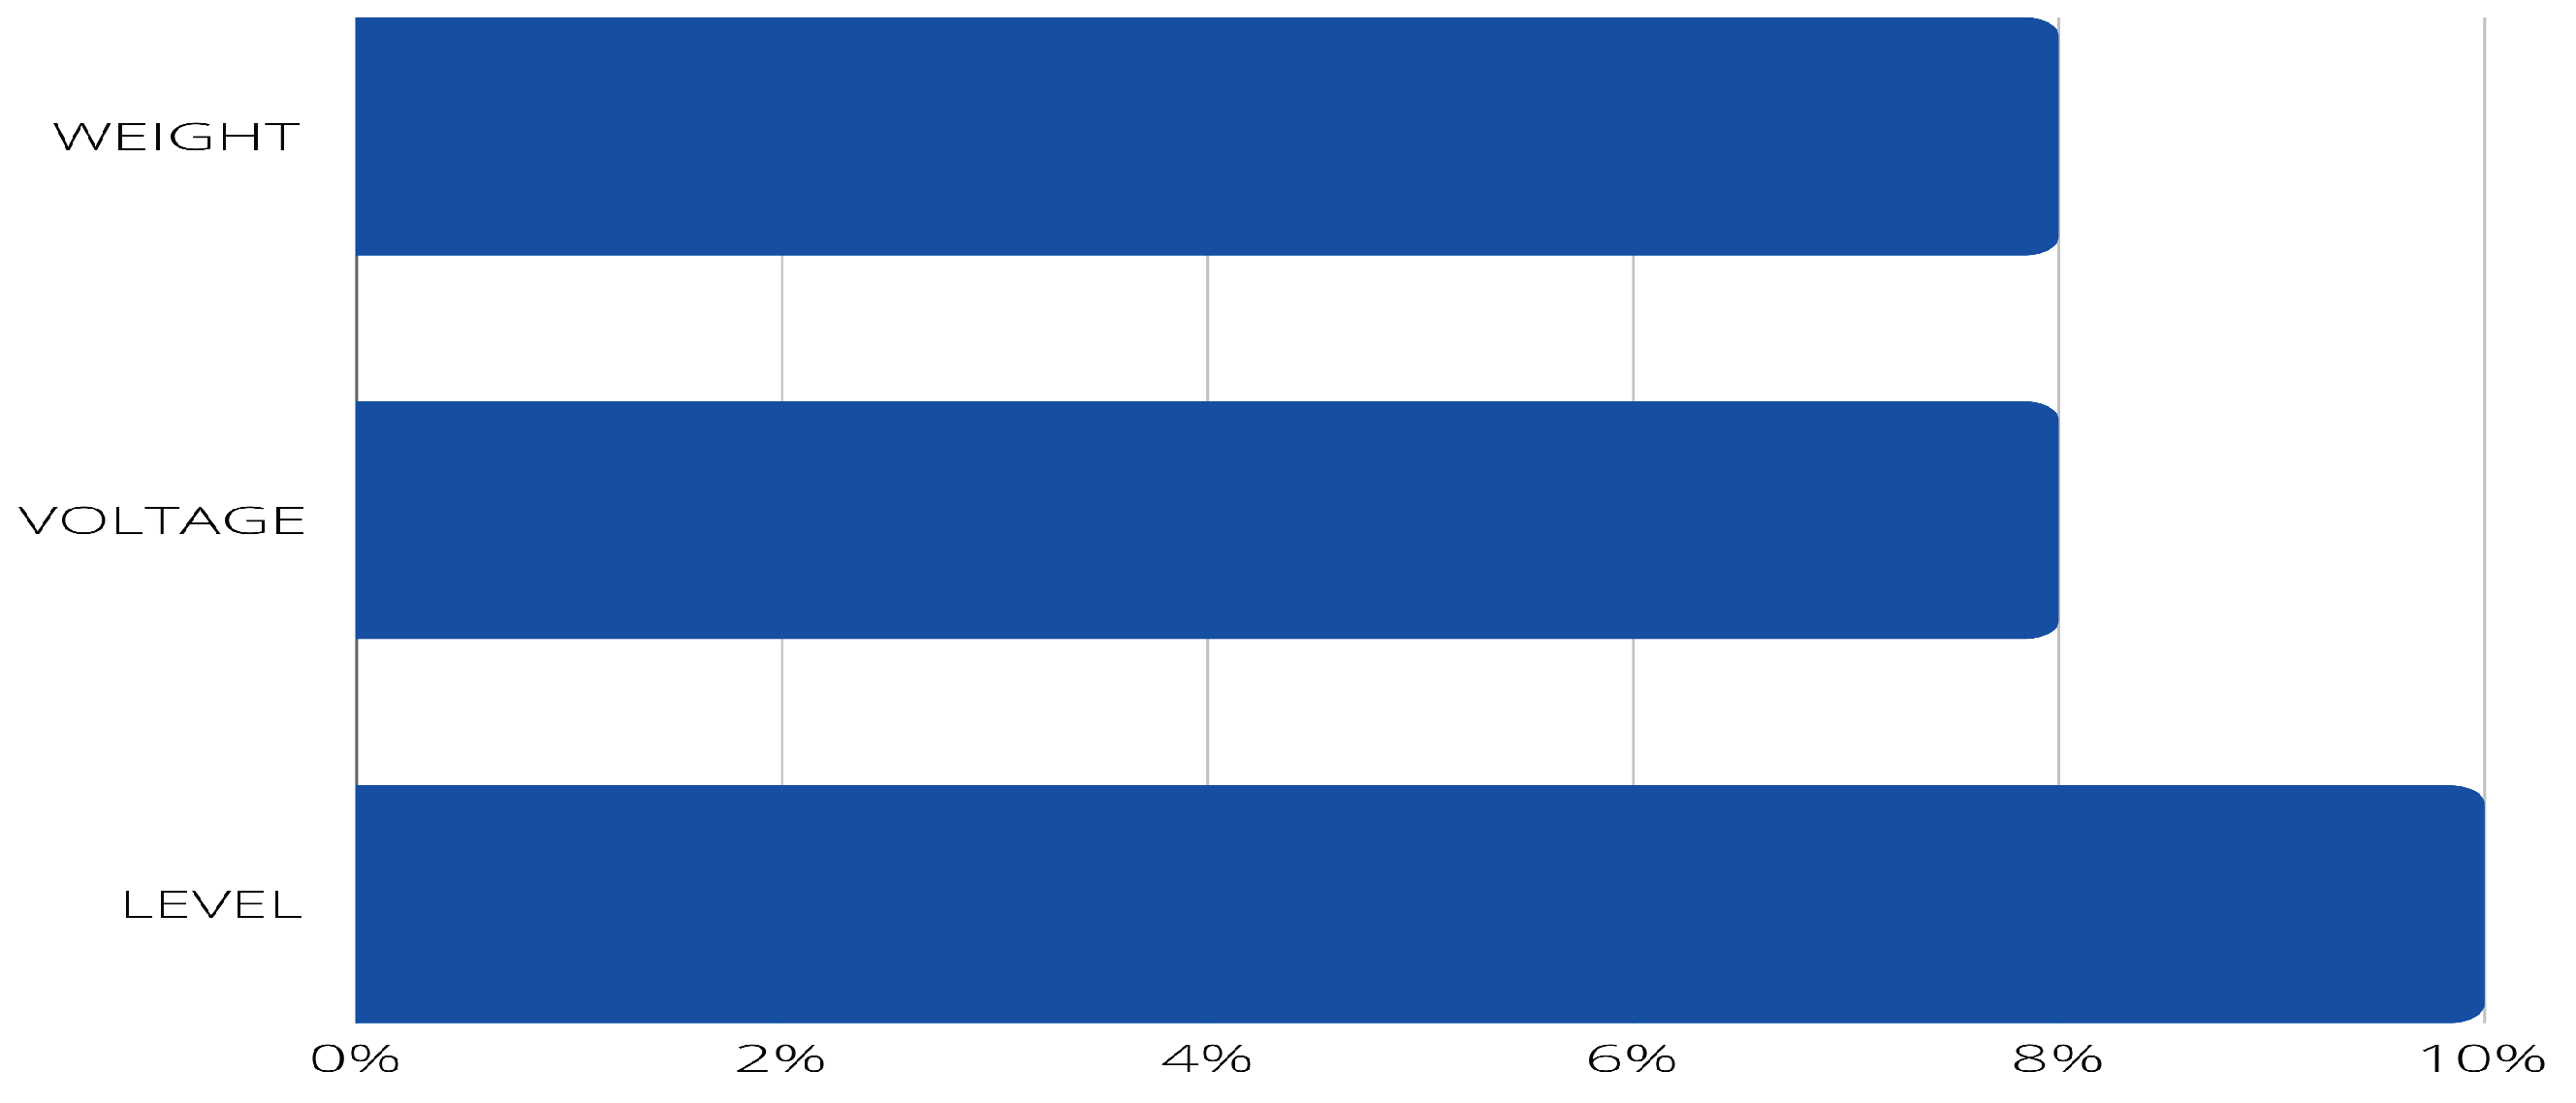
- PI5: What is monitored (e.g., gas leakage, transport, pipelines)?
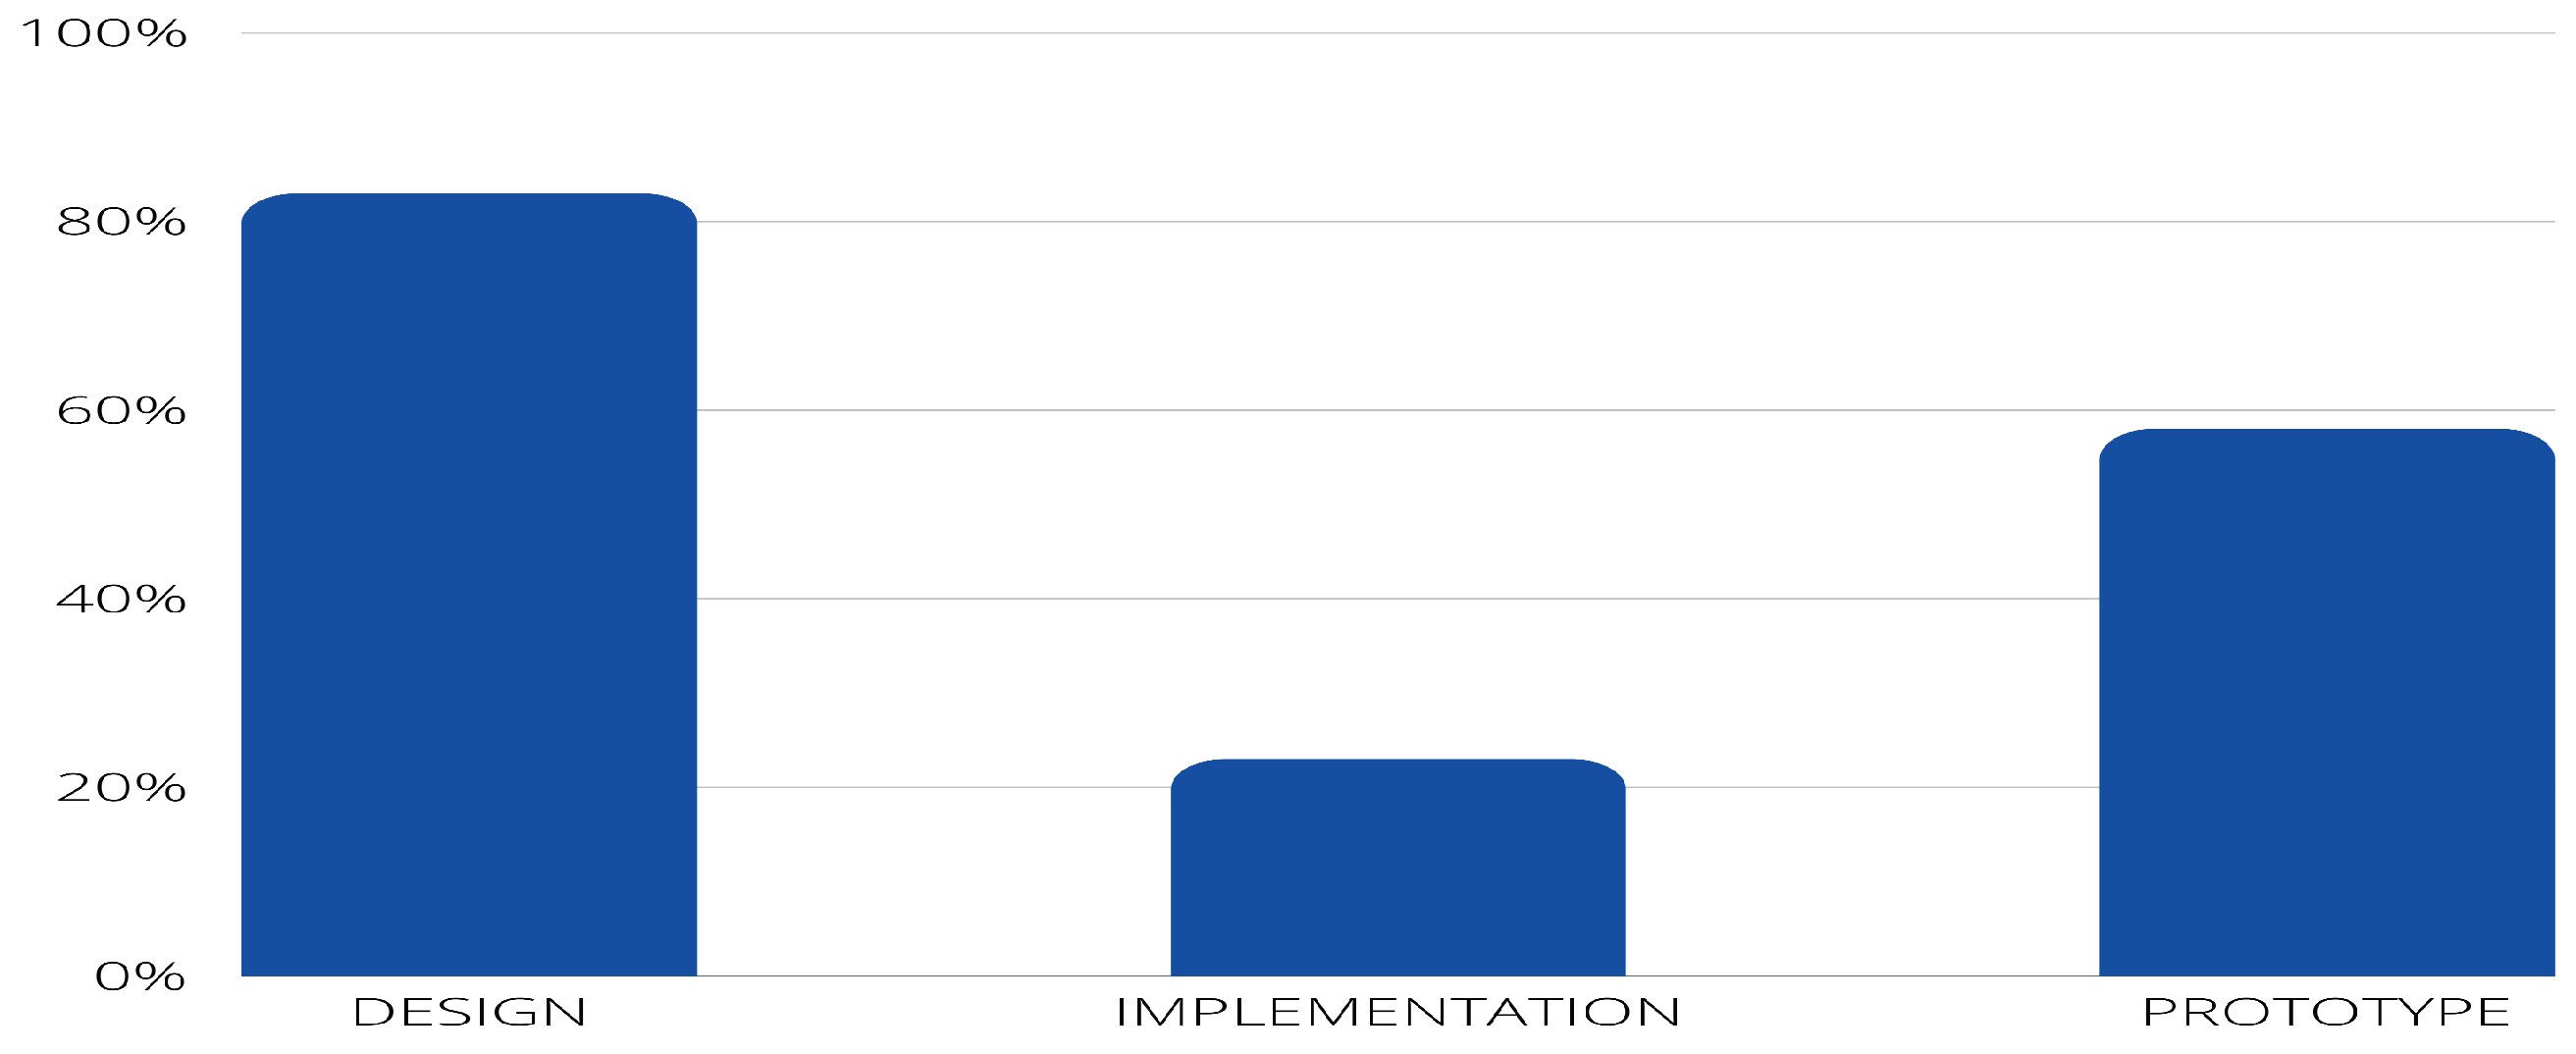
- PI6: What is the result of the research (e.g., design, implementation)?
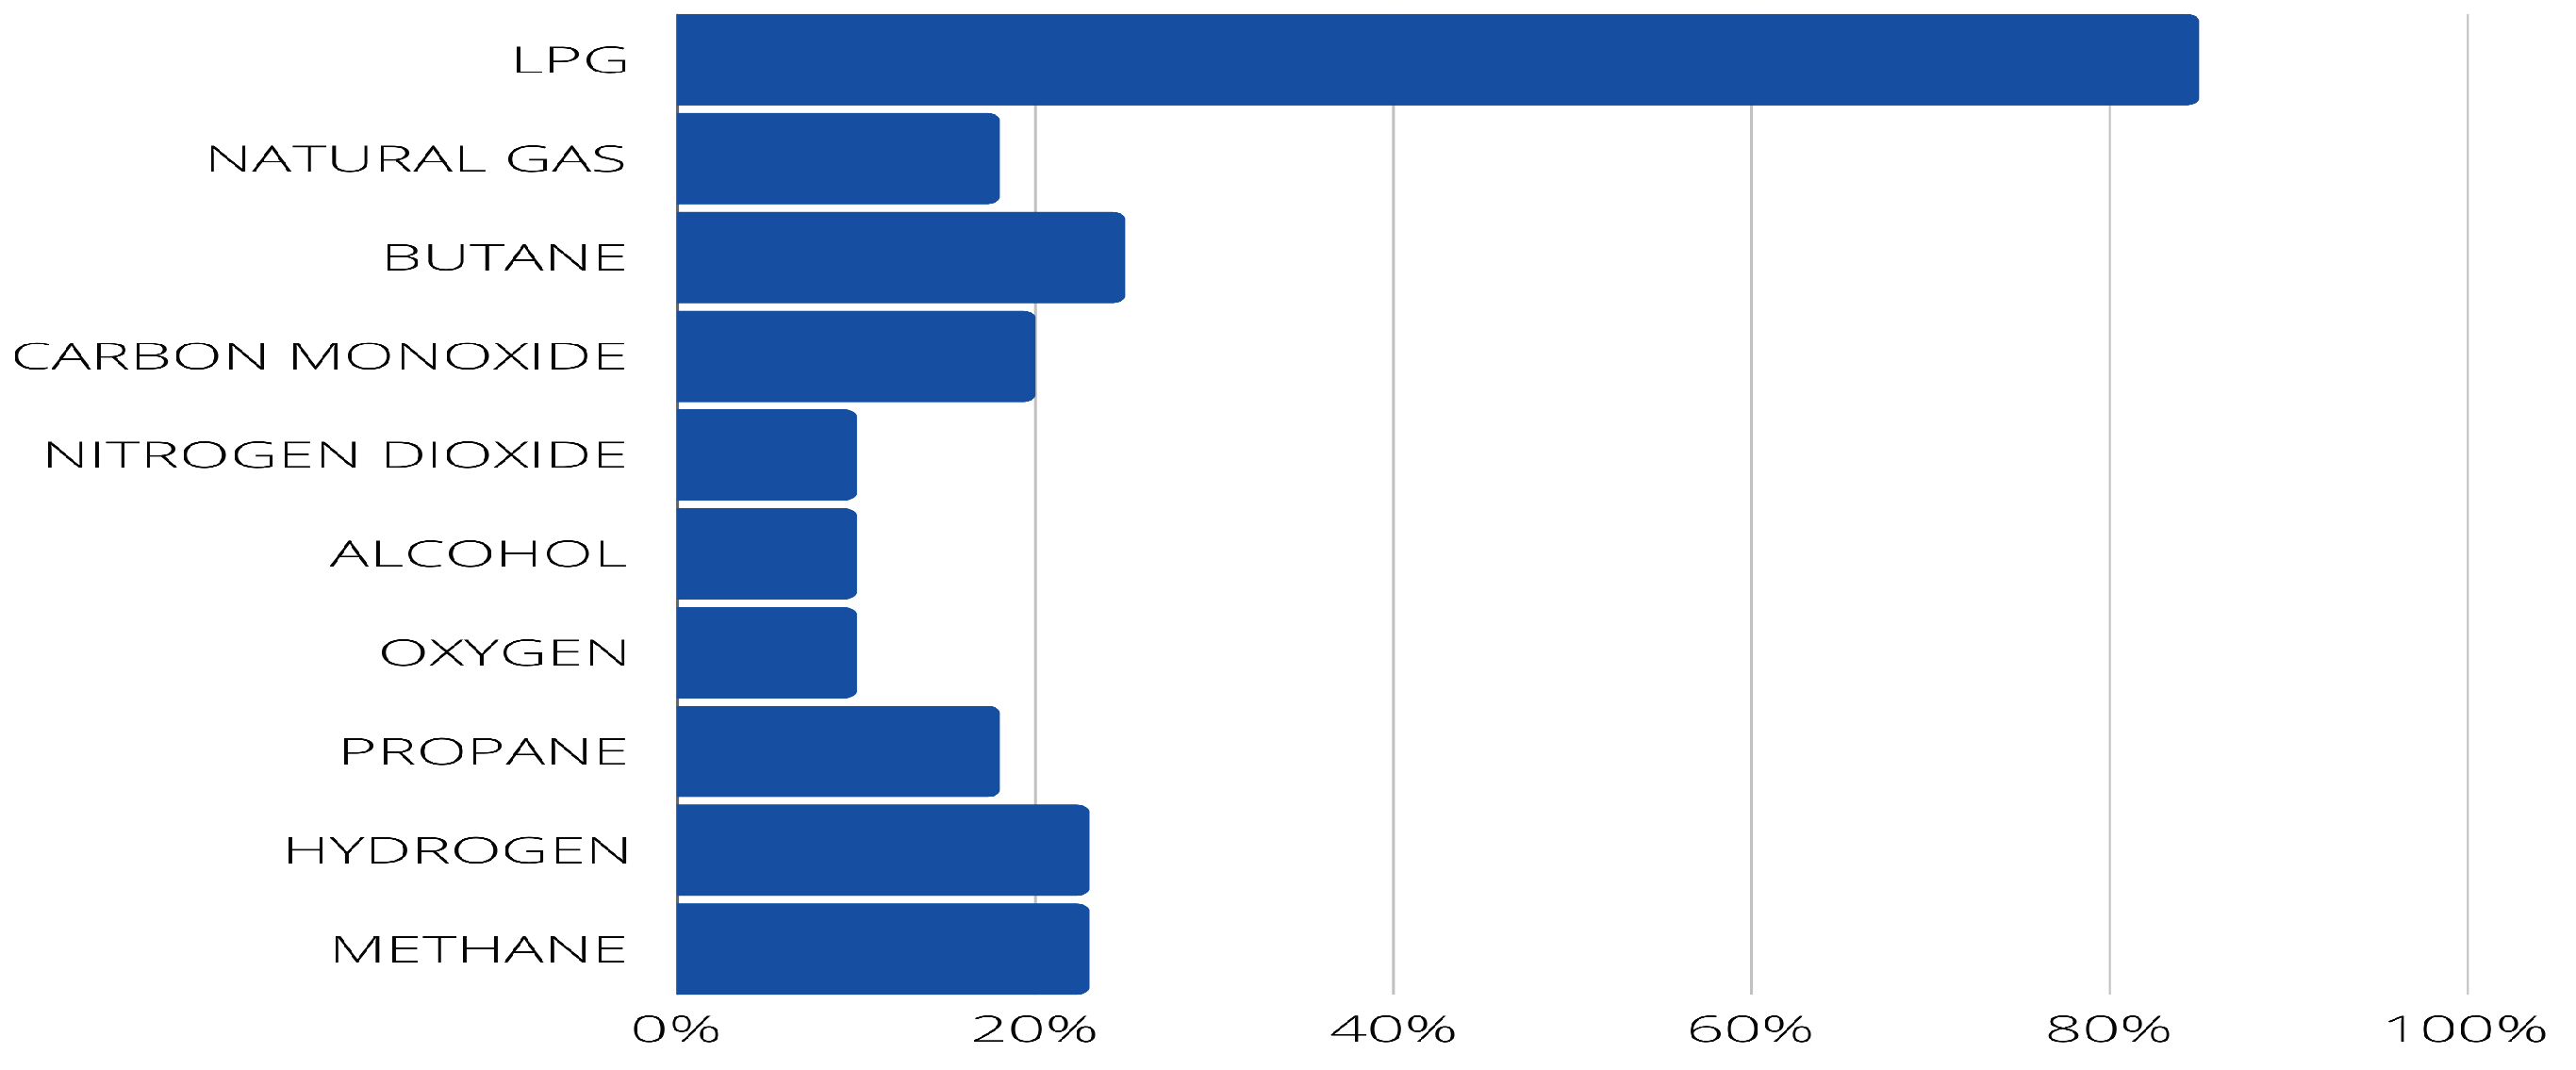
- PI7: What gases are monitored (e.g., LPG, natural gas, butane, carbon monoxide, nitrogen dioxide, sulfur dioxide)?
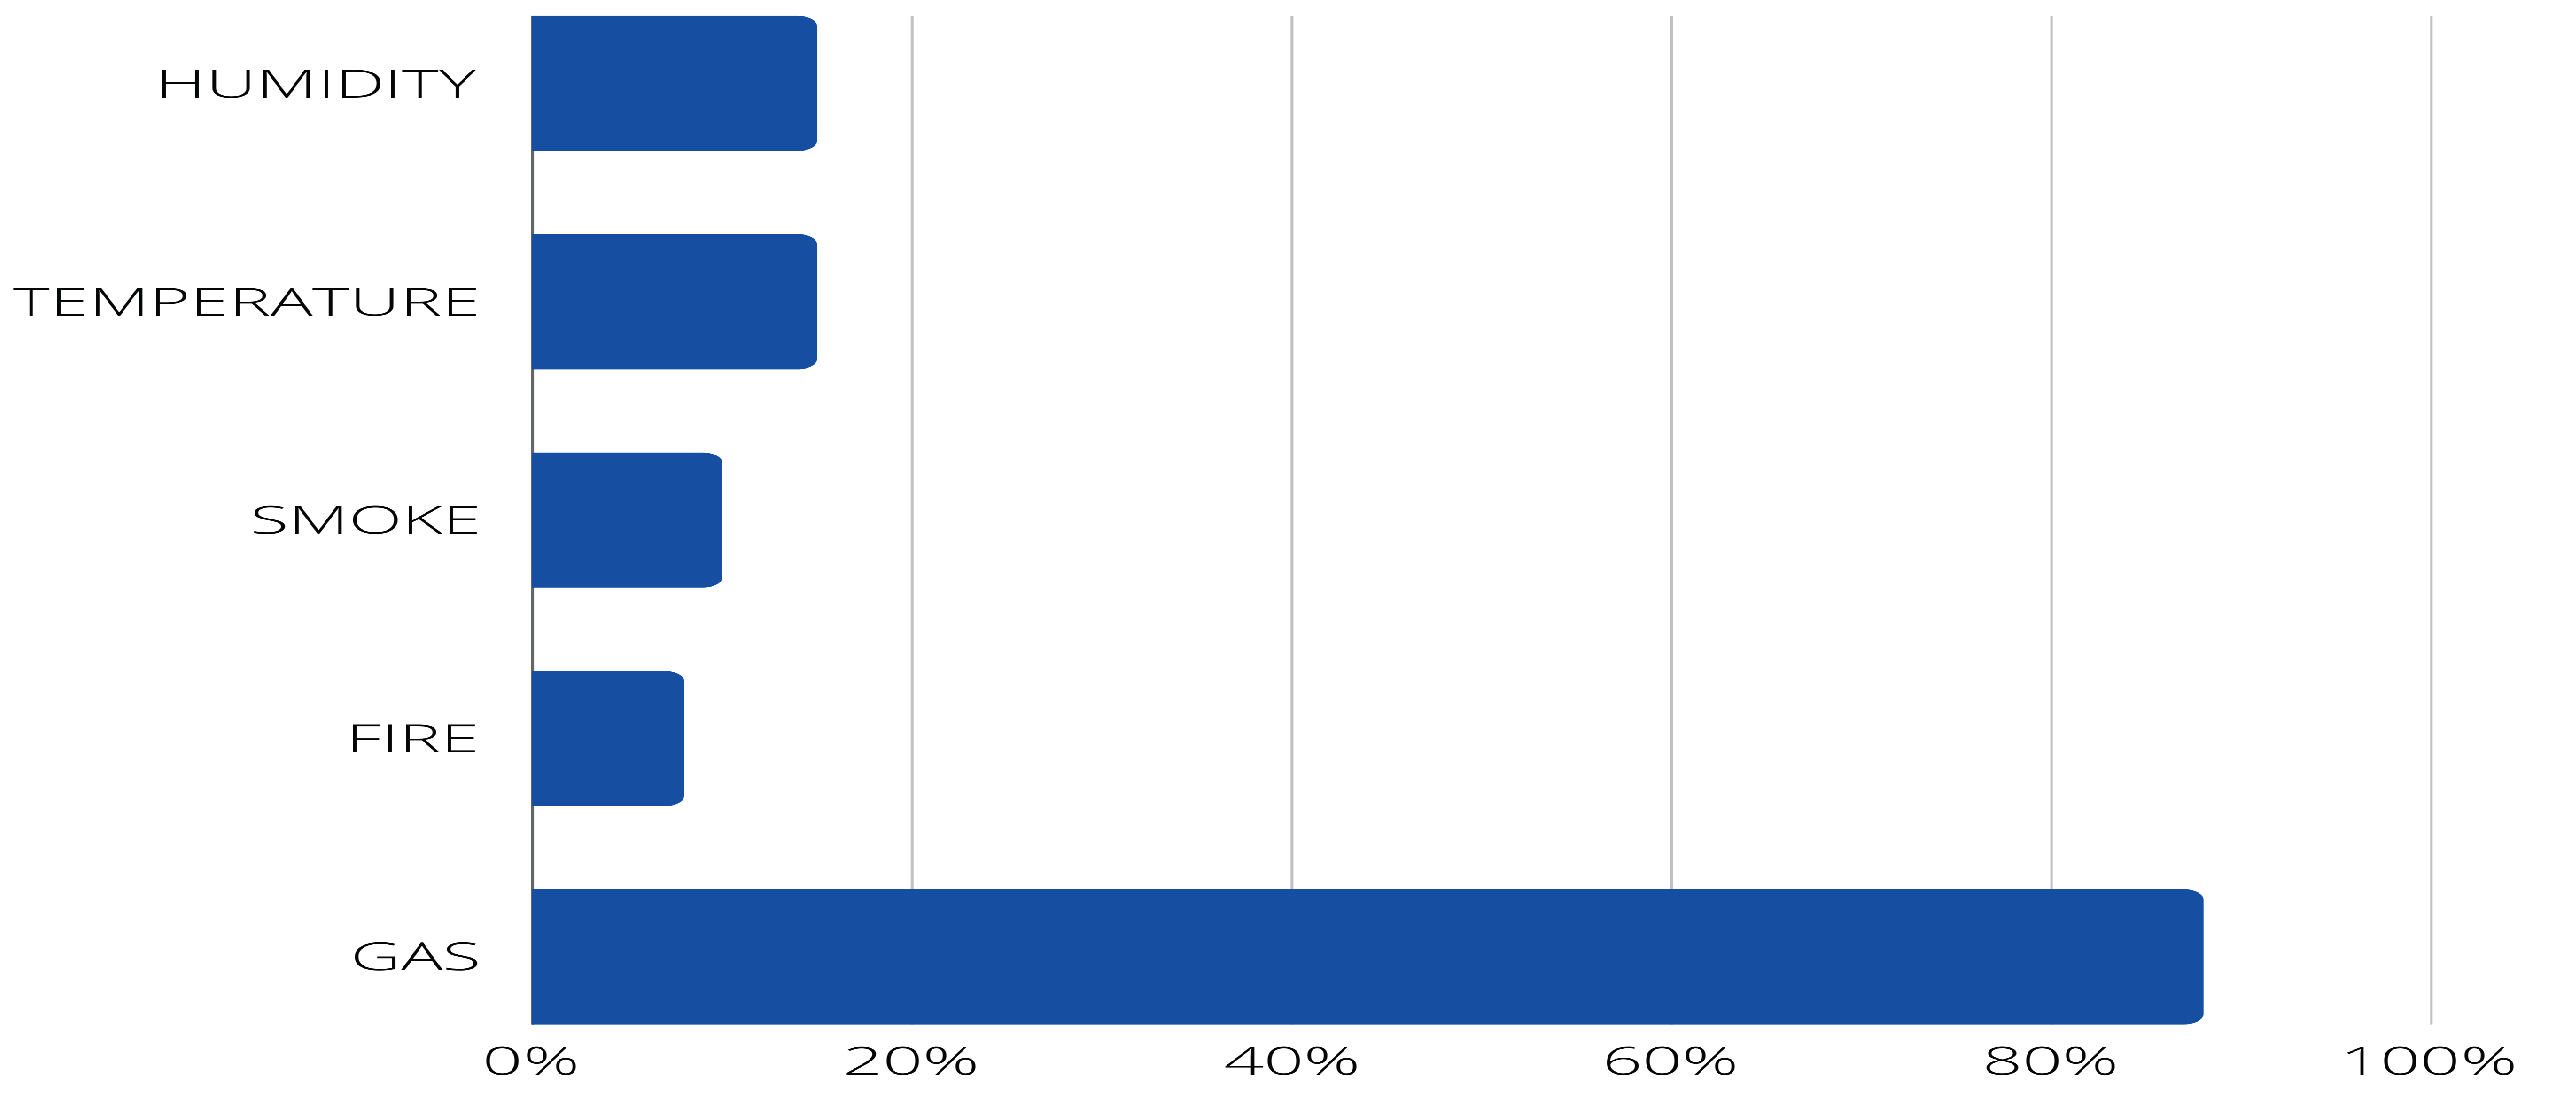
- PI8: What data are detected (e.g., humidity, temperature, heat indicator)?
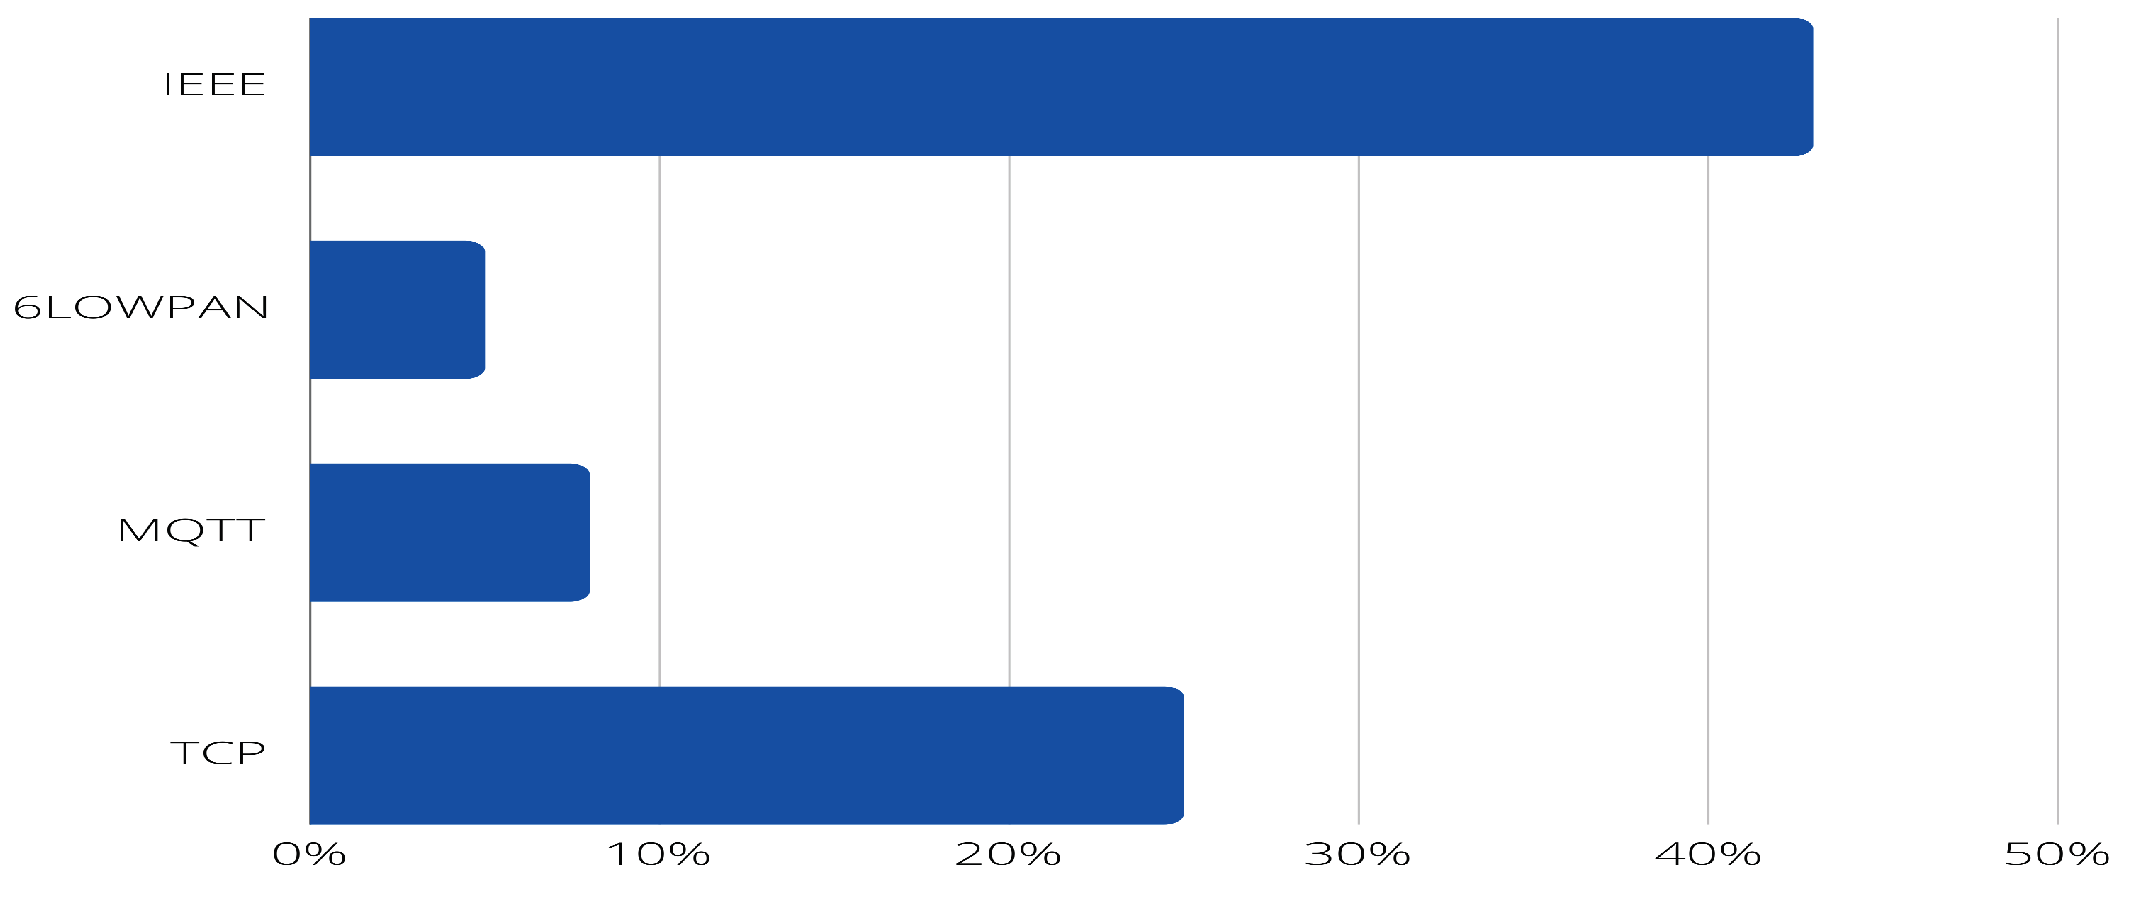
- PI9: What protocols are used (e.g. IEEE, 6LoWPAN, MQTT)?
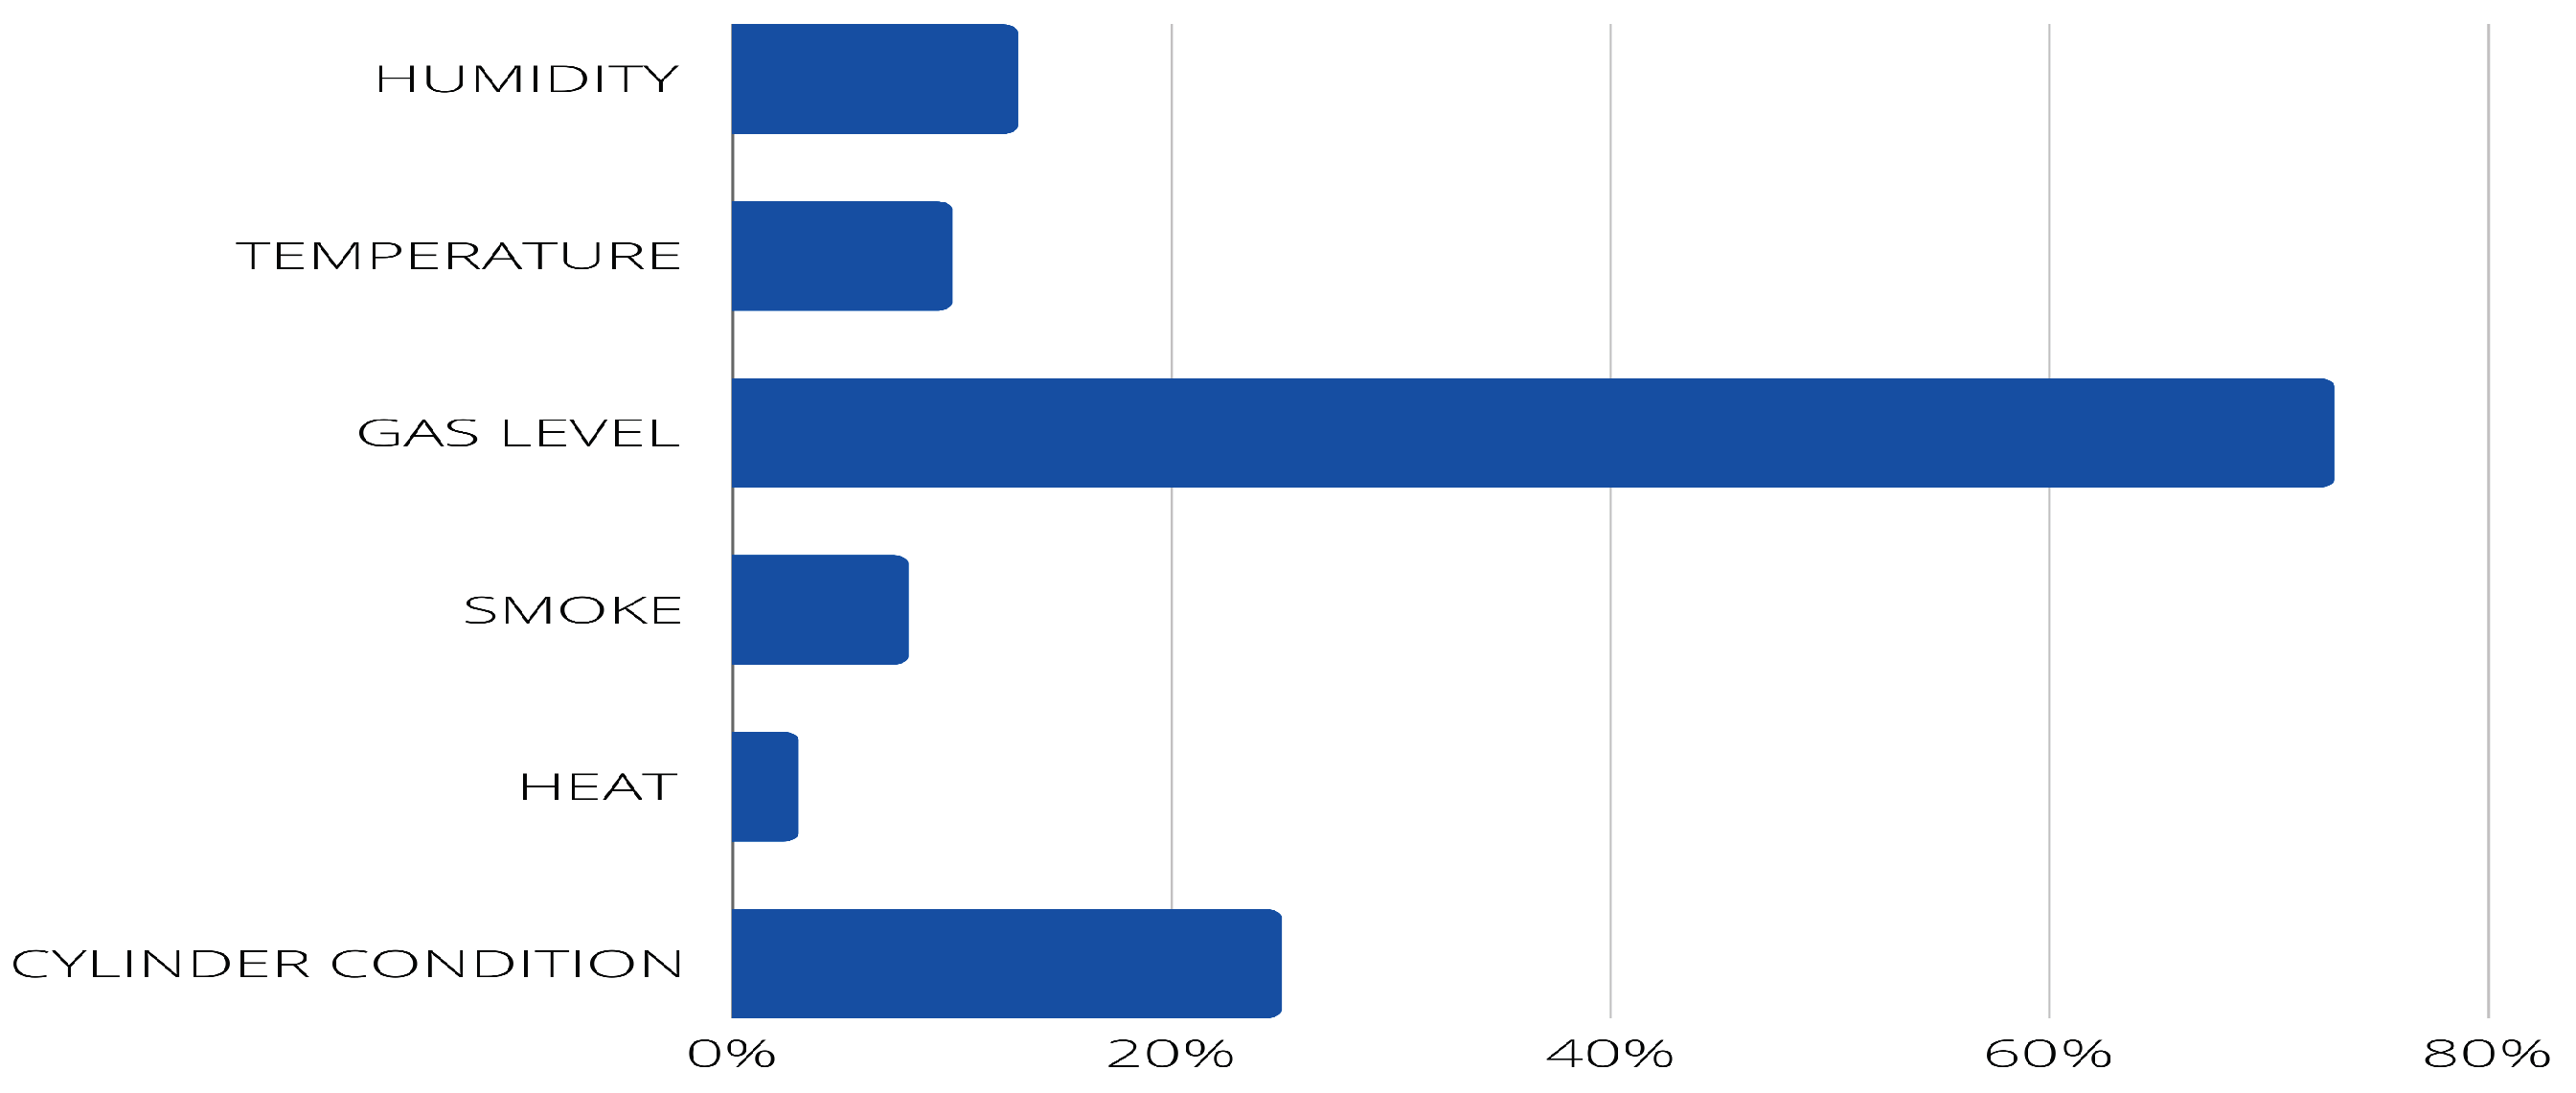
- PI10: What indicators are displayed (e.g., humidity, temperature, gas level)?
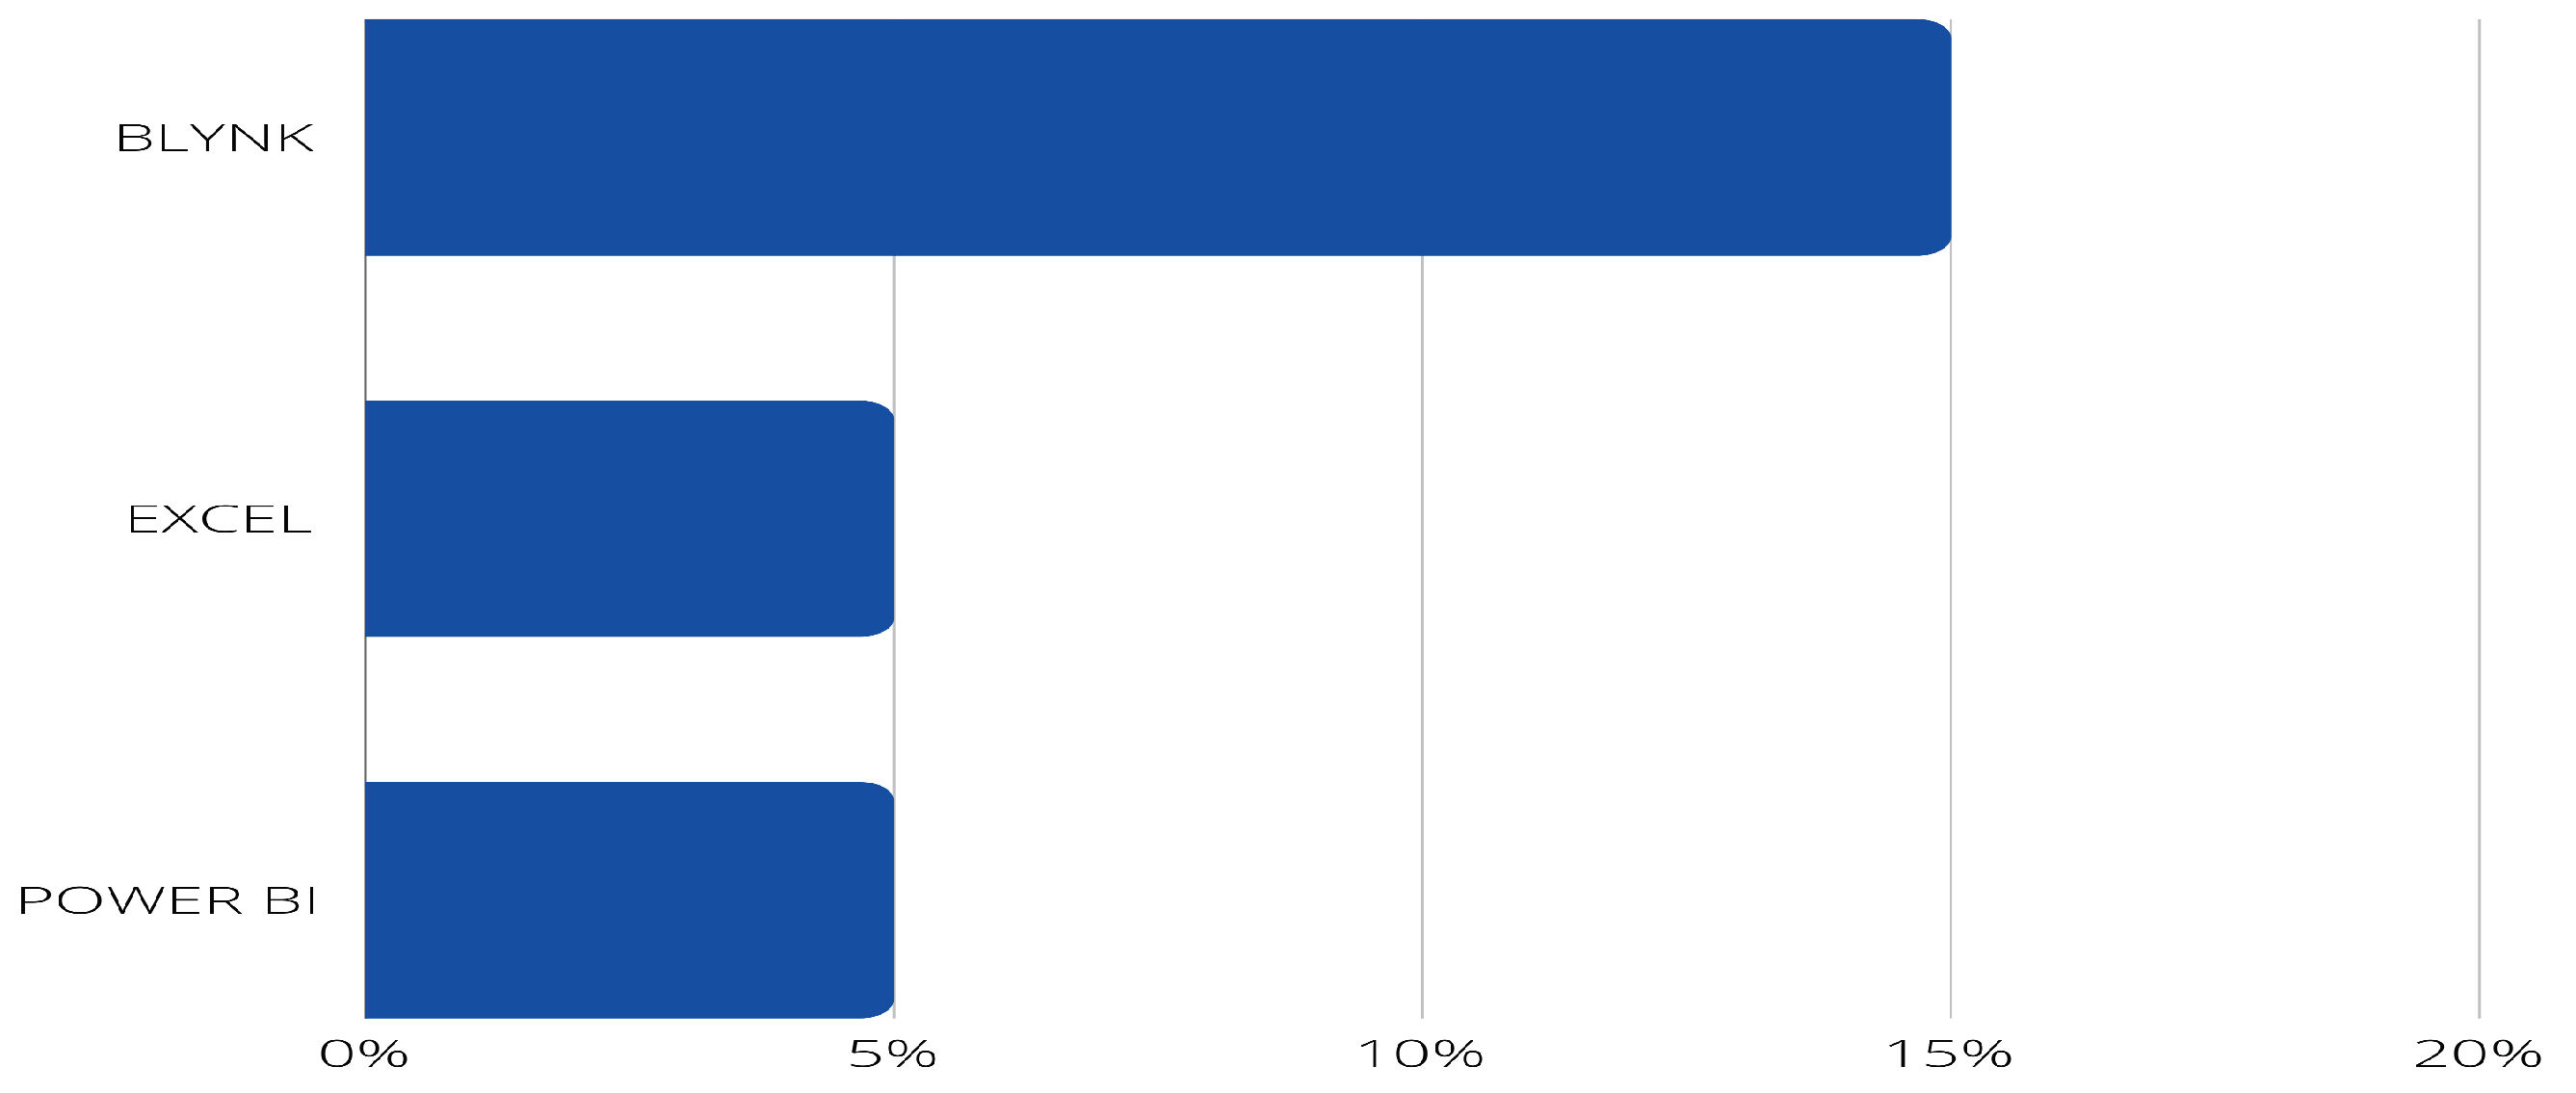
- PI11: What software tools are used in Business Intelligence?
- PI12: What general data do the data warehouses have?
- Data collection and synthesis: Data covering the identified articles are extracted, the research questions are answered, and data analysis is performed in quantitative form and described for explanation. The study uses a quantitative approach.
4. Results
4.1. Analysis of scientific articles using a systematic review of the literature.
4.2. Answer to the research questions.
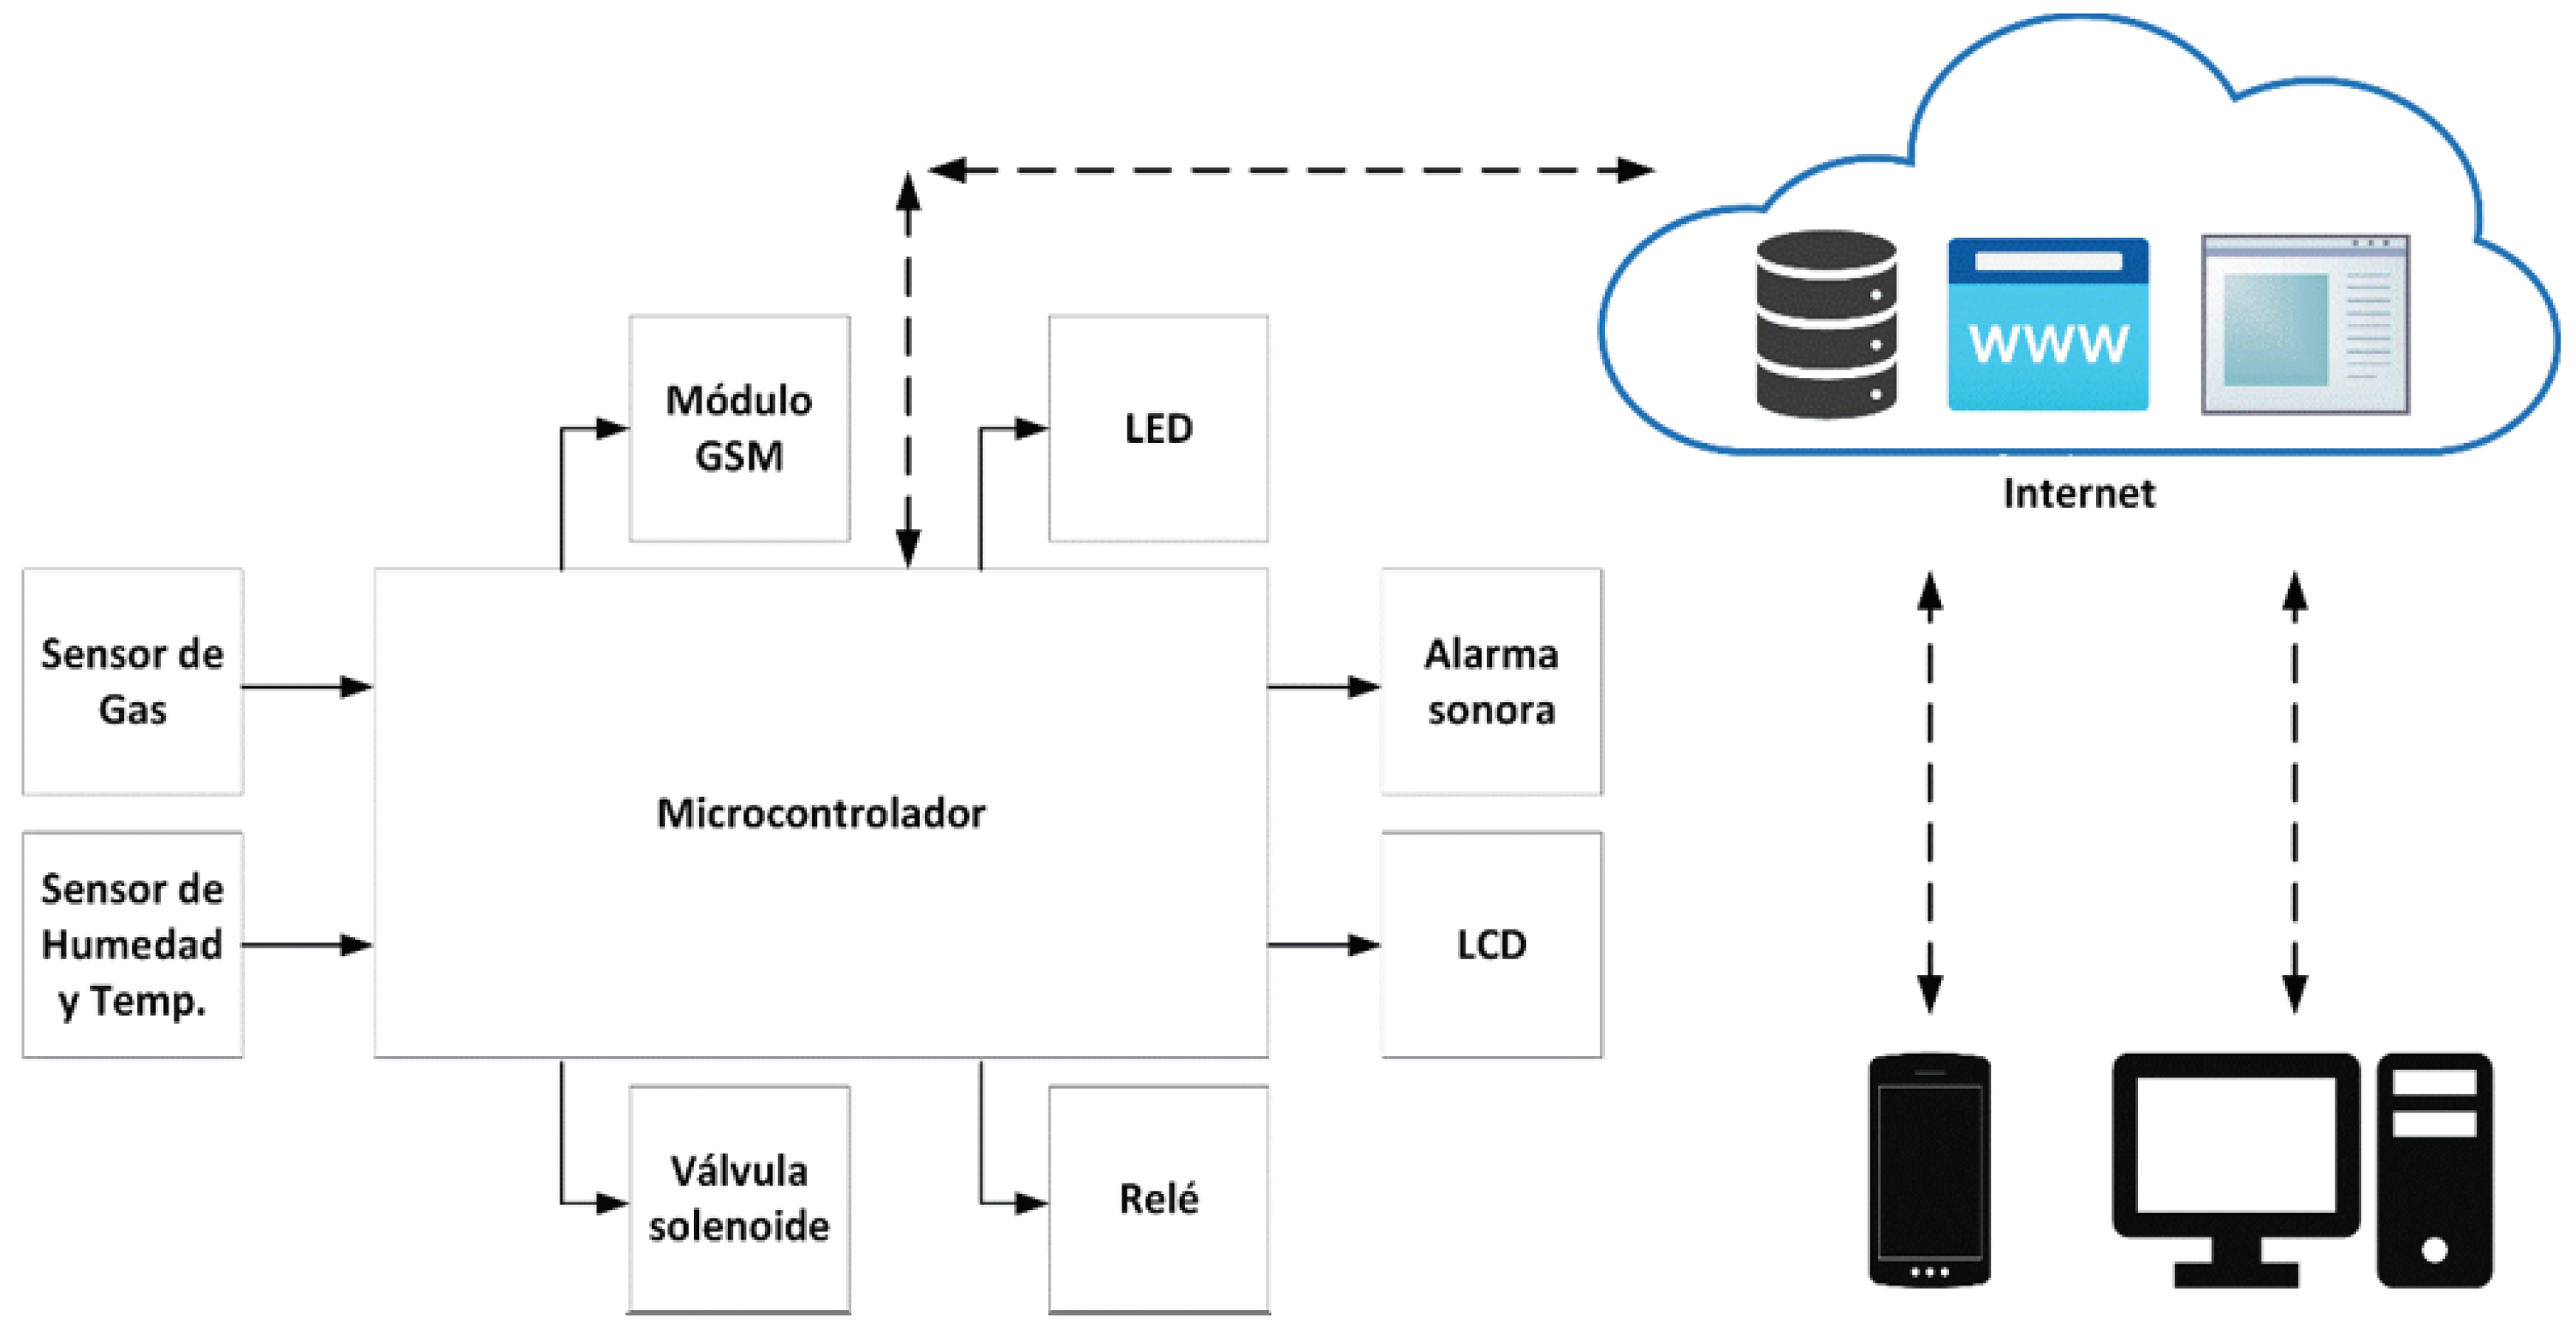
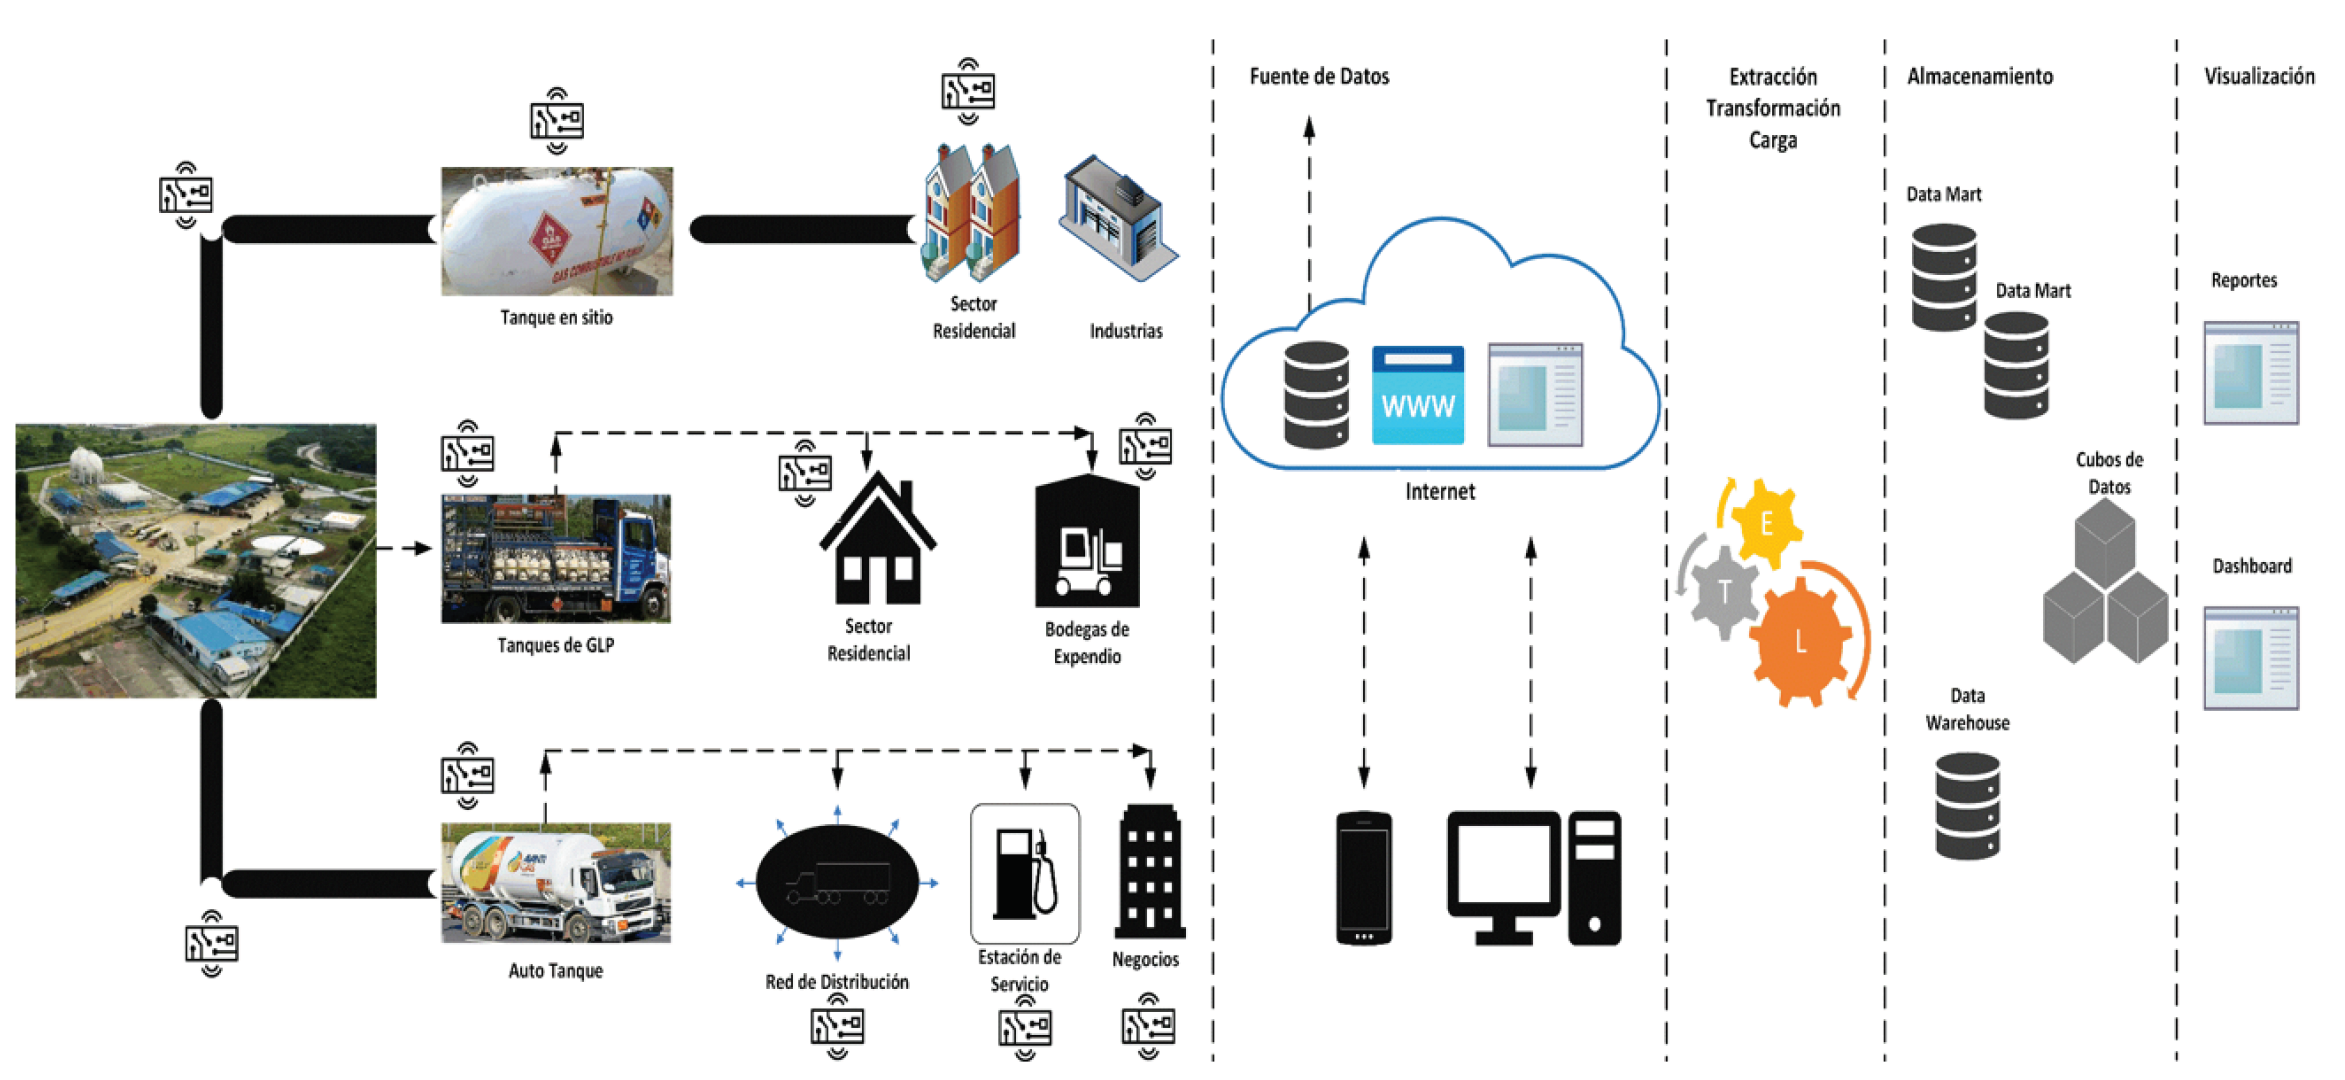
4.3. Design of a general architecture for LPG management based on IoT and BI.
- MQ-5 gas sensor. Detects LPG and natural gas with excellent accuracy. Obtains the presence of gas with a concentration from 2000 PPM (Parts Per Million) up to 10000 PPM and operates with 5 volts of power.
- MQ-6 gas sensor. It detects the presence of LPG. It is an analog sensor based on resistance. It obtains the presence of gas with a concentration from 200 PPM to 10000 PPM.
- Temperature and humidity sensor. The DHT11 digital sensor is a low-cost sensor that measures air temperature and humidity. It can measure temperature from 0 to 500 °C with an accuracy of ±2 °C and humidity from 20 to 80% with an accuracy of 5%. It consumes power from 3 to 5 volts and draws a current of up to 2.5 milliamps while reading data.
- LCD. The 16cm x 2cm liquid crystal display is connected to the NodeMCU via I2C communication protocol. The LCDs the data obtained by the sensors, such as humidity, temperature, and gas status, in real-time on-site.
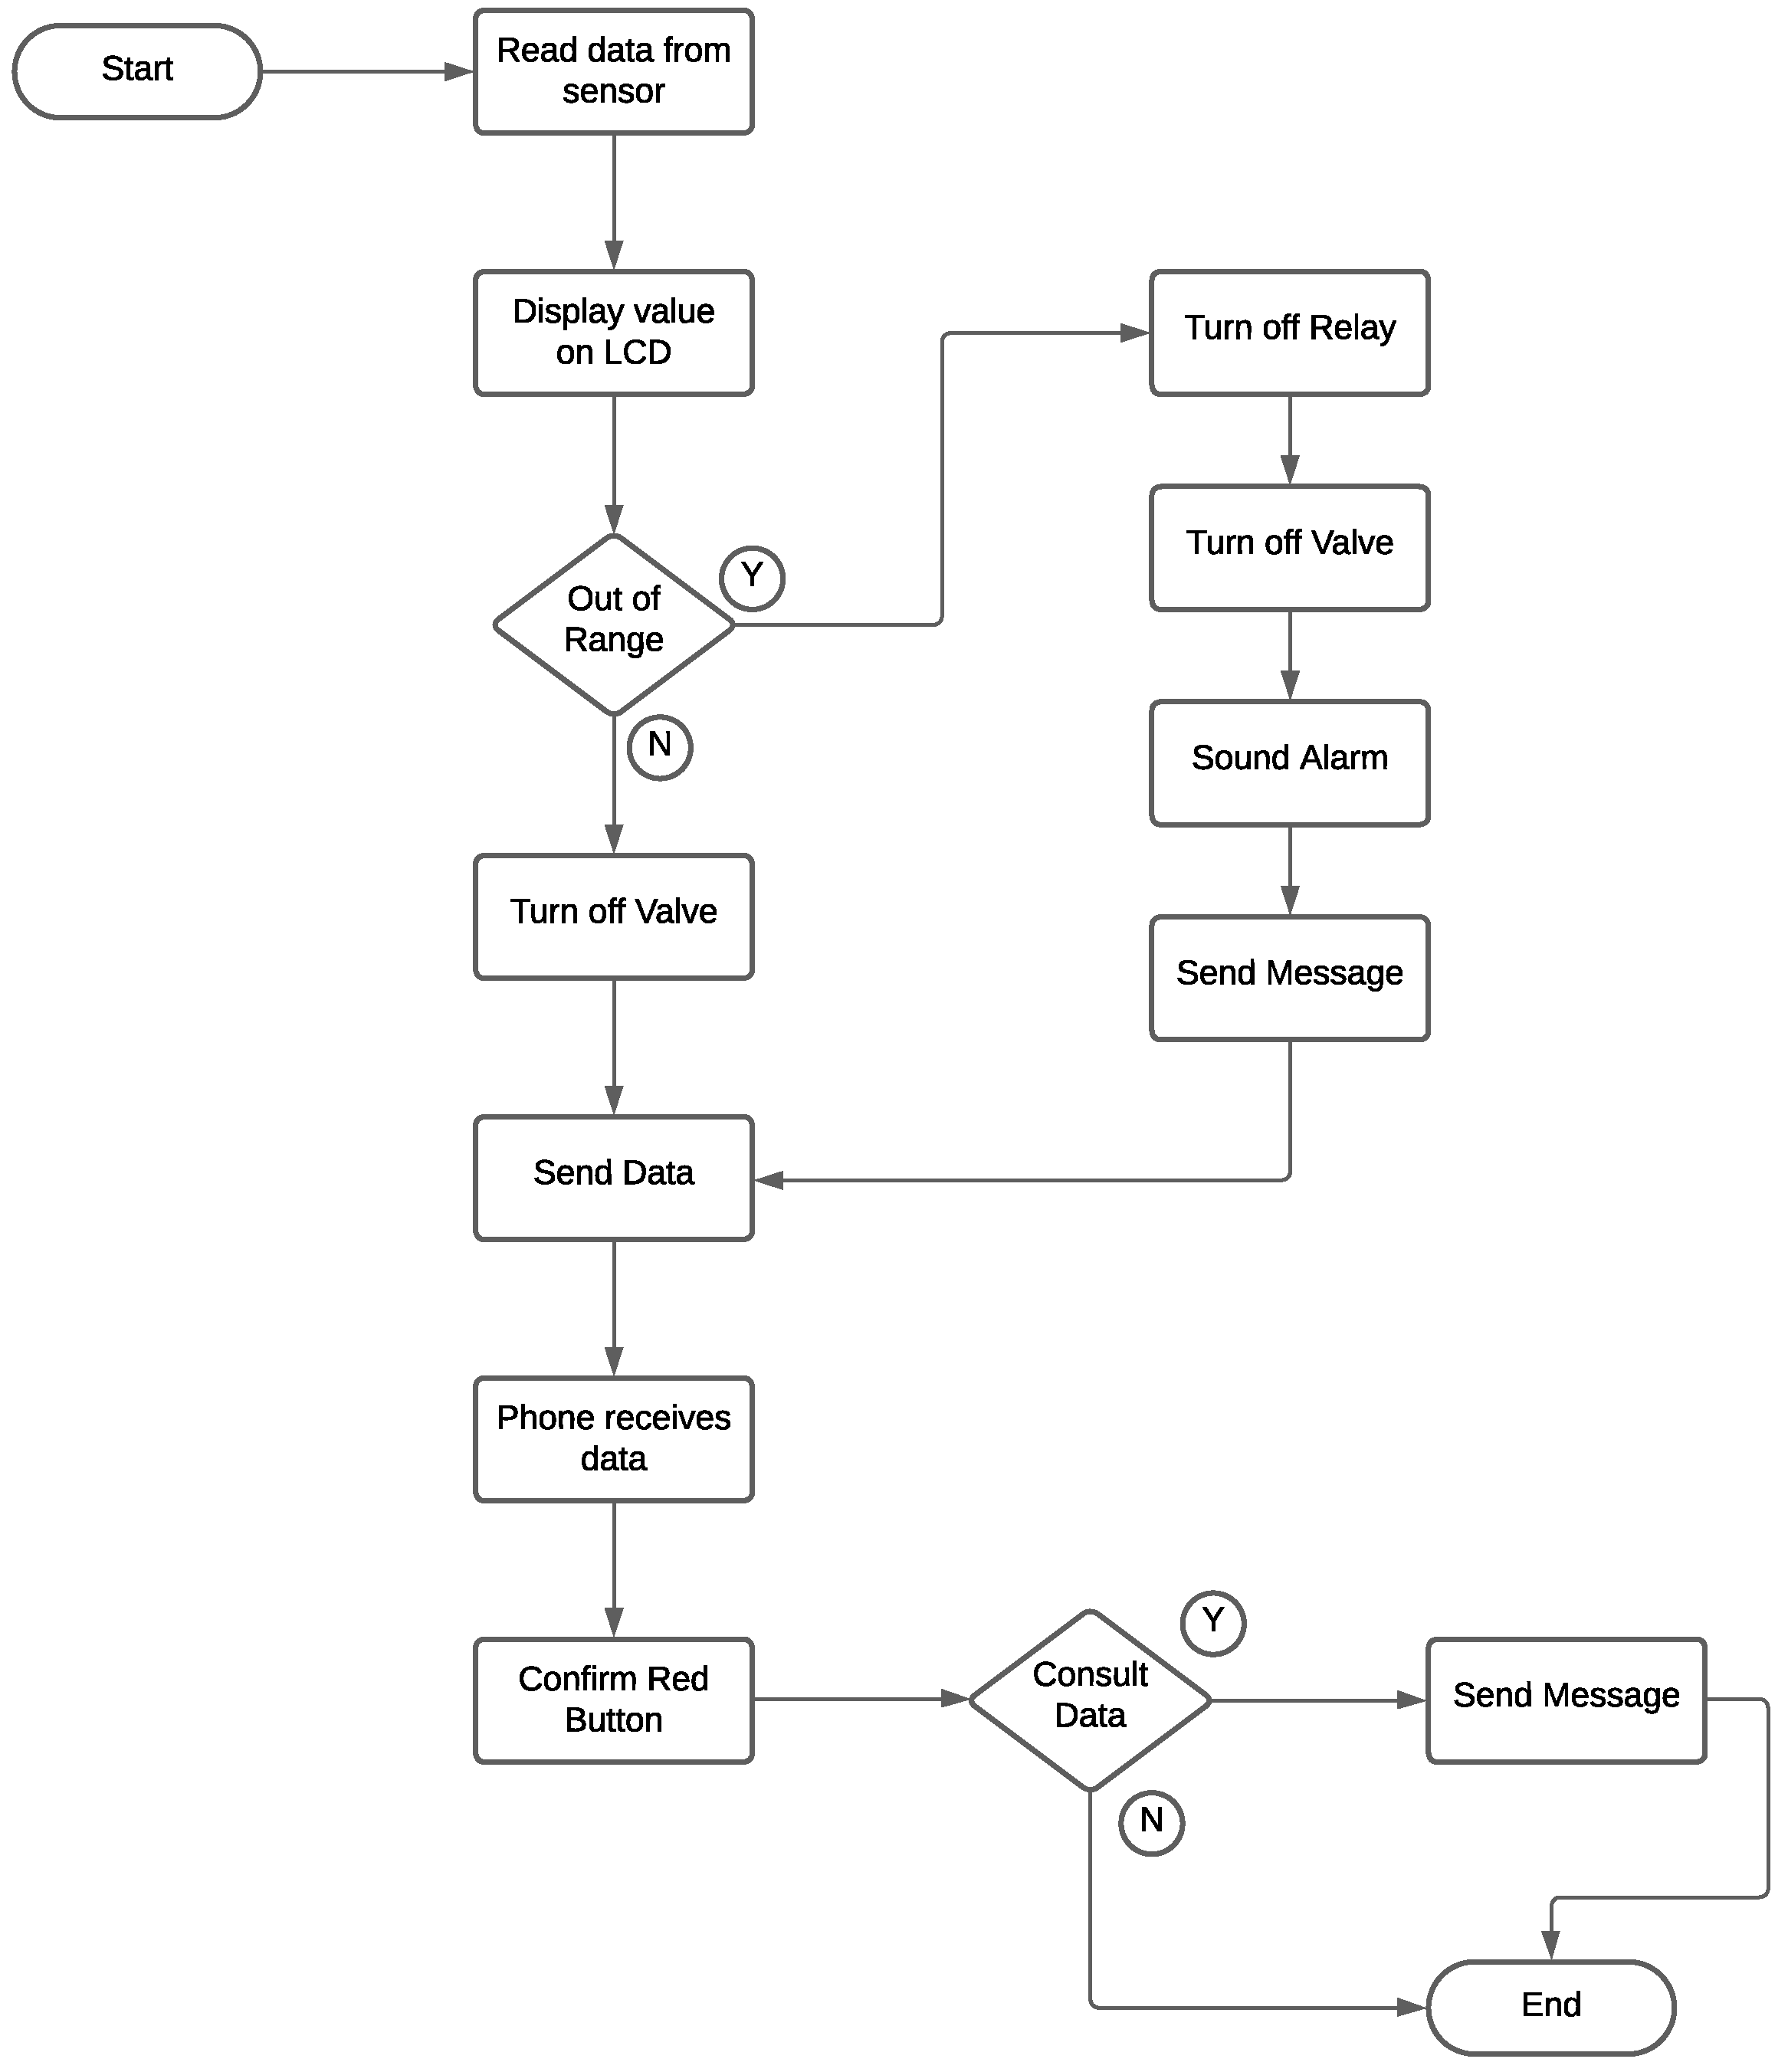
- NodeMCU DEVKIT 1.0. NodeMCU is open-source firmware for the IoT platform. This hardware is a microcontroller unit with a wifi chip. It is an excellent low-cost option for sending data to a web server, LCD, GSM, and relay. This control unit takes the data obtained by the sensors. After analyzing the sensor data, this microcontroller executes the appropriate actions.
- Audible alarm. The buzzer is added to notice nearby people. If the sensor detects the presence of gas in the air, then the NodeMCU activates the audible alarm.
- GSM modem (SIM800L). This hardware connects to the NodeMCU to send and receive text messages (SMS). The modem has a SIM card and must be with a subscription to a mobile operator. If the sensor detects the presence of gas or out-of-range value, then the microcontroller sends an automatic notification to a cell phone number about the gas leak. In addition, it is possible to query the status of the gas leak by SMS remotely.
- Relay. It is a device that operates the solenoid valve.
- Solenoid valve: This device controls gas leakage; it turns on or off through the relay module according to the signal from the microcontroller.
- Wifi router. It is a wifi router device for Internet connection.
- Smartphone: This is a control unit. It can access mobile applications on the solenoid valve and remotely turn it on or off.
- Google Firebase is a platform for storing and processing leakage data. This database sends the data from the microcontroller to the mobile applications in real time.
- Arduino IDE and C++ programming. The microcontrollers are programmed in Arduino IDE and C++ programming language.
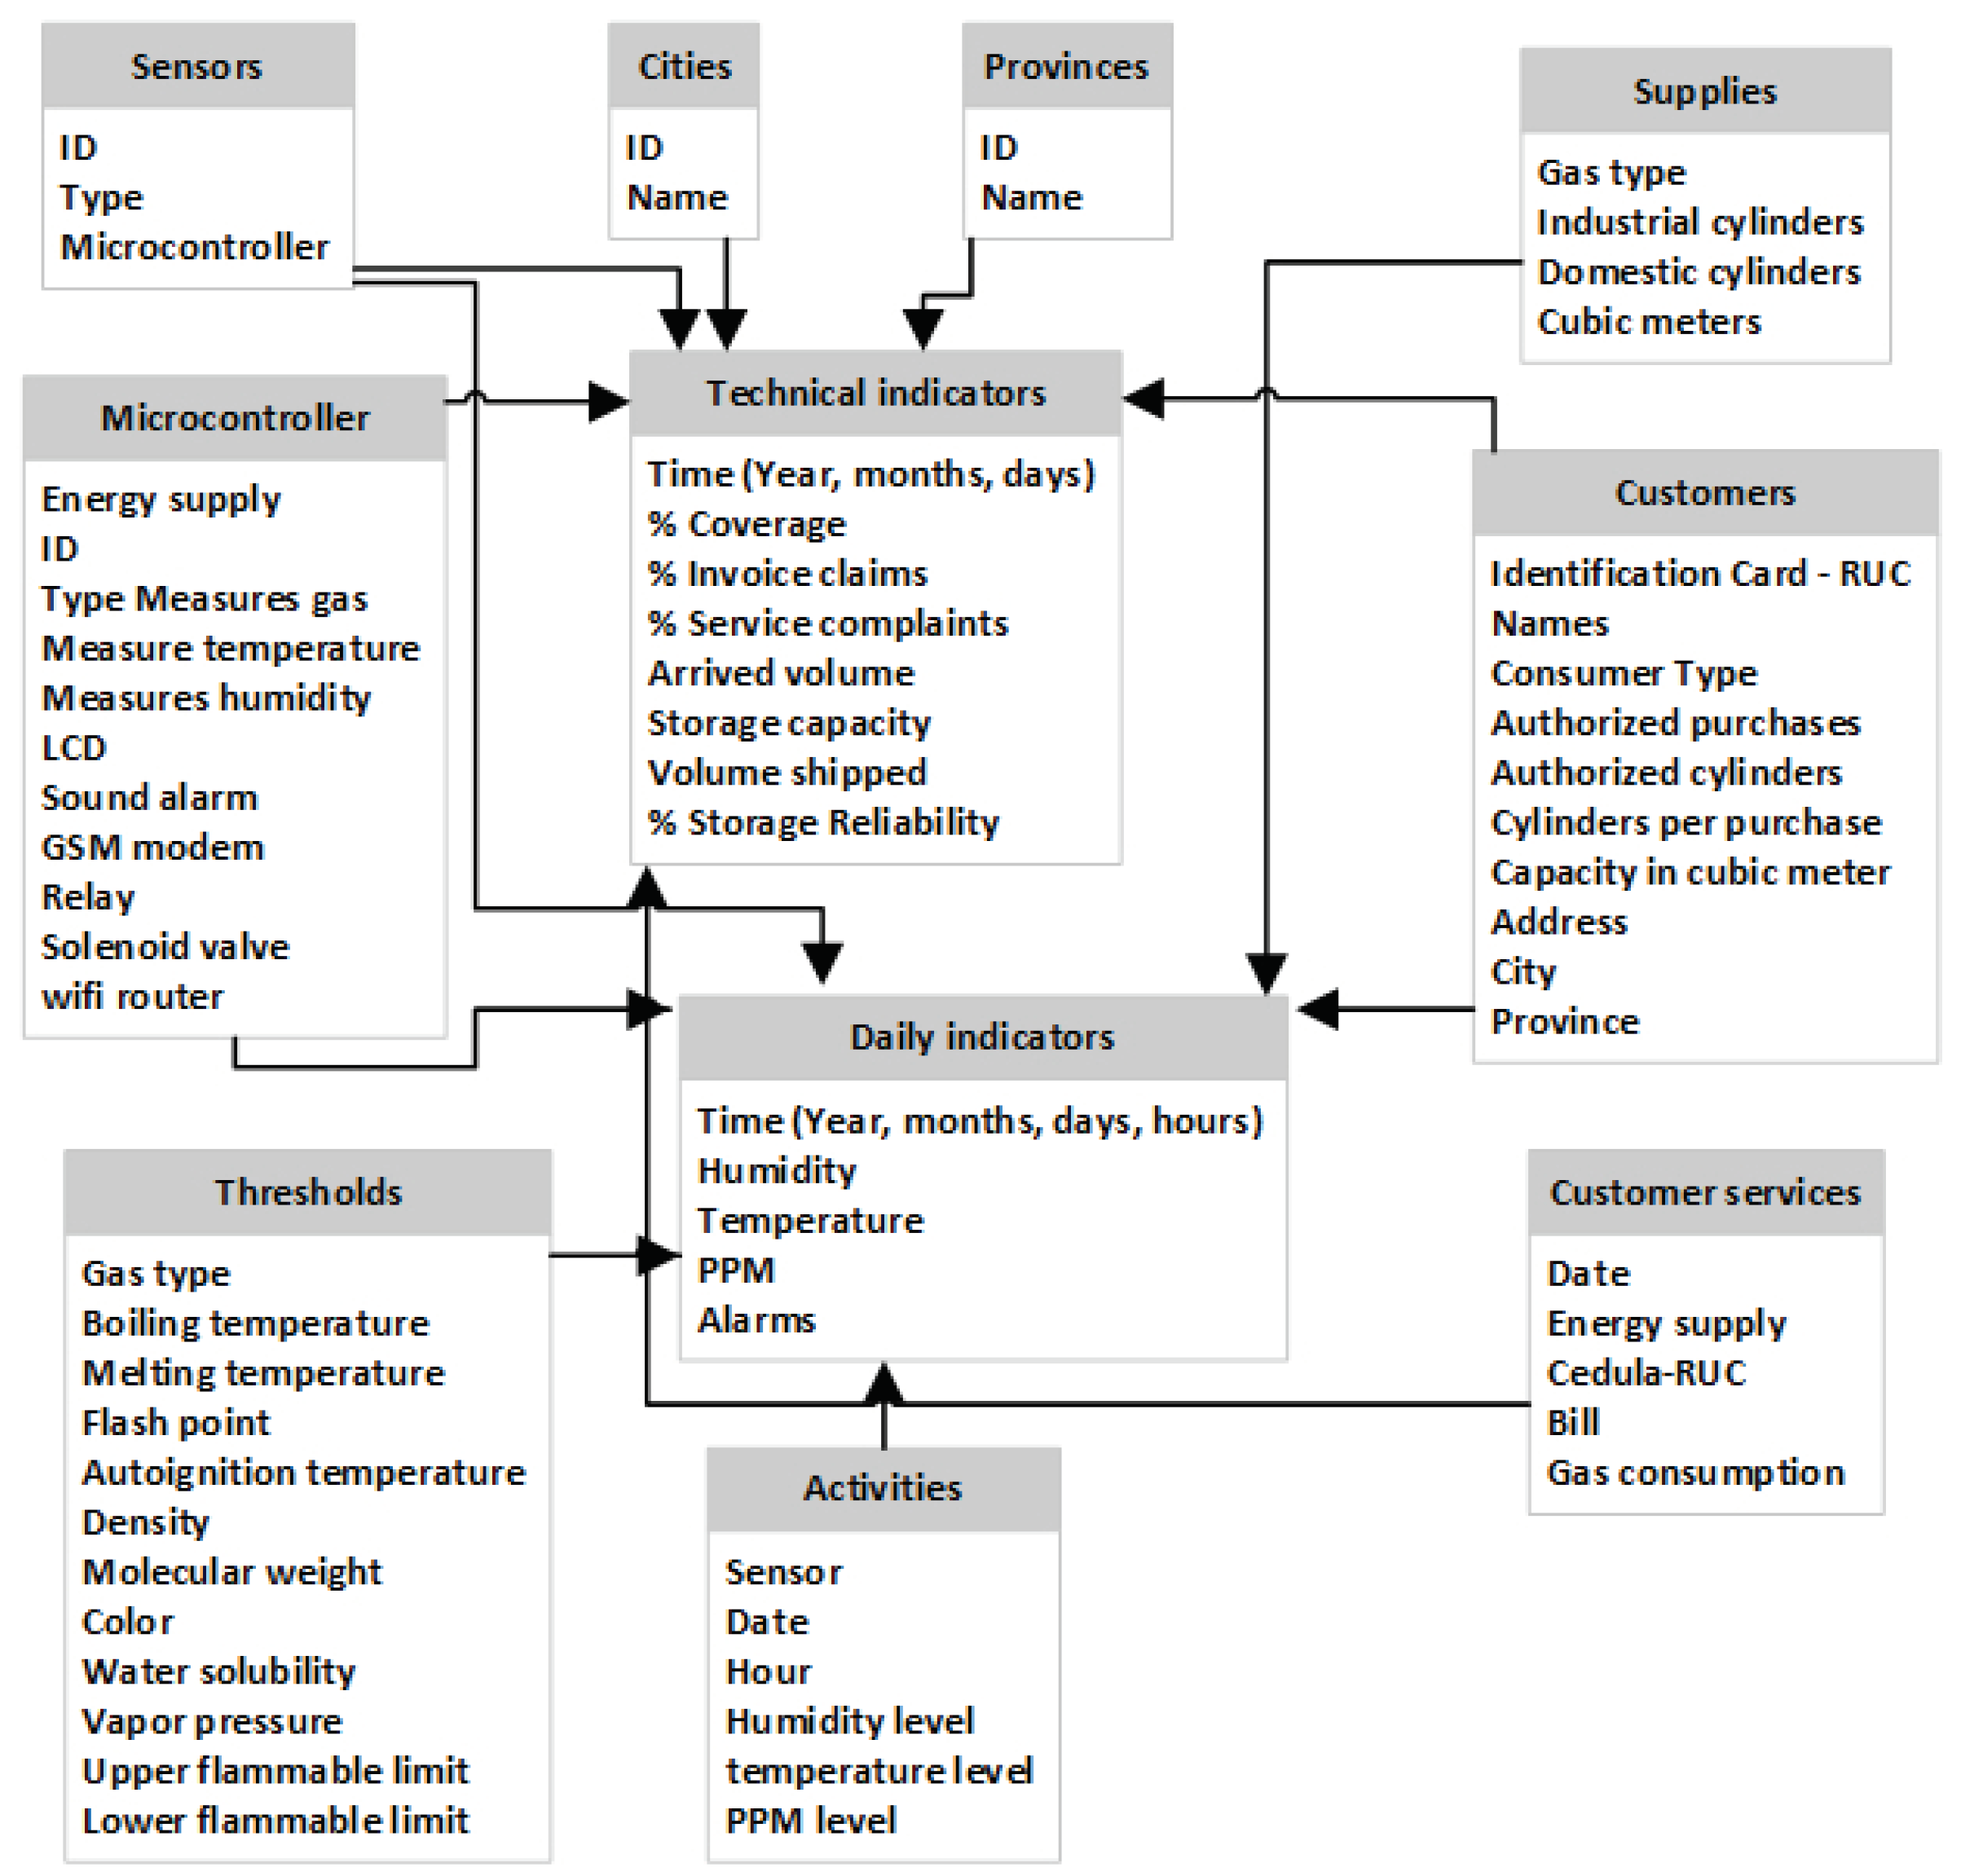
- Data Source: This is the Firebase in the cloud. The database contains the Sensors table with column identification, series, sensor name, location, start date, and status. The Measurements table has columns such as sensor, humidity level, temperature level, PPM level, date, and time.
- ETL: There is the ETL process (Extraction-Transformation-Load); here, the Power BI tool performs the validation, cleaning, transformation, and aggregation of the data and then performs the load to the Data Mart. In this case, the source data belongs to a single database; the data is homogeneous in the extraction; the extraction is performed every hour or according to the Power BI configuration; in the data cleansing, unnecessary data is discarded. Data is considered valid because it is in a database; data such as sensor series and start date are discarded in data cleaning. The cleaned data is loaded into the Data Warehouse, and the data belonging to the Facts table is loaded into the Power BI tool.
- Storage: There is the datamart, the data warehouse, and the cube; remember that the source database comprises two-dimensional tables or straightforward data. The Power BI tool obtains this multidimensional data on the sensors. A multifaceted analysis allows thinking, reducing confusion, avoiding lousy perspectives, and seeing from another angle and other facets.
- Visualization: This BI results in view contains dashboard sorts; the previous steps could be performed in the Power-BIPower BI.
4.4. Evaluate the IoT network and BI model using the Y.4908 Standard and the IT specialist survey.
| No | Questions | 1 | 2 | 3 | 4 | 5 |
|---|---|---|---|---|---|---|
| 1 | A BI model presents data sources | 44 | 43 | 10 | 3 | 0 |
| 2 | The Data Warehouse model is presented | 33 | 47 | 20 | 0 | 0 |
| 3 | ETL is presented | 37 | 33 | 30 | 0 | 0 |
| 4 | The names of the indicators are presented | 53 | 40 | 7 | 0 | 0 |
| 5 | The terms of the reports are presented | 57 | 37 | 6 | 0 | 0 |
| 6 | The named software is appropriate | 34 | 33 | 13 | 0 | 0 |
| 7 | The DW contains dimensions and facts | 47 | 40 | 13 | 0 | 0 |
| 8 | The hands are suitable for this case | 57 | 37 | 3 | 3 | 0 |
| 9 | The model promotes a culture of data-driven decision-making | 57 | 30 | 7 | 3 | 3 |
| 10 | The model is clear and specific | 57 | 37 | 6 | 0 | 0 |
| Overall average | 50 | 38 | 12 | 1 | 0 |
5. Discussion
6. Conclusions
References
- Senthil, G.; Suganthi, P.; Prabha, R.; Madhumathi, M.; Prabhu, S.; Sridevi, S. An Enhanced Smart Intelligent Detecting and Alerting System for Industrial Gas Leakage using IoT in Sensor Network. 2023 5th International Conference on Smart Systems and Inventive Technology (ICSSIT), 2023, pp. 397–401. [CrossRef]
- Paul, H.; Saifullah, M.K.; Kabir, M.M. A Smart Natural Gas Leakage Detection and Control System for Gas Distribution Companies of Bangladesh using IoT. 2021 2nd International Conference on Robotics, Electrical and Signal Processing Techniques (ICREST), 2021, pp. 109–114. [CrossRef]
- Gomes, J.B.A.; Rodrigues, J.J.P.C.; Al-Muhtadi, J.; Arunkumar, N.; Rabêlo, R.A.L.; Furtado, V. An IoT-Based Smart Solution for Preventing Domestic CO and LPG Gas Accidents. 2018 IEEE 10th Latin-American Conference on Communications (LATINCOM), 2018, pp. 1–6. [CrossRef]
- Sharma, B.B.; Vaidya, P.; Kumar, N.; Chen, C.C.; Sharma, R.; Dwivedi, R.P.; Gupta, G. Arduino based LPG Leakage Detection and Prevention System. 2021 8th International Conference on Computing for Sustainable Global Development (INDIACom), 2021, pp. 161–166.
- Ahmed, S.; Rahman, M.J.; Razzak, M.A. Design and Development of an IoT-Based LPG Gas Leakage Detector for Households and Industries. 2023 IEEE World AI IoT Congress (AIIoT), 2023, pp. 0762–0767. [CrossRef]
- PetroEcuador. PetroEcuador E.P.-GLP. 2023. [Google Scholar]
- BCE. Banco Central Ec GLP. 2023. [Google Scholar]
- Mahfuz, N.; Karmokar, S.; Rana, M.I.H. A Smart Approach of LPG Monitoring and Detection System Using IoT. 2020 11th International Conference on Computing, Communication and Networking Technologies (ICCCNT), 2020, pp. 1–4. [CrossRef]
- Xiao, W.; Liu, C.; Wang, H.; Zhou, M.; Hossain, M.S.; Alrashoud, M.; Muhammad, G. Blockchain for Secure-GaS: Blockchain-Powered Secure Natural Gas IoT System With AI-Enabled Gas Prediction and Transaction in Smart City. IEEE Internet of Things Journal 2021, 8, 6305–6312. [Google Scholar] [CrossRef]
- Yadav, S.A.; Sharma, S.; Das, L.; Gupta, S.; Vashisht, S. An Effective IoT Empowered Real-time Gas Detection System for Wireless Sensor Networks. 2021 International Conference on Innovative Practices in Technology and Management (ICIPTM), 2021, pp. 44–49. [CrossRef]
- Ramadhani, P.P.; Hadi, S.; Rosadi, R. Implementation of Data Warehouse in Making Business Intelligence Dashboard Development Using PostgreSQL Database and Kimball Lifecycle Method. 2021 International Conference on Artificial Intelligence and Big Data Analytics, 2021, pp. 88–92. [CrossRef]
- Kholil, M.; Ismanto, I.; Akhsani, R. Development Of LPG Leak Detection System Using Instant Messaging Infrastructure Based On Internet Of Things. 2021 International Conference on Electrical and Information Technology (IEIT), 2021, pp. 147–150. [CrossRef]
- Gavaskar, K.; Malathi, D.; Ravivarma, G.; Arulmurugan, A. Development of LPG Leakage Detection Alert and Auto Exhaust System using IoT. 2021 7th International Conference on Electrical Energy Systems (ICEES), 2021, pp. 558–563. [CrossRef]
- Eshgarf, R.; Deldardil, M. Identifying Effective Factors on Deploying Business Intelligence in the Gas Refinery Industries of Iran Based on DEMATEL Approach: A Study of Parsian Gas Refinery Co. Management and Administrative Sciences Review 2014, 3, 523–531. [Google Scholar]
- Fornaroli, A.; Gatica-Perez, D. Urban Crowdsourcing Platforms across the World: A Systematic Review. Digit. Gov.: Res. Pract. 2023, 4. [Google Scholar] [CrossRef]
- UIT-T. UIT-T Y.4908. 2020. [Google Scholar]
- Suma, V.; Shekar, R.R.; Akshay, K.A. Gas Leakage Detection Based on IOT. 2019 3rd International conference on Electronics, Communication and Aerospace Technology (ICECA), 2019, pp. 1312–1315. [CrossRef]
- Srivastava, A.K.; Thakur, S.; Kumar, A.; Raj, A. IoT Based LPG Cylinder Monitoring System. 2019 IEEE International Symposium on Smart Electronic Systems (iSES) (Formerly iNiS), 2019, pp. 268–271. [CrossRef]
- Shrestha, S.; Anne, V.P.K.; Chaitanya, R. IoT Based Smart Gas Management System. 2019 3rd International Conference on Trends in Electronics and Informatics (ICOEI), 2019, pp. 550–555. [CrossRef]
- Kodali, R.K.; Greeshma, R.; Nimmanapalli, K.P.; Borra, Y.K.Y. IOT Based Industrial Plant Safety Gas Leakage Detection System. 2018 4th International Conference on Computing Communication and Automation (ICCCA), 2018, pp. 1–5. [CrossRef]
- Da Silva Medeiros, G.V.; Santos, M.R.d.; Lopes, A.S.B.; Barbalho Neto, E.C. Smartgas: a smart platform for cooking gas monitoring. 2017 IEEE First Summer School on Smart Cities (S3C), 2017, pp. 97–102. [CrossRef]
- Denić, N.; Nešić, Z.; Radojičić, M.; Vasović, J.V. Some considerations on business intelligence application in business improvement. 2014 22nd Telecommunications Forum Telfor (TELFOR), 2014, pp. 1142–1145. [CrossRef]
- Zia, U.u.R.; Zulfiqar, M.; Azram, U.; Haris, M.; Khan, M.A.; Zahoor, M.O. Use of Macro/Micro Models and Business Intelligence tools for Energy Assessment and Scenario based Modeling. 2019 4th International Conference on Emerging Trends in Engineering, Sciences and Technology (ICEEST), 2019, pp. 1–7. [CrossRef]
- Meris, P.R.; Dimaunahan, E.; Dela Cruz, J.C.; Fadchar, N.A.; Manuel, M.C.; Bonaobra, J.C.C.; Ranosa, F.J.I.; Mangaoang, J.L.D.; Reyes, P.C. IOT Based – Automated Indoor Air Quality and LPG Leak Detection Control System using Support Vector Machine. 2020 11th IEEE Control and System Graduate Research Colloquium (ICSGRC), 2020, pp. 231–235. [CrossRef]
- Yahaya, S.Z.; Mohd Zailani, M.N.; Che Soh, Z.H.; Ahmad, K. IoT Based System for Monitoring and Control of Gas Leaking. 2020 1st International Conference on Information Technology, Advanced Mechanical and Electrical Engineering (ICITAMEE), 2020, pp. 122–127. [CrossRef]
- Aman, F.; Thiran, T.P.; Huda Yusof, K.; Sapari, N.M. IoT Gas Leakage Detection, Alert, and Gas Concentration Reduction System. 2022 IEEE 12th Symposium on Computer Applications & Industrial Electronics (ISCAIE), 2022, pp. 55–60. [CrossRef]
- Islam, M.R.; Matin, A.; Siddiquee, M.S.; Hasnain, F.M.S.; Rahman, M.H.; Hasan, T. A Novel Smart Gas Stove with Gas Leakage Detection and Multistage Prevention System Using IoT LoRa Technology. 2020 IEEE Electric Power and Energy Conference (EPEC), 2020, pp. 1–5. [CrossRef]
- Yaya, M.H.B.M.; Patchmuthu, R.K.; Wan, A.T. LPG Gas Usage and Leakage Detection Using IoT in Brunei. 2021 International Conference on Green Energy, Computing and Sustainable Technology (GECOST), 2021, pp. 1–5. [CrossRef]
- Kumaran, M.; Pradeep, J.; Hounandan, R.; Prahatheesh, B. Smart LPG Cylinder Monitoring and Explosion Management System. 2021 12th International Symposium on Advanced Topics in Electrical Engineering (ATEE), 2021, pp. 1–7. [CrossRef]
- Hambali, F.A.; Fitriana, R.; Joelianto, E. Integration System of IoT Gas Sensor using Simple Network Management Protocol and Open Platform Communication. 2021 IEEE 7th Information Technology International Seminar (ITIS), 2021, pp. 1–6. [CrossRef]
- Jinfeng, L.; Chen, C.; Xiaowei, C.; Wei, W. Management of Indoor Gas Safety based on the NB-IoT Gas Meter. 2021 33rd Chinese Control and Decision Conference (CCDC), 2021, pp. 2776–2780. [CrossRef]
- Nahid, S.I.; Khan, M.M. Toxic Gas Sensor and Temperature Monitoring in Industries using Internet of Things (IoT). 2021 24th International Conference on Computer and Information Technology (ICCIT), 2021, pp. 1–6. [CrossRef]
- Şahinbaş, K.; Yılmaz, B. Business Intelligence Application in the Natural Gas Industry: A Company Case. In Strategic Approaches to Energy Management: Current Trends in Energy Economics and Green Investment; Yüksel, S., Dinçer, H., Eds.; Springer International Publishing: Cham, 2021; pp. 141–154. [Google Scholar] [CrossRef]
- Saad, H.; Siddiqui, S.A.; Naim, N.F.; Othman, N. Development of LPG Leakage Simulation System Integrated with the Internet of Things (IoT). 2022 IEEE 18th International Colloquium on Signal Processing & Applications (CSPA), 2022, pp. 161–166. [CrossRef]
- B, R.; K, G.; D, M.; R, N.; V, G.; R, S. Smart Detection System for LPG Gas Leakage using IoT. 2022 6th International Conference on Computing Methodologies and Communication (ICCMC), 2022, pp. 421–430. [CrossRef]
- Gokulavasan, B.; Shrina, K.; Sangeetha Sruthi, U.; Sneka Darshini, R.; Srivaishnavi, D. Smart Gas Booking System and Leakage Detection Using IOT. 2022 8th International Conference on Advanced Computing and Communication Systems (ICACCS), 2022, Vol. 1, pp. 1914–1917. [CrossRef]
- Reddy, S.; K N, R.P. LPG Gas Detection and Monitoring Using IoT. 2022 International Interdisciplinary Humanitarian Conference for Sustainability (IIHC), 2022, pp. 693–697. [CrossRef]
- Khajavizadeh, L.; Andersson, M. MOSFET-based gas sensors for process industry IoT applications. 2022 International Conference on Electrical, Computer, Communications and Mechatronics Engineering (ICECCME), 2022, pp. 1–5. [CrossRef]
- B, R.; D, M.; K, G.; N, S.; R, S.; T, K. IoT based Automatic Electricity Cut off using LPG Gas Leakage Detection System. 2023 Second International Conference on Electronics and Renewable Systems (ICEARS), 2023, pp. 1–8. [CrossRef]
- Chawla, S.; Chawla, H. IoT-Based Digital LPG Gas Cylinder Trolley to Prevent Hazards with Voice-Controlled Features. 2023 6th International Conference on Information Systems and Computer Networks (ISCON), 2023, pp. 1–6. [CrossRef]
- Chakradhar, K.; Deshmukh, R.; Singh, P.P.; Hazela, B.; Taluja, R. LPG Cylinder Leakage Monitoring by IoT. 2023 International Conference on Inventive Computation Technologies (ICICT), 2023, pp. 1386–1389. [CrossRef]
- Lorthong, S.; Janjarassuk, U.; Jayranaiwachira, N. LPG Leakage Risk Predictions from an IoT-Based Detection System Using Machine Learning. 2023 9th International Conference on Engineering, Applied Sciences, and Technology (ICEAST), 2023, pp. 14–17. [CrossRef]
- Kalavathi Devi, T.; Kumar, N.S.; Chandrasekaran, G.; Sakthivel, P.; Priyadarshi, N.; Bhaskar, M.S.; Kumar, N. IoT Based Remote Monitoring of Gas Leakage in Power Plants. 2023 IEEE 3rd International Conference on Technology, Engineering, Management for Societal impact using Marketing, Entrepreneurship and Talent (TEMSMET), 2023, pp. 1–5. [CrossRef]
- Reza, M. Business Intelligence on Agile Natural Gas Supply Chain. Journak of Business Data Science Research 2023. [Google Scholar]
- Gautam, D.; Bhatia, S.; Goel, N.; Mallikaijuna, B.; H S, G.; Bhushan Naib, B. Development of IoT Enabled Framework for LPG Gas Leakage Detection and Weight Monitoring System. 2023 International Conference on Device Intelligence, Computing and Communication Technologies, (DICCT), 2023, pp. 182–187. [CrossRef]
- Blynk. Blynk. 2023. [Google Scholar]
- Microsoft. Power BI. 2023. [Google Scholar]
- Ralph, K.; Margy, R. The Data Warehouse Toolkit; In John Wiley & Sons, Inc.: Canada, 2018. [Google Scholar]
- Nishisato, S. Data Analysis and Likert Scale. In Measurement, Mathematics and New Quantification Theory; Springer Nature Singapore: Singapore, 2023; pp. 19–36. [Google Scholar] [CrossRef]

| Capacity | Yes | No | ||
|---|---|---|---|---|
| Network Interoperability | Interconnected | |||
| Device List | ||||
| Systems List | ||||
| Data Interoperability | Interconnect | |||
| Device List | ||||
| Systems List | ||||
| Service Interoperability | Integrate | |||
| Device List | ||||
| Systems List |
| Year | Papers | No |
|---|---|---|
| 2019 | [3,14,17,18,19,20,21,22,23] | 9 |
| 2020 | [8,24,25,26,27] | 5 |
| 2021 | [2,4,9,10,12,13,28,29,30,31,32,33] | 12 |
| 2022 | [34,35,36,37,38] | 5 |
| 2023 | [1,5,39,40,41,42,43,44,45] | 9 |
| Capacity | Yes | No | ||
|---|---|---|---|---|
| Network Interoperability | Interconnected | |||
| Device List | X | |||
| Systems List | X | |||
| Data Interoperability | Interconnect | |||
| Device List | X | |||
| Systems List | X | |||
| Service Interoperability | Integrate | |||
| Device List | X | |||
| Systems List | X |
Disclaimer/Publisher’s Note: The statements, opinions and data contained in all publications are solely those of the individual author(s) and contributor(s) and not of MDPI and/or the editor(s). MDPI and/or the editor(s) disclaim responsibility for any injury to people or property resulting from any ideas, methods, instructions or products referred to in the content. |
© 2024 by the authors. Licensee MDPI, Basel, Switzerland. This article is an open access article distributed under the terms and conditions of the Creative Commons Attribution (CC BY) license (http://creativecommons.org/licenses/by/4.0/).


