1. Introduction
The importance of remote monitoring of health parameters has risen in the most recent years [
1]. Thanks to technological advances in the fields of medicine, informatics and engineering, there has been a rapid growth of technologies capable of providing a tool for remote monitoring subjects or patients in different ways [
2]. The target of these applications is represented by people with movement impediments or forced to remain home. This aspect acquired even more relevance after the pandemic emergency of recent years, which was linked with an increasing development of such health monitoring methods [
3,
4]. The monitoring methods can be of multiple nature: audio, video or biomedical signals in a more general sense. Examples are given by the remote monitoring of ECG signals [
5,
6], heart rate [
7] and others. Currently, there are many integrated "smart" systems such as smartwatches and smartphones that can be used to obtain real-time information on lifestyle and health status in a non-invasive way.
In this landscape, smartphones play a critical role. This is demonstrated by the rising number of commercial and non-commercial smartphone applications aimed at acquiring and analyzing generic biomedical signals, promoting an increasing number of actual clinical trials. An example is given by the Apple Heart Study born from the partnership of Apple, Inc. and Stanford University [
8]. Starting from these experiences, during the COVID-19 pandemic we have witnessed a further growth of such devices and apps aimed precisely at the remote monitoring of COVID-19 patients [
9]. In the pandemic context, smartphone systems can play a fundamental role in fulfilling two intrinsically related aspects: guaranteeing the safety and health of the domestic population and systematically monitoring isolated subjects remotely. Nowadays, the monitoring of vital functions through smartphones is made possible thanks to the numerous sensors integrated into them such as: high resolution cameras, geo-localization sensors, accelerometers, gyroscopes, magnetometers, ambient light sensors and microphones [
10,
11]. Examples are given by the works of Brown et al [
12] and Kvapilova et al [
13], in which applications were developed to record through the smartphone microphone cough sounds to remotely diagnose infections via Artificial Intelligence algorithms.
The works from the literature demonstrate how these instruments are capable of providing health information are a powerful tool for prevention and monitoring of public health for impeded patients. Beyond the needs imposed by pandemics, it is relevant to underline that remote monitoring also plays a key role in monitoring rehabilitation conditions for patients who underwent surgery interventions [
14]. An example is given by the work of Halloran and colleagues, in which a population of stroke patients was successfully monitored via wearable accelerometer sensors for rehabilitation [
15].
The current drawback of smartphone-based systems is the limited nature of the biomedical signals that can be provided, regardless of their embedded sensor technology. An example is given by the respiratory kinematics. It is in fact fundamental to underline how the respiratory act is linked with complex kinematics that are much more extensive than the information reported by a single one-dimensional pattern [
16]. The corresponding respiratory pattern should therefore be characterized by a 4D dynamic system (3D space and time) where the spatial component does not respond only to the excursion of the rib cage with its respiratory frequency, but to the way in which the rib cage and the diaphragm allows the act of inhalation and exhalation. The study of chest wall kinematics during respiratory act has relevance in different health contexts [
17,
18], including the rehabilitation after surgery [
19]. Previous contributions reported the relevance of chest wall movement for respiratory function, due to the link between ventilation and diaphragm motion when chest expansion is impaired as a consequence of surgery [
20]. Weakening of chest wall muscles increases the risk for postoperative pulmonary complications with consequent further impairing the pulmonary function [
21]. In some cases, chest wall movement and pulmonary function in patients who underwent cardiac surgery revealed an asymmetric respiratory movement and an anomalous breathing pattern after three months from the intervention, when compared with preoperative values [
22]. In literature, accelerometer measurements for respiratory kinematics at chest and abdomen level were reported already [
23,
24,
25] with successful results in different contexts. To our knowledge, mostly wearable systems with standalone sensors were used.
In this context, the current paper proposes a new smartphone-based method for respiratory kinematics assessment, with the development of an application dedicated for the remote monitoring of patients. The main idea behind this work is the definition of an acquisition protocol with a new application for the evaluation of chest / abdomen respiratory kinematics via embedded Inertial Movement Units (IMUs) sensors. In this manuscript, the method feasibility will be demonstrated by first presenting a validation procedure of the monitoring system. After the validation, a dedicated application will be developed and described. Then, a measurement campaign with the above cited application, involving healthy volunteers, will be defined and the resulting accelerometer / gyroscope signals will be processed. Finally, the results will be discussed considering the signal differences among the considered population.
2. Materials and Methods
In this section, the validation of the accelerometer / gyroscope measurements will be described first, then the application development will be characterized. At last, a the signal processing procedure and the acquisition campaign will be explained.
2.1. Validation
The measurements from the smartphone-embedded IMU sensors were validated first. Firstly, an acquisition procedure was defined to evaluate the feasibility. A sample of ten healthy volunteer subjects, (31 ± 1.5 and 30 ± 2.2 years old, BMI of 22.9 ± 4.0 and 19.5 ± 3.9, for 4 males and 6 females, respectively) were involved for the preliminary data recording protocol definition. Different smartphone positioning configurations were defined to fully explore respiratory kinematics at both the chest and abdomen levels. It is, in fact, established that the respiratory act generates complex kinematics at the rib cage level [
26].
Figure 1 shows the summary of the movements of the rib cage and diaphragm during the respiratory cycle. As it can be seen, the kinematics includes not just one direction but multiple degrees of freedom in three-dimensional space and it also includes the movement imposed by the diaphragm compression [
27,
28].
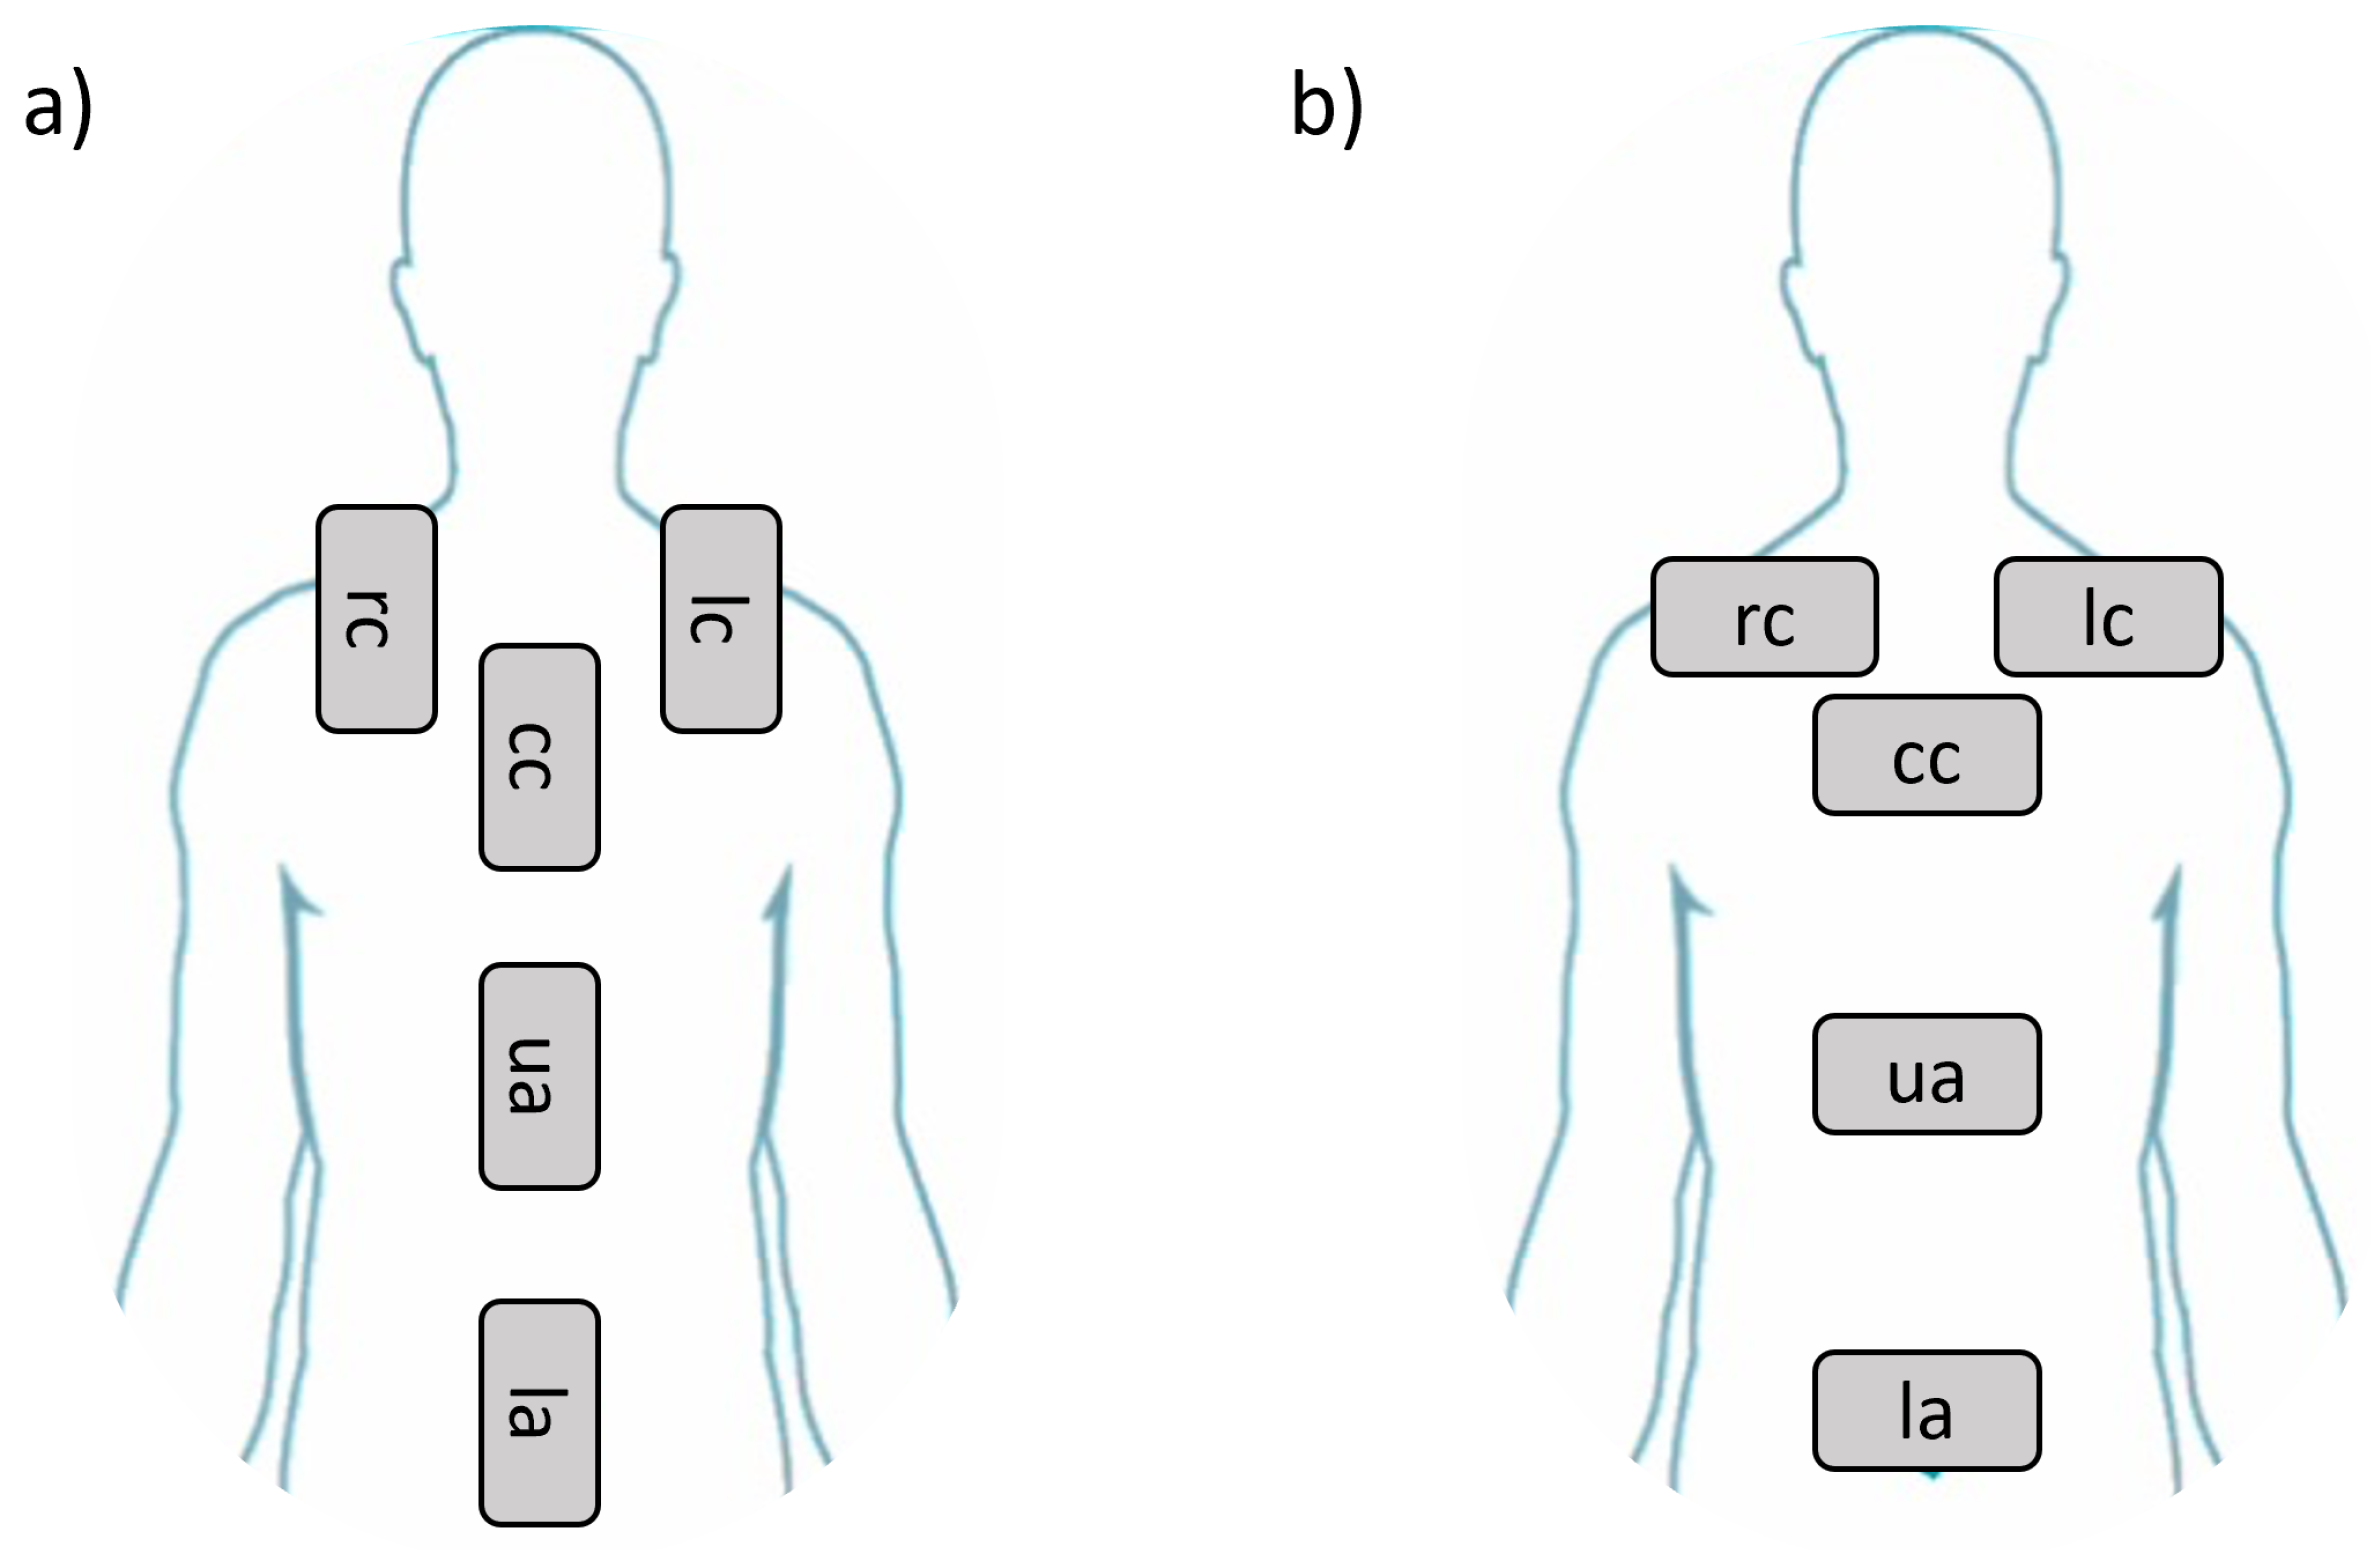
On the basis of this evidence, configurations to explore the respiratory kinematics were established with clinicians’ support, as summarized in
Figure 2 a - b. Briefly, five configurations were identified with two possible orientations of the smartphone, i.e. vertical (
Figure 2 a) and horizontal (
Figure 2 b) for a total of ten cases. The five configurations are given by:
Position 1 -right side of the chest ()
Position 2 -left side of the chest ()
Position 3 -chest center ()
Position 4 -upper abdomen ()
Position 5 -lower abdomen ()
The acquisition from the smartphone-embedded IMUs were performed with a dedicated application for this preliminary validation phase. For each of the defined positions, the volunteers were asked to follow the given steps, with the support of an operator:
The subject was asked to position supine on the bed and breathe normally
The operator, after ensuring the correct positioning of the volunteer subject, placed the smartphone designated for acquisition in one of the ten defined configurations and started the recording
The subject was asked to hold his / her breath for 2 seconds, to allow for zero input reference registration, necessary for noise estimation
The subject was then asked to breathe normally for 20 seconds, at the end of which the recording was stopped
At this point, the operator can place the smartphone in the next position and repeat the previous steps, until the pre-established configurations are completed
After each test session, the data from smartphone acquisitions were transferred to a computer for off-line processing procedures. All the processing was carried out with a custom script in Matlab. Data from both acquisition sessions were sampled with a frequency of 100 Hz. In particular, the three accelerometer (
) and gyroscope (
) signals were processed. For all the waveforms, the Signal-to-Noise Ratio for accelerometers (
) and gyroscopes (
), evaluated as vector module, in dB was calculated according to:
where
is the signal power, calculated during the respiratory activity interval, and
is the noise power, calculated during the zero input reference interval. The signal and noise power were calculated according to:
where
N is the number of samples in the interval and
is the waveform on the chosen interval (signal for the respiratory activity interval and noise for the zero input reference interval). After
calculation, the signals were analyzed in terms of artifacts presence. In particular, these two main steps were imposed: filtering and artifact individuation. For the filtering, a band-pass filtering, with lower and upper frequencies of 0.1 Hz and 1 Hz, was imposed on the signal to remove the effects of high-frequency noise, low-frequency drifts and sensor offsets. In particular, a Butterworth filter of 4th order was imposed. For the artifact removal, step-like and drift artifacts were individuated in the waveforms, as they were assumed to be linked with sensor sliding during the acquisition. The artifacts were detected by adopting a Wavelet transform-based method [
29].
2.2. Application Development
After the validation phase, a dedicated smartphone application aimed at guiding the user through the acquisition procedure and for accelerometer and gyroscope signals acquisition was developed (
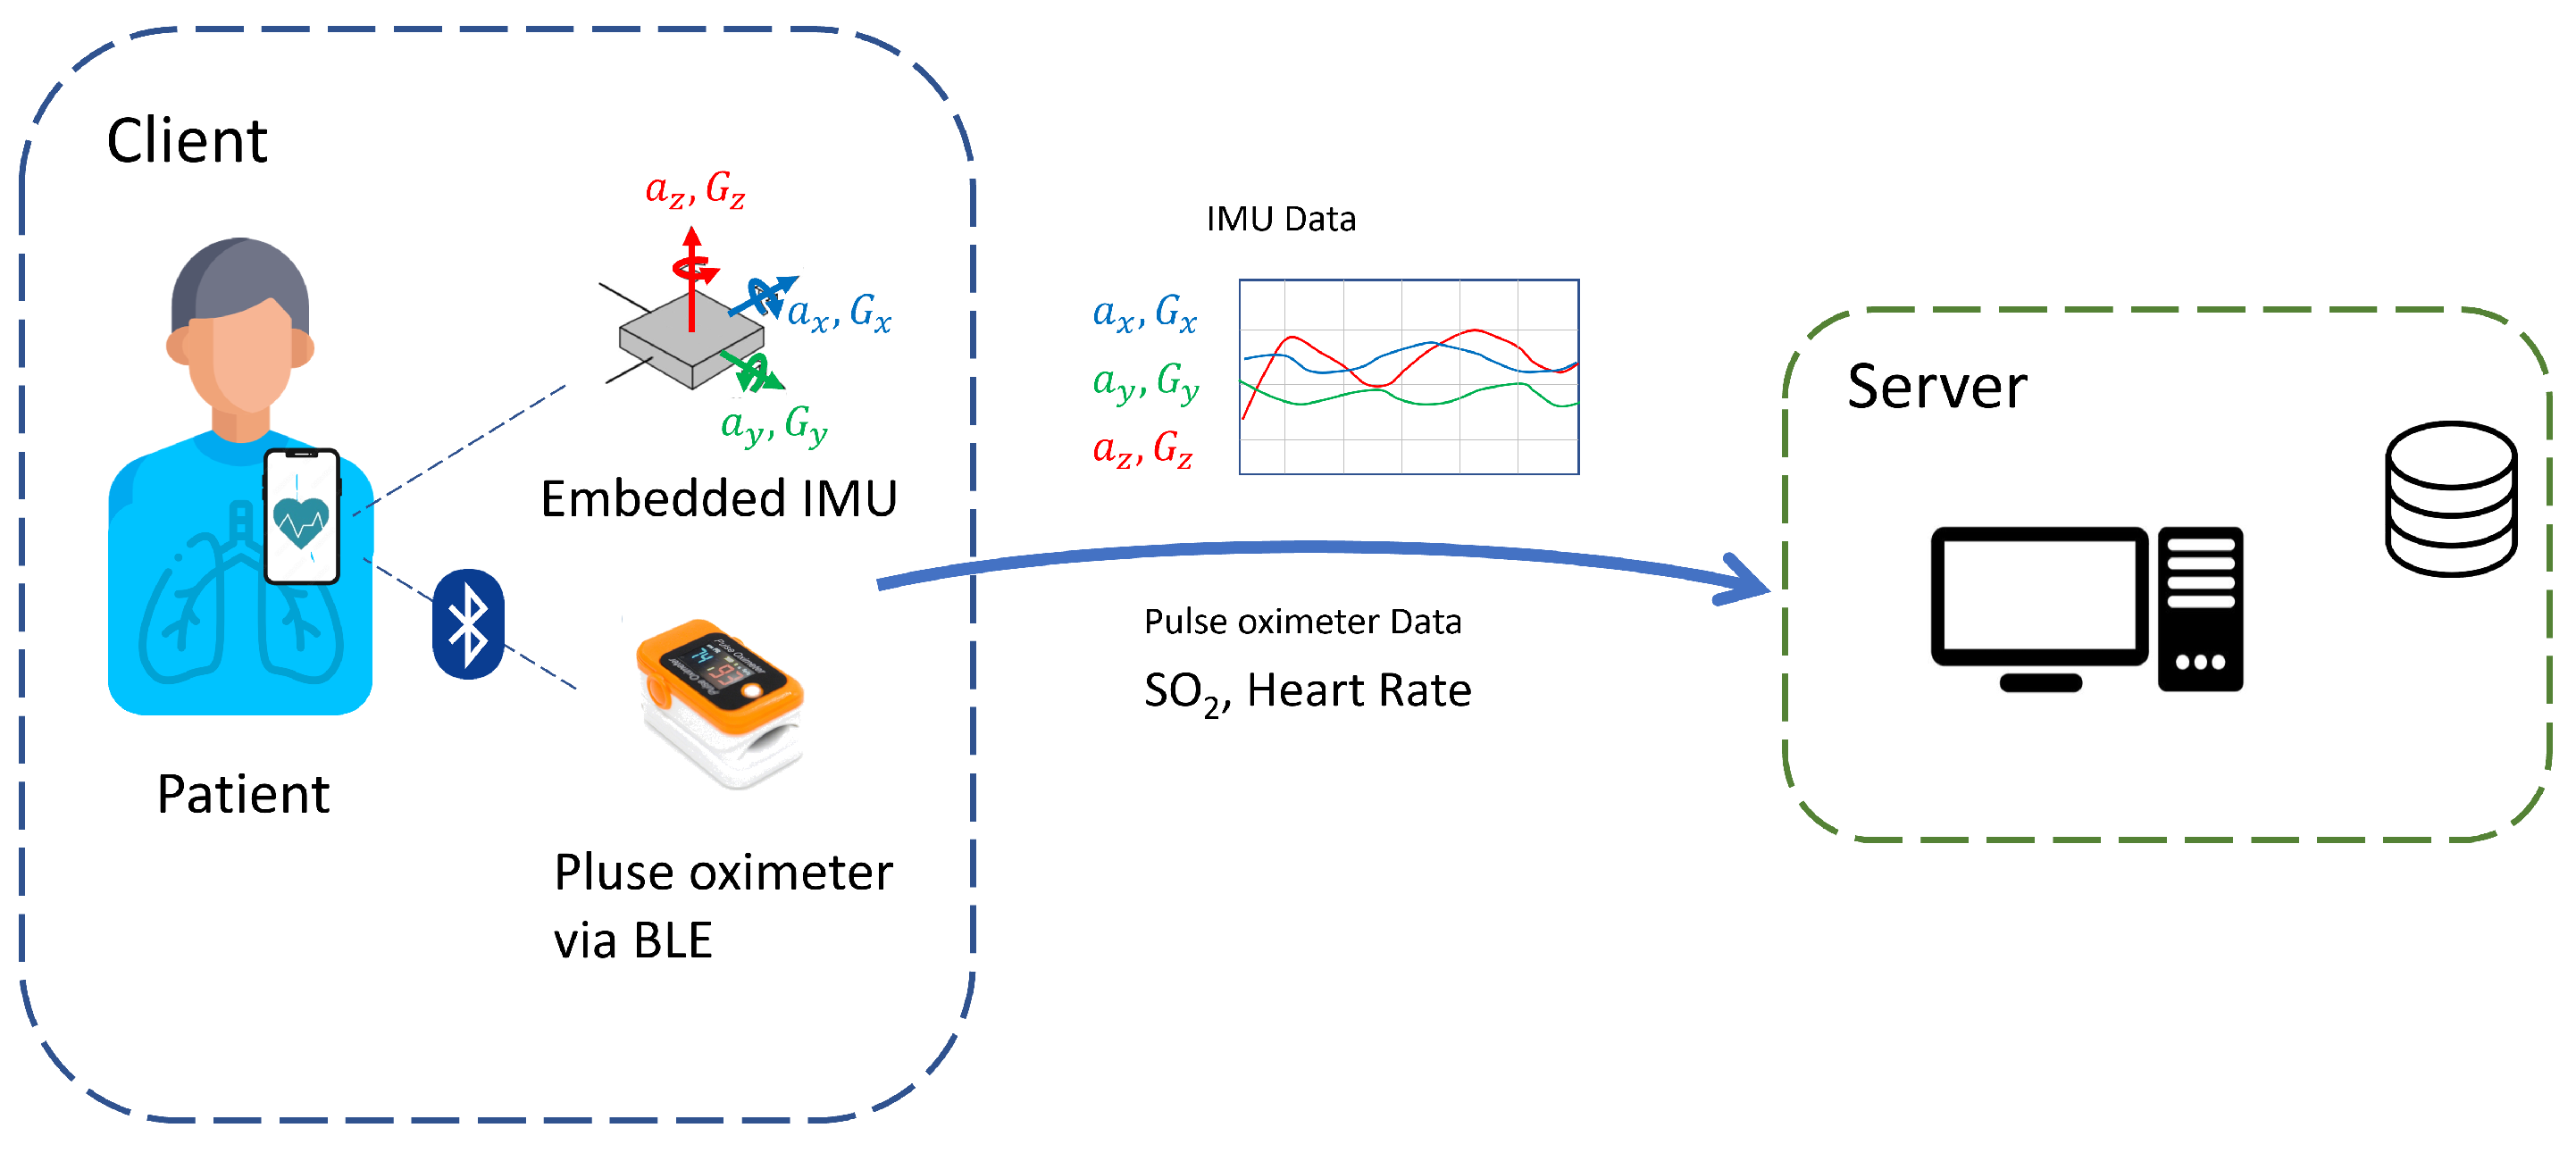
Figure 3). The application was programmed to be compatible with Android operative systems. In particular, a multilingual application was created, written in the general purpose Kotlin language, and based on a classic client-server architecture with REST interfaces. The client-server architecture was required to allow the data sharing procedure, with the app serving as the client, while a central server takes on the server and database management role.
The application was programmed to ask the user to choose among the different measurement protocols, depending on the smartphone positioning. The app was developed in order to guide the user to correctly finalize the measurement with an exemplificative video and prerecorded voice instructions. During the acquisition, the app would record the data from the embedded IMU in terms of accelerometer and gyroscope data. Additionally, the app was developed in order to communicate with an external pulse oximeter device via Bluetooth Low Energy (BLE) protocol, thus enabling the correlation of the IMU measurements with blood oxygenation and heart rate data. At the end of each acquisition, the app was programmed to share the anonymized data with the server via network connection. Particular attention was given to the privacy requirements for the protection of sensitive data collected by the app. Given this aspect, the application was programmed to associate the measurement with anonymous identifiers rather than personal data.
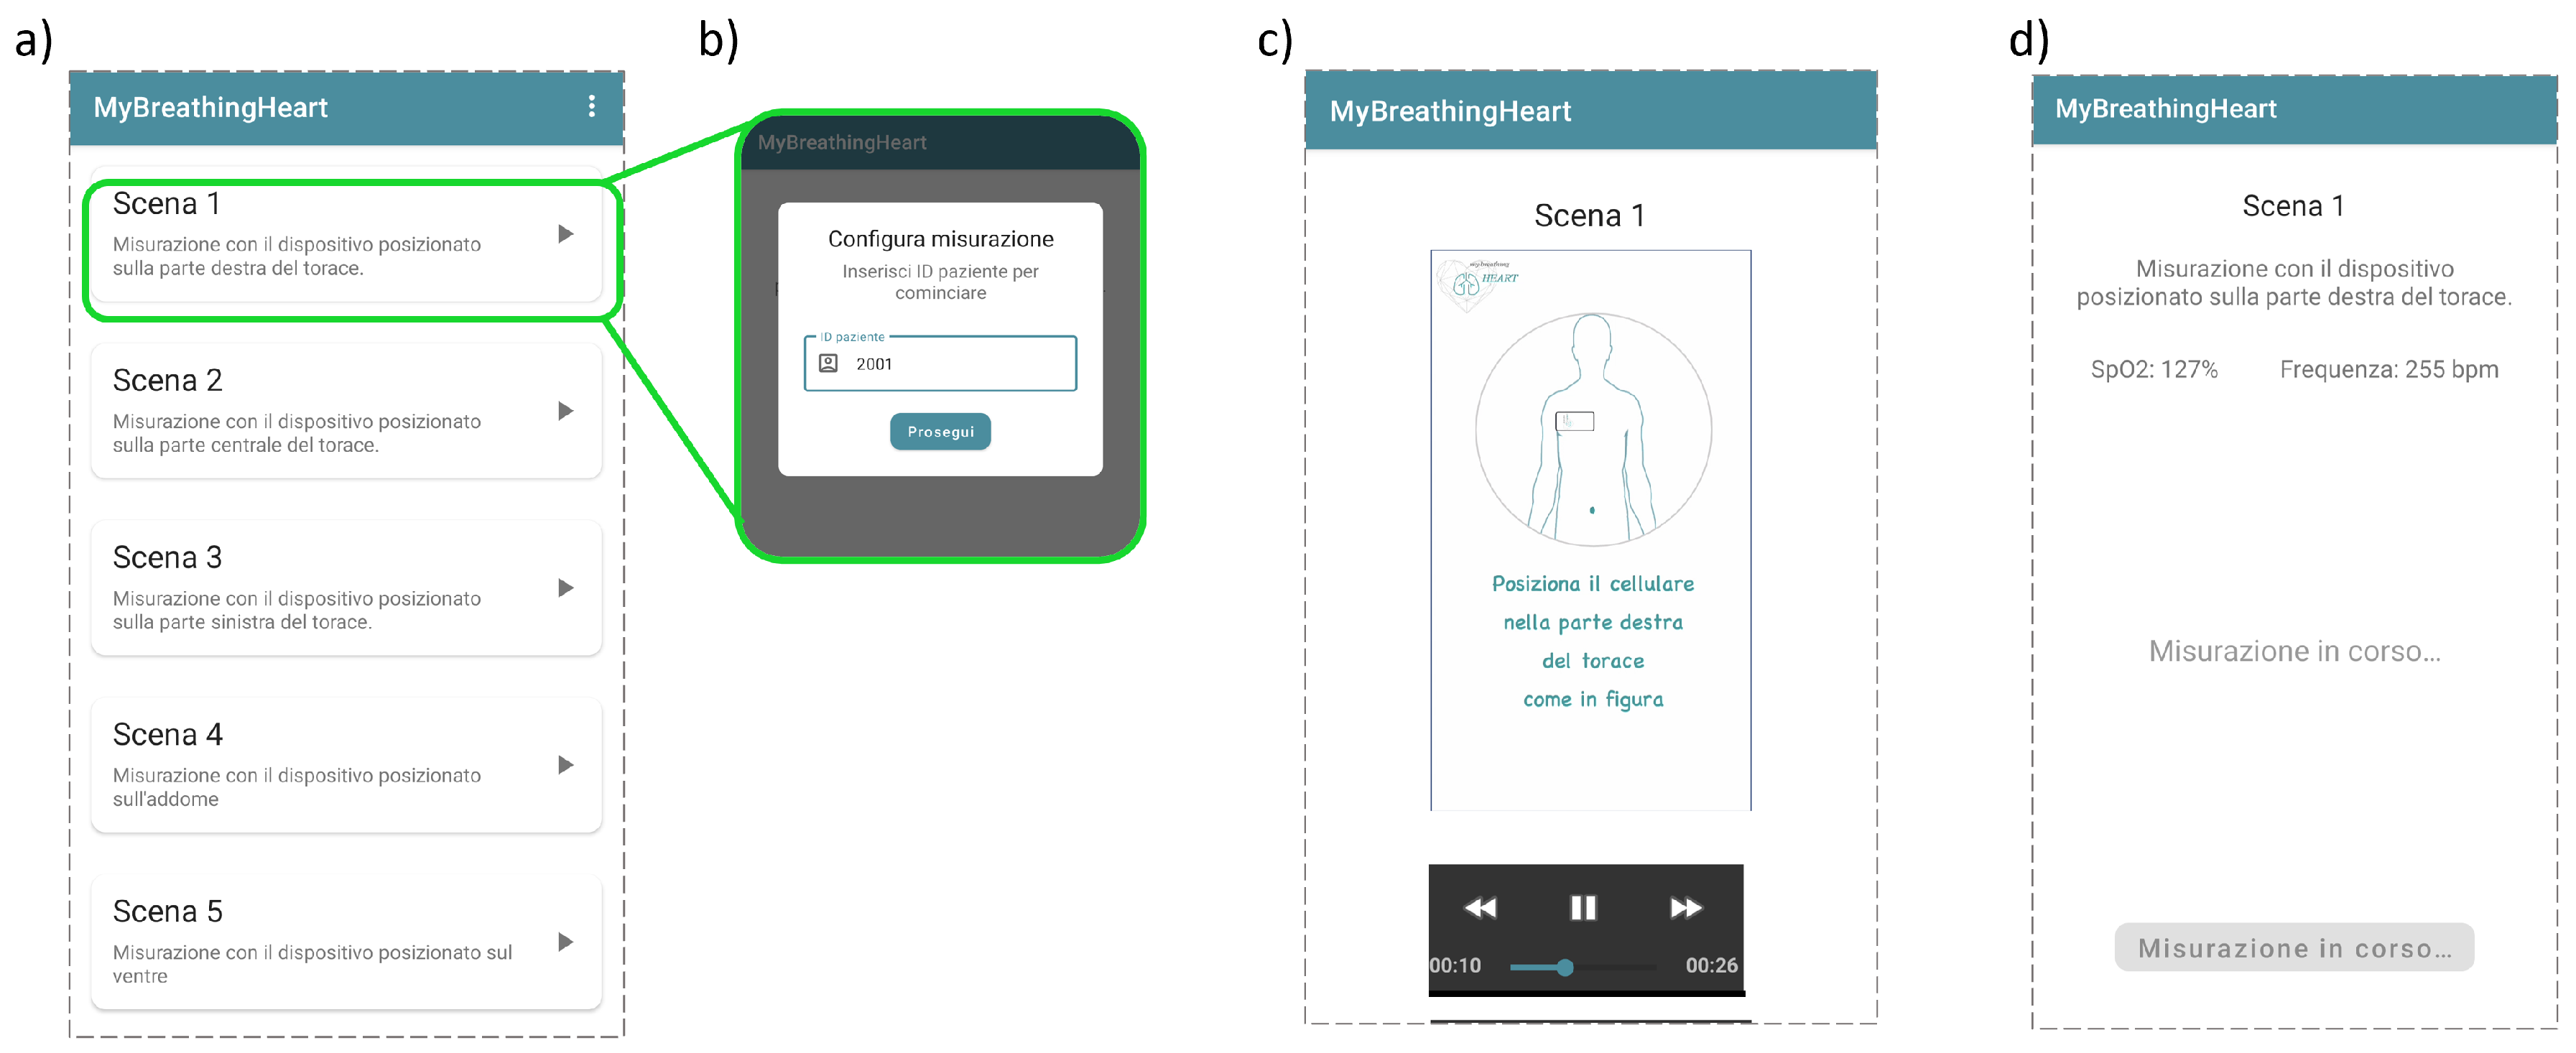
The application was successfully finalized. In
Figure 4, the position selection, the user identification, the exemplificative video and the acquisition interface are reported [
30].
2.3. Signal Processing
After finalizing the application, a workflow for processing the IMU data was defined. The following processing operations were imposed on accelerometer signals
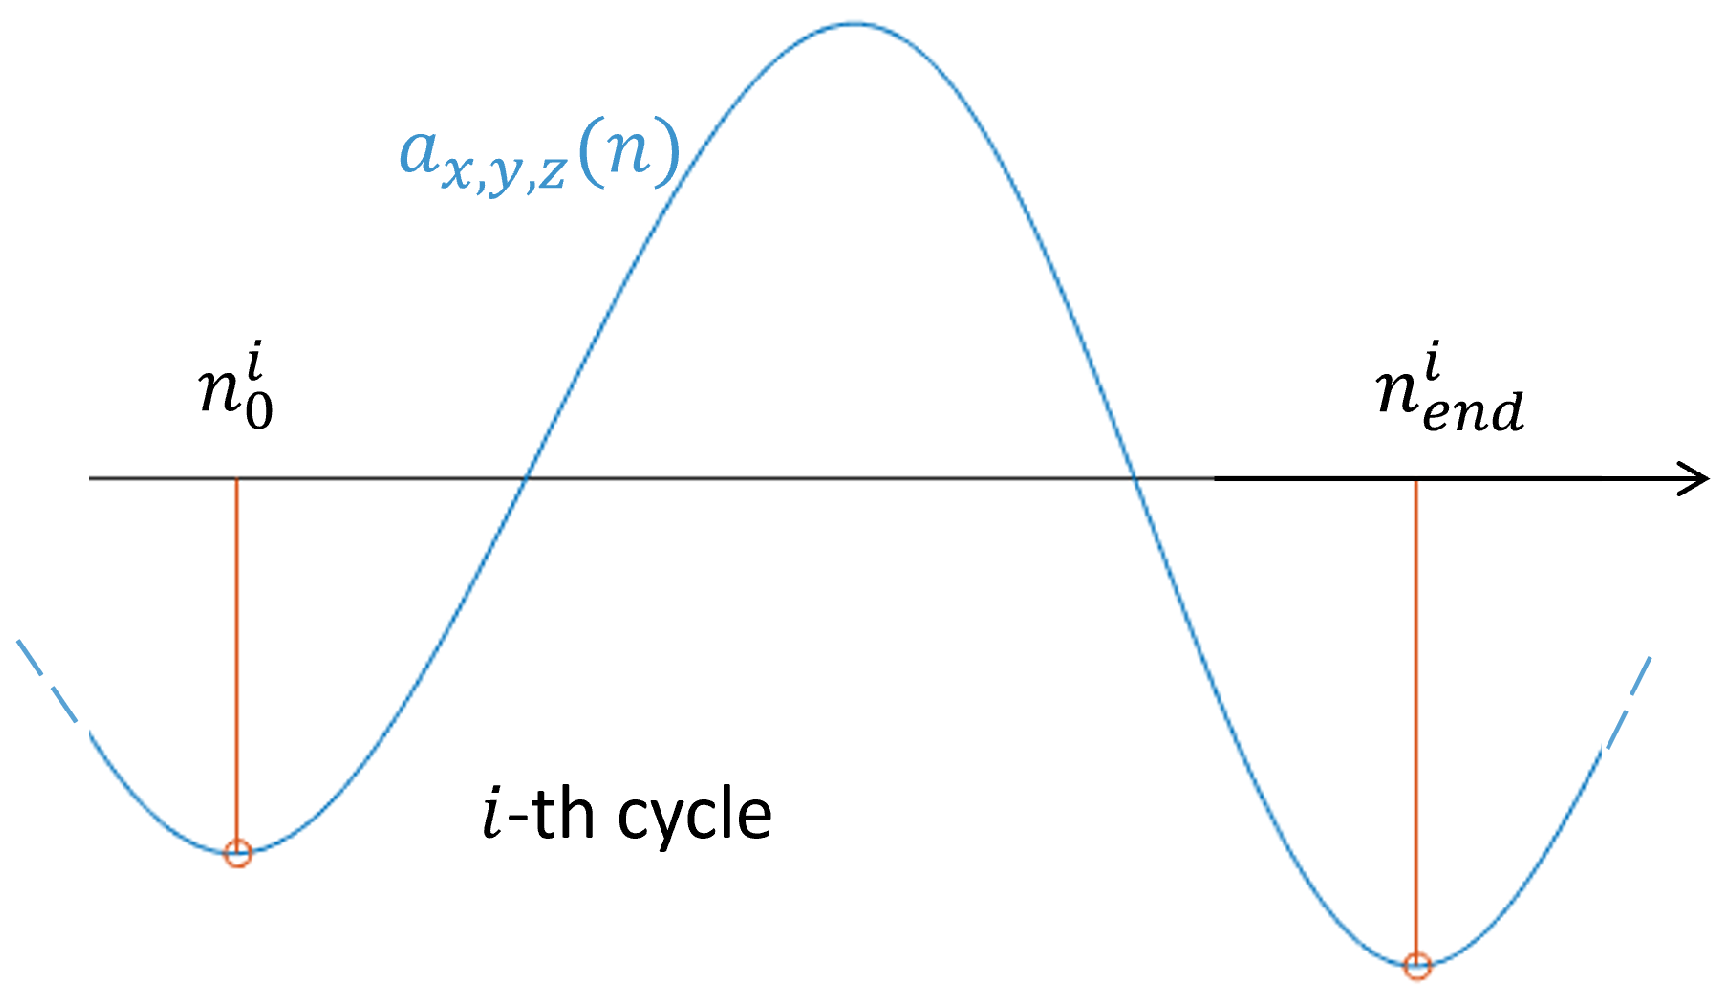
: filtering, cycle identification and reference system correction. For the filtering, the same method proposed in the Validation phase of subsection 2.1 was imposed. Specifically, the band-pass filter was applied to remove both noise and low frequencies errors, linked with unwanted body movements. For the cycle identification, a peak detection algorithm was imposed on the channel linked with the maximum signal range, to search for local minima. A single respiratory cycle was assumed to be included between two local minima of the main acceleration component (
Figure 5).
The smartphone at these minima was assumed to be stationary and consequently, acceleration components were assumed to be zero. To follow this assumption, the acceleration signals at the
i-th cycle (
) were processed according to a linear drift correction:
where
and
are the time indexes of the beginning and end of the
i-th respiratory cycle.
Before proceeding with reference system correction, angular velocities (
) from gyroscope were processed. Briefly, a band-pass filtering, as already imposed for the accelerometer signals, was adopted and the cycles according to the already established local minima were individuated. Then, a linear correction like the one described in Equation
3 was imposed to each gyroscope signal
at each respiratory cycle. Finally, a numerical integration process was imposed to obtain the orientation angles (
) from the angular velocities. In particular, the
were calculated according to:
At this point, it is possible to use the orientation angles to transform the acceleration components from the local reference system to the global reference system. Assumptions on the smartphone orientation during the respiratory act were made. The assumptions are summarized in
Figure 6. In particular, it was hypothesized that the smartphone orientation was the same at the beginning and at the end of each respiratory act, defined by the initial local reference system
. On the basis of this, a linear correction similar to the one expressed in Equation
3 was imposed to
as well. At a given time point
n within the
i-th respiratory act, the smartphone orientation was defined according to the generic local reference system
. A time-varying rotation matrix
can be defined to convert the components from the local reference system at time
n to the local reference system at time
.
From the angle orientation estimation, the rotation matrix
for each interval was defined, by considering the roll (
), pitch (
) and yaw (
) angles [
31], as:
where
is a rotation matrix about the
j-th axis. Finally, the time-varying rotation matrix of Equation
5 was applied to the acceleration components
to calculate the acceleration in the
reference system on the
i-th interval as:
As an additional point, the accelerometer and gyroscope data were used, after the above cited processing, as a tool to estimate the Respiratory Rate (RR) for each acquisition. In particular, the signal revealing the maximum range after filtering among
and
was selected. Then, the discrete Fourier transform was imposed to the selected signal (
) via the Fast Fourier Transform algorithm, according to:
where
f is the frequency domain variable and
is the discrete Fourier transform of the signal. Given the semi-periodicity of the signal
, the RR can be estimated by the nonzero frequency
corresponding to the maximum of
.
2.4. Acquisition Campaign
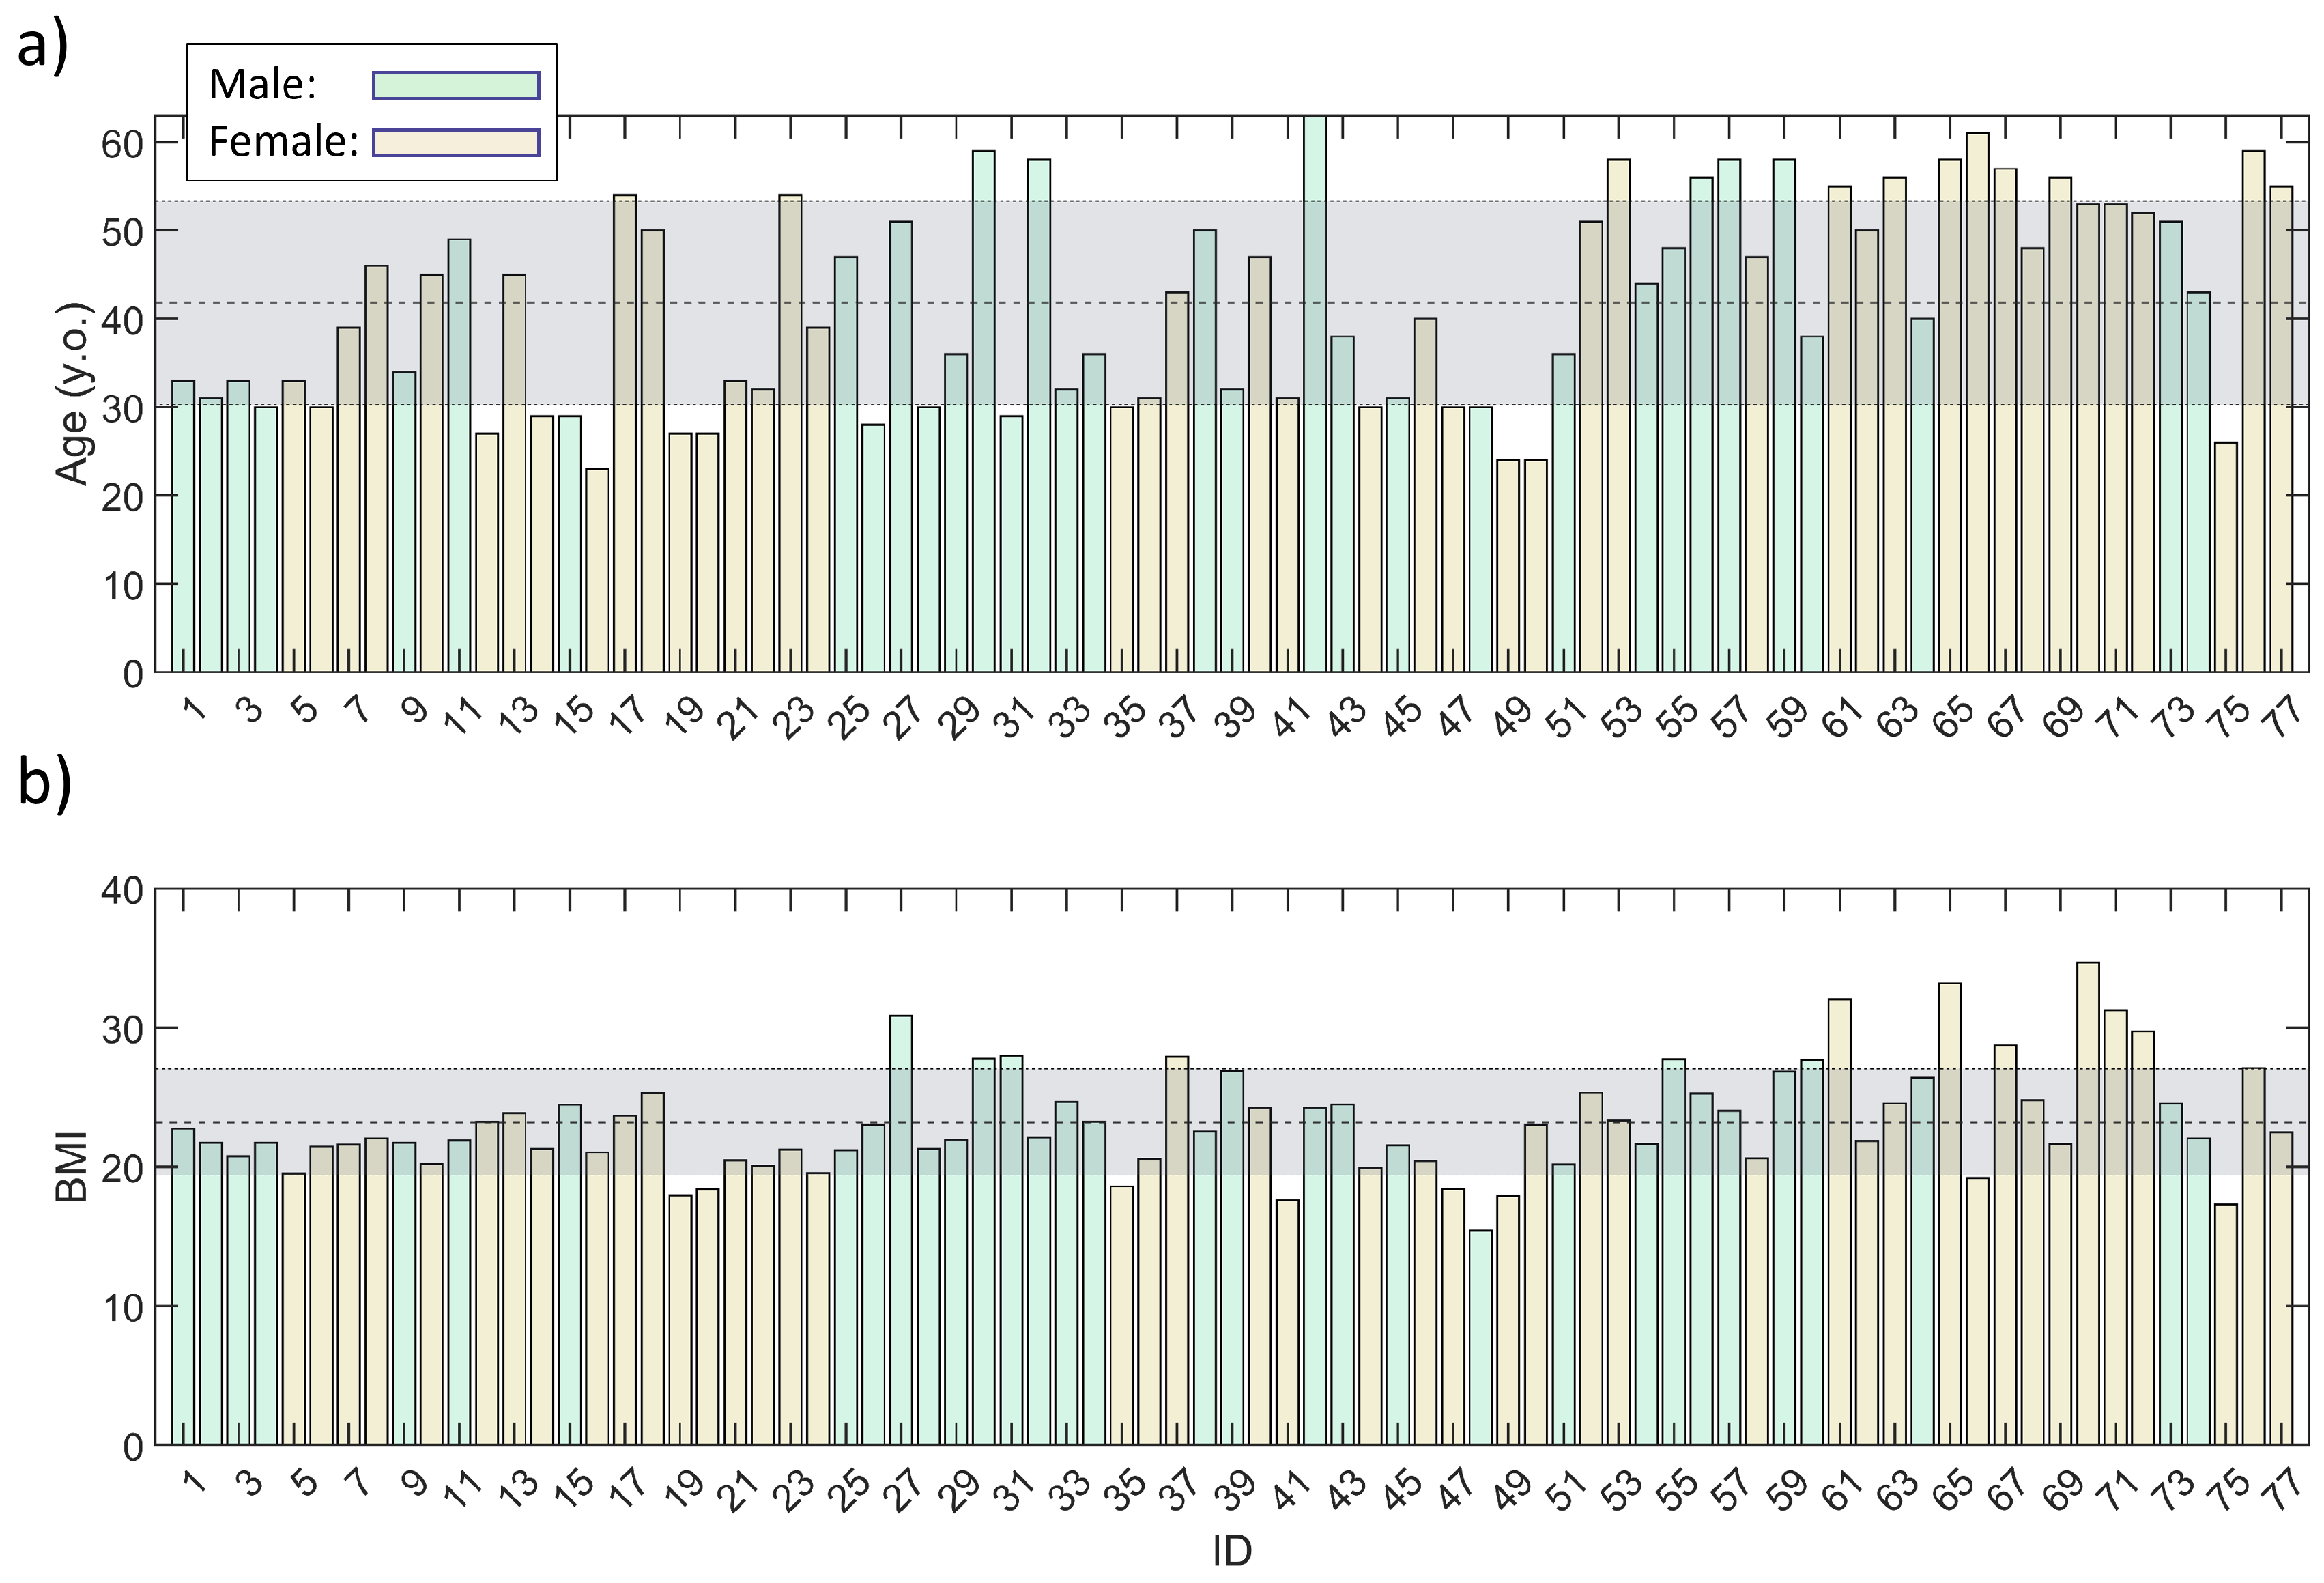
After validating the acquisition protocol, developing the dedicated application and defining the signal processing, a specific acquisition campaign was carried out. The campaign was defined to gather data from a population of healthy volunteers. A total of 77 subjects with no known respiratory or cardiovascular pathologies were recruited. The subject distribution in terms of age and Body Mass Index (BMI), with highlight on corresponding mean ± standard deviation (42 ± 11.5 years old and BMI of 23.2 ± 3.8) and sex, are reported in
Figure 7.
In particular, the population was constituted by 33 males (41 ± 10.8 years old and BMI of 23.7 ± 3.0) and by 44 females (42 ± 12.0 years and BMI of 23.0 ± 4.3). All participants were fully informed about the purpose of the study and informed consent documentation was obtained from all. The IMU signals for all the prescribed positions were processed for all the subjects, according to the procedure summarized in subsection 2.3. During the acquisition campaign, the users were asked to rate the application’s usability on a scale from 1 (worst score) to 5 (best score). Additionally, the statistical significance was evaluated according to patient sex, prescribed smartphone position and between the three main vector components of accelerometer / gyroscope sensors. In particular, the statistical significance tests were carried out in terms of maximum range of each accelerometer () and gyroscope (). The significance of differences for all the above cited parameters was assessed via two-sample Kolmogorov-Smirnov tests. All the tests were carried out with a significance level of 1%.
As an additional point for the acquisition campaign, the RR was calculated for each subject, according to the method described in previous subsection 2.3.
3. Results
Concerning the validation phase, the preliminary data gathering campaign was successful. The
and
values are reported in
Table 1 for each of the five positions with both vertical and horizontal orientation.
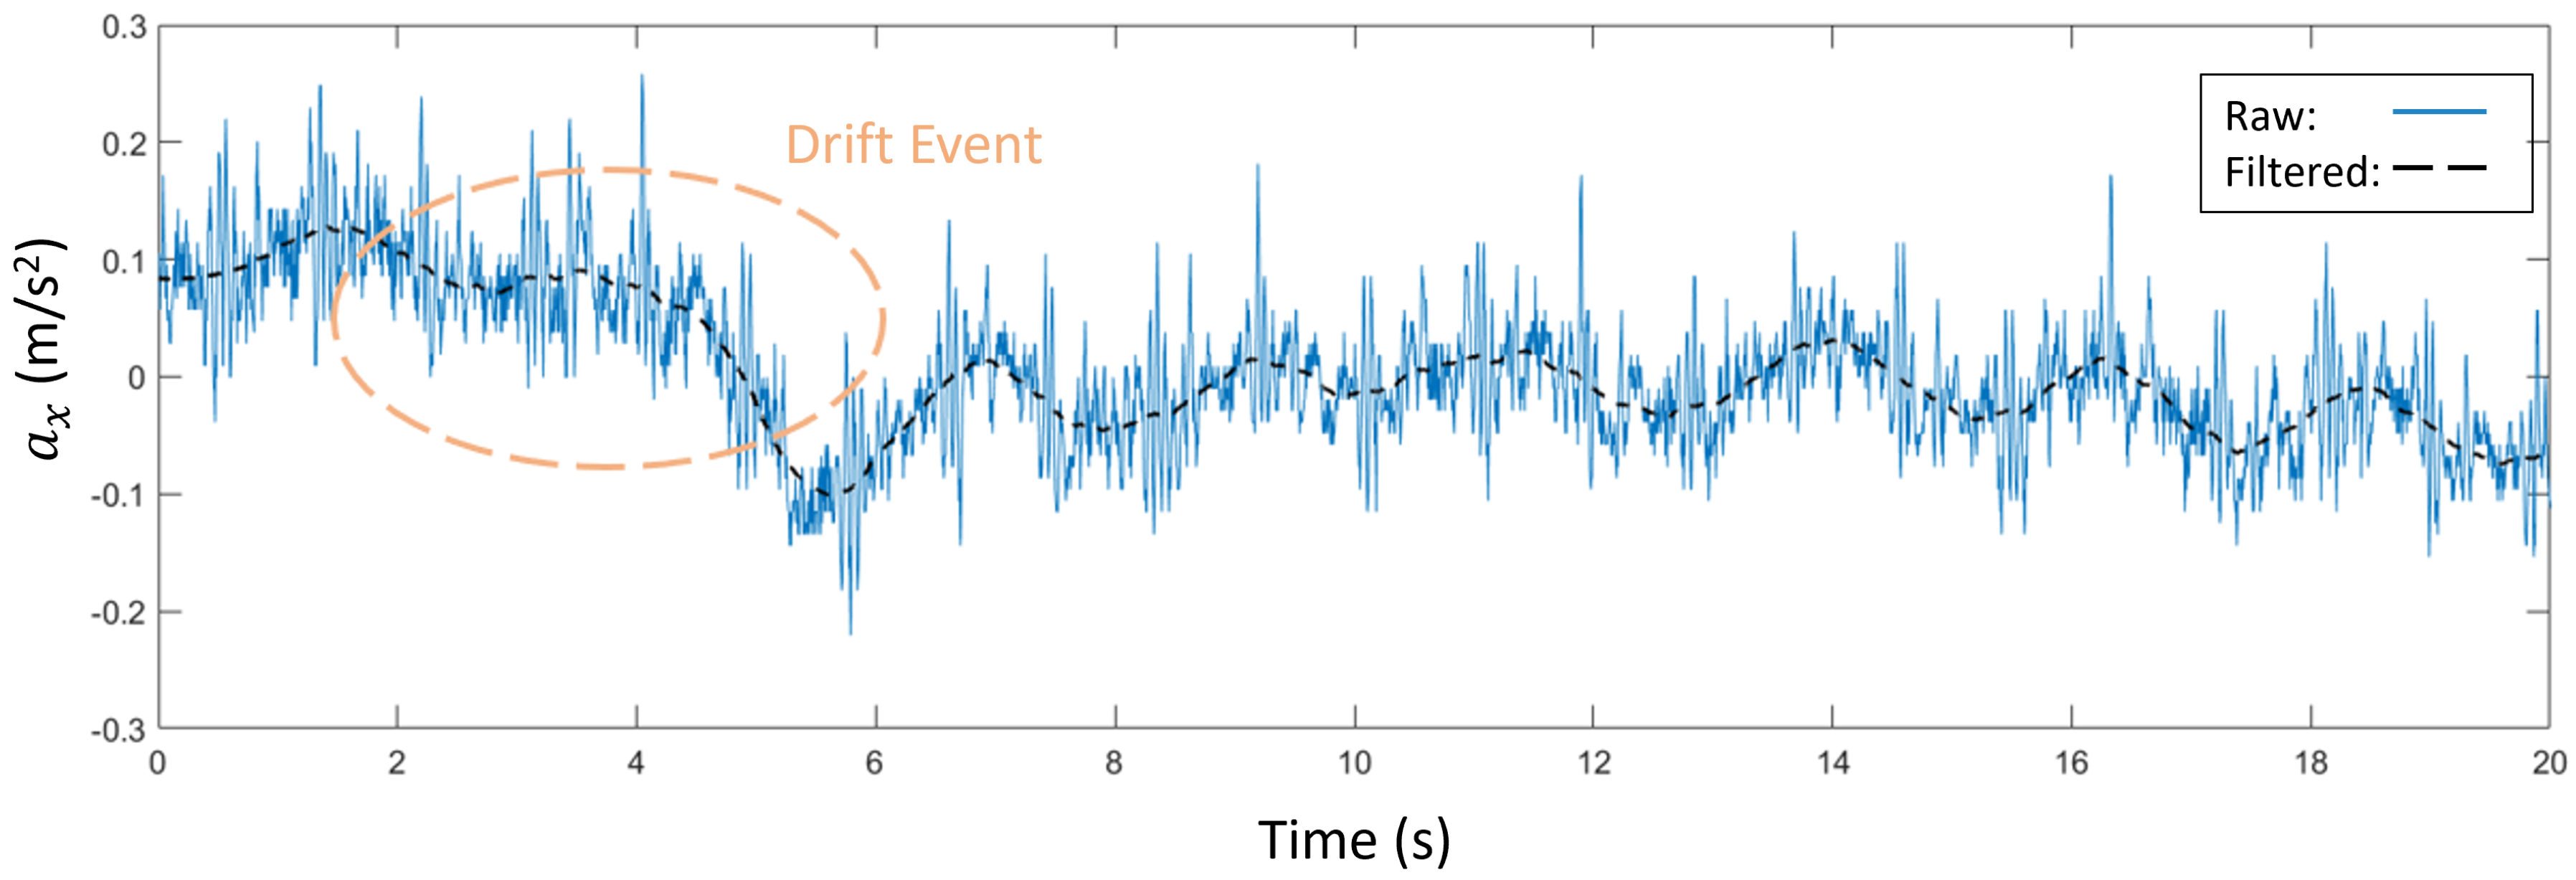
The artifact detection protocol imposed in this phase revealed the presence of drifting artifacts in the acquisitions of positions with vertical orientation (
Figure 2 a). An example of these events, occurred on position
, is showed in
Figure 8 before and after filtering. From the preliminary validation campaign, drifting artifacts appeared on 26% of the acquisitions with vertical orientation. For this reason, positions with horizontal orientation only were carried out in successive acquisition campaign.
Concerning the campaign, the acquisitions were successful for the healthy volunteers. The five positions
,
,
,
and
were recorded for all the cases. The distribution in terms of application usability score, on the basis of the volunteers’ evaluation, is reported in
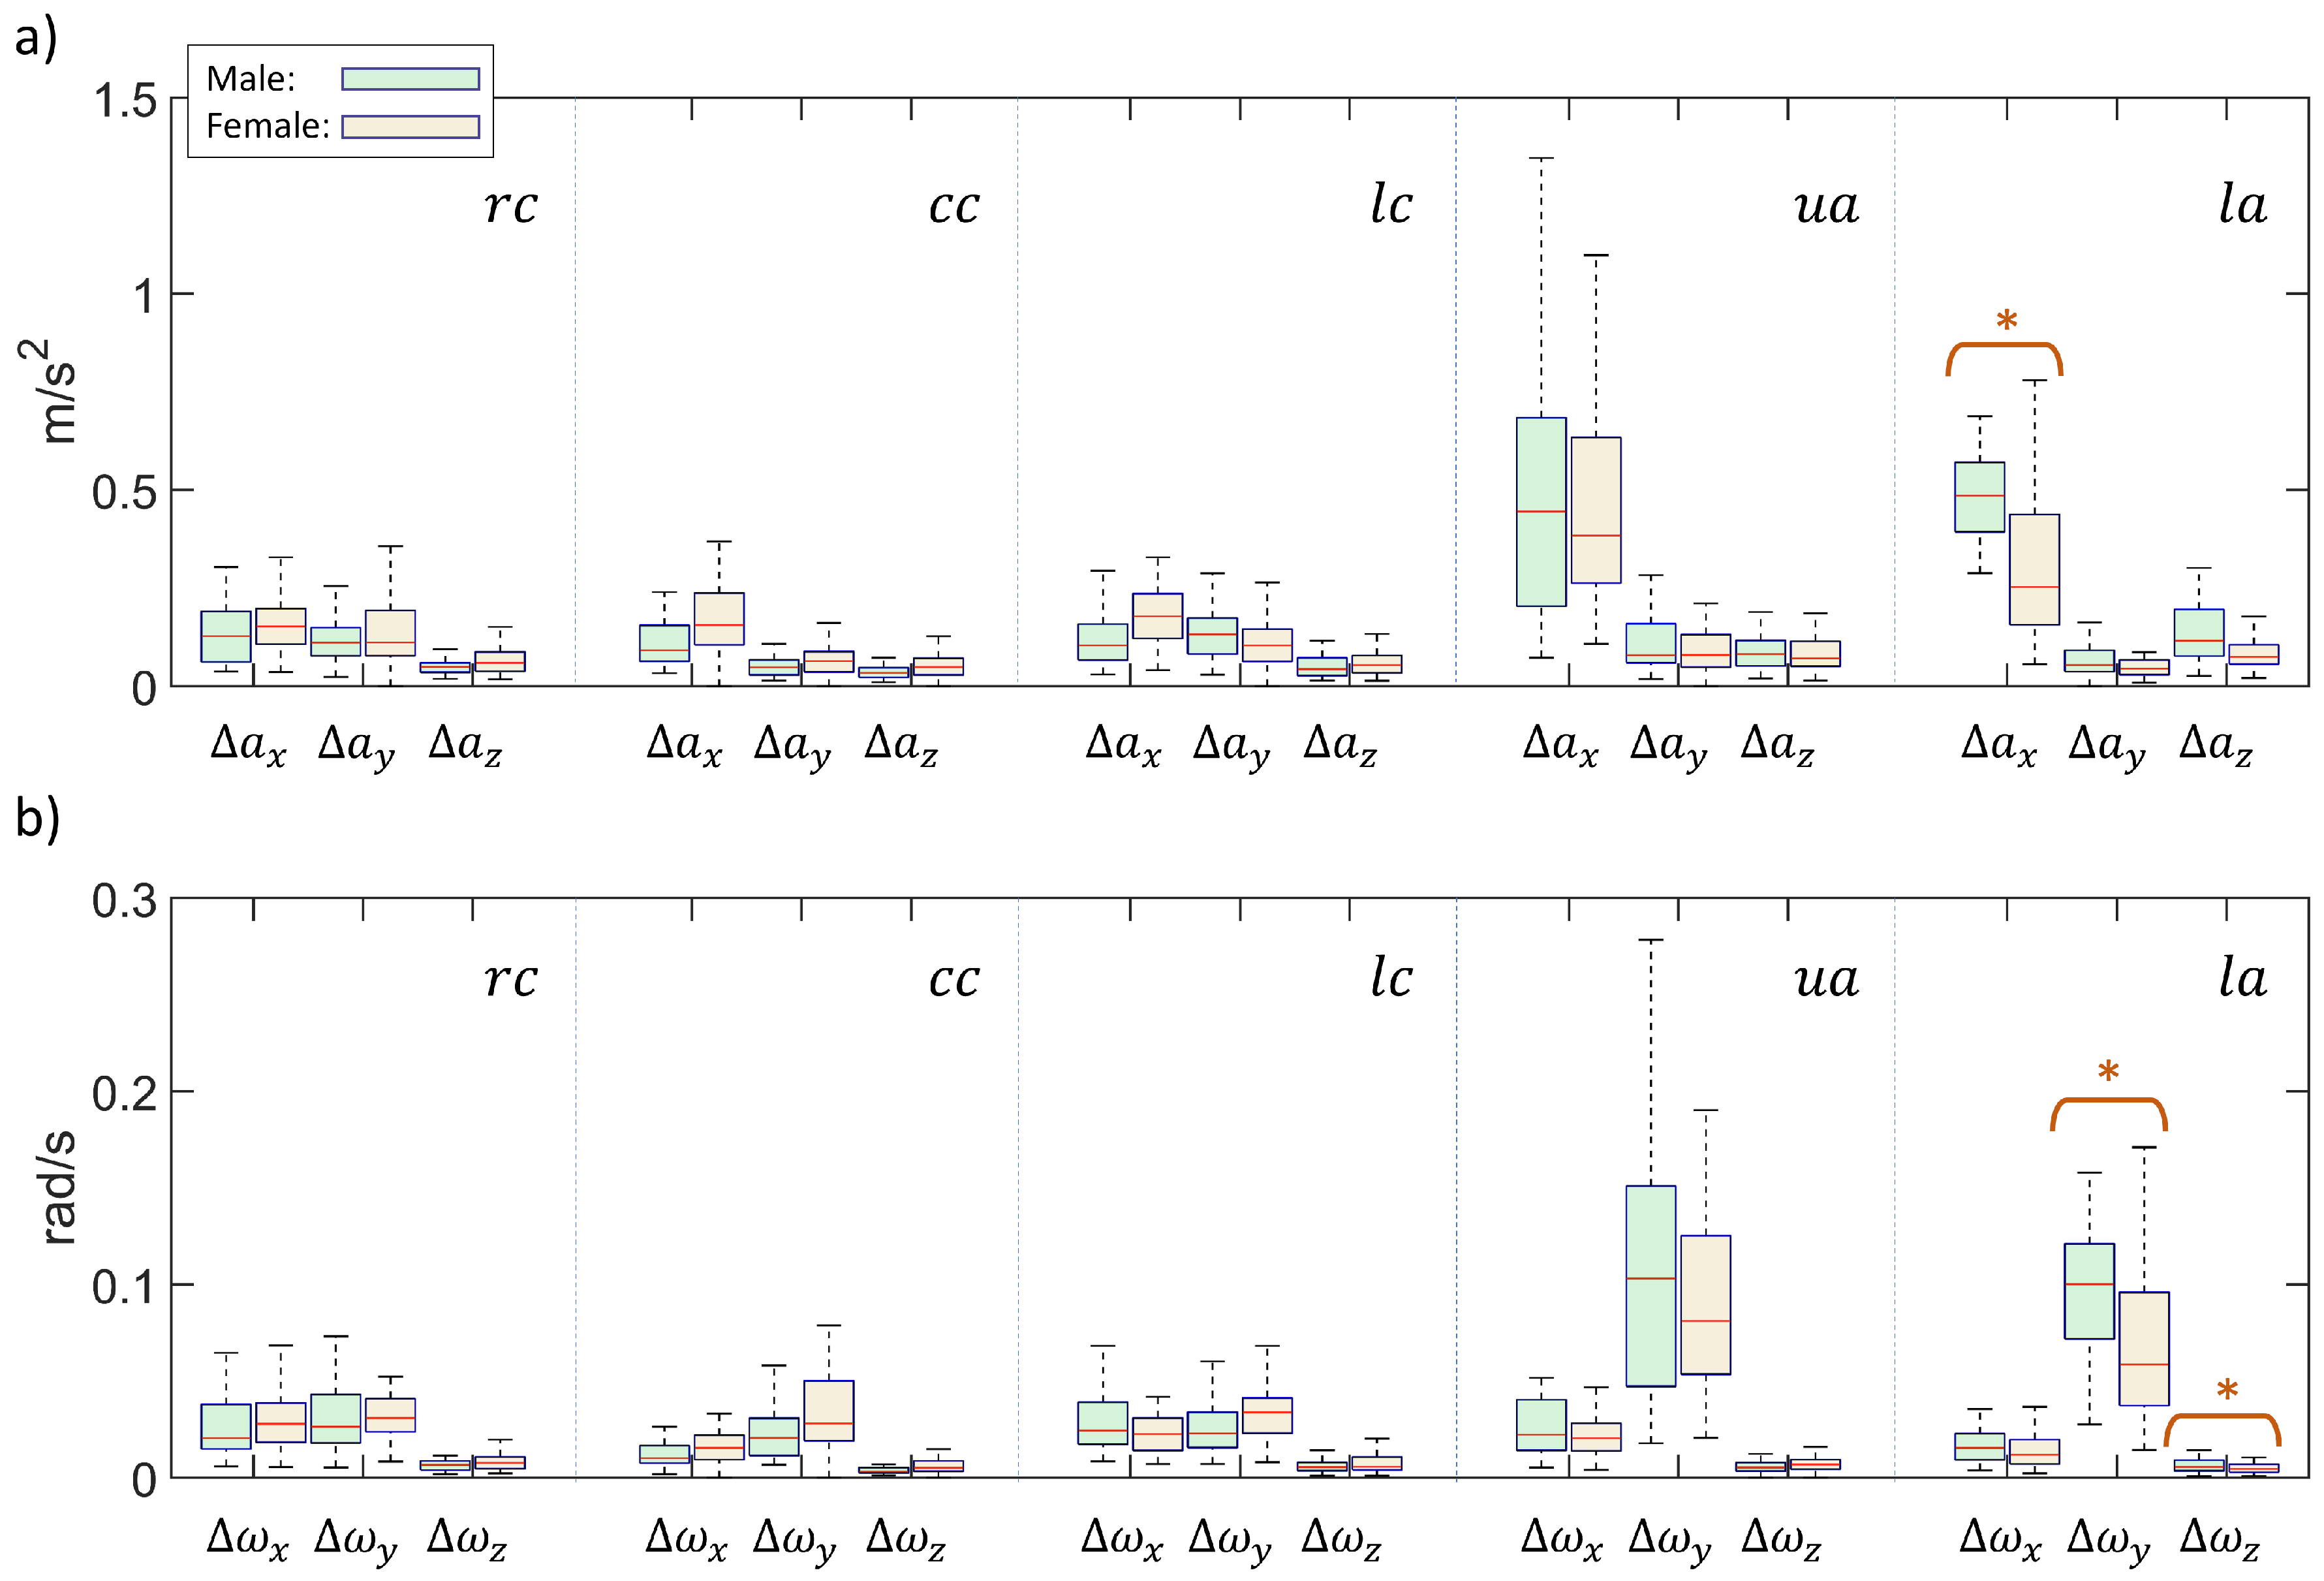
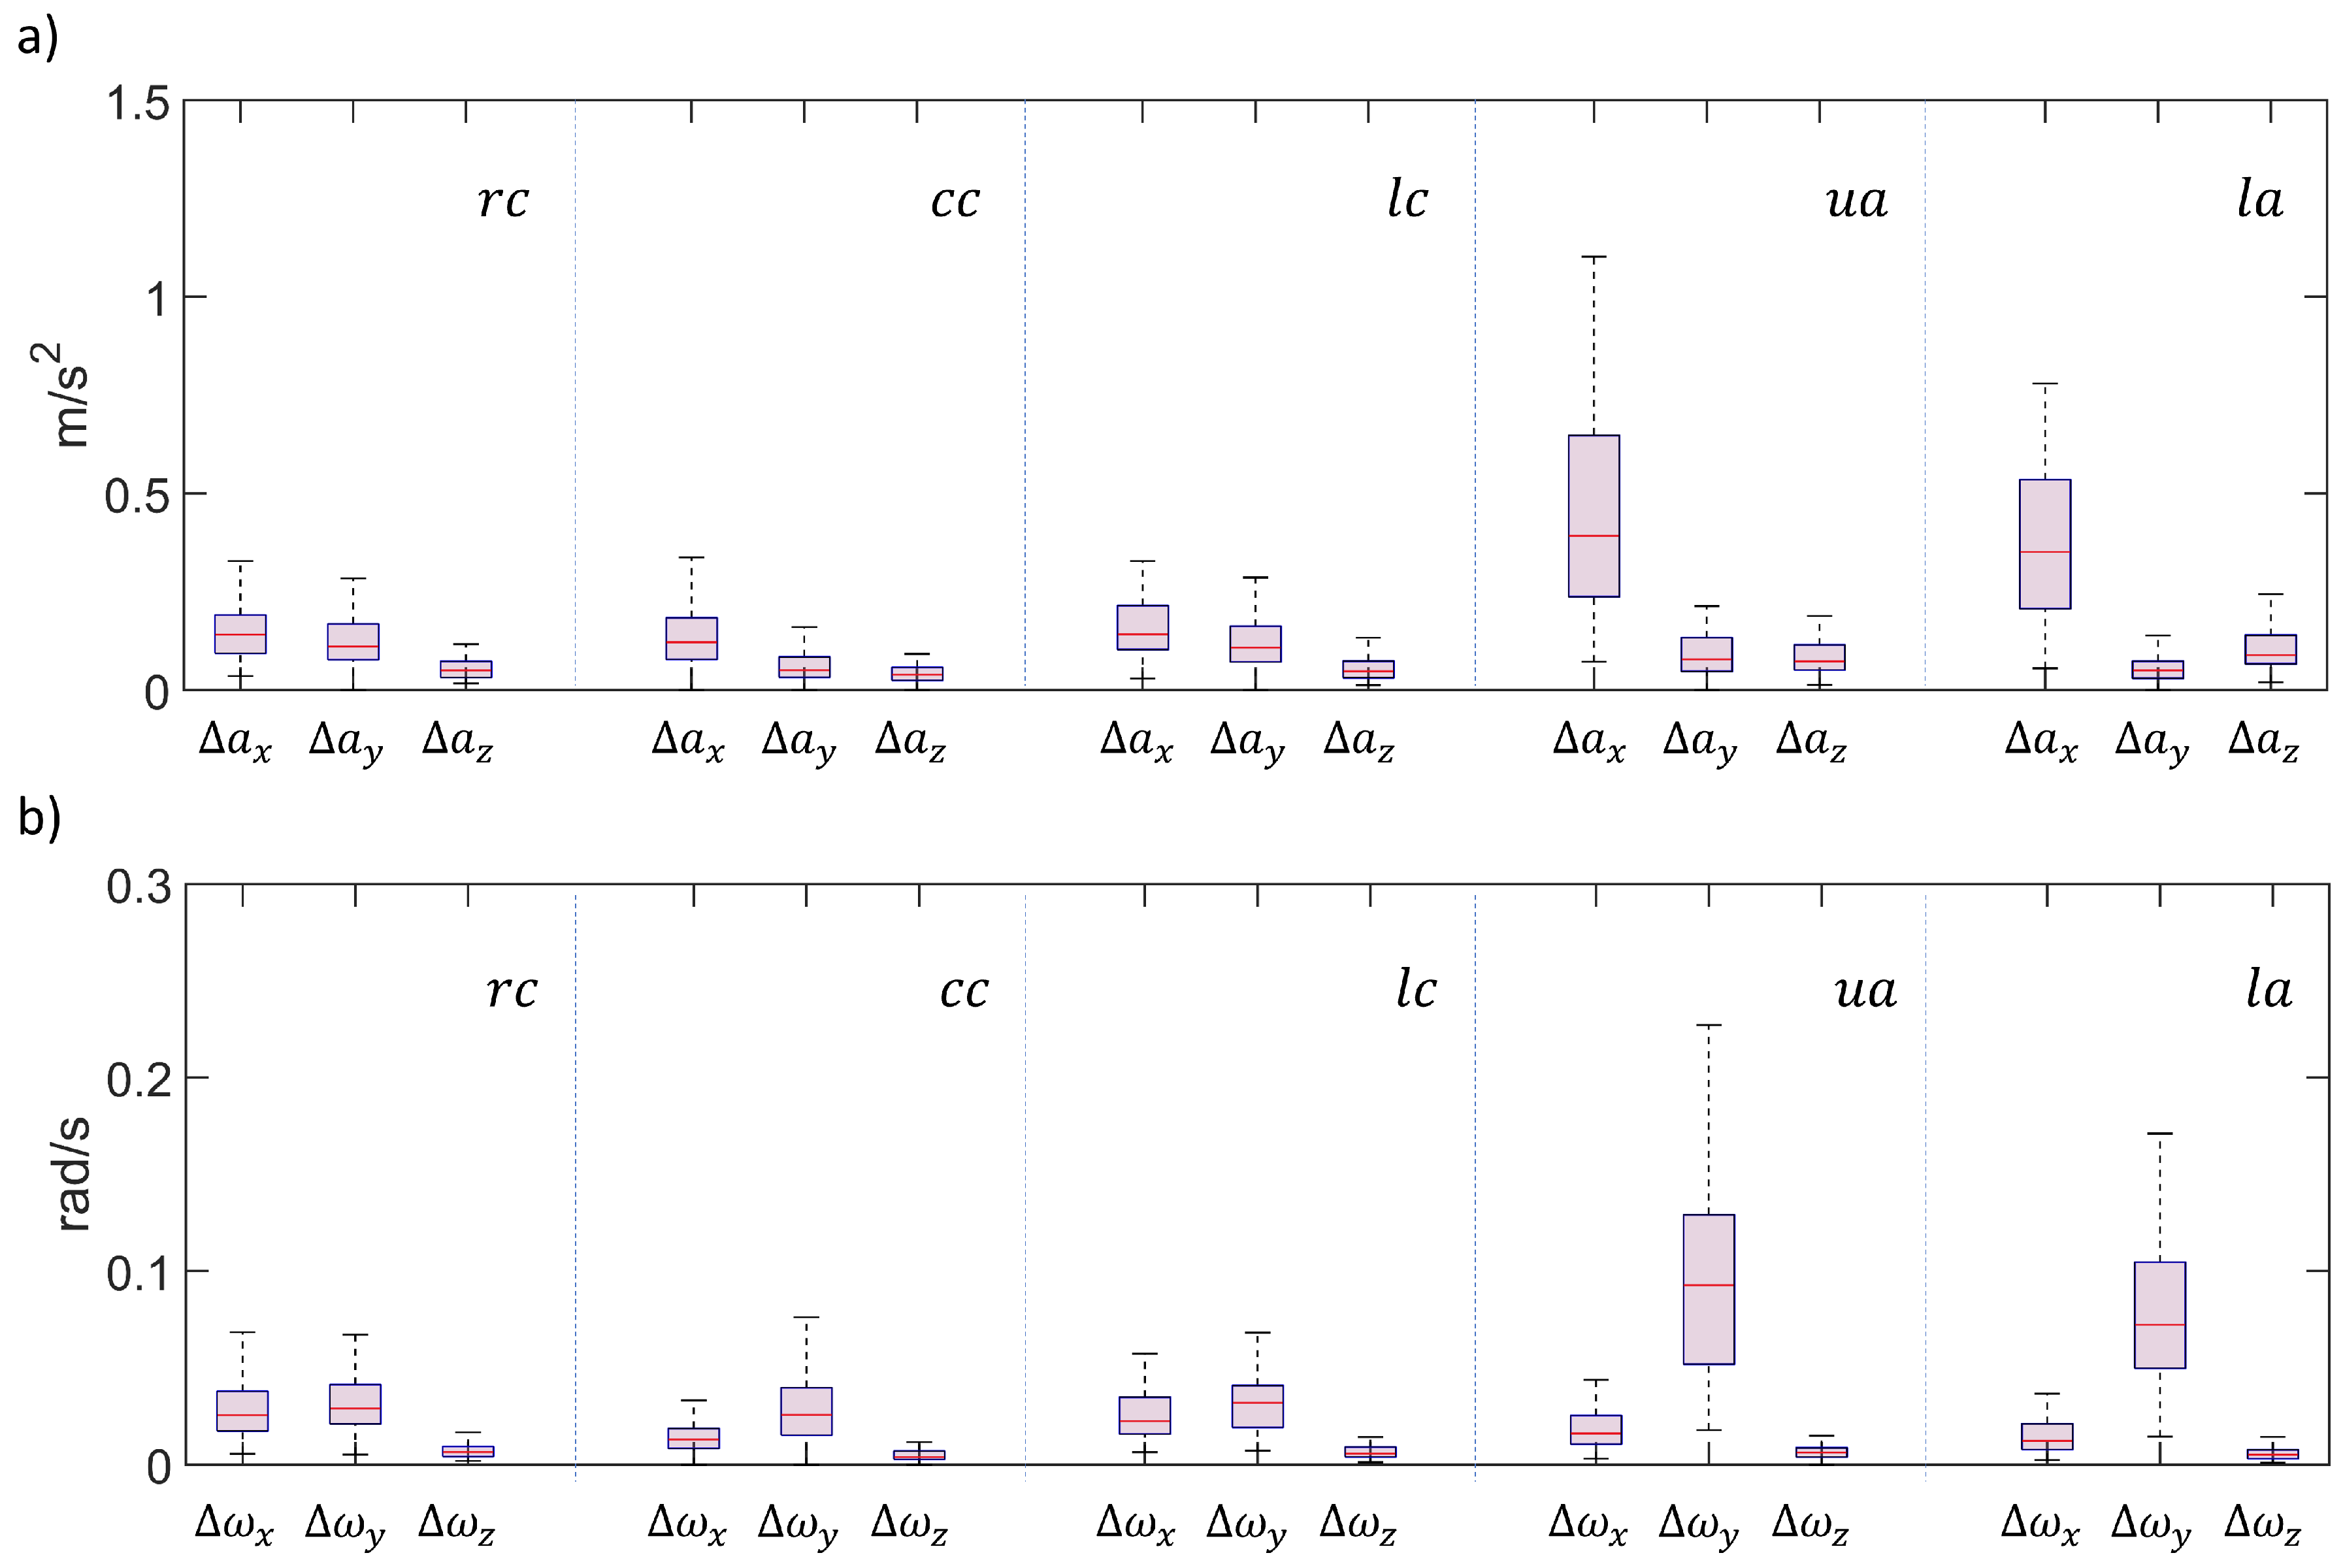
Figure 9, with highlights on the mean ± standard deviation (4.0 ± 0.6). The distributions in terms of ranges of accelerations and gyroscopes are reported in the box plots of
Figure 10 and
Figure 11. In particular, the data were subdivided in males and females volunteers in
Figure 10, while the overall distributions are presented in
Figure 11. In
Figure 10 the components exhibiting a significant difference between male and female populations were highlighted with an asterisk. For both figures, the box plot data were grouped according to smartphone positions.
The results of Kolmogorov-Smirnov tests were reported in terms of over / under threshold
p values. In particular,
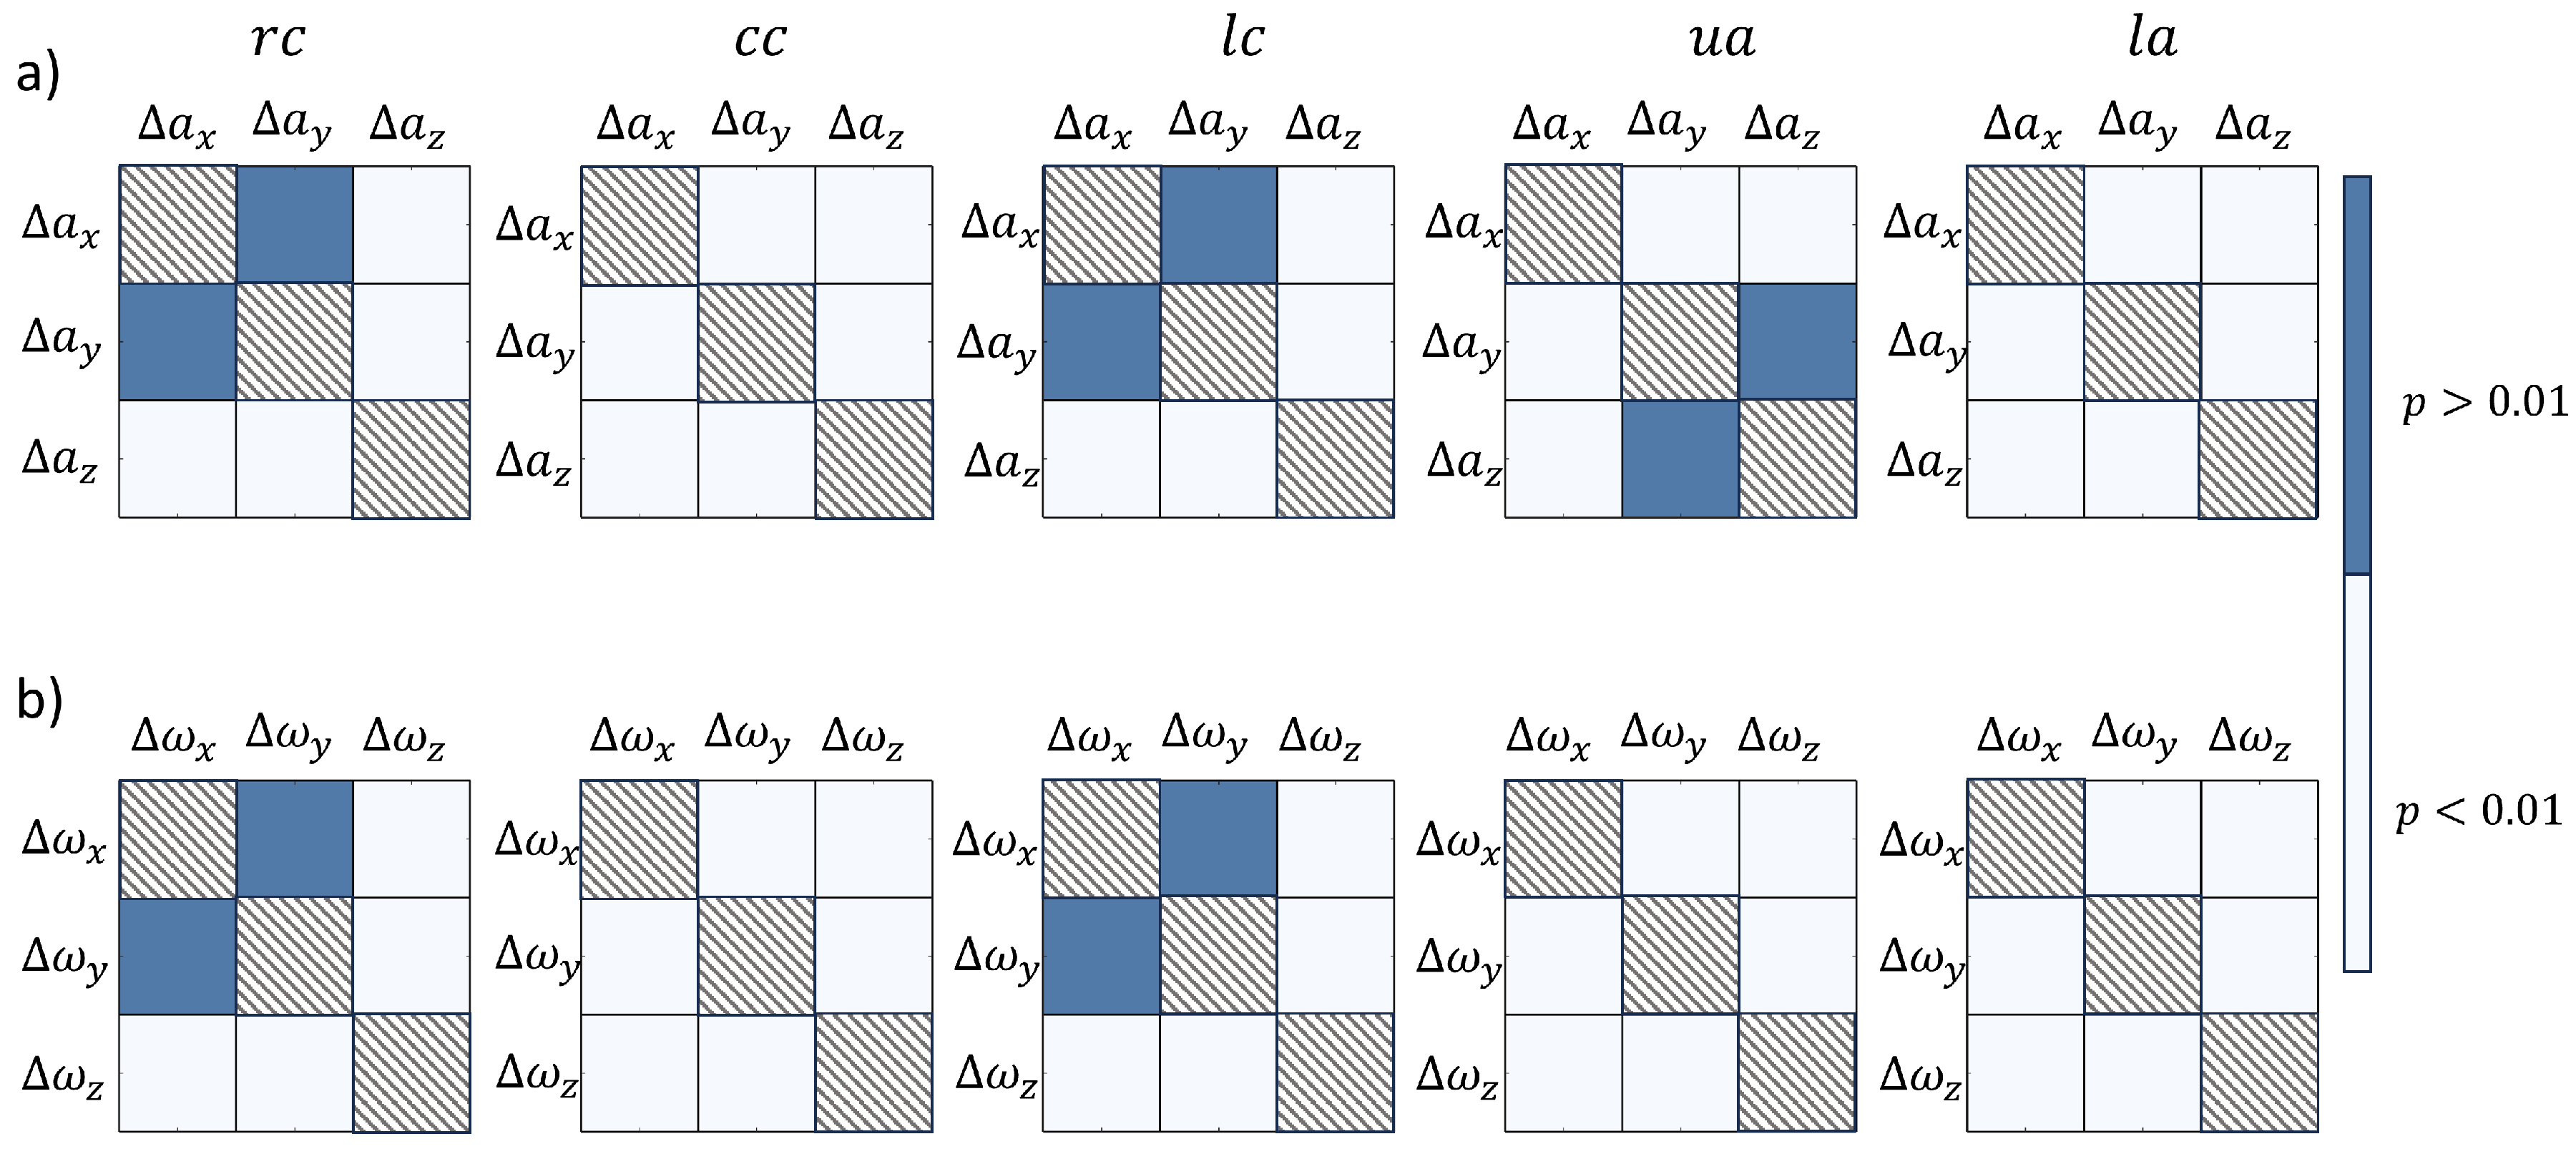
Figure 12 schematizes the
p values to assess the statistical significance of difference between main components of accelerations (
Figure 12 a) and gyroscopes (
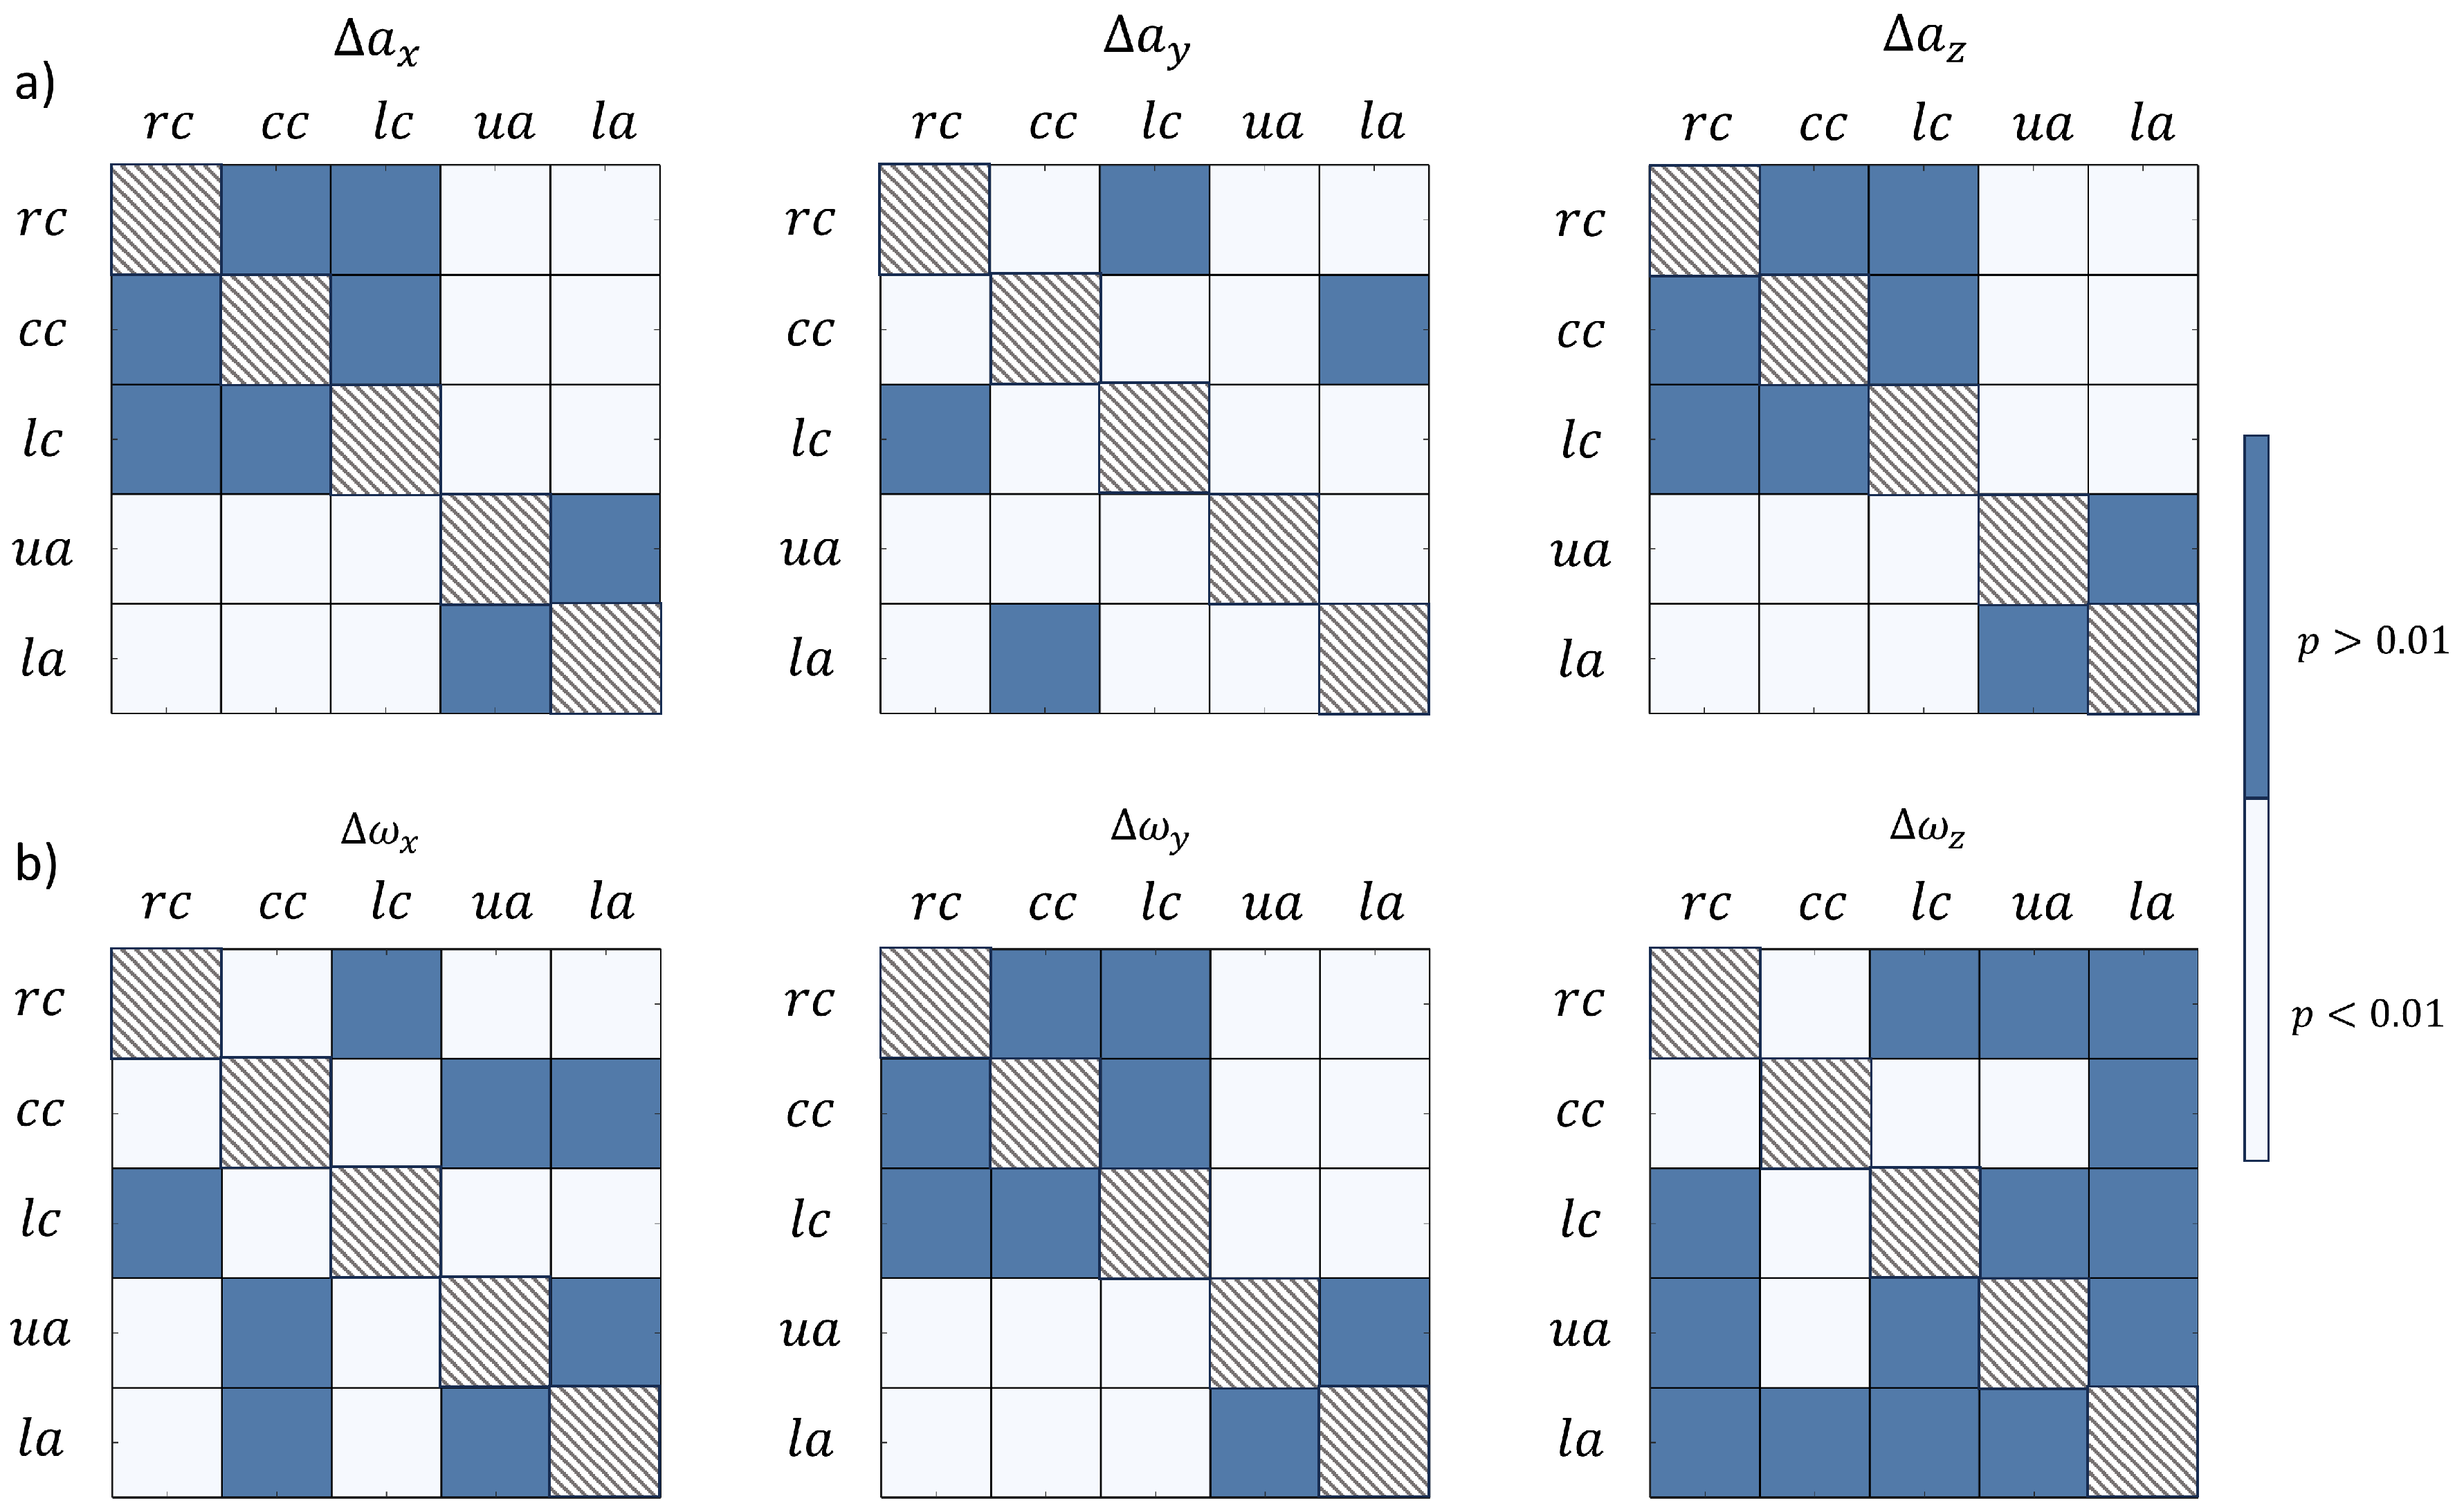
Figure 12 b) vector component ranges. Similarly, the results of statistical significance of the different smartphone positions are summarized in tables of
Figure 13, in terms of accelerations (
Figure 13 a) and gyroscopes (
Figure 13 b) vector component ranges. For all the tables of
Figure 12 and
Figure 13, light squares were used to highlight the statistical significant differences (
).
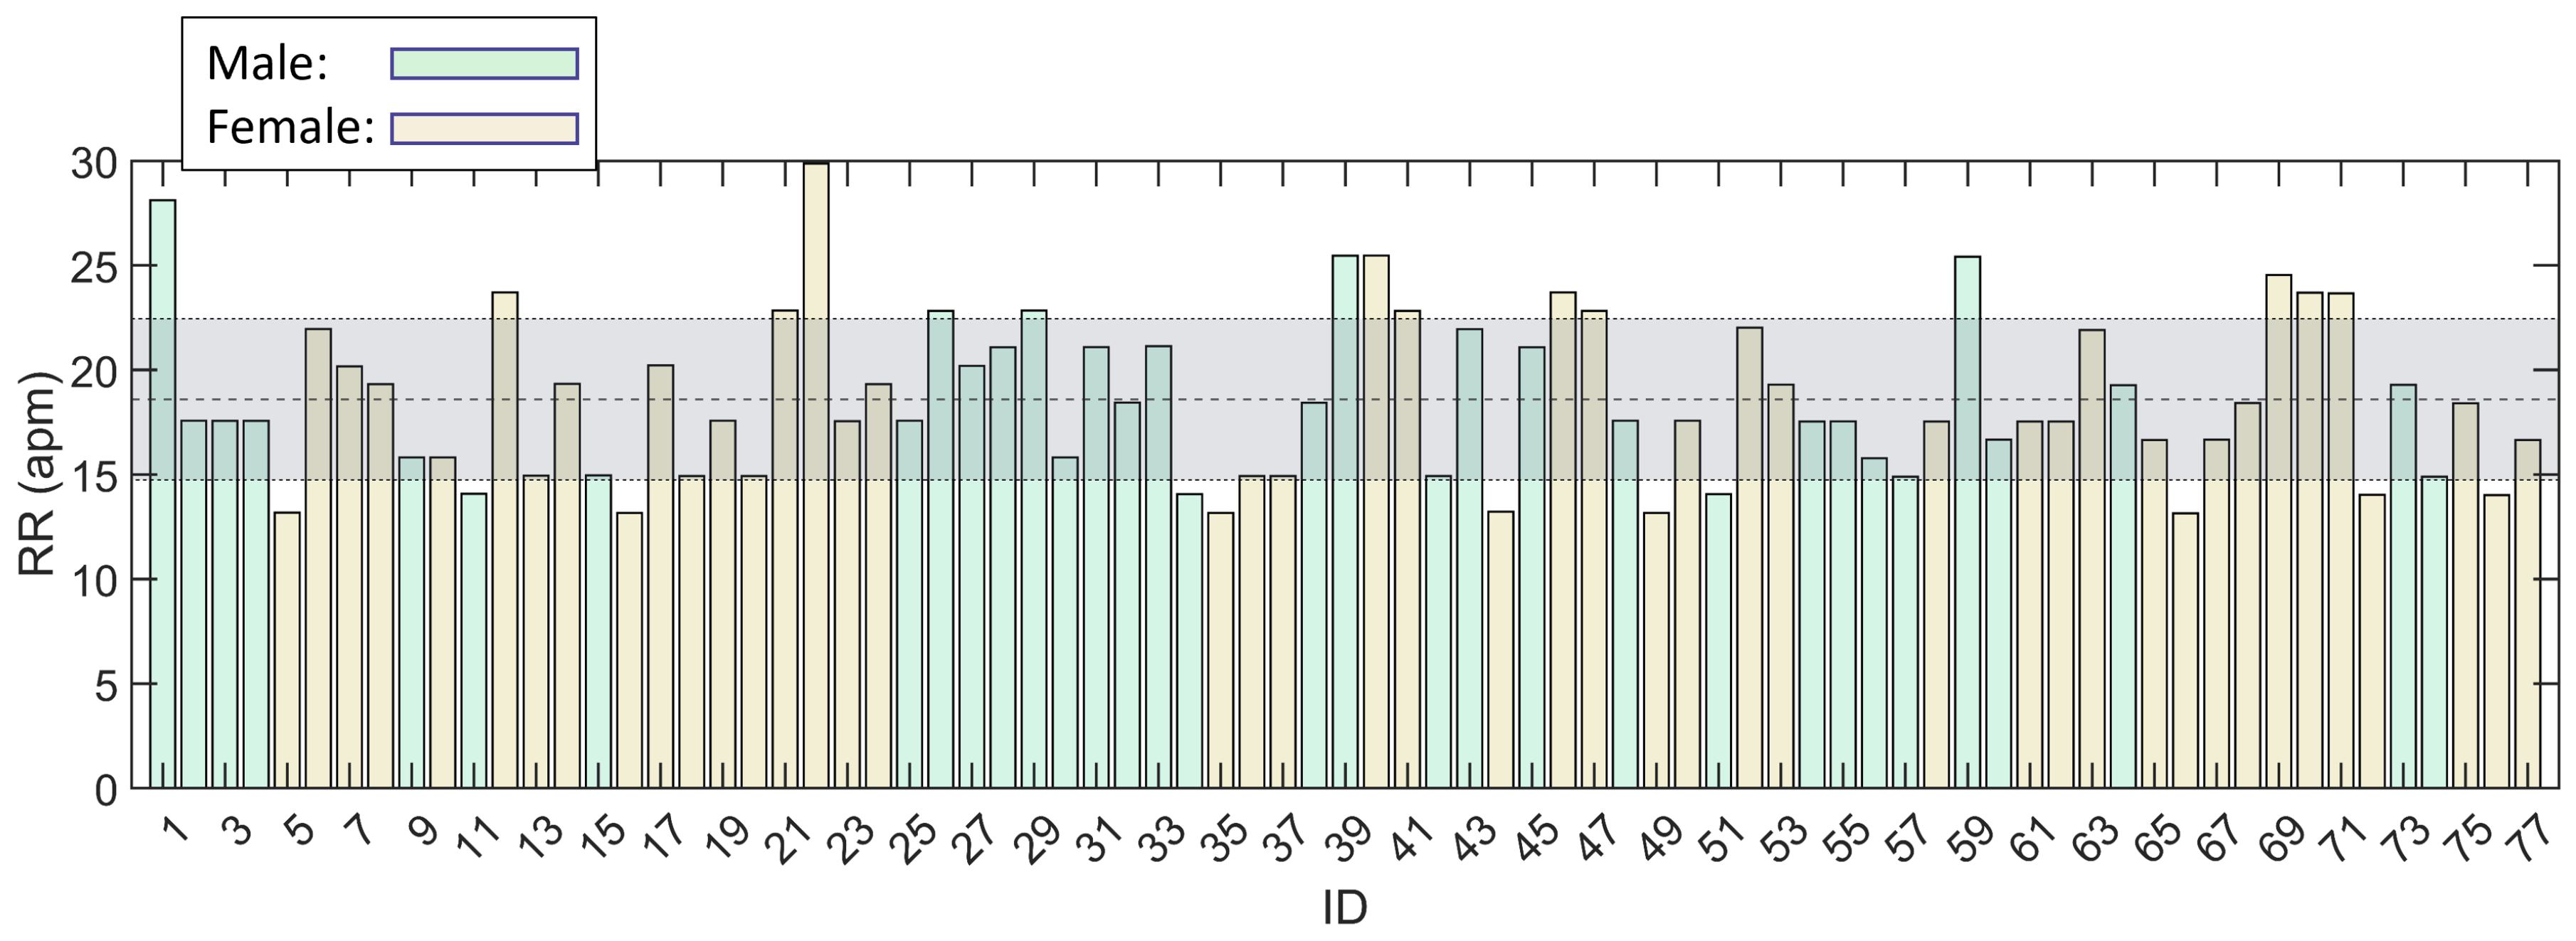
Concerning the RR estimation, the distribution, with values in acts per minute (apm), was reported in
Figure 14 with an highlight on the mean ± standard deviation (23.2 ± 4.8 apm).
4. Discussion
The results presented in the previous section demonstrated the feasibility of the new procedure for respiratory remote monitoring. In particular, it was demonstrated that the novel smartphone-based acquisition method for chest / abdomen respiratory kinematics was suitable for the task, thanks to the validation procedure imposed. A dedicated application was developed with success and the acquisition campaign was carried out on a significant number of volunteer cases. The acquisition campaign revealed significant differences in different terms such as participant sex, vector components and smartphone position.
Concerning the first validation phase, the
and
were successfully calculated for the preliminary population, as reported in
Table 1. The values reported from the different smartphone positions were contained within the 19 - 26 dB range, which is an acceptable range for signal evaluation. The values contained in
Table 1 confirm the feasibility to adopt all the smartphone positions in both orientations to record the respiratory kinematics. The values of
demonstrate the possibility to detect the respiratory kinematics with the proposed procedure. It was observed that smartphone slipping can occur for vertical orientation. The artifact detection process during the validation phase revealed signal drifting phenomena for the 26% of the acquisitions, as reported in the example of
Figure 8. Given the results of the preliminary validation phase, the subsequent acquisition campaign was carried out by adopting horizontal orientations only.
Concerning the acquisition campaign, 77 healthy volunteers were recruited. The scores in terms of application’s usability were satisfactory (
Figure 9), with a mean score of 4.0 ± 0.6 on a scale from 1 to 5.
The distributions with male - female sub populations of
and
were obtained (
Figure 10). The statistical tests concluded that for the
,
,
and
positions, no significant difference exists according to the subject sex. On the contrary, as highlighted in
Figure 10, a
score was produced for
,
and
for the
position. These results denote the statistical difference between male and female subjects for the above cited position. This highlighted aspect results to be in accordance with the different respiratory nature existing between males and females, linked with diaphragm movement, as already reported in literature [
32]. Moreover, the ranges of accelerometer measurements reported in
Figure 10 are in line with values from literature concerning acquisitions in the abdomen area [
33].
The overall distributions of
and
were obtained (
Figure 11). The statistical significance of the different the vector components in the five positions was assessed (
Figure 12). In particular, the
and
positions reveal similar behaviors both in terms of accelerations and angular velocities, with
z components being significantly lower than both
x and
y components. The
and
positions, instead, reveal significant differences between all components for both acceleration and angular velocities, with higher values on the
and
, respectively. At last, the
position exhibits a single dominant component in terms of acceleration (
) and differences between all the different components in terms of angular velocities. These data highlight a relevant concept: lateral chest positions (
and
) exhibited nonnegligible acceleration components and rotations on the chest plane, while the
,
and
usually exhibit a single dominant component, which is in line with the central nature of their location. These data suggest that the respiratory kinematics is more complex at lateral chest level, where multiple degrees of freedom are covered [
27,
28]. In general, the differences emerging from the comparison of the prescribed smartphone positions demonstrate the possibility to detect the several components of the respiratory kinematics, linked with chest and abdomen displacements.
The statistical significance of the different smartphone positions used during the acquisition campaign was assessed (
Figure 13). In particular, it appears that the components acquired on the chest (
,
and
) are always significantly lower than the ones acquired on the abdomen (
and
) for
,
and
components. This aspect underlines the different nature respiration on the basis of the acquisition position, as acceleration ranges suggest an higher excursion in the abdomen area, which is characteristic of normal healthy breathing [
34,
35]. For the
and
components, no significant difference emerged by comparing
and
lateral chest positions and by comparing
and
. This last trend confirms the similar nature of both lateral chest positions, in which the
and
components are not negligible, and the similar nature of
and
, being both central positions for the acquisition. At last, the
, statistical relevant differences emerged from
position only. Nevertheless, it is possible to observe that the
range were always limited in comparison to the other gyroscope components (see also
Figure 11 b) and, for this reason, the differences were not considered relevant.
Finally, the RR was calculated for all the subjects from the signal acquired during the campaign (
Figure 14). The reported mean ± standard deviation values are 18.6 ± 3.8 apm which are contained in the physiological range according to literature [
36].
The presented work exhibits points of limitation and future work opportunities. A direct validation of the acquisition of the respiratory movement via smartphone is still lacking in the presented work. Nevertheless, the feasibility of the acquisition procedure was demonstrated by revealing satisfactory levels of and significant differences in the main accelerometer and angular velocity components. The study did not foresee the adoption of the application for actual remote monitoring, with users without operator supervision. Nevertheless, the application was deemed as satisfactory in terms of usage according to the reported scores. The presented work has the potential to be used to gather a significant volume of data, given the widespread nature of smartphone diffusion. The current work is limited by the involvement of healthy subjects only. It would be interesting in the future to include pathological subjects, with known respiratory diseases or under a post-surgery rehabilitation regime, into the recruitment study.
5. Conclusions
In this manuscript, a new method for the acquisition of respiratory kinematics signal via smartphone was presented. The feasibility of the presented methodology was demonstrated and a total of five smartphone positions, covering both chest and abdomen, was defined. After the validation, an acquisition campaign was carried out with success on healthy subjects population. The gathered data revealed significant differences among the different acquisition positions, with the possibility to distinguish features of the chest and abdomen kinematics during the respiratory acts. The study represents a first step towards a new approach for remote respiratory monitoring based on smartphone acquisitions.
Author Contributions
Conceptualization, S.C., V.G., D.H., S.B.; methodology, E.V., E.G.; software, E.V., E.G., L.M., V.G.; validation, E.V., E.G.; formal analysis, E.V., E.G.; investigation, E.V., E.G., S.C.; resources, E.V., E.G., D.H., L.F., G.B., S.B.; data curation, E.V., E.G., L.M., L.S.; writing—original draft preparation, E.V., E.G.; writing—review and editing, E.V., E.G., S.C., L.M., V.G., L.S.; visualization, E.V., E.G., S.C., V.G.; supervision, S.C., V.G.; project administration, S.C., V.G., L.F., S.B.; funding acquisition, V.G., L.F., S.B. All authors have read and agreed to the published version of the manuscript.
Funding
This research was funded by Bando regionale Ricerca COVID 19 Toscana - Progetto MyBreathingHeart CUP n J64G200038001.
Institutional Review Board Statement
The study was conducted in accordance with the Declaration of Helsinki, and approved by the Ethics Committee of Comitato Etico Regionale per la Sperimentazione Clinica della Regione Toscana Sezione: AREA VASTA NORD OVEST protocol code: 20417_BERTI, date of approval: 24th Feb 2022.
Informed Consent Statement
Informed consent was obtained from all subjects involved in the study.
Data Availability Statement
The data presented in this study are available, on reasonable request, from the corresponding author.
Conflicts of Interest
The authors declare no conflict of interest.
Abbreviations
The following abbreviations are used in this manuscript:
| apm |
acts per minute |
| BLE |
Bluetooth Low Energy |
| BMI |
Body Mass Index |
|
chest central |
| IMU |
Inertial Movement Unit |
|
lower abdomen |
|
left chest |
|
right chest |
| RR |
Respiratory Rate |
|
Signal to Noise Ratio |
|
upper abdomen |
References
- Mohammed, K.; Zaidan, A.; Zaidan, B.; Albahri, O.S.; Alsalem, M.; Albahri, A.S.; Hadi, A.; Hashim, M. Real-time remote-health monitoring systems: a review on patients prioritisation for multiple-chronic diseases, taxonomy analysis, concerns and solution procedure. Journal of medical systems 2019, 43, 1–21. [Google Scholar] [CrossRef] [PubMed]
- Dawes, A.; Lin, A.; Varghese, C.; Russell, M.; Lin, A. Mobile health technology for remote home monitoring after surgery: a meta-analysis. British Journal of Surgery 2021, 108, 1304–1314. [Google Scholar] [CrossRef] [PubMed]
- Shaji, S.; Pathinarupothi, R.K.; Rangan, E.S.; Menon, K.U.; Ramesh, M.V. Heart lung health monitor: Remote at-home patient surveillance for pandemic management. 2021 IEEE Global Humanitarian Technology Conference (GHTC). IEEE, 2021, pp. 127–130.
- Vedaei, S.S.; Fotovvat, A.; Mohebbian, M.R.; Rahman, G.M.; Wahid, K.A.; Babyn, P.; Marateb, H.R.; Mansourian, M.; Sami, R. COVID-SAFE: An IoT-based system for automated health monitoring and surveillance in post-pandemic life. IEEE access 2020, 8, 188538–188551. [Google Scholar] [CrossRef] [PubMed]
- Magnocavallo, M.; Vetta, G.; Bernardini, A.; Piro, A.; Mei, M.C.; Di Iorio, M.; Mariani, M.V.; Della Rocca, D.G.; Severino, P.; Quaglione, R.; others. Impact of COVID-19 pandemic on cardiac electronic device management and role of remote monitoring. Cardiac Electrophysiology Clinics 2022, 14, 125–131. [Google Scholar] [CrossRef] [PubMed]
- Strik, M.; Caillol, T.; Ramirez, F.D.; Abu-Alrub, S.; Marchand, H.; Welte, N.; Ritter, P.; Haïssaguerre, M.; Ploux, S.; Bordachar, P. Validating QT-interval measurement using the Apple Watch ECG to enable remote monitoring during the COVID-19 pandemic. Circulation 2020, 142, 416–418. [Google Scholar] [CrossRef] [PubMed]
- Alugubelli, N.; Abuissa, H.; Roka, A. Wearable Devices for Remote Monitoring of Heart Rate and Heart Rate Variability—What We Know and What Is Coming. Sensors 2022, 22, 8903. [Google Scholar] [CrossRef] [PubMed]
- Turakhia, M.P.; Desai, M.; Hedlin, H.; Rajmane, A.; Talati, N.; Ferris, T.; Desai, S.; Nag, D.; Patel, M.; Kowey, P.; others. Rationale and design of a large-scale, app-based study to identify cardiac arrhythmias using a smartwatch: The Apple Heart Study. American heart journal 2019, 207, 66–75. [Google Scholar] [CrossRef]
- Golinelli, D.; Boetto, E.; Carullo, G.; Nuzzolese, A.G.; Landini, M.P.; Fantini, M.P. Adoption of digital technologies in health care during the COVID-19 pandemic: systematic review of early scientific literature. Journal of medical Internet research 2020, 22, e22280. [Google Scholar] [CrossRef]
- Beduk, T.; Beduk, D.; Hasan, M.R.; Guler Celik, E.; Kosel, J.; Narang, J.; Salama, K.N.; Timur, S. Smartphone-based multiplexed biosensing tools for health monitoring. Biosensors 2022, 12, 583. [Google Scholar] [CrossRef]
- Alzughaibi, A.A.; Ibrahim, A.M.; Na, Y.; El-Tawil, S.; Eltawil, A.M. Community-Based Multi-Sensory Structural Health Monitoring System: A Smartphone Accelerometer and Camera Fusion Approach. IEEE Sensors Journal 2021, 21, 20539–20551. [Google Scholar] [CrossRef]
- Brown, C.; Chauhan, J.; Grammenos, A.; Han, J.; Hasthanasombat, A.; Spathis, D.; Xia, T.; Cicuta, P.; Mascolo, C. Exploring automatic diagnosis of COVID-19 from crowdsourced respiratory sound data. Proceedings of the 26th ACM SIGKDD international conference on knowledge discovery & data mining, 2020, pp. 3474–3484.
- Kvapilova, L.; Boza, V.; Dubec, P.; Majernik, M.; Bogar, J.; Jamison, J.; Goldsack, J.C.; Kimmel, D.J.; Karlin, D.R. Continuous sound collection using smartphones and machine learning to measure cough. Digital biomarkers 2020, 3, 166–175. [Google Scholar]
- Nascimento, L.M.S.d.; Bonfati, L.V.; Freitas, M.L.B.; Mendes Junior, J.J.A.; Siqueira, H.V.; Stevan Jr, S.L. Sensors and systems for physical rehabilitation and health monitoring—A review. Sensors 2020, 20, 4063. [Google Scholar] [CrossRef] [PubMed]
- Halloran, S.; Tang, L.; Guan, Y.; Shi, J.Q.; Eyre, J. Remote monitoring of stroke patients’ rehabilitation using wearable accelerometers. Proceedings of the 2019 ACM International Symposium on Wearable Computers, 2019, pp. 72–77.
- Aliverti, A.; Lacca, D.; LoMauro, A. Quantitative Analysis by 3D Graphics of Thoraco-Abdominal Surface Shape and Breathing Motion. Frontiers in Bioengineering and Biotechnology 2022, 10, 910499. [Google Scholar] [CrossRef]
- Bianchi, R.; Gigliotti, F.; Romagnoli, I.; Lanini, B.; Castellani, C.; Binazzi, B.; Stendardi, L.; Grazzini, M.; Scano, G. Patterns of chest wall kinematics during volitional pursed-lip breathing in COPD at rest. Respiratory medicine 2007, 101, 1412–1418. [Google Scholar] [CrossRef]
- Takashima, S.; Nozoe, M.; Mase, K.; Kouyama, Y.; Matsushita, K.; Ando, H. Effects of posture on chest-wall configuration and motion during tidal breathing in normal men. Journal of physical therapy science 2017, 29, 29–34. [Google Scholar] [CrossRef] [PubMed]
- Tukanova, K.; Papi, E.; Jamel, S.; Hanna, G.B.; McGregor, A.H.; Markar, S.R. Assessment of chest wall movement following thoracotomy: a systematic review. Journal of Thoracic Disease 2020, 12, 1031. [Google Scholar] [CrossRef]
- Grimby, G.; Fugl-Meyer, A.R.; Blomstrand, A. Partitioning of the contributions of rib cage and abdomen to ventilation in ankylosing spondylitis. Thorax 1974, 29, 179–184. [Google Scholar] [CrossRef]
- Lunardi, A.C.; Miranda, C.S.; Silva, K.M.; Cecconello, I.; Carvalho, C.R. Weakness of expiratory muscles and pulmonary complications in malnourished patients undergoing upper abdominal surgery. Respirology 2012, 17, 108–113. [Google Scholar] [CrossRef]
- Kristjánsdóttir, Á.; Ragnarsdóttir, M.; Hannesson, P.; Beck, H.J.; Torfason, B. Respiratory movements are altered three months and one year following cardiac surgery. Scandinavian Cardiovascular Journal 2004, 38, 98–103. [Google Scholar] [CrossRef]
- Monaco, V.; Giustinoni, C.; Ciapetti, T.; Maselli, A.; Stefanini, C. Assessing Respiratory Activity by Using IMUs: Modeling and Validation. Sensors 2022, 22, 2185. [Google Scholar] [CrossRef]
- Massaroni, C.; Nicolò, A.; Lo Presti, D.; Sacchetti, M.; Silvestri, S.; Schena, E. Contact-based methods for measuring respiratory rate. Sensors 2019, 19, 908. [Google Scholar] [CrossRef] [PubMed]
- De la Fuente, C.; Weinstein, A.; Guzman-Venegas, R.; Arenas, J.; Cartes, J.; Soto, M.; Carpes, F.P. Use of accelerometers for automatic regional chest movement recognition during tidal breathing in healthy subjects. Journal of Electromyography and Kinesiology 2019, 47, 105–112. [Google Scholar] [CrossRef]
- Ladjal, H.; Shariat, B.; Azencot, J.; Beuve, M. Appropriate biomechanics and kinematics modeling of the respiratory system: Human diaphragm and thorax. 2013 IEEE/RSJ International Conference on Intelligent Robots and Systems. IEEE, 2013, pp. 2004–2009.
- Torres-Tamayo, N.; García-Martínez, D.; Lois Zlolniski, S.; Torres-Sánchez, I.; García-Río, F.; Bastir, M. 3D analysis of sexual dimorphism in size, shape and breathing kinematics of human lungs. Journal of anatomy 2018, 232, 227–237. [Google Scholar] [CrossRef] [PubMed]
- Shaw, B.S.; Shaw, I. Pulmonary function and abdominal and thoracic kinematic changes following aerobic and inspiratory resistive diaphragmatic breathing training in asthmatics. Lung 2011, 189, 131–139. [Google Scholar] [CrossRef] [PubMed]
- Yang, L.; Qu, S.; Zhang, Y.; Zhang, G.; Wang, H.; Yang, B.; Xu, C.; Dai, M.; Cao, X. Removing clinical motion artifacts during ventilation monitoring with electrical impedance tomography: introduction of methodology and validation with simulation and patient data. Frontiers in medicine 2022, 9, 817590. [Google Scholar] [CrossRef] [PubMed]
- Simone, L.; Miglior, L.; Gervasi, V.; Moroni, L.; Vignali, E.; Gasparotti, E.; Celi, S. Early Screening of Cardiorespiratory Diseases Through Smartphone IMU Sensors and Bidirectional LSTM. Available at SSRN 4676194.
- Candan, B.; Soken, H.E. Robust attitude estimation using IMU-only measurements. IEEE Transactions on Instrumentation and Measurement 2021, 70, 1–9. [Google Scholar] [CrossRef]
- Romei, M.; Mauro, A.L.; D’angelo, M.; Turconi, A.; Bresolin, N.; Pedotti, A.; Aliverti, A. Effects of gender and posture on thoraco-abdominal kinematics during quiet breathing in healthy adults. Respiratory physiology & neurobiology 2010, 172, 184–191. [Google Scholar]
- Erfianto, B.; Rizal, A. IMU-Based Respiratory Signal Processing Using Cascade Complementary Filter Method. Journal of Sensors 2022, 2022. [Google Scholar] [CrossRef]
- Sikora, M.; Mikołajczyk, R.; Łakomy, O.; Karpiński, J.; Żebrowska, A.; Kostorz-Nosal, S.; Jastrzębski, D. Influence of the breathing pattern on the pulmonary function of endurance-trained athletes. Scientific Reports 2024, 14, 1113. [Google Scholar] [CrossRef]
- Kiesel, K.; Rhodes, T.; Mueller, J.; Waninger, A.; Butler, R. Development of a screening protocol to identify individuals with dysfunctional breathing. International journal of sports physical therapy 2017, 12, 774. [Google Scholar] [CrossRef]
- Russo, M.A.; Santarelli, D.M.; O’Rourke, D. The physiological effects of slow breathing in the healthy human. Breathe 2017, 13, 298–309. [Google Scholar] [CrossRef] [PubMed]
Figure 1.
Summary of rib cage kinematics during respiratory act, including diaphragm compression.
Figure 1.
Summary of rib cage kinematics during respiratory act, including diaphragm compression.
Figure 2.
Prescribed positions for smartphone acquisition with vertical (a) and horizontal (b) orientation.
Figure 2.
Prescribed positions for smartphone acquisition with vertical (a) and horizontal (b) orientation.
Figure 3.
Application server - client workflow for data sharing.
Figure 3.
Application server - client workflow for data sharing.
Figure 4.
Application interfaces examples: position selection (a), user identification (b), positioning exemplificative video reproduction (c) and acquisition interface (d).
Figure 4.
Application interfaces examples: position selection (a), user identification (b), positioning exemplificative video reproduction (c) and acquisition interface (d).
Figure 5.
Example of a single respiratory cycle identification.
Figure 5.
Example of a single respiratory cycle identification.
Figure 6.
Local reference system with rotation matrices on a respiratory act.
Figure 6.
Local reference system with rotation matrices on a respiratory act.
Figure 7.
Distribution in terms of age (a) and BMI (b) for the population of volunteers selected for the acquisition campaign. The mean ± standard deviation range was highlighted.
Figure 7.
Distribution in terms of age (a) and BMI (b) for the population of volunteers selected for the acquisition campaign. The mean ± standard deviation range was highlighted.
Figure 8.
Example of drifting event in signal during preliminary acquisition campaign, on position and vertical orientation.
Figure 8.
Example of drifting event in signal during preliminary acquisition campaign, on position and vertical orientation.
Figure 9.
Distribution in terms of usability score for the population of volunteers selected for the acquisition campaign. The mean ± standard deviation range was highlighted.
Figure 9.
Distribution in terms of usability score for the population of volunteers selected for the acquisition campaign. The mean ± standard deviation range was highlighted.
Figure 10.
Box plots for male / female populations in terms of acceleration ranges (a) and angular speed ranges (b), grouped according to different smartphone positions. Highlights on significant differences () were reported with an asterisk.
Figure 10.
Box plots for male / female populations in terms of acceleration ranges (a) and angular speed ranges (b), grouped according to different smartphone positions. Highlights on significant differences () were reported with an asterisk.
Figure 11.
Box plots for overall population in terms of acceleration ranges (a) and angular speed ranges (b), grouped according to different smartphone positions.
Figure 11.
Box plots for overall population in terms of acceleration ranges (a) and angular speed ranges (b), grouped according to different smartphone positions.
Figure 12.
Tables of p-values from Kolmogorov-Smirnov tests to assess statistical significance of signal vector components in terms of (a) and (b).
Figure 12.
Tables of p-values from Kolmogorov-Smirnov tests to assess statistical significance of signal vector components in terms of (a) and (b).
Figure 13.
Tables of p-values from Kolmogorov-Smirnov tests to assess statistical significance of smartphone position in terms of (a) and (b).
Figure 13.
Tables of p-values from Kolmogorov-Smirnov tests to assess statistical significance of smartphone position in terms of (a) and (b).
Figure 14.
Distribution in terms of RR for the population of volunteers selected for the acquisition campaign. The mean ± standard deviation range was highlighted.
Figure 14.
Distribution in terms of RR for the population of volunteers selected for the acquisition campaign. The mean ± standard deviation range was highlighted.
Table 1.
values from the validation phase in the ten prescribed smartphone configurations (five positions and two orientations).
Table 1.
values from the validation phase in the ten prescribed smartphone configurations (five positions and two orientations).
| Smartphone Positions |
|
|
| Vertical orientation |
|
19 dB |
18 dB |
|
26 dB |
25 dB |
|
23 dB |
20 dB |
|
26 dB |
25 dB |
|
23 dB |
22 dB |
| Horizontal orientation |
|
20 dB |
23 dB |
|
25 dB |
26 dB |
|
22 dB |
21 dB |
|
25 dB |
25 dB |
|
26 dB |
25 dB |
|
Disclaimer/Publisher’s Note: The statements, opinions and data contained in all publications are solely those of the individual author(s) and contributor(s) and not of MDPI and/or the editor(s). MDPI and/or the editor(s) disclaim responsibility for any injury to people or property resulting from any ideas, methods, instructions or products referred to in the content. |
© 2020 by the authors. Licensee MDPI, Basel, Switzerland. This article is an open access article distributed under the terms and conditions of the Creative Commons Attribution (CC BY) license (https://creativecommons.org/licenses/by/4.0/).

