Submitted:
13 February 2024
Posted:
14 February 2024
You are already at the latest version
Abstract
Keywords:
1. Introduction
2. Materials and Methods
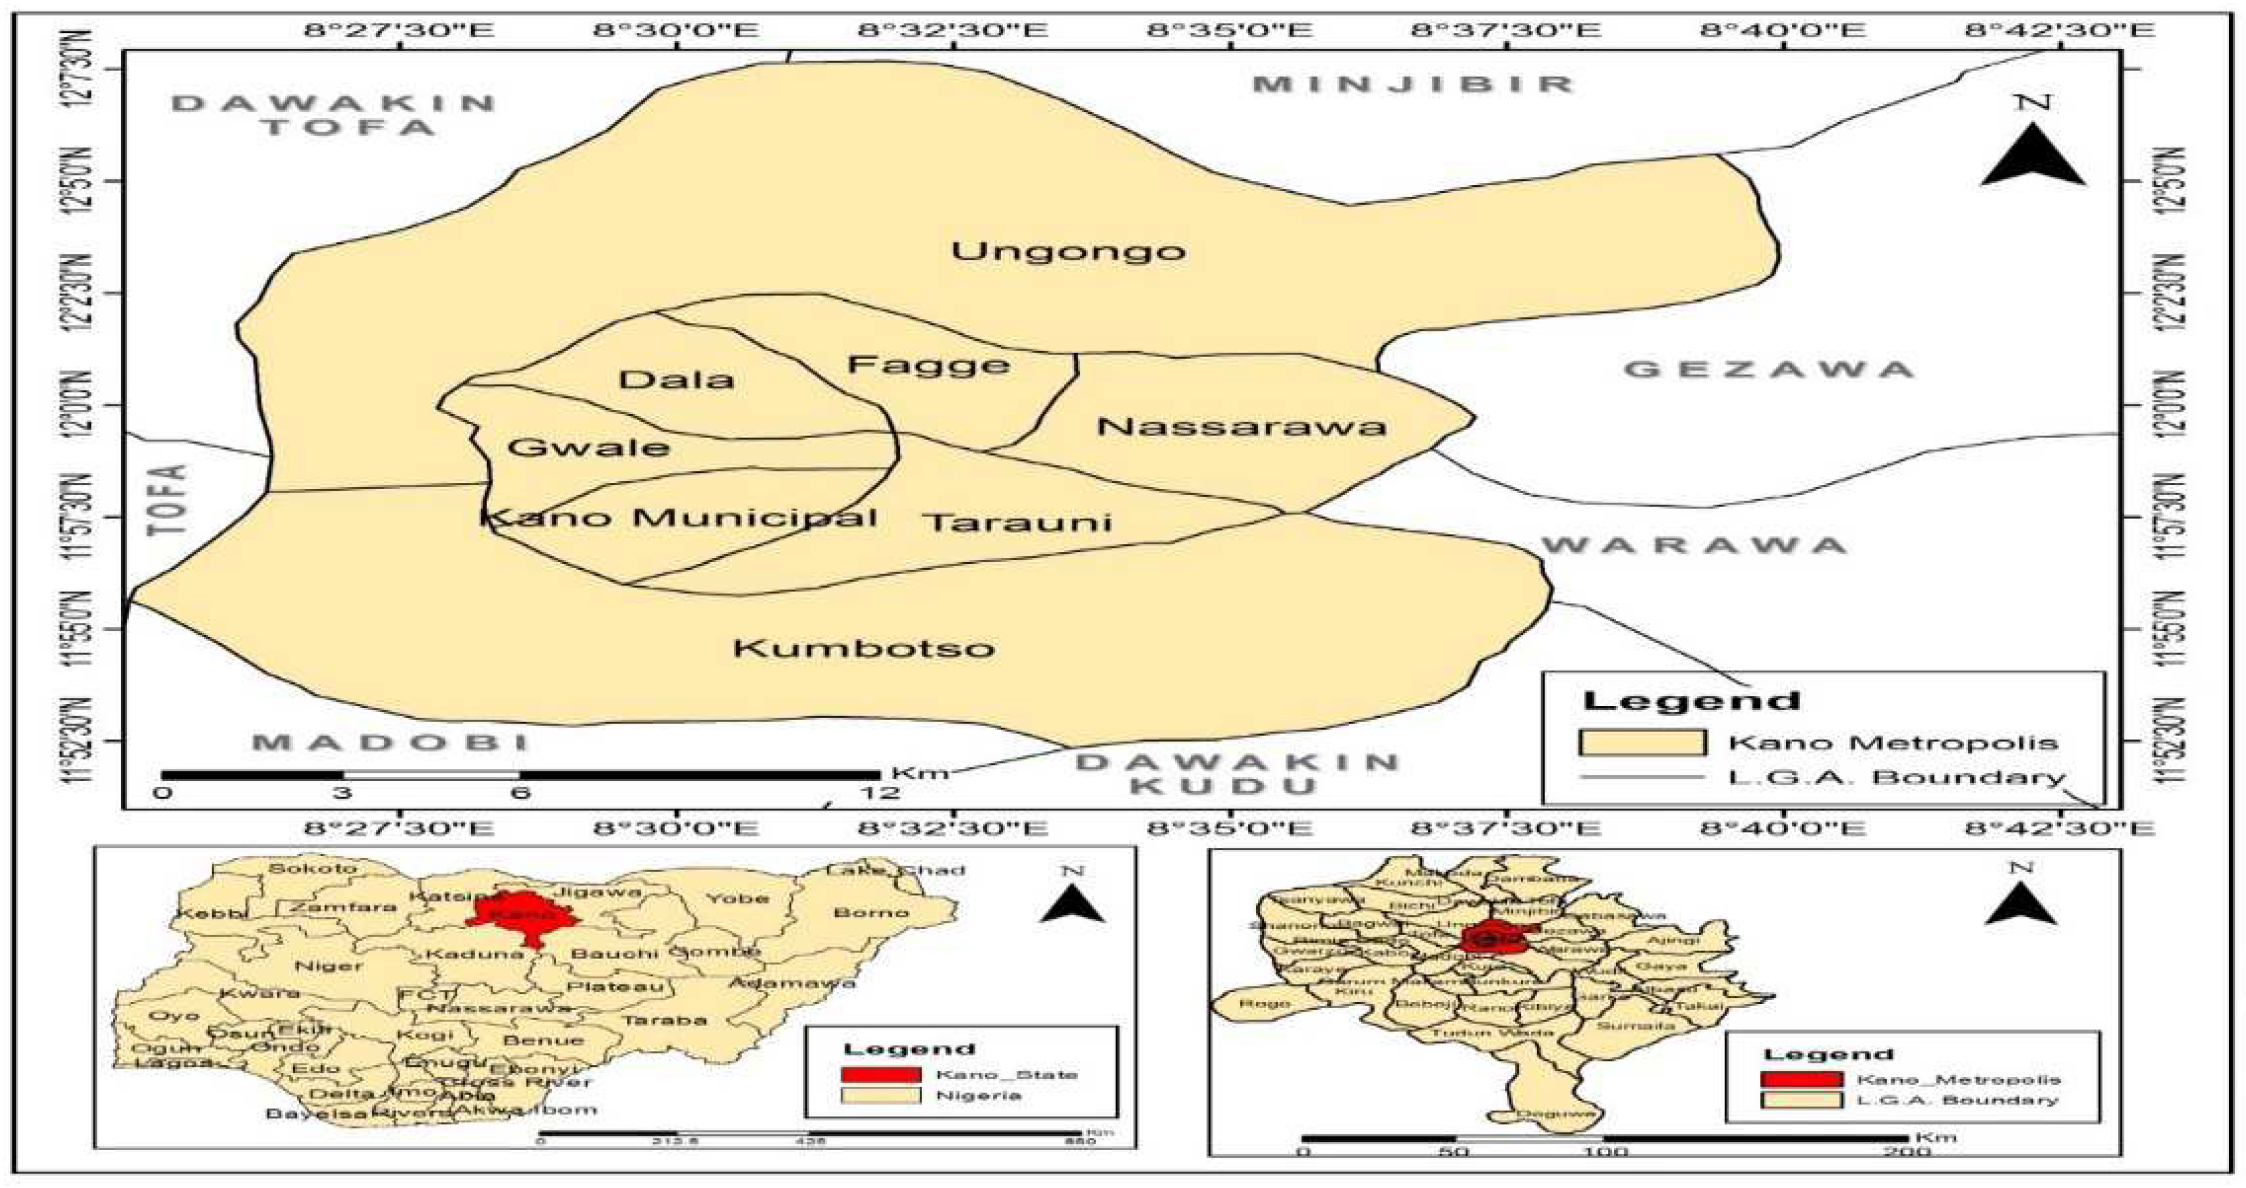
2.1. The Study Area
2.2. Determination of Flood Hazard
2.3. Determination of Social Vulnerability


 ) are the weights. Finally, the three components that is E, S, LoR were aggregated into final composite indicator of social vulnerability using Equation (8) [32].

3.2. Determination of Flood Risk
3. Results
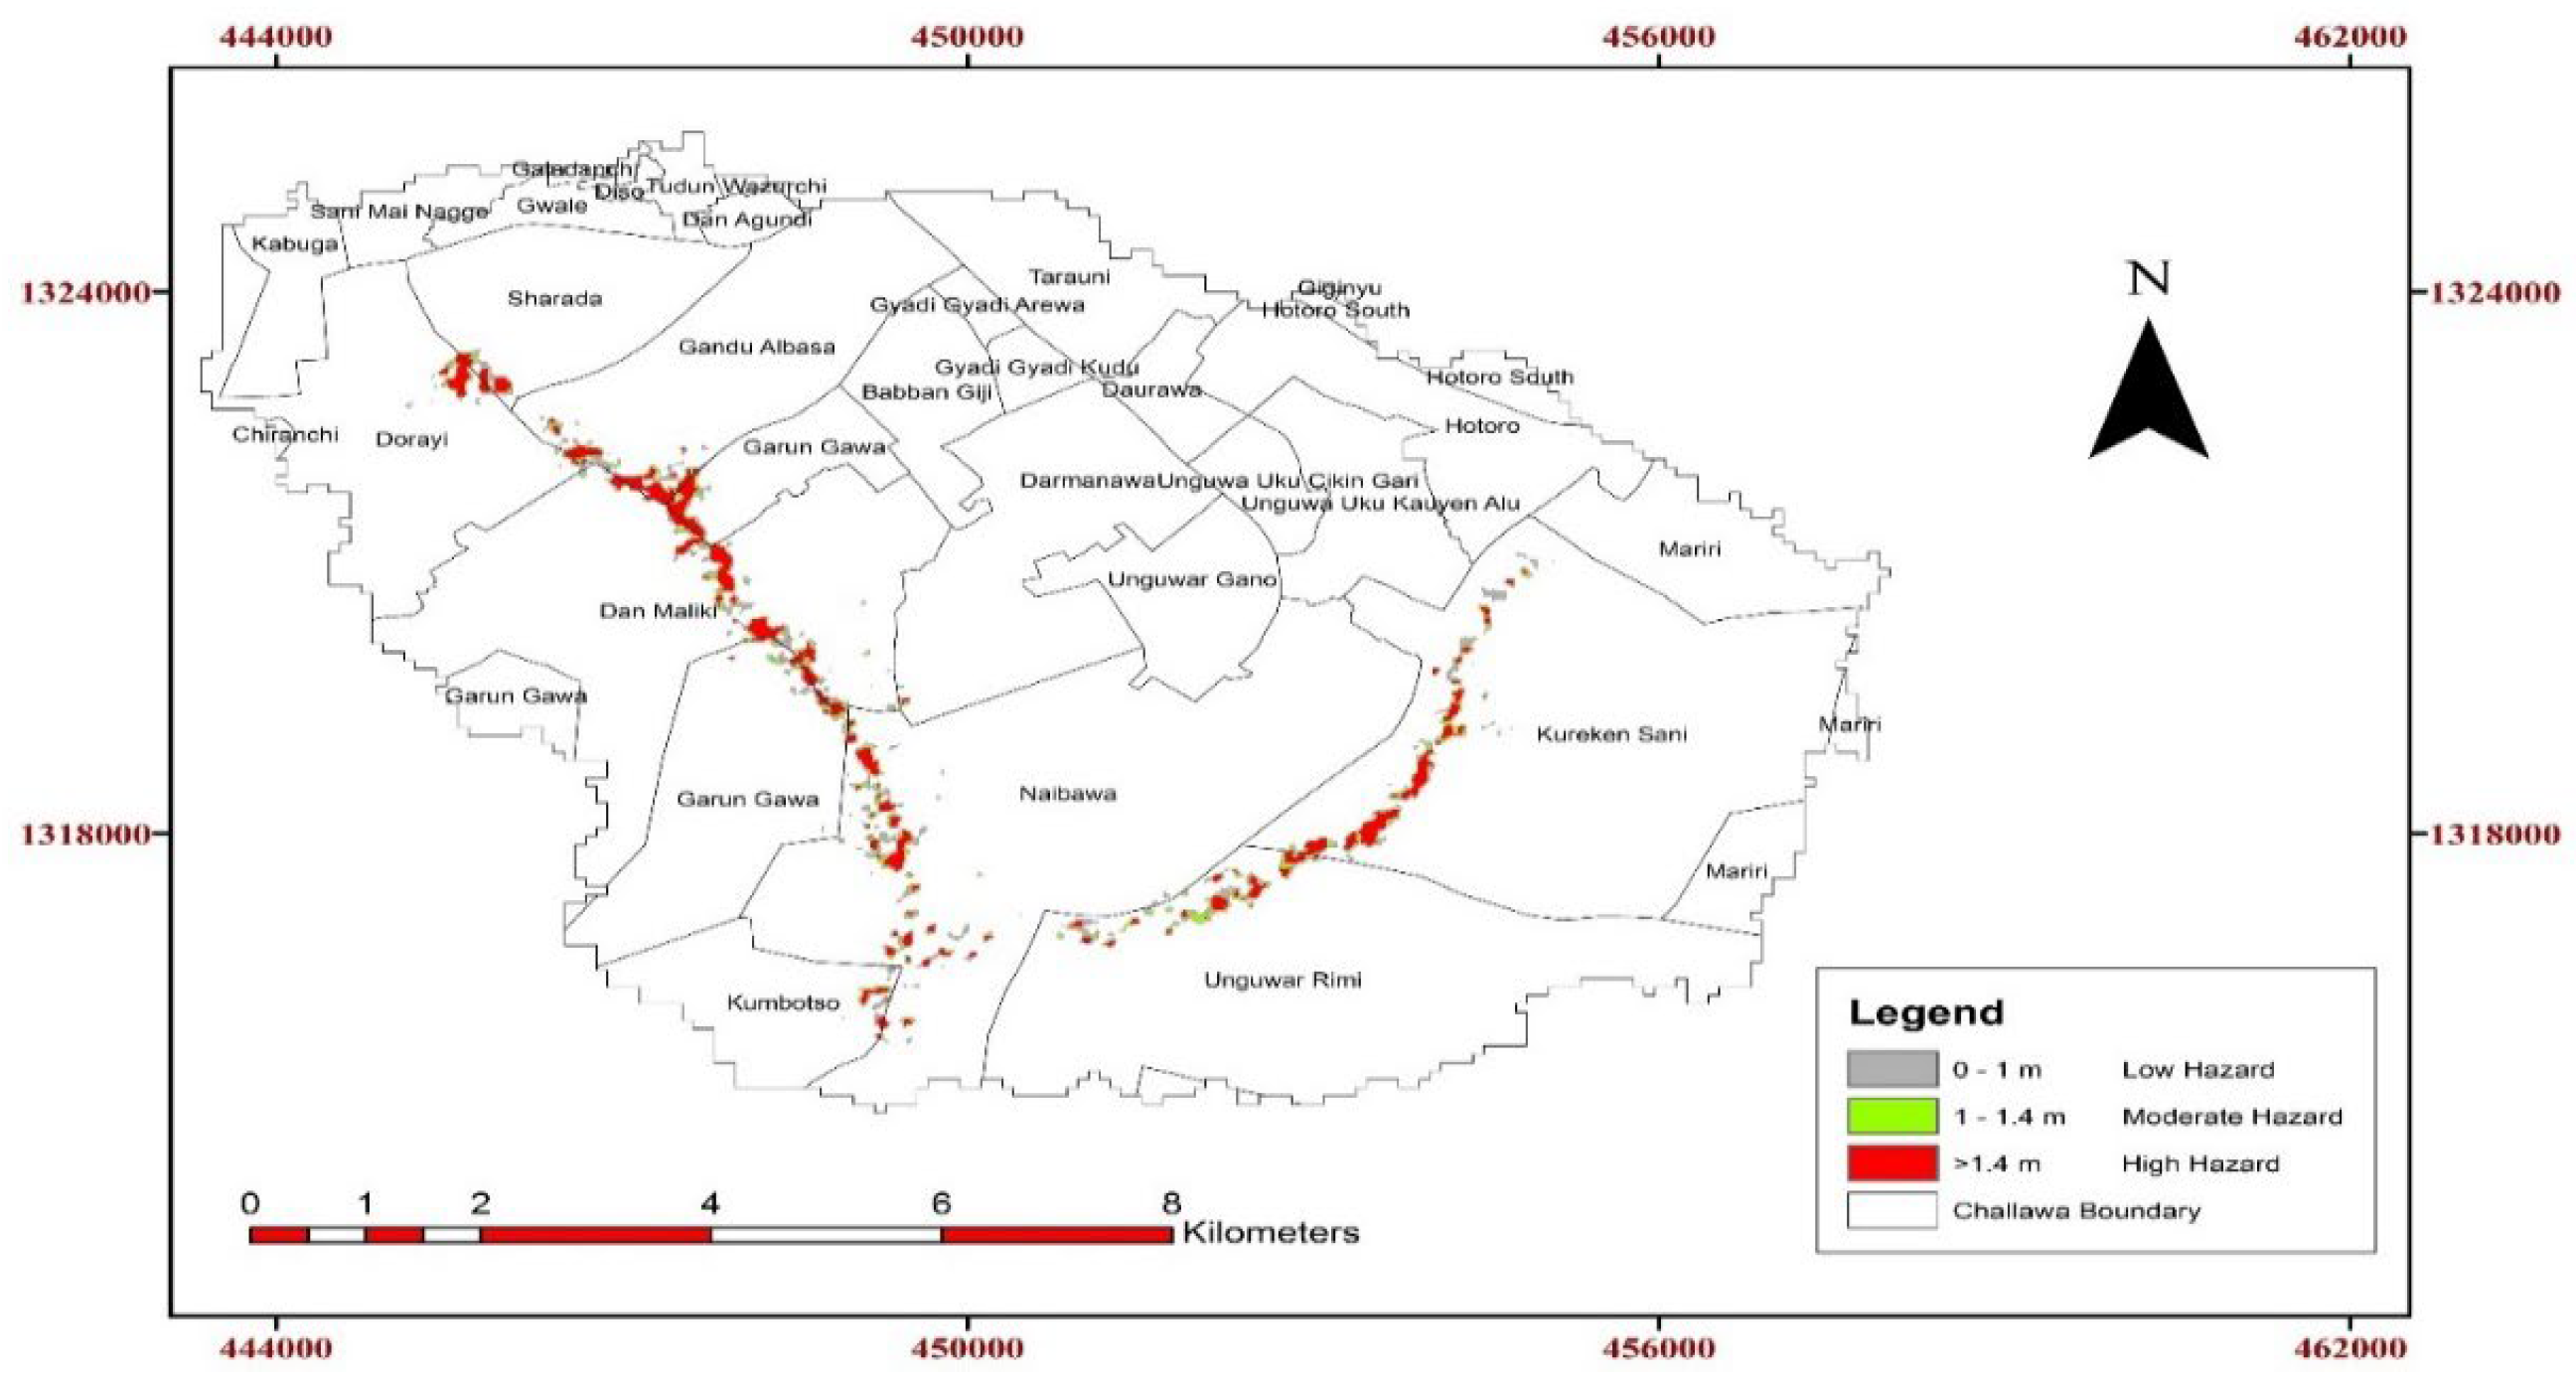
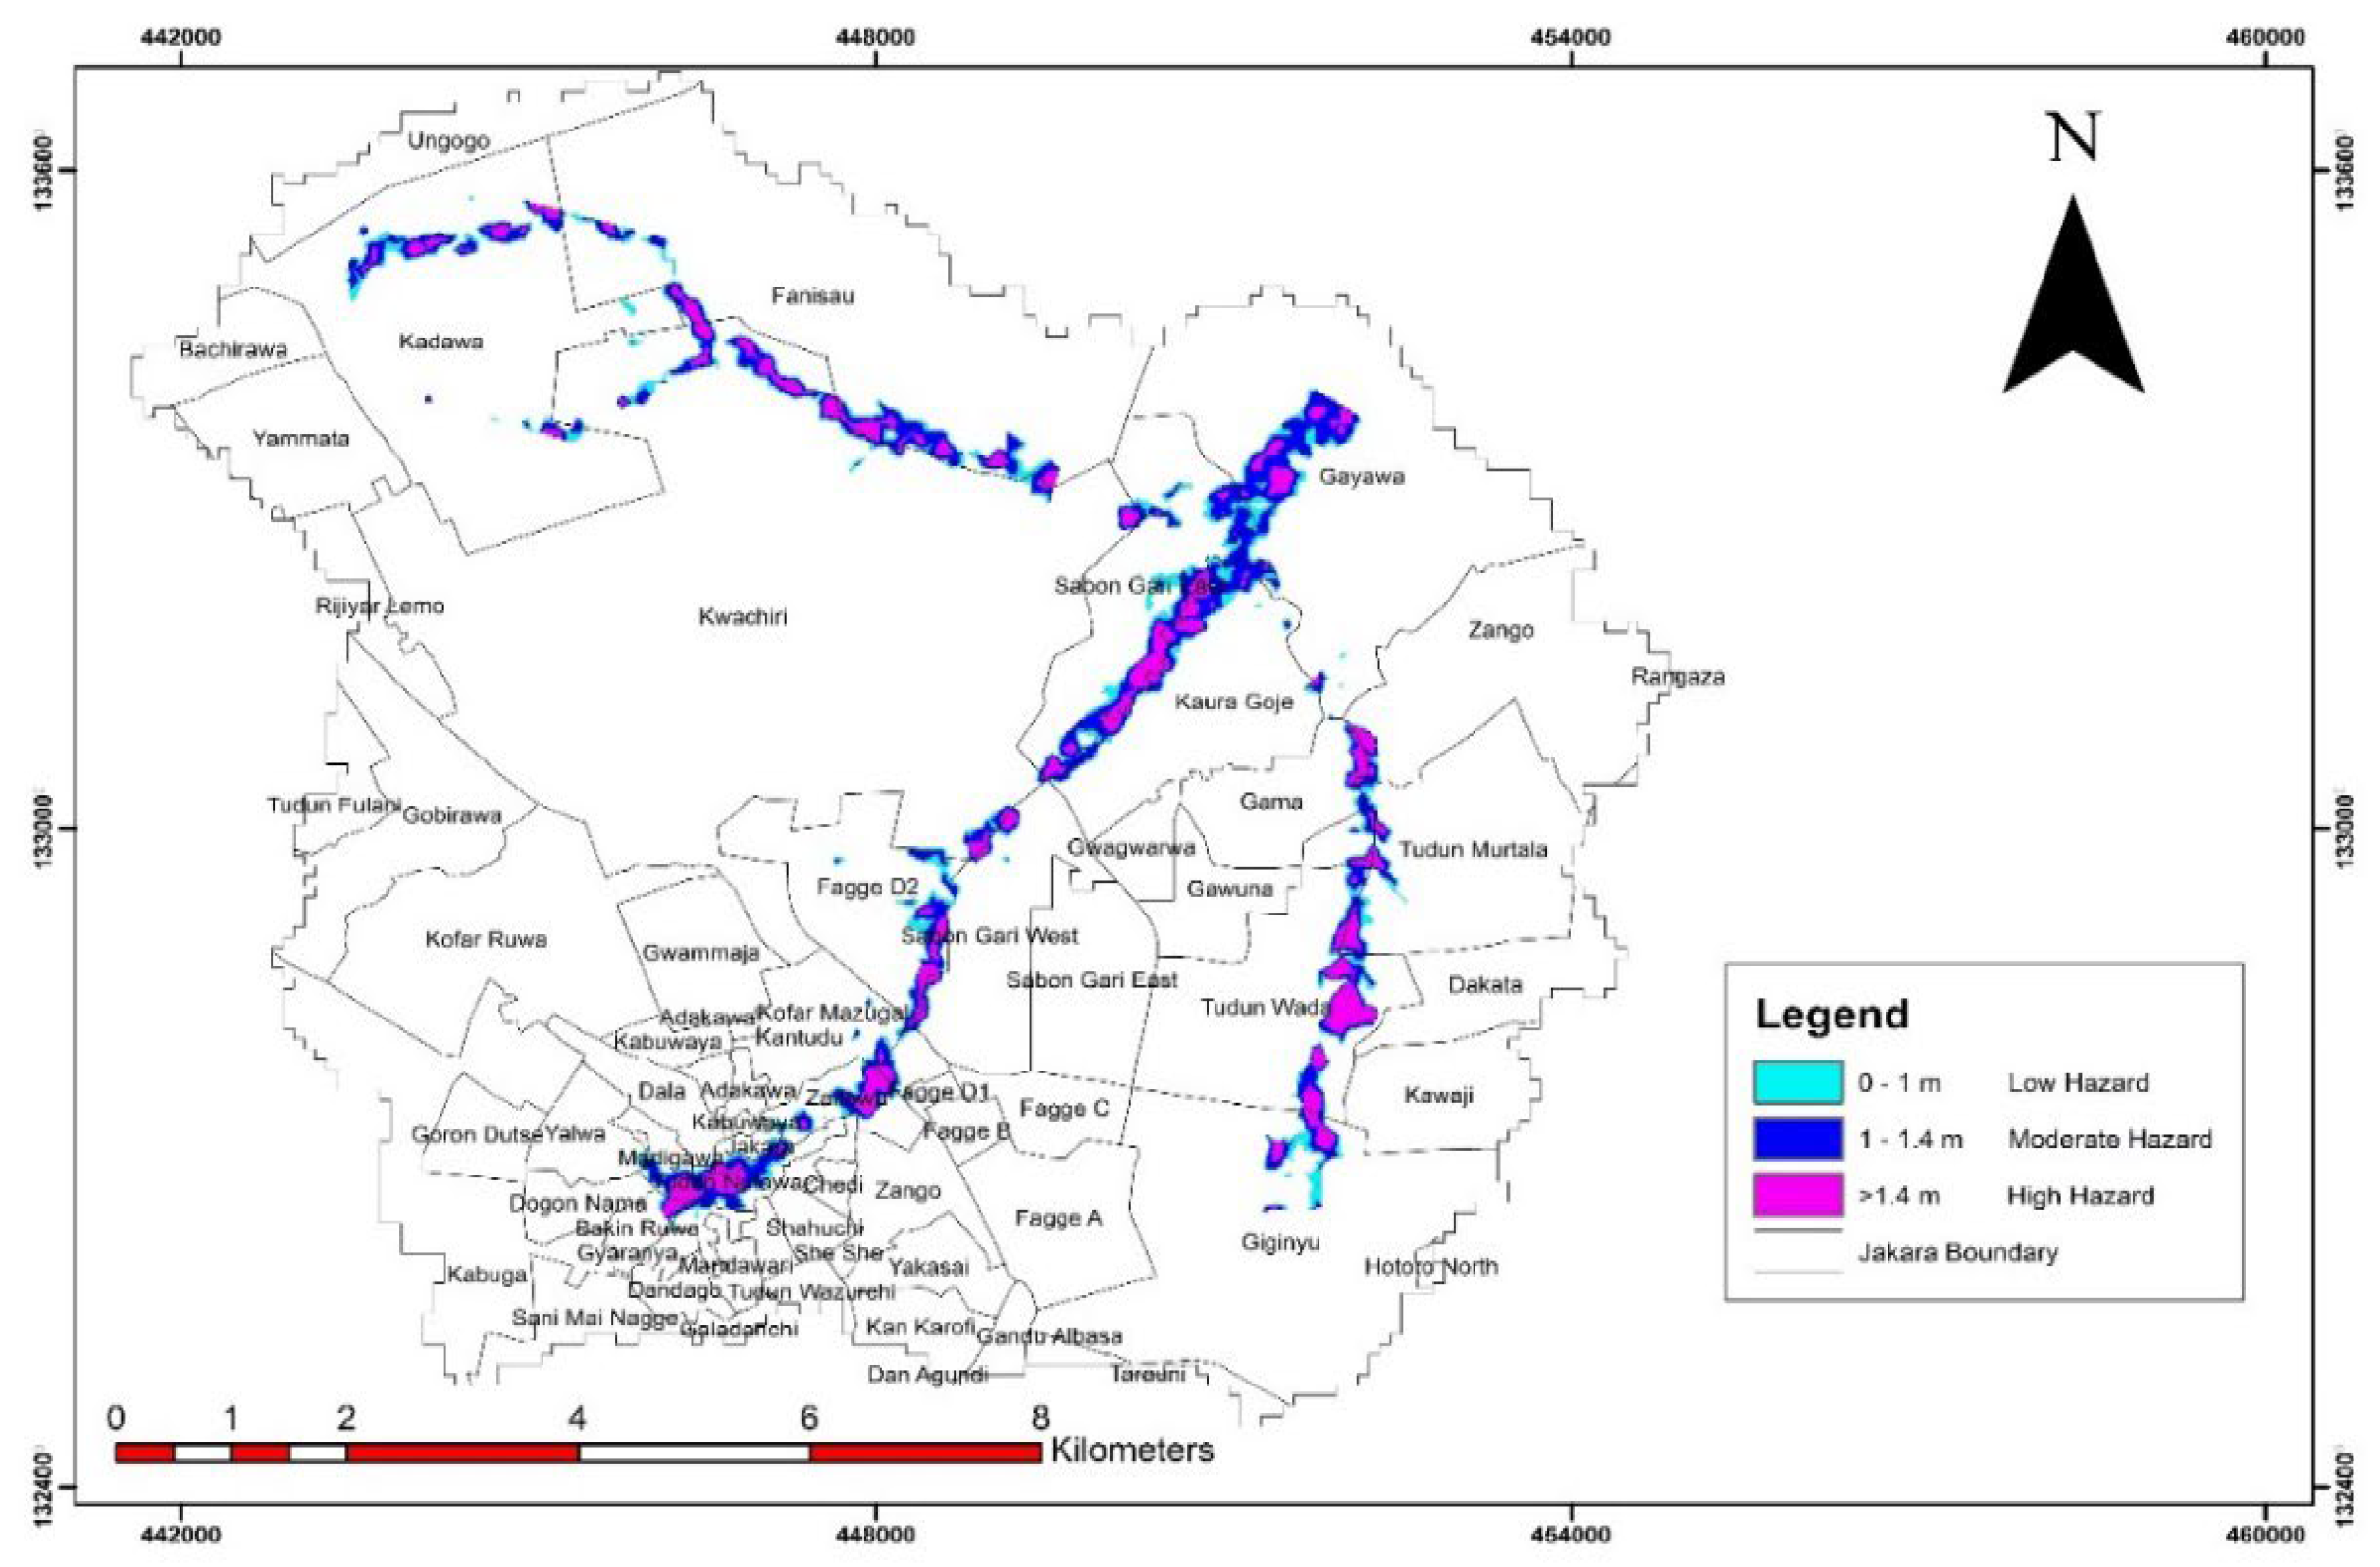
3.1. Flood Hazard
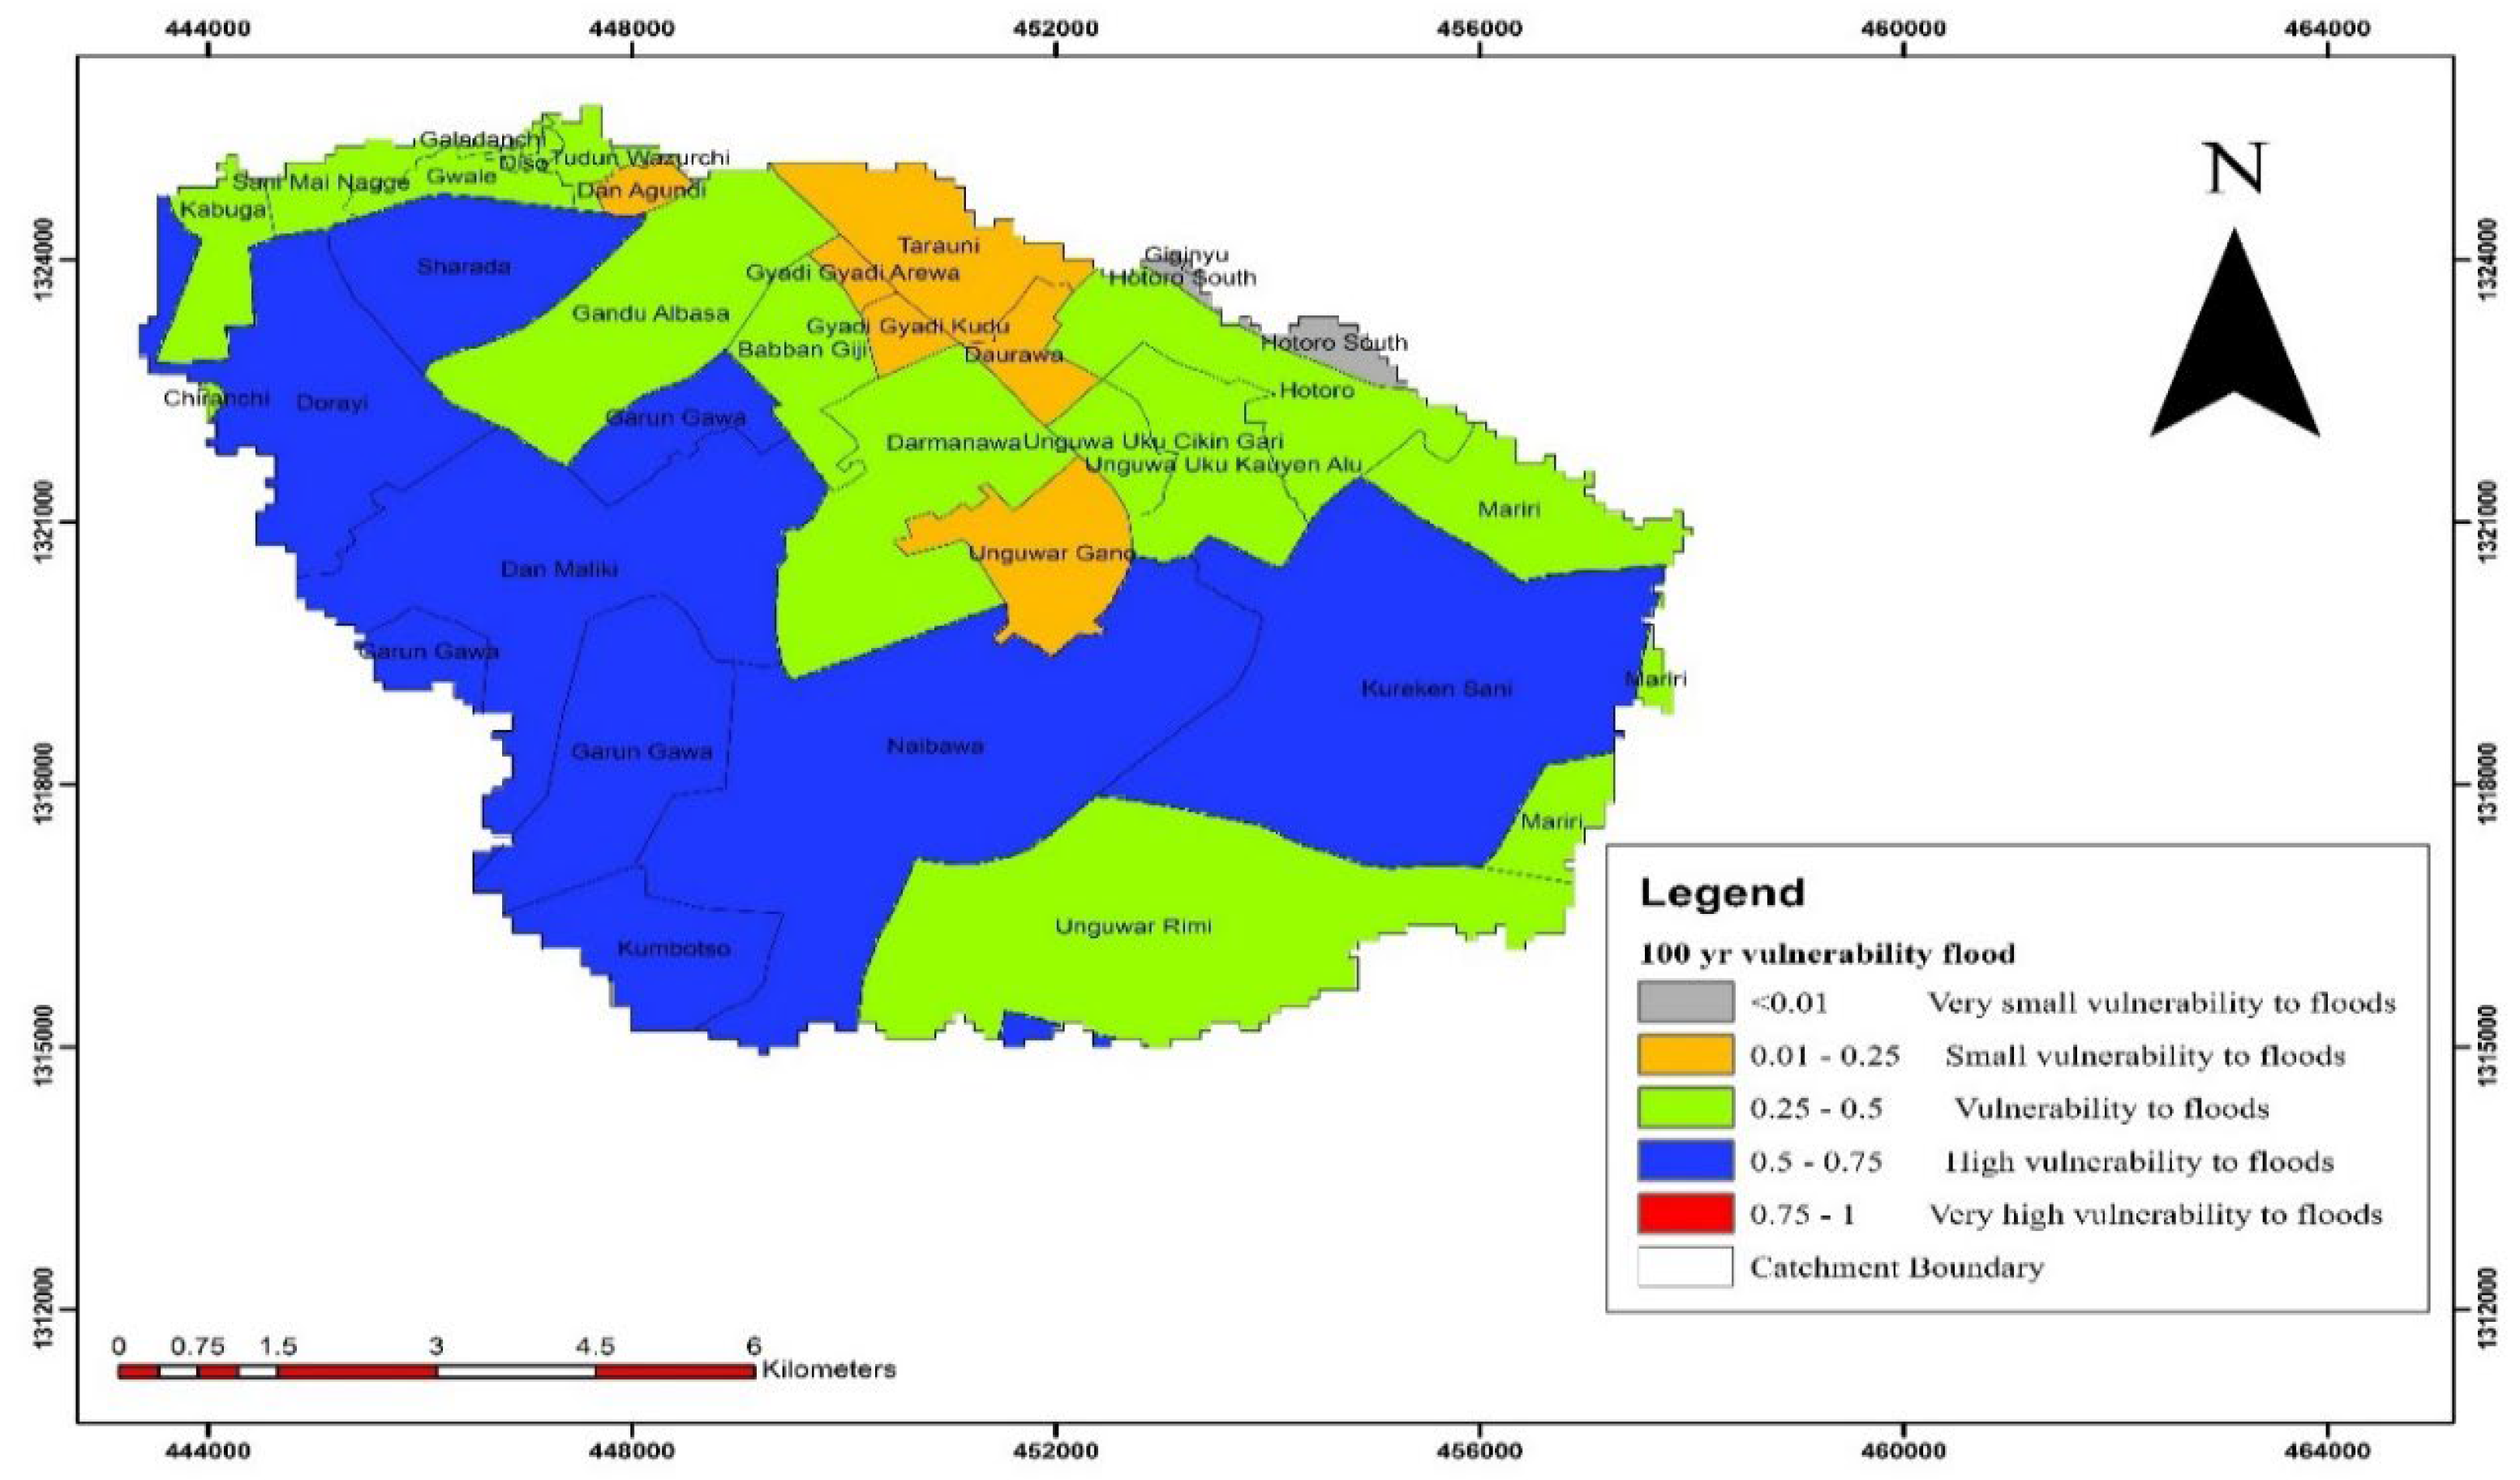
3.2. Flood Vulnerability
3.3. Flood Risk
4. Discussion
5. Conclusions
Author Contributions
Data Availability Statement
Acknowledgments
Conflicts of Interest
References
- Rangari, VA, Umamahesh, NV, Patel AK. Flood-hazard risk classification and mapping for urban catchment under different climate change scenarios: A case study of Hyderabad city. Urban Climate 2021, 36, 100793. [CrossRef]
- Yiyi H, Stephan T, Paolo A, Jun R. 2021. Flood impacts on urban transit and accessibility—A case study of Kinshasa. Transportation Research Part D: Transport and Environment, 2021, 96, 102889, ISSN 1361-9209. [CrossRef]
- Adegun, OB. Flood-related challenges and impacts within coastal informal settlements: a case from Lagos, Nigeria. International J. of Urban Sustainable Development 2023, 15, 1–13. [Google Scholar] [CrossRef]
- Cai S, Fan J, Yang W. Flooding risk assessment and analysis based on GIS and the TEN-AHP method: A Case Study of Chongqing Chaina. Atmosphere 2021, 12, 623. [Google Scholar] [CrossRef]
- Armenakis, C.; Du, E.X.; Natesan, S.; Persad, R.A.; Zhang, Y. Flood Risk Assessment in Urban Areas Based on Spatial Analytics and Social Factors. Geosciences 2017, 7, 123. [Google Scholar] [CrossRef]
- UNISDR (United Nations International Strategy for Disaster Reduction). UNISDR terminology on disaster risk reduction. Geneva: UNISDR, 30, 2015.
- Zhang X, Yi L, Zhao D. Community-based disaster management: A review of progress in China. Natural Hazards, 2013, 65(3), 2215-2239.
- Bathrellos GD, Karymbalis E, Skilodimou1, HD, Gaki-Papanastassioul K, Baltas EA. Urban flood hazard assessment in the Basin of Athens Metropolitan City, Greece. Environ Earth Science 2016, 75, 319. [Google Scholar] [CrossRef]
- Bruijn K.M, Klijn F, Van de Pas B, Slager CTJ. Flood fatality hazard and flood damage hazard: combining multiple hazard characteristics into meaningful maps for spatial planning. Natural Hazards and Earth System Science 2015, 15, 1297–1309. [CrossRef]
- Aldrees A, Dan’azumi S. Application of Analytical Probabilistic Models in Urban Runoff Control Systems’ Planning and Design: A Review. Water 2023, 15, 1640. [Google Scholar] [CrossRef]
- UN Environment–DHI Center, CTCN, UNEP. Flood hazard assessment and mapping; A practitioner’s guide to adaptation technologies for increased water sector resilience climate change adaptation technologies for water. 2021, Accessed from http//www.unepdhi.org/publications on 9th November, 2021.
- Temitope, EO. Generation of Unit Hydrograph for River Jakara in Kano Metropolis. M.Eng. Thesis, Department of Civil Engineering, Bayero University Kano, 2010. [Google Scholar]
- Abaje I B, Ndabula C, & Garba AH. Is the Changing Rainfall patterns of Kano State and its Adverse Impacts an Indication of Climate Change? European Scientific Journal 2014, 10(2), 7857–7881. [Google Scholar]
- Mohammed MU, Abdulhamid A, Badamasi MM, Ahmed M. Rainfall Dynamics and Climate Change in Kano, Nigeria. J. of Scientific Research and Report, 2015, 7(5), 386-395.
- Mohammed MU, Hassan NI, Badamasi MM. In search of missing links: Urbanization and climate change in Kano Metropolis, Nigeria. Intern. J. of Urban Sustainable Development. 2019, 11(3), 309 - 318. [CrossRef]
- IPCC (Intergovernmental Panel on Climate Change). Climate change impacts, Adaptation and vulnerability, contribu tion of Working Group II to the Fourth Assessment Report. Report, Summary for Policy Makers. 2014.
- Okayo J, Odera P, Omuterema S. Socio-economic characteristics of the community that determine ability to uptake precautionary measures to mitigate flood disaster in Kano Plains, Kisumu County, Kenya. Geoenvironmental Disasters, 2015, 2(26). [CrossRef]
- Kablan MKA, Dango K, Coulibaly M. Assessment of social vulnerability to flood in Urban Cote d’Ivoire using the MOVE frame work. Water, 2017, 9(292),1-18.
- Flanagan BE, Gregory EW, Hallisey EJ, Heitgerd JL, Lewis B. A Social Vulnerability Index for Disaster Management. J. of Homeland Security and Emergency Management, 2011, 8(1). [CrossRef]
- Rahman MA. 2018. Social vulnerability to flood: An integrated spatial assessment in the United States. Association of American Geographers, Washington, DC, USA, 2018.
- Ajibade I, McBean G, Bezner-kerr R. Urban flooding in Lagos, Nigeria: Patterns of vulnerability and resilience among Women. Global Environmental Change, 2014, 23, 1714-1725.
- Akukwe, T. I., & Ogbodo, C. Spatial Analysis of Vulnerability to Flooding in Port Harcourt Metropolis, Nigeria. SAGE Open, 2015, 5(1). [CrossRef]
- Nkwunonwo UC, Whitwork M, Baily B. Relevance of social vulnerability assessment to flood risk reduction in the Lagos Metropolis of Nigeria. J. of Applied Science & Technology, 2016, 8, 366-382.
- Nabegu, AB. Analysis of vulnerability to flood disaster in Kano State. Greener Journal of Physical Sciences 2014, 4, 22–29. [Google Scholar]
- Olajuyigbe AE, Rotowa OO, Durajaye E. An assessment of flood hazard in nigeria; the case of Mile 12, Lagos. Mediterranea Journal of Social Sciences, 2012, 3, 367-375.
- Action Aid. Climate change, urban flooding and the rights of urban poor in Africa. Key findings from six African cities. London; Action Aid International, 2006.
- Lianxiao M, Morimoto T. Spatial analysis of social vulnerability to floods based on the MOVE framework and Information Entropy Method: Case Study of Katsushika Ward, Tokyo, Japan. J. of Sustainability 2019, 11, 1–19. [Google Scholar]
- Younus M, Kabir M. Climate change vulnerability assessment and adaptation of Bangladesh: Mechanisms, Notions and Solutions. Sustainability 2018, 10, 4286. [Google Scholar] [CrossRef]
- Musungu K, Motala S, Smit J. Using Multi-criteria evaluation and GIS for flood risk analysis in informal settlements of Cape Town: The case of Graveyard Pond. South African Journal of Geomatics, 2012, 1(1), 1-15.
- Shuaibu, A.; Hounkpè, J.; Bossa, Y.A.; Kalin, R.M. Flood Risk Assessment and Mapping in the Hadejia River Basin, Nigeria, Using Hydro-Geomorphic Approach and Multi-Criterion Decision-Making Method. Water 2022, 14, 3709. [Google Scholar] [CrossRef]
- Williams HT, Muhammed BU. Modelling social vulnerability to malaria risk in Katsina-Ala Local Government Area, floods, Benue State Nigeria. J. of Geography & Environmental Earth Science 2018, 14, 2454–57352.
- Sane OD, Gaye AT, Diakhate M, Aziadekey M. Social vulnerability assessment to flood in Medina Gounass Dakar. J. of Geographic Information System 2015, 7, 415–429. [Google Scholar] [CrossRef]
- Mustapha A, Yakudima II, Alhaji M, Nabegu AB, Dakata GAF, Umar AY, Musa UB. Overview of the physical and human setting of Kano Region, Nigeria. J. of Geography 2014, 1, 1–12.
- Mohammed A, Dan’azumi S, Modibbo AA, Adamu AA, Ibrahim Y. Rainfall-runoff modeling for Challawa and Jakara Catchment Areas of Kano City, Nigeria. Arid Zone Journal of Engineering, Technology and Environment 2021, 17, 439–452. [Google Scholar]
- 35. Daffi RE, Otun JA. Ismail A. Flood hazard assessment of River Dep Floodplains in North-Central Nigeria. Intern. J. of Water Res and Env. Engineering 2014, 6, 67–72. [CrossRef]
- Daffi RE, Ismail A, Egharevba NS. Use of geographic information system techniques for flood inundation mapping of low-lying areas of River Dep Basin. Nigerian J. of Tropical Engineering 2015, 8, 1–8.
- Cançado V, Brasil L, Nascimento N, Guerra A. Flood risk assessment in an urban area: Measuring hazard and vulnerability. 11th International Conference on Urban Drainage, 2008, Edinburgh, Scotland, UK.
- Olasunkanmi AB, Dan’azumi S. Flood inundation and hazard mapping of River Zungur Watershed using GIS and HEC-RAS Models. Nigerian Journal of Technology 2018, 37, 1162–1167. [CrossRef]
- Birkmann, J. Framing vulnerability, risk and societal responses, the MOVE framework. Natural Hazards 2013, 67, 193–211. [Google Scholar] [CrossRef]
- Iyengar, N.S. and Sudarshan, P. A Method of Classifying Regions from Multivariate Data. Economic and Political Weekly 1982, 17, 2047–2052. [Google Scholar]
- Karmaoui, A., Balica, S. F., and Messouli, M.: Analysis of applicability of flood vulnerability index in Pre-Saharan region, a pilot study to assess flood in Southern Morocco. Nat. Hazards Earth Syst. Sci. Discuss. 2016, 96. [CrossRef]
- Sharma SV, Roy PS, Chakravarthi V, Rao SG. Flood risk assessment using multi-criteria analysis: a case study from Kopili River Basin, Assam, India. J. of Geomatics Natural Hazards and Risk 2018, 9, 79–93. [CrossRef]
- Mukhtar I. Analysis of flood risk and vulnerability in kano metropolis, Kano State, Nigeria. PhD Thesis. Department of Geography. Ahmadu Bello University Zaria. Nigeria, 2018.
- Houston D, Werritty A, Bassett D, Geddes A, Hoolachan A, McMillan M. Pluvial (Rain-related) Flooding in Urban Areas: The Invisible Hazard, 2011, Joseph Rowntree Foundation.
- Lisetskii F.N, Buryak ZA. Runoff of Water and Its Quality under the Combined Impact of Agricultural Activities and Urban Development in a Small River Basin. Water 2023, 15, 2443. [CrossRef]
- Nasidi NA. Urbanism and the Conservation of The Natural Environment for Sustainable Development: A Case Study of Kano State, Nigeria, 1989-2020. [Research Report] IFRA-Nigeria Working Papers Series 87, IFRA-Nigeria. 2022, pp.1-20. ⟨hal-03762087⟩.
- Cook LM, McGinnis S, Samaras C. The effect of modeling choices on updating intensity-duration-frequency curves and stormwater infrastructure designs for climate change. Climatic Change 2020, 159, 289–308. [Google Scholar] [CrossRef]
- WMO (World Meteorological Organization), GWP (Global Water Partnership). Integrated Flood Management Tools Series No.20, 2013.
- Khan DM, Veerbeek W, Chen AS, Hammond MJ, Islam F, Pervin I, Djoidjevic S, Buttler D. Back to the Future: Assessing Damage of 2004 Dhaka Flood in the 2050 Urban Environment. J. of Flood Risk Management 2016. [CrossRef]
- Rosmadi, H.S.; Ahmed, M.F.; Mokhtar, M.B.; Lim, C.K. Reviewing Challenges of Flood Risk Management in Malaysia. Water 2023, 15, 2390. [Google Scholar] [CrossRef]
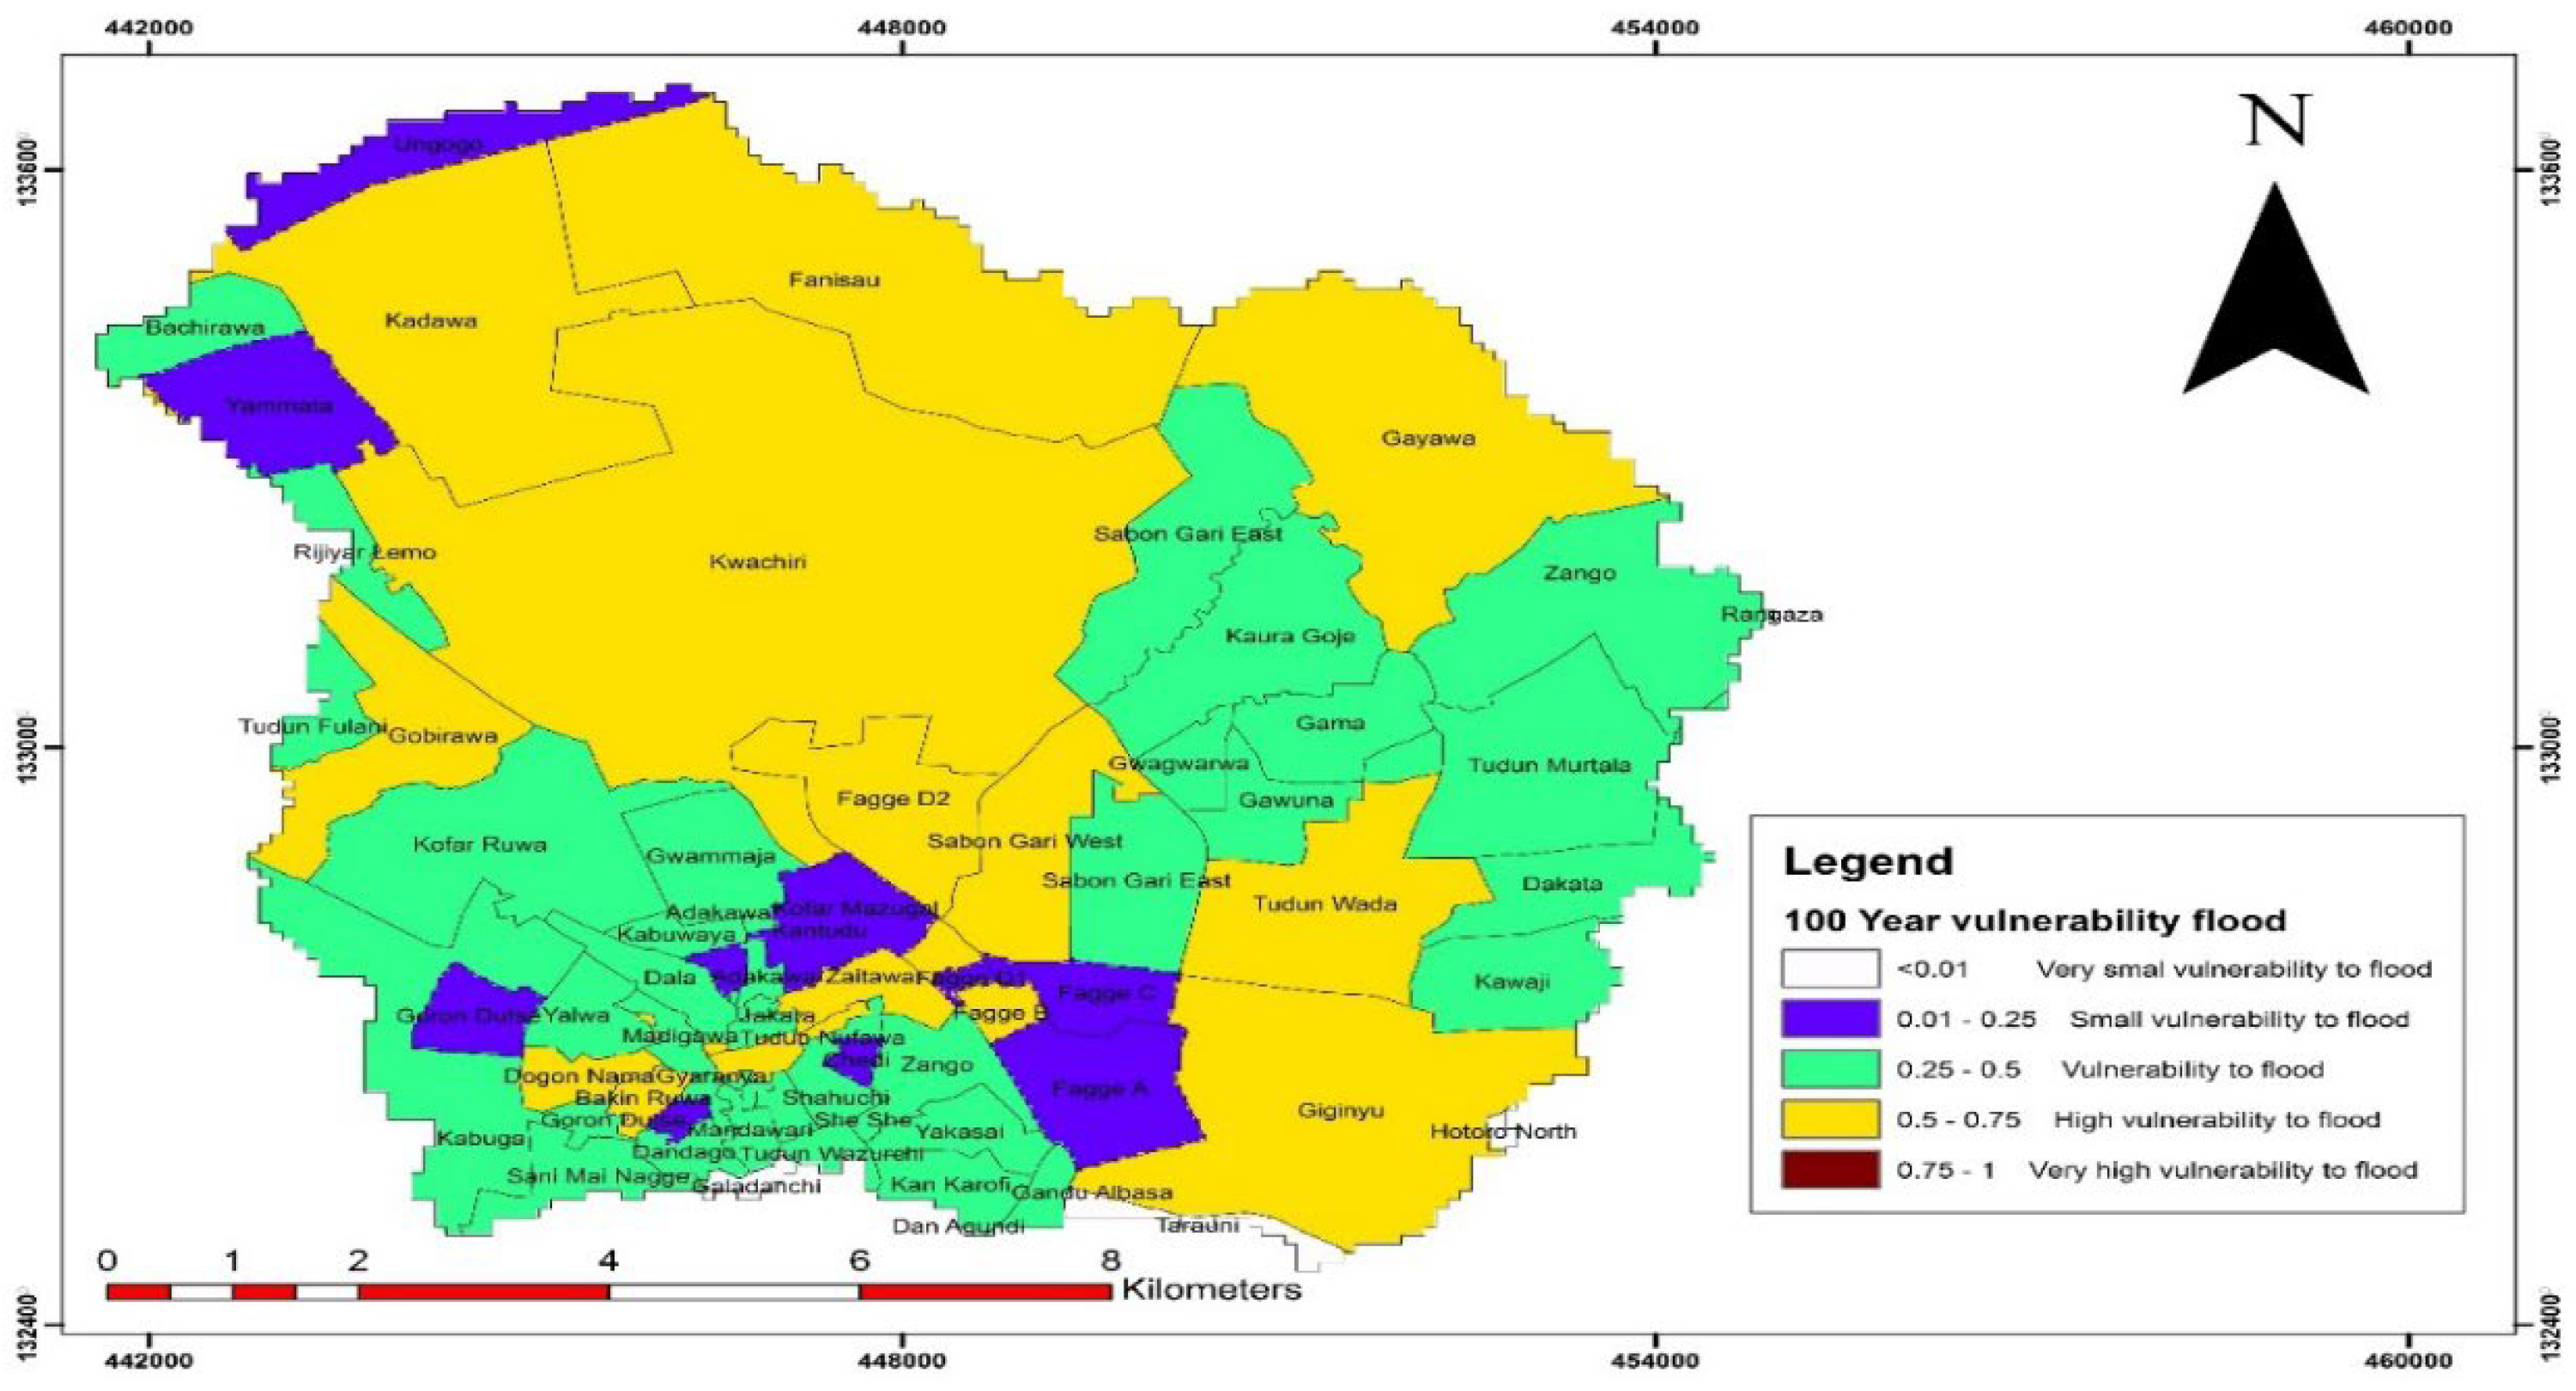
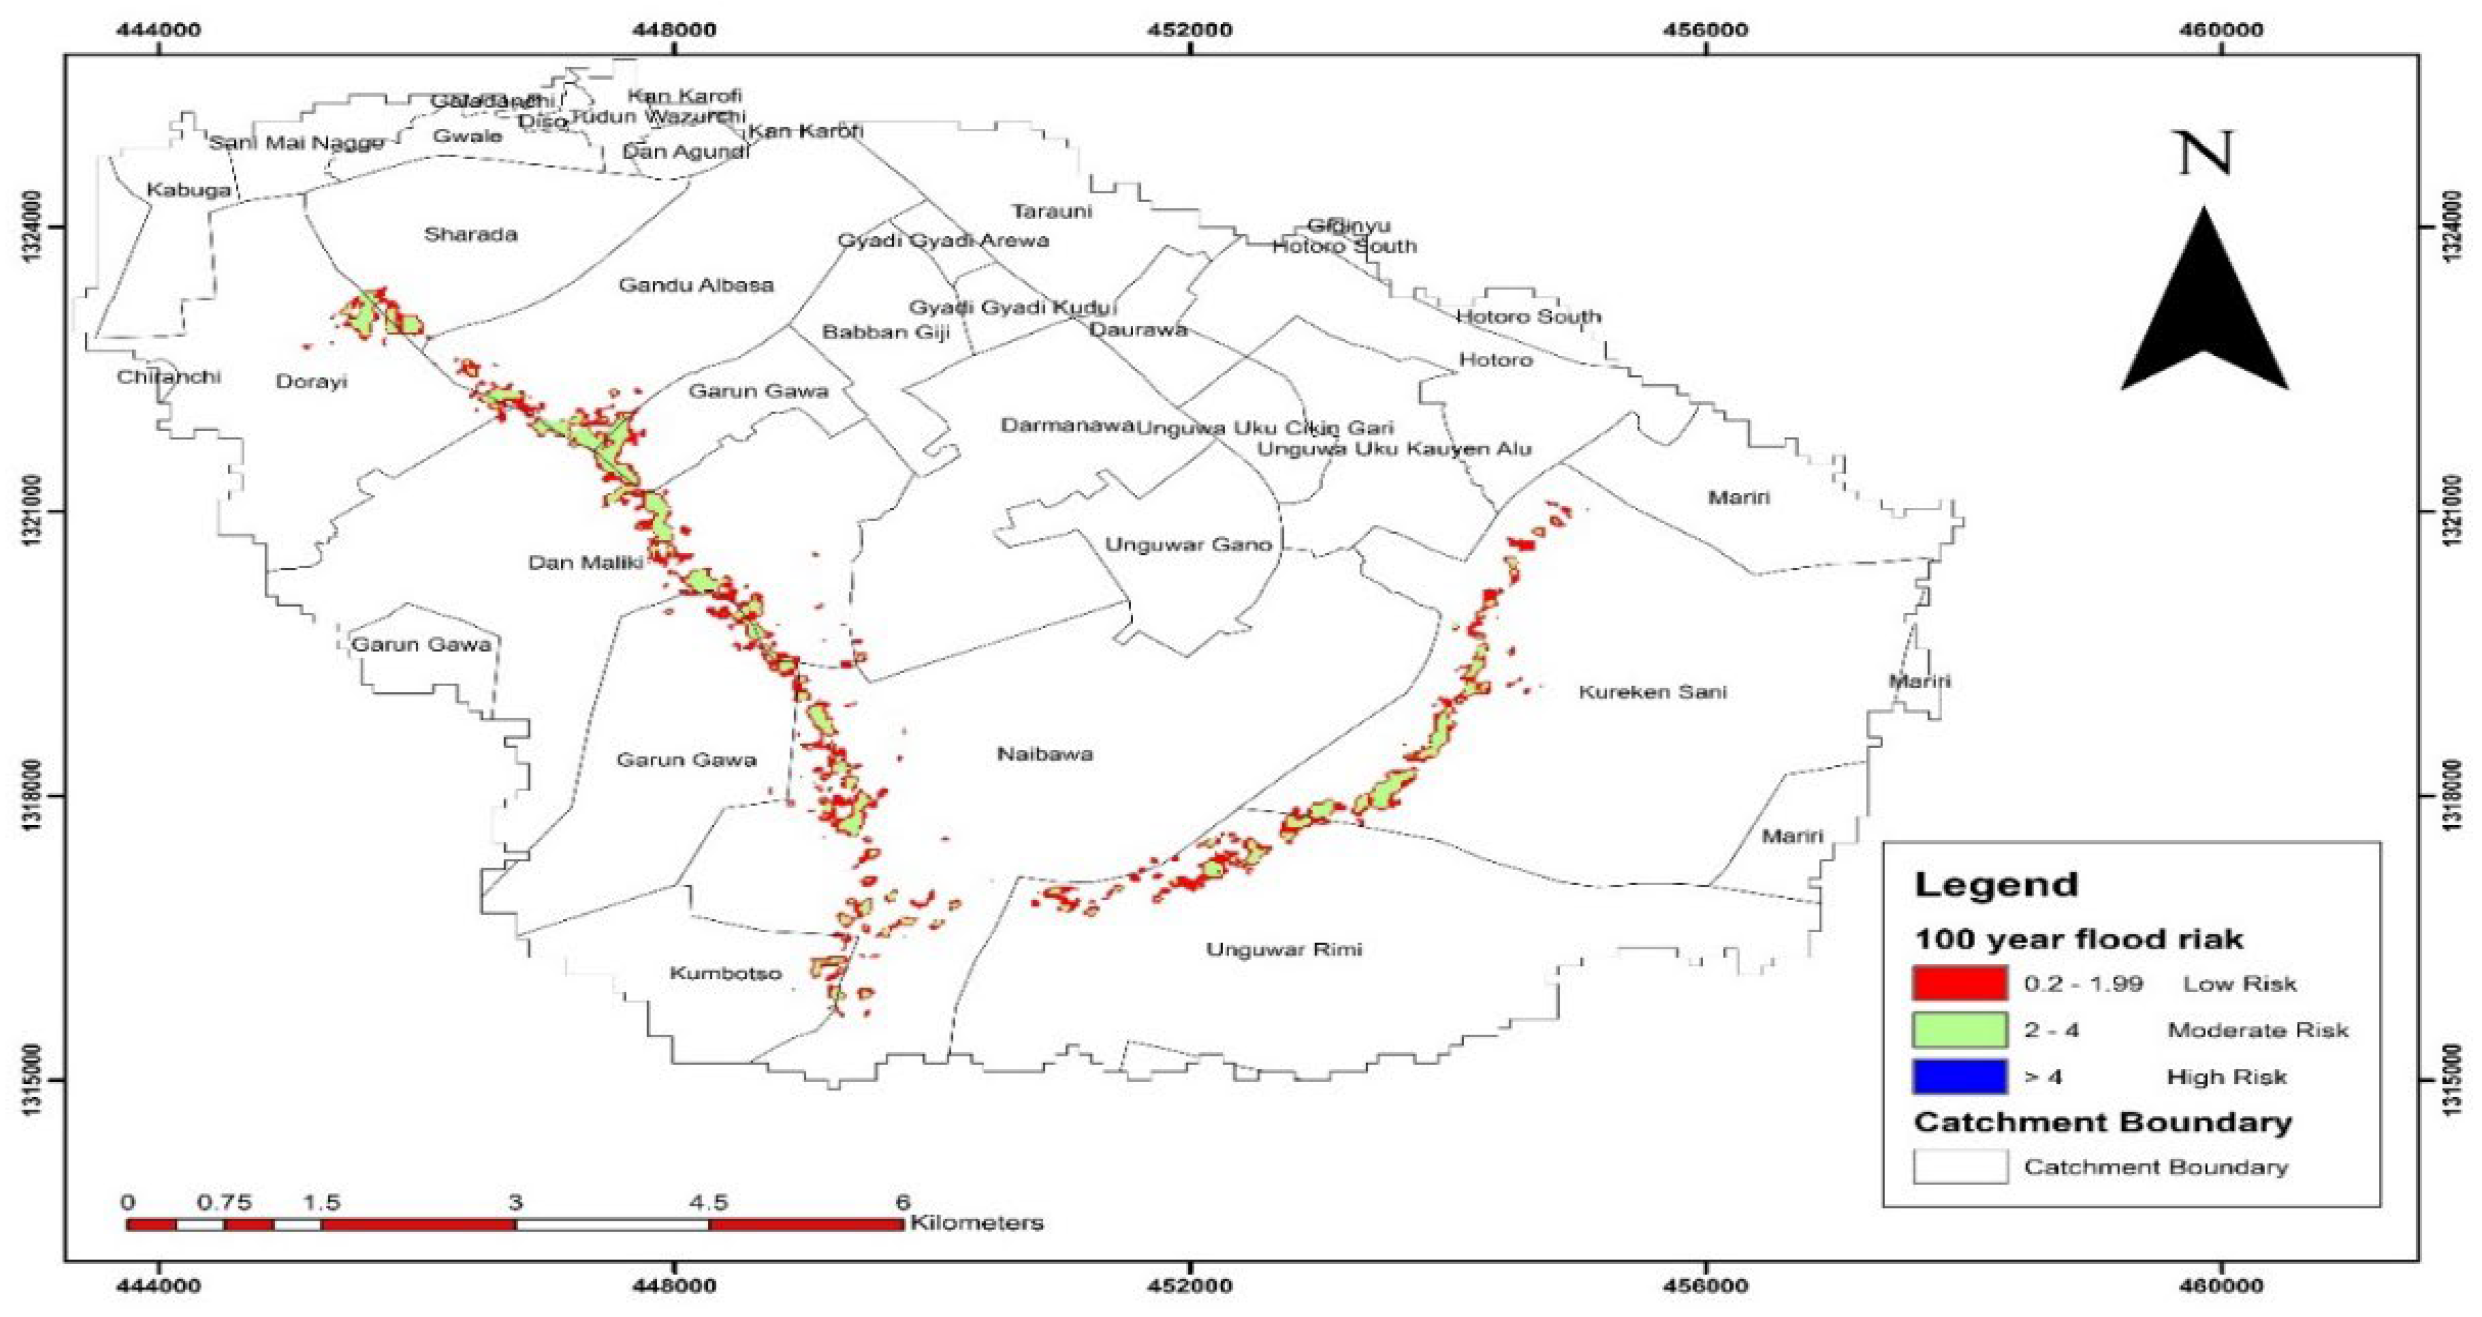
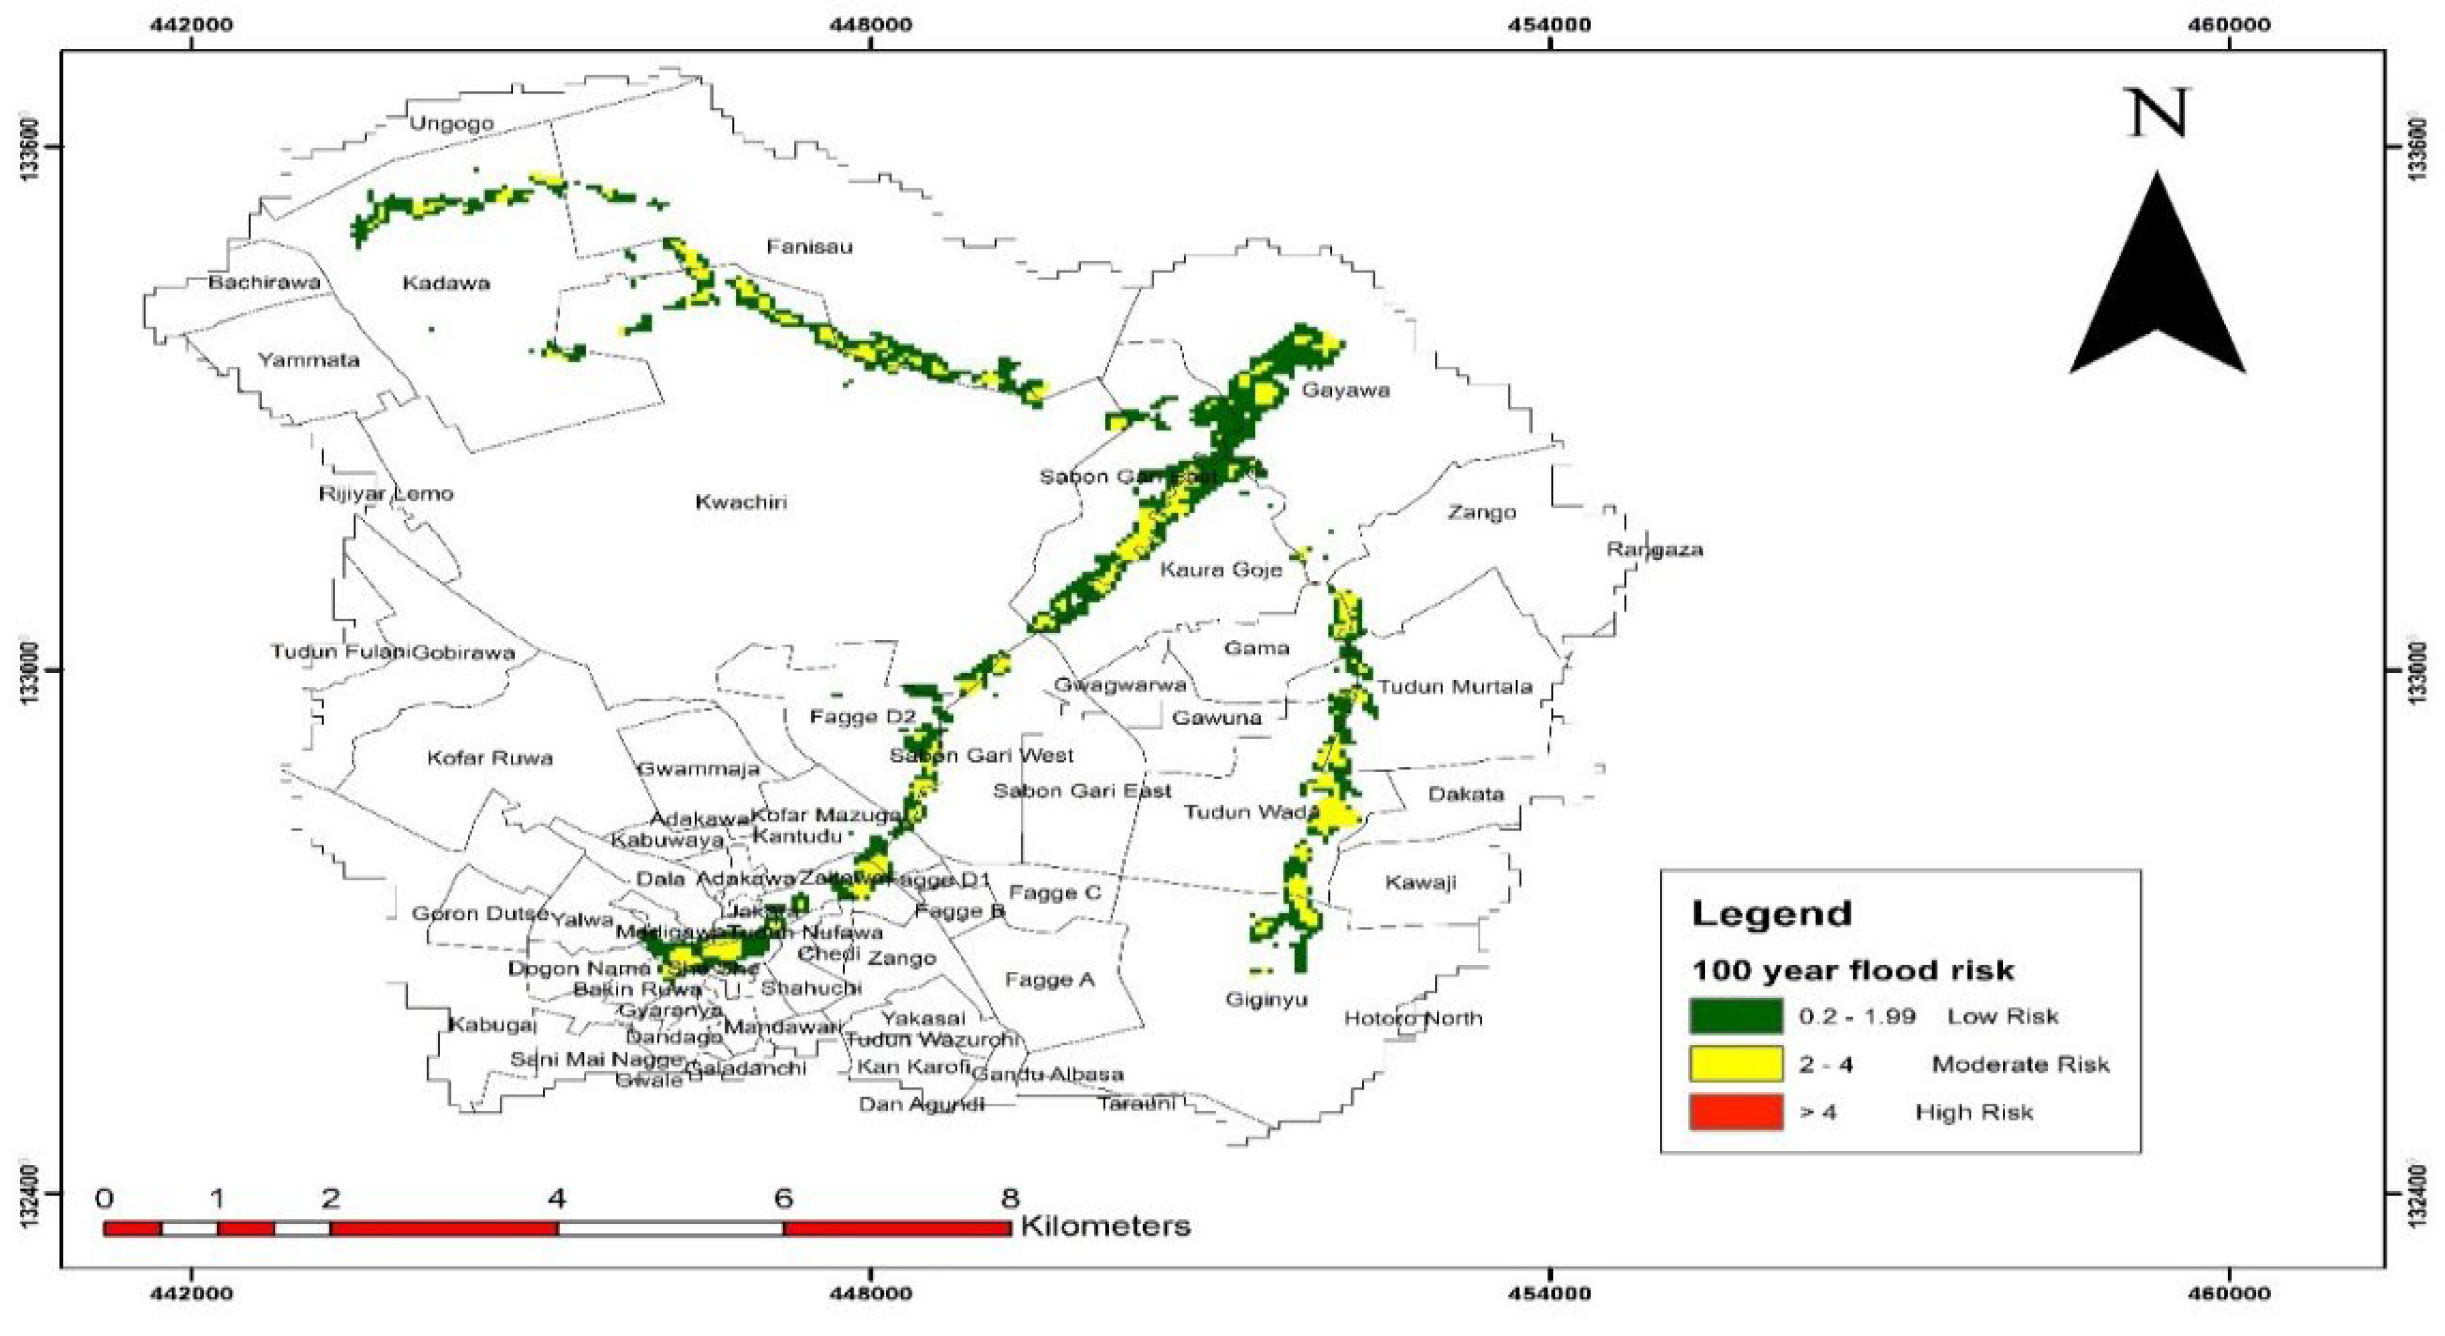
| Hazard Classification | Flood Depth (m) | Flood Velocity (m/s) |
|---|---|---|
| High | > 1.4 | > 2 |
| Medium | 1 - 1.4 | 1 – 2 |
| Low | 0 – 1 | 0 – 1 |
| Components | Symbol | Indicator | Explanation | Functional relationship |
|---|---|---|---|---|
| Exposure |
E1 E2 E4 |
Population density Elevation Inundated areas |
The higher the population, the higher the exposure. The lower the elevation, the higher the exposure. The larger the flood inundated areas, the more exposed. |
+ + + |
| Susceptibility | S1 S2 S3 S4 |
Children under 5 Elderly above 60 Disable people Women |
Fragile health and difficulty for evacuation process. Fragile health and difficulty for evacuation process. Difficulty for evacuation process. The higher the number, the higher the susceptibility of affected people. |
+ + + + |
| Resilience | LoR1 LoR2 LoR3 |
Literacy Unemployment Poverty |
The higher the rate, the higher the capacity to understand early warning systems. Jobless people have difficulties to recover from flood damages. The higher the poverty rate, the difficult it is to recover from flood damage |
- + + |
| Index value. | Classification |
|---|---|
| < 0.01 | Very small vulnerability to floods |
| 0.01 - 0.25 | Small vulnerability to floods |
| 0.25 - 0.5 | Vulnerability to floods |
| 0.50 - 0.75 | High vulnerability to floods |
| 0.75 – 1 | Very high vulnerability to floods |
| Risk Index | Risk classification |
|---|---|
| > 4 | High |
| 2 – 4 | Moderate |
| 0.2 – 1.99 | Low |
| 0 | No risk |
| Hazard Class | 2-year | 5-year | 10-year | 25-year | 50-year | 100-year |
|---|---|---|---|---|---|---|
| Low hazard (km2) | 4.20 | 4.31 | 4.33 | 4.36 | 4.39 | 4.43 |
| Medium hazard (km2) | 2.66 | 2.70 | 2.71 | 3.37 | 3.96 | 4.48 |
| High hazard (km2) | 2.85 | 3.01 | 3.07 | 3.14 | 3.18 | 3.22 |
| Total | 9.71 | 10.02 | 10.11 | 10.87 | 11.53 | 12.13 |
| Hazard | 2-year | 5-year | 10-year | 25-year | 50-year | 100-year |
|---|---|---|---|---|---|---|
| Low hazard (km2) | 7.14 | 7.66 | 7.83 | 8.14 | 8.28 | 8.50 |
| Medium hazard (km2) | 4.12 | 4.11 | 4.16 | 4.06 | 4.07 | 3.97 |
| High hazard (km2) | 3.08 | 3.55 | 3.86 | 4.27 | 4.59 | 4.89 |
| Total | 14.35 | 15.31 | 15.85 | 16.47 | 16.94 | 17.36 |
| Return period | Vulnerability Class Extent (km2) |
Total |
||||
| VSVF | SVF | MVF | HVF | VHVF | ||
| 100 | 0.34 | 3.67 | 19.37 | 27.53 | 0 | 50.91 |
| 50 | 0.32 | 3.60 | 34.42 | 11.56 | 0 | 49.90 |
| 25 | 0.32 | 3.60 | 37.79 | 8.19 | 0 | 49.90 |
| 10 | 0.32 | 4.23 | 38.87 | 6.48 | 0 | 49.90 |
| 5 | 0.32 | 8.18 | 34.92 | 6.48 | 0 | 49.90 |
| 2 | 0.32 | 8.34 | 41.23 | 0 | 0 | 49.90 |
| Return period | Vulnerability Class extent (km2) |
Total |
||||
| VSVF | SVF | MVF | HVF | VHVF | ||
| 100 | 0.23 | 3.04 | 14.43 | 22.86 | 0 | 40.56 |
| 50 | 0.23 | 3.13 | 17.31 | 19.89 | 0 | 40.56 |
| 25 | 0.23 | 5.36 | 17.82 | 17.15 | 0 | 40.56 |
| 10 | 0.23 | 8.50 | 30.16 | 1.67 | 0 | 40.56 |
| 5 | 0.23 | 9.96 | 29.48 | 0.89 | 0 | 40.56 |
| 2 | 0.23 | 11.54 | 28.79 | 0 | 0 | 40.56 |
| Return Period (Year) | ||||||
|---|---|---|---|---|---|---|
| Risk class | 2 | 5 | 10 | 25 | 50 | 100 |
| Low Risk (km2) | 4.44 | 4.66 | 4.67 | 5.47 | 5.48 | 5.43 |
| Medium Risk (km2) | 2.57 | 2.43 | 2.66 | 3.36 | 3.47 | 3.85 |
| High Risk (km2) | 0.55 | 0.70 | 0.81 | 0.96 | 1.17 | 1.22 |
| Total (km2) | 7.56 | 7.79 | 8.14 | 9.79 | 10.12 | 10.50 |
| Return period (Year) | ||||||
|---|---|---|---|---|---|---|
| LULC | 2 | 5 | 10 | 25 | 50 | 100 |
| Built up area (km2) | 3.99 | 4.07 | 4.11 | 4.73 | 4.87 | 4.98 |
| Bare land (km2) | 2.66 | 2.76 | 2.84 | 3.65 | 3.79 | 3.88 |
| Vegetation (km2) | 0.88 | 0.90 | 1.12 | 1.32 | 1.36 | 1.54 |
| Water body (km2) | 0.03 | 0.06 | 0.06 | 0.07 | 0.09 | 0.10 |
| Total | 7.55 | 7.79 | 8.13 | 9.78 | 10.11 | 10.50 |
| Return Period (Year) | ||||||
|---|---|---|---|---|---|---|
| Risk class | 2 | 5 | 10 | 25 | 50 | 100 |
| Low Risk (km2) | 5.60 | 5.71 | 6.75 | 7.07 | 7.61 | 7.76 |
| Medium Risk (km2) | 3.73 | 4.59 | 4.74 | 4.96 | 5.02 | 5.17 |
| High Risk (km2) | 1.04 | 1.01 | 1.08 | 1.11 | 1.17 | 1.30 |
| Total | 10.37 | 11.31 | 12.57 | 13.14 | 13.80 | 14.23 |
| Return Period (Year) | ||||||
|---|---|---|---|---|---|---|
| LULC | 2 | 5 | 10 | 25 | 50 | 100 |
| Built up area (km2) | 4.67 | 5.18 | 5.59 | 5.87 | 6.28 | 6.50 |
| Bare land (km2) | 3.75 | 3.93 | 4.45 | 4.58 | 4.69 | 4.85 |
| Vegetation (km2) | 1.87 | 2.09 | 2.42 | 2.56 | 2.65 | 2.70 |
| Water body (km2) | 0.09 | 0.10 | 0.11 | 0.14 | 0.17 | 0.17 |
| Total | 10.38 | 11.30 | 12.57 | 13.15 | 13.79 | 14.23 |
Disclaimer/Publisher’s Note: The statements, opinions and data contained in all publications are solely those of the individual author(s) and contributor(s) and not of MDPI and/or the editor(s). MDPI and/or the editor(s) disclaim responsibility for any injury to people or property resulting from any ideas, methods, instructions or products referred to in the content. |
© 2024 by the authors. Licensee MDPI, Basel, Switzerland. This article is an open access article distributed under the terms and conditions of the Creative Commons Attribution (CC BY) license (http://creativecommons.org/licenses/by/4.0/).


