Submitted:
15 February 2024
Posted:
15 February 2024
You are already at the latest version
Abstract
Ralstonia solanacearum is the pathogen responsible for Ralstonia solanacearum, which is soil-borne, infests plant conduits to cause disease.They are not easy to control and are harmful.Therefore the development of a controlled-release agent responsive to the pathogen's soil temperature and moisture conditions could aid in its control. Corn kernel powder is used as a carrier for Tetramycin biopesticide, with various compounds tested for bonding.They were then made by extrusion moulding.Temperature and wetness responsive components, including Pentaerythritol Tetrastearate, Pentaerythritol Tetraoleate, Polyethylene Glycol Stearate, and Polyethylene Glycol Monooleate,are compounded and coated onto Tetramycin cores to form an intermediate shell layer. Finally, Ethyl cellulose(EC)and Hydroxypropyl methyl cellulose(HPMC) are dissolved and sprayed onto the outermost layer to complete the pellet's shell layer.After the evaluation of texture performance test,DSC analysis,TG test,temperature and humidity response performance test, as well as pellet cross-section SEM observation, field effectiveness test, etc., the preferred formulations were screened.The results showed that the preferred Core formulation:Corn kernel powder:Tetramycin aqueous:Xanthan gum mass ratio=13.5:23:2; Intermediate Shell layer:PETS: PETO: PEG400MO mass ratio=10:30:10; and Outer Shell layer: Ethyl cellulose (EC):Hydroxypropyl methyl cellulose (HPMC) mass ratio=5:1.Under soil conditions of high incidence of Ralstonia solanacearum, i.e., sustained warmth (30-35℃) and high humidity (30% moisture content), the formulated pills showed a release rate of 95.18% to 96.24% over a period of 35 days. Moreover, they showed a stepwise cyclic release process under alternating warm and humid-dry and cold conditions.In field tests on tobacco, a relative preventive efficacy of 54.74% was achieved 106 days post-transplanting. Soil bacterial community structure analysis revealed a significant decrease (2.28-2.84 times) in the abundance of Solanaceae Raelia under Tetramycin pellet treatment compared to the control. Additionally, fungal community structure showed highter consistency initially across various soil depths, with diversity differences between soil layers reestablished later (106 days), while the predominant categories of bacteria and fungi remained unchanged.In this study, we successfully developed a nucleoshell-type slow-controlled release pill embedded with Tetramycin. This pill effectively responded to temperature and humidity changes, resulting in high efficacy in disease prevention.This development holds significant promise for effectively improving drug utilization and easing application challenges, offering broad prospects for Ralstonia solanacearum prevention and control in agriculture.
Keywords:
Tetramycin
; Ralstonia solanacearum
; kernel-shell granules
; wet-temperature dual response
1. Introduction
Ralstonia solanacearum is a bacterial soilborne disease caused by Ralstonia solanacearum, with a wide geographic distribution and a broad range of plant hosts, leading to severe economic losses worldwide throughout the year. Studies have shown that Ralstonia solanacearum typically initiates infection from wounds on plant roots, and following invasion, it produces significant amounts of extracellular polysaccharides (EPS) to obstruct the conduits, ultimately resulting in the characteristic symptom of wilting in half of the host’s leaves [1,2,3,4].After the host plant’s death, the bacteria return to the soil environment through saprophytism and then seek contact with new hosts to spread the infection [5].In the early stages of infection, plants do not exhibit obvious disease symptoms, and by the time symptoms of leaf wilting are observed, the disease has become difficult to reverse. Premature use of medication leads to drug wastage, posing significant challenges for precise drug application. Furthermore, outbreaks of Ralstonia solanacearum are often accompanied by high temperatures and heavy rains, which dilute the medication and reduce its concentration. Excessive medication usage can cause serious damage to the soil environment, making it challenging to prevent and control Ralstonia solanacearum [6,7,8].
In recent years, there has been a rapid growth in demand for environmentally friendly control methods, leading to an increasing preference for relatively gentle and harmless natural product drugs [9].Tetramycin is a broad-spectrum antibiotic produced through fermentation metabolism by the non-absorbent Streptomyces Wuzhou subspecies. It consists of four main components, namely Tetramycin A, Tetramycin B, Albonoursin, and Anisomycin, making it a novel type of natural agricultural antibiotic [10,11]. Among them, Tetramycin A and Tetramycin B belong to macrolide Tetramycin antibiotics, which have significant inhibitory effects on bacterial diseases; Albonoursin belongs to peptide pyrimidine nucleotide antibiotics, which have strong killing effects on fungal diseases; Anisomycin belongs to nitrogen-containing heterocyclic aromatic antibiotics, which can promote nutrient absorption in plants and enhance plant immunity [12,13,14]. Commonly used for preventing fungal and bacterial diseases, and can rapidly decompose into non-toxic compounds after use, aligning with today’s green control principles [15]. Xiaozhou Ma et al. utilized hydrogel encapsulation loaded with Tetramycin for controlling Ralstonia solanacearum, and the experimental results demonstrated that Tetramycin could effectively control the occurrence of Ralstonia solanacearum [16].In this study, temperature-sensitive carriers that can respond to temperature changes were prepared by taking advantage of the fact that Pentaerythritol Tetrastearate (PETS), Pentaerythritol Tetraoleate (PETO), and poly(ethylene glycol) monooleate (PEG400MO) have different melting points and can be mixed in arbitrary ratios. Additionally, moisture-responsive shells were prepared using water-soluble Hydroxypropyl methyl cellulose (HPMC) and alcohol-soluble Ethyl cellulose (EC). HPMC and EC were utilized to create humidity-responsive shells. As a result, the release rate of tetramycin is controlled by the environmental temperature and humidity to effectively extend the duration of tetramycin’s efficacy. Under laboratory conditions, the temperature responsiveness of the temperature-sensitive carrier and the textural parameters of HPMC-EC were characterized and analyzed. In the field environment, the pill’s effectiveness against the target was investigated. A core-shell slow-controlled release pill was prepared with drug release behavior matching the temperature and humidity variations during the growth of cyanobacteria. This provides a new method to enhance the efficiency of drug utilization in agricultural production.
2. Results
2.1. Results of Core Formulation Screening
Based on the information provided in Table 2-1, the core materials from various formulations were pour into the automatic pill-making machine. The weight of the pills produced by the machine in one minute, as well as the quality and integrity of the pills, were recorded and evaluated. Additionally, the core particles were subjected to texture analysis using a Texture Analyzer.
As indicated in Table 2-1 and Figure 2-1, when compared to the other experimental groups, the particle morphology of A3 was superior, exhibiting higher integrity and a faster discharge rate. Corroborating this, the textural data provided in Table 2-2 revealed that A3 particles possessed strong springiness and cohesiveness, along with an average hardness. Consequently, the particles formed were of better quality and less prone to breakage, aligning with the experimental findings presented Table 2-1 and Figure 2-1. Therefore, A3 was chosen as the core material.

Table 2-1.
Minute Yield and Sensory Evaluation of Different Formulation Drug Cores.
| Sample Names | Yield Rate (g/min) | Sensory Evaluation |
|---|---|---|
| A1 | 26.62±7.93bc | Extrusion difficulties |
| A2 | 40.53±5.63b | Poorly formed and broken pills |
| A3 | 60.70±3.26a | Good ball formation, partially sticking to the knife |
| A4 | 56.54±4.68a | Sticky knife, fluffy balls |
| A5 | 23.93±13.01c | Extrusion difficulties |
Table 2-2.
Differential Analysis of Texture Parameters for Different Formulation Drug Cores.
| Sample Names | Hardness/g | Springiness/g·s | Cohesiveness |
|---|---|---|---|
| A1 | 267.198±16.819c | 0.986±0.037a | 0.493±0.048a |
| A2 | 394.755±30.142a | 0.047±0.003c | 0.049±0.001c |
| A3 | 361.108±10.692ab | 1.008±0.111a | 0.460±0.069a |
| A4 | 284.864±10.533c | 0.569±0.131b | 0.081±0.038c |
| A5 | 335.023±22.560b | 1.008±0.014a | 0.281±0.141b |
Annotate: Data are presented as the mean±SD based on three biological replicates, Different letters represent significant difference(p < 0.05).
2.2. Intermediate Layer Shell Formulation Screening Results
The softening point of Pentaerythrityl Tetrarastearate (PETS) is 63.8 °C, while the softening point of Polyethylene Glycol Stearate (PEG400MS) is 34.1 °C. Pentaerythrityl Tetraoleate and Polyethylene Glycol Monooleate are in liquid form at room temperature. Thus it is possible to adjust the ratio of PETS, PETO and PEG400 to act as a temperature response.
The softening points and DSC absorption peaks of the oil phase samples with different ratios are presented in Table 2-3, and the thermal behaviors of the oil phase samples during the DSC and TGA analyses are depicted in Figure 2-2 and Figure 2-3. As shown in Figure 2-2(a), it can be observed that the softening point gradually decreases with the increasing addition of PEG400MS, and the DSC absorption peaks also progressively shift towards lower temperatures as the amount of PEG400MS with a low melting point increases. The effect of adding PEG400MO, as shown in Figure 2-2(b), is consistent with that of PEG400MS.From Figure 2-2, it can be observed that the melting point of PETS is at 51.42 °C. With the addition of PEG400, a clear decreasing trend in the melting point can be observed. The DSC plots of the sample groups M1-1~M1-6 all exhibit two heat-absorption peaks, which could be attributed to the shock-cooling treatment (60℃-0℃ice/water bath) that the samples underwent. During this process, the low melting point of unsaturated PEG400MS inhibited the crystallization behavior of PETS, potentially resulting in the formation of partially crystallized amorphous solids with a lower softening point [17].As a result, formulations M1-4 and M2-1 were initially chosen for the composition of the grease material shell. The TGA results depicted in Figures 2-3 reveal that the components including PETS, PETO, PEG400MS, PEG400MO, as well as the formulations M1-4 and M2-1 under consideration, are thermally stable within the temperature range corresponding to the DSC results.
Figure 2-2.
DSC Analysis Chart of Outer Shells with Different Ratios of Fat Materials.
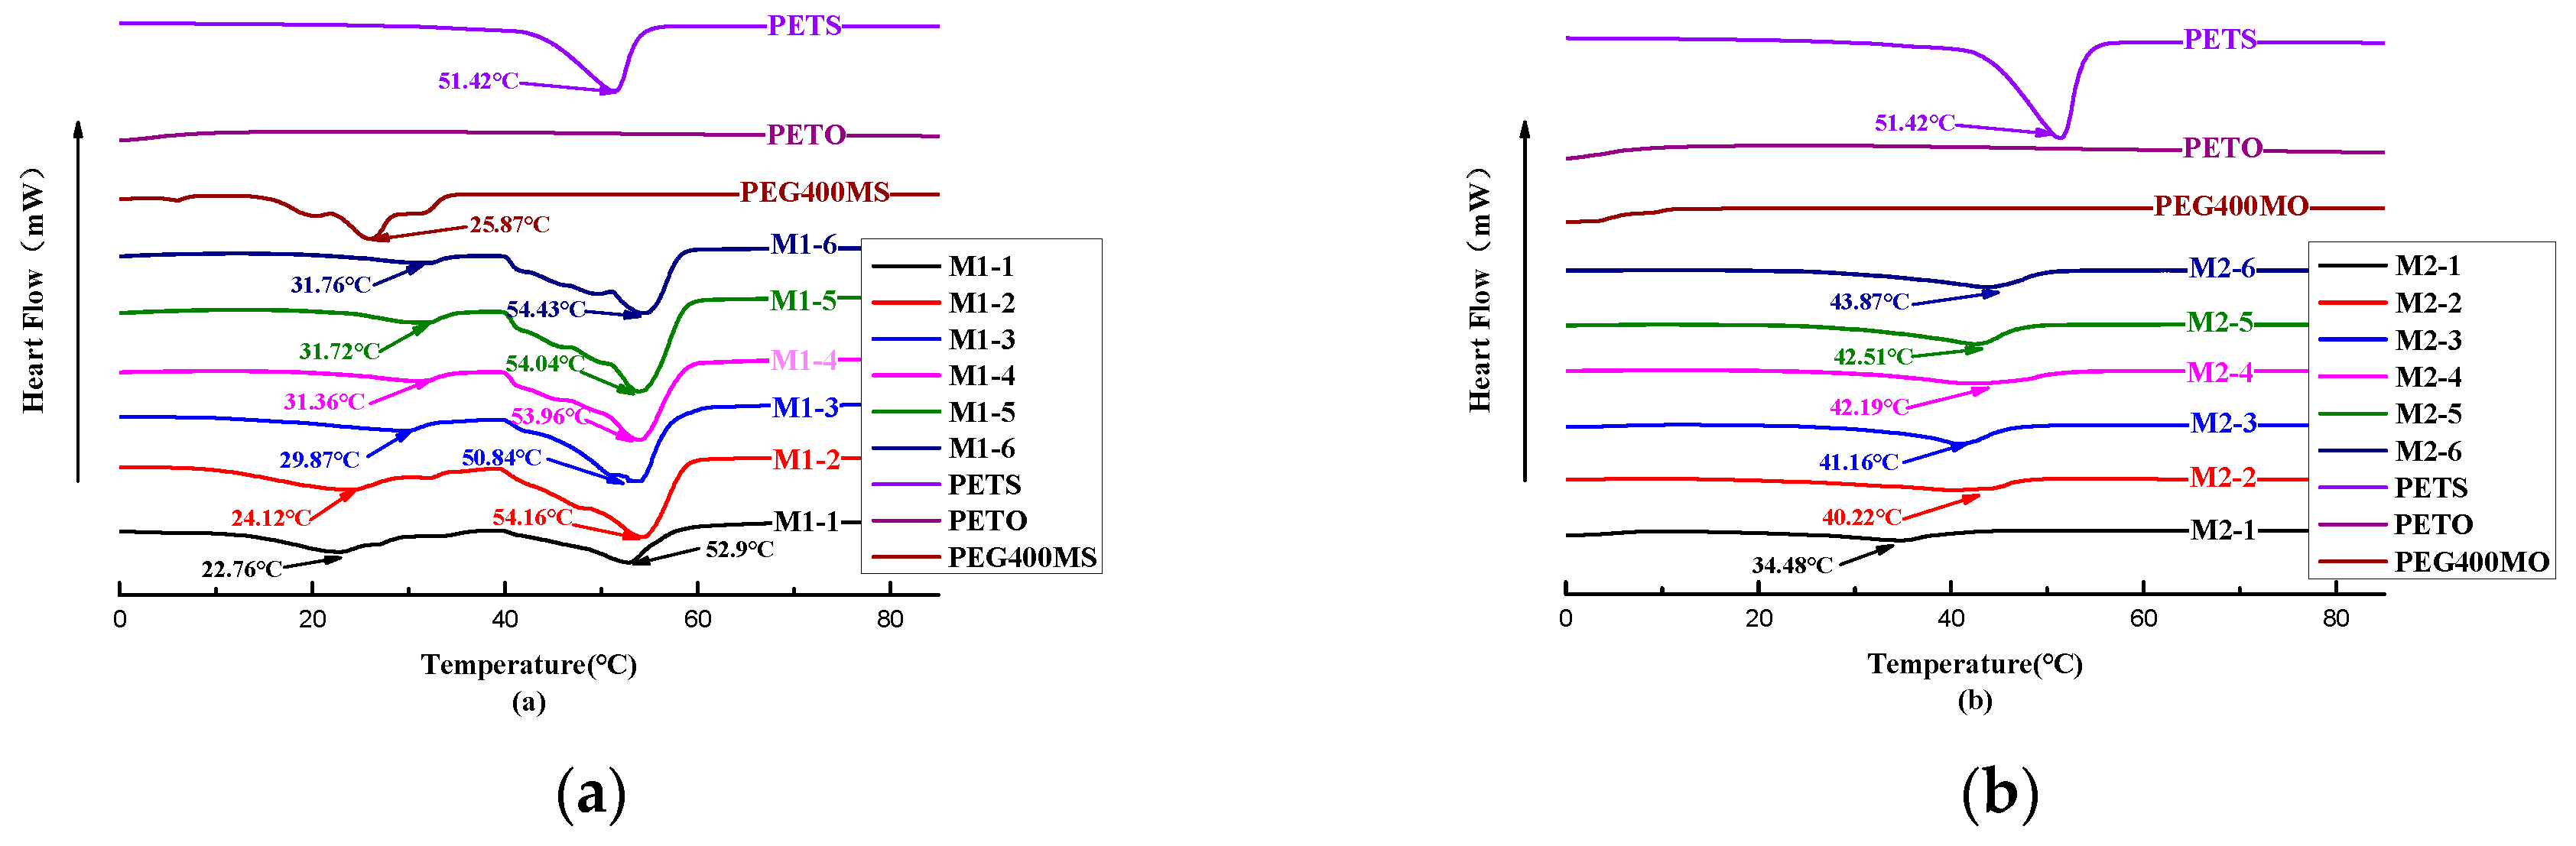
Figure 2-3.
TGA Analysis Chart of Outer Shells with Different Ratios of Fat Materials.
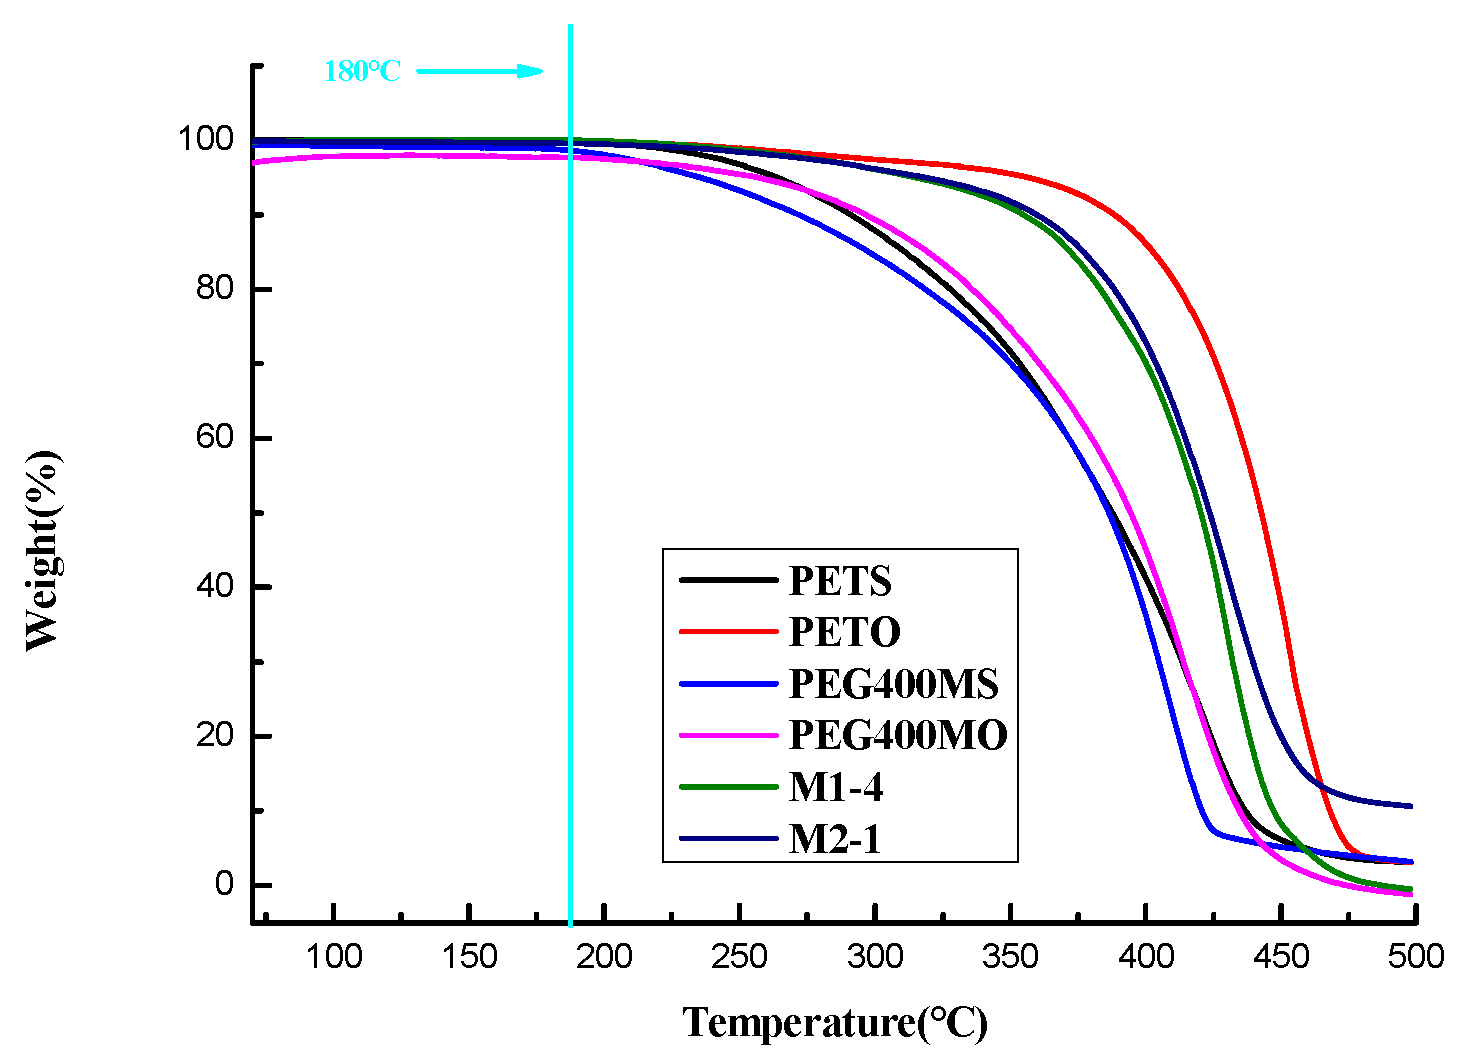
Table 2-3.
The Softening Point Determination Results of Fat Material Shell Formulation.
| Sample Names | Softening Points (°C) | Endothermic Peaks in DSC (°C) |
|---|---|---|
| M1-1 | 30.7 | 22.76, 52.90 |
| M1-2 | 31.2 | 24.12, 54.16 |
| M1-3 | 31.8 | 29.87, 50.84 |
| M1-4 | 32.7 | 31.36, 53.96 |
| M1-5 | 35 | 31.72, 54.04 |
| M1-6 | 44.1 | 31.76, 54.43 |
| M2-1 | 32.8 | 34.48 |
| M2-2 | 35.4 | 40.22 |
| M2-3 | 37.2 | 41.16 |
| M2-4 | 38.2 | 42.19 |
| M2-5 | 39.2 | 42.51 |
| M2-6 | 40.2 | 43.87 |
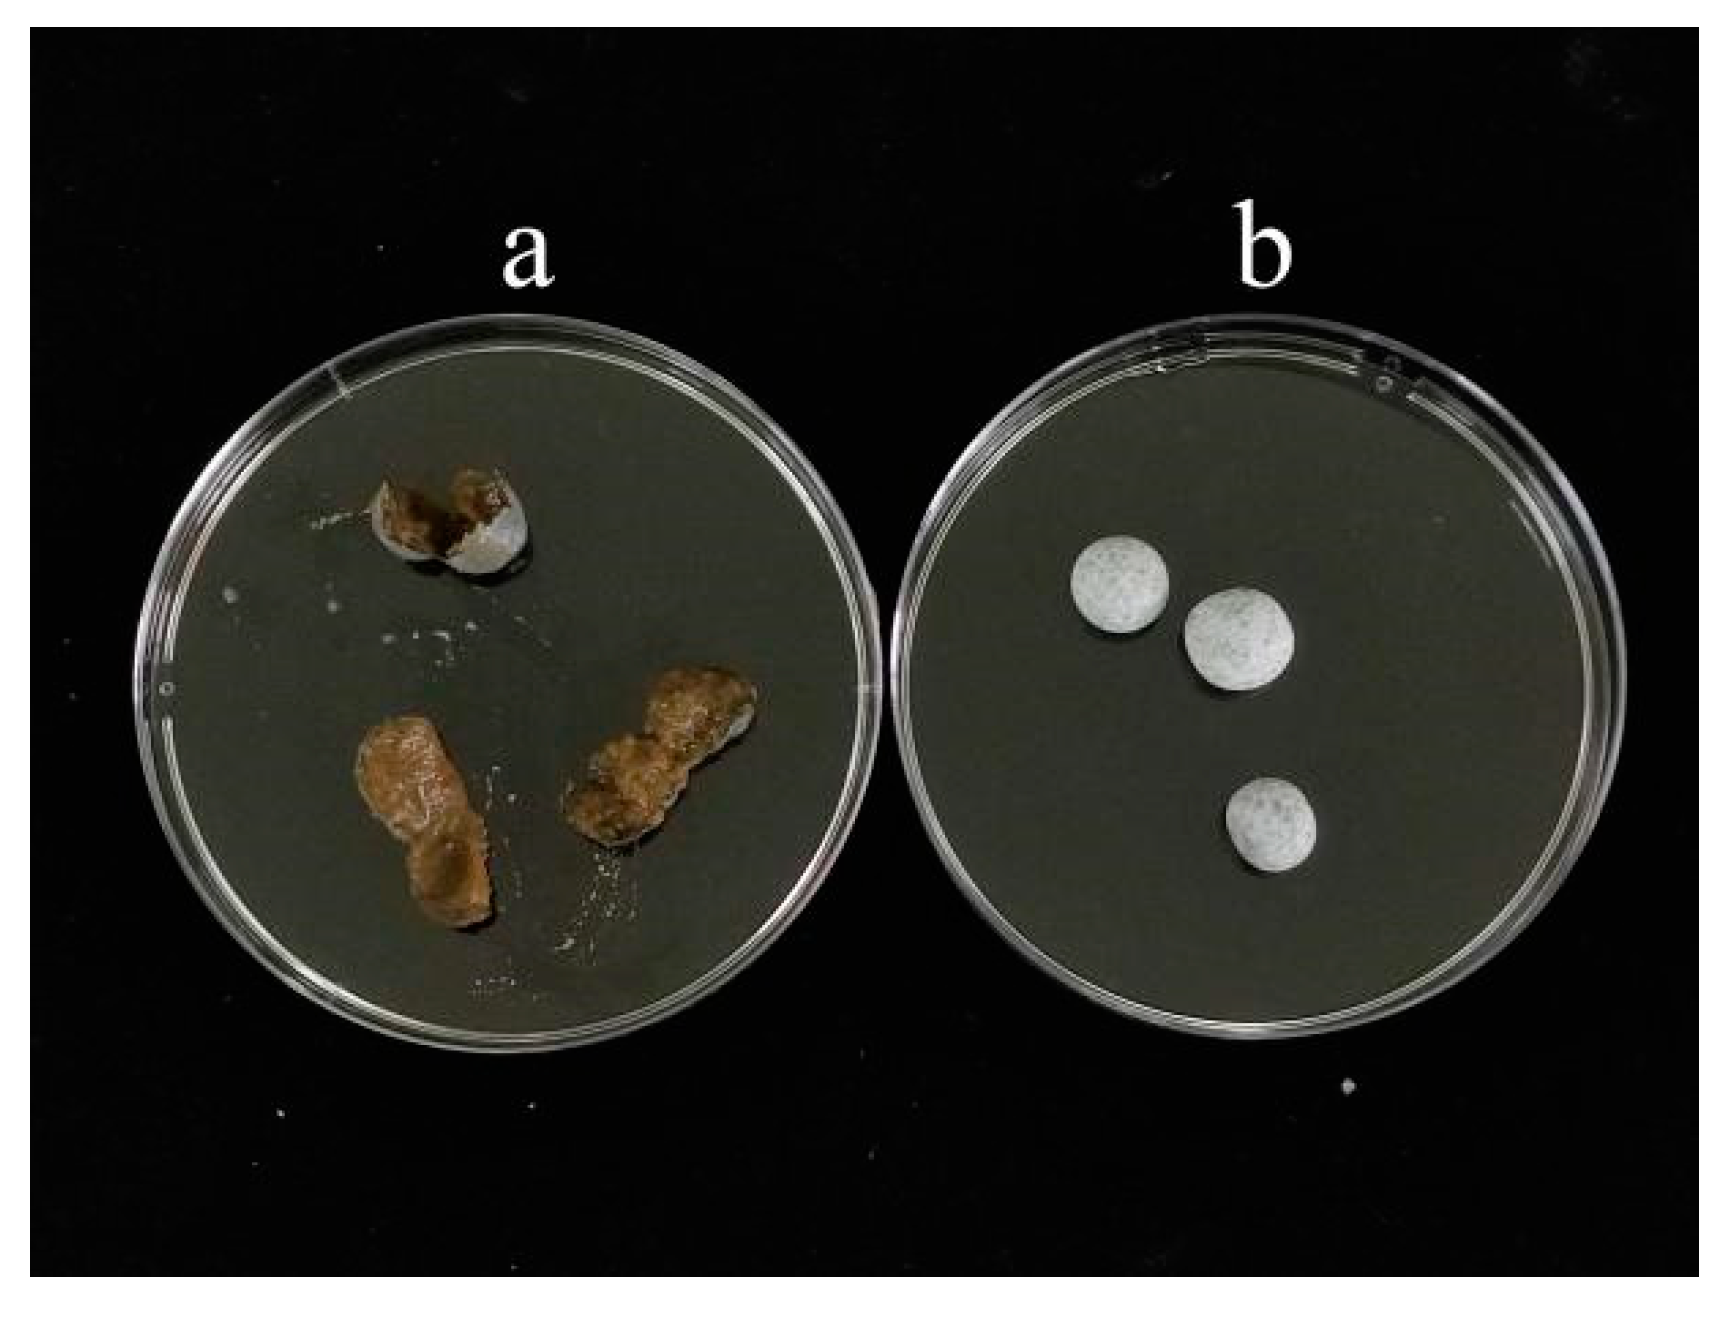
Examining Figure 2-4(a), it becomes evident that the pill pellets containing PEG400MS exhibit dissolution cracking of the core after 15 days of immersion in water, with particularly severe cracking observed at 30 and 35 °C. This phenomenon may be attributed to the fact that both PEG400MS and PEG400MO are effective amphiphilic compounds, and a moderate addition of these compounds can provide some humidity response to the temperature-sensitive material shells. PEG400MS, being a long-chain fatty acid, possesses various hydrophilic groups like aldehyde (-CHO) and carboxyl (-COOH), which offer superior hydrophilicity when compared to PEG400MO with its hydrophobic oleic acid chains. This increased hydrophilicity may make it more likely for moisture to penetrate into the core, causing the kernel to dissolve, resulting in the observed dissolution cracking [18,19].On the other hand, PEG400MS, being a long-chain fatty acid, possesses a more rigid molecular structure, which may render the shell layer more brittle and prone to cracking when used as an oil shell material. In contrast, PEG400MO is softer and can better encapsulate the pill’s core, preventing cracking due to water absorption and swelling. Figure 2-6 shows the pills after soaking in water, highlighting the differences in their conditions.
In Figure 2-5, a temperature-sensitive material shell containing beet red is formed into a small ball and placed in 35℃ water. It can be observed that M2-6, without the addition of PEG400MO, does not release beet red, while the addition of PEG400MO results in increased release of beet red, indicating that the presence of a hydrophilic and pliable material is necessary to facilitate drug release. Therefore, M2-1 is deemed more suitable as a grease shell material.
Figure 2-4.
Condition of Soaking M1-4(a) and M2-1(b) at Different Temperatures (20, 25, 30, 35 °C) for 15 Days.
Figure 2-4.
Condition of Soaking M1-4(a) and M2-1(b) at Different Temperatures (20, 25, 30, 35 °C) for 15 Days.
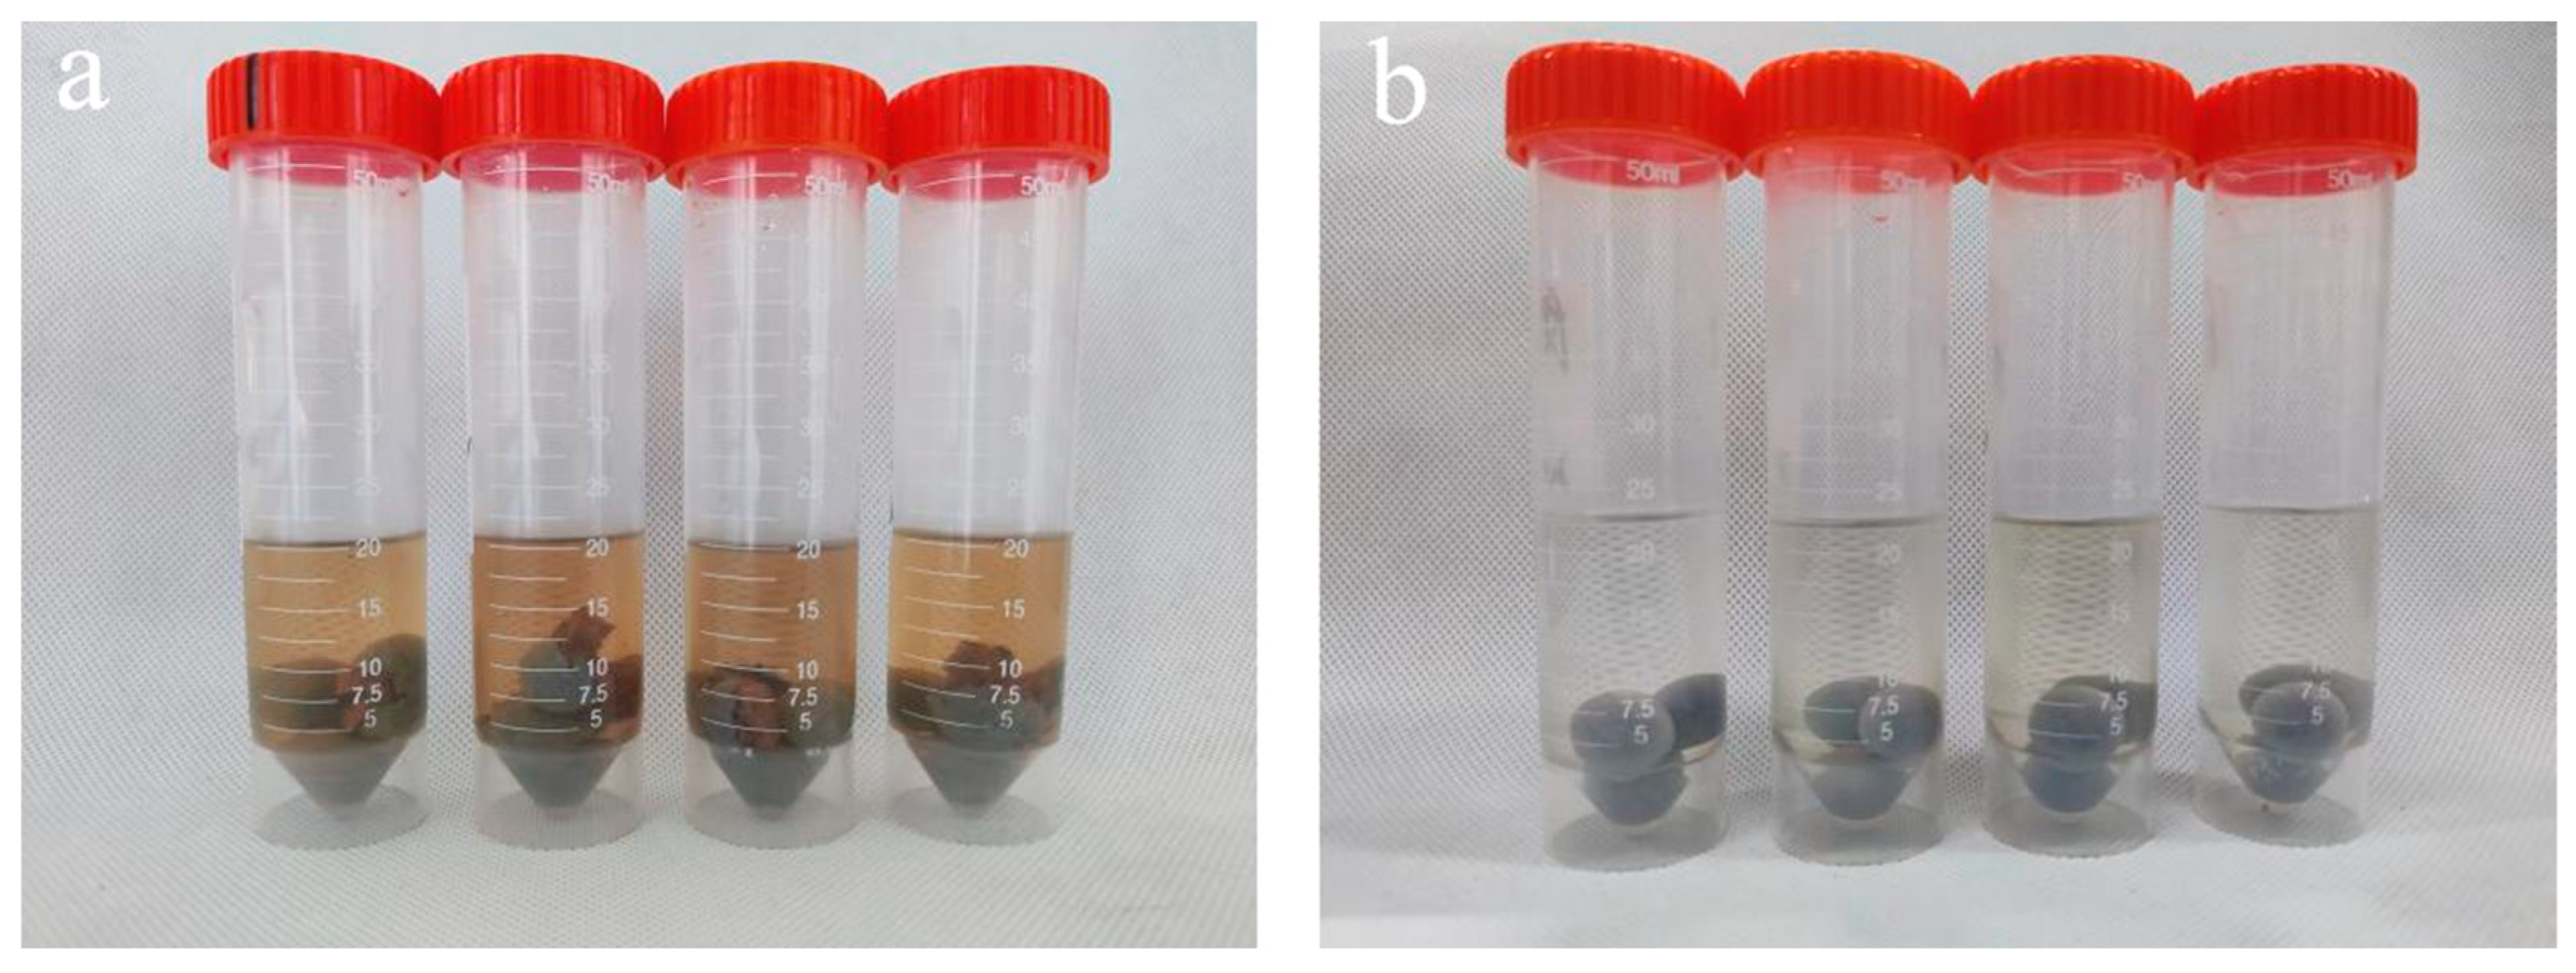
Figure 2-5.
M2-1~M2-6 Temperature-Sensitive Material Shell Releases Beetroot Red.
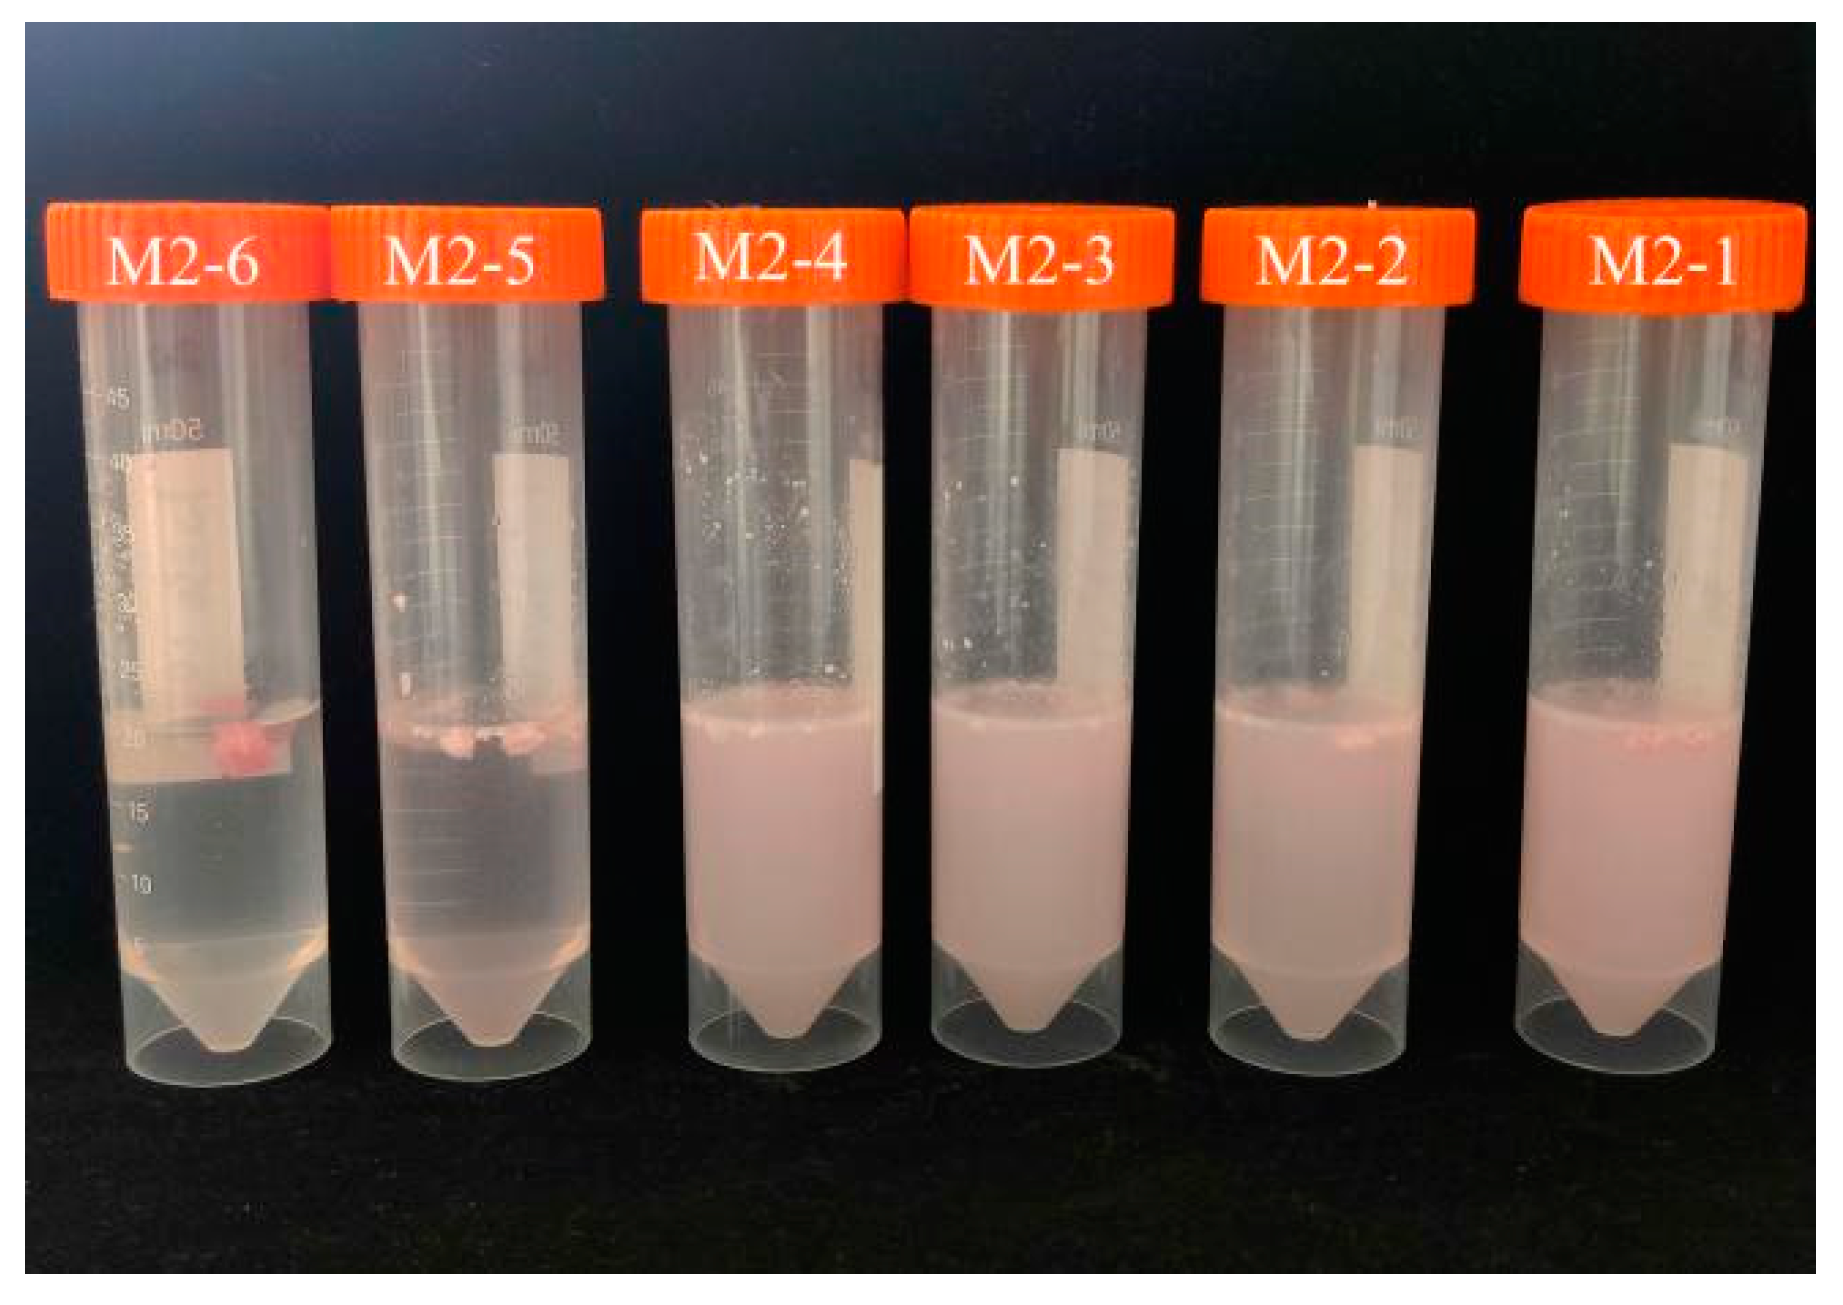
Figure 2-6.
The image of pill M1-4(a) and M2-1(b) after soaking in water.
2.3. Outer Shell Formulation Screening Results
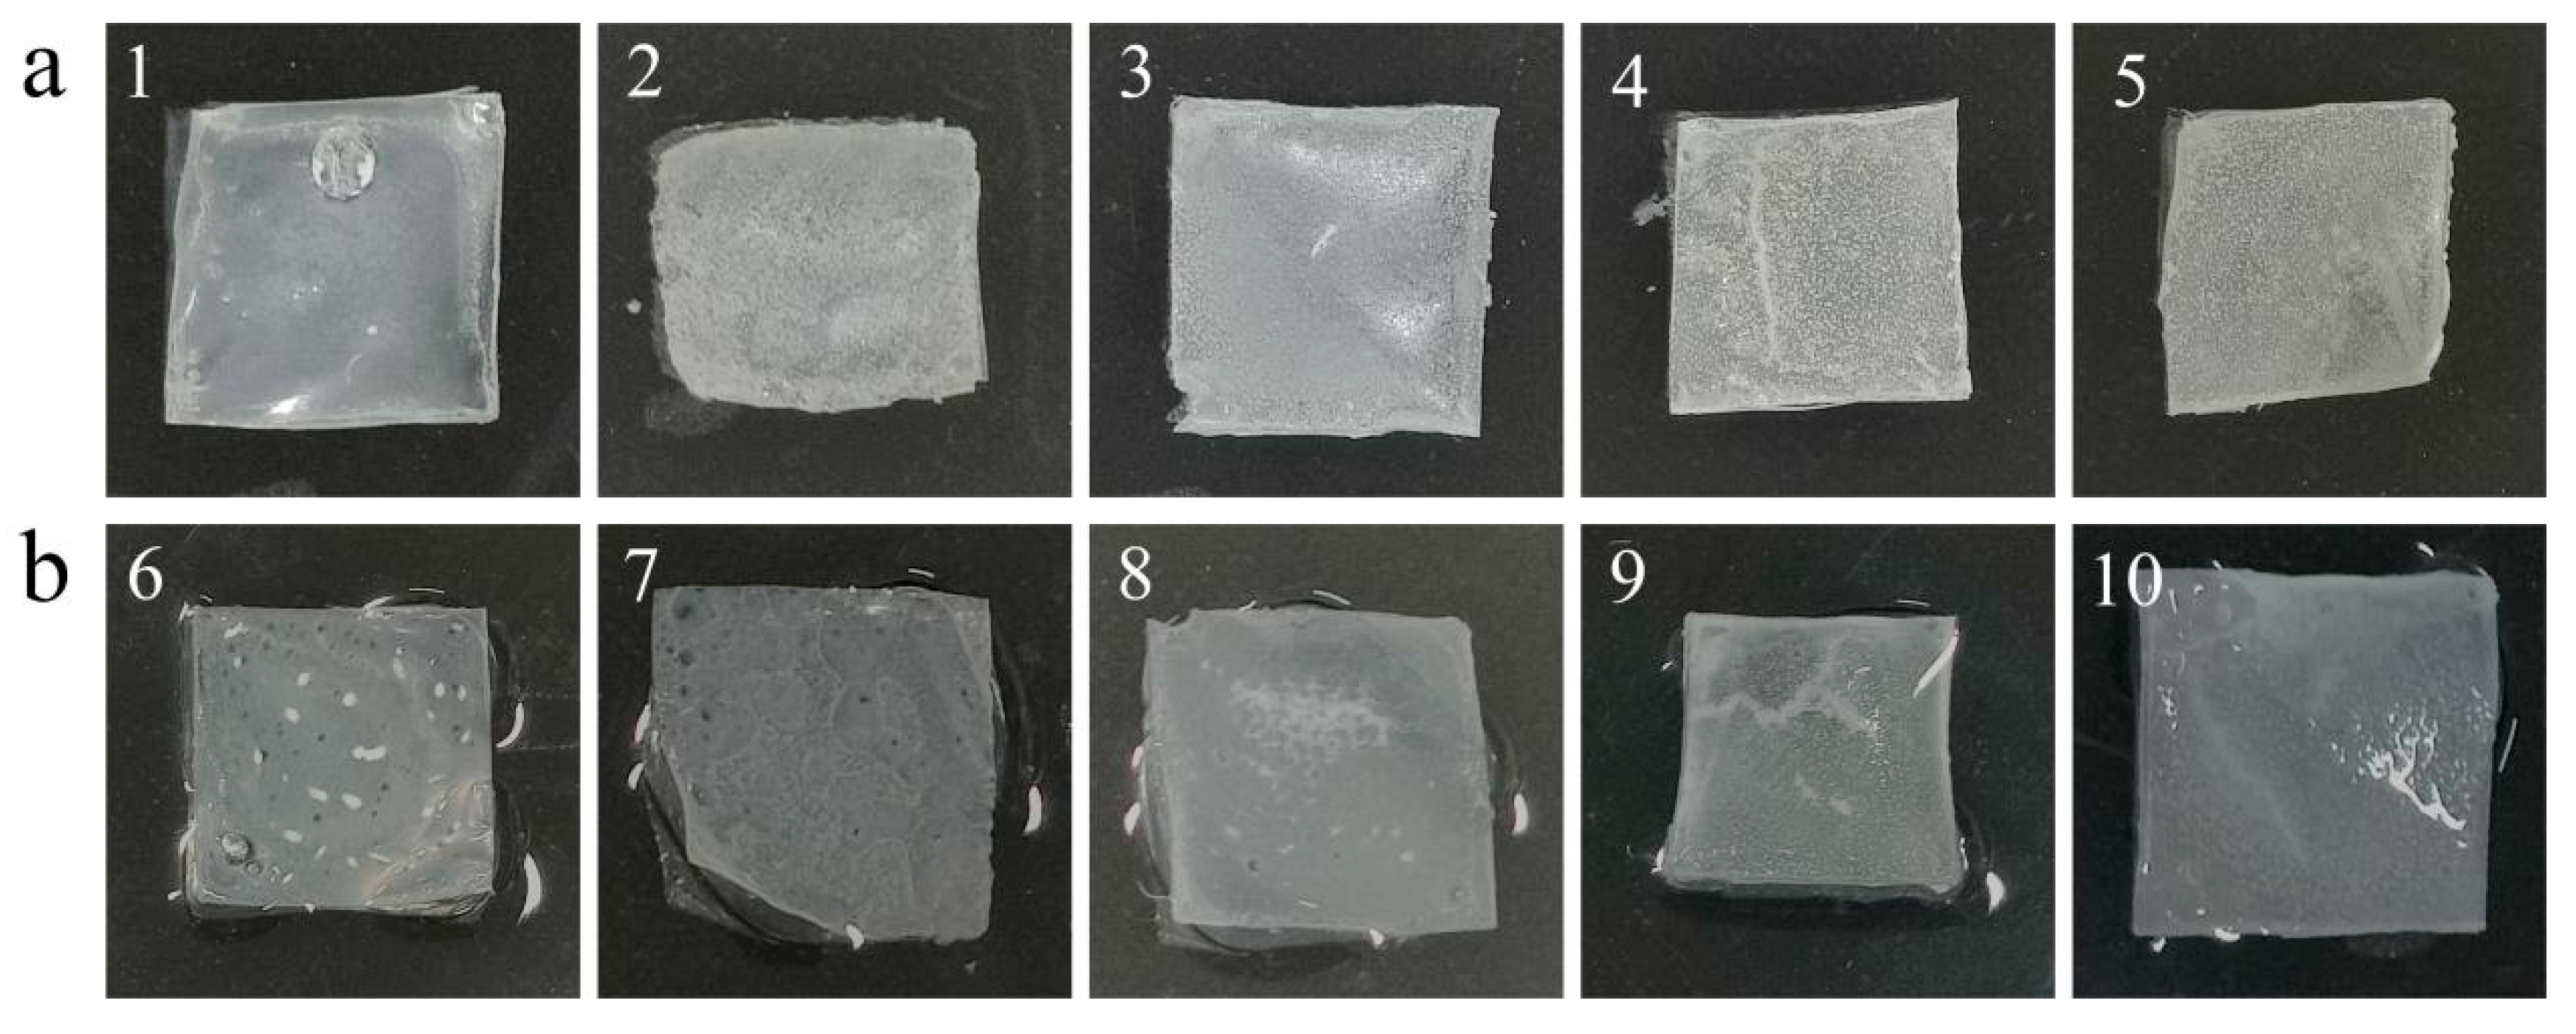
Figure 2-5 displays the morphology of outer shells with various ratios before water soaking (a) and after water soaking (b) at 35℃for 30 days. In this figure, numbers 1-5 correspond to HE1-HE6 respectively, while numbers 6-7 correspond to HE1-HE6 after water soaking. Upon observing Figure 2-5, it becomes evident that after 30 days, samples 4 and 5, which contain a higher proportion of EC, and samples 9 and 10, with an equal proportion, appear to be curled and possess a rough texture that is hard to touch. They are also prone to breakage upon extrusion, especially in the case of samples 4 and 5 without water soaking. Conversely, samples 1, 2, and 3, with a lower proportion of EC, and samples 6, 7, and 8, with the same proportion, have smoother textures that are tough and less prone to folding. However, samples 1, 2, 6, and 7 have thinner textures on the entire surface and lack springiness.
Figure 2-5.
Morphology of different ratios of outer shells (HE1-HE6 arranged from left to right) after 30 days at 35 °C without immersion (a) and after immersion (b).
Figure 2-5.
Morphology of different ratios of outer shells (HE1-HE6 arranged from left to right) after 30 days at 35 °C without immersion (a) and after immersion (b).
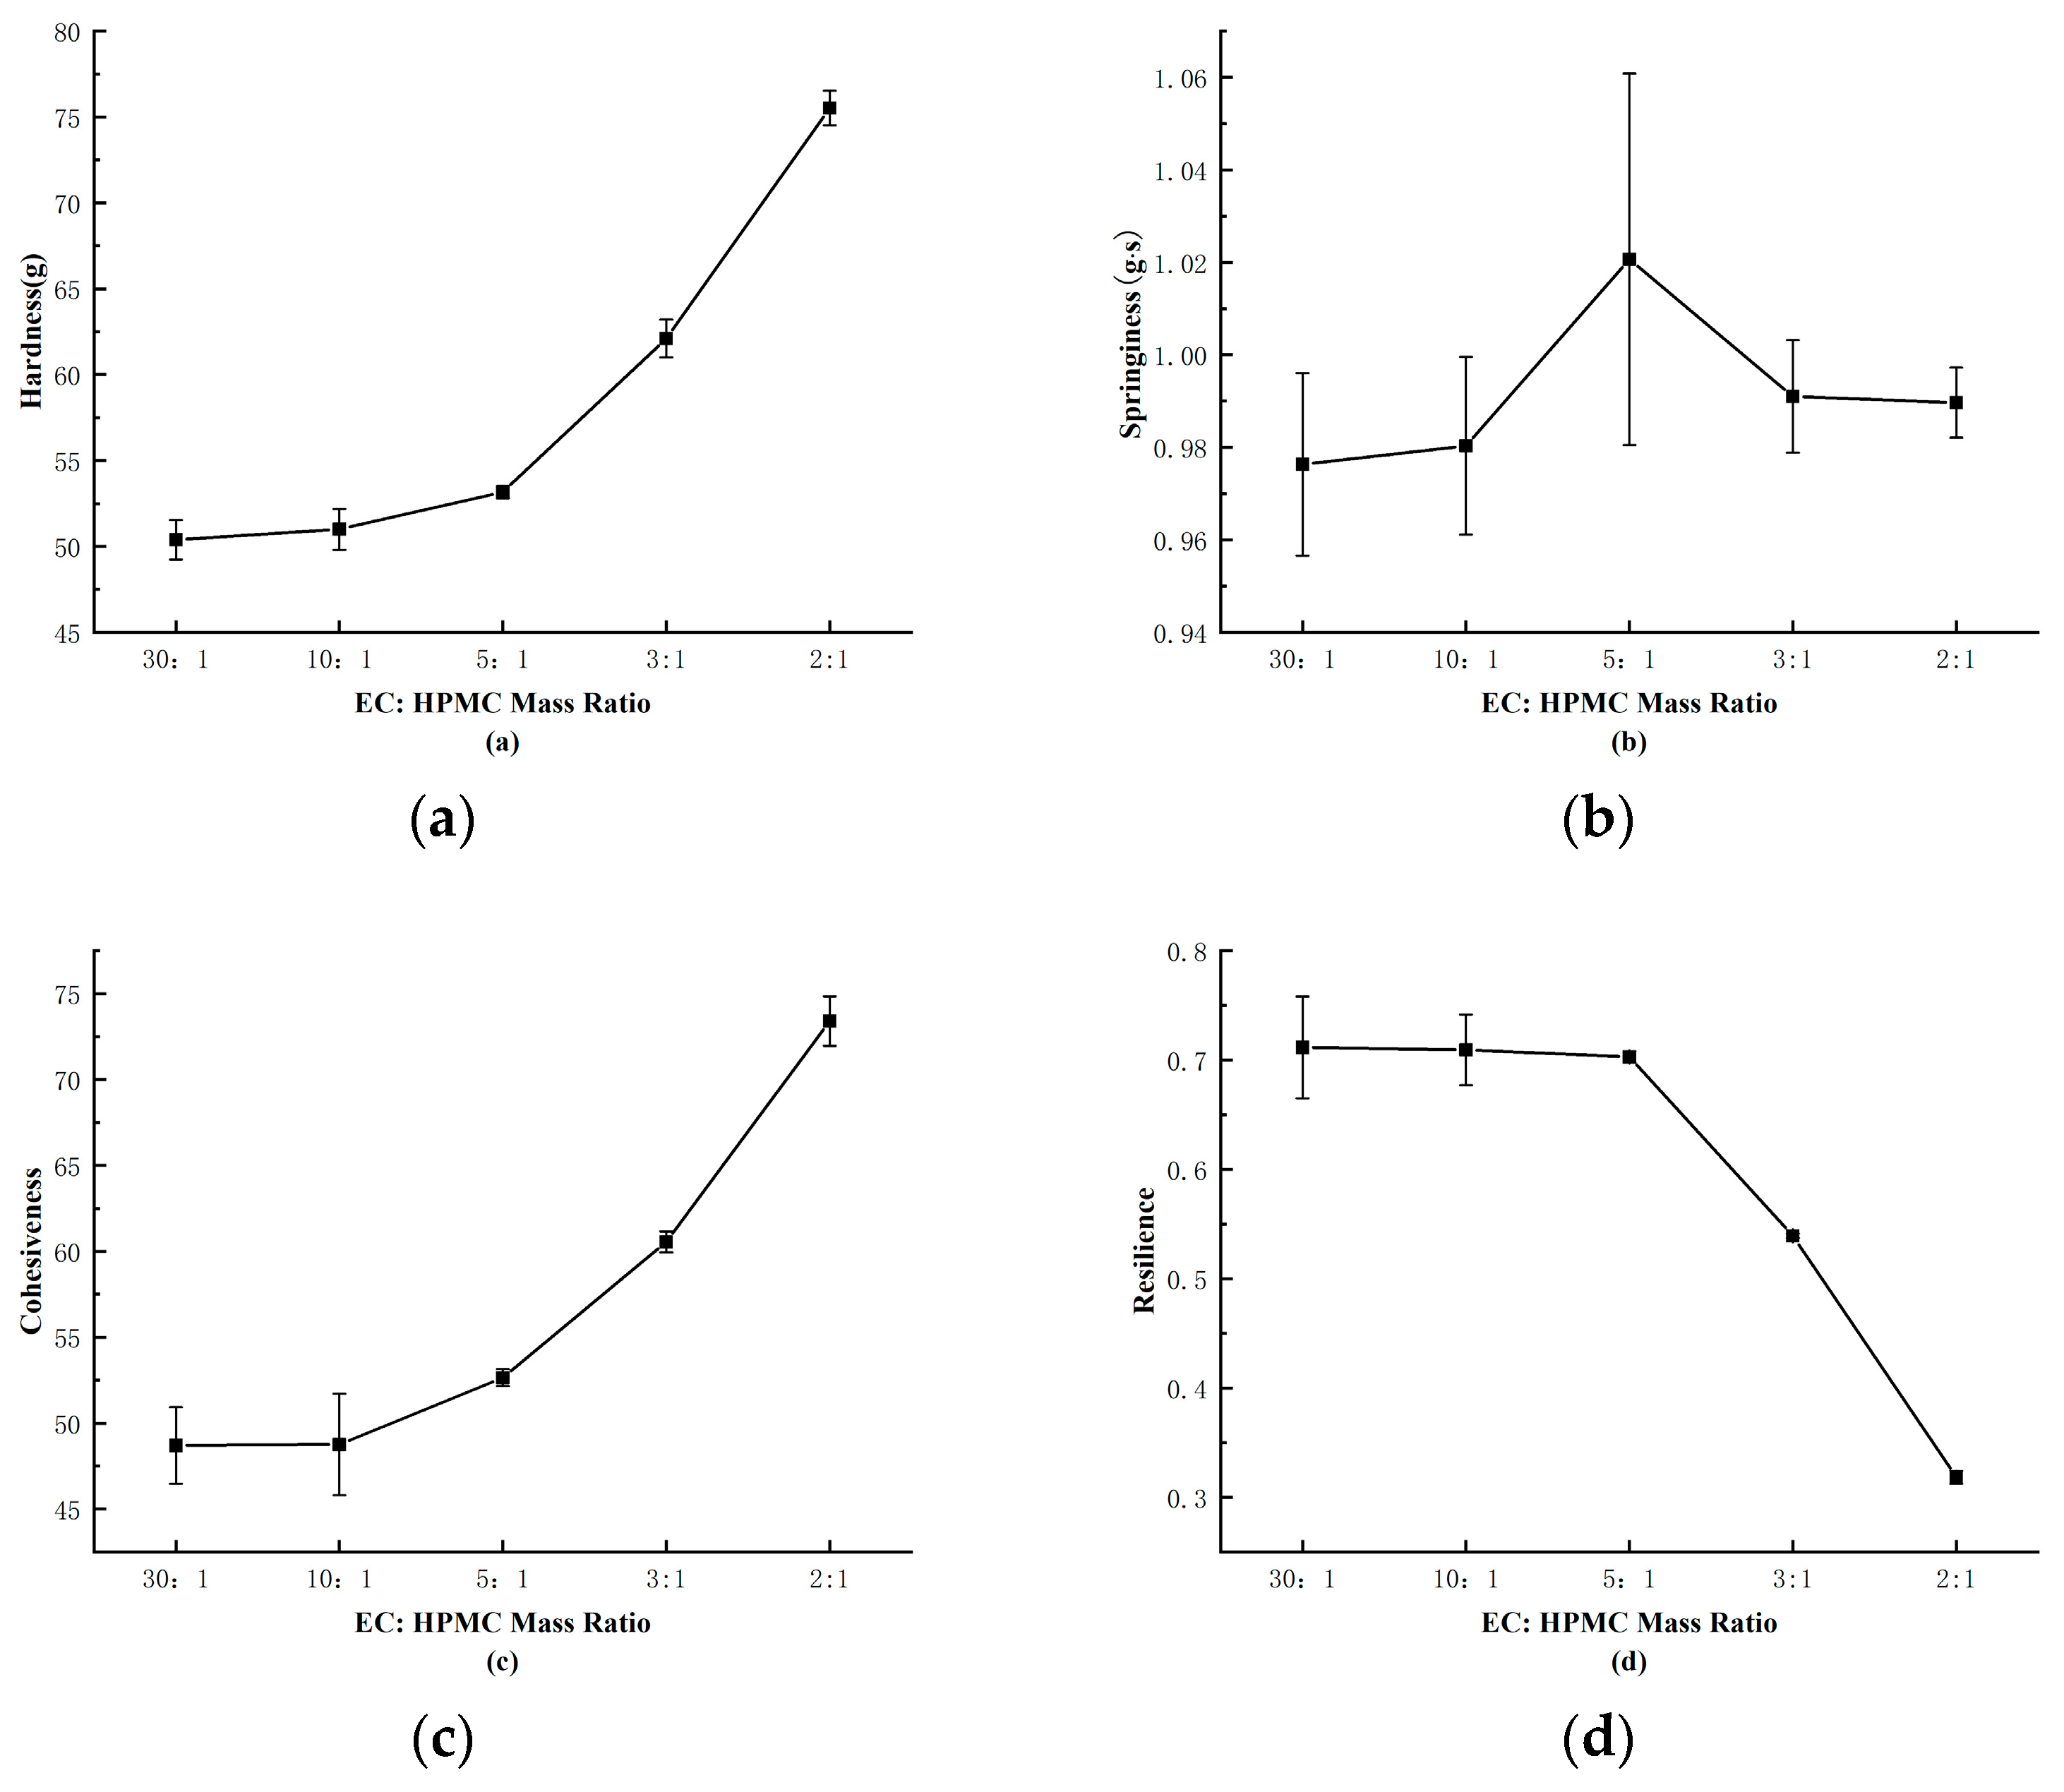
Observing Figure 2-5(c), it can be noted that the viscosity of the outer shell increases with the rise in HPMC content. Since the production of tetracycline delayed-release granules requires the use of a motorized spray gun to uniformly apply the outer shell. Excessive viscosity can make it challenging to spray the shell uniformly, leading to uneven coating of the pill. As shown in Figure 2-4(a) and Figure 2-4(b), the hardness of the shell also increases with higher HPMC content, while optimal springiness is achieved at an EC:HPMC mass ratio of 5:1.
In Figure 2-4(d), it can be observed that the toughness and resilience of the shell decrease with increasing HPMC content. These findings are consistent with the observations in Figure 2-5. The primary role of the outer shell is to encapsulate the pill while providing some humidity response. Good springiness ensures that the pill does not dissolve or rupture due to water absorption, moderate hardness prevents easy breakage, and the water-soluble nature of HPMC allows the shell to expand when in contact with water, enlarging the pore channels. Excessive HPMC addition can lead to excessively rapid drug release [20]. Therefore, the EC:HPMC mass ratio of 5:1 was selected as the formulation for the shell material, as it offers good toughness, resilience, and suitability for the pill shell.
Figure 2-6.
Analysis of the Amount of Added HPMC on the Texture Parameters of outer shells.
2.4. Tetramycin Standard Curve
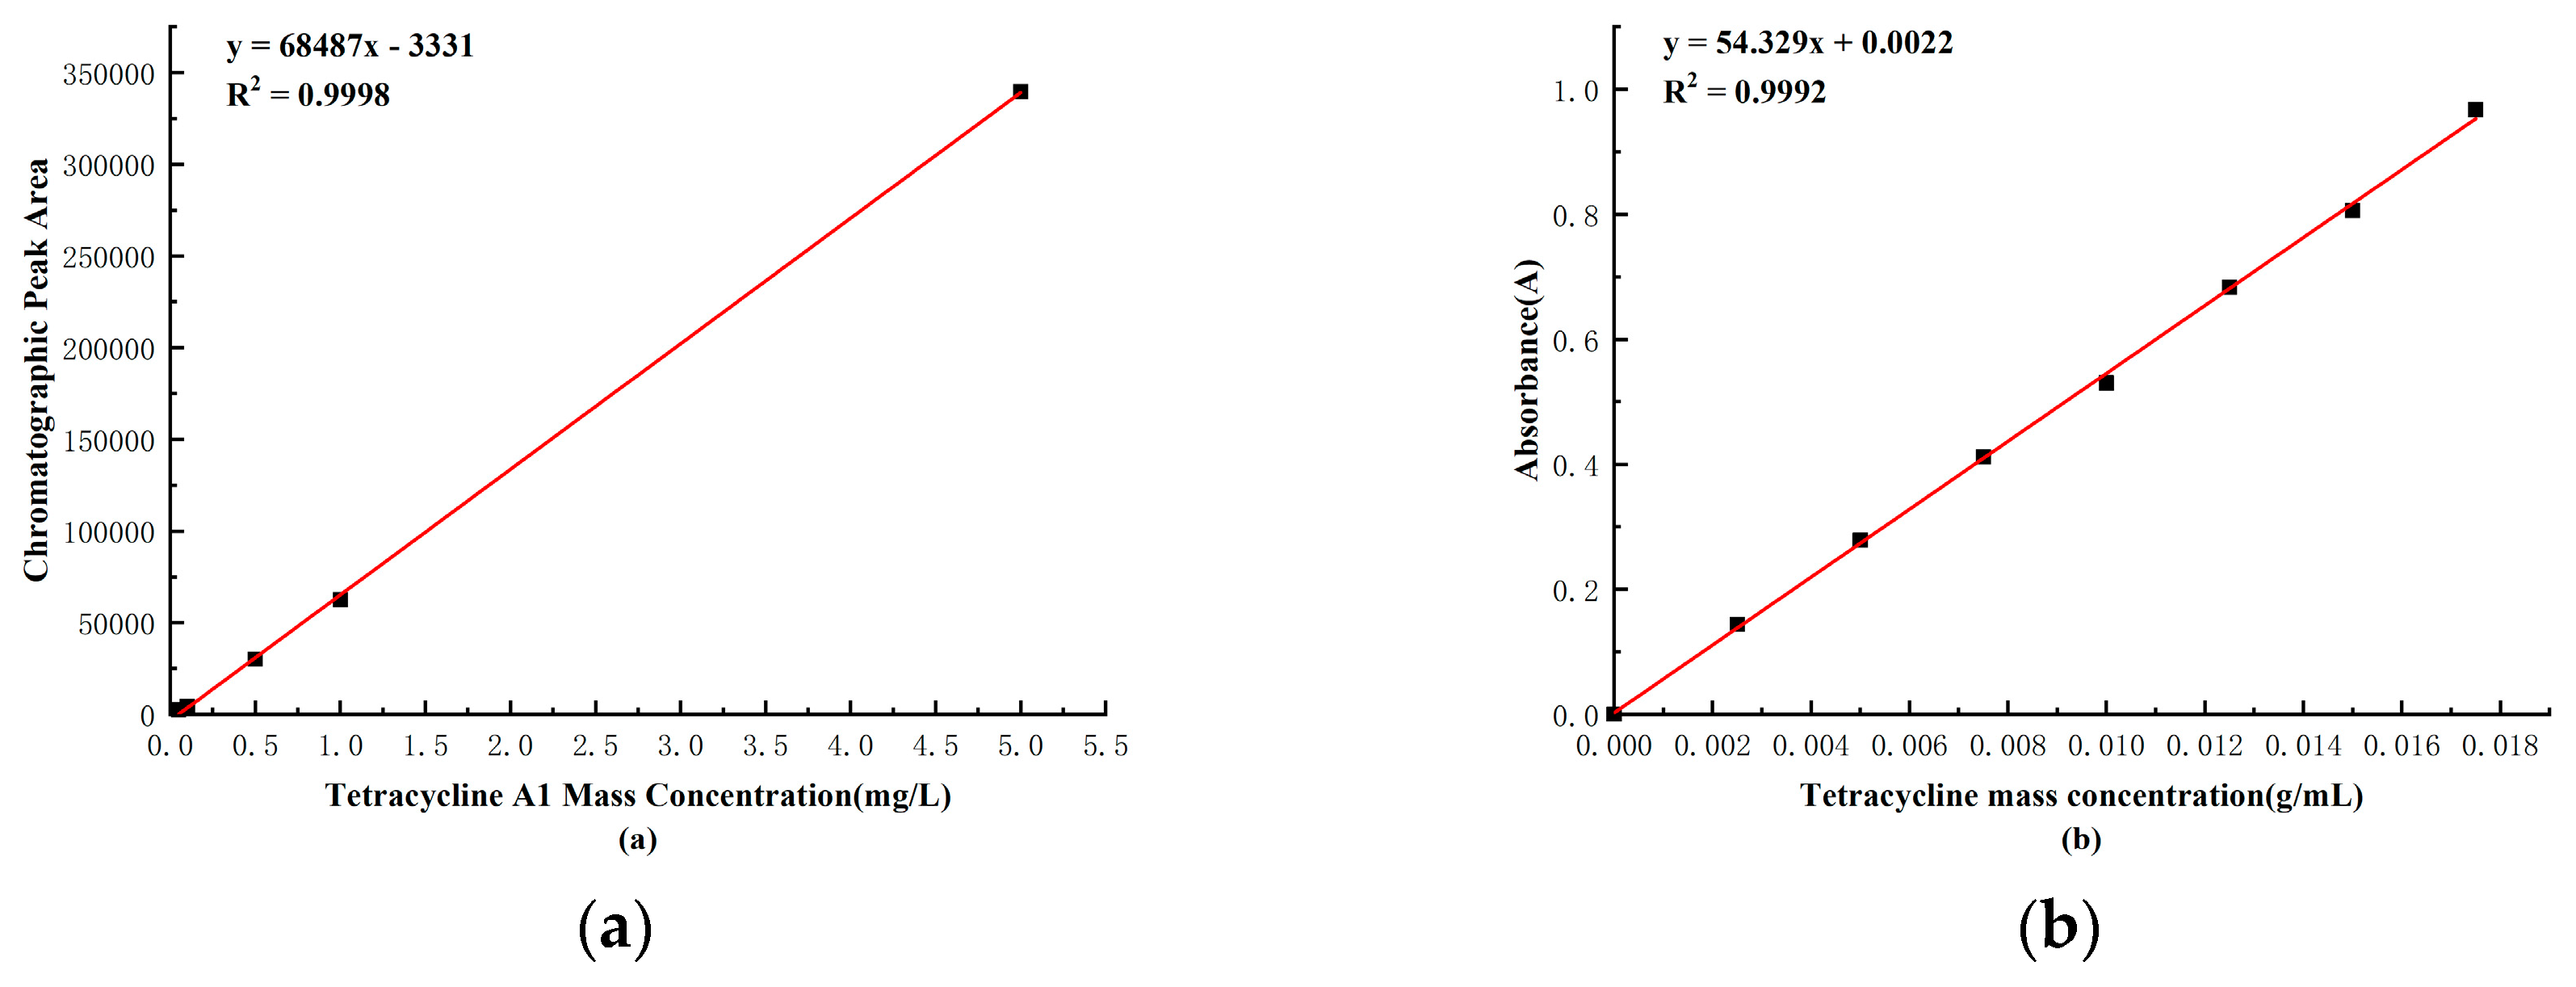
Observing Figure 2-7(a), a strong linear relationship was evident between the mass concentration of Tetramycin A1 and the chromatographic peak area. As shown in Figure 2-7(b), there was also a strong linear relationship between the mass of Tetramycin and the absorbance. Based on the standard curve established, subsequent experiments can accurately calculate the mass of Tetramycin using either the chromatographic peak area or absorbance.
Figure 2-7.
The Standard Curves of Mass Concentrations for Tetracycline A1 and Tetracycline.
2.5. Observation of the Microstructure of the Shell Layer Using SEM
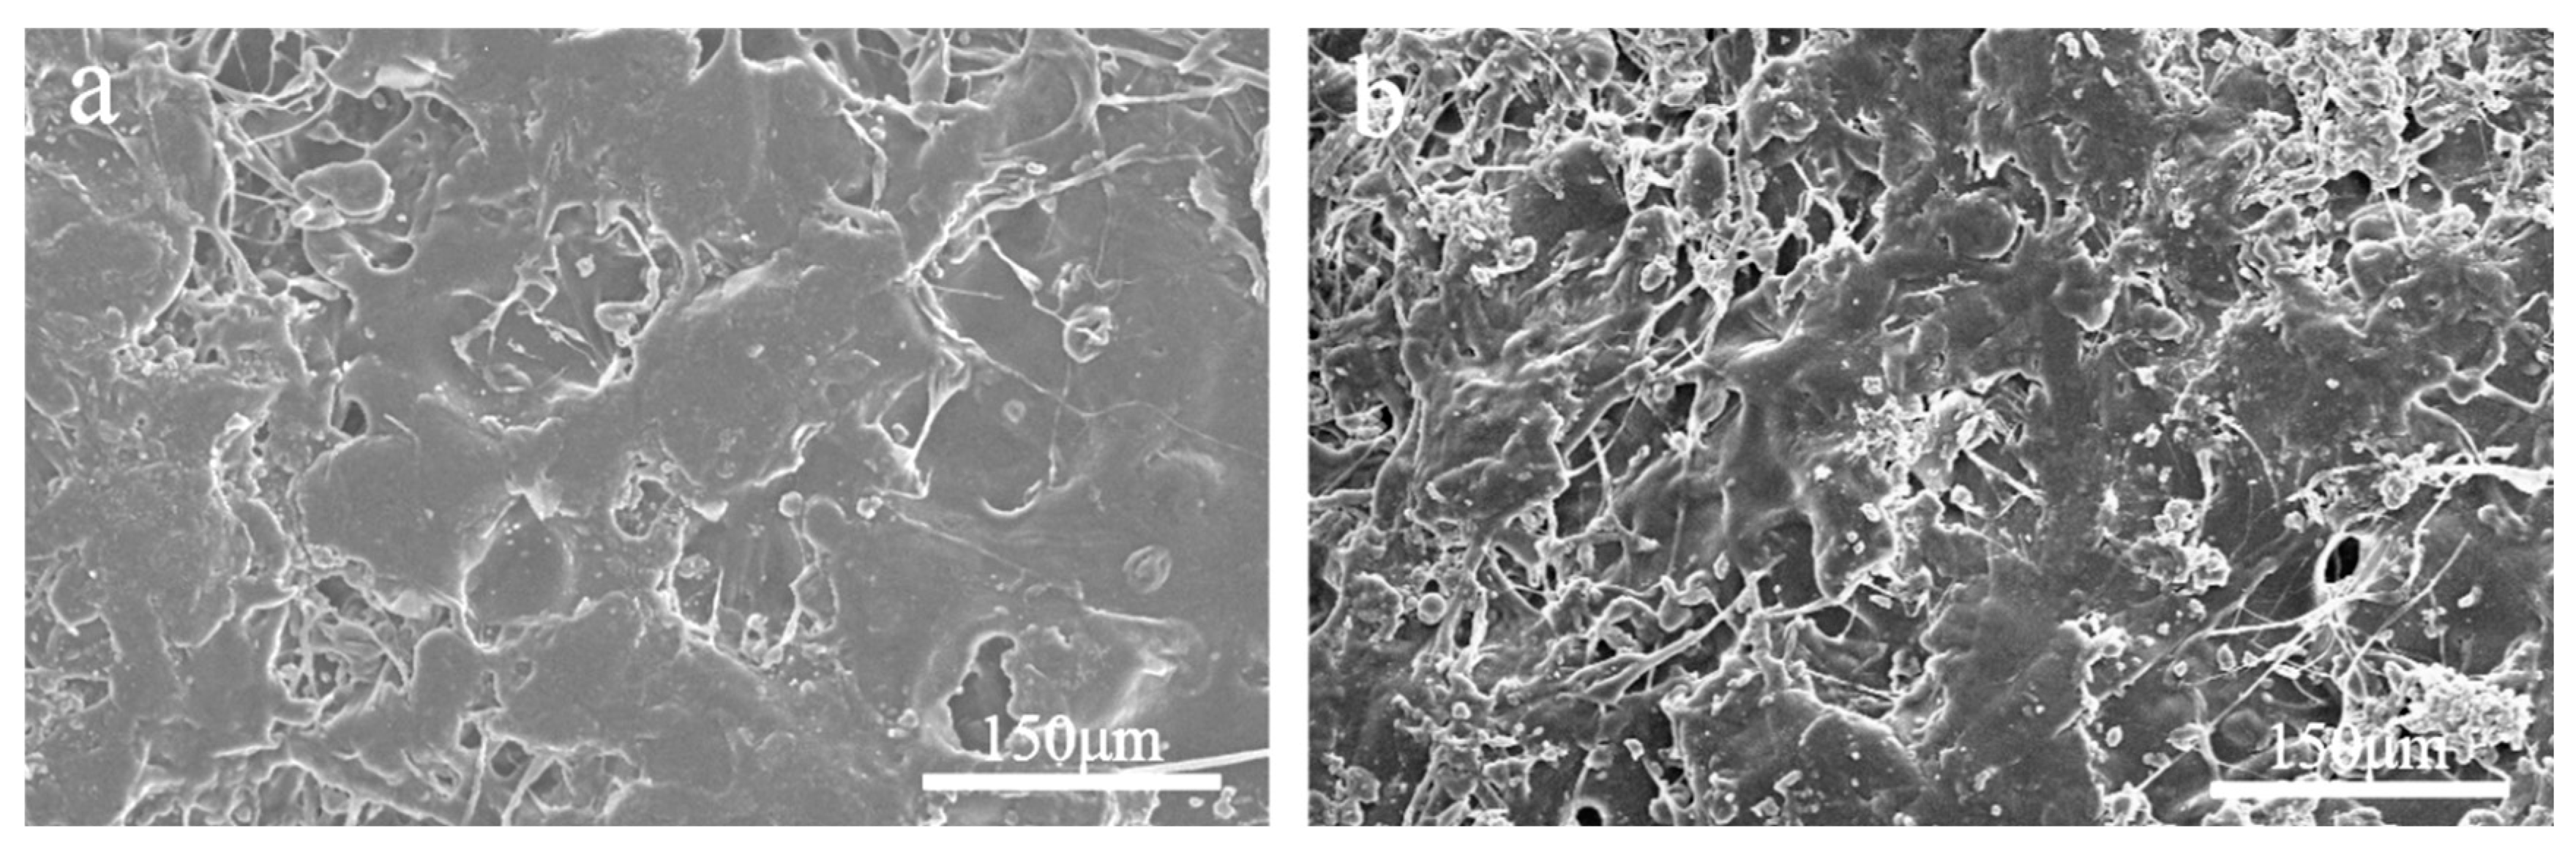
The surface microstructure of the HPMC-EC membrane before and after soaking in water is depicted in Figure 2-8(a) and Figure 2-8(b). In Figure 2-8(b)(a), the surface of the outer shell before water soaking appears relatively smooth, with larger blocks and fewer pores. However, in Figure 2-8(b), the surface of the shell after water soaking has become uneven and fractured, with more pores. This structure can enhance the encapsulation of sustained and controlled-release particles while providing some humidity responsiveness without affecting drug release at the corresponding temperature.
Figure 2-8.
Scanning Electron Microscope Images of outer shells Before Soaking (a) and After Soaking (b).
Figure 2-8.
Scanning Electron Microscope Images of outer shells Before Soaking (a) and After Soaking (b).
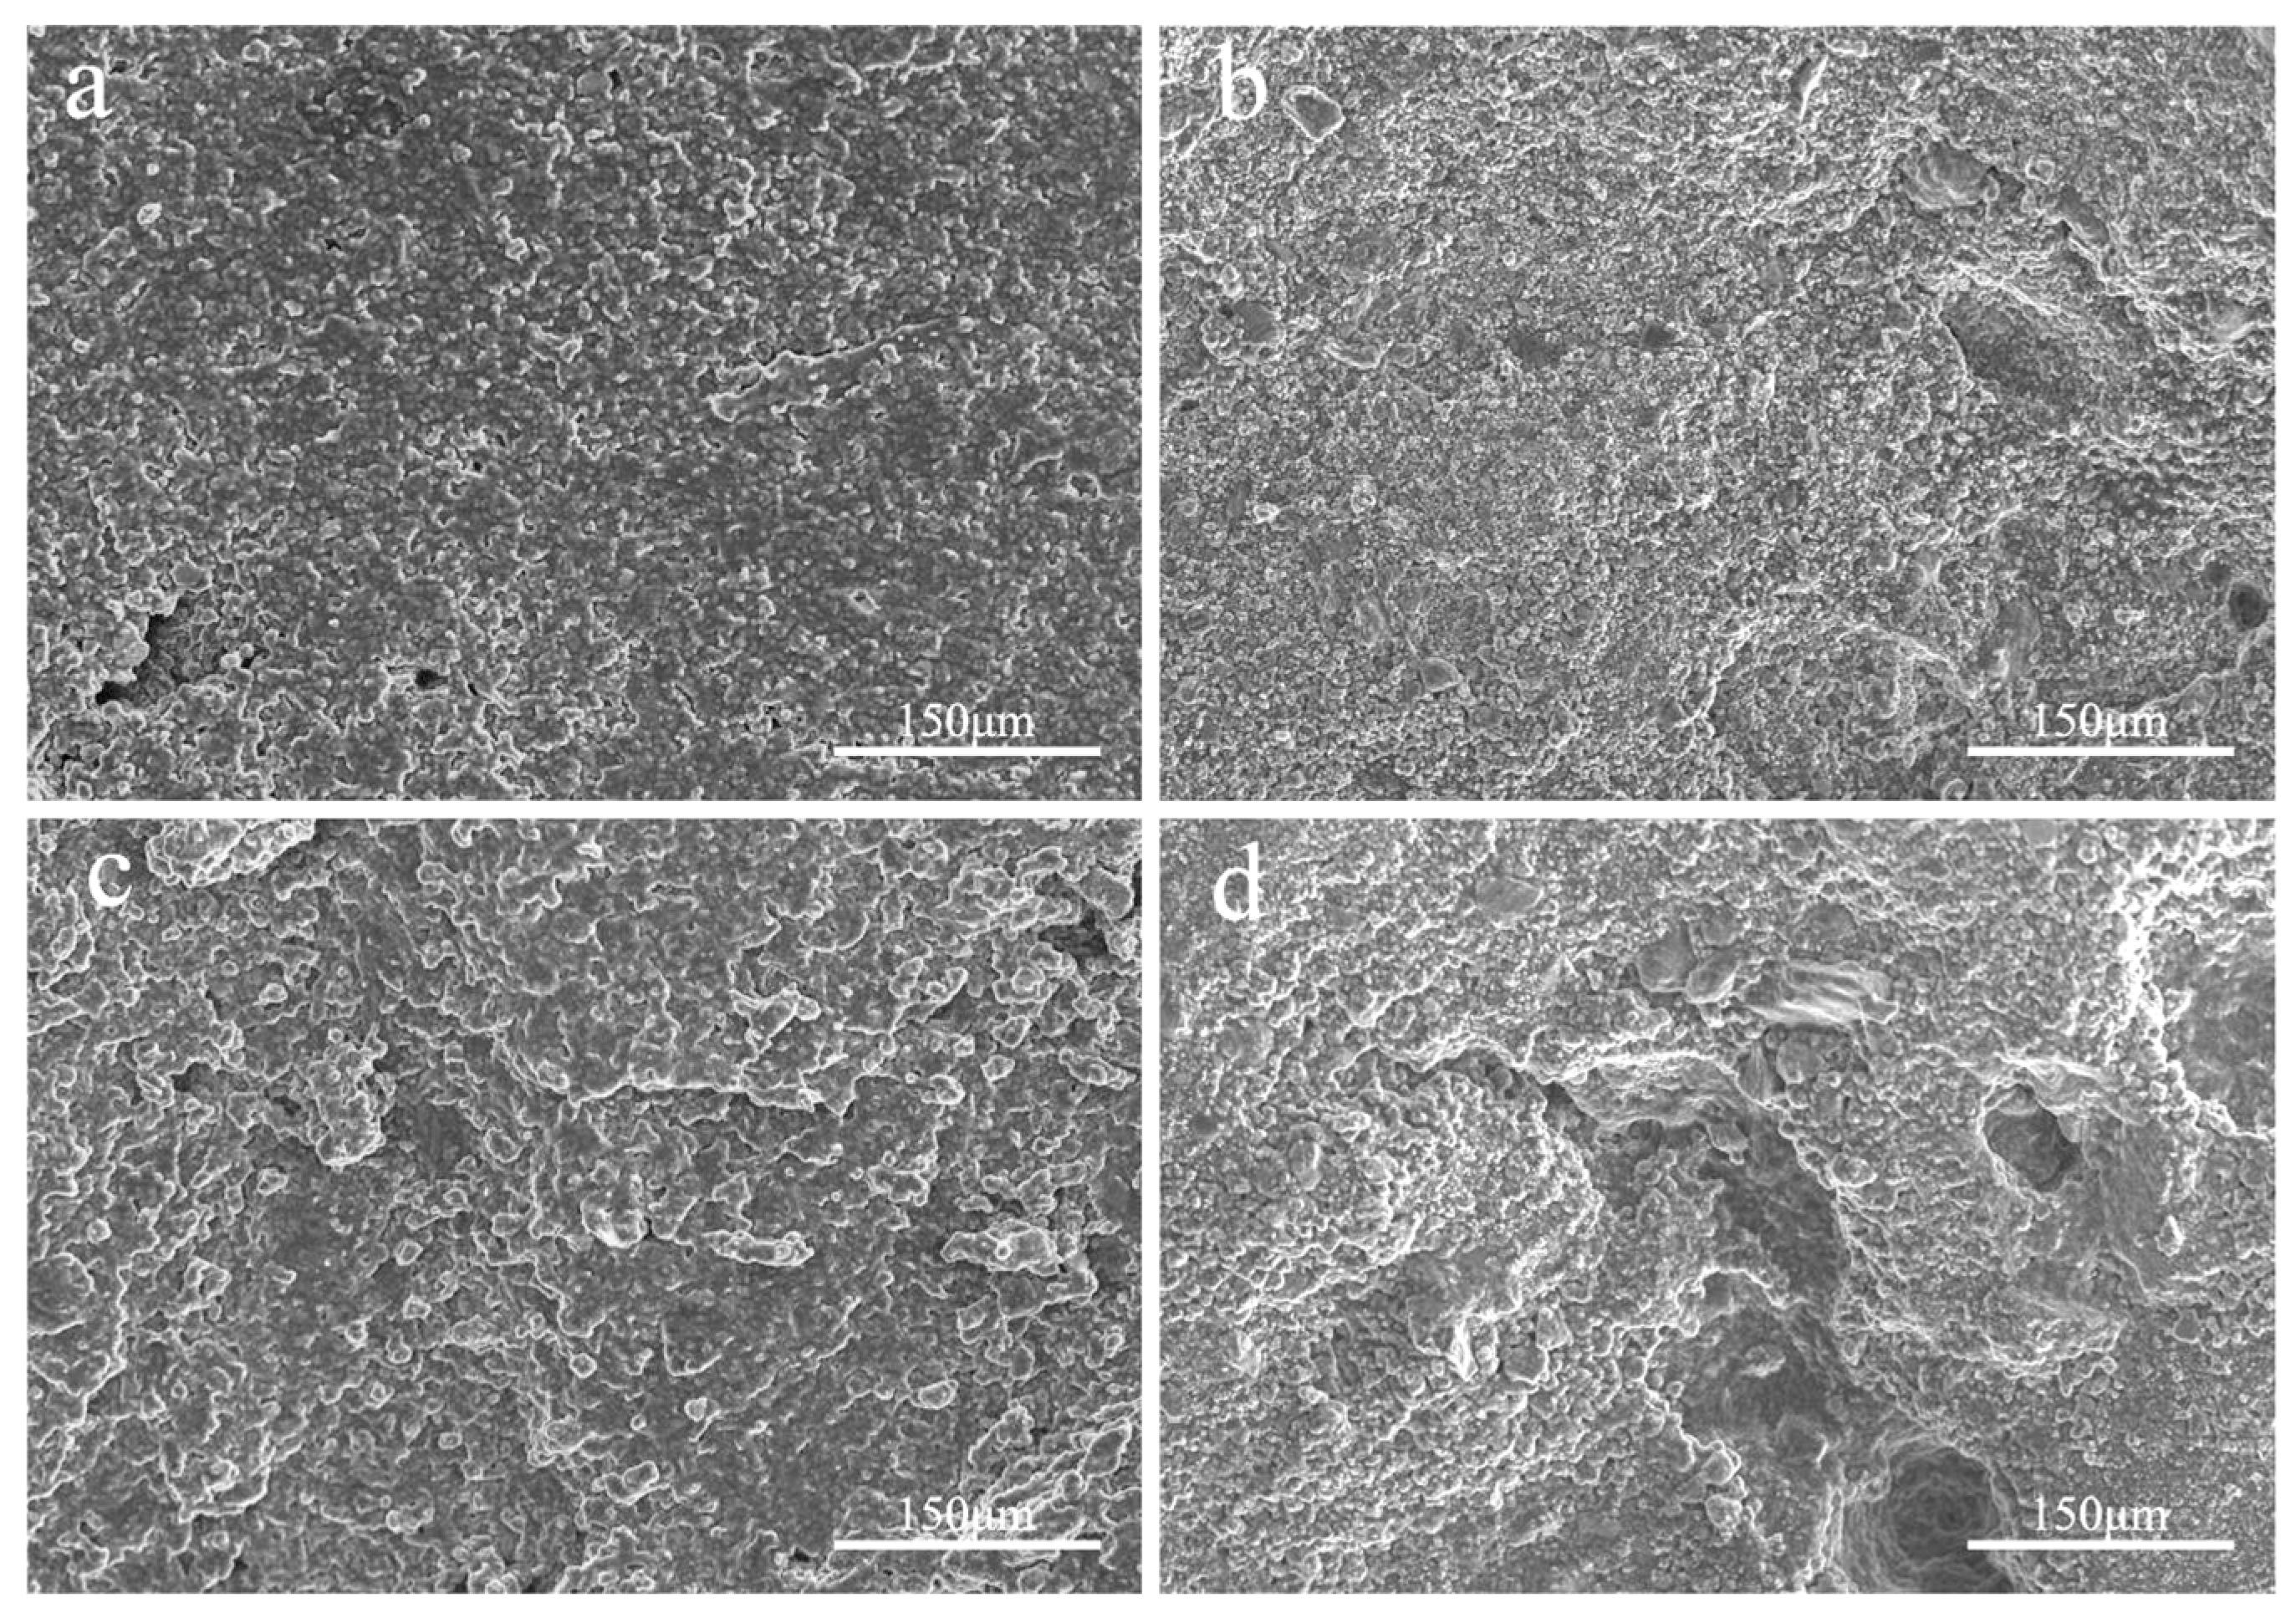
Observing Figure 2-9, several observations can be made:a. In Figure 2-9(a), the surface appears relatively flat and tightly adhered, demonstrating good compatibility between PETS, PETO, and PEG400MO, as they are miscible with each other.b. In Figure 2-9(b), the surface remains relatively flat, but there are some small holes, likely caused by the hydrophilicity of PEG400. This allows a small amount of water to penetrate the temperature-sensitive material, resulting in some drug release with the water.c. In Figure 2-9(c), as the temperature approaches the melting point of the temperature-sensitive material, the surface starts to dissolve, creating a terraced appearance.d. Figure 2-9 (d) shows unevenness on the surface and the emergence of several holes when exposed to high temperature and high humidity conditions. In this scenario, moisture can penetrate the core, dissolve the drug, and increase the pressure gradient inside the core, pushing the drug to pass through the shell for release.
From Figure 2-9, it can be concluded that the temperature-sensitive material shell can exhibit temperature responsiveness. In conditions of elevated temperature and humidity, the pill does not crack, allowing for controlled drug release. This results in a slow release process for drug diffusion.
Figure 2-9.
Scanning Electron Microscopy Images of Temperature-Sensitive Material Carriers at Various Temperature and Humidity Level. (a. 20 °C without water immersion; b. 20 °C with water immersion; c. 35 °C without water immersion; d. 35 °C with water immersion).
Figure 2-9.
Scanning Electron Microscopy Images of Temperature-Sensitive Material Carriers at Various Temperature and Humidity Level. (a. 20 °C without water immersion; b. 20 °C with water immersion; c. 35 °C without water immersion; d. 35 °C with water immersion).
2.6. Drug Release Characterization
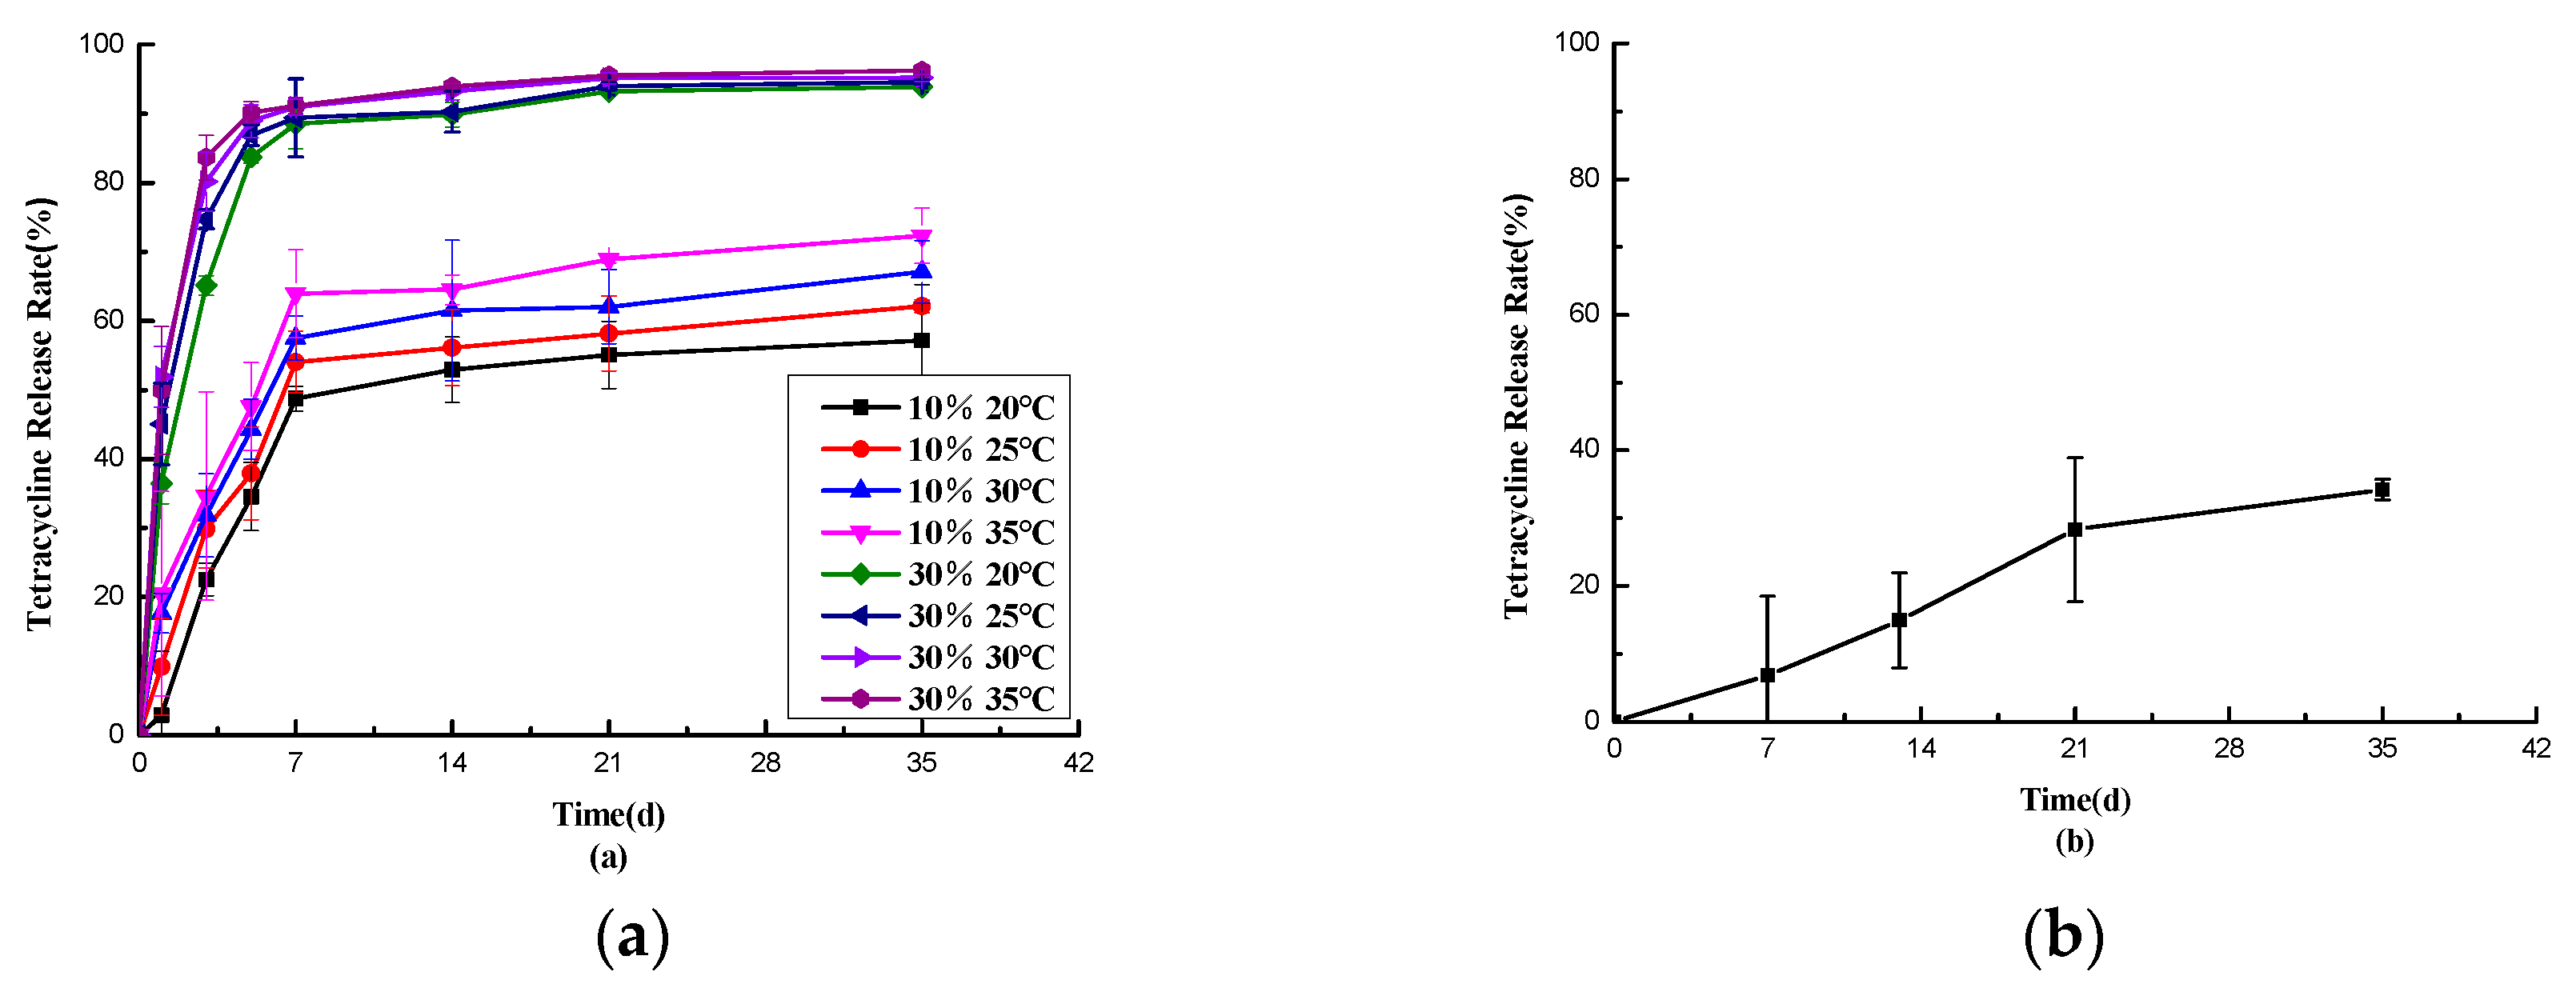
Observing Figure 2-10(b), it’s evident that some evaporative drug release occurred from the pill particles in an open environment at room temperature. At 35 days, the release rate reached 34.20%. This indicates that the drug release in Figure 2-9(a) wasn’t solely due to drug evaporation. In Figure 2-10(a), the overall release rate of the pill particles was lower under low humidity conditions compared to high humidity conditions. Specifically, the high-temperature and high-humidity environment (30% moisture, 35 °C) exhibited the fastest release, with a rate of 96.24% at 35 days. In contrast, the low-temperature and low-humidity environment (10% moisture, 20 °C) showed the slowest release, with a rate of 57.19% at 35 days. This trend aligns with the desired temperature and humidity response for this study.
Although the high-humidity groups demonstrated faster release at high temperatures and slower release at low temperatures, there wasn’t a significant difference in the 35-day release rate (94.54% vs. 96.24%). This may be attributed to the damage to the outer shell when exposed to water, resulting in increased porosity, which This prevents a good slow release of the drug.
Figure 2-10.
Release Curves of Pellets from Tablets under Different Temperature and Humidity Conditions (a) and Open Storage Release Curves of Pellets at Room Temperature (b).
Figure 2-10.
Release Curves of Pellets from Tablets under Different Temperature and Humidity Conditions (a) and Open Storage Release Curves of Pellets at Room Temperature (b).
The experiments mentioned above have demonstrated that Tetramycin slow-controlled release pill granules exhibit a certain temperature and humidity response capability, meeting the requirements for controlling Ralstonia solanacearum in the field. In general, the drug release rate was initially rapid and steep, gradually becoming smoother over time. This behavior can be attributed to the drug release process through the dissolution of HPMC within the outer shell, leading to the formation of several holes in the shell. The high temperature caused the grease material shell to melt, allowing moisture to penetrate into the inner core of the drug, leading to drug dissolution. As a result, internal pressure increased, and the drug gradually diffused outward under the combined influence of concentration and pressure gradients. During this process, in the early stages, the drug concentration in the surrounding soil is low, while the drug concentration within the drug core is high, resulting in a sudden release and a faster release rate. However, as the drug in the core is dissolved, the drug concentration within the core gradually decreases, leading to a weakening of the release force. Consequently, the entire release process enters a stage of reduced drug release [21,22].
The relationship between the release rate and time of the pill particles under different temperature and humidity conditions can be accurately modeled by a first-order kinetic equation. The key kinetic parameters, such as the maximum release rate (No), kinetic rate (k), correlation coefficient (R2), and standard deviation (Se) of the release mechanism, are summarized in Tables 2-4. It is noteworthy that the correlation coefficients (R2) for all the experimental groups are quite high, ranging from 0.9738 to 0.9981, indicating an excellent fit of each equation to the release data. Additionally, the standard deviations of Se are relatively small, ranging from 0.0286 to 0.0492, further confirming the goodness of fit. Concerning the maximum release rate (No) of the drug, it was significantly higher under high humidity conditions compared to low humidity environments. Moreover, N0 generally increased with rising temperature. Similarly, the kinetic rate (k) exhibited a similar trend, indicating that the drug release was influenced by both temperature and humidity [23,24].
Table 2-4.
First-order Kinetic Parameters for Pellet Release from Tablets under Different Temperature and Humidity Conditions.
Table 2-4.
First-order Kinetic Parameters for Pellet Release from Tablets under Different Temperature and Humidity Conditions.
| Temperature | Humidness | The First-Order Kinetics Equation Nt = No(1 − e−kt) |
|||
|---|---|---|---|---|---|
| k | R2 | Se | |||
| 20℃ | 10% | 57.5474 | 0.1890 | 0.9738 | 0.0286 |
| 25℃ | 10% | 60.5647 | 0.2263 | 0.9847 | 0.0247 |
| 30℃ | 10% | 64.6938 | 0.2521 | 0.9884 | 0.0233 |
| 35℃ | 10% | 69.9371 | 0.2581 | 0.9813 | 0.0300 |
| 20℃ | 30% | 92.3197 | 0.4497 | 0.9964 | 0.0251 |
| 25℃ | 30% | 91.9658 | 0.6134 | 0.9960 | 0.0383 |
| 30℃ | 30% | 92.9348 | 0.7548 | 0.9959 | 0.0492 |
| 35℃ | 30% | 94.0467 | 0.7408 | 0.9981 | 0.0331 |
2.7. Analysis of Simulated Field Release Experiments
The release rate of the pill particles varies in different environmental conditions due to their temperature and humidity response properties, as shown in Figure 2-11. Groups A and B exhibit different degrees of stepwise slow release, especially in Group A. This group cycles between high-temperature and high-humidity and low-temperature and low-humidity environments, resulting in a pronounced ladder-like release pattern. In 21 days, Group A achieves a release rate of 96.43%. This behavior demonstrates that the pill particles do not undergo a one-time, uniform, and equal release. Instead, they adjust their release rate in response to changes in the environment. This adaptive behavior helps prevent the premature release of the drug due to sudden high-temperature and high-humidity weather, ensuring that the drug remains effective for longer and meets subsequent demand.Group C, on the other hand, does not exhibit a stepwise slow release pattern. This is likely because the release rate of the pill is faster in both high-temperature and high-humidity and high-temperature and low-humidity environments, resulting in a parabolic release curve. Groups D and E, which serve as blank control groups, show a lower rate of slow release, with release rates of 30.27% and 30.86% at 21 days, respectively. This release behavior is similar to what was observed in Figure 2-10(b) and is likely due to drug evaporation from the pills exposed to air.
Figure 2-11.
Simulated Field Release Curves.
2.8. Soil Defense Effectiveness and Disease Index Statistics
Observing Figure 2-12(a), it can be seen that at 72 days, both the blank group and the experimental group had similar disease onset rates (6.17% vs. 5.60%), and the disease index of the experimental group was slightly lower than that of the blank group. This result may be attributed to the fact that, at the end of May and the beginning of June, the local weather had not yet reached the high-temperature conditions conducive to the high incidence of Tobacco. Consequently, the temperature-responsive pills had not begun to release the drug significantly, and the difference in disease index between the two groups was not substantial.
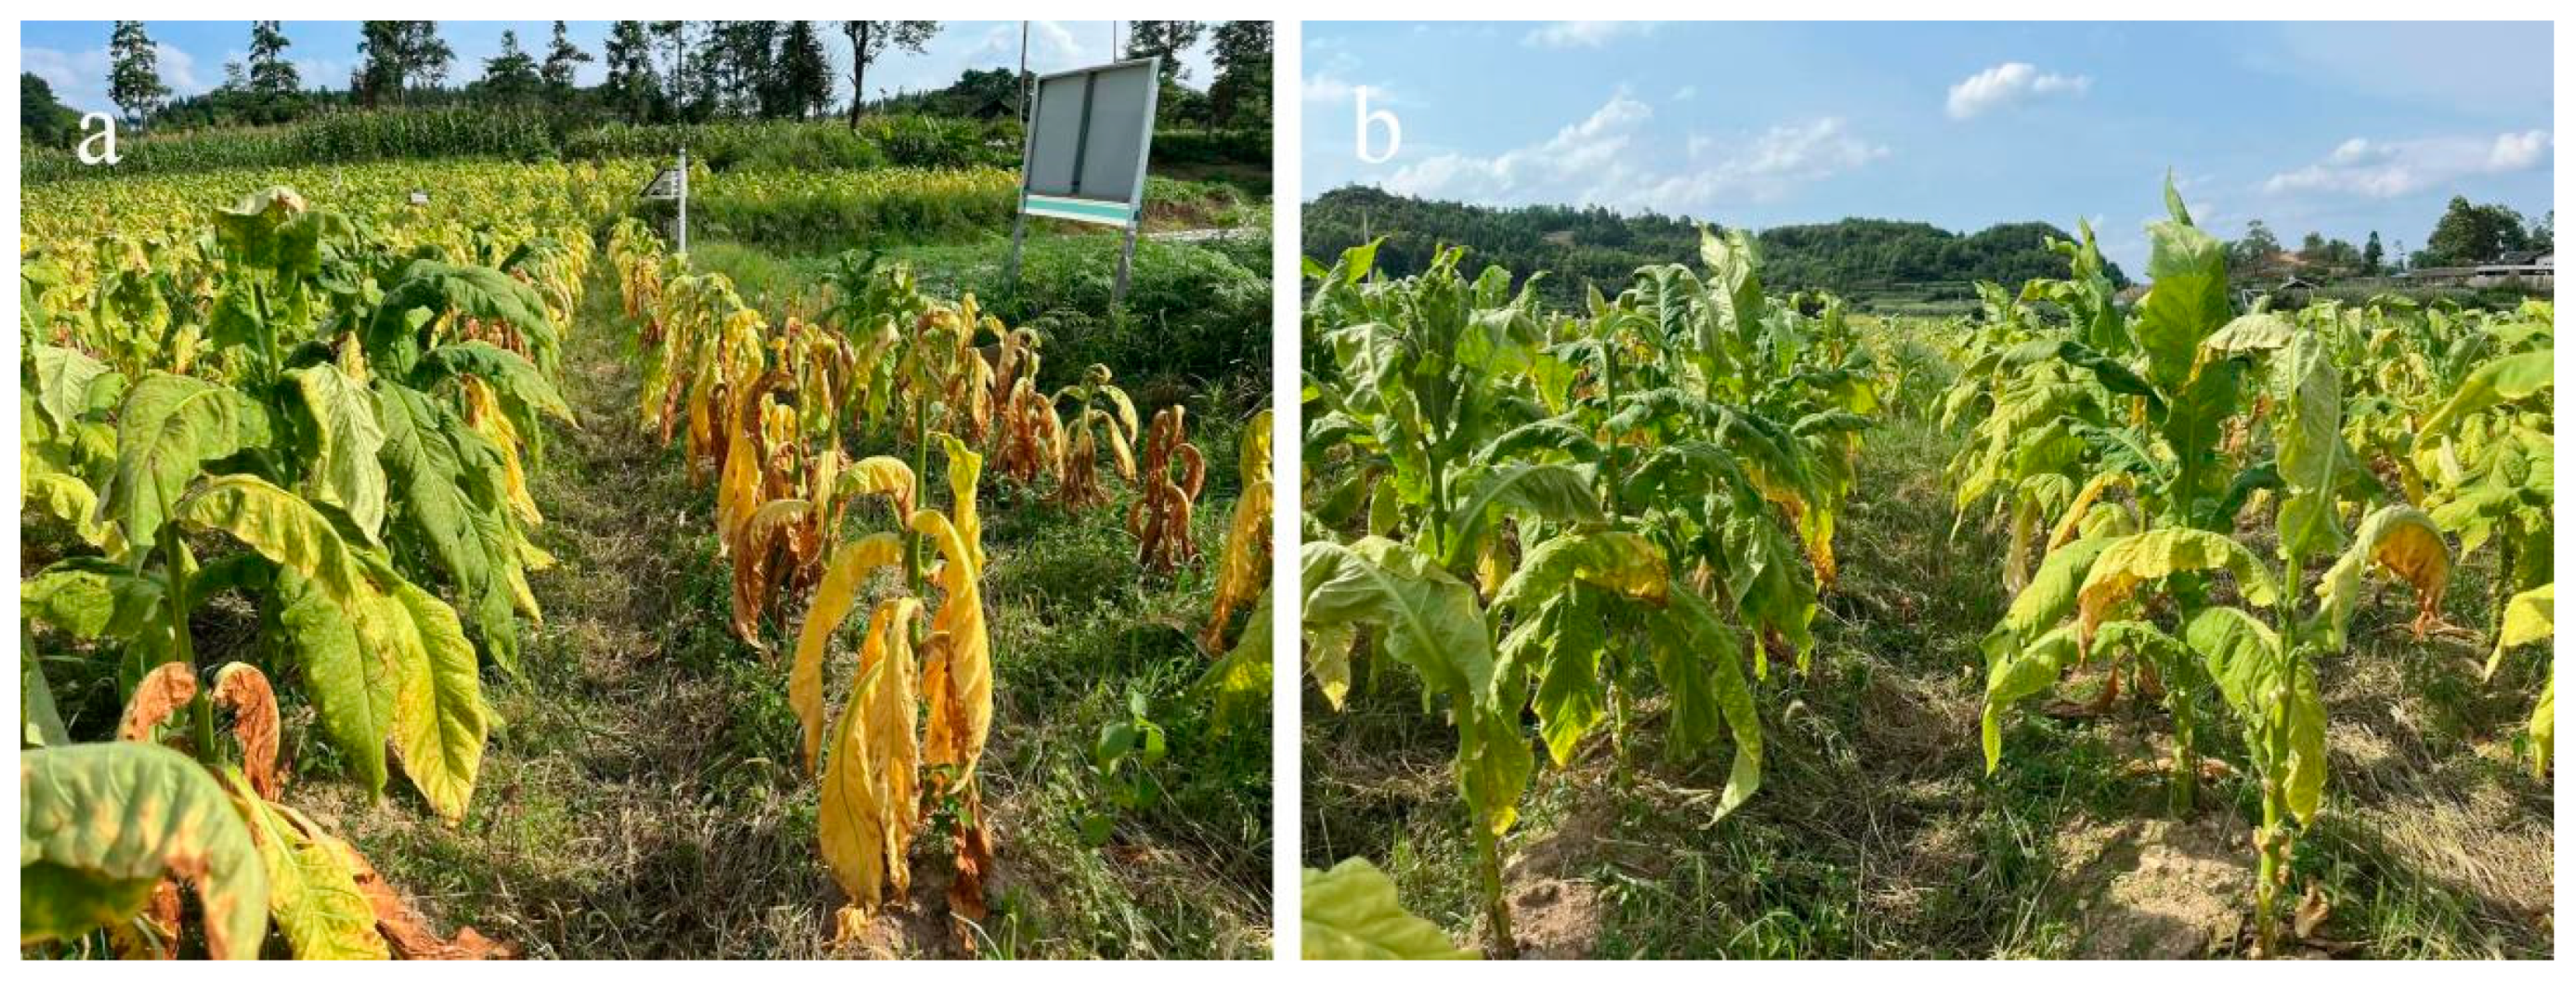
However, by 90 days, the disease index of the blank group was slightly higher than that of the test group (6.43% vs. 4.97%). During this period, the test group gradually started to release the drug as the temperature rose, leading to a gradual improvement in disease incidence. The preventive effect reached 20.67%, as shown in Figure 2-10(b).By 106 days, which was in the month of July when the temperature and humidity conditions for the high incidence of Ralstonia solanacearum were met, accompanied by heavy rainfall, the blank group experienced a significant outbreak of Ralstonia solanacearum. The experimental group’s pill particles had also reached the temperature and humidity response conditions, gradually releasing the drug. As a result, the disease incidence in the blank group was much more severe than that in the experimental group (43.97% vs. 19.90%), with a relative preventive effect of 54.74%. As shown in Figure 2-13, the blank group had more tobacco plants withered, and there were more Ralstonia solanacearum plants. In contrast, the test group remained in relatively good condition, with fewer diseased plants, and the leaves appeared healthier. These experiments demonstrated that the pill had a positive and effective control effect in practical application.
Figure 2-12.
Disease Index (a) and Control Efficacy (b) of Tobacco Bacterial Wilt in Blank Group and Experimental Group.Data are presented as the mean±SD based on three biological replicates, Different letters represent significant difference(p<0.05).
Figure 2-12.
Disease Index (a) and Control Efficacy (b) of Tobacco Bacterial Wilt in Blank Group and Experimental Group.Data are presented as the mean±SD based on three biological replicates, Different letters represent significant difference(p<0.05).
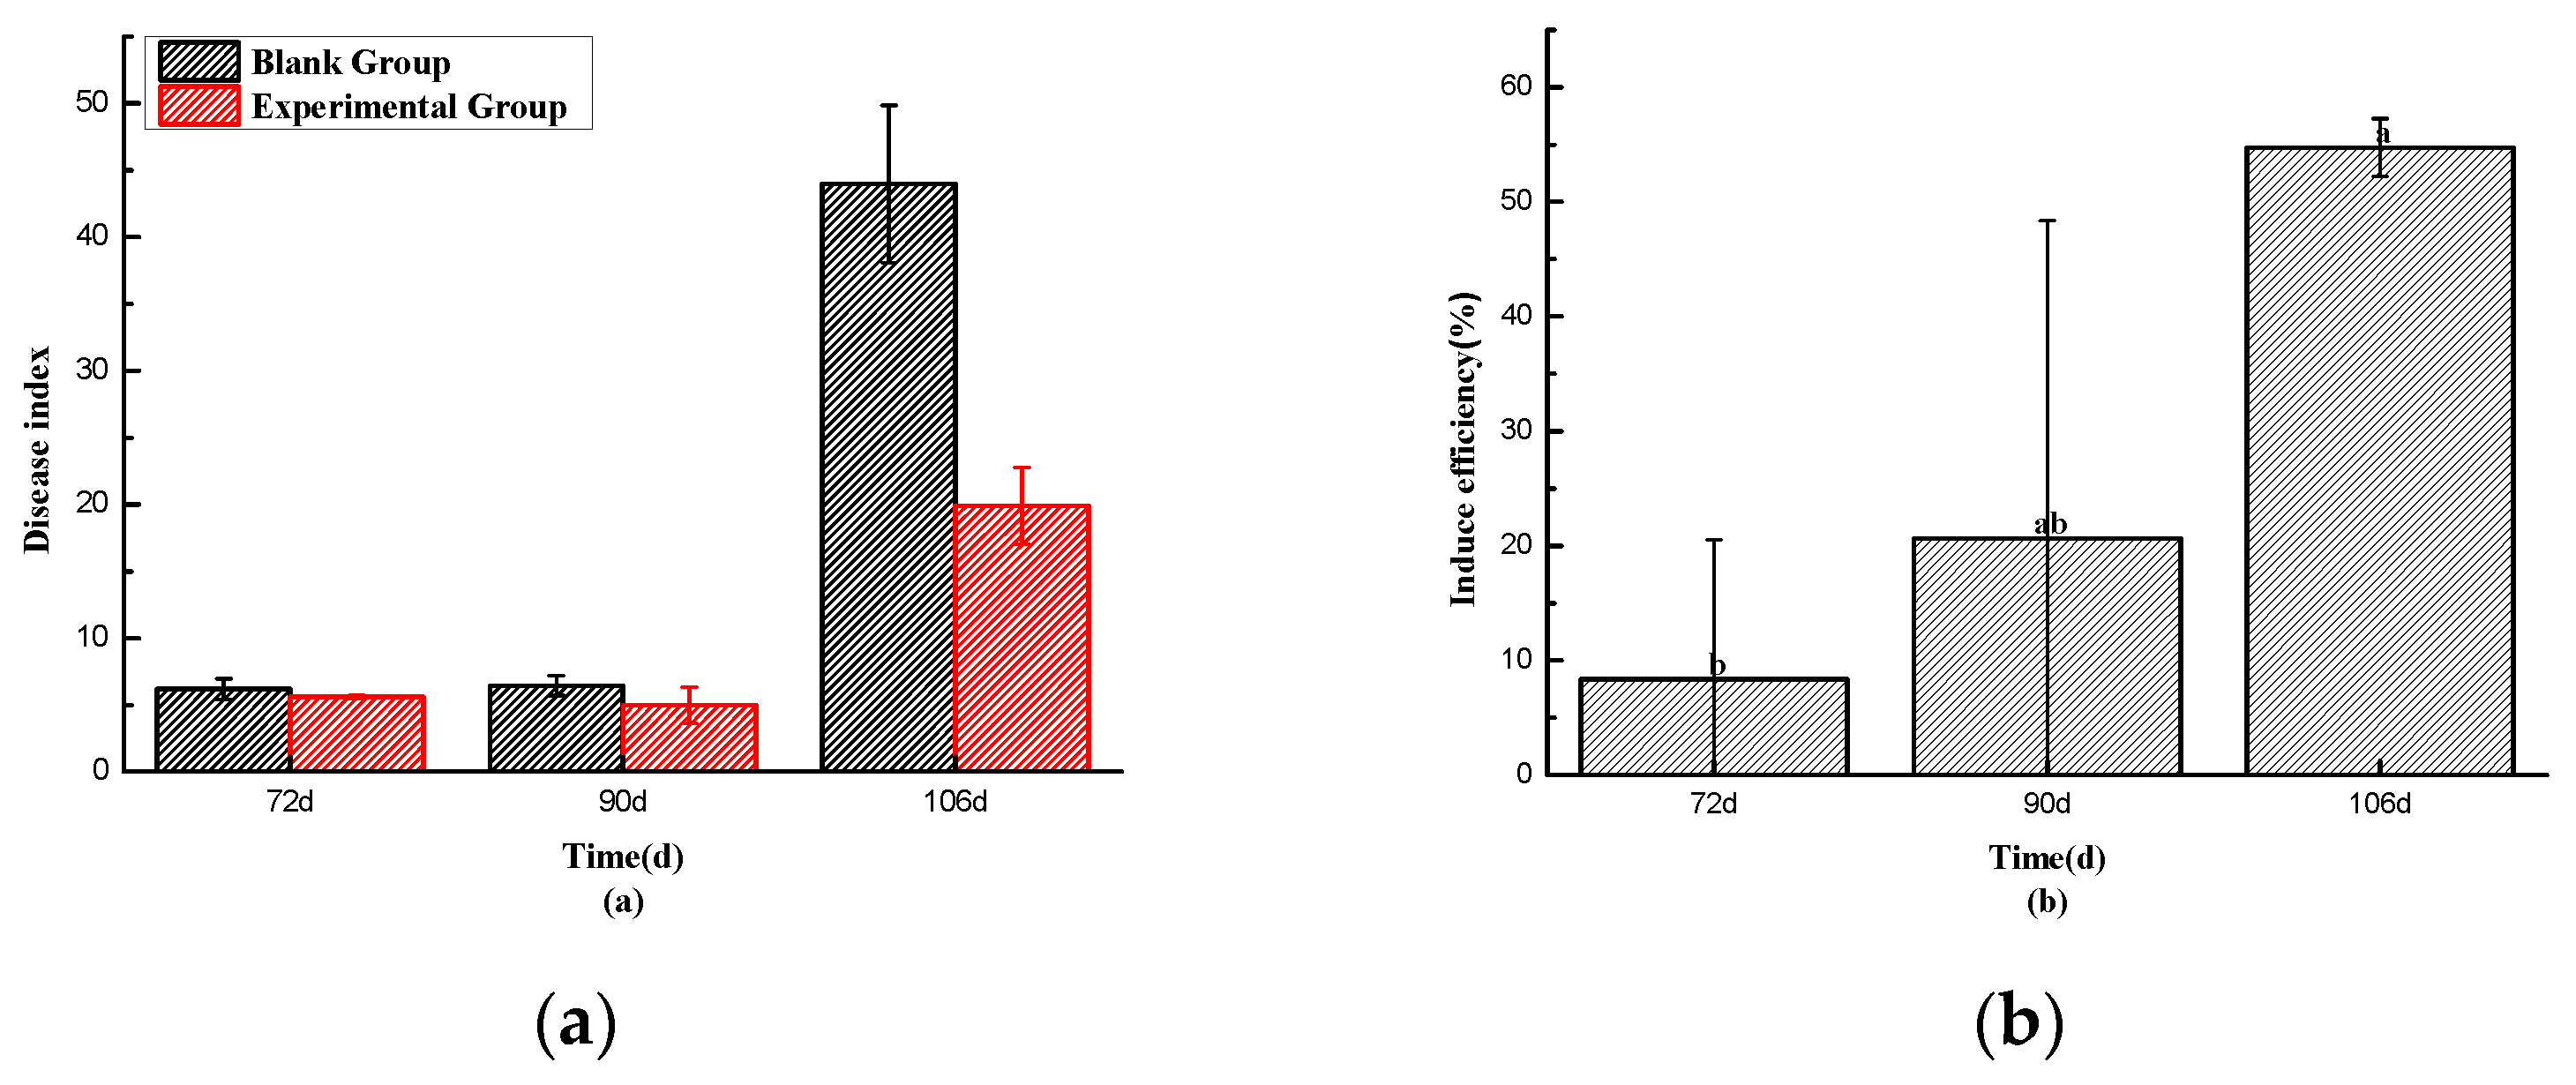
Figure 2-13.
Field Experiment Results at 106 Days for Blank Group (a) and Experimental Group (b).
2.9. Structural Flora Analysis of Soil Bacterial and Fungal Communities
Figure 2-14(a) reveals that at the phylum classification level, the dominant flora in the soil at different depths of both the blank group and the test group were primarily Pseudomonas (32.61%~48.26%). At the class classification level, the soil flora were mainly distributed within the order Alphaproteobacteria (21.49%~32.30%). At the phylum classification level, the soil bacterial groups were primarily found in the orders Hyphomicrobiales (6.93%~10.63%) and Sphingomonadales (5.08%~11.11%). At the family classification level, the primary bacterial groups were from the family Sphingomonadaceae (4.80%~10.76%). At the genus classification level, the primary bacterial groups in the soil were from the genus Sphingomonas (4.47%~10.50%).
Ralstonia solanacearum belongs to the genus Ralstonia in the family Ralstoniaceae. As shown in Figure 2-14, at the genus classification level, the relative content of Ralstonia in the soil of the experimental group was lower than that in the blank group (0.47% vs. 1.07%). Similarly, at the species level, the content of Ralstonia solanacearum in the experimental group was also lower than that in the blank group (0.32% vs. 0.91%). These experimental results suggest that Tetramycin inhibited the growth of Ralstonia solanacearum to some extent, reducing its presence in the soil. This reduction can potentially help tobacco seedlings resist Ralstonia solanacearum infestation, leading to fewer cases of tobacco plant wilting and death caused by Ralstonia solanacearum.
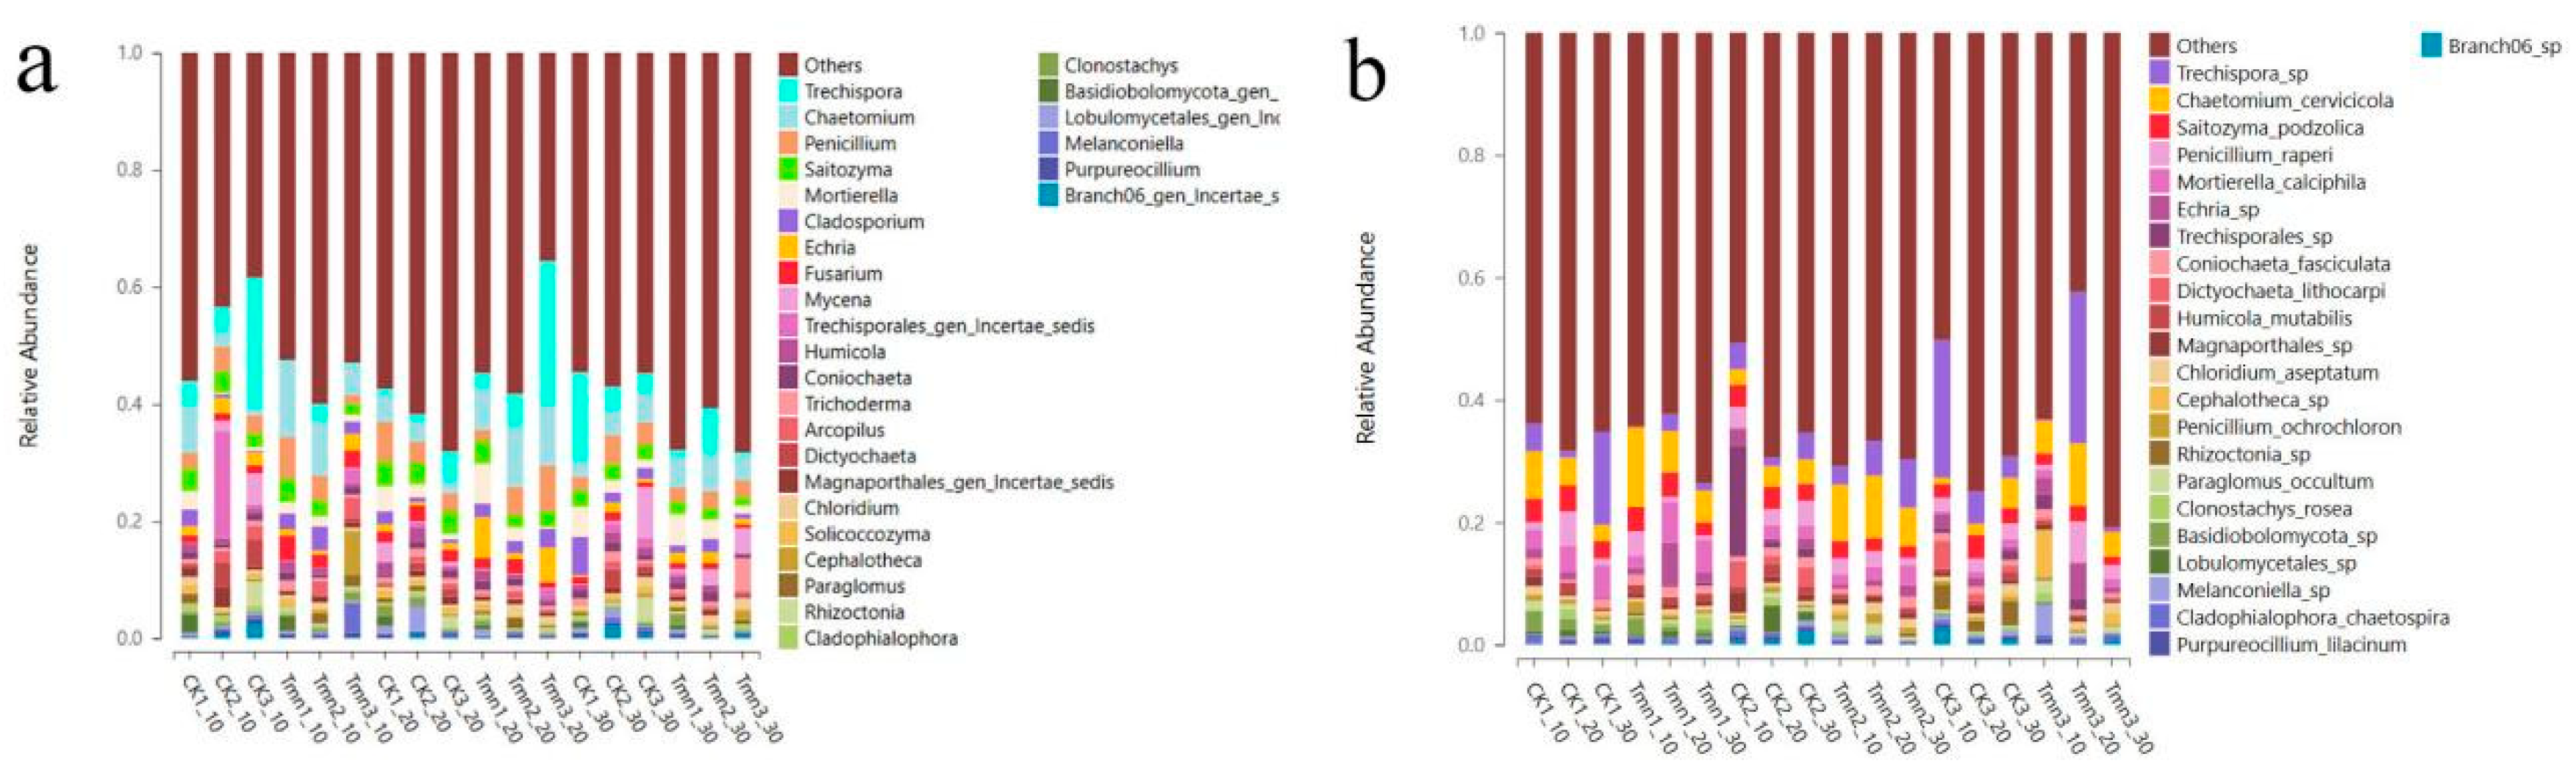
As indicated in Figure 2-14(b), at the phylum level, the predominant soil flora in different depths of the blank group and the test group mainly belonged to Ascomycota (29.02%~54.07%). At the class level, the flora was primarily represented by Sordariomycetes (19.11%~43.68%). When classified by order, the primary components of the flora were Mortierellales (5.97%~40.92%) and Trechisporales (1.28%~44.40%). Moving to the family level, the dominant families were Mortierellaceae (5.98%~40.92%) and Hydnodontaceae (1.16%~44.10%). Finally, at the genus level, the prominent genera included Trechispora (0.21%~15.19%) and Chaetomium (1.00%~12.93%).
There were no significant shifts in the major fungal classes between the treatment and control groups. However, the fungal community structure showed higher consistency in the early stages in different deep soil layers of the treatment group compared to the control, indicating that the Tetramycin controlled-release pellet treatment had a certain effect on the soil fungal community structure. The diversity differences between different soil layers in the treatment group were restored in the later period (106 days), suggesting that the impact of the pharmaceutical treatment began to diminish towards the end of the production season.
Figure 2-14.
Genus-level (a) and species-level (b) distribution frequency chart of soil bacteria.
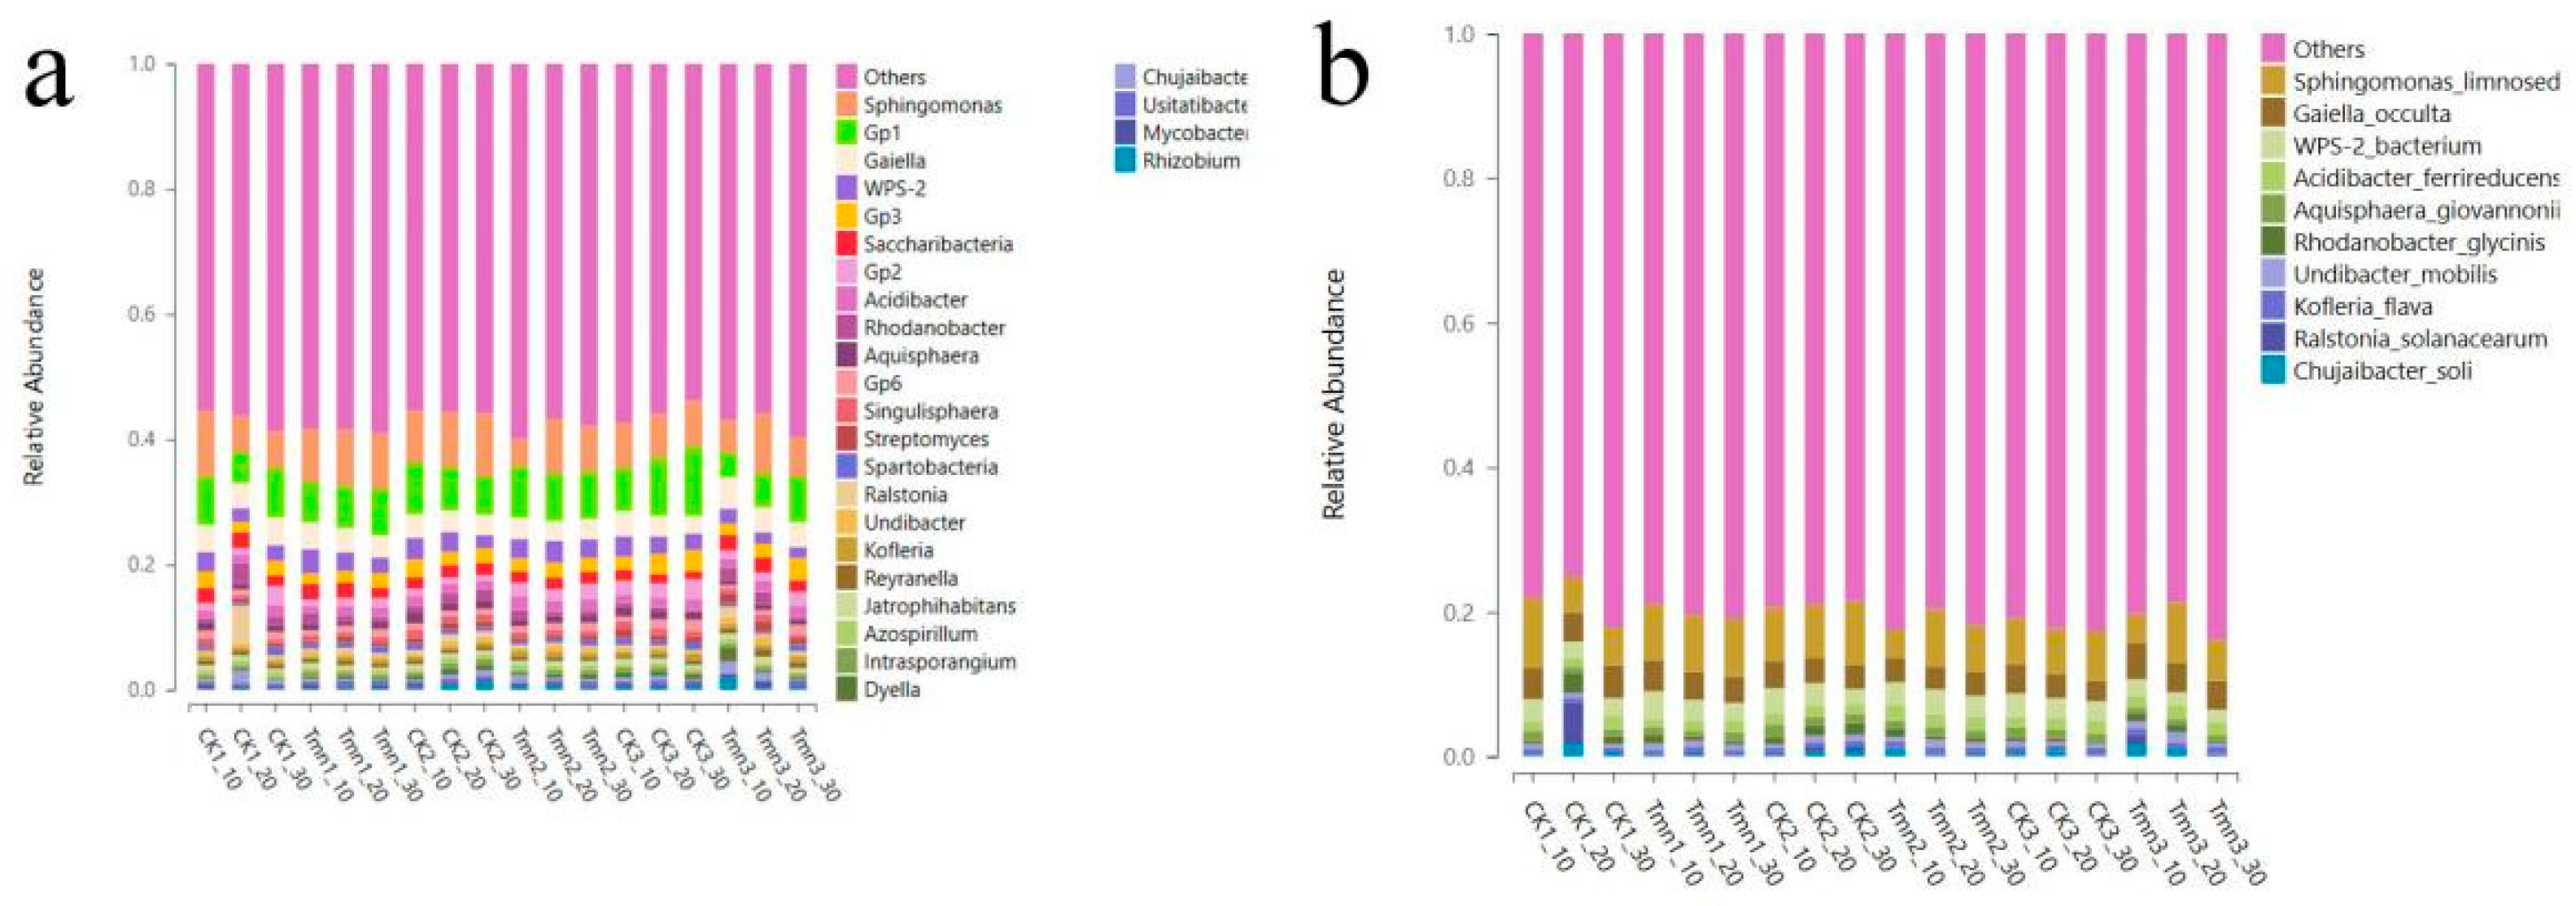
Figure 2-15.
Genus-level (a) and species-level (b) distribution frequency chart of soil fungi.
The dilution curves are depicted in Figure 2-16 (a) and (b), and they show that the dilution curves for both bacteria and fungi tend to level off. This indicates that the sequencing depth used in the current study is adequate to accurately represent the microbial composition of the soil in the tobacco plant.
Figure 2-16.
Bacterial (a) and Fungal(b) Dilution Curves.
3. Discussion
3.1. The Raw Material for the Preparation of Tetramycin Core-Shell Pellets Is Green
Corn cob meal, used in pharmaceutical preparations, is an agricultural waste product. Corn cobs are primarily composed of cellulose (35-55%), hemicellulose (25-35%), and lignin (20-30%), and are rich in carbohydrates [25]. Due to its high density (160-210 kg/m3) and porous structure, it can retain sufficient water to achieve high drug loading percentages when carrying aqueous drugs. Finally, it can also be converted into soil organic matter by soil microorganisms, making it a high-quality carrier for Tetramycin [26,27]. Additionally, it enables the utilization of agricultural waste. PETO and PETS are intermediate shell layer materials synthesized from Pentaerythrityl esters, Stearic acid, and Oleic Acid. Pentaerythrityl Tetrastearate is prone to hydrolysis and fracture due to susceptibility of its ester groups to water molecule attack, resulting in structural damage, and it possesses characteristics of high-speed biodegradation [28,29]. Stearic Acid and Oleic Acid are widely found in plants and animals, serving as natural raw materials that do not easily cause harm to the environment. PEG400MO is a polyethylene glycol polymer with a relative molecular mass of 400, commonly used in the preparation of degradable compositions [30,31].Cellulose, as one of the most abundant renewable resources in nature, finds utility in various fields through its derivatives. The shell layer materials EC and HPMC are cellulose ethers derived from natural cellulose through chemical modification. As both EC and HPMC share biodegradable cellulose as their main chains, they exhibit a certain level of biodegradability [32,33,34]. Due to their stable chemical properties, film-forming abilities, as well as notable characteristics such as non-toxicity and biodegradability, they are commonly utilized in the production of biodegradable membranes, packaging materials, and other applications [35,36].
3.2. Temperature and Humidity Responsiveness of the Enclosure
Since PETS, PETO, and PEG400 can be mixed in any proportion, temperature-sensitive shells with properties responsive to temperature changes are formulated by leveraging the differences in melting points among the three substances. The primary mechanism involves the formation of new compounds through interaction forces among the various components, resulting in a melting point that falls between those of the individual raw materials. By adjusting the ratios, a formula with a softening point of 30-35 °C can be achieved. When the temperature reaches this range, the intermediate shell layer undergoes a phase transition from a “gel-like crystal state” to a liquid crystal state, enhancing permeability and facilitating drug release [37].Additionally, the inclusion of hydrophilic PEG400MO imparts humidity responsiveness to the intermediate shell layer. This characteristic aids in the transport of water Agronomy through the intermediate shell layer to reach the interior of the drug core, facilitating the release of water-soluble drugs contained within the core.
The outer cellulose shell is a cross-linked reticular membrane created by blending water-soluble HPMC with alcohol-soluble EC. When exposed to water, the membrane undergoes swelling, causing the multidimensional spatial mesh structure formed by -OH groups on the cellulose ether molecular chain through esterification or etherification cross-linking to break down [38]. Simultaneously, a portion of the HPMC dissolves, leading to the formation of pores on the surface of the cellulose membrane. Through these pores, water Agronomy penetrate into the intermediate shell layer.
The experimental results corroborated the theoretical conjecture mentioned above, demonstrating that the drug exhibited responsive release when exposed to conditions of sustained mildness (35 °C) coupled with high humidity (30%).
3.3. Temperature- and Humidity-Responsive Slow-Release Pellets Can Meet Agricultural Needs in Warmer Regions
The optimal conditions for the development of Ralstonia solanacearum are typically a temperature range of 30-35 °C combined with high humidity [39,40]. Therefore, particles that respond to temperature and humidity, particularly within the range of 33-35 °C, should effectively cater to the requirements in tobacco agricultural production. Additionally, experimental evidence has confirmed the efficacy of Tetramycin against tobacco Ralstonia solanacearum [16,41]. According to the aforementioned experimental results, the relative preventive effect reached 54.74% at 106 days after transplanting, significantly reducing the damage caused by Ralstonia solanacearum in tobacco production. Consequently, core-shell particles hold promise as biopesticide control agents for tobacco Ralstonia solanacearum in Guizhou Province of China.
Furthermore, since Tetramycin is a broad-spectrum antibiotic, it can also target other diseases such as wheat erythroplasmosis, powdery mildew, poplar ulcer, and bacterial hornblotch. By adjusting the response temperature of the intermediate shell layer, control of these additional diseases can be achieved. As a result, the particles can address a broader spectrum of agricultural needs in warmer regions, presenting favorable prospects for application.
4. Materials and Methods
4.1. Materials and Instruments
Corn kernel powder is food grade from Henan Qikang Water Treatment Material Co.(Henan China).Tetramycin is industrial grade from Liaoning Microscope Bioengineering Co.(Liaoning China).Pentaerythritol Tetrastearate(PETS), Pentaerythritol Tetraoleate(PETO) and Polyethylene Glycol Monooleate(PEG400MO) are industrial grade from Jiangxi Zhilian New Material Co.(Jiangxi China).,Guangzhou Fufei Chemical Technology Co.(Guangzhou China). and Jiangsu Hai’an Petrochemical Plant(Jiangsu China).Ethyl cellulose(EC,AR), Hydroxypropyl methyl cellulose(HPMC,AR), Ethanol purchased(98%,AR) from Sinopharm Chemical Reagent Co.(Shanghai China).Both Automatic Pill Making Machine AW-91 and Pill Polishing Machine BY-300 are from Wenling Aoli Chinese Medicine Machinery Co.(Zhejiang China).Electric spray gun SG9626ST from Ningbo Huipu Hardware Tools Co.(Zhejiang China).The high-performance liquid chromatography (HPLC) equipment (Waters e2695 with Waters 2489 UV detector and HPLC column: SunfireTM C18 (250 × 4.6 mm, 5 µm)) was from Waters Corporation (Milford, MA, USA).The scanning electron microscope(SEM) SU1510 used for the analysis was from Hitachi((Ibaraki, Japan).Differential Scanning Calorimeters(DSC) 204F and Thermogravimetric Analysers(TGA) STA 449 F3 from Netzsch(Free State of Bavaria Germany).The mass spectrometer TA-XT plus is from Stable Micro Systems(Surrey UK).UV Spectrophotometer UV-5500 from Shanghai Yuananalytical Instrument Co.Shell 1 is an intermediate shell layer. Shell 2 is the outer shell layer.
Figure 4-1.
Tetracycline Controlled-Release Tablet Finished Sectional View(a) and Structural Schematic Diagram(b).
Figure 4-1.
Tetracycline Controlled-Release Tablet Finished Sectional View(a) and Structural Schematic Diagram(b).
Figure 1-2.
SEM Image of Cross-section of Pill at 35x Magnification.
4.2. Preparation of Tetramycin Core-Shell Sustained and Controlled Release Particles
4.2.1. Preparation of Cores and Screening of Formulations
In this paper, we consider using corn kernel meal as the carrier and Tetramycin aqueous solution as the drug, using Quaternary Ammonium Chitosan, Sodium Polyacrylate, Sodium Carboxymethyl Cellulose, Xanthan Gum, and Sodium Alginate as binders. With a fixed ratio of corn kernel meal to Tetramycin aqueous solution, and based on the varying adhesive properties of different binders, we first mix a fixed amount of corn kernel meal with different amounts of adhesive, achieving the distribution as shown in Table 1-1. Then, a fixed amount of Tetramycin aqueous solution is added and thoroughly mixed to ensure the complete absorption of Tetramycin aqueous solution by the corn kernel meal. Finally, the mixture is poured into an automatic pill-making machine to produce spherical core particles.
Table 4-1.
Translation of the formula table for drug core materials with different ratios.
| Sample Names | Corn Cob Powder/g | Tetracycline/g | Quaternary Ammonium Chitosan/g | Sodium Polyacrylate/g | Sodium Carboxymethyl Cellulose/g | Xanthan Gum/g | Sodium Alginate/g |
|---|---|---|---|---|---|---|---|
| A1 | 135 | 230 | 20 | 20 | |||
| A2 | 135 | 230 | 15 | ||||
| A3 | 135 | 230 | 20 | ||||
| A4 | 135 | 230 | 10 | ||||
| A5 | 135 | 230 | 20 |
4.2.2. Preparation and formulation screening of Intermediate layer shel
In this paper, we mainly consider the mutual solubility of PETS, PETO and two derivatives of PEG400 (PEG400MS, PEG400MO) to prepare temperature-sensitive shells. Twelve mixed oil phase solutions were configured according to Table 1-2, numbered M1-1 to M2-6, and the proportions in Table 1-2 are all mass ratios.
Table 4-2.
Formulation Table of Oil Phase Materials with Different Ratios.
| Sample Names | M1 | M2 |
|---|---|---|
| PETS: PETO: PEG400MS Mass Ratio | PETS: PETO: PEG400MO Mass Ratio | |
| 1 | 10:20:10 | 10:30:10 |
| 2 | 10:20:5 | 10:30:5 |
| 3 | 10:20:2 | 10:30:2 |
| 4 | 10:20:1 | 10:30:1 |
| 5 | 10:20:0.5 | 10:30:0.5 |
| 6 | 10:20:0 | 10:30:0 |
4.2.3. Preparation and Formulation Screening of Outer Shell
HPMC and EC are modified derivatives of natural cellulose.Both of these substances possess excellent viscosity and stability, making them valuable as stabilizers and thickeners in pharmaceuticals. They are commonly used to improve drug release. When a mixture of these two substances undergoes a cross-linking reaction, it forms a mesh-like structure. When this mixture is air-dried, it results in the formation of a translucent film. Studies have shown that this hybrid film can be loaded with drugs through dissolution in water or alcohol, thereby achieving sustained release of the drug [42].According to Table 1-3, five mixed solutions of HPMC and EC with different mass ratios were configured, and the effects of different mass ratios of HPMC and EC on the toughness, elasticity, etc. of the shells were considered.
Table 4-3.
Formulation Table of Organic Cellulose Materials with Different Ratios.
| Sample Names | EC: HPMC Mass Ratio |
|---|---|
| HE1 | 30:1 |
| HE2 | 10:1 |
| HE3 | 5:1 |
| HE4 | 3:1 |
| HE5 | 2:1 |
4.3. Analyze Test Methods and Test Procedures
4.3.1. Tetramycin Standard Curve Production
Accurately weigh a certain mass of Tetramycin, prepare an aqueous solution of Tetramycin with the mass concentration of 5g/L in distilled water, take 2.5, 5, 7.5, 10, 12.5mL of Tetramycin, and then condense to 50mL, then determine the absorbance at 319nm. The absorbance at 319nm was measured. The absorbance was taken as the vertical coordinate and the mass concentration of Tetramycin as the horizontal coordinate to make the standard curve.
4.3.2. DSC Analysis
Accurately weighed 20~30 mg of oil film material was analyzed on a differential scanning calorimeter (Netzsch DSC 204 F). The equilibrium and sample gases were nitrogen, the heating rate was 10 °C/min, the starting temperature was -30 °C and the termination temperature was 90 °C to investigate the decomposition temperature.
4.3.3. Mass Spectrometer Analysis
The TA-XT plus mass spectrometer was used to determine the mass structure of the drug core and HPLC-EC shell liquid. P2 was selected as the probe for the determination of the drug core, with a descending speed of 2.0 mm/s before the test, a testing speed of 1.0 mm/s, a return speed of 2 mm/s after the test, a testing distance of 20.0 mm, a trigger force of 5 g, and each test was repeated three times. Determination of HPLC-EC shell probe selection P36R, before the test probe descending speed 2.0mm/s, test speed 1.0mm/s, after the test probe return speed 2mm/s, test distance 20.0mm, trigger force 5g, each test repeated 3 times.
4.3.4. High Performance Liquid Chromatography Analysis
A Water e2695-2489 high performance liquid chromatograph was used to determine the mass concentration of Tetramycin A1 in the sample pills. The chromatographic column was SunFire C18 with the size of φ4.6 mm×250 mm (diameter×length), the inter-packing pore size in the column was 5 μm, the detection wavelength was 292 nm, the column temperature was 25 °C, the volume ratio of methanol to aqueous formic acid with a mass fraction of 0.1% was 15:85 in the mobile phase, and the flow rate was 0.4 mL/min, and the injection volume of the solution to be detected was 20 μL [43].
Take a certain mass of sample pills, chopped in a centrifuge tube, add methanol and phosphate buffer solution in the volume ratio of 3:7, dissolve and ultrasonic treatment for 30 min, after cooling, centrifugation at 4000r for 15 min, and leave for a period of time, and determine the amount of loaded drug by analyzing the mass concentration of Tetramycin in the solution.
4.3.5. SEM Analysis
A swept surface electron microscope (SEM) was utilized to observe the changes in the morphological characteristics of the intermediate and outer shell layers before and after water soaking. The water-soaked and un-soaked sample pills were snap-frozen in liquid nitrogen, and then the oil and HPMC-EC membranes were peeled off and removed. The samples were fixed on the carrier with conductive adhesive tape, and the samples were blown well against the samples with a washer ball, and the surface of the samples was sprayed with gold (10 nm) [44], and the morphology characteristics of the samples before and after soaking in water were observed with a scanning electron microscope under a magnification of 200 times.
4.3.6. Characterization of Drug Release
Accurately weighed 100g of soil samples were added to a ziplock bag and divided into two categories with 10% and 30% water. The prepared pills were placed into the sealed bag and ensured to be buried in the soil, 1, 3, 5, 7, 14, 21, 35 samples were taken for testing and each group of tests was repeated three times and the average value was taken to plot the release curve.
4.3.7. Analysis of Simulated Field Release Experiments
To the sealed bag, 1000g of soil samples were accurately weighed and divided into two categories, adding 10% and 30% water respectively. As shown in Figure 1-3, the pills were first placed in a sealed bag with 30% water content, placed in a constant temperature incubator at 35 degrees Celsius for 12h, sampling and testing, each group of tests were repeated three times, take the average value; the remaining pills pills were placed in (a) 10% water, 20 °C; (b) 10% water, 35 °C; (c) 30% water, 20 °C environment for 3 days, sampling and testing, each group of The test was repeated three times and the average value was taken. In addition, (d) placed in the air environment of 20 °C and (e) placed in the air environment of 35 °C as a control group, followed by the experimental group to take samples, and the test was repeated three times and the average value was taken for each group. The operation was repeated five times and the release curve was plotted.
Figure 1-3.
Simulation of Field Environmental Release Experiment Technical Route.
4.3.8. Soil Defense Effect and Disease Finger Statistics
Tobacco seedling plants without drug application were used as blank group, and tobacco seedling plants with drug application were used as experimental group, totaling 2 treatments, each treatment was repeated 3 times, with a total of 180 tobacco plants, and disease incidence of tobacco plants in all treatments was investigated at 55, 72, 90, 102d after drug application in each group, and disease index and relative were calculated in accordance with (GB/T 23222-2008) [45]. Prevention effect.
4.3.9. Analysis of Soil Flora Structure
After counting the disease fingers, soil samples were collected from three tobacco plants with similar growth and development from each of the blank and test groups. Soil samples were taken from 10, 20 and 30 cm depth of the corresponding plots, dried at 50 °C, leaves and boulders removed, passed through a 200-mesh sieve and stored at -80 °C.
The sequencing analysis of colony structure was submitted to Wuhan Huada Gene Technology Service Co (China).
4.4. Statistical Analysis of Data
Origin 8.5 software was used to plot the graphs, and IBM SPSS Statistics 26.0 software was used to organize and perform ANOVA and analysis of significance of differences. Each test was repeated three times in parallel and the results were expressed as mean ± standard deviation.
5. Conclusions
Through the selection of the drug core, grease shell material, HPMC-EC shell material, and conducting drug release experiments and field trials, we successfully prepared core-shell slow-controlled-release pill particles containing Tetramycin. These particles have demonstrated the ability to achieve intelligent temperature and humidity-controlled release of the aqueous drug, which aligns with the conditions required to control Ralstonia solanacearum in tobacco. The field trial also confirmed that these pill particles could reduce the occurrence of Ralstonia solanacearum within a specific time frame, effectively decreasing the quantity of drugs and the frequency of applications. This approach is beneficial for minimizing the environmental impact associated with excessive drug use in soil. Additionally, a single drug application can maintain effectiveness for approximately 30 days, reducing the need for frequent manual drug applications and labor costs. This innovation meets the demands of agricultural production and can be applied in a wide range of settings.
Author Contributions
Conceptualization, Y.L., X.C. and S.L.; methodology, J.G., G.L., X.D., and J.Z.; formal analysis, Y.L. and X.C.; investigation, Y.L., X.C.; resources, X.C.; writing—original draft preparation, J.G.; writing—review and editing, J.G.; supervision, Y.L., X.C. and S.L.; project administration, Y.L. and X.C.; funding acquisition, Y.L., X.C. All authors have read and agreed to the published version of the manuscript.
Funding
This research was funded by a science and technology project of the Guizhou Branch of China National Tobacco Corporation, grant number 2021XM11, 201811.
Institutional Review Board Statement
Not applicable.
Informed Consent Statement
Not applicable.
Data Availability Statement
Not applicable.
Acknowledgments
The authors would like to thank Shunli Kou for support with the SEM,Shiwang Liu for support with The mass spectrometer, Yuanfeng Wu for support with the HPLC,Yinbang Zhu for support with the DSC,and Zhenzhen Wang for support on the TGA.
Conflicts of Interest
The authors declare no conflict of interest.
References
- Nemo P, Alice G, Fabienne V, et al.Ralstonia solanacearum, a widespread bacterial plant pathogen in the post-genomic era.Molecular plant pathology.2013,14(7):651-62. [CrossRef]
- D CH, Beatriz Z, Jean CD, et al.Ralstonia solanacearum pandemic lineage strain UW551 overcomes inhibitory xylem chemistry to break tomato bacterial wilt resistance. Molecular plant pathology. 2023. [CrossRef]
- A CL, Maurício R.History and Status of Selected Hosts of the Ralstonia solanacearum Species Complex Causing Bacterial Wilt in Brazil. Frontiers in microbiology. 2018, 91228. [CrossRef]
- Jiawei W, Yulong P, Shanshan X, et al.Biocontrol and molecular characterization of Bacillus velezensis D against tobacco bacterial wilt. Phytopathology Research. 2023, 5(1). [CrossRef]
- Stéphane G.Molecular traits controlling host range and adaptation to plants in Ralstonia solanacearum. The New phytologist. 2010, 187(4):920-8. [CrossRef]
- Siyuan S, Jiaojiao N, Chao Z, et al. Significant relationship between soil bacterial community structure and incidence of bacterial wilt disease under continuous cropping system. Archives of microbiology.2017,199(2):267-275. [CrossRef]
- Furusawa A, Uehara T, Ikeda K, et al. Ralstonia solanacearum colonization of tomato roots infected by Meloidogyne incognita.Journal of Phytopathology.2019,167(6):338-343. [CrossRef]
- Xiaowei S, Haohong Z, Yinzhu Z, et al. A Case of Hemophagocytic Lymphohistiocytosis Secondary to Ralstonia Solanacearum Infection. Clinical laboratory.2019,65(6). [CrossRef]
- Borlinghaus J, Albrecht F, Gruhlke HC M, et al. Allicin: Chemistry and Biological Properties.Molecules.2014,19(8):12591-12618. [CrossRef]
- Cheng Z, Wenzhi L, Youhua L, et al. Co-Application of Tetramycin and Matrine Improves Resistance of Kiwifruit against Soft Rot Disease and Enhances Its Quality and Amino Acids.Antibiotics.2022,11(5):671-671. [CrossRef]
- Wenzhi L, Youhua L, Xianhui Y, et al.Antifungal activity and mechanism of tetramycin against Alternaria alternata, the soft rot causing fungi in kiwifruit.Pesticide Biochemistry and Physiology.2023,192105409-105409. [CrossRef]
- Sophien K, Oliver F, G DJ J, et al.The Top 10 oomycete pathogens in molecular plant pathology.Molecular plant pathology.2015,16(4):413-34. [CrossRef]
- V. VB, B. TC, E. EM, et al.Synthesis and Antifungal Activity of N-Benzyl Derivatives of Tetramycin B.Russian Journal of General Chemistry.2021,91(6):1028-1038. [CrossRef]
- Yinglong H, Yu D, Qingping W, et al.Identification of the Potential Biological Preservative Tetramycin A-Producing Strain and Enhancing Its Production.Frontiers in microbiology.2019,102925. [CrossRef]
- V. VB.Ecological Aspects of Application of Tetraene Macrolide Antibiotic Tetramycin in Agriculture and Food Industry (A Review).Russian Journal of General Chemistry.2022,91(13):2858-2880. [CrossRef]
- Ma X, Xiang S, Xie H, et al.Fabrication of pH-Sensitive Tetramycin Releasing Gel and Its Antibacterial Bioactivity against Ralstonia solanacearum.Molecules.2019,24(19):3606-3606. [CrossRef]
- Mu B, Li M.Fabrication and thermal properties of tetradecanol/graphene aerogel form-stable composite phase change materials.Scientific Reports.2018,8(1):1-14. [CrossRef]
- Abderrahmane S, Sara GD, Marco C, et al.Macromolecular vs molecular crowding in aqueous solutions: A comparative study of PEG400 and ethylene glycol.Journal of Molecular Liquids.2024,394123713. [CrossRef]
- Nwude FE, Chaweewan J, Teerapol S.Insights into the formulation properties, biocompatibility, and permeability of poorly water-soluble methoxyflavones with PEG400 and propylene glycol.Acta Pharmaceutica.2023,73(3):385-404. [CrossRef]
- Tanpong C, Nutthapong K, Rose SS, et al.Extraction of Tropical Fruit Peels and Development of HPMC Film Containing the Extracts as an Active Antibacterial Packaging Material.Molecules.2021,26(8):2265-2265. [CrossRef]
- Lulu D. Nutrient Release Mechanism and Evaluation Methods of Slow and Controlled Release Fertilisers.Shandong Agricultural University(China);2010.
- Najmeh BS, Majid MH, Rabi B, et al.Release kinetics and bioavailability of nutrients from a slow-release iron fertilizer coated with cellulose derived from waste palm branches and pistachio shells.Arabian Journal of Geosciences.2023,16(2). [CrossRef]
- Patharawadee B, Sirinya S, Pohnpawee N, et al.Novel coating films containing micronutrients for controlled-release urea fertilizer: release mechanisms and kinetics study.Polymer Bulletin,2022,80(9):1-23. [CrossRef]
- Xiaoli W, Jianbin Z, Jianjun D, et al.Kinetics of nitrogen release from coated controlled release fertilisers. Journal of Northwest Agriculture and Forestry University.2003,(05):35-38+42. [CrossRef]
- Weila L, Yifan Y, Varenyam A.Biochemical composite material using corncob powder as a carrier material for ureolytic bacteria in soil cadmium immobilization.Science of the Total Environment.2022,802149802-149802. [CrossRef]
- [27]Weila L, Yifan Y, Varenyam A.Biochemical composite material using corncob powder as a carrier material for ureolytic bacteria in soil cadmium immobilization.Science of the Total Environment.2022,802149802-149802. [CrossRef]
- Lakkana L, Pattana L.Ethanol production from sweet sorghum juice in repeated-batch fermentation by Saccharomyces cerevisiae immobilized on corncob.World journal of microbiology biotechnology.2012,28(2):559-66. [CrossRef]
- Vander Waal G, Kenbeek D.Testing application and future development of envrivementally friendly ester base fluids.J Syn Lubr.1993,10(1):67. [CrossRef]
- Bakhtiary N, Bagheri H, Salehnia M.Design of biocompatible polylactic acid–polyethylene glycol combination for manufacturing biodegradable staplers.Journal of Applied Polymer Science.2023,141(2). [CrossRef]
- Cai C, Chen Z, Ye S, et al.Synthesis and characterization of biodegradable and photocrosslinkable multi-block poly(ether-ester): Molecular-weight and component of the polyethylene glycol segment dependence.Journal of Applied Polymer Science.2023,140(47). [CrossRef]
- Yuqian Z, Yuwei H, Zhongxin T, et al.Cellulose extraction from rice straw waste for biodegradable ethyl cellulose films preparation using green chemical technology.Journal of Cleaner Production.2024,439(7):140839. [CrossRef]
- Arafat H, A AA, Afeez G, et al.Demulsification of asphaltene stabilized crude oil emulsions by biodegradable ethylcellulose polymers with varying viscosities.Scientific reports.2023,13(1):1090. [CrossRef]
- Raghunath D, Soumitra G, Sagar P.Corrigendum to “Flocculation characteristics of polyacrylamide grafted hydroxypropyl methyl cellulose: An efficient biodegradable flocculant” [Chem. Eng. J. 229 (2013) 144–152].Chemical Engineering Journal.2022,427. [CrossRef]
- Alina H, Anjum N, Feroz A, et al.Sustainable alginate/aloe vera composite biodegradable films reinforced with carboxymethyl cellulose and hydroxypropyl methylcellulose.Polymer Composites.2022,43(6):3471-3480. [CrossRef]
- Ruifeng Z, Xiaotong F, Shengnan J, et al.Water and oil-resistant paper materials based on sodium alginate/hydroxypropyl methylcellulose/polyvinyl butyral/nano-silica with biodegradable and high barrier properties.International journal of biological macromolecules.2022,225. [CrossRef]
- Yasemin TB.Development of citric acid crosslinked biodegradable chitosan/hydroxyethyl cellulose/organo-modified nanoclay composite films as sustainable food packaging materials [J].Polymer-Plastics Technology and Materials.2023,62(9):1138-1156. [CrossRef]
- Chunqing B.Preparation of functional lipid micro- and nano-capsules and evaluation of their properties.Nanchang University(China);2014.
- Hao W, Ziqiang S.Progress in cross-linking modification of water-soluble cellulose ethers.Cellulose Science and Technology.2022,30(02):64-71. [CrossRef]
- Cheng H, Hua G, Lin C, et al.Effect of temperature on phenotype characterization of Ralstonia solanacearum from tobacco.Canadian Journal of Plant Pathology.2020,42(2):164-181. [CrossRef]
- Fanyu K. Integrated control of Ralstonia solanacearum in tobacco. tobacco science and technology.2003(04):42-43+48.
- Yao W, Chunyang H, Liang Y, et al.Screening of Ralstonia solanacearum compound and its efficacy against the disease in the field.Pesticides.2022,61(10):776-780. [CrossRef]
- Campos,C.A., Gerschenson,L.N., Flores,S.K.Development of edible films and coatings with antimicrobial activity. (Special Issue: Innovations in food technology.).Food and bioprocess technology.2011,4(6):849-875. [CrossRef]
- Lihua Y, Fangzhou J, Henghui C , et al.A method for the determination of Tetramycin residues in soil using high performance liquid chromatography.Hunan Province of China:CN109142589B,2022-03-01.
- Shujun W, Jinglin Y, Qinghua Z, et al. .Granular structure and allomorph position in C-type Chinese yam starch granule revealed by SEM, 13C CP/MAS NMR and XRD.Food Hydrocolloids, 2009. [CrossRef]
- State Tobacco Monopoly Administration of China.Grade and investigation method of tobacco diseases and insect pests:GB/T 23222-2008.Title of Site. Available online: URL (accessed on Day Month Year).
Disclaimer/Publisher’s Note: The statements, opinions and data contained in all publications are solely those of the individual author(s) and contributor(s) and not of MDPI and/or the editor(s). MDPI and/or the editor(s) disclaim responsibility for any injury to people or property resulting from any ideas, methods, instructions or products referred to in the content. |
© 2024 by the authors. Licensee MDPI, Basel, Switzerland. This article is an open access article distributed under the terms and conditions of the Creative Commons Attribution (CC BY) license (http://creativecommons.org/licenses/by/4.0/).
Copyright: This open access article is published under a Creative Commons CC BY 4.0 license, which permit the free download, distribution, and reuse, provided that the author and preprint are cited in any reuse.


