Submitted:
12 February 2024
Posted:
15 February 2024
You are already at the latest version
Abstract
Keywords:
Introduction
2. Details on MSProfileR Tool
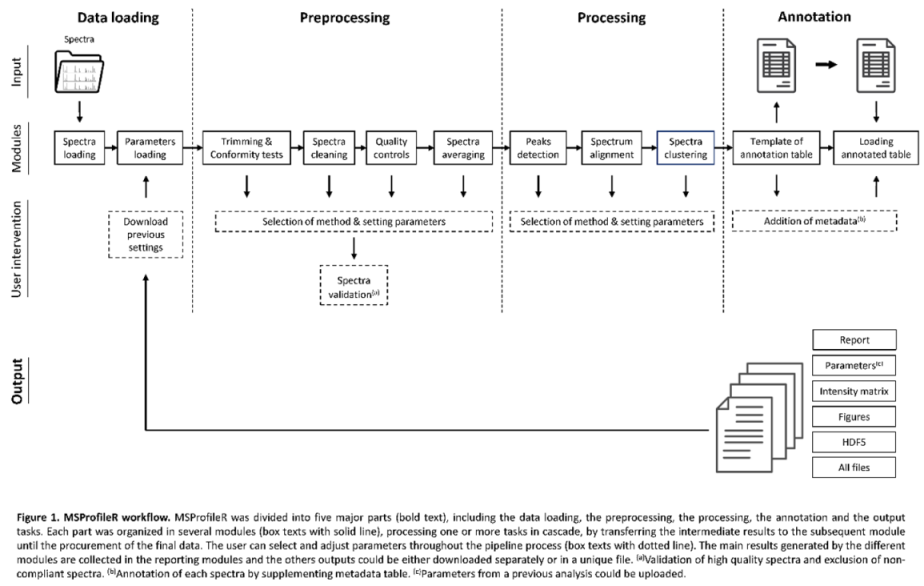
2.1. General organization of the “MSProfileR_v1.0” Tool

2.2. Data Loading
2.2.1. Module of the MS Spectra Loading
2.2.2. Module of Parameter Loading
2.3. Preprocessing
2.3.1. Module of Trimming and Conformity Check
- (i)
- Completeness: Are there any empty spectra (i.e., no data to load)?
- (ii)
- Missing values: Are there any spectra with irregular m/z values? Normally, the interval between two successive m/z values should remain equal or increase uniformly (i.e., no missing point or aberrant values).
- (iii)
- Spectra range: Does the length (ie, m/z values range) of spectra differ?
2.3.2. Module of Spectra Cleaning
2.3.3. Module of Quality Control
2.3.4. Module of Spectra Averaging
2.4. Processing
2.4.1. Module of Peak Detection
2.4.2. Module of Spectra Alignment
2.4.3. Module of Spectra Clustering
2.5. Spectra Annotation
2.6. Output
2.6.1. Reports
2.6.2. Save Setting Parameters
2.6.3. Export Intensity Matrix
2.6.4. Figure List (Plots, Graph, etc.)
2.6.5. Hierarchical Data Format Version 5 (HDF5) File
2.6.6. Module Downloading All Files
2.7. The User Interface (UI)

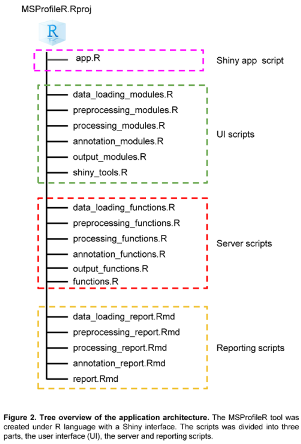
2.7.1. Web Interface Development Architecture
2.7.2. UI of Data Loading Tab
2.7.3. UI of Preprocessing Tab
2.7.4. UI of Processing Tab
2.7.5. UI of Annotation Tab
2.7.6. UI of Output Tab
3. Assessment of MSProfileR Tool
3.1. Use Case N°1: Arthropod Families
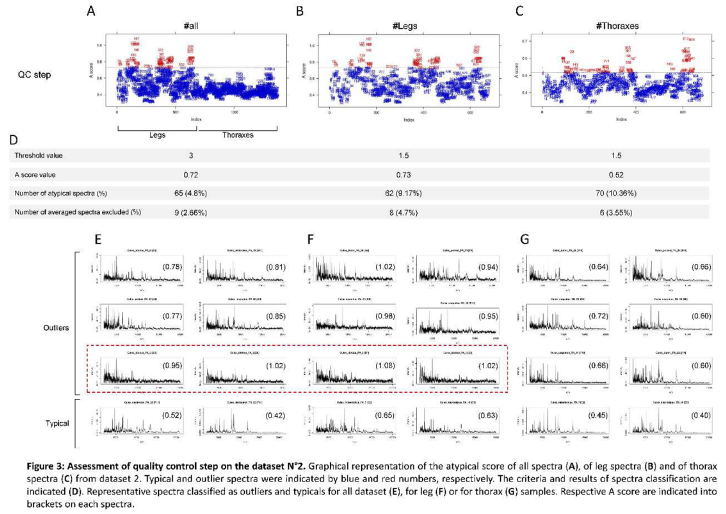
3.2. Use Case N°2: Culex Genus

Discussion
Conclusions
List of Abbreviations
Supplementary Materials
Author Contributions
Funding
Ethics Approval and Consent to Participate
Consent for publication
Availability of Data and Materials
Acknowledgments
Competing Interests
Availability
References
- Sandrin, T.R.; Goldstein, J.E.; Schumaker, S. MALDI TOF MS Profiling of Bacteria at the Strain Level: A Review. Mass Spectrom. Rev. 2013, 32, 188–217. [Google Scholar] [CrossRef]
- Fenselau, C.; Demirev, P.A. Characterization of Intact Microorganisms by MALDI Mass Spectrometry. Mass Spectrom. Rev. 2001, 20, 157–171. [Google Scholar] [CrossRef]
- Seng, P.; Rolain, J.-M.; Fournier, P.E.; La Scola, B.; Drancourt, M.; Raoult, D. MALDI-TOF-Mass Spectrometry Applications in Clinical Microbiology. Future Microbiol. 2010, 5, 1733–1754. [Google Scholar] [CrossRef]
- Yssouf, A.; Almeras, L.; Raoult, D.; Parola, P. Emerging Tools for Identification of Arthropod Vectors. Future Microbiol. 2016, 11, 549–566. [Google Scholar] [CrossRef]
- Dieme, C.; Yssouf, A.; Vega-Rúa, A.; Berenger, J.-M.; Failloux, A.-B.; Raoult, D.; Parola, P.; Almeras, L. Accurate Identification of Culicidae at Aquatic Developmental Stages by MALDI-TOF MS Profiling. Parasit. Vectors 2014, 7, 544. [Google Scholar] [CrossRef]
- Nabet, C.; Kone, A.K.; Dia, A.K.; Sylla, M.; Gautier, M.; Yattara, M.; Thera, M.A.; Faye, O.; Braack, L.; Manguin, S.; et al. New Assessment of Anopheles Vector Species Identification Using MALDI-TOF MS. Malar. J. 2021, 20, 33. [Google Scholar] [CrossRef]
- Nebbak, A.; Willcox, A.C.; Bitam, I.; Raoult, D.; Parola, P.; Almeras, L. Standardization of Sample Homogenization for Mosquito Identification Using an Innovative Proteomic Tool Based on Protein Profiling. Proteomics 2016, 16, 3148–3160. [Google Scholar] [CrossRef] [PubMed]
- Nebbak, A.; El Hamzaoui, B.; Berenger, J.-M.; Bitam, I.; Raoult, D.; Almeras, L.; Parola, P. Comparative Analysis of Storage Conditions and Homogenization Methods for Tick and Flea Species for Identification by MALDI-TOF MS. Med. Vet. Entomol. 2017, 31, 438–448. [Google Scholar] [CrossRef]
- Vega-Rúa, A.; Pagès, N.; Fontaine, A.; Nuccio, C.; Hery, L.; Goindin, D.; Gustave, J.; Almeras, L. Improvement of Mosquito Identification by MALDI-TOF MS Biotyping Using Protein Signatures from Two Body Parts. Parasit. Vectors 2018, 11, 574. [Google Scholar] [CrossRef] [PubMed]
- Boyer, P.H.; Boulanger, N.; Nebbak, A.; Collin, E.; Jaulhac, B.; Almeras, L. Assessment of MALDI-TOF MS Biotyping for Borrelia Burgdorferi Sl Detection in Ixodes Ricinus. PloS One 2017, 12, e0185430. [Google Scholar] [CrossRef] [PubMed]
- Bamou, R.; Costa, M.M.; Diarra, A.Z.; Martins, A.J.; Parola, P.; Almeras, L. Enhanced Procedures for Mosquito Identification by MALDI-TOF MS. Parasit. Vectors 2022, 15, 240. [Google Scholar] [CrossRef]
- Yssouf, A.; Parola, P.; Lindström, A.; Lilja, T.; L’Ambert, G.; Bondesson, U.; Berenger, J.-M.; Raoult, D.; Almeras, L. Identification of European Mosquito Species by MALDI-TOF MS. Parasitol. Res. 2014, 113, 2375–2378. [Google Scholar] [CrossRef]
- Kumsa, B.; Laroche, M.; Almeras, L.; Mediannikov, O.; Raoult, D.; Parola, P. Morphological, Molecular and MALDI-TOF Mass Spectrometry Identification of Ixodid Tick Species Collected in Oromia, Ethiopia. Parasitol. Res. 2016, 115, 4199–4210. [Google Scholar] [CrossRef]
- Albrethsen, J. Reproducibility in Protein Profiling by MALDI-TOF Mass Spectrometry. Clin. Chem. 2007, 53, 852–858. [Google Scholar] [CrossRef]
- Diarra, A.Z.; Laroche, M.; Berger, F.; Parola, P. Use of MALDI-TOF MS for the Identification of Chad Mosquitoes and the Origin of Their Blood Meal. Am. J. Trop. Med. Hyg. 2019, 100, 47–53. [Google Scholar] [CrossRef]
- Gibb, S.; Strimmer, K. MALDIquant: A Versatile R Package for the Analysis of Mass Spectrometry Data. Bioinforma. Oxf. Engl. 2012, 28, 2270–2271. [Google Scholar] [CrossRef]
- Palarea-Albaladejo, J.; Mclean, K.; Wright, F.; Smith, D.G.E. MALDIrppa: Quality Control and Robust Analysis for Mass Spectrometry Data. Bioinforma. Oxf. Engl. 2018, 34, 522–523. [Google Scholar] [CrossRef] [PubMed]
- Susmita, D.; Bart J. A., M. Statistical Analysis of Proteomics, Metabolomics, and Lipidomics Data Using Mass Spectrometry.
- Coombes, K.R.; Tsavachidis, S.; Morris, J.S.; Baggerly, K.A.; Hung, M.-C.; Kuerer, H.M. Improved Peak Detection and Quantification of Mass Spectrometry Data Acquired from Surface-Enhanced Laser Desorption and Ionization by Denoising Spectra with the Undecimated Discrete Wavelet Transform. Proteomics 2005, 5, 4107–4117. [Google Scholar] [CrossRef] [PubMed]
- Tibshirani, R.; Hastie, T.; Narasimhan, B.; Soltys, S.; Shi, G.; Koong, A.; Le, Q.-T. Sample Classification from Protein Mass Spectrometry, by “Peak Probability Contrasts. ” Bioinforma. Oxf. Engl. 2004, 20, 3034–3044. [Google Scholar] [CrossRef] [PubMed]
- Savitzky, Abraham.; Golay, M.J.E. Smoothing and Differentiation of Data by Simplified Least Squares Procedures. Anal. Chem. 1964, 36, 1627–1639. [CrossRef]
- Ryan, C.G.; Clayton, E.; Griffin, W.L.; Sie, S.H.; Cousens, D.R. SNIP, a Statistics-Sensitive Background Treatment for the Quantitative Analysis of PIXE Spectra in Geoscience Applications. Nucl. Instrum. Methods Phys. Res. Sect. B Beam Interact. Mater. At. 1988, 34, 396–402. [Google Scholar] [CrossRef]
- Deininger, S.-O.; Cornett, D.S.; Paape, R.; Becker, M.; Pineau, C.; Rauser, S.; Walch, A.; Wolski, E. Normalization in MALDI-TOF Imaging Datasets of Proteins: Practical Considerations. Anal. Bioanal. Chem. 2011, 401, 167–181. [Google Scholar] [CrossRef]
- Dieterle, F.; Ross, A.; Schlotterbeck, G.; Senn, H. Probabilistic Quotient Normalization as Robust Method to Account for Dilution of Complex Biological Mixtures. Application in 1H NMR Metabonomics. Anal. Chem. 2006, 78, 4281–4290. [Google Scholar] [CrossRef] [PubMed]
- Rousseeuw, P.J.; Croux, C. Alternatives to the Median Absolute Deviation. J. Am. Stat. Assoc. 1993, 88, 1273–1283. [Google Scholar] [CrossRef]
- Rosner, B. Percentage Points for a Generalized ESD Many-Outlier Procedure. Technometrics 1983, 25, 165–172. [Google Scholar] [CrossRef]
- Zheng, X.; Ma, Y.; Bai, Y.; Huang, T.; Lv, X.; Deng, J.; Wang, Z.; Lian, W.; Tong, Y.; Zhang, X.; et al. Identification and Validation of Immunotherapy for Four Novel Clusters of Colorectal Cancer Based on the Tumor Microenvironment. Front. Immunol. 2022, 13, 984480. [Google Scholar] [CrossRef] [PubMed]
- Yihui, X.; J. J., A.; Garrett, G. Chapter 15 Parameterized Reports. In R Markdown: The Definitive Guide; 2023.
- Ingargiola, A.; Laurence, T.; Boutelle, R.; Weiss, S.; Michalet, X. Photon-HDF5: Open Data Format and Computational Tools for Timestamp-Based Single-Molecule Experiments. Proc. SPIE-- Int. Soc. Opt. Eng. 2016, 9714, 971405. [Google Scholar] [CrossRef] [PubMed]
- Fall, F.K.; Laroche, M.; Bossin, H.; Musso, D.; Parola, P. Performance of MALDI-TOF Mass Spectrometry to Determine the Sex of Mosquitoes and Identify Specific Colonies from French Polynesia. Am. J. Trop. Med. Hyg. 2021, 104, 1907–1916. [Google Scholar] [CrossRef] [PubMed]
- Costa, M.M.; Guidez, A.; Briolant, S.; Talaga, S.; Issaly, J.; Naroua, H.; Carinci, R.; Gaborit, P.; Lavergne, A.; Dusfour, I.; et al. Identification of Neotropical Culex Mosquitoes by MALDI-TOF MS Profiling. Trop. Med. Infect. Dis. 2023, 8, 168. [Google Scholar] [CrossRef]
- Briolant, S.; Costa, M.M.; Nguyen, C.; Dusfour, I.; Pommier de Santi, V.; Girod, R.; Almeras, L. Identification of French Guiana Anopheline Mosquitoes by MALDI-TOF MS Profiling Using Protein Signatures from Two Body Parts. PloS One 2020, 15, e0234098. [Google Scholar] [CrossRef]
- Sevestre, J.; Diarra, A.Z.; Laroche, M.; Almeras, L.; Parola, P. Matrix-Assisted Laser Desorption/Ionization Time-of-Flight Mass Spectrometry: An Emerging Tool for Studying the Vectors of Human Infectious Diseases. Future Microbiol. 2021, 16, 323–340. [Google Scholar] [CrossRef]
- Beltran, A.; Palomar, A.M.; Ercibengoa, M.; Goñi, P.; Benito, R.; Lopez, B.; Oteo, J.A. MALDI-TOF MS as a Tick Identification Tool in a Tertiary Hospital in Spain. Acta Trop. 2023, 242, 106868. [Google Scholar] [CrossRef] [PubMed]
- Jumpertz, M.; Sevestre, J.; Luciani, L.; Houhamdi, L.; Fournier, P.-E.; Parola, P. Bacterial Agents Detected in 418 Ticks Removed from Humans during 2014-2021, France. Emerg. Infect. Dis. 2023, 29, 701–710. [Google Scholar] [CrossRef] [PubMed]
- Dingle, T.C.; Butler-Wu, S.M. Maldi-Tof Mass Spectrometry for Microorganism Identification. Clin. Lab. Med. 2013, 33, 589–609. [Google Scholar] [CrossRef] [PubMed]
- Diarra, A.Z.; Almeras, L.; Laroche, M.; Berenger, J.-M.; Koné, A.K.; Bocoum, Z.; Dabo, A.; Doumbo, O.; Raoult, D.; Parola, P. Molecular and MALDI-TOF Identification of Ticks and Tick-Associated Bacteria in Mali. PLoS Negl. Trop. Dis. 2017, 11, e0005762. [Google Scholar] [CrossRef]
- Ilina, E.N.; Borovskaya, A.D.; Malakhova, M.M.; Vereshchagin, V.A.; Kubanova, A.A.; Kruglov, A.N.; Svistunova, T.S.; Gazarian, A.O.; Maier, T.; Kostrzewa, M.; et al. Direct Bacterial Profiling by Matrix-Assisted Laser Desorption-Ionization Time-of-Flight Mass Spectrometry for Identification of Pathogenic Neisseria. J. Mol. Diagn. JMD 2009, 11, 75–86. [Google Scholar] [CrossRef] [PubMed]
- Fothergill, A.; Kasinathan, V.; Hyman, J.; Walsh, J.; Drake, T.; Wang, Y.F.W. Rapid Identification of Bacteria and Yeasts from Positive-Blood-Culture Bottles by Using a Lysis-Filtration Method and Matrix-Assisted Laser Desorption Ionization-Time of Flight Mass Spectrum Analysis with the SARAMIS Database. J. Clin. Microbiol. 2013, 51, 805–809. [Google Scholar] [CrossRef] [PubMed]
- Yssouf, A.; Socolovschi, C.; Leulmi, H.; Kernif, T.; Bitam, I.; Audoly, G.; Almeras, L.; Raoult, D.; Parola, P. Identification of Flea Species Using MALDI-TOF/MS. Comp. Immunol. Microbiol. Infect. Dis. 2014, 37, 153–157. [Google Scholar] [CrossRef] [PubMed]
- Bauer, C.; Cramer, R.; Schuchhardt, J. Evaluation of Peak-Picking Algorithms for Protein Mass Spectrometry. Methods Mol. Biol. Clifton NJ 2011, 696, 341–352. [Google Scholar] [CrossRef]
- Costa, M.M.; Martin, H.; Estellon, B.; Dupé, F.-X.; Saby, F.; Benoit, N.; Tissot-Dupont, H.; Million, M.; Pradines, B.; Granjeaud, S.; et al. Exploratory Study on Application of MALDI-TOF-MS to Detect SARS-CoV-2 Infection in Human Saliva. J. Clin. Med. 2022, 11, 295. [Google Scholar] [CrossRef]
- Asare, P.T.; Lee, C.-H.; Hürlimann, V.; Teo, Y.; Cuénod, A.; Akduman, N.; Gekeler, C.; Afrizal, A.; Corthesy, M.; Kohout, C.; et al. A MALDI-TOF MS Library for Rapid Identification of Human Commensal Gut Bacteria from the Class Clostridia. Front. Microbiol. 2023, 14, 1104707. [Google Scholar] [CrossRef]
- Del Prete, E.; Facchiano, A.; Profumo, A.; Angelini, C.; Romano, P. GeenaR: A Web Tool for Reproducible MALDI-TOF Analysis. Front. Genet. 2021, 12, 635814. [Google Scholar] [CrossRef] [PubMed]
- Nebbak, A.; Almeras, L. Identification of Aedes Mosquitoes by MALDI-TOF MS Biotyping Using Protein Signatures from Larval and Pupal Exuviae. Parasit. Vectors 2020, 13, 161. [Google Scholar] [CrossRef]
| Tab (or Steps) | Modules | Tasks | Methods | Parameters (Range) | Default Setting | Graphical Interface |
|---|---|---|---|---|---|---|
|
Data loading |
Spectra loading |
Choose the level of spectra path issues from the MALDI-TOF MS directories | number of folders (1 to n) | 4 | ||
| Import of raw spectra data and spectra metadata | Table | |||||
| Setting parameters (optional) | Download previous settings | JSON file(a) | ||||
| Pre-processing | Trimming & Conformity tests | Trimming of spectra | Lower – upper limits (0.1-500 kDa) |
2-20 kDa | Plotting the limits | |
| Elimination of empty, irregular or non-compliant length spectra | Count and color code of spectra status (green, compliant; orange, non-compliant spectra) | |||||
| Cleaning spectra | Variance stabilization | Sqrt* Log Log 2 Log 10 |
||||
| Smoothing | Savitzky-Golay* Moving average |
Half Window Size (1- 100) | 10 | |||
| Baseline removal | SNIP* TopHat Convex hull Median |
Number of iterations (1-100) | 100 | |||
| Normalization | TIC* PQN Median |
Plotting of stabilized, smoothed, corrected and normalized spectra | ||||
| Quality control | Estimator | Q* MAD |
||||
| Associated method | RC* Hampel ESD Boxplot Adj.boxplot |
Threshold value (0.1- 10) | 3 (1.5 for boxplot rules, 3 for others methods) | |||
| Detection of outliers outside the upper and lower thresholds | Ascore | Spectra below the lower threshold included |
Plotting of spectra with respective Ascore, threshold indicated by dotted line(s) and outliers colored in red numbers. | |||
| Selection of spectra | User intervention | Listing of selected and excluded spectra Plotting of selected spectra |
||||
| Averaging | Average replicates | Mean* Median Sum |
Count of averaged spectra Table |
|||
| Processing | Peak detection | Estimator | MAD* Super Smoother |
Half window size (1-100) |
20 | |
| Background subtraction | SNR | SNR value (2-7) | 2 | Boxplot counting detected peak per SNR value Plotting of detected peak per selected spectra |
||
| Spectrum alignment | Reference peak detection | Strict* Relaxed |
min Frequency (0.1-1) Tolerance (0.0001-0.5) |
0.9 0.002 |
Plotting of reference peaks | |
| Warping | Lowess* Linear Quadratic Cubic |
Gel view of spectra from dataset | ||||
| Peak binning | Strict* Relaxed |
Tolerance (0.0001-0.5) | 0.002 | Peak counting Plotting of aligned spectra |
||
| Peak filtering | Frequency | min Frequency (0.1-1) | 0.2 | Plotting of filtered spectra | ||
| Clustering | Hierarchical clustering Creation of matrix |
Plot a clustred heatmap | ||||
| Spectra annotation | Loading template for annotation table | Table in .csv format | ||||
| Upload annotation table | Table in .csv format | |||||
| Output | Reporting | Pdf file listing the successive methods, parameters, outputs and results of spectra treatment applied | ||||
| Parameters | Json file Registration of methods and parameters selected during spectra analysis |
|||||
| Intensity matrix | Excel file Matrix table inventorying peak list and respective intensities |
|||||
| Figures | Svg files A zip file contain all the graphs during the process |
|||||
| HDF5 | HDF5 File(b) Registration of imported raw spectra, averaged spectra, annotated table and parameters |
|||||
| All files | Zipped file Contain all the previous outputs |
| Family | Species | Origin (country) | Developmental stage | Body part$ | Number of specimens* | Sample preparation | Rearing conditions |
|---|---|---|---|---|---|---|---|
| Culicidae | An. coluzzii | Dakar (Senegal) | Adult | Legs | 4 | (27862981) | |
| Thorax | 4 | (30390691) | (35773735) | ||||
| Larvae | Whole | 4 | (25442218) | ||||
| Ae. aegypti (Bora strain) | French Polynesia (France) | Adult | Legs | 4 | (27862981) | ||
| Thorax | 4 | (30390691) | (35773735) | ||||
| Larvae | Whole | 4 | (25442218) | ||||
| Ae. albopictus | Marseille (France) | Adult | Legs | 4 | (27862981) | ||
| Thorax | 4 | (30390691) | (35773735) | ||||
| Larvae | Whole | 4 | (25442218) | ||||
| Ixodidae | Rh. sanguineus | Southern France (France) |
Adult | Legs | 4 | (31622384) | (23040662) |
| Am. variegatum | (Senegal) | Adult | Legs | 4 | (31622384) | (26051210) | |
| Siphonaptera (Pulicidae) | Ct. felis | Bristol (UK) | Adult | Cephalothorax | 4 | (31622384) | (29451890) |
| Total# | 48 |
| Genus | Subgenera | Species | Number of specimens$ | Number of specimens included in the reference MS DB per body part (Thoraxes/Legs)§ |
|---|---|---|---|---|
| Culex (Cx.) | Culex (Cux.) | Culex declarator | 7 | 2 / 1 |
| Culex nigripalpus | 12 | 3 / 2 | ||
| Culex quinquefasciatus | 34 | 4 / 4 | ||
| Culex usquatus | 22 | 4 / 4 | ||
| Melanoconion (Mel). | Culex adamesi | 1 | 1 / 1 | |
| Culex dunni | 30 | 4 / 3 | ||
| Culex eastor | 3 | 1 / 1 | ||
| Culex idottus | 2 | 1 / 0 | ||
| Culex pedroi | 15 | 4 / 2 | ||
| Culex portesi | 28 | 4 / 1 | ||
| Culex rabanicolus | 5 | 2 / 2 | ||
| Culex spissipes | 9 | 3 / 2 | ||
| Culex. phlogistus | 1 | 1 / 1 | ||
| Total | 169# | 34/24 |
Disclaimer/Publisher’s Note: The statements, opinions and data contained in all publications are solely those of the individual author(s) and contributor(s) and not of MDPI and/or the editor(s). MDPI and/or the editor(s) disclaim responsibility for any injury to people or property resulting from any ideas, methods, instructions or products referred to in the content. |
© 2024 by the authors. Licensee MDPI, Basel, Switzerland. This article is an open access article distributed under the terms and conditions of the Creative Commons Attribution (CC BY) license (http://creativecommons.org/licenses/by/4.0/).


