Preprint
Article

Nanostructured PR-Rich CexPr1-xO2-δ Mixed Oxides for Diesel Soot Combustion. Importance of Oxygen Lability.

Altmetrics

Downloads

94

Views

38

Comments

0

A peer-reviewed article of this preprint also exists.

Submitted:

15 February 2024

Posted:

15 February 2024

You are already at the latest version

Alerts
Abstract
Soot combustion experiments with 5%O2/He were conducted using model soot, and four distinct compositions of CexPr1-xO2-δ oxides were prepared, varying nominal cerium com-positions (x=0, 0.2, 0.3, and 1). The catalyst samples were comprehensively characterized using techniques such as XRD, Raman spectroscopy, HR-TEM, N2 adsorption at −196 °C, XPS, O2-TPD, H2-TPR, and work function measurements. The Pr-rich compositions, rang-ing from Ce0.3Pr0.7O2-δ to PrO2-δ, resulted in a significant increase in the total evolved O2 amounts and enhanced catalyst reducibility. However, a decrease in textural properties of the catalysts was noted, being particularly important for the pure praseodymia under the synthesis route conducted. The catalytic activity was investigated under two contact modes of mixing between soot and catalyst: loose and tight. The results revealed that the catalytic performance is associated with the surface contact in tight contact mode and with the combination of surface/subsurface/bulk oxygen mobility and the BET surface ar-ea in loose contact mode. Notably, the T10 and T50 parameters were achieved at much lower temperatures than the uncatalyzed soot combustion, even under loose contact conditions. Specifically, the 50% conversion was achieved at 511℃ and 538℃ for Ce0.3Pr0.7O2 and Ce0.2Pr0.8O2, respectively. While no direct correlation between catalytic activity and work function was observed a significant relationship emerges between work function values and the formation of oxy-gen vacancies, whatever the conditions used for these measurements. On the other hand, the ability to generate a high population of oxygen vacancies at low temperatures, rather than the direct activation of gas-phase O2, influences the catalytic performance of Pr-doped ceria catalysts, highlighting the importance of surface/subsurface oxygen vacancy generation, which was the parameter which showed better correlation with the catalytic activity, whatever the soot conversion value or the mode of contact considered.
Keywords: 
Subject: Chemistry and Materials Science  -   Materials Science and Technology

1. Introduction

In the Heavy-Duty Vehicles and Non-Road Mobile Machinery industry, diesel engines are expected to maintain a significant presence alongside alternative powertrain solutions, especially in regions outside the EU. This is driven by the implementation of stringent emission requirements and CO2 legislations in Europe beyond 2025, mandating diesel vehicles to achieve optimal fuel economy while emitting zero-impact emissions [1]. The potential Euro 7 emission limit proposed by the Consortium for Ultra-Low Vehicle Emission (CLOVE) aims to develop scenarios for a substantial reduction in real-world emissions while remaining achievable based on the concept of "best-performing vehicles" [2]. Diesel engines are a significant source of particulate matter (PM), which is primarily composed of soluble organic fraction (SOF) and soot. The majority of PM particles are very small, with approximately 90% being less than 1 micrometer and 70% less than 0.3 micrometers [3]. These emissions have adverse environmental and health effects, including the potential to cause cancer [4]. In response to these concerns, many countries have implemented stricter emission regulations. The proposed particulate number (PN) limit by the European Commission (EC) in the latest information on Euro 7 regulation in November 2022 [5] is more stringent than that of Euro VI Step E (9.78·1011 /kWh for PEMS measurement) and is particularly challenging for diesel vehicles. The advancements in the latest generation of diesel particulate filter (DPF) materials have been significant. However, the implementation of stricter particulate regulations necessitates further enhancements in DPF technology. In particular, the proposed PN emission limits for Euro7, covering a broad range of operating conditions and targeting particulate matter as small as 10 nm, as outlined in the CLOVE proposal, underscores the need for continued improvements in particulate number (PN) filtration performance [6]
Wall flow diesel particulate filters (DPF) with a 90% capture efficiency are commonly used to address PM emissions in diesel vehicles [7]. However, the accumulation of soot inside the DPF can lead to performance deterioration, necessitating regular regeneration to burn out the accumulated soot and reduce back pressure. This is crucial as excessive back-pressure can negatively impact CO2 emissions [7], which is a key performance criterion. It is important to note that the self-ignition temperature of soot is higher than the typical exhaust temperature of diesel engines, posing a challenge for effective regeneration. Therefore, the catalyzed Diesel Particulate Filter (cDPF) aids regeneration by reducing the activation energy for soot oxidation. This involves applying an oxidation catalyst to the filter, thus lowering the temperature needed for the combustion of soot. Ceria-based catalysts have been extensively studied as a cost-effective alternative to PGM-based catalysts in this context [3].
The process of catalytic soot combustion involves a unique gas-solid-solid heterogeneous reaction. Consequently, the effectiveness of the catalyst is primarily determined by both its inherent activity and the degree of contact between the catalyst and the soot particles [8]. In this line, Sarli et al [9] indicated that only low soot loading can make a good contact state with the corresponding catalyst. However, as more soot is loaded into the filter, the contact between the catalyst and the soot weakens [10]. The extent of contact between the two solids is determinant to define the soot combustion activities. Based on this context, recently, a notable number of researchers have dedicated their tasks to improve this degree of contact in the designed catalysts for this commented application. One of the most studied strategies has been the design of effective and ordered macroporous catalytic structures. It is important to keep in mind that the real soot diameter can be around 25 nm, therefore constructing ordered macroporous tunnels can be an effective way to enhance the catalyst-soot contact [8], thus further optimizing the catalytic response. Notably, three-dimensional ordered microporous (3DOM) catalysts have been extensively studied for their ability to significantly reduce the transfer resistance of soot particles within their pores. This reduction is attributed to the periodic and orderly arrangement of macroporous structure in 3DOM catalysts, leading to an overall improvement in catalytic activity. However, the lifetime during working conditions and the coating of these structures onto the real DPF remains an unclear issue[8].
Another feasible and interesting route to overcome these difficulties is the design of nano-catalysts with an outstanding oxygen delivery capacity, which could alleviate, partially, the drawbacks of poor contact in a real cDPF. In this sense, ceria has been revealed as a very interesting solid due to its redox behavior, which could be amplified by the insertion of several dopants, among which praseodymium is revealed as one of the most interesting [11]. Praseodymium oxide has an equal structure to that of ceria, with similar crystal parameters. The fact that Pr can easily move among Pr4+ and Pr3+ oxidation states, promotes an excellent mobility of oxygen in the bulk and yields excellent soot combustion catalysts as previously published [11,12,13]. Nevertheless, the impact of the Pr-content onto the ceria lattice has not been analyzed in detail at very high Pr contents, where the impact can be much more remarkable. As an example, Andana et al. analyzed nanostructured ceria-praseodymia catalysts until a maximum Ce/Pr composition of 50/50 [11].
The need for catalysts with outstanding oxygen delivery capacity and maximum abilities to incorporate oxygen vacancies onto their structure is of paramount importance since the diesel soot oxidation with oxygen should be promoted mainly by oxygen in present and future diesel vehicles. This is motivated by the last Euro 6/7 standards, which have lowered substantially the allowed NOx emission. As a consequence, and due to the intrinsic features of the whole post-treatment catalytic architecture, it is more efficient to locate the de-NOx system upstream of the cDPF, meaning that, practically, only oxygen remains as a suitable oxidant for the soot combustion process [7].
This study investigates the impact of high oxygen emissions from rich ceria-praseodymia oxides on soot combustion, considering the oxygen delivery capacities and BET surface areas aiming to unravel the intricate dynamics of how the oxygen released at different temperatures, affects soot combustion and how the BET surface area and degree of contact influence the soot combustion process. For this purpose, a detailed study of the physico-chemical properties of the solids, such as the possibility of the creation of defective ordered structures for the solids synthesized is explored. Additionally, the work function was employed as a complementary parameter to gain insights into the unique properties of these solids, and the correlation between the work function and the catalytic responses of the catalysts was explored. To facilitate a comparative evaluation of the prepared catalysts their catalytic activity was benchmarked against a well-established model catalyst, the reference pure ceria.

2. Materials and Methods

2.1. Catalyst Preparation

Four compositions of CexPr1-xO2-δ mixed oxides have been prepared with different nominal compositions in cerium and/or praseodymium (x=0, 0.2, 0.3, and 1; being x referred to as cerium content), including pure praseodymia and ceria, respectively. The solids were prepared by an intimate mixture of Ce(NO3)3·6H2O (supplied by Aldrich, 99%) and/or Pr(NO3)3·6H2O (supplied by Sigma Aldrich, 99.9%) as precursors, by taking the required amounts and mixing in a mortar for 10 min. Subsequently, a calcination step at 500 °C, for 1 h, in static air was carried out [14].

2.2. Catalysts Characterization

BET surface areas were measured by multi-point N2 adsorption at -196°C using an automatic Autosorb-6B (Quantachrome equipment). The samples were previously degassed for 4 h at 250°C under vacuum.
X-ray diffractograms of the samples were recorded in a Bruker D8 advanced diffractometer, using CuKα radiation with a wavelength of 0.15406 nm. Spectra were registered between 10° and 80° (2h) with a step of 0.1° and a time per step of 3 s. Indexation of the patterns was accomplished using dedicated software (EVA), and the average crystal sizes were calculated using Scherrer’s equation.
The Raman spectra were obtained using a LabRam Jobin Ivon Horiba Raman Spectrometer equipped with a confocal microscope and a variable power He-Ne laser source emitting light at 633 nm with a laser power of 1mW. Each spectrum was acquired by performing 2 scans, each lasting 200 seconds.
XPS, a K-Alpha spectrophotometer (Thermo-Scientific), with a high-resolution monochromator spectrometer, was employed, with an Al anode (1253.6 eV) radiation source. The binding and kinetic energy scales were adjusted by considering the C transition signal at 284.6 eV. The surface composition of the catalysts was analyzed using the Ce-3d and Pr-3d regions, along with the C-1s and O-1s regions. To determine the proportion of Ce3+ cations compared to the total cerium present on the surface, the calculation method outlined by Laachir et al. [15] was employed. Similarly, the relative percentage of Pr3+ cations to the total praseodymium was estimated following the approach suggested by Borchet et al. [16].
The sample morphology was analyzed at a microscopic level using transmission electron microscopy methods. The equipment used was the FEI Tecnai Osiris, equipped with an X-FEG Schottky field emitter (200 kV) and a high-angle annular dark-field (HAADF) detector. Elemental mapping was conducted using Energy Dispersive X-ray (EDX) spectroscopy, employing a Super-X EDX windowless system with a 4-sector silicon drift detector (SDD). The distribution of the elements in the catalysts under investigation was obtained using the Bruker Esprit software.
O2-Temperature-programmed desorption under He (O2-TPD) was performed with a simultaneous TG-DTA coupled to a mass spectrometer (TG-DTA-MS). A 20 mg sample of the catalyst was pretreated under helium flow 100 ml/min at 150℃ for 1 h, then heating under programmed temperature from 150 °C to 950 °C, at 10 °C/min, was conducted.
Temperature-programmed reduction with H2 (H2-TPR) was performed using a Micromeritics Auto Chem II 2920 apparatus. In each trial, 20 mg of catalyst was placed in a U-shaped quartz tube and pretreated with a flow of 5 % O2/He, and the samples were heated up to 500 °C (10 °C/min) for 1h. After cooling down the samples, the gas was changed to a 10% H2/He flow (40 mL/min). The signal from a thermal conductivity detector was recorded from 30 to 950 °C at a linear heating rate of 10 °C/min.
The work function of the samples was determined based on the contact potential difference (VCPD) measurements carried out by the dynamic condenser method of Kelvin with a KP6500 probe (McAllister Technical Services). The reference electrode was a standard stainless-steel plate with a diameter of 3 mm (Φref = 4.3 eV). During the measurements, the vibration frequency and amplitude were set to 120 Hz and 40 arb. uni. The work function of the samples was calculated using a simple relation eVCPD = Φref - Φsample.

2.3. Catalytic soot combustion tests

The soot combustion reaction was evaluated by using a Thermogravimetric analyzer (Mettler Toledo TGA/DSC) with an Al2O3 crucible. Non-isothermal TG tests were carried out by using a heating ramp of 10℃/min up to 900℃ under 5% O2/He. The catalyst/soot ratio employed was 20/1 under different contact modes, the so-called tight contact (TC) conditions were obtained by mixing well the powders in a mortar for 10 minutes. The reasons for this choice were: a higher level of reproducibility and more meaningful catalytic activity data obtained [17]. On the other hand, the second procedure consists of mixing the components with a spatula (in a very gentle way for 4 min) to afford the loose contact mode, which is the most realistic one [4,5].

3. Results and discussion

3.1. Catalysts characterization

3.1.1. Structural and textural parameters.

Figure 1 shows the X-ray diffractograms of the four catalysts prepared. The three Pr-based formulations chosen (based on previous results) for praseodymium-based catalysts exhibit a single cubic fluorite structure [14]. The four typical reflections corresponding to the (111), (200), (220), and (311) planes are observed at 28.55, 33.05, 47.50, and 56.40° of 2θ values, respectively. On the other hand, pure ceria exhibits the expected pattern as well.
Additionally, the lattice parameter (a) can be obtained for each catalyst by using Bragg’s law (and determining the d parameter), while Scherrer’s equation is employed for the average crystal size estimation. All these results are summarized in Table 1. The values slightly increase by considering a progressive substitution of cerium by praseodymium into the cationic sublattice providing evidence of a higher presence of the Pr3+ cation reaching the pure praseodymium oxide formulation limit [7]. On the other hand, quite similar average crystal sizes can be observed for the four formulations. Conversely, a lowering in the BET surface area is seen inside the series and is quite noticeable for pure praseodymia (6 m2/g). A previous work [14] reported a negative effect of very high Pr loadings onto ceria (concerning BET surface area and pore development) when the Direct Calcination method was employed. In fact, recent works by Frizon et al [20] and Fahed et al [21] reported that the insertion of high Pr loadings in mixed oxides (specifically CZ mixed oxides) significantly decreased the specific surface area. The observation of the non-correlation between SBET and average crystal size (in spherical approximation; r(nm) = 3/(ρ · SBET)), where ρ is the compound density) was attributed to the fact that the particles were not spherical and the aggregation phenomena occurred limiting the pore size (see Table 1). High Pr loading can decrease the inter-granular porosity in line with the drop of the porous volume observed from the data in Table 1.
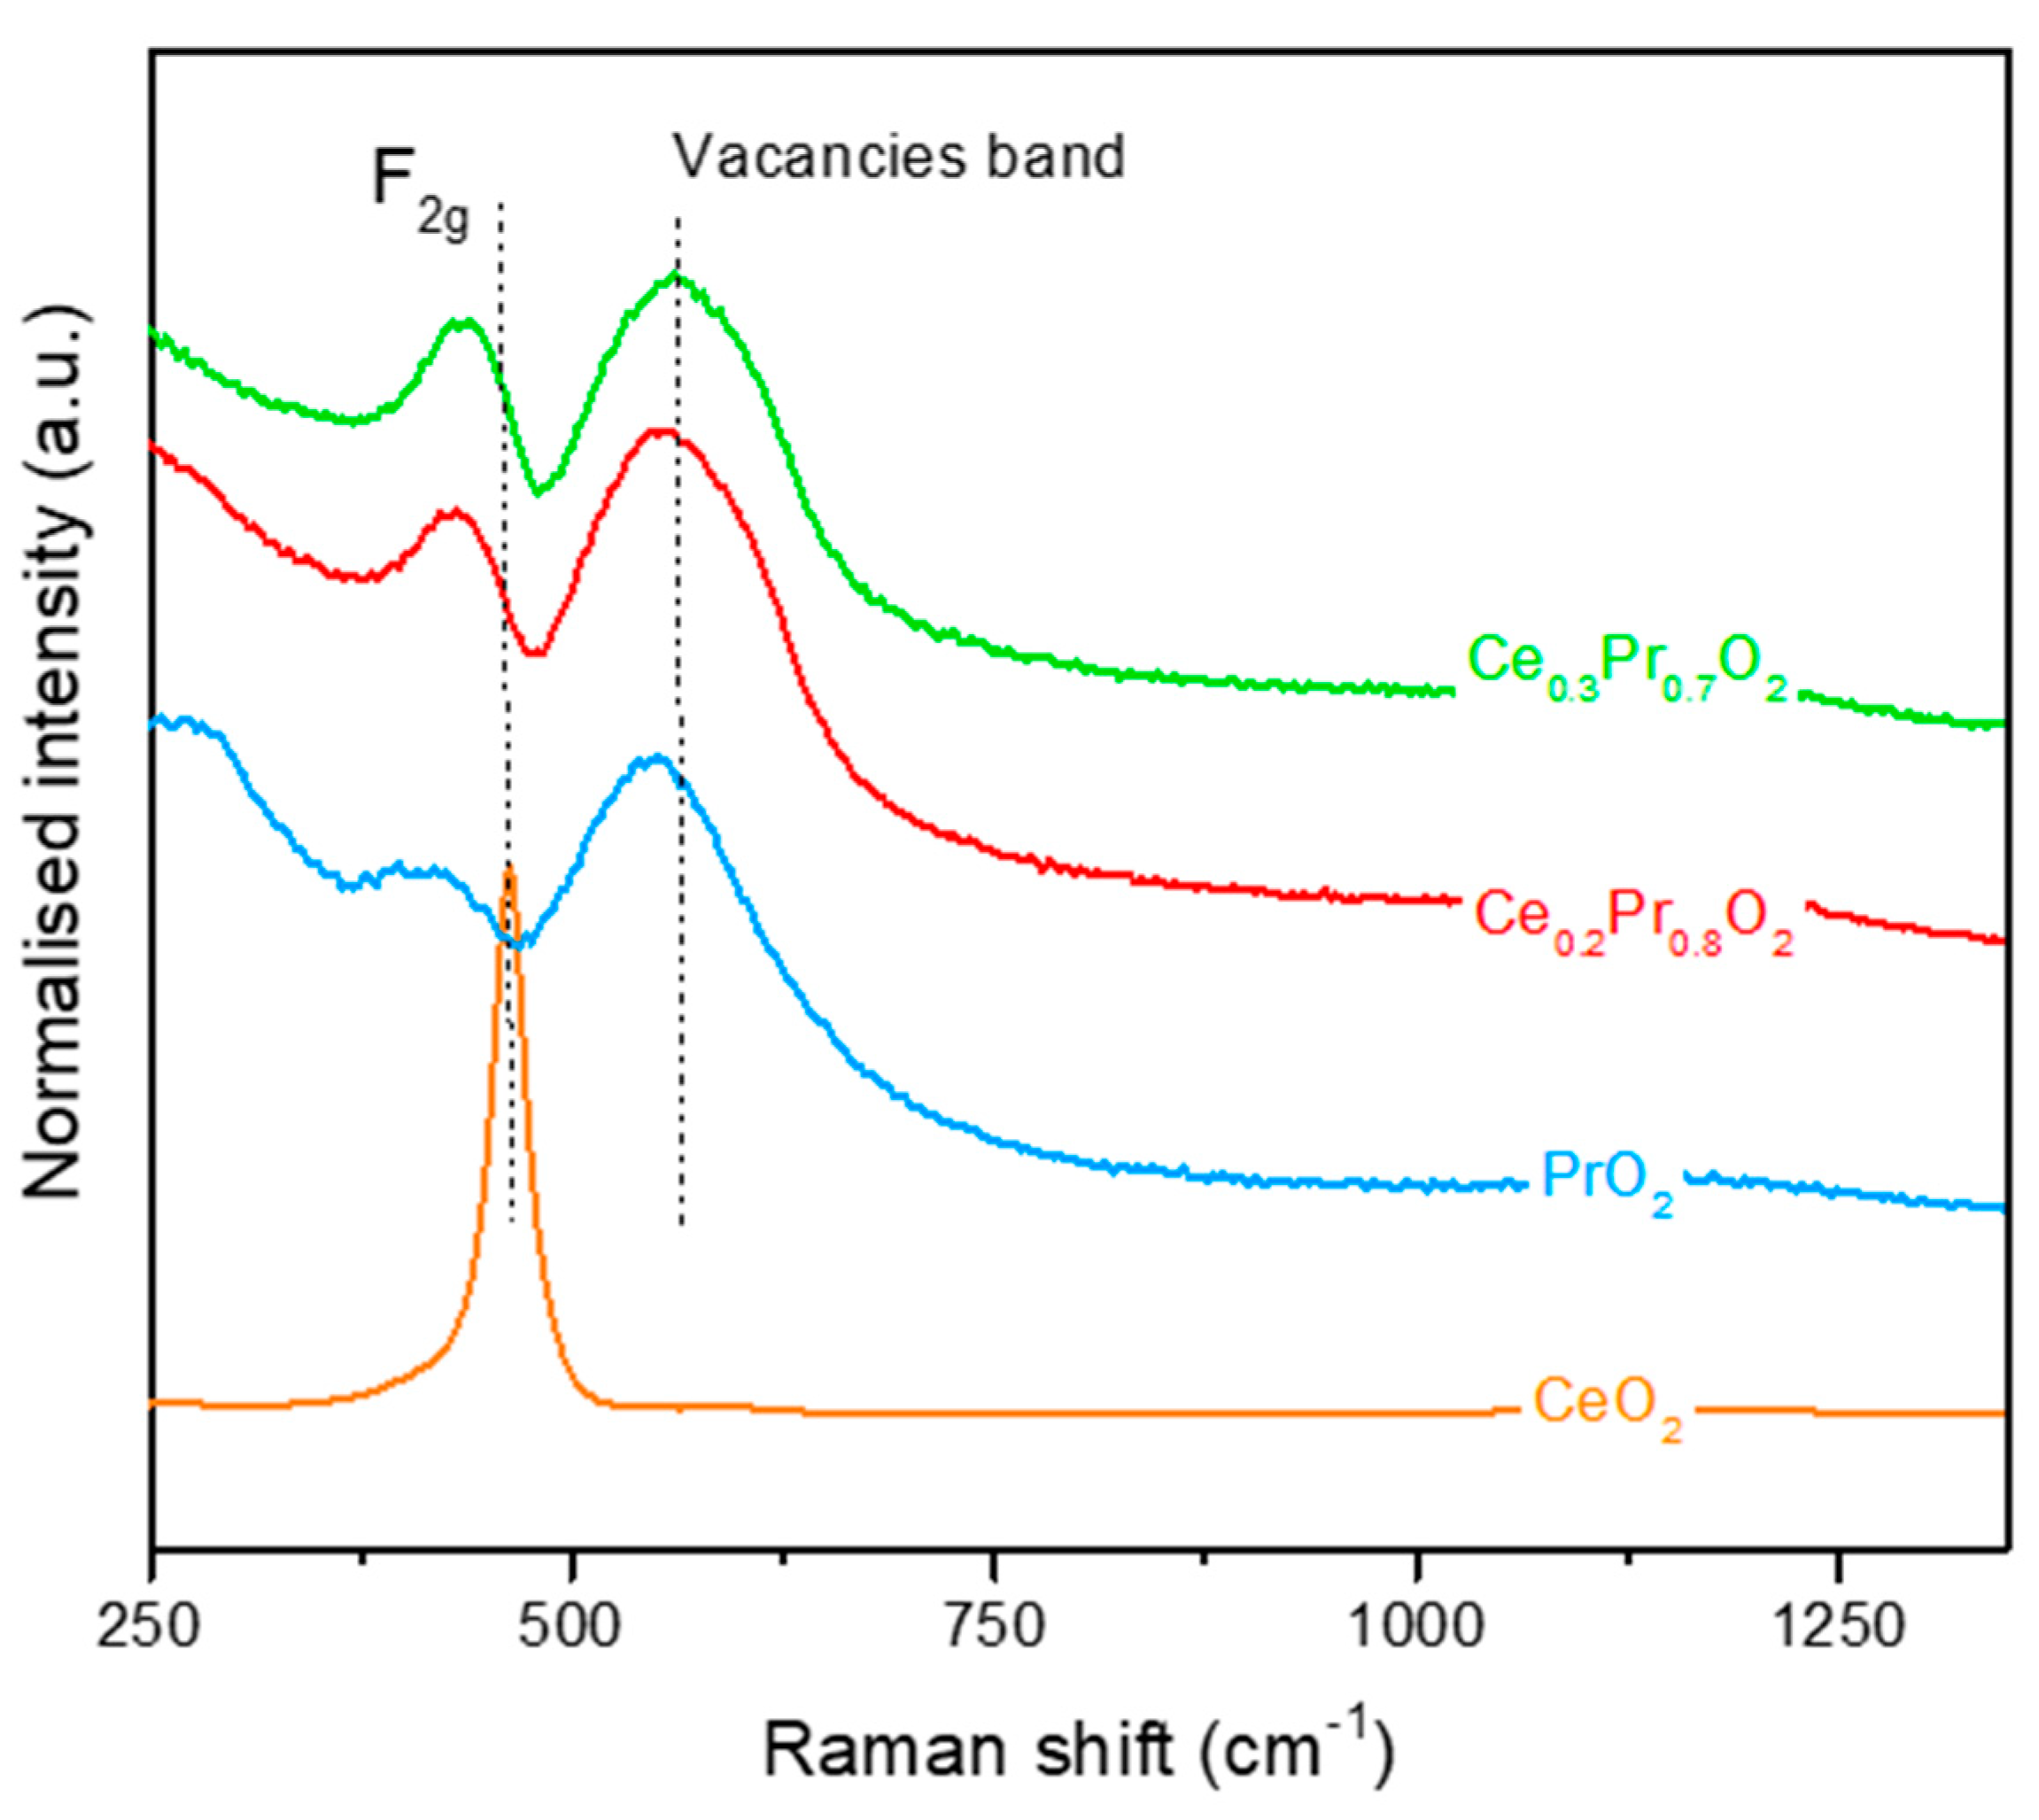
Raman spectroscopy is a highly suitable technique for the structural characterization of cerium-based oxides, providing additional structural information beyond that offered by the XRD technique. The XRD patterns provide information mostly about the positions of large cations in the crystal lattice (such as cerium). Still, this technique offers very low sensitivity to light elements (such as oxygen) [12]. Raman spectra of ceria revealed the F2g band at 464 cm-1, which might be attributed to a symmetrical breathing mode of the oxygen ions combined with the tetravalent cations [8,9]. The three Pr-containing catalysts show the F2g vibration mode of the fluorite structure (see Figure 2), where the band position is moved to lower wavenumber values by the addition of Pr content onto ceria, as listed in Table 1, where this decrease can be due to the existence of the trivalent cation (rather Pr3+ than Ce3+), i.e., a weaker force constant of the corresponding cation-anion bonds. This interpretation is also supported by the observed mode at a wavenumber of about 570 cm-1, which is attributed to a defect mode caused by oxygen vacancies as mentioned in a previous publication [24]. The relatively high intensity of this mode under atmospheric conditions indicates the presence of the reduced cations (rather being Pr3+ than Ce3+). An additional mode around 195 cm-1, whose evolution can be correlated with that of the band at 570 cm-1, can be attributed to the other asymmetric vibration caused by the formation of oxygen vacancies [25]. The I560/IF2g ratio obtained from the normalized spectra correlates with the Pr content, as can be seen in Table 1. This ratio can be considered as an indicator (or descriptor) of the abundance of oxygen vacancies caused by the substitution of Ce atoms by Pr atoms in the mixed oxides until achieving pure praseodymium oxide [25].
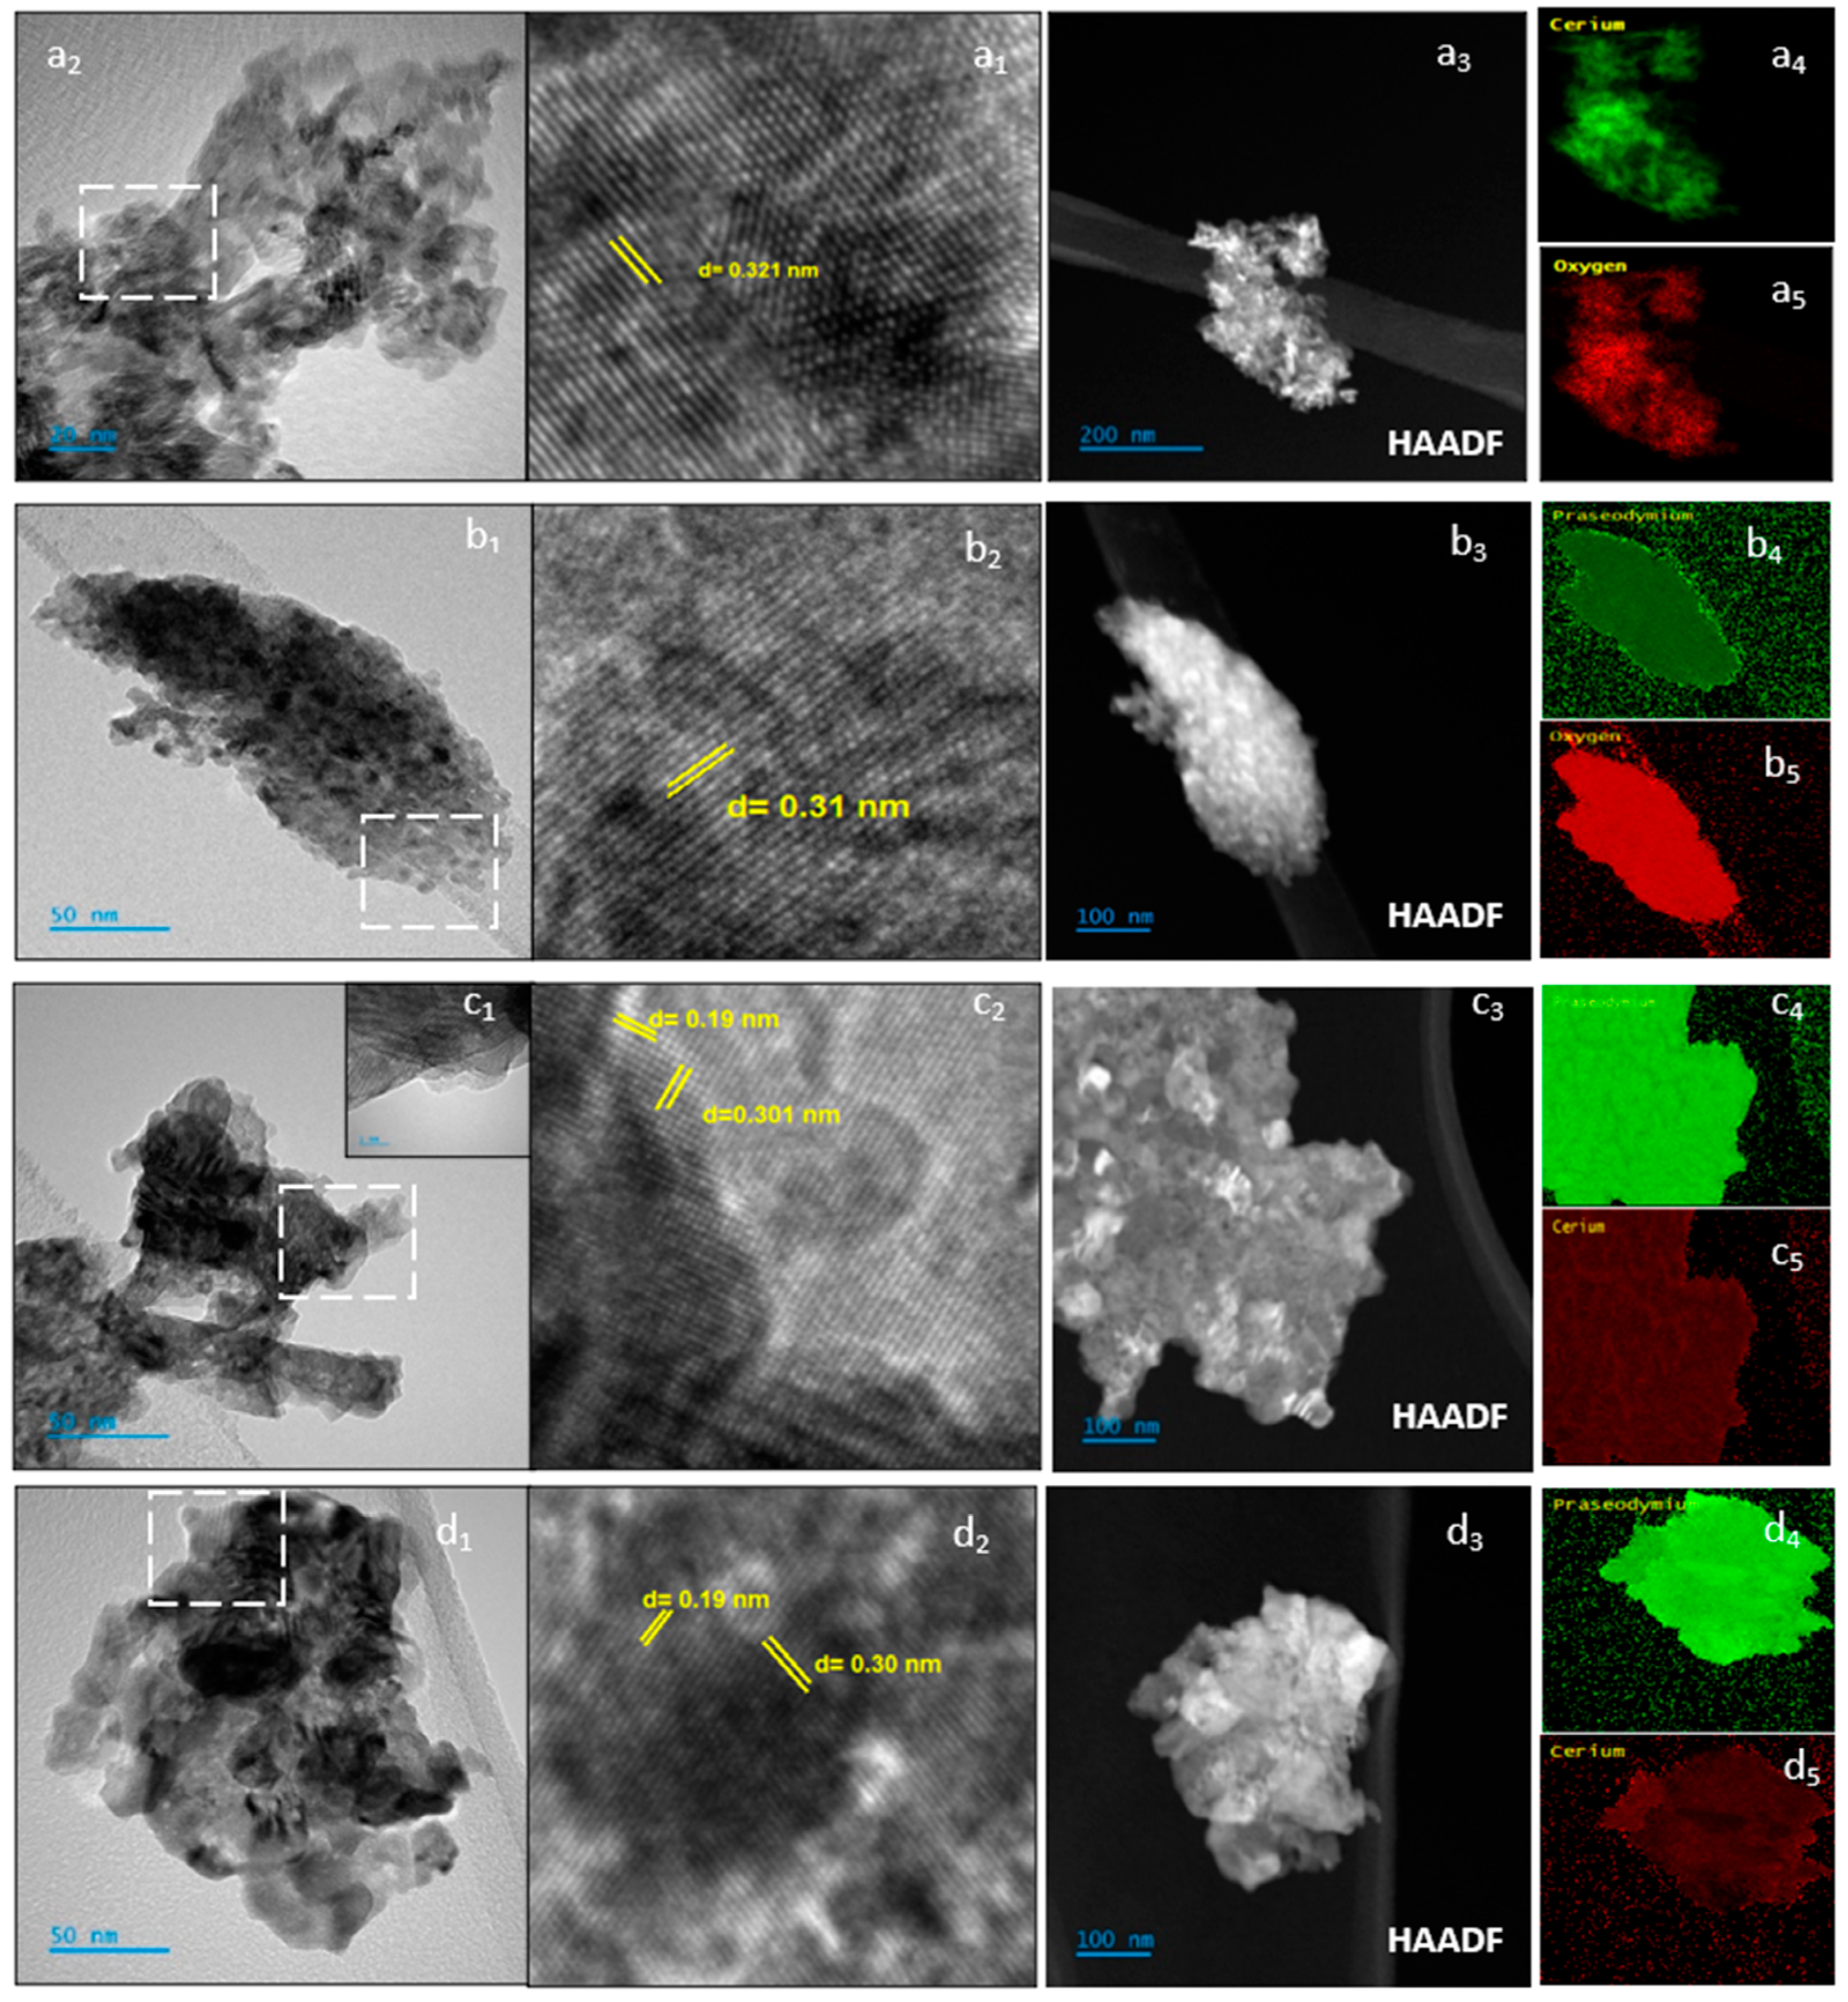
In order to explore if the catalysts present varied morphologies dependent on the molar composition of cerium and praseodymium, the high-resolution TEM images of the catalysts investigated are illustrated in Figure 3. The presence of aggregates of multiple nanoparticles can be generally observed: a dense substance made of nanocrystalline domains that have been sintered exhibits a significant number of likely disordered grain boundaries. Although the individual particles are not visible in Figure 3(a1-d1), (this might be due to the route of synthesis used, as reported in a previous study [26]), there is strong evidence of crystallinity within the domains, as seen by the visible lattice fringes (Figure 3 b2-d2) and even clearer in Figure 3(a1-a4), corresponding to the pure ceria catalyst (analyzed for comparison purposes). The interplanar distances of the lattice fringes observed are compatible with the fluorite structure of the catalysts, showing (111) fringes (close to 0.31 nm) [22,23] and (220) facets with an interplanar distance of 0.19 nm as shown in Figure 3b2 and c2 [29], which confirms the XRD results, where the reflections corresponding to both planes are the most intense ones detected. Actually, the d value obtained for the (111) facets, measured for the three catalysts, exhibits a slight and progressive increase in the corresponding value (0.30, 0.301, and 0.31 nm, respectively) as the Pr loading enhances from Ce0.3Pr0.7O2 to PrO2, in complete agreement with a (lattice parameter) values measured by XRD where this value is also increased. It should be noted that the crystal structure of ceria and praseodymia show large similarities [30]. Therefore, phase segregation is difficult to infer (if any), and according to these results, there is no evidence of such phenomena [16].
The representative HAADF images Figure 3 (a3-d3) of CeO2, PrO2, Ce0.2Pr0.8O2, and Ce0.3Pr0.7O2, respectively show the appearance of spherical agglomerates in the mixed oxide, these images corresponded well with the energy dispersive spectroscopy (EDS) element mapping images of Ce (a4-c5 and d5), Pr ( b4-c4 and d4) and O ( a5 -b5) showing relatively high-density distributions, where there is a homogenous distribution of cerium and praseodymium on the nanometric scale over the Ce0.2Pr0.8O2 and Ce0.3Pr0.7O2 catalysts, which is also consistent with the TEM and XRD results.
Surface-sensitive X-ray photoelectron spectroscopy (XPS) has been used to study the surface chemical state of mixed oxide particles. Table 2 shows some representative parameters obtained from the XPS spectra analysis (see Figure S1 in the Supplementary Information).
The obtained results suggest that the Ce/Pr surface atomic ratios were consistently lower than theoretical or nominal values in ceria-praseodymia samples. This indicates that there was a higher concentration of praseodymium on the particle surface (or the periphery of the particles) than that of cerium (thus exhibiting Pr surface enrichment) [12]. When conducting estimations, the Ce 3d and Pr 3d levels were utilized, both of which do not exhibit significantly different binding energies. The Ce 3d level has a binding energy of approximately 870 eV, while the Pr 3d level has a binding energy of around 970 eV. These values indicate the amount of energy required to remove an electron from the respective 3d orbitals of cerium (Ce) and praseodymium (Pr) atoms [31]. Overall, the segregation of dopant cations at the surface and domain boundaries of ceria is an important aspect to consider when studying or utilizing ceria-based materials, as it can have significant implications for their properties and performance in various applications [21,28,29].
Pr cations (Pr3+ and Pr4+) are incorporated into the cerium oxide lattice (and or partially segregated at the particle’s surface), as suggested by comparison of Ce/Pr surface values with the nominal ones. Therefore, the presence of nano-domains with different Ce/Pr compositions (indistinguishable by XRD and/or HR TEM cannot be excluded for the two mixed oxides). Corresponding estimations are compiled in Table 3.
The expected and well-described “carbonation” process that occurs on solid surfaces during calcination and storage of samples can pose challenges for the analysis and interpretation of Ce3+ and Pr3+ cations existence [14,34]. This process leads to the accumulation of carbon on the surface of these oxides, as indicated in Table 2. The presence of carbon species on the surface can make the accurate determination of the Ce3+ and Pr3+ cations, (truly involved in the creation of oxygen vacancies) quite difficult. The estimated values of Pr3+ (%) are always higher than those of Ce3+ (%), for the two mixed oxides prepared, which are the expected results since Pr is a more reducible cation (due to the higher reduction potential and more labile Pr-O bond) and is more basic, compared to Ce [1,30,31].

3.1.1. Comparison of the oxygen lability of the catalysts under different environments

The redox properties and the corresponding lability of the oxygen species in these formulations were explored by means of two procedures that can be complementary one each other: H2-TPR and O2-TPD (to measure the O2 evolved under an inert atmosphere). For more details about definitions, procedures, and estimations conducted to determine the amount of oxygen vacancies created after the two different procedures, please see the Supplementary Information.
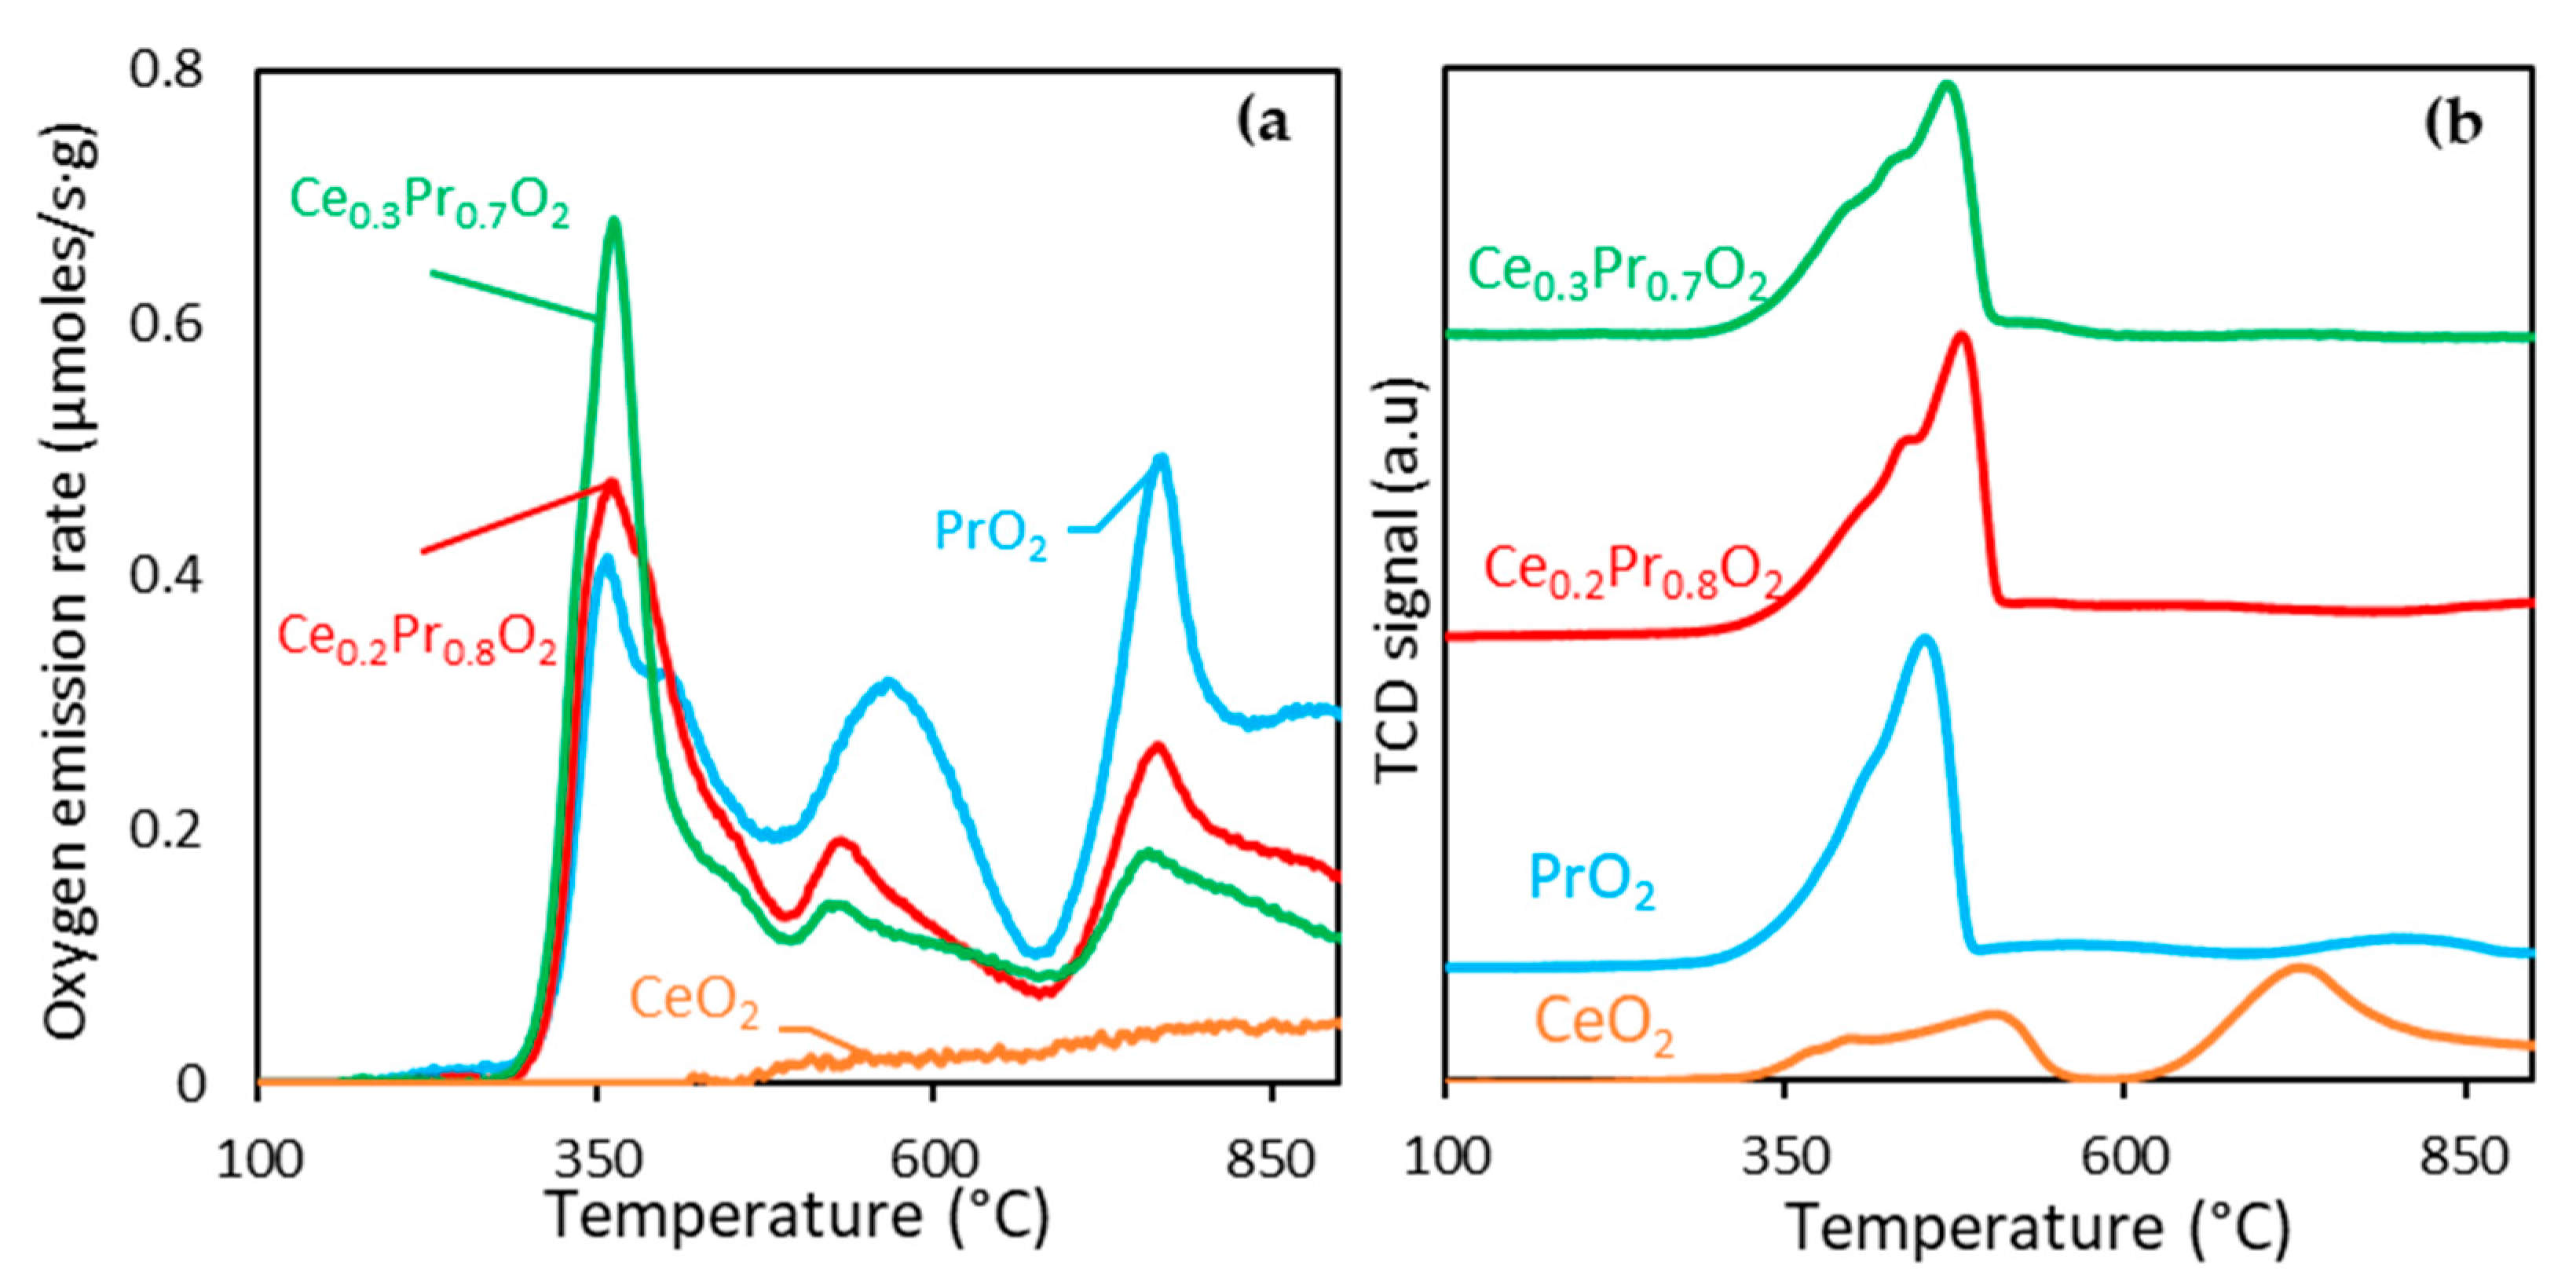
O2-TPD under an inert atmosphere (helium) was used to examine the oxygen “delivery” of the catalysts, and in turn, its lability under helium, by following the rate of oxygen desorption in terms of temperature (and its subsequent global quantification, thus obtaining the value of µmol O2 emitted/gcat). Figure 4(a) displays the O2-TPD profiles of the catalysts, expressed as this mentioned oxygen emission rate versus temperature, and Table 4 compiles the corresponding quantifications. Even though CeO2 is a well-known oxygen storage material, O2 desorption under an inert atmosphere was hardly observed in this case, in line with previous results [37], as shown in Figure 4(a). Conversely, the three other samples (the Pr-containing catalysts) yielded three main and large oxygen desorption peaks from 300℃ to 900℃, whose general pattern is very similar (differing mainly in the relative contribution of every peak), which seems to be a function of the Pr-content. Since the two mixed oxides’ general profile is very similar to that obtained for the pure oxide, the discussion about the oxygen mobility can be assessed in a more certain way due to the presumed absence of separate rich Pr and/or Ce domains in the solids, which could probably modify the oxygen emission pattern, thus making distinctions if referred to that of the pure oxide. It is generally expected that the existence of such large domains would display different oxygen labilities. This indirect evidence would be congruent with the XRD and TEM discussion, where a main crystalline phase with a gradual variation of the lattice parameter was observed when going from the Ce0.3Pr0.7O2 sample to PrO2.
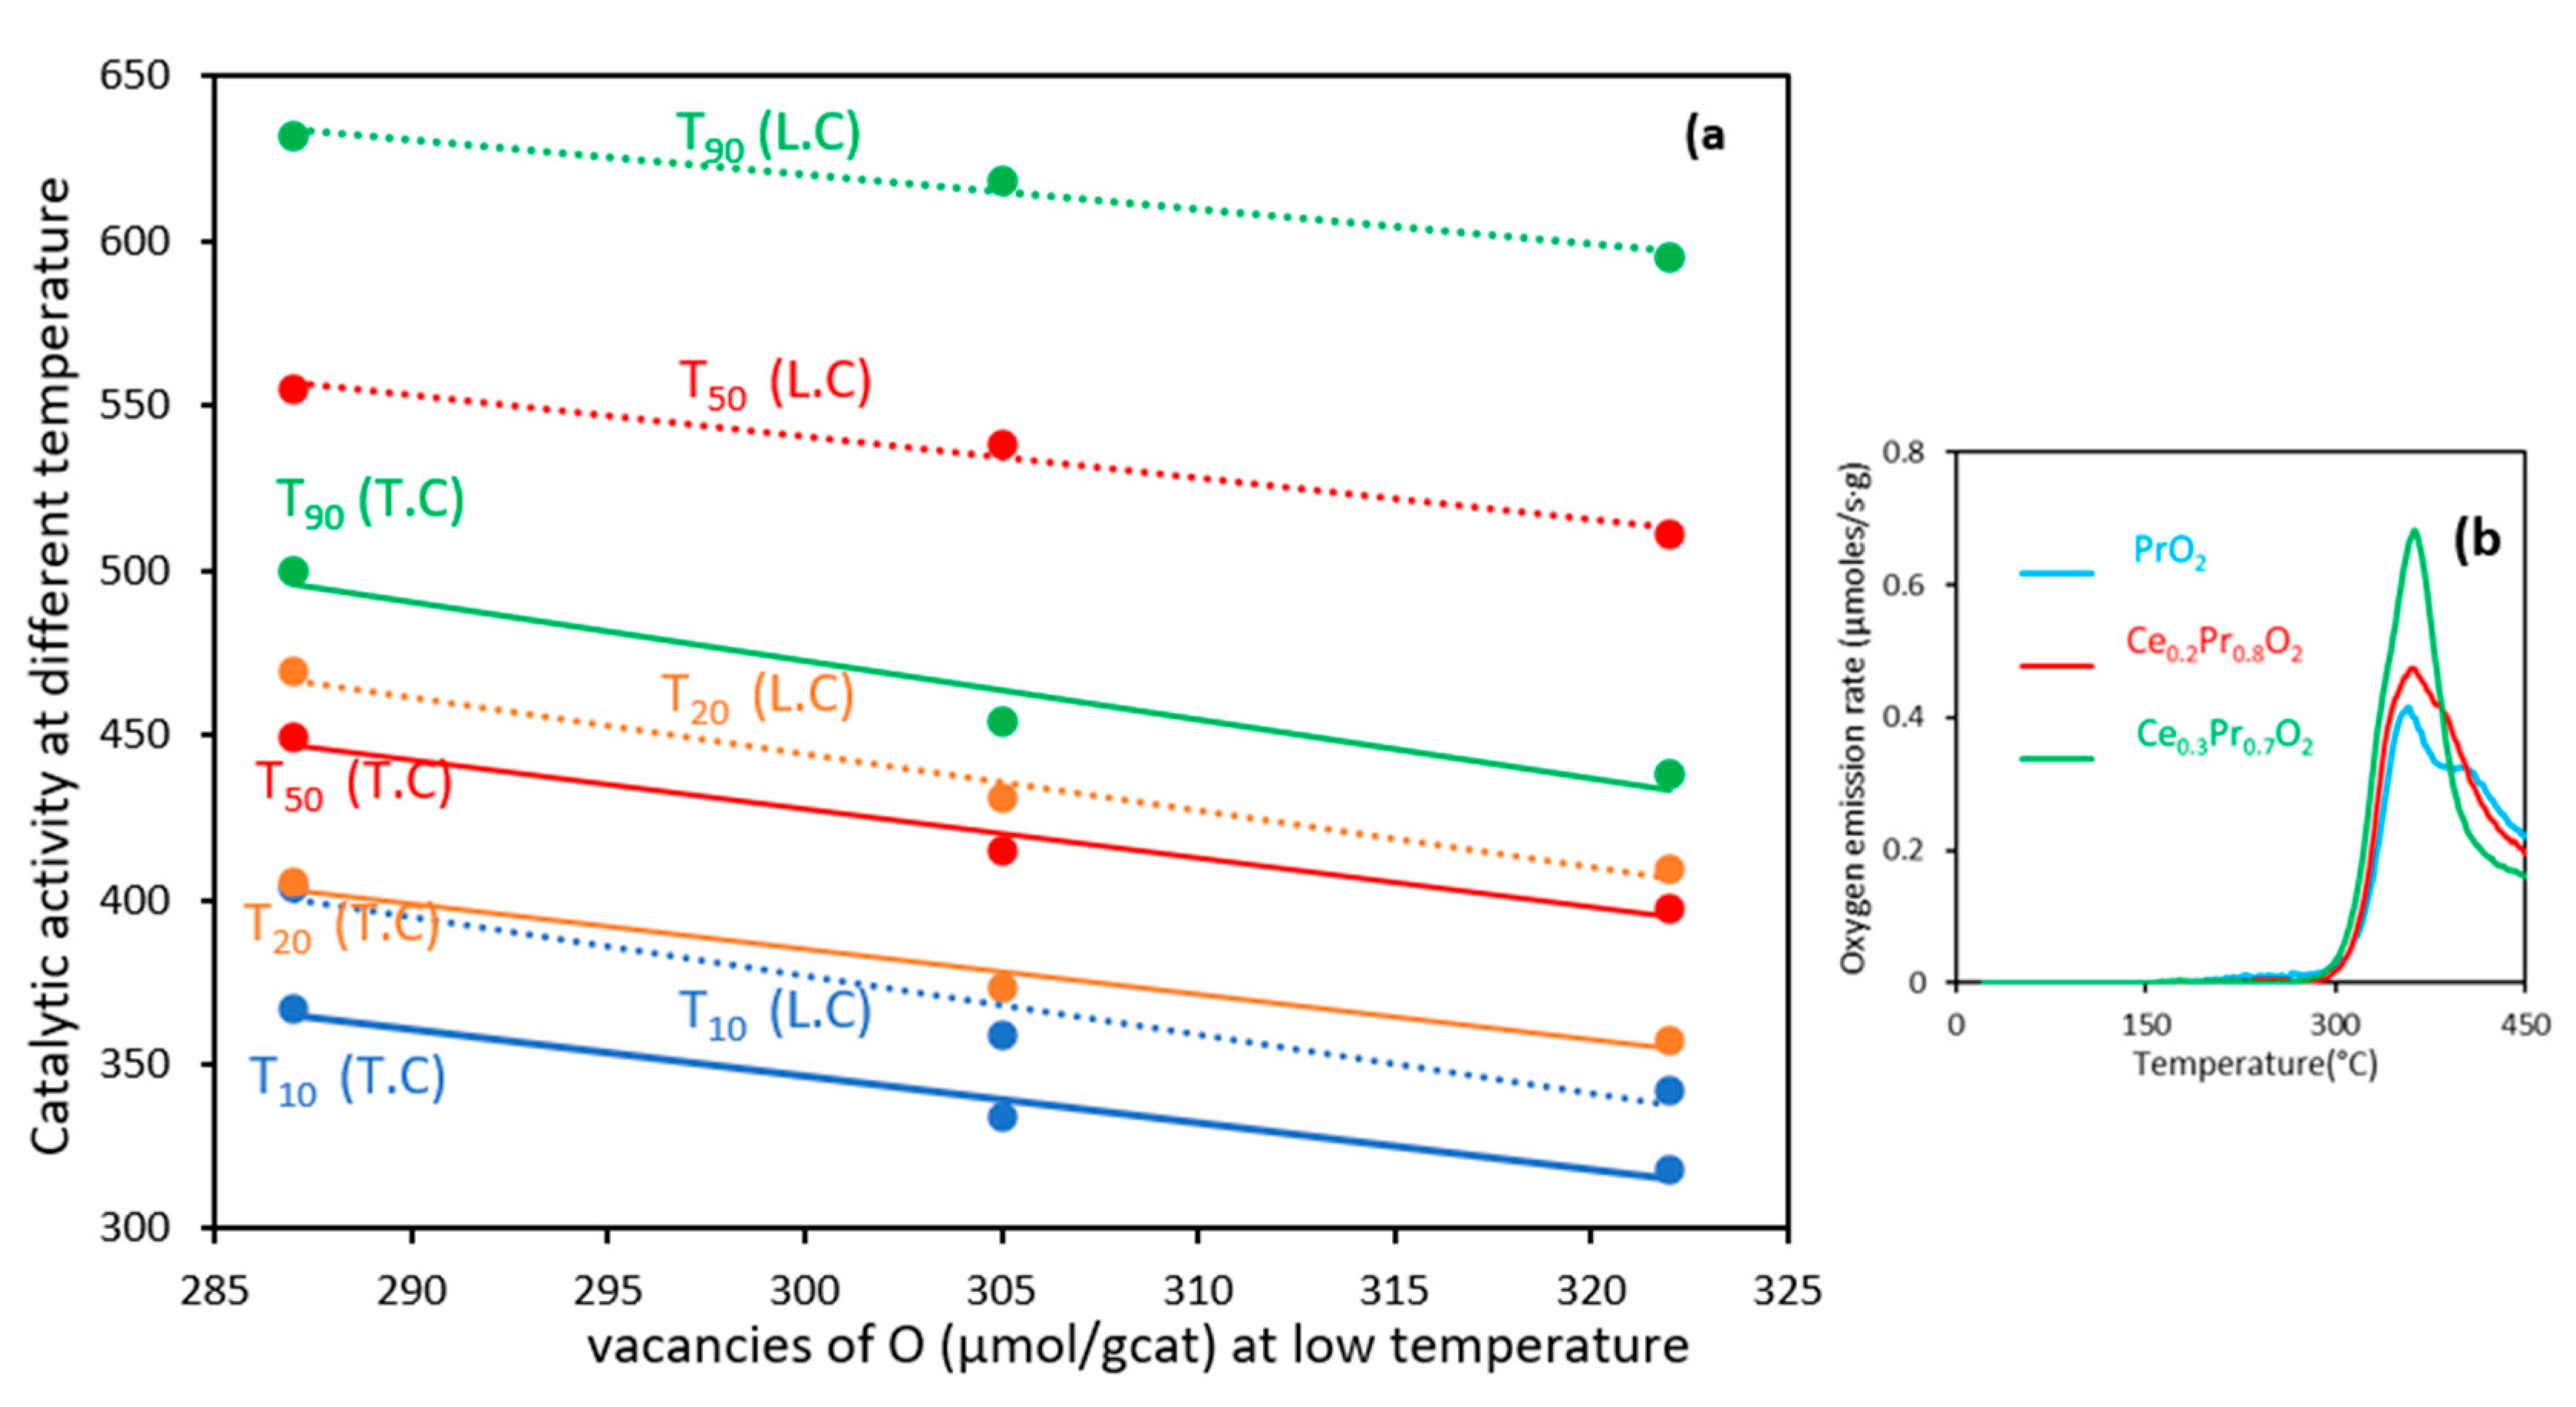
The sharpest peak and the highest values of O2 emission rates in the low-temperature range are reached by Ce0.3Pr0.7O2, at 363 °C, (this temperature maximum is very similar for the three catalysts), which can be attributed, in principle, to the most surface/reactive oxygen susceptible to being evolved. The profile and magnitude of this first peak, being the sharpest and most intense one of the whole pattern for the two mixed oxides, reveals an accentuated oxygen lability and, in turn, relevant oxygen mobility at very low temperatures, which can be assumed to be very influenced by the BET surfaces, since the magnitude and maximum oxygen emission rate at this very low temperature follows the same trend than that of the BET surface area and pore volume of the solids. Conversely, the second and third peaks are more accentuated for the pure PrO2, revealing the maximum bulk oxygen mobility and the best data of global oxygen evolved for this formulation. Therefore, the more the Pr loading, the higher the O2 evolved amounts, which is in line with the conclusions of other authors [7,11].
For the deepest insight, some quantitative considerations will be provided now. Considering a mean oxygen density of 21.7 µmol O·m-2 in ceria-based oxides, according to the assumptions taken by Fahed et al [21] based on other authors [38], the oxygen emitted relative to the first peak (see values in parentheses of Table 4) only concerns to surface oxygen species (or a fraction of them) for the two mixed oxides under study. Conversely, for the case of PrO2, more than the theoretical oxygen surface population (even though it is small due to its very low surface area) can be desorbed in this low range of temperature, proving evidence of the very high oxygen mobility at the surface/subsurface level for this catalyst.
It is interesting to approach the whole oxygen delivery capacity deduced from these experiments (O2-TPD). If it is bear in mind that the ideal reduction of PrO2 to Pr2O3 would yield a maximum amount of oxygen evolved of 1445 μmol O2/gcat (indicating the maximum oxygen released that could be reached by a bulk oxide of this starting formulation, fully oxidized) [39], the value of 1045 μmol O2/gcat for pure praseodymia (even characterized by a very low surface area) indicates very high lability of oxygen and an accentuated mobility of subsurface/bulk oxygen even under a not reducing atmosphere (He).
H2-TPR was used to assess the reducibility of the selected catalysts as well as determine the amount of oxygen vacancies susceptible to being created in a different reaction atmosphere. Figure 4(b) depicts the profiles of H2 consumption obtained by this procedure. It is interesting to compare as deeply as possible both Figure 4a and Figure 4b. Firstly, the profiles under H2 are characterized by similar patterns (in agreement with the previous discussion) and asymmetrical shapes, the higher the Pr content in the catalysts, the sharper and more intense the peak. This has a certain parallelism with the O2-TPD profiles, where the three different peaks can be interpreted as the “delivery” of more and more internal lattice oxygen, but appearing, now, as a unique peak (but with weak shoulders, under a more aggressive atmosphere, H2) [40]. From a very basic and qualitative perspective, it seems that the three previous peaks, detected under He, have been combined in a single asymmetric peak that decays at an early temperature (around 500°C). The corresponding integration of this peak (in Figure 4b) for every catalyst confirms the increasing reducibility (ability to form oxygen vacancies) as the Pr loading is progressively enhanced in the catalysts’ formulation [24].
The delta (δ) parameter has been used to indicate that a single oxygen-deficient non-stoichiometric phase is formed. In this sense, the general formula after the corresponding reduction will be written as MO2-δ or Ce1-xPrxO2-δ, to express the maximum level of non-stoichiometry that has been reached under the two different atmospheres (He or H2). For example, for PrO2, its maximum theoretical level of non-stoichiometry would be δ equal to 0.5 [39,41], which corresponds to the reduced formula of PrO2-0.5 or PrO1.5 (better written as Pr2O3 ), where the whole Pr+4 cations have been reduced to Pr+3).
The values of δ or non-stoichiometry reached, together with the final formula after the reduction of the different catalysts, under the two atmospheres, are shown in Table 4. An increasing trend of δ is observed with the increase in the content in praseodymium, reflecting the better reducibility, and in turn, improved oxygen mobility in both atmospheres, since the oxygen amount evolved is very high (and not only affecting the surface oxygen, as previously commented, and explained below in more detail). Besides, as the Pr content is increased, the capacity of oxygen delivery under the two atmospheres becomes closer and closer, thus reflecting superior oxygen lability as well, which is suggested to be of paramount importance for the soot combustion application.
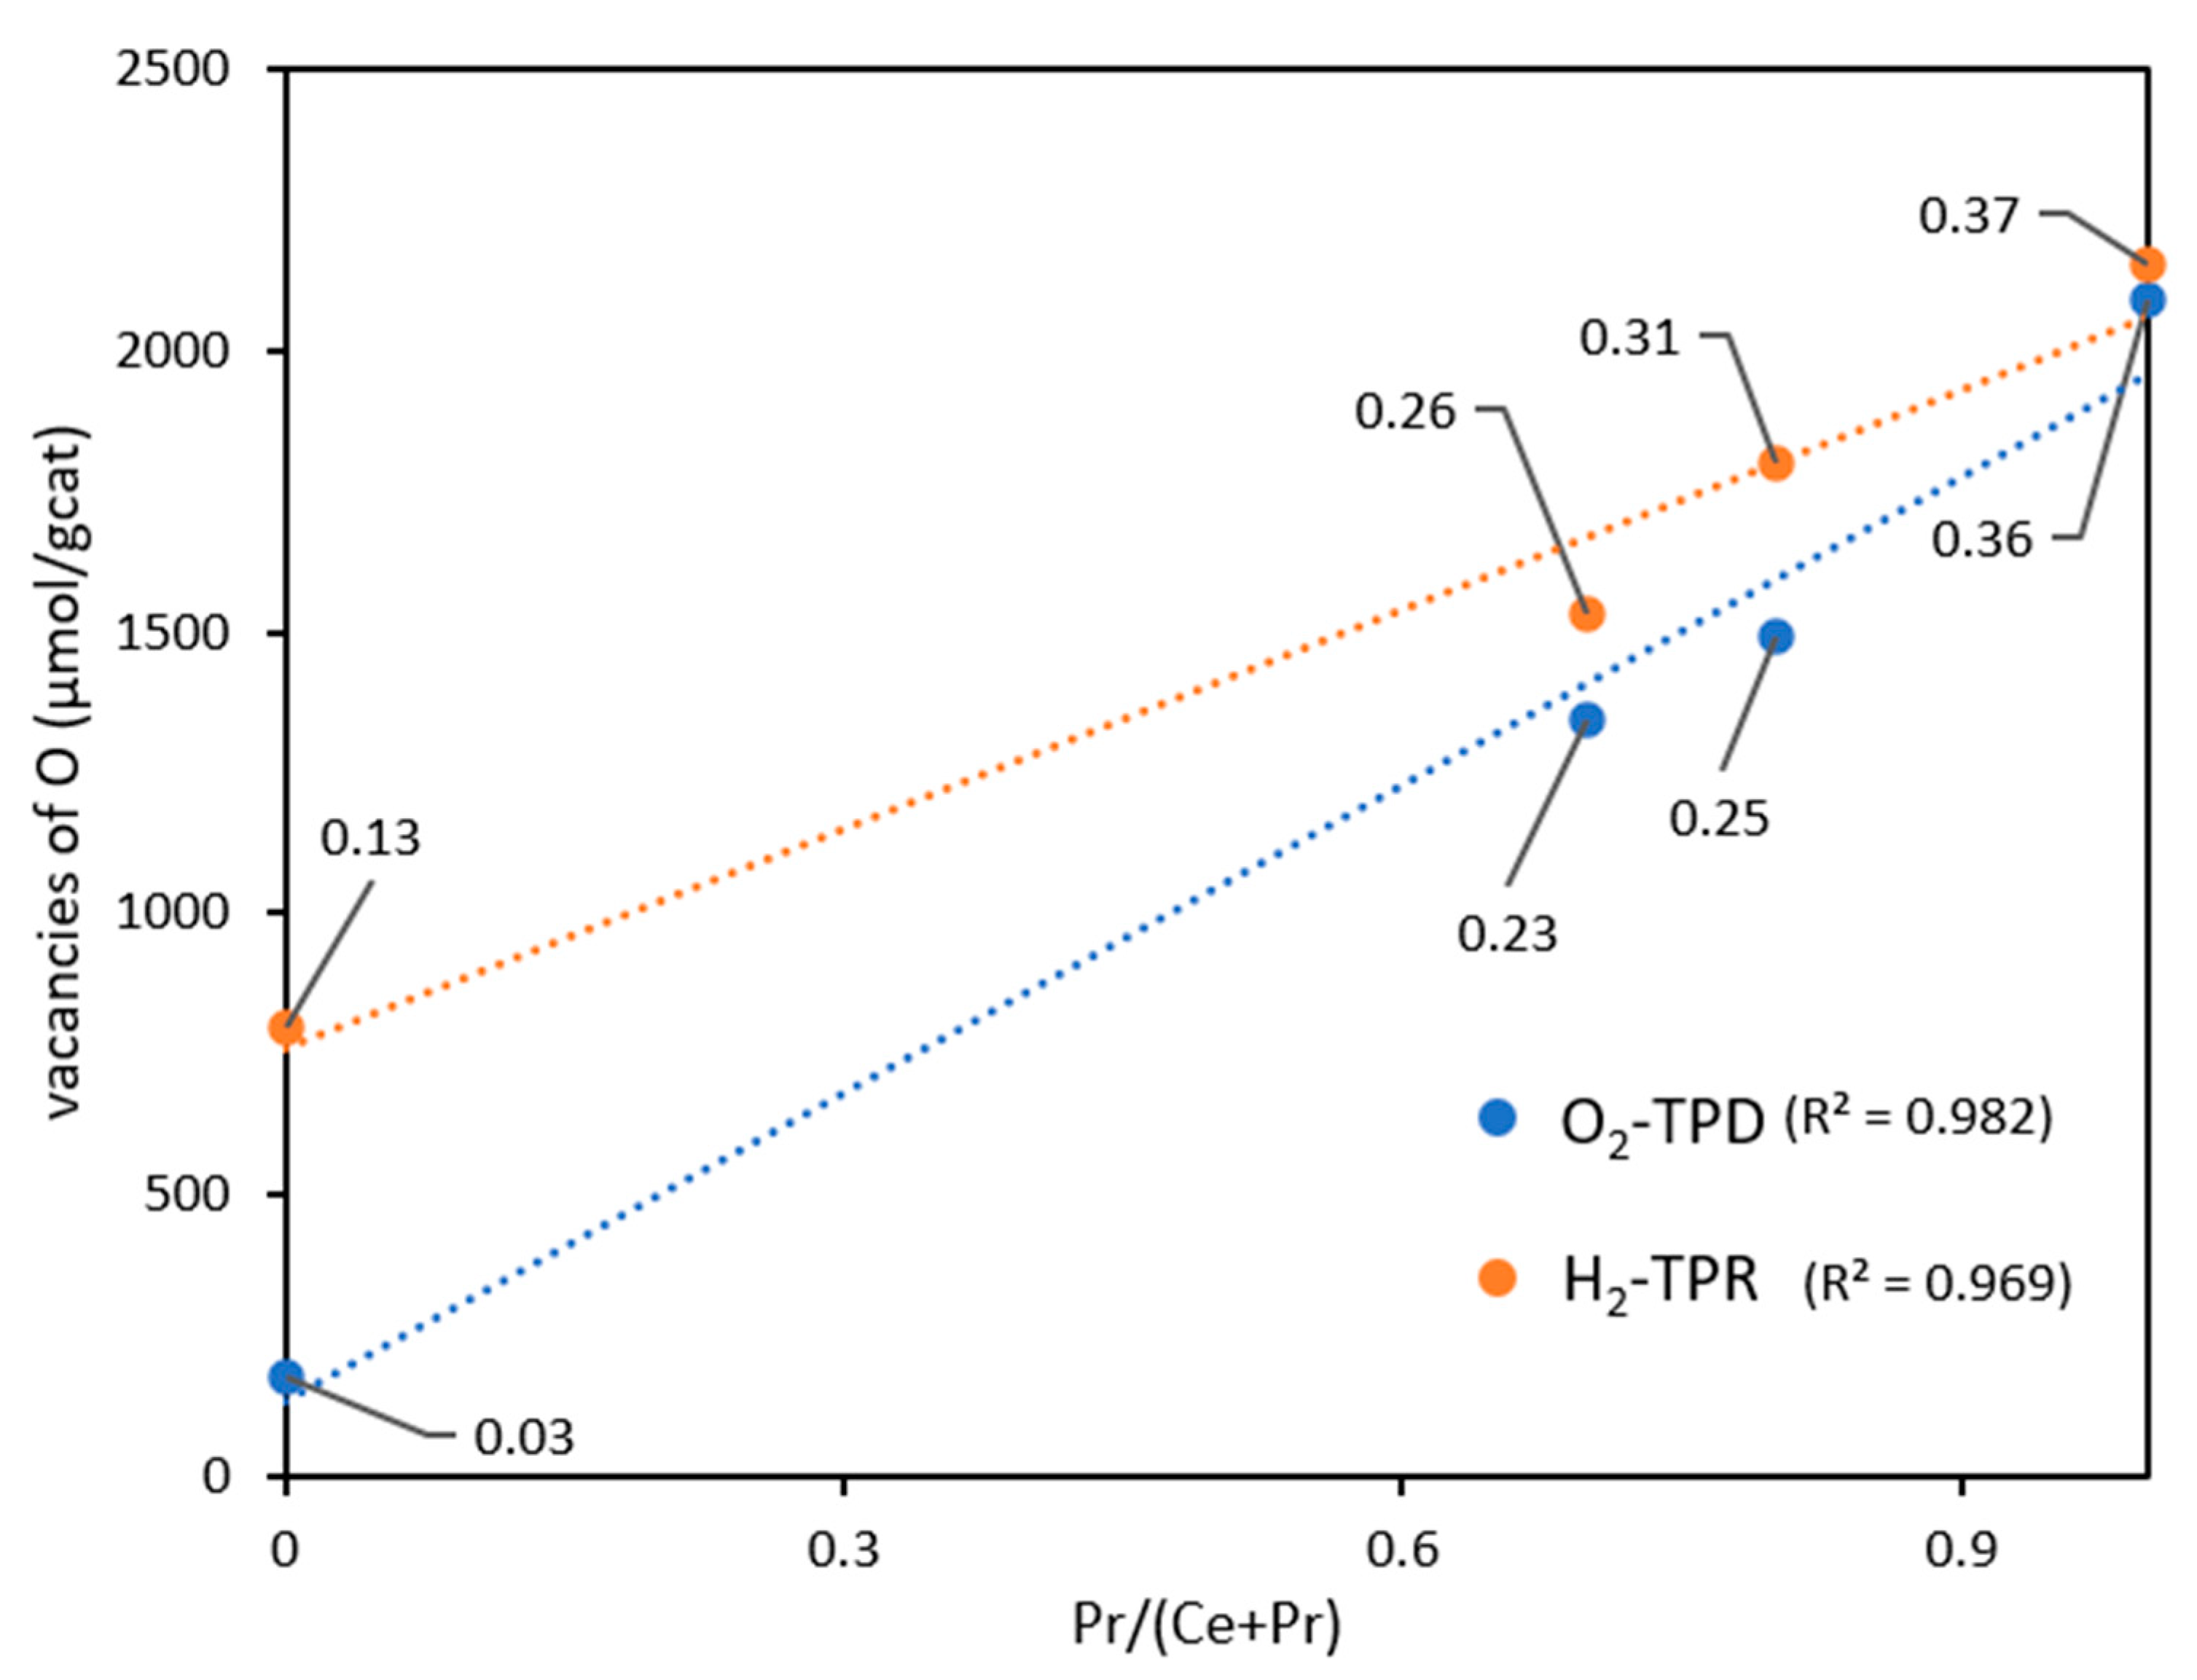
Figure 5 illustrates the correlations of the amounts of oxygen vacancies created under the two atmospheres (estimated from global O2 emitted and H2 consumed amounts shown in Table 4 and following the assumptions explained in the Supplementary Information) versus the praseodymium content of the catalysts (ranging from pure ceria to pure praseodymia). It is worth noting that, independently of the different textural properties that characterize the catalysts, the main parameter governing the total oxygen release capacity of the oxides is the praseodymium content (approximately linear correlation see Figure 5), mainly that obtained by the representation of O2-TPD data, with a value of r2 of 0.982). Besides, an interesting observation can be extracted from Figure 5, as the Pr content is higher and higher, the values obtained under the two different atmospheres become closer and closer (as illustrated in Figure 5), proving the best oxygen mobility and, in turn, the high ability of stabilizing vacancies for PrO2 (even under mild conditions).
Interestingly, for the case of pure praseodymia, the maximum theoretical level of reducibility that can be reached (measured from both atmospheres) corresponds with the value of the theoretical non-stoichiometric phase of Bevan’s cluster. It is described in the literature [42] that fluorite-related solids (MO2-x) can be anion deficient, with the cation sublattice remaining essentially perfect. The defect cluster would correspond to tightly bound vacancies along a body diagonal [111] (as shown in Figure S2 of the Supplementary Information). The central cation is six-coordinated and is surrounded by six seven-coordinated cations. Since the geometry of these clusters permits four different equivalent orientations, it is easily accommodated in the fluorite structure and accounts for the wide range of stability of the so-called α-phases (MO1.71-MO2). This congruency between the experimental estimation and the theoretical defect cluster mentioned proves the large population of bulk oxygen vacancies accommodated in this solid, thus leading to a bulk defect cluster structure and becoming indirect evidence of the large capacity of stabilizing oxygen vacancies into the lattice after mild or reducing atmospheres.

3.2. Catalytic performances of soot combustion under 5% of O2 /He atmosphere

O2-TPD experiments have proved a large ability to release O2, at very low temperatures for the Pr-containing catalysts, and, consequently, available for catalytic reactions, when compared with a very poor response coming from the ceria catalyst. To assess the impact of these behaviors on the catalytic soot combustion, due to the different BET surface areas and pore volumes characterizing the catalysts, TPO experiments under 5%O2/He, both in tight and loose contact conditions, were carried out.
The accepted mechanism of soot oxidation over ceria-based solids involves the formation of oxygen vacancies at the interface between the catalyst and the soot. These vacancies can act as sites for oxygen activation, forming reactive species that will spill over the soot surface to oxidize the corresponding C atoms. This mechanism clearly depends on the degree of contact between the catalyst and the soot, because this impacts the population of oxygen vacancies that will form at the interface, where soot can play a role as a reductant for the ceria-based oxide, and the spilling of active O species which is facilitated by a large contact surface area. The number of contact points in the interfacial region is of paramount importance to promote the soot oxidation at low temperatures, these will be highly dependent on the textural parameters of the catalysts, mainly, in the first stages of the reaction [43]. In this sense, the soot combustion experiments were conducted under the two typical configurations (tight and loose contact) [43]. The data obtained from both configurations could provide deeper knowledge about the performance of the catalysts and the possibility of “splitting” and determining the impact of BET surface area, surface oxygen mobility, and bulk oxygen mobility on catalytic performance:

3.2.1. Experiments under tight contact mode.
It is widely accepted that tight contact conditions are less representative of the real situation concerning the contact achieved among soot and catalyst in a real DPF [44], but the advantages of this mode of mixture are as follows: good reproducibility, reliable results, and a preliminary view or “screening” of the intrinsic catalytic behavior. Definitely, very helpful to reflect the inherent features of a catalyst. Nevertheless, the order of activities should be carefully discussed since the trends (when different catalysts are compared) and the performances found could be very different from those obtained under the loose-contact mode [45].
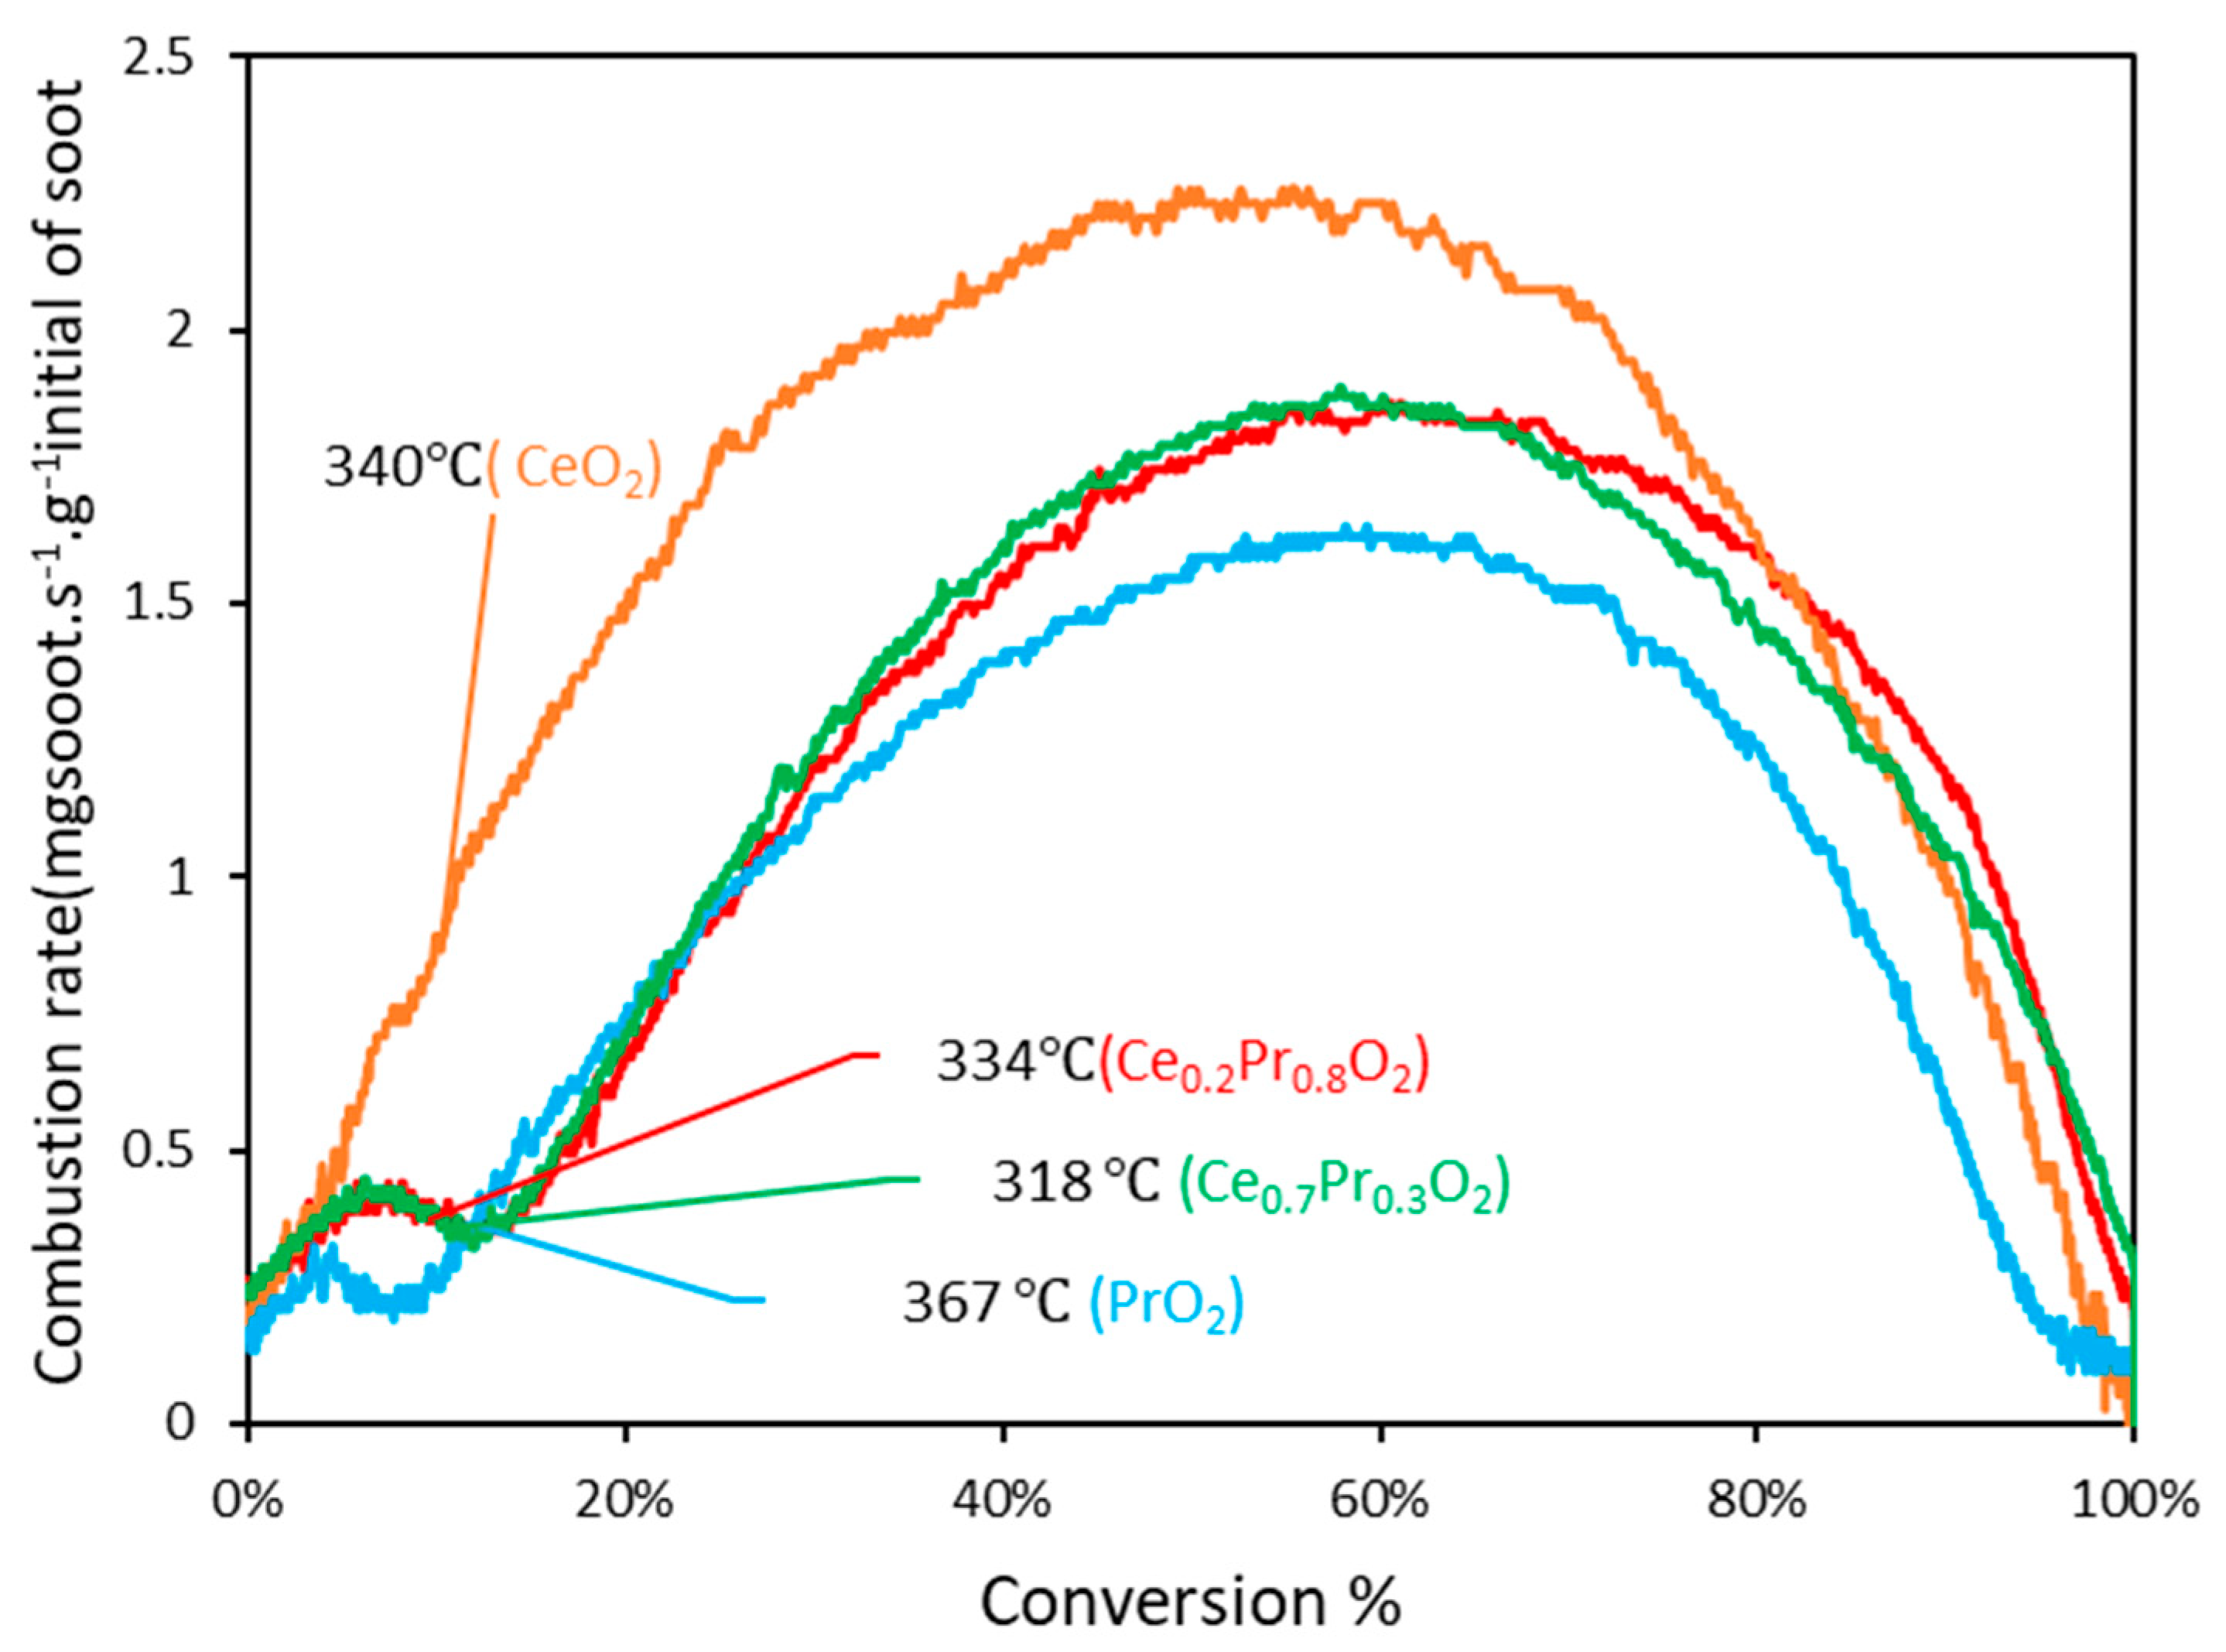
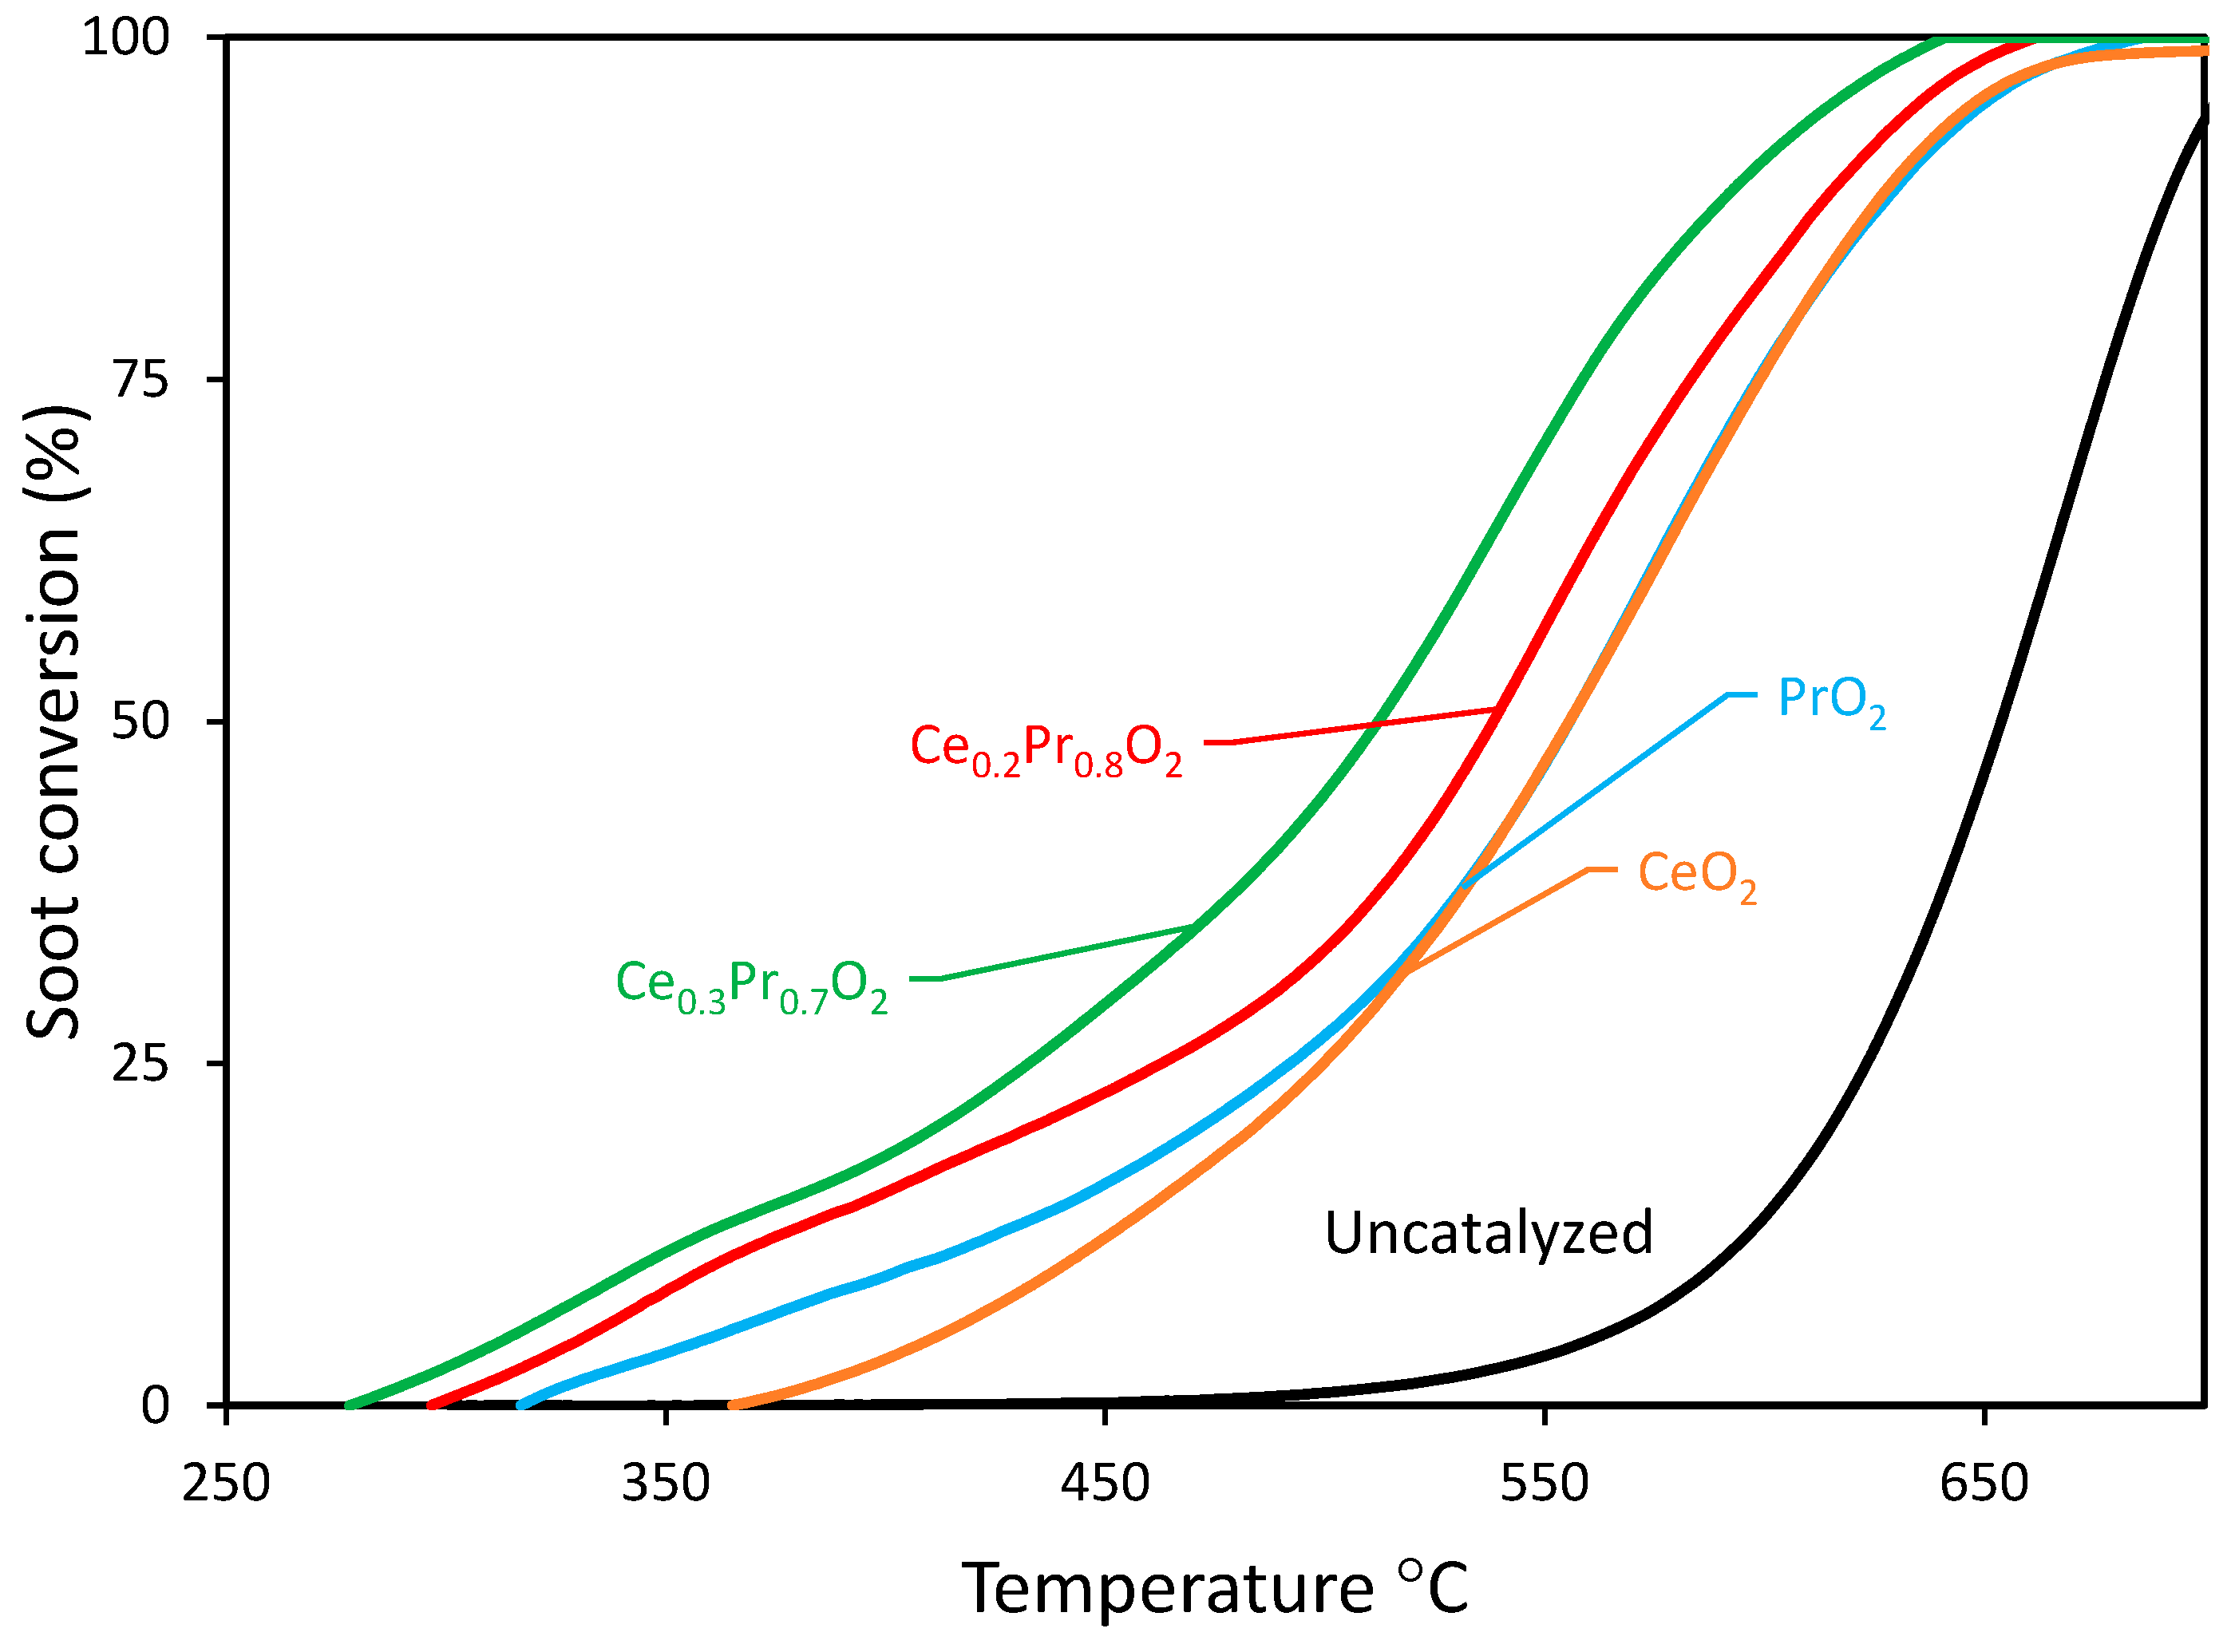
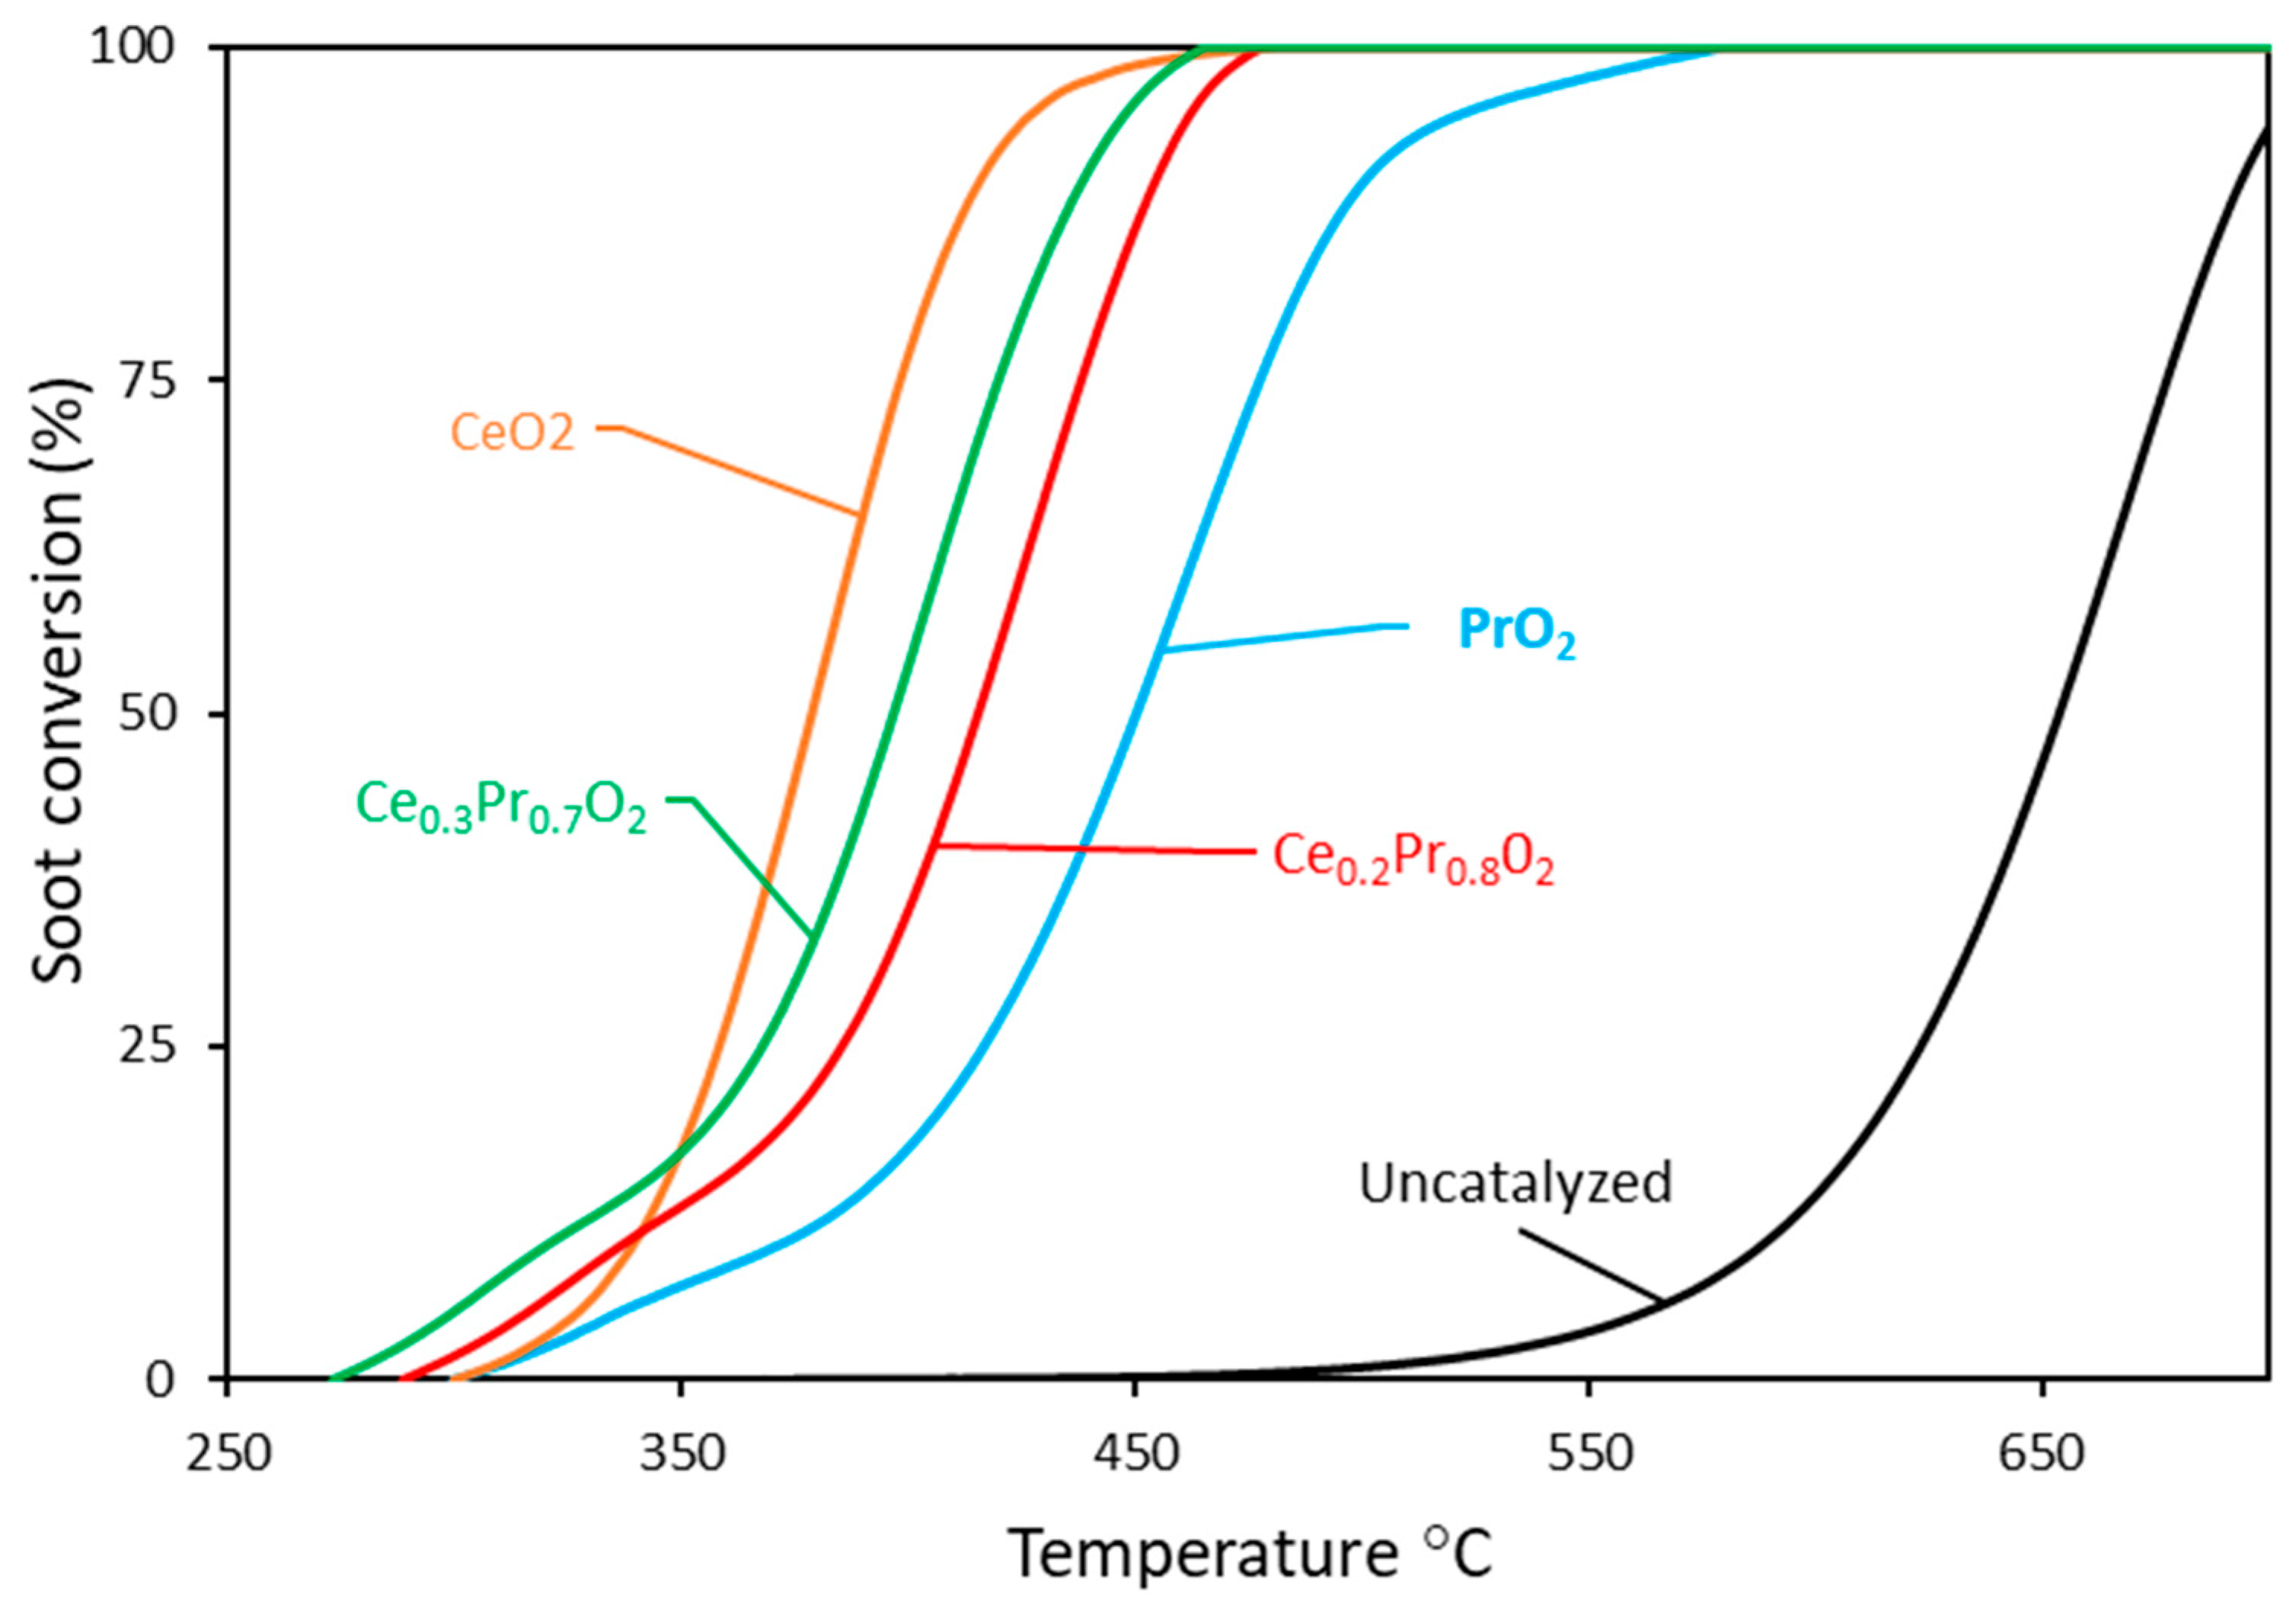
Firstly, the catalytic activity of the investigated samples is represented by the soot conversion curves as a function of temperature (and corresponding T10%, T20%, T50%, and T90% values, which are listed in Table 5). To provide a basis for comparison, the profile of pure cerium oxide (taken as a model catalyst) is included as a reference, and all the profiles are shown in Figure 6. It is interesting to pay attention to the region of low temperatures (or low soot conversion values), where the initial catalytic beds are in similar starting conditions since the soot loaded has not been consumed in remarkable amounts. The catalytic activity can be ranked in the following sequence:
Ce0.3Pr0.7O2 > Ce0.2Pr0.8O2> PrO2 ~ CeO2
Ceria exhibits the highest BET surface area measured (81 m2/g) of the series, followed by Ce0.3Pr0.7O2, Ce0.2Pr0.8O2, and PrO2, respectively. However, even at the initial steps of the reaction, the BET surface area seems not to be the most important parameter governing the activity. Paying attention to Figure 4a, one can see that this is the order of oxygen lability, at low temperatures, for Pr-containing samples,(the order of BET surface areas and the activities matches as well), meanwhile, pure ceria presents a very poor ability to release oxygen under O2-TPD conditions (nearly null).
As soon as the reaction proceeds and the temperature is increased, CeO2 is characterized by higher soot conversion values comparing the same range of temperature (from 350°C on) with the Pr-containing samples which present very good oxygen mobility [45,46]. This observation is consistent with the results published by Aneggi et al. [46] who reported superior activity for pure ceria than that of Zr-doped ceria (with good bulk oxygen mobility [27]), analyzing soot combustion activities in air under tight contact conditions. This indicated, according to the authors, that the regeneration of surface oxygen by sub-surface or bulk oxygen was not prevailing and the replenishment of surface oxygen was mainly due to the O2-gas phase, because no correlation was found with the respective values of OSC of the catalysts studied [46]. The present results seem to point out to a similar direction.
Figure 6. Soot conversion curves (under tight contact) as a function of temperature for all the catalysts (including the uncatalyzed reaction, for comparison purposes).
Preprints 98995 g006
Table 5. Comparison of the temperatures needed to achieve several values of conversion (X%) along with the soot combustion rates (in parentheses) measured under tight and loose contact conditions (T.C and L.C).
Sample Temperature (℃)
10%a 20% a 50% a 90% a
T.C L.C T.C L.C T.C. L.C T.C L.C
CeO2 340(0.89) b 439(0.24) b 355(1.46) b 483(0.43) b 382(2.23) b 556(0.83) b 415(0.80) b 630(0.51) b
Ce0.3Pr0.7O2 318(0.36) b 342(0.30) b 357(0.71) b 409(0.32) b 397(1.78) b 511(0.78) b 438(1.07) b 595(0.69) b
Ce0.2Pr0.8O2 334(0.38) b 359(0.28) b 373(0.63) b 431(0.27) b 415(1.74) b 538(0.94) b 454(1.20) b 618(0.58) b
PrO2 367(0.24) b 404(0.31) b 405(0.72) b 469(0.15) b 449(1.54) b 555(0.72) b 500(0.63) b 632(0.58) b
1Ag/YSZbc 380 420 - - 430 530 - -
a % soot conversion values. b soot combustion rates, (expressed as mgsoot ·s-1·ginitial soot-1 in parentheses). c extracted data from [47] (formulation with 6m2/g of BET surface area).
With the aim of working with more accurate data and reaching better comparability, the evolution of soot combustion rates was depicted versus the soot conversion values in Figure 7. With these representations, the catalytic activity data are much more comparable, since the analysis is based on the same amount of remaining soot in the reactor. Interestingly, soot combustion rates seem to be higher at low conversions for the ceria catalyst, which could be considered contradictory results. Nevertheless, this is only a consequence of the delay in appreciable soot combustion rates at low temperatures (probably due to the absence of a good oxygen delivery capacity of this catalyst). When going deeper into the information of Figure 7 and the corresponding temperatures at which the soot conversions reached are taken into account (see values compiled in Table 5), it can be clearly checked that the highest soot combustion rate measured at iso-conversion of 10% for the pure ceria catalyst, is due to the highest temperature needed compared with the Pr-containing mixed oxides (340° versus 318/334°C) and not to a better intrinsic activity. In this line, the comparative representations of Figure 7, (along with the summary compiled in Table 5) are quite useful and needed for a reliable discussion of the results. From 20% of conversion on, ceria is the catalyst exhibiting the highest soot combustion rate at the lowest temperature, which is likely attributed to its highest BET surface area, which provides more surface-active sites for the combustion reaction to take place at medium temperatures. However, pure ceria’s profile decays before, indicating that this catalyst is seen much more affected than Pr-containing mixed oxides by the loss of contact among soot particles and the catalysts’ surface, and, from 80% of conversion on, the ceria’s rate drops below those of the Pr-containing mixed oxides.

3.2.2. Experiments under loose contact mode.

The experiments conducted under tight contact conditions, discussed previously, do not reflect the real conditions achieved in a real coated Diesel Particulate Filter, where the contact between soot and catalyst is often very poor, and this affects the efficiency of the catalytic process (which can be considered as optimum in the tight contact mode).
Figure 8 shows the soot conversion curves under loose contact mode as a function of temperature, for each catalyst. As expected, these combustion profiles are shifted towards lower temperatures with regard to the uncatalyzed profile. On the other hand, the soot combustion profiles are clearly moved towards higher temperatures, if compared with those obtained under tight contact mode, and are characterized by an activity order considerably different:
Ce0.3Pr0.7O2 ≥ Ce0.2Pr0.8O2> PrO2 > CeO2
(If attention is paid, mainly, to the range of low and medium temperatures)
According to this ranking, Ce0.3Pr0.7O2 exhibited the highest catalytic activity among the catalysts tested, followed by Ce0.2Pr0.8O2. The use of Ce0.3Pr0.7O2 resulted in the highest soot conversion in the initial temperature range, while CeO2 showed the lowest conversion rate. In general, ceria’s performance is seen much more moved further to those of Pr-containing samples if compared with the trends under tight contact mode, emphasizing the idea that pure ceria would be much less active under real conditions. A tentative explanation can be given now: as soon as the catalyst-soot contact becomes poorer and poorer, (loose contact versus tight contact mode), the role of a large population of oxygen that can be released in the proper range of temperature becomes more relevant. As seen by the O2-TPD profiles, ceria presents a very low population of oxygen species that can be released under He, and therefore, able to contribute to the soot combustion process. Conversely, the Pr-containing samples are much more active than ceria (mainly in the low-temperature range), just following the order of oxygen emission degree in the low-temperature range (see Figure 4a).
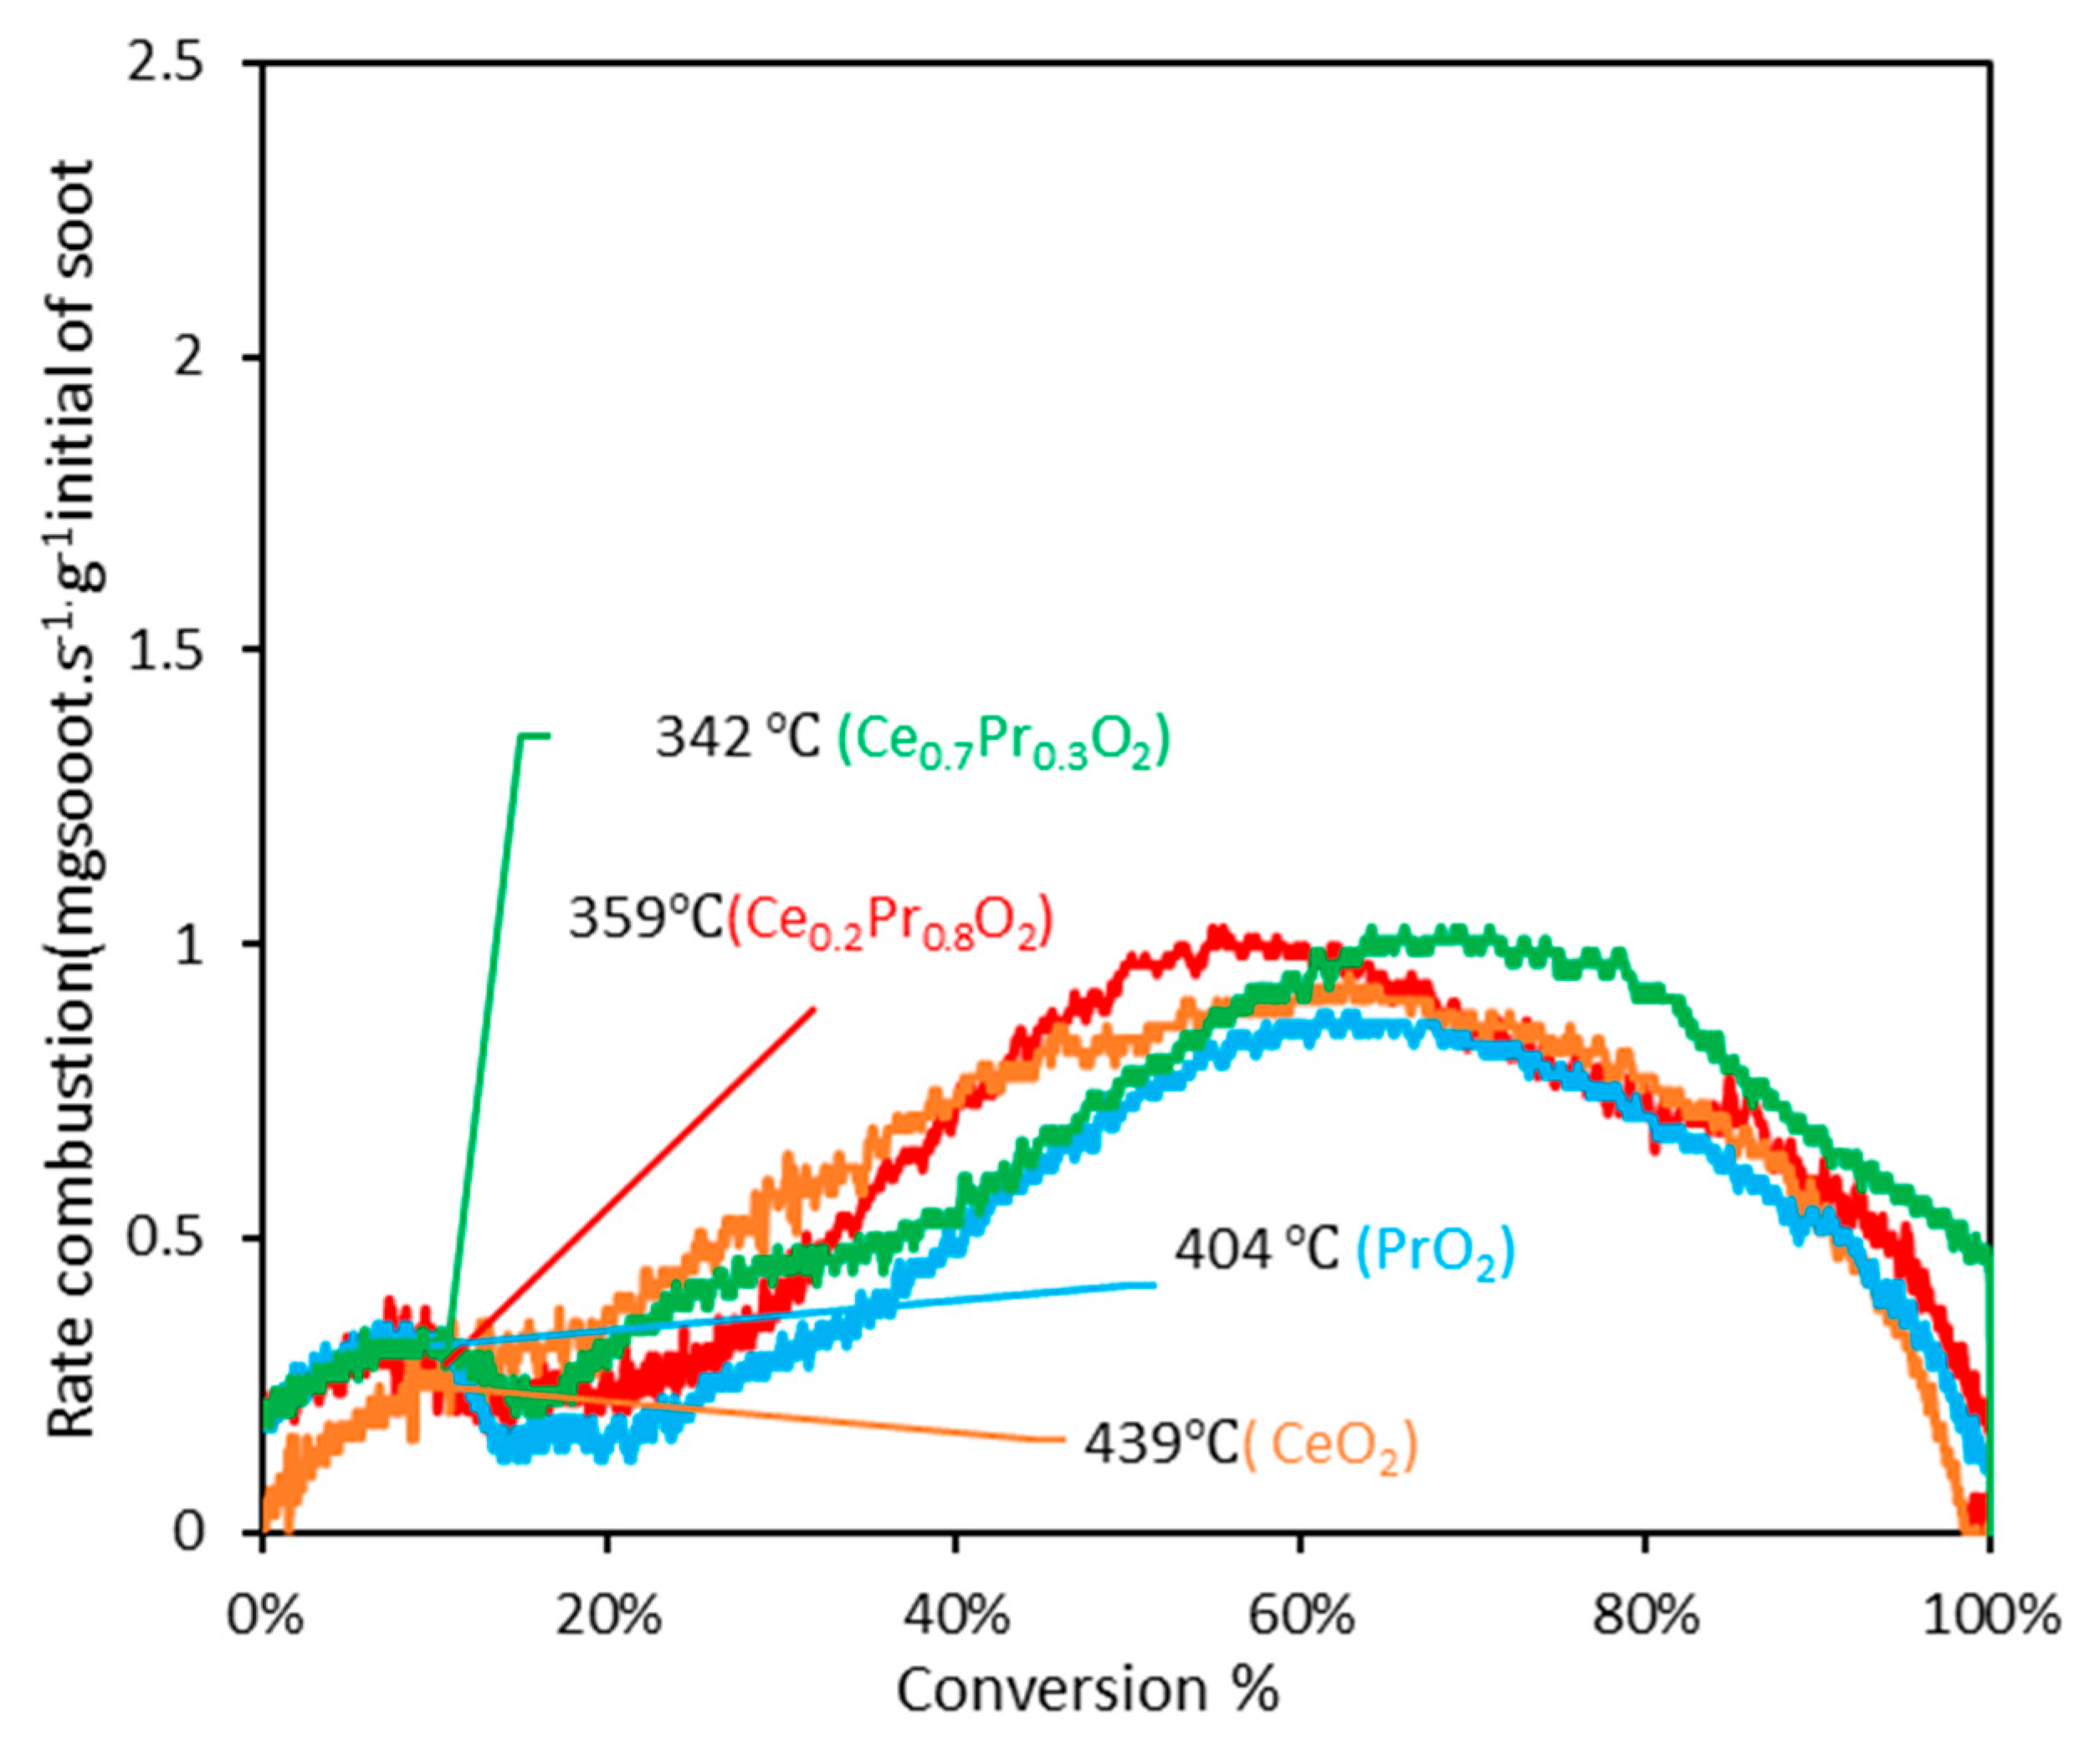
The evolution of soot combustion rates was illustrated versus the soot combustion values in Figure 9, in parallel with the analysis made in tight contact mode. From a comparative point of view, it is worth commenting on the general profiles of this set of catalysts under the two situations tested. Much higher maximum values and higher differences in the catalysts’ behaviors are shown by means of conducting experiments under tight contact, (if compared with those of loose contact) thus verifying that, effectively, the tight contact conditions can be defined as a mode of mixture able to reveal the intrinsic differences in the catalytic performances. The very intimate degree of contact maximizes the soot combustion rate and, probably, the relevant steps of the soot combustion process can play a “harmonized” role (since there are no constraints among catalyst surface and the soot surface joints), therefore, as soon as the oxygen species are replenished by O2-gas, they are effectively transferred to the soot’s surface.
The catalysts exhibit similar catalytic responses, but a detailed analysis of the data in Figure 9 reveals that the pure ceria sample achieves the same soot conversion rates at identical values of conversion but at different temperatures compared to the Pr-containing samples. This trend aligns with the order of the oxygen emission ability at low temperatures determined by O2-TPD. The data collected in Table 5 confirms that whatever the Pr-containing catalyst is considered, the ceria catalyst always needs a higher temperature to achieve the same soot conversion values under more or less comparable soot conversion rates. Only pure praseodymia, which presents a considerably low BET surface area and pore volume, is characterized by similar values of temperatures to those of ceria at high conversion values. All these findings are supported by the fact that the Pr-containing catalysts present a tremendous ability to deliver high oxygen amounts at low temperatures, and a part of them will eventually reach the soot surface, even though the direct contact among the surfaces is hindered.
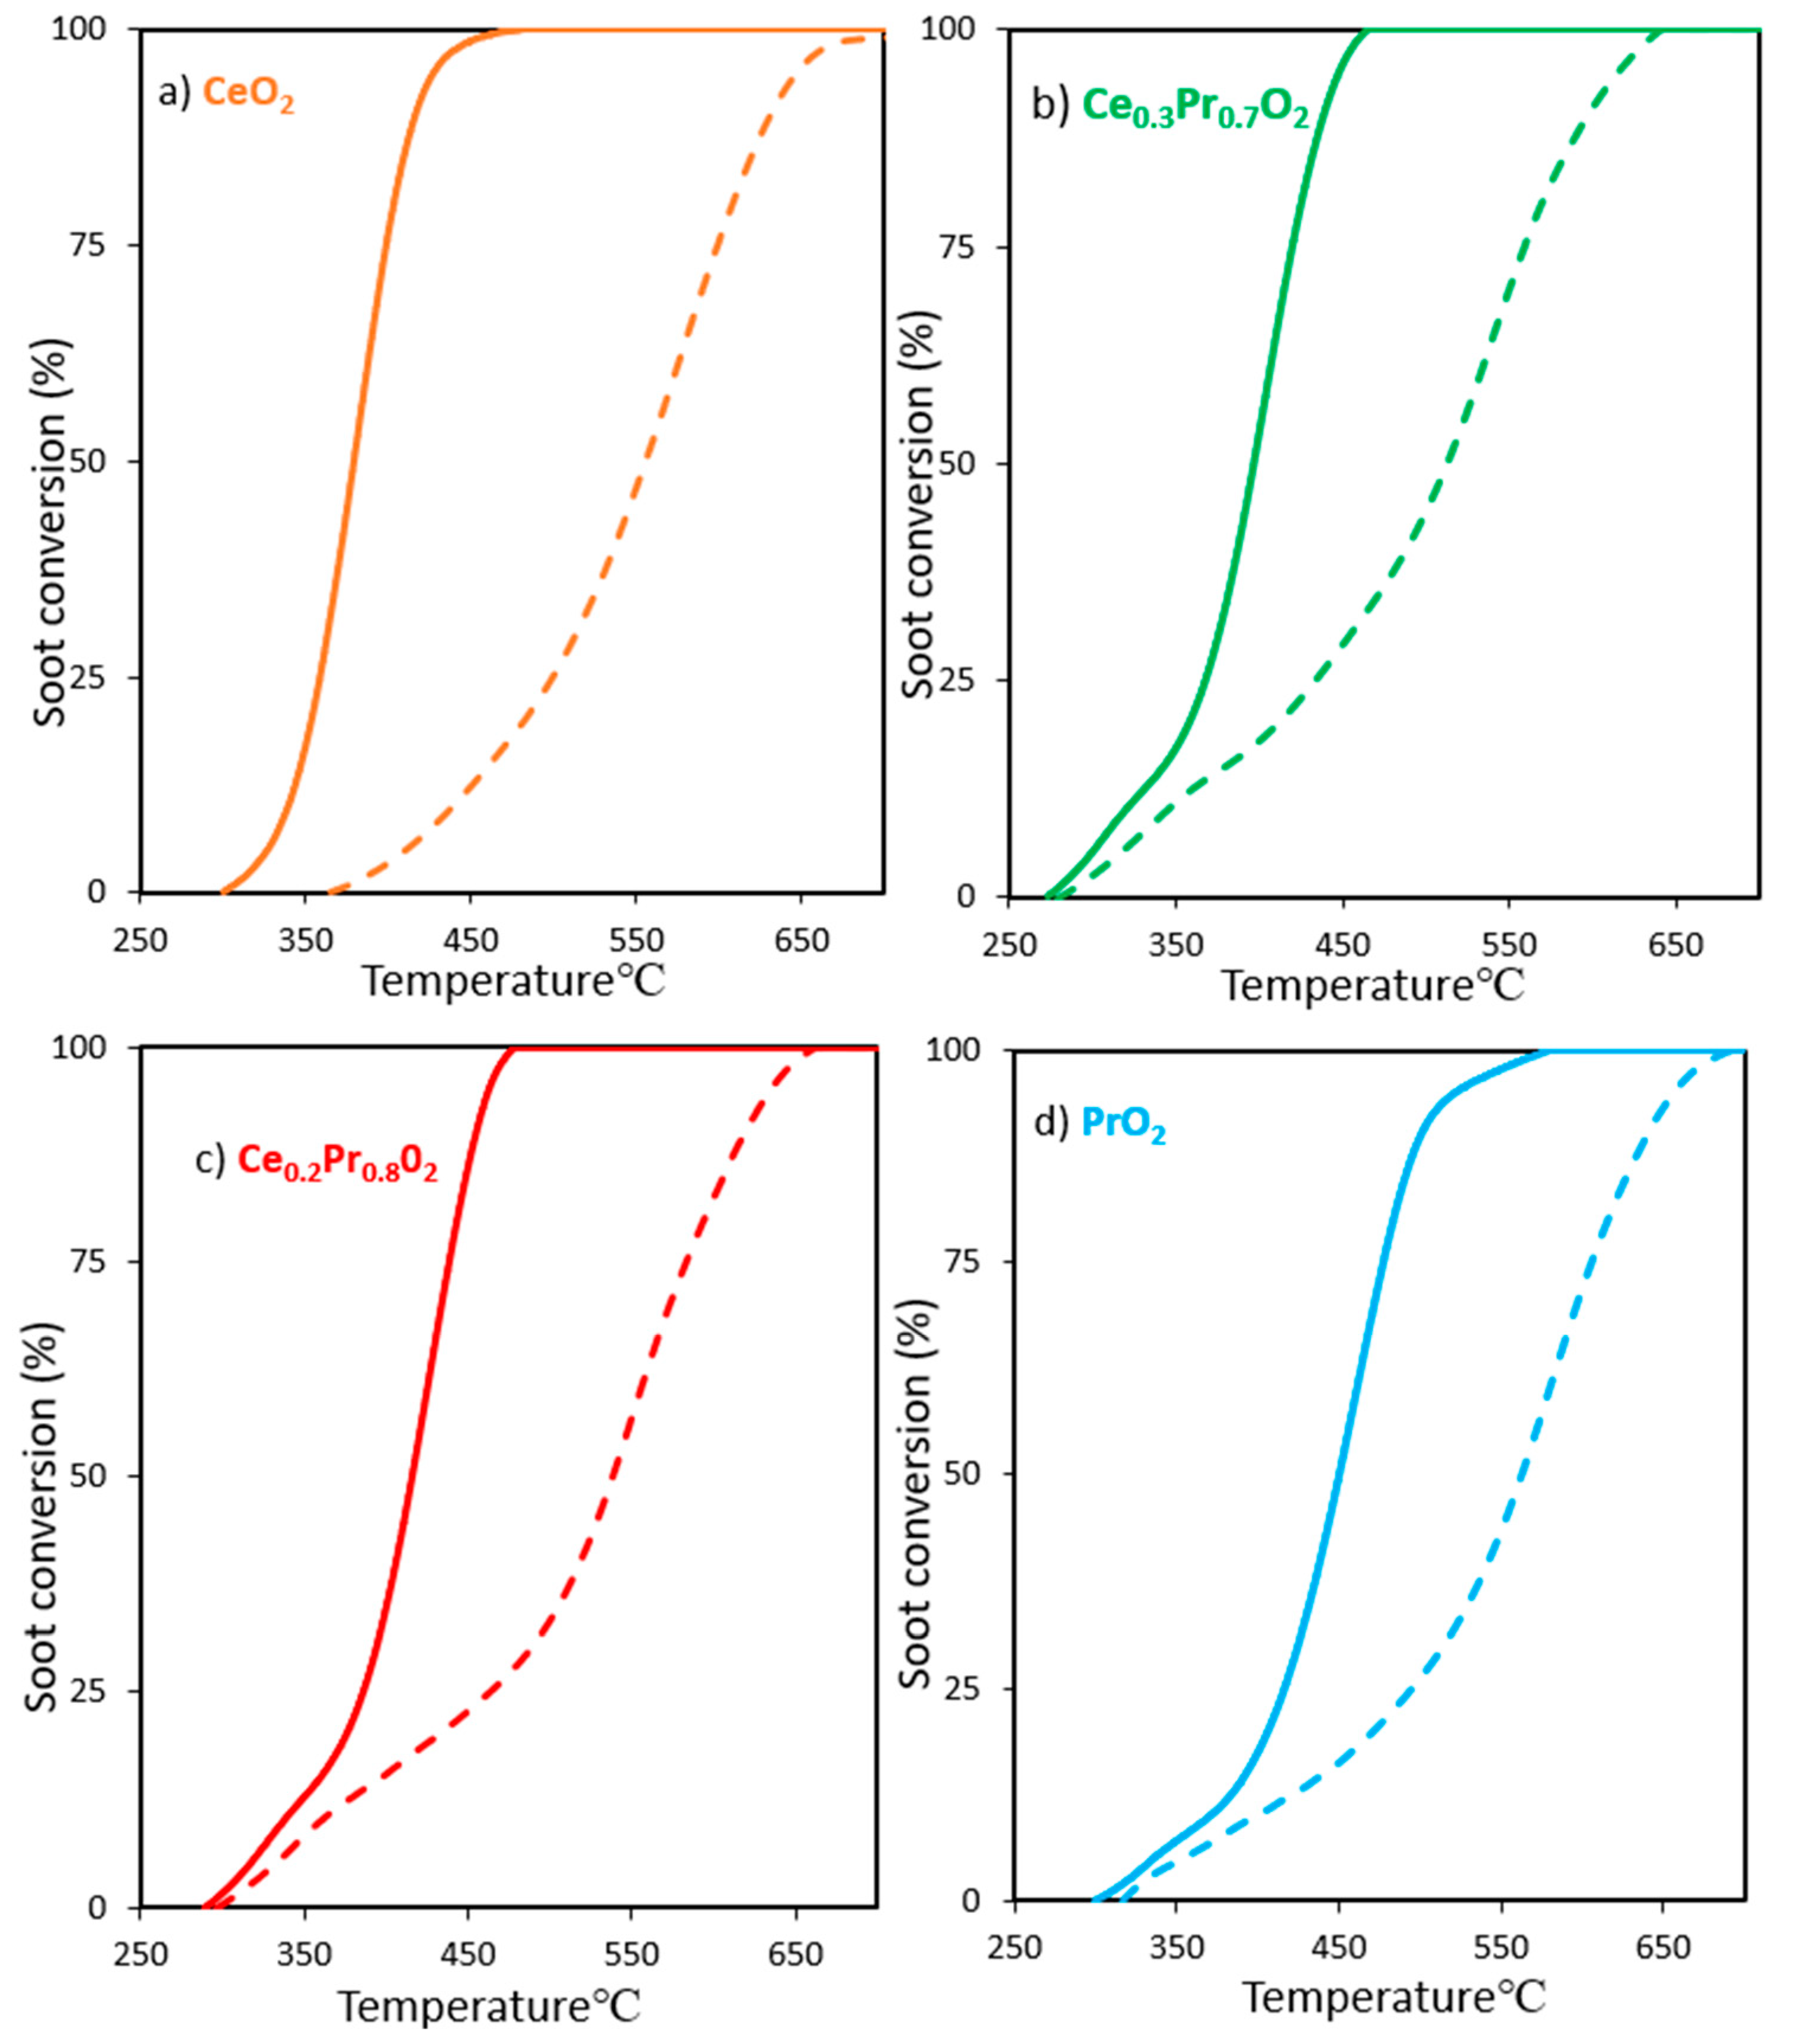
The discussion of this work is completed by the direct comparison of the soot conversion profiles for every catalyst (in separate graphs). Therefore, in order to obtain a more comparative and reliable analysis, the curves obtained under the two modes (tight and loose) are compared for each catalyst in Figure 10, in an attempt to analyze which catalyst (or catalysts) are seen more affected by the decrease of the number, quality, and intensity of the contact points (catalyst/soot), or in other words, the change from an intimate contact mode to a gentle or more representative contact mode. Solid lines represent tight contact experiments, while dashed lines represent loose contact conditions in Figure 10. By means of these representations, the following general statement can be assessed: better performances were observed at the highest degree of contact, whatever the nature of the catalyst; however, remarkable differences can be noted in the patterns and the relative differences in activity in terms of the contact mode are a function of the nature of the catalyst.
Therefore, Figure 10 illustrates the impact of the contact mode (tight vs. loose) on the soot conversion profiles and highlights important observations previously mentioned. The behavior of ceria in both contact modes, tight and loose, differs importantly when compared to those of the praseodymium-containing formulations. These formulations exhibit two distinct slopes, indicating a possible change in the rate-determining step (or mechanism). Conversely, the ceria catalyst does not show two distinct slopes, but a conventional sigmoidal shape appears. This change of slope is clearly reflected in the relative maximum appearing at low conversion values which features the representations of Figure 7 and Figure 9 for Pr-containing catalysts, but which is completely absence for the pure ceria catalyst.
One potential explanation for this difference lies in the different performance or features of the ceria’s catalyst. In this case, the catalytic activity is thought to primarily depend on the surface oxygen species’ population. In contrast, for the praseodymium-containing formulations, at certain temperatures, the catalytic activity appears to depend on the surface/subsurface/bulk oxygen species’ mobility (besides the involvement of surface oxygen).
This observation suggests that the praseodymium-containing formulations have improved oxygen mobility, (as proved by O2-TPD and H2-TPR results), enabling efficient active oxygen transfer from the catalyst to the soot surface. This improved oxygen transfer mechanism is likely due to the enhanced mobility of surface/subsurface/bulk oxygen species in these formulations. This ability seems to be especially critical under loose contact mode.
On the other hand, the differences between tight and loose contact curves are the lowest ones for the case of PrO2. Actually, this catalyst presents the lowest BET surface area (6 m2/g), and the best bulk oxygen mobility. As the Pr-containing catalysts are characterized by higher and higher surface areas, the corresponding curves move further away from each other, mainly in the low-temperature range (as shown by Ce0.2Pr0.8O2 (31 m2/g) and Ce0.3Pr0.7O2 (42m2/g), respectively).
Finally, to assess the interest of these compositions against other catalysts’ formulations recently reported in the literature [49], Table 5 compiles the measured values of T10% and T50% obtained from soot combustion curves under quite similar conditions (tight and loose contact modes; 5%O2/He; 100 ml/min; and Printex-U as model soot), by choosing the most active formulation reported by Serve et al., (1Ag/YSZb), in [49]. The impact of the present results is notorious since the two mixed oxides are more active than the selected catalyst 1Ag/YSZb, for whatever the conditions are compared. Interestingly, this catalyst (presenting BET area of 6m2/g and Vp of 0.02 cm3/g), shows quite similar textural features to those of pure praseodymia (see Table 1), and, even the pure praseodymia catalyst is more active than the Ag-catalyst at low conversion values, which can be again supported by the large ability to deliver oxygen at low temperatures of this catalyst. Accordingly, the benefits of Pr-containing samples among other formulations seem to be more evident at low temperatures.

3.3. Work function measurements

A crucial initial stage in many catalytic reactions involves the transfer of an electron from the catalyst surface to reacting molecules. The material’s capacity to perform this electron transfer is determined by its work function, which is essentially the energy required to extract an electron from the material’s surface. This electron transfer can generate active entities that are more inclined to engage in subsequent reactions or modify the charge of a molecule, enabling it to interact with a molecule of opposite charge [1]. According to the literature [43,44], the work function of the catalyst can be manipulated either by substituting elements in its core structure or by introducing surface promoters. It is well known that promoting the use of alkali materials with transition metal oxides leads to a reduction in the work function of the parent materials, resulting in an active catalyst.
Electronic surface promotion could play an important role in the catalytic oxidation of soot, as it is related to the activation of gas-phase oxygen, responsible for the combustion of carbonaceous pollutants. However, a direct relationship between catalytic activity (either under loose or tight contact) with the work function values could not be found under the experimental conditions used in this study. This suggests that the formation of reactive oxygen species (such as O-, O2-, O22-) on the catalyst surfaces via electron may not be of key importance for the investigated catalysts.
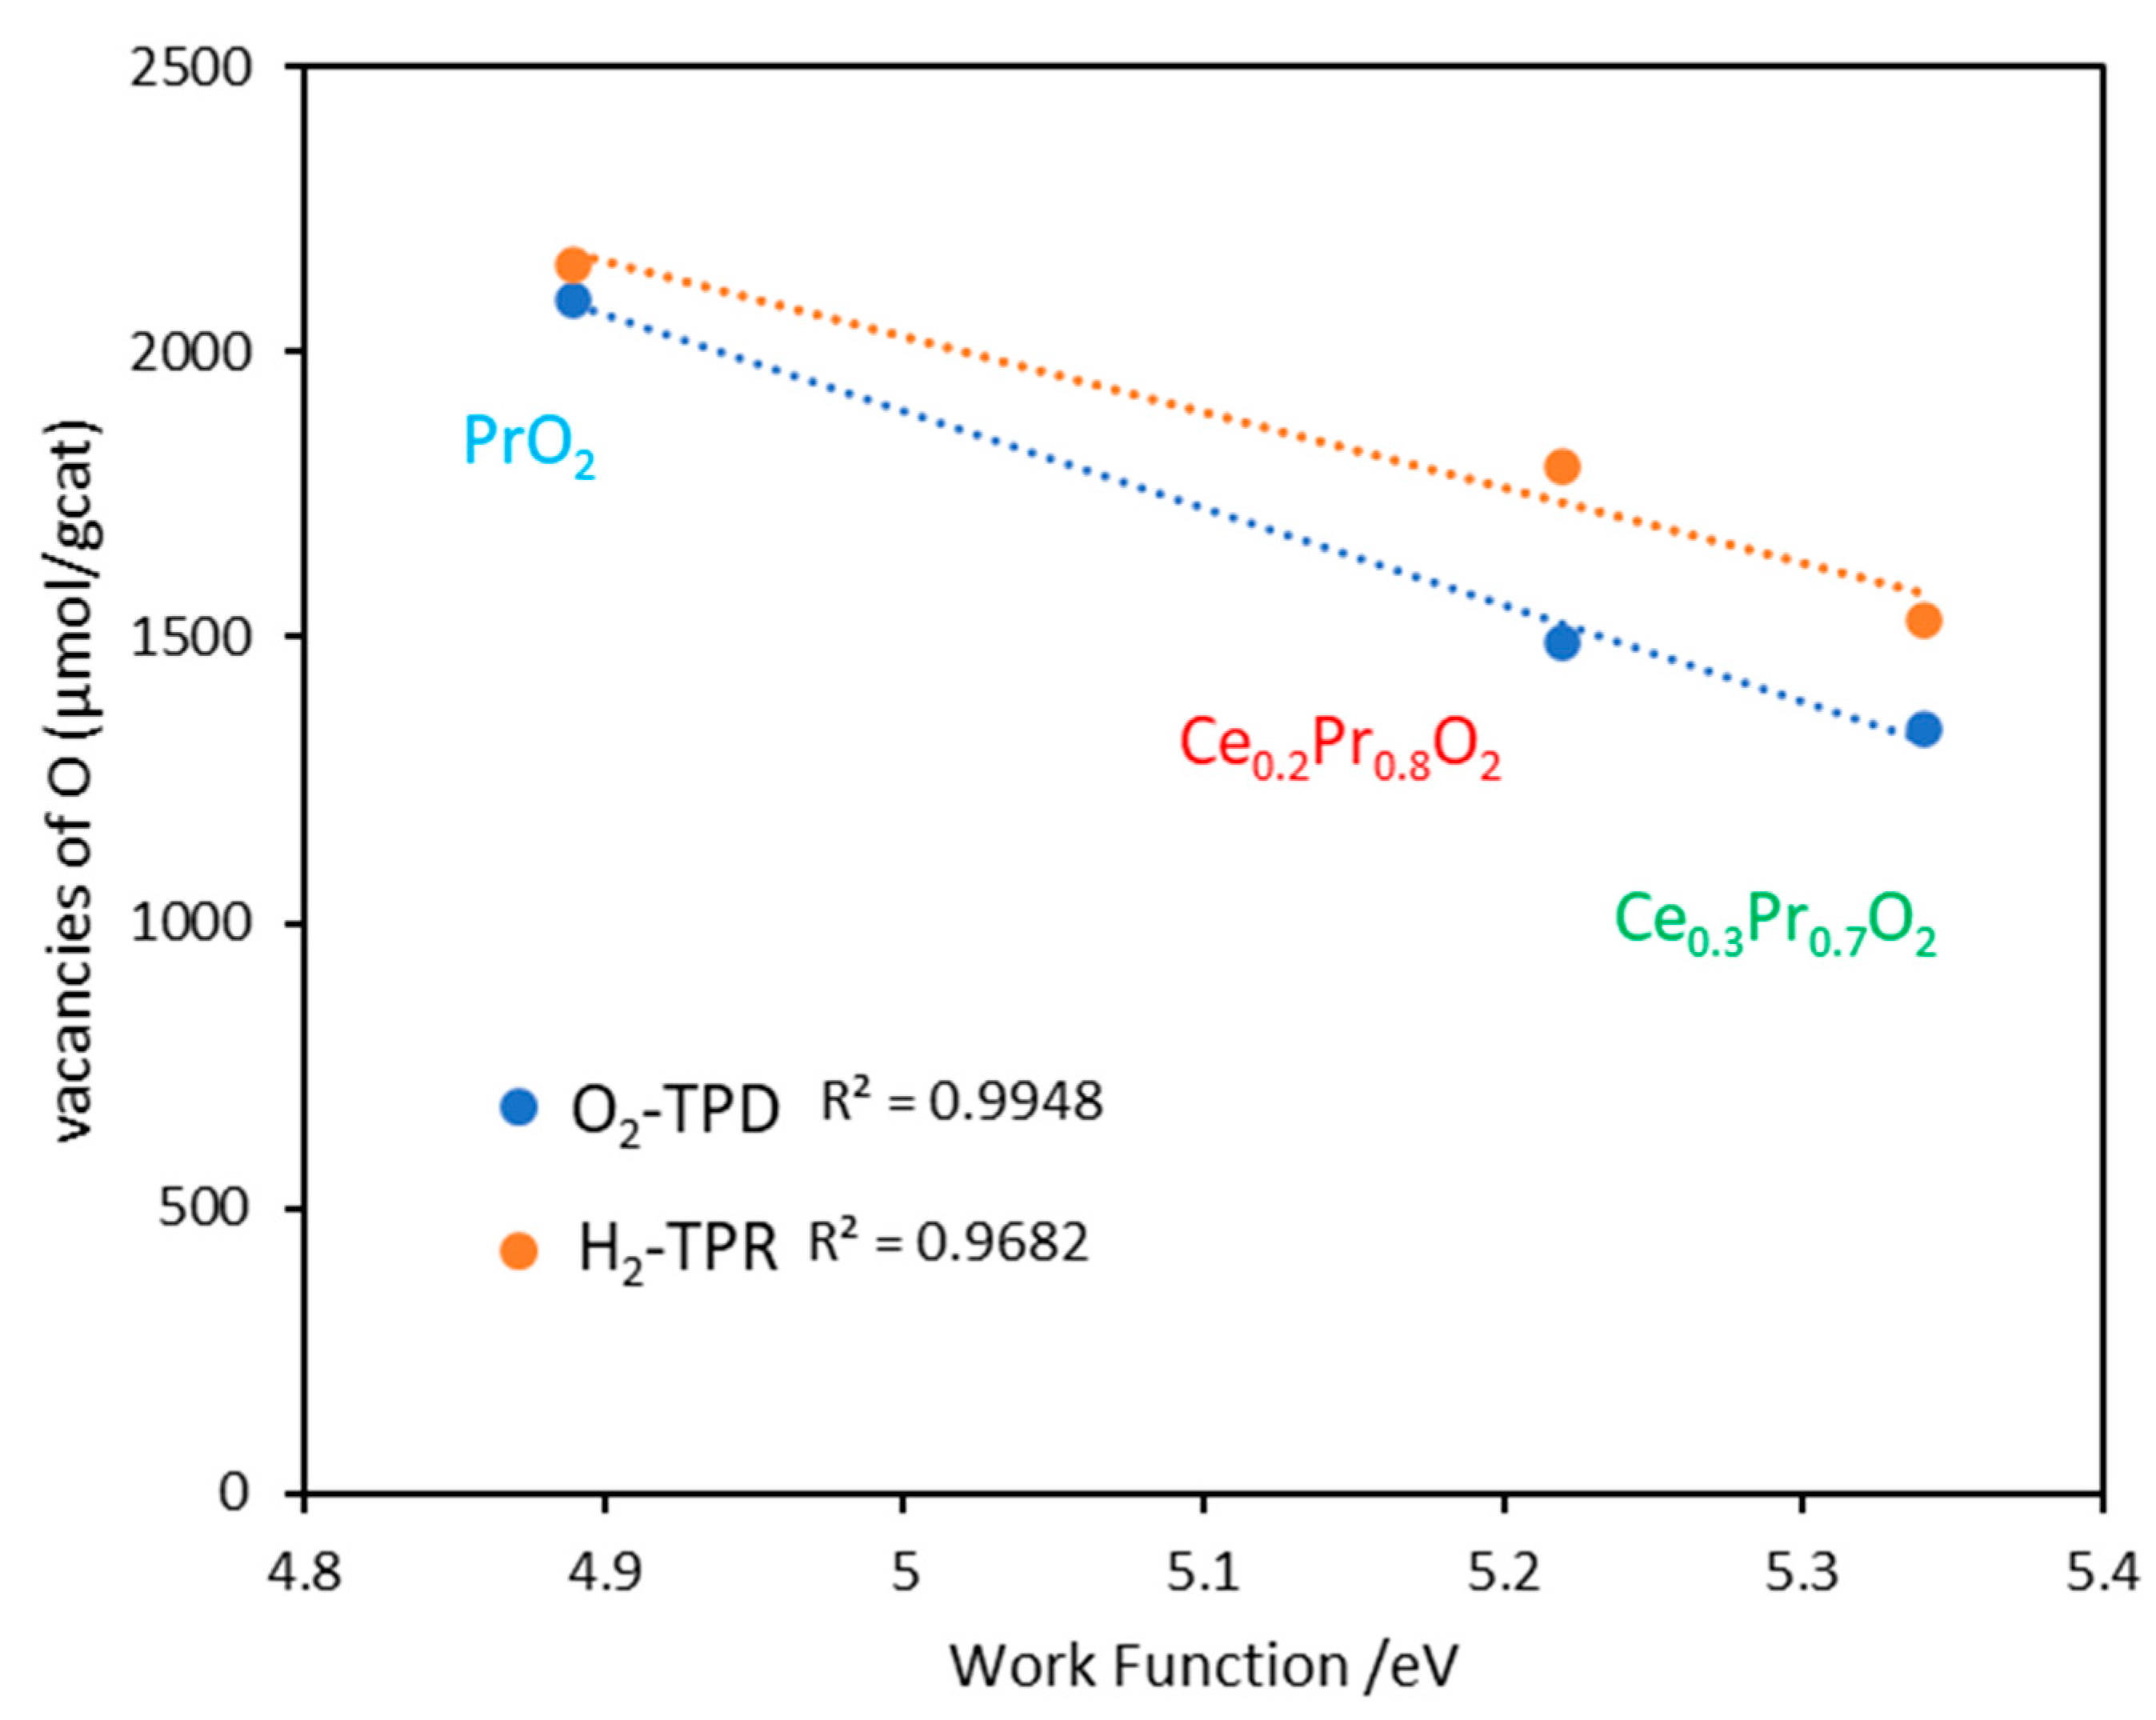
Indeed, an intriguing aspect emerges when a possible relationship between the work function values and the formation of oxygen vacancies under the two tested atmospheres is examined. There appears to be a noticeable correlation between the amounts of oxygen vacancies created and the catalyst work function, as illustrated in Figure 11. Specifically, the sample with the highest ability to generate oxygen vacancies, considering the whole range of temperatures (pure praseodymia) is that with the lowest value of work function. The regression coefficient obtained is very close to 1 (0.9948) for the data obtained from O2-TPD (see Figure 11).
Conversely, the catalytic activity might be tentatively related to the oxygen emission capacity in the low-temperature range (Figure 12a). Since the soot amounts remaining in the reactor are not the same at the different temperatures of the study, the temperatures to achieve different degrees of conversion (see Table 5) were chosen to be represented against the estimation of the potential oxygen vacancies created at low temperature (see Figure 4a and specific representation on Fig. 12b). All the lines present reasonable correlations, but the best regression coefficients are obtained mainly for loose contact conditions, indicating that the activity is influenced by the contact mode, and at loose contact mode the impact of the oxygen emitted at low temperatures (corresponding to the first peak of O2 emission) is more determinant to define the orders of catalytic activities.
As a brief summary, the comparison of soot conversion profiles under TPR mode should be done in a very careful and detailed way, since the soot combustion rates must be compared at the same or similar soot conversion values and even temperatures, mainly in the new scenarios of legislations, where the exhaust temperatures will become lower and lower. The TPR profiles of the catalysts conducted under the two contact modes provide valuable information about their activity and performance in diesel soot oxidation, and comparing these profiles under consistent conditions is essential for meaningful comparisons. The Pr-rich compositions seem to be promising compositions for real diesel soot combustion applications due to their very high oxygen lability, if compared with traditional pure ceria, characterized by a poor oxygen lability at medium temperatures.

4. Conclusions

Based on the obtained results, the following conclusions can be drawn:
Mixed Ce-Pr oxides of cubic fluorite structure prepared via direct calcination exhibit a large population of oxygen vacancies. The associated high non-stoichiometry values estimated from TPD-O2 in an inert atmosphere, (which is slightly increased under an H2 atmosphere, depending on the catalyst formulation), are strongly dependent on the Pr content (as the Pr content increases, the reducibility increases). Specifically, an increase in Pr content correlates with enhanced oxide reducibility. Conversely, pure ceria presents a very poor oxygen delivery capacity.
The order of catalytic activity shown by the oxides is very sensitive to the mode of contact. A high oxygen delivery capacity at low temperatures is a determinant to explain the activity under loose contact mode. Conversely, BET surface area seems to play a role when explaining the soot combustion activity, especially at medium temperatures, under tight contact mode.
In a loose contact situation (in addition to the replenishment of gaseous O2 for regeneration of surface-active oxygen), subsurface and/or bulk diffusion of oxygen from the lattice sites also become an important pathway, resulting in increased activity of Pr-doped ceria under O2 in comparison to undoped CeO2. A temperature of 653 ℃ was needed to achieve 50% soot oxidation in the uncatalyzed process, whereas the presence of Ce0.3Pr0.7O2 and Ce0.2Pr0.8O2, dramatically decreased the T50% to much lower temperatures, even under loose contact conditions. Specifically, the 50% conversion was achieved at 511 ℃ and 538 ℃ for Ce0.3Pr0.7O2 and Ce0.2Pr0.8O2, respectively, revealing the satisfactory performances of these formulations under loose contact mode.
Although the catalytic activity for the Ce-Pr oxide catalysts does not correlate directly with the work function, a relationship has been observed between the work function values and the formation of oxygen vacancies under the two tested atmospheres (He and H2). This strongly suggests that for praseodymia-based catalysts the formation of reactive oxygen species on the surface via electron transfer is not of primary importance and the soot combustion is dominated by the Mars-van Krevelen mechanistic pathway.

Supplementary Materials

The following supporting information can be downloaded at the website of this paper posted on Preprints.org, Figure S1: XPS spectra of: a) Pr 3d and b) Ce3d; Figure S2: Bevan cluster in MO2-x oxides of fluorite structure.

Author Contributions

Conceptualization, A.G.G. and I.M.; methodology, I.M, G.G. and A.G.G.; validation, A.G.G. and I.M.; formal analysis, I.M., A.G.G., G.G., A.K.; investigation, I.M and A.G.G..; resources, A.G.G., A.K.; data curation, I.M; writing—original draft preparation, I.M and A.G.G; writing—review and editing, A.G.G., I.M., A.K.; visualization, I.M.; supervision, A.G.G, G.G. and A.K.; project administration, A.G.G.; funding acquisition, A.G.G, A.K. All authors have read and agreed to the published version of the manuscript.

Funding

This research was funded by the financial support of Generalitat Valenciana (CIPROM/2021/070 project) and the Spanish Ministry of Science and Innovation/Research Spanish Agency (PID2019-105542RB-I00 /AEI/10.13039/501100011033 project) and the UE-FEDER funding. I.M. acknowledges Algerian Ministry of Higher Education and Scientific Research for the financial support through the national grant.

Acknowledgments

The authors acknowledge Technical Services of University of Alicante for conducting some characterization tests (XRD, Raman Spectroscopy and XPS analysis), and the Jagiellonian University of Krakow for hosting and supporting the work during the internship.

Conflicts of Interest

The authors declare no conflict of interest.

References

  1. Nakagoshi, Y.; Mori, K.; Tanaka, K.; Furuta, Y.; Aoki, T.; Yoshioka, F.; Kato, K. New Generation Diesel Particulate Filter for Future Euro7 Regulation; SAE International: Warrendale, PA, 2023. [Google Scholar]
  2. Commission Proposes New Euro 7 Standards. Available online: https://ec.europa.eu/commission/presscorner/detail/en/ip_22_6495 (accessed on 15 November 2023).
  3. Lou, D.; Chen, Y.; Zhang, Y.; Wan, P.; Tan, P.; Hu, Z.; Fang, L.; Wang, T. Study on Soot Oxidation Characteristics of Ce and La Modified Pt-Pd CDPF Catalysts; SAE International: Warrendale, PA, 2023; 01-0390. [Google Scholar]
  4. Yu, D.; Yu, X.; Zhang, C.; Wang, L.; Fan, X.; Zhao, Z.; Wei, Y.; Liu, J.; Gryboś, J.; Leszczyński, B.; et al. Layered Na2Mn3O7 Decorated by Cerium as the Robust Catalysts for Efficient Low Temperature Soot Combustion. Appl. Catal. B Environ. 2023, 338, 123022. [Google Scholar] [CrossRef]
  5. Euro 7: MEPs back new rules to reduce road transport emissions | Nyheter | Europaparlamentet. Available online: https://www.europarl.europa.eu/news/sv/press-room/20231009IPR06746/euro-7-meps-back-new-rules-to-reduce-road-transport-emissions (accessed on 31 October 2023).
  6. Nain Singh, G.; Singh Bharj, R. Experimental Study of Filtration Behavior of Diesel Particulate Filter in a Diesel Engine to Meet BS-VI Emission Norms in INDIA. J. Phys. Conf. Ser. 2019, 1276, 012078. [Google Scholar] [CrossRef]
  7. Serve, A.; Boreave, A.; Cartoixa, B.; Pajot, K.; Vernoux, P. Synergy between Ag Nanoparticles and Yttria-Stabilized Zirconia for Soot Oxidation. Appl. Catal. B Environ. 2019, 242, 140–149. [Google Scholar] [CrossRef]
  8. Zhang, C.; Yu, D.; Peng, C.; Wang, L.; Yu, X.; Wei, Y.; Liu, J.; Zhao, Z. Research Progress on Preparation of 3DOM-Based Oxide Catalysts and Their Catalytic Performances for the Combustion of Diesel Soot Particles. Appl. Catal. B Environ. 2022, 319, 121946. [Google Scholar] [CrossRef]
  9. Di Sarli, V.; Landi, G.; Lisi, L.; Saliva, A.; Di Benedetto, A. Catalytic Diesel Particulate Filters with Highly Dispersed Ceria: Effect of the Soot-Catalyst Contact on the Regeneration Performance. Appl. Catal. B Environ. 2016, 197, 116–124. [Google Scholar] [CrossRef]
  10. Lisi, L.; Landi, G.; Di Sarli, V. The Issue of Soot-Catalyst Contact in Regeneration of Catalytic Diesel Particulate Filters: A Critical Review. Catalysts 2020, 10, 1307. [Google Scholar] [CrossRef]
  11. Andana, T.; Piumetti, M.; Bensaid, S.; Russo, N.; Fino, D.; Pirone, R. Nanostructured Ceria-Praseodymia Catalysts for Diesel Soot Combustion. Appl. Catal. B Environ. 2016, 197, 125–137. [Google Scholar] [CrossRef]
  12. Guillén-Hurtado, N.; Giménez-Mañogil, J.; Martínez-Munuera, J.C.; Bueno-López, A.; García-García, A. Study of Ce/Pr Ratio in Ceria-Praseodymia Catalysts for Soot Combustion under Different Atmospheres. Appl. Catal. Gen. 2020, 590, 117339. [Google Scholar] [CrossRef]
  13. Giménez-Mañogil, J.; Guillén-Hurtado, N.; Fernández-García, S.; Chen, X.; Calvino-Gámez, J.J.; García-García, A. Ceria-Praseodymia Mixed Oxides: Relationships Between Redox Properties and Catalytic Activities Towards NO Oxidation to NO2 and CO-PROX Reactions. Top. Catal. 2016, 59, 1065–1070. [Google Scholar] [CrossRef]
  14. Martínez-Munuera, J.C.; Zoccoli, M.; Giménez-Mañogil, J.; García-García, A. Lattice Oxygen Activity in Ceria-Praseodymia Mixed Oxides for Soot Oxidation in Catalysed Gasoline Particle Filters. Appl. Catal. B Environ. 2019, 245, 706–720. [Google Scholar] [CrossRef]
  15. Laachir, A.; Perrichon, V.; Badri, A.; Lamotte, J.; Catherine, E.; Lavalley, J.C.; Fallah, J.E.; Hilaire, L.; Normand, F.L.; Quéméré, E.; et al. Reduction of CeO2 by Hydrogen. Magnetic Susceptibility and Fourier-Transform Infrared, Ultraviolet and X-Ray Photoelectron Spectroscopy Measurements. J. Chem. Soc. Faraday Trans. 1991, 87, 1601–1609. [Google Scholar] [CrossRef]
  16. Borchert, H.; Frolova, Y.V.; Kaichev, V.V.; Prosvirin, I.P.; Alikina, G.M.; Lukashevich, A.I.; Zaikovskii, V.I.; Moroz, E.M.; Trukhan, S.N.; Ivanov, V.P.; et al. Electronic and Chemical Properties of Nanostructured Cerium Dioxide Doped with Praseodymium. J. Phys. Chem. B 2005, 109, 5728–5738. [Google Scholar] [CrossRef]
  17. Legutko, P.; Stelmachowski, P.; Yu, X.; Zhao, Z.; Sojka, Z.; Kotarba, A. Catalytic Soot Combustion─General Concepts and Alkali Promotion. ACS Catal. 2023, 13, 3395–3418. [Google Scholar] [CrossRef]
  18. Ruiz, M.L.; Lick, I.D.; Ponzi, M.I.; Castellón, E.R.; Jiménez-López, A.; Ponzi, E.N. Thermal Decomposition of Supported Lithium Nitrate Catalysts. Thermochim. Acta 2010, 1–2, 21–26. [Google Scholar] [CrossRef]
  19. Rajendran, M.; Mallick, K.K.; Bhattacharya, A.K. Combustion Synthesis, Powder Characteristics and Crystal Structure of Phases in Ce-Pr-O System. J. Mater. Sci. 1998, 33, 5001–5006. [Google Scholar] [CrossRef]
  20. Frizon, V.; Bassat, J.-M.; Pollet, M.; Durand, E.; Hernandez, J.; Pajot, K.; Vernoux, P.; Demourgues, A. Tuning the Pr Valence State To Design High Oxygen Mobility, Redox and Transport Properties in the CeO2–ZrO2–PrOx Phase Diagram. J. Phys. Chem. C 2019, 123, 6351–6362. [Google Scholar] [CrossRef]
  21. Fahed, S.; Pointecouteau, R.; Aouine, M.; Boréave, A.; Gil, S.; Meille, V.; Bazin, P.; Toulemonde, O.; Demourgues, A.; Daturi, M.; et al. Pr-Rich Cerium-Zirconium-Praseodymium Mixed Oxides for Automotive Exhaust Emission Control. Appl. Catal. Gen. 2022, 644, 118800. [Google Scholar] [CrossRef]
  22. McBride, J.R.; Hass, K.C.; Poindexter, B.D.; Weber, W.H. Raman and X-Ray Studies of Ce1-xRExO2-y, Where RE=La, Pr, Nd, Eu, Gd, and Tb. J. Appl. Phys. 1994, 76, 2435–2441. [Google Scholar] [CrossRef]
  23. Krishna, K.; Bueno-López, A.; Makkee, M.; Moulijn, J.A. Potential Rare Earth Modified CeO2 Catalysts for Soot Oxidation: I. Characterisation and Catalytic Activity with O2. Appl. Catal. B Environ. 2007, 75, 189–200. [Google Scholar] [CrossRef]
  24. Giménez-Mañogil, J.; Guillén-Hurtado, N.; Fernández-García, S.; Chen, X.; Calvino-Gámez, J.J.; García-García, A. Ceria-Praseodymia Mixed Oxides: Relationships Between Redox Properties and Catalytic Activities Towards NO Oxidation to NO2 and CO-PROX Reactions. Top. Catal. 2016, 59, 1065–1070. [Google Scholar] [CrossRef]
  25. Luo, M.F.; Yan, Z.L.; Jin, L.Y.; He, M. Raman Spectroscopic Study on the Structure in the Surface and the Bulk Shell of CexPr1-xO2-δ Mixed Oxides. J. Phys. Chem. B 2006, 110, 13068–13071. [Google Scholar] [CrossRef]
  26. Reddy, B.M.; Thrimurthulu, G.; Katta, L.; Yamada, Y.; Park, S.E. Structural Characteristics and Catalytic Activity of Nanocrystalline Ceria-Praseodymia Solid Solutions. J. Phys. Chem. C 2009, 113, 15882–15890. [Google Scholar] [CrossRef]
  27. Sutradhar, N.; Sinhamahapatra, A.; Pahari, S.; Jayachandran, M.; Subramanian, B.; Bajaj, H.C.; Panda, A.B. Facile Low-Temperature Synthesis of Ceria and Samarium-Doped Ceria Nanoparticles and Catalytic Allylic Oxidation of Cyclohexene. 2011, 7628–7637. [CrossRef]
  28. Carlos, J.; Munuera, M. Ceria-Based Catalysts for Exhaust Aftertreatment Systems in Last Generation Diesel and Gasoline Engines. Ph.D. Thesis, University of Alicante, Alicante, Spain, 2022. [Google Scholar]
  29. Andana, T.; Piumetti, M.; Bensaid, S.; Veyre, L.; Thieuleux, C.; Russo, N.; Fino, D.; Quadrelli, E.A.; Pirone, R. Nanostructured Equimolar Ceria-Praseodymia for NOx-Assisted Soot Oxidation: Insight into Pr Dominance over Pt Nanoparticles and Metal–Support Interaction. Appl. Catal. B Environ. 2018, 226, 147–161. [Google Scholar] [CrossRef]
  30. Fan, L.; Xi, K.; Zhou, Y.; Zhu, Q.; Chen, Y.; Lu, H. Design Structure for CePr Mixed Oxide Catalysts in Soot Combustion. RSC Adv. 2017, 7, 20309–20319. [Google Scholar] [CrossRef]
  31. Ballauri, S.; Sartoretti, E.; Hu, M.; D’Agostino, C.; Ge, Z.; Wu, L.; Novara, C.; Giorgis, F.; Piumetti, M.; Fino, D.; et al. Praseodymium Doping in Ceria-Supported Palladium Nanocatalysts as an Effective Strategy to Minimize the Inhibiting Effects of Water during Methane Oxidation. Appl. Catal. B Environ. 2023, 320, 121898. [Google Scholar] [CrossRef]
  32. Sinev, M.Yu.; Graham, G.W.; Haack, L.P.; Shelef, M. Kinetic and Structural Studies of Oxygen Availability of the Mixed Oxides Pr1-xMxOy (M = Ce, Zr). J. Mater. Res. 1996, 11, 1960–1971. [Google Scholar] [CrossRef]
  33. Liu, S.; Wu, X.; Liu, W.; Chen, W.; Ran, R.; Li, M.; Weng, D. Soot Oxidation over CeO2 and Ag/CeO2: Factors Determining the Catalyst Activity and Stability during Reaction. J. Catal. 2016, 337, 188–198. [Google Scholar] [CrossRef]
  34. Atribak, I.; Bueno-López, A.; García-García, A.; Azambre, B. Contributions of Surface and Bulk Heterogeneities to the NO Oxidation Activities of Ceria-Zirconia Catalysts with Composition Ce0.76Zr 0.24O2 Prepared by Different Methods. Phys. Chem. Chem. Phys. 2010, 12, 13770–13779. [Google Scholar] [CrossRef] [PubMed]
  35. Huang, W. Hydrothermal Synthesis and Properties of Terbium- or Praseodymium-Doped Ce1−xSmxO2−x/2 Solid Solutions. Solid State Ion. 1998, 113–115, 305–310. [Google Scholar] [CrossRef]
  36. Knauth, P.; Tuller, H.L. How Unique Are the Microstructure and the Electrical Properties of Nanocrystalline Ceramics? 1999; Volume 548, pp. 429–442. [Google Scholar]
  37. Koichiro Harada†, Tetsuya Oishi‡, Seiji Hamamoto‡, and Tatsumi Ishihara Lattice Oxygen Activity in Pr- and La-Doped CeO2 for Low-Temperature Soot Oxidation.The Journal of Physical Chemistry C Available online:. [CrossRef]
  38. Madier, Y.; Descorme, C.; Le Govic, A.M.; Duprez, D. Oxygen Mobility in CeO2 and CexZr(1-x)O2 Compounds:  Study by CO Transient Oxidation and 18O/16O Isotopic Exchange. J. Phys. Chem. B 1999, 103, 10999–11006. [Google Scholar] [CrossRef]
  39. Logan, A.D.; Shelef, M. Oxygen Availability in Mixed Cerium/Praseodymium Oxides and the Effect of Noble Metals. J. Mater. Res. 1994, 9, 468–475. [Google Scholar] [CrossRef]
  40. Letichevsky, S.; Tellez, C.A.; Avillez, R.R.D.; Silva, M.I.P.D.; Fraga, M.A.; Appel, L.G. Obtaining CeO2–ZrO2 Mixed Oxides by Coprecipitation: Role of Preparation Conditions. Appl. Catal. B Environ. 2005, 58, 203–210. [Google Scholar] [CrossRef]
  41. Trovarelli, A.; Boaro, M.; Rocchini, E.; De Leitenburg, C.; Dolcetti, G. Some Recent Developments in the Characterization of Ceria-Based Catalysts. J. Alloys Compd. 2001, 323–324, 584–591. [Google Scholar] [CrossRef]
  42. Rao, C.N.R.; Gopalakrishnan, J. New Directions in Solid State Chemistry; Cambridge University Press, 1997; ISBN 978-0-521-49559-2. [Google Scholar]
  43. Aneggi, E.; Llorca, J.; Trovarelli, A.; Aouine, M.; Vernoux, P. In Situ Environmental HRTEM Discloses Low Temperature Carbon Soot Oxidation by Ceria–Zirconia at the Nanoscale. Chem. Commun. 2019, 55, 3876–3878. [Google Scholar] [CrossRef] [PubMed]
  44. Chen, Y.; Shen, G.; Lang, Y.; Chen, R.; Jia, L.; Yue, J.; Shen, M.; Du, C.; Shan, B. Promoting Soot Combustion Efficiency by Strengthening the Adsorption of NOx on the 3DOM Mullite Catalyst. J. Catal. 2020, 384, 96–105. [Google Scholar] [CrossRef]
  45. Guillén-Hurtado, N.; Bueno-López, A.; García-García, A. Catalytic Performances of Ceria and Ceria-Zirconia Materials for the Combustion of Diesel Soot under NO x/O 2 and O 2. Importance of the Cerium Precursor Salt. Appl. Catal. Gen. 2012, 437–438, 166–172. [Google Scholar] [CrossRef]
  46. Aneggi, E.; de Leitenburg, C.; Trovarelli, A. On the Role of Lattice/Surface Oxygen in Ceria–Zirconia Catalysts for Diesel Soot Combustion. Catal. Today 2012, 181, 108–115. [Google Scholar] [CrossRef]
  47. Serve, A.; Boreave, A.; Cartoixa, B.; Pajot, K.; Vernoux, P. Impact of the Support on the Catalytic Activity of Ag Nanoparticles for Soot Combustion. Catal. Today 2021, 363, 93–104. [Google Scholar] [CrossRef]
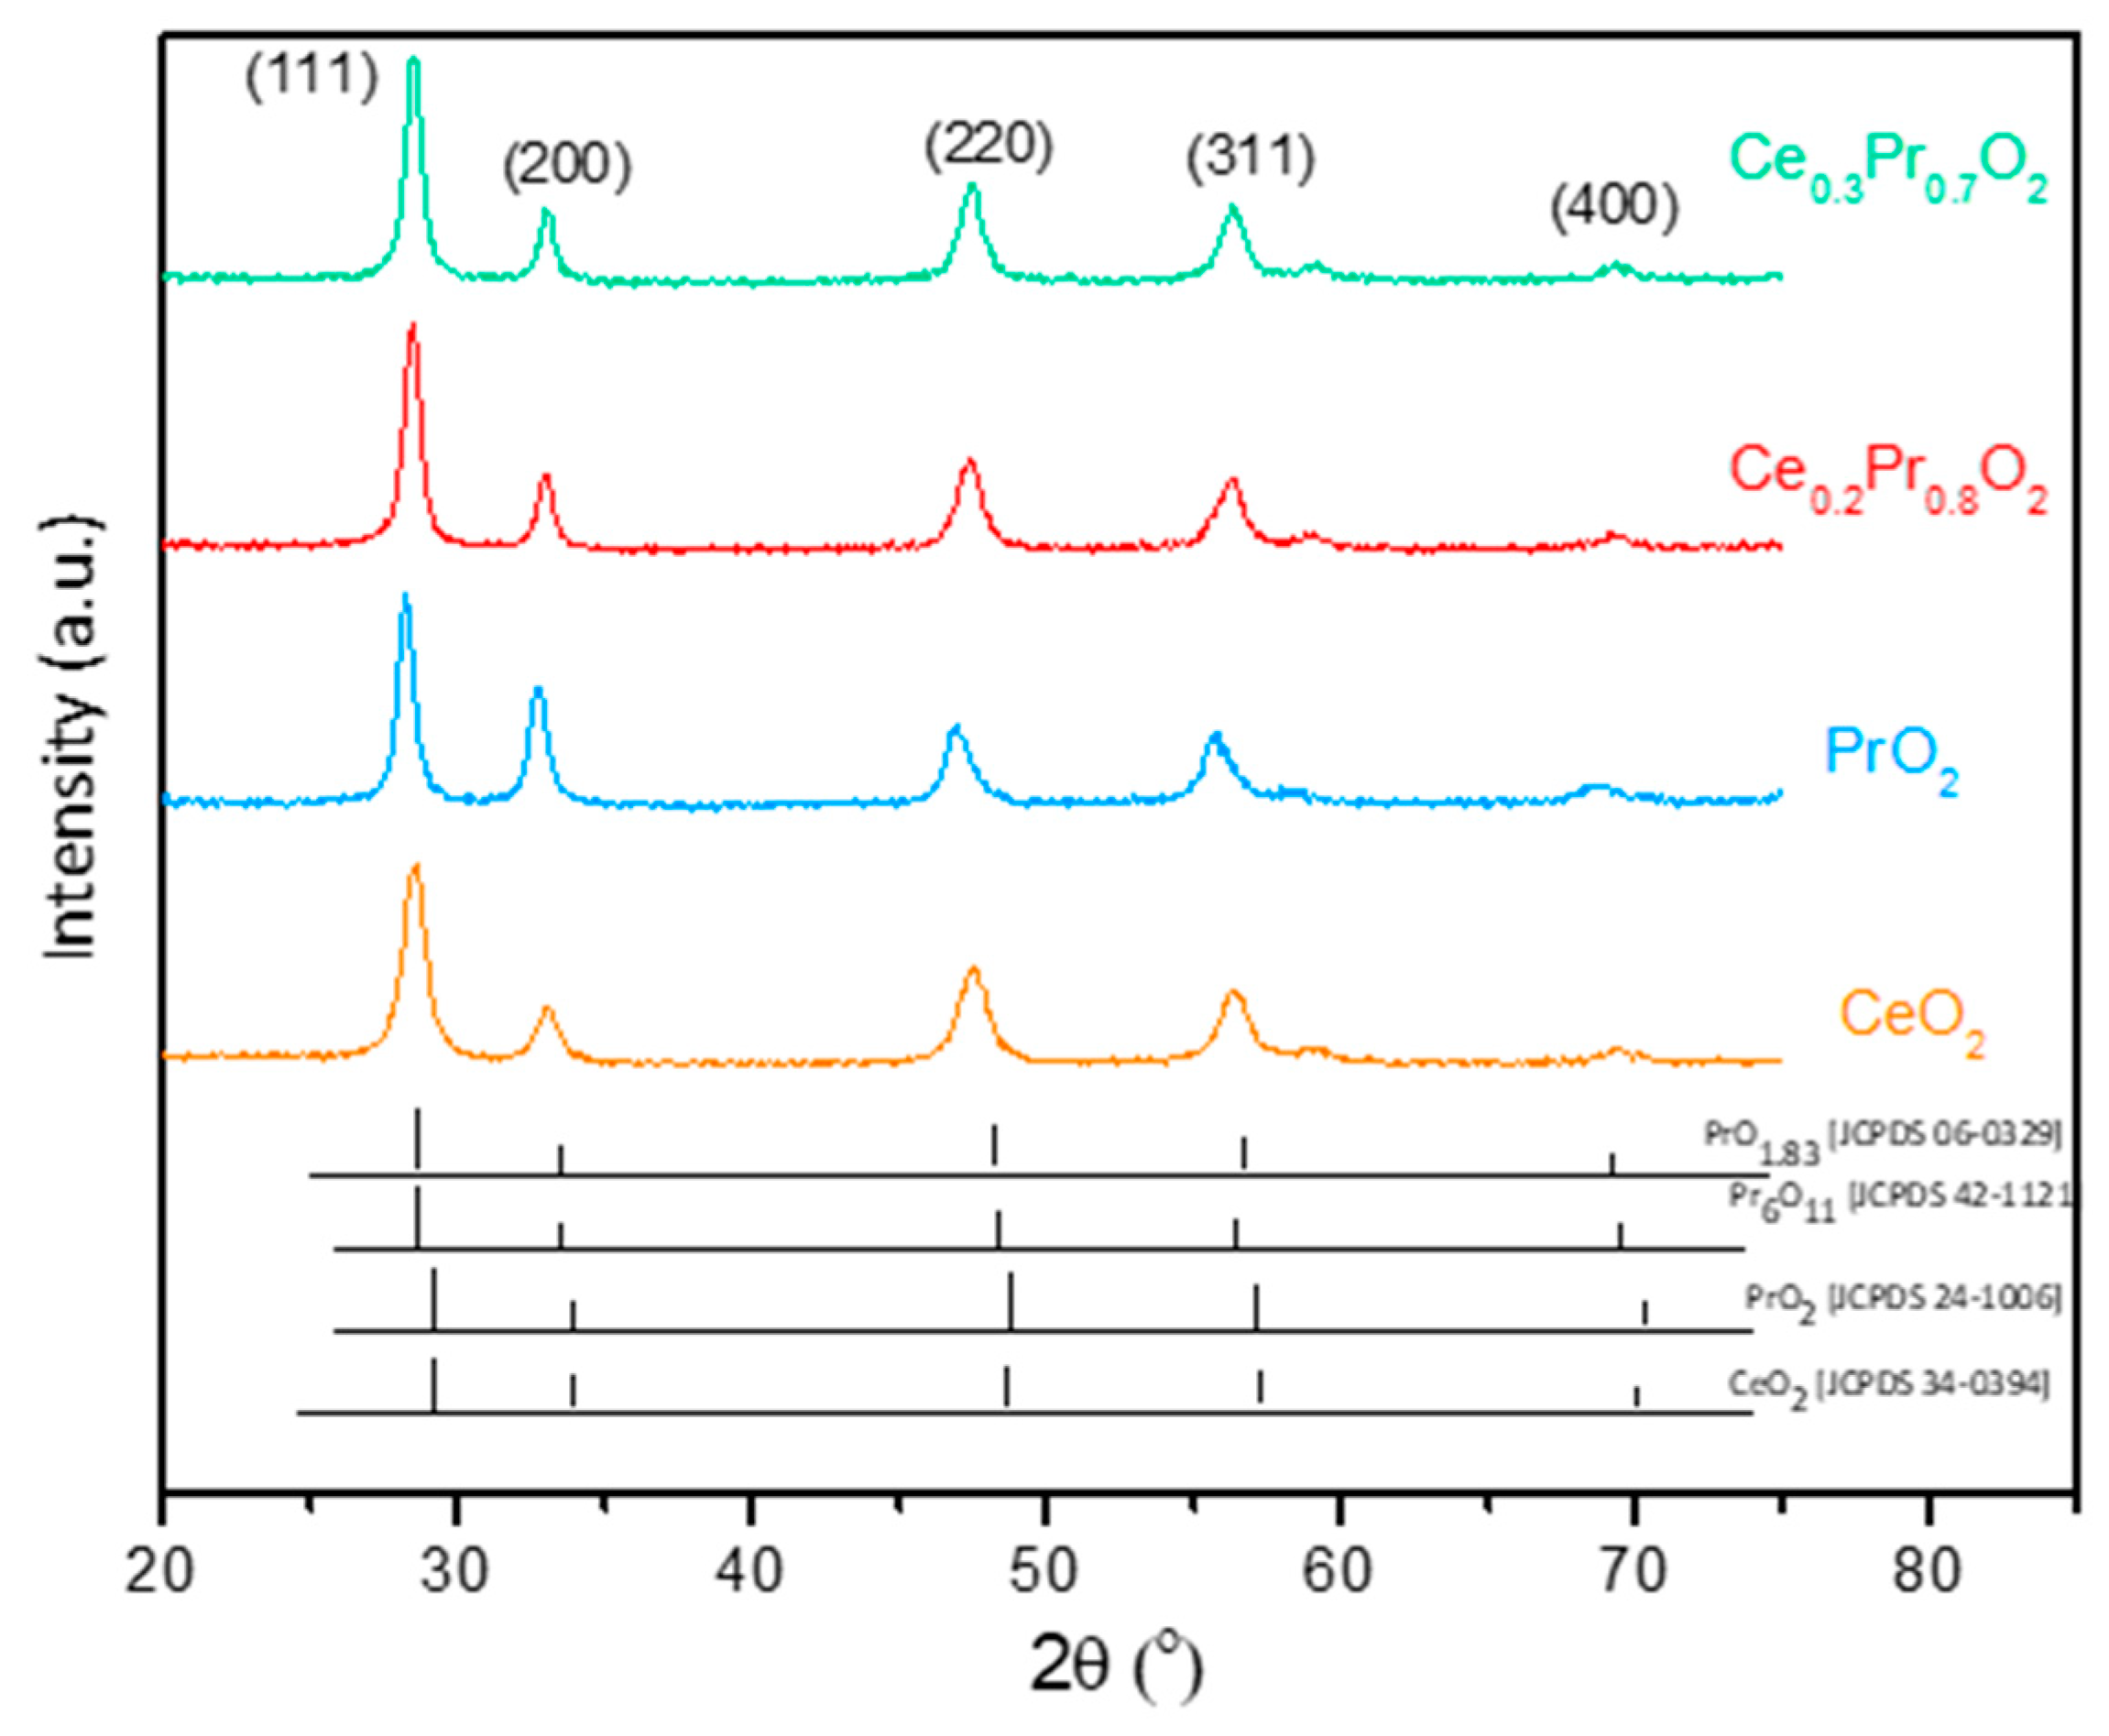
Figure 1. X-ray diffractograms of the investigated catalysts together with the corresponding references.
Preprints 98995 g001
Figure 2. Raman spectra of the investigated Pr-containing catalysts.
Preprints 98995 g002
Figure 3. Representative TEM (a1, b1, c1 and d1), HR TEM (a2, b2, c2, d2), and HAADF-EDX (a3-d3 and a4-d5) analysis for the investigated catalysts: (a1-a5) for CeO2, for PrO2 (b1-b5), (c1-c5) for Ce0.2Pr0.8O2 and (d1-d5) for Ce0.3Pr0.7O2.
Preprints 98995 g003
Figure 4. (a) O2-TPD and (b) H2 -TPR profiles of the catalysts.
Preprints 98995 g004
Figure 5. Oxygen delivery capacity, expressed as the amount of oxygen vacancies formed under different atmospheres, versus Pr loading (along with estimated δ values for every catalyst).
Preprints 98995 g005
Figure 7. Evolution of soot combustion rates versus soot conversion values along the experiments conducted under tight contact mode (the values of temperature for every catalyst are referred to as the 10% of conversion).
Preprints 98995 g007
Figure 8. Soot conversion curves (under loose contact) as a function of temperature for all the catalysts (including uncatalyzed reaction, for comparison purposes).
Preprints 98995 g008
Figure 9. Evolution of soot combustion rates versus soot conversion values along the experiments conducted under loose contact mode (the values of temperature for every catalyst are referred to as the 10% of conversion).
Preprints 98995 g009
Figure 10. Soot conversion profiles versus temperature under the two contact modes. (Tight contact: solid lines and loose contact: dashed lines): a) CeO2; b) Ce0.3Pr0.7O2; c) Ce0.2Pr0.8O2, and d) PrO2. .
Preprints 98995 g010
Figure 11. Relationship between the total oxygen vacancies generated (measured by O2-TPD and by H2-TPR) and the work function values for the Pr-containing catalysts studied.
Preprints 98995 g011
Figure 12. Catalytic activity data, expressed as temperatures needed to achieve several conversion degrees under both loose (L.C.) and tight contact (T.C.), versus the amount of vacancies determined at low temperatures from O2-TPD (by using the profiles represented in Figure (b)).
Preprints 98995 g012
Table 1. Selected textural and structural parameters of the catalysts.

Sample
Lattice parameter a (nm) Average crystal size (nm)
SBET (m2/g)

Vp
(cm3/g)
F2g band
position
(cm-1)
Intensity ratio of the vacancies band/F2g band
CeO2
Ce0.3Pr0.7O2
Ce0.2Pr0.8O2
PrO2
0.5415
0.5418
0.5420
0.5467
11.1
12.2
12.0
11.5
81
42
31
6
0.221
0.059
0.030
0.012
463.1
438.6
431.8
428.3
-
1.09
1.15
1.20
Table 2. The chemical surface composition of the studied catalysts was determined from XPS results.
Sample Ce (%) Pr (%) O (%) C* (%)
CeO2
Ce0.3Pr0.7O2
Ce0.2Pr0.8O2
PrO2
25.03
4.94
3.52
-
-
14.77
14.98
13.66
55.45
50.02
47.38
43.01
19.50
30.25
34.10
43.31
* High carbon contents due to residual contamination inherent to the measurements, but mostly to surface “carbonation” of the oxides.
Table 3. Surface atomic ratios and oxidation state quantifications from XPS.
Sample Pr+3 (%) Ce+3 (%) Ce/Pr surface Ce/Pr nominal O/(Ce+Pr)
CeO2
Ce0.3Pr0.7O2
Ce0.2Pr0.8O2
PrO2
0.0
48.3
44.9
44.7
36.3
31.1
34.1
0.0
-
0.26
0.23
-
-
0.43
0.25
-
2.21
2.53
2.56
2.67
Table 4. Oxygen released quantifications, (obtained from O2-TPD), and H2 consumption quantifications, (obtained from H2-TPR) for the catalysts studied.
Sample O2 emitted (μmol/gcat) δ1 1formula after reduction H2 consumption (µmol/gcat) δ2 2formula after reduction
CeO2
Ce0.3Pr0.7O2
Ce0.2Pr0.8O2
PrO2
88
671/(322)*
745/(305)*
1045/(287)*
0.03
0.23
0.25
0.36
CeO1.97
Ce0.3Pr0.7 O1.77
Ce0.2Pr0.8O1.74
PrO1.64
779
1530.0
1797.0
2155.6
0.13
0.26
0.31
0.37
CeO1.87
Ce0.3Pr0.7O1.74
Ce0.2Pr0.8O1.69
PrO1.63
*O*Oxygen emitted quantification in parentheses (only first peak).
Disclaimer/Publisher’s Note: The statements, opinions and data contained in all publications are solely those of the individual author(s) and contributor(s) and not of MDPI and/or the editor(s). MDPI and/or the editor(s) disclaim responsibility for any injury to people or property resulting from any ideas, methods, instructions or products referred to in the content.
Copyright: This open access article is published under a Creative Commons CC BY 4.0 license, which permit the free download, distribution, and reuse, provided that the author and preprint are cited in any reuse.
Prerpints.org logo

Preprints.org is a free preprint server supported by MDPI in Basel, Switzerland.

Subscribe

© 2024 MDPI (Basel, Switzerland) unless otherwise stated