Methods
Study Population
The design of the study consists of a case-control population. The case group corresponded to all patients who were admitted to the Long COVID unit between June 2020 and December 2022 (n=341). Patients were diagnosed with the ICD B94.8 code (Sequelae of other specified infectious and parasitic diseases) before the introduction of the U09.9 code for PCC. The only inclusion criteria for the sample under study was for the individual to be over 18 years old, to have a diagnosis of PCC and to reside within the geographic radius of the hospital’s service area, specifically, the North Metropolitan Area of Barcelona (Catalonia, Spain). If the patients fitted the inclusion criteria, they would enter the Long COVID unit and their data would be collected.
The control population was obtained through a matching algorithm from administrative records of the reference. The algorithm is based on a criteria of similarity to the case population by the following variables: sex ratio (approximately 2:1 female-male), age-group (an approximate similarity), and socioeconomic status (based on pharmacy copayments). Having acute COVID or its sequelae was not a criteria for the control population selection, in order to maintain the integrity of the observational study.
The resulting cohort had a size of 49,419 patients: 341 from the case population and 49,078 from the matched case population. Both populations’ use of services was measured from December 2017 to December 2022.
Setting and Location
The study was conducted in the Germans Trias i Pujol Hospital (Spain) and the primary care centres in its area between July 2020 and December 2022. This is the largest monographic Long COVID Unit in Spain. The Long Covid Unit's objective is to diagnose, assess, and rehabilitate individuals suffering from PCC through multidisciplinary care by physicians, nurses, nutritionists and psychologists.
The unit's guidelines outline a structured approach to patient assessment and follow-up. The process begins with an initial visit during which the nursing team develops a care plan, offers health education, and evaluates the patient’s symptoms. A family doctor then conducts further assessments, such as physical examinations and complementary procedures like chest X-rays, spirometry (SpO2), electrocardiograms, fatigue tests, and functional tests.
Up to six weeks after the initial visit, a first follow-up with the family doctor takes place to assess analytical results and functional test ratings. Based on the severity of the condition and results, patients may be referred to infectious diseases specialists, telematic rehabilitation, or hospitals for further evaluation and treatment. During this period, another visit to the nursing team occurs to provide additional health education and continue the rehabilitation plan.
After six weeks, medical attention is provided either remotely through calls, video calls, or on-site, depending on the patient's needs and the progress of rehabilitation. At 12 weeks (3 months), tracking visits are scheduled to monitor the patient's progress and response to treatment, including clinical analysis results, fatigue and functional tests, and overall condition. Based on these evaluations, patients may continue rehabilitation or be referred to higher levels of healthcare for further treatment. At 24 weeks (6 months), a final visit is conducted to conclude the process.
Comparators
The costs of PCC patients were compared both in a retrospective manner (pre and post diagnosis and treatment) and in a case-control setting (in contrast with a comparison population). The retrospective analysis covered a symmetrical 12-month period (six months before and after diagnosis), while the prospective analysis in the control population spanned 12 months.
We also retrospectively compare the use of different services in primary and hospital care, procedures, hospitalizations and emergencies. A case-control comparison in these services would be difficult to measure due to the different orders of magnitude of the sample sizes and the large amount of missing values in the control population.
Perspective
This study employs a societal perspective to estimate the costs produced by post-COVID19 condition patients. The costs of the patient are paid by the hospital, which is then reimbursed by the public insurer (Catalan Health Service), whose financing comes from taxes paid by citizens.
Measurement and Evaluation of Resources and Costs
Supplementary Tables S1 and S2 describe the prices for each form of healthcare resource utilisation. The included resources were primary care visits (in different forms, as specified in the table), outpatient care (first and successive visits of an episode), inpatient care, emergency care and different procedures. Costs were valued per the Catalan Law regulating billable assumptions and concepts and approving the public prices corresponding to the services provided by the Catalan Institute of Health, which acts as a cost catalogue for forms of healthcare resource utilisation [
14].
Patients with PCC visited the hospital and primary care in a structured way over a six-month period after their diagnosis. However, not all visits were related to the structured care plan, as some could be attributed to post-COVID-19 issues or unrelated problems. Some visits included hospital, primary care, and emergency services. Due to the staggered entry of patients into the program, a fixed time-frame for studying visits was not feasible. Instead, a balanced approach was adopted, setting an individual threshold of six months before and after diagnosis for each patient. Visits were recorded individually in the databases, then aggregated by service and patient. This method was used to calculate averages by age-group, sex, and the entire population.
Currency, Price Date, and Conversion
Costs were available in euros, and valued at 2020 prices [
14]. The reporting of this study follows the Consolidated Health Economic Evaluation Reporting Standards (CHEERS) framework for economic evaluations, as recommended by health economists associations [
15].
Statistical Tests
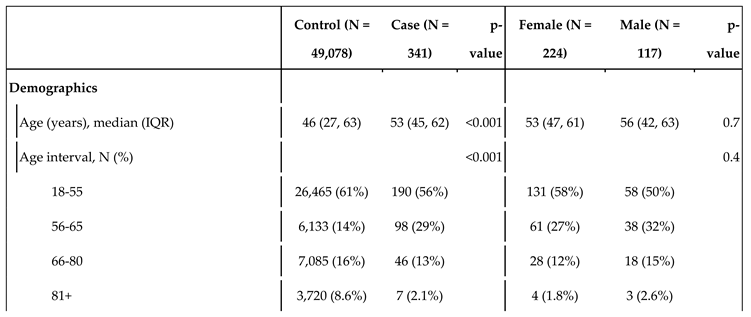
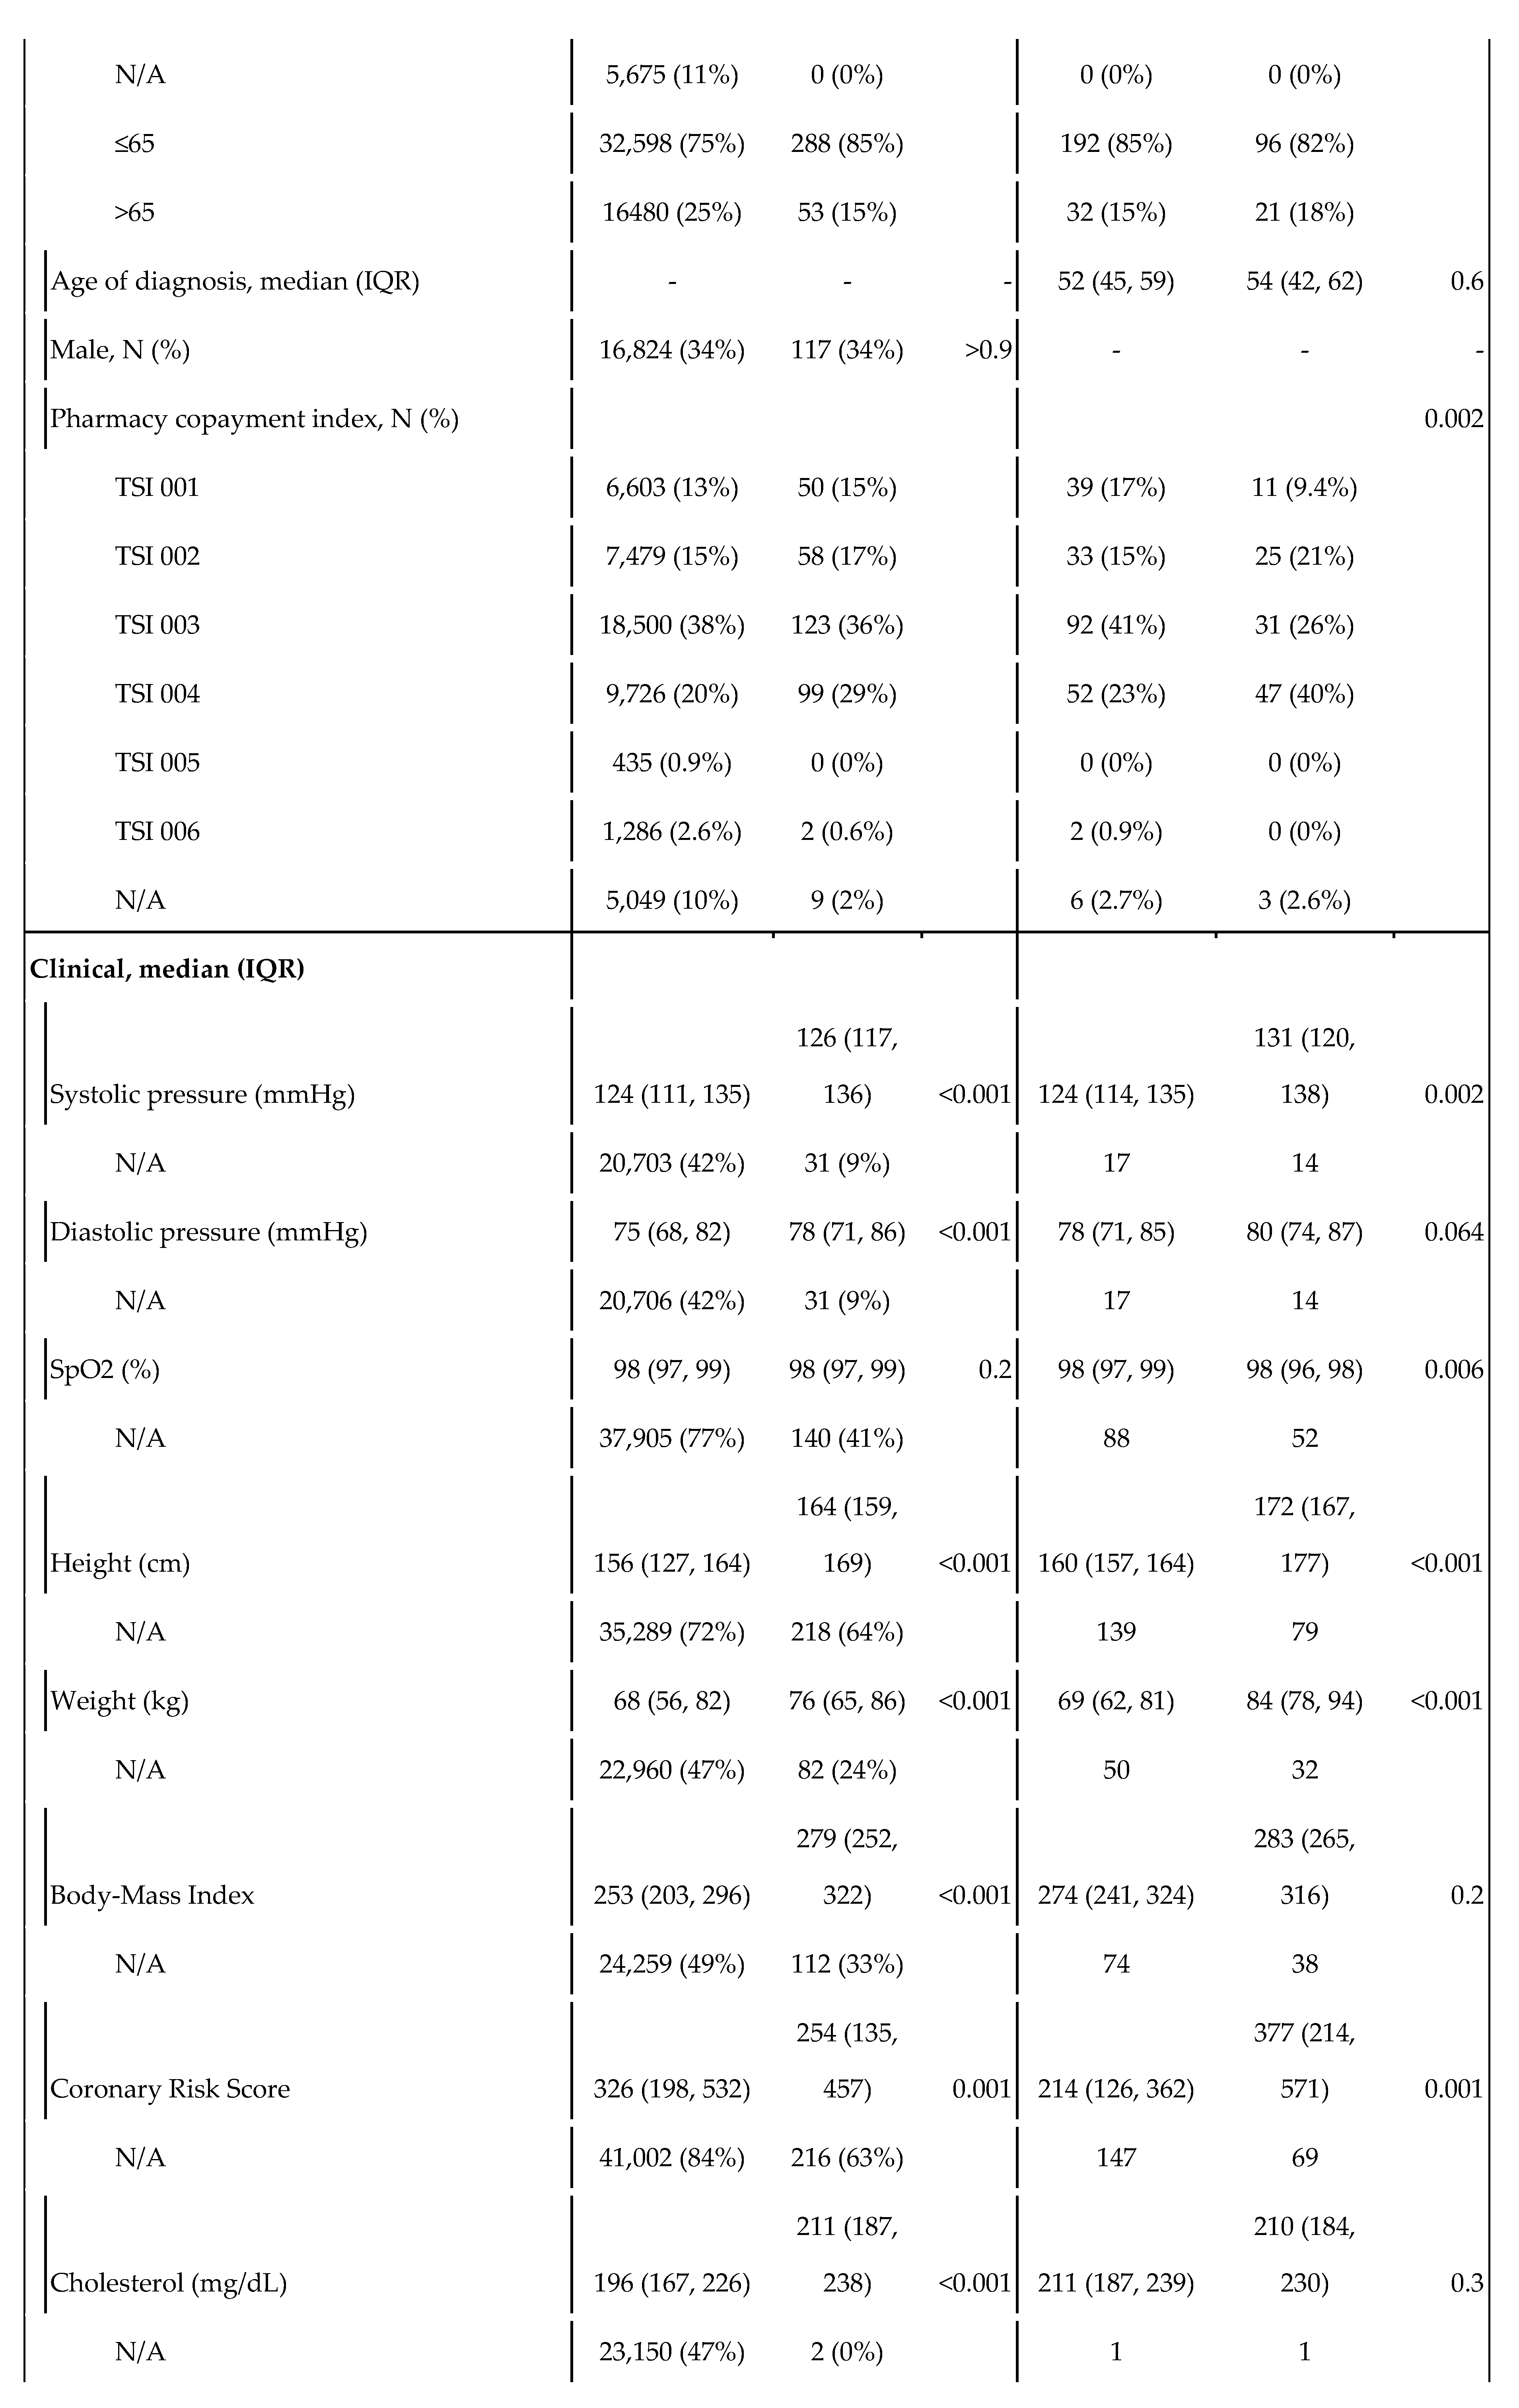
At baseline, demographic and analytical variables were collected for the case population, while the last available value was used for the control population. The median and IQR are used to describe the quantitative variables, while n(%) are used for qualitative variables. The p-value indicates the statistical significance of the difference between the two groups being compared. To test the significance of the differences, we used Wilcoxon, Fisher, Pearson and Kruskal-Wallis tests. Finally, N/A indicates the missing values for each variable. The software R (version 4.2.2) and its packages tidyverse, glmnet, and zoo were used for the data manipulation and statistical analysis [
16,
17,
18,
19].
Role of the Funding Source
Funding for the study was provided through fundraising campaigns organised by the non-profit foundation Fundació Lluita contra les Infeccions, which included "yomecorono.org" and Gala contra les Infeccions, Editions 2021 and 2022. None of the funding sources played a role in the study's design, data collection, data analysis, interpretation of results, or the writing of the report.
Discussion
While survey-based reports of PCC recovery have found high (35%) cure rates [
4,
7] and the PHOSP-COVID cohort had a 29% recovery rate after one year [
20], the study conducted at this Long COVID Unit found that only 7.6% of the total PCC patients experienced recovery [
11]. Regardless of the exact cure rates, Long COVID might have a global impact on clinical and public health as a long-lasting chronic condition, as at least 5% of those afflicted with COVID-19 are expected to suffer from PCC [
1,
2,
3]. As such, it is essential to evaluate the rising costs these patients might bear on the system and to adopt policies to contain such costs.
In this 2-year retrospective economic evaluation we found that post-treatment PCC patients are around 7% less costly than pre-treatment patients in terms of use of healthcare resources. While there is a strong increase in hospital care costs, the rest of services have a reduction in costs, notably hospitalizations and primary care. A possible interpretation is that by redirecting visits towards hospital care, an effective, coordinated, integrated treatment can be provided to the patients and reduce their need to access primary care and the overuse of hospitalizations, emergency services and procedures.
Worryingly, PCC patients, no matter whether before or after treatment nor between sex or age-groups, are nearly four times as costly than the control patients. They are high frequency users, and present important differences in their relationship to the healthcare system and processes. Their use of resources, both before and after, greatly surpasses the baremos established by previous systematic reviews [
21,
22,
23].
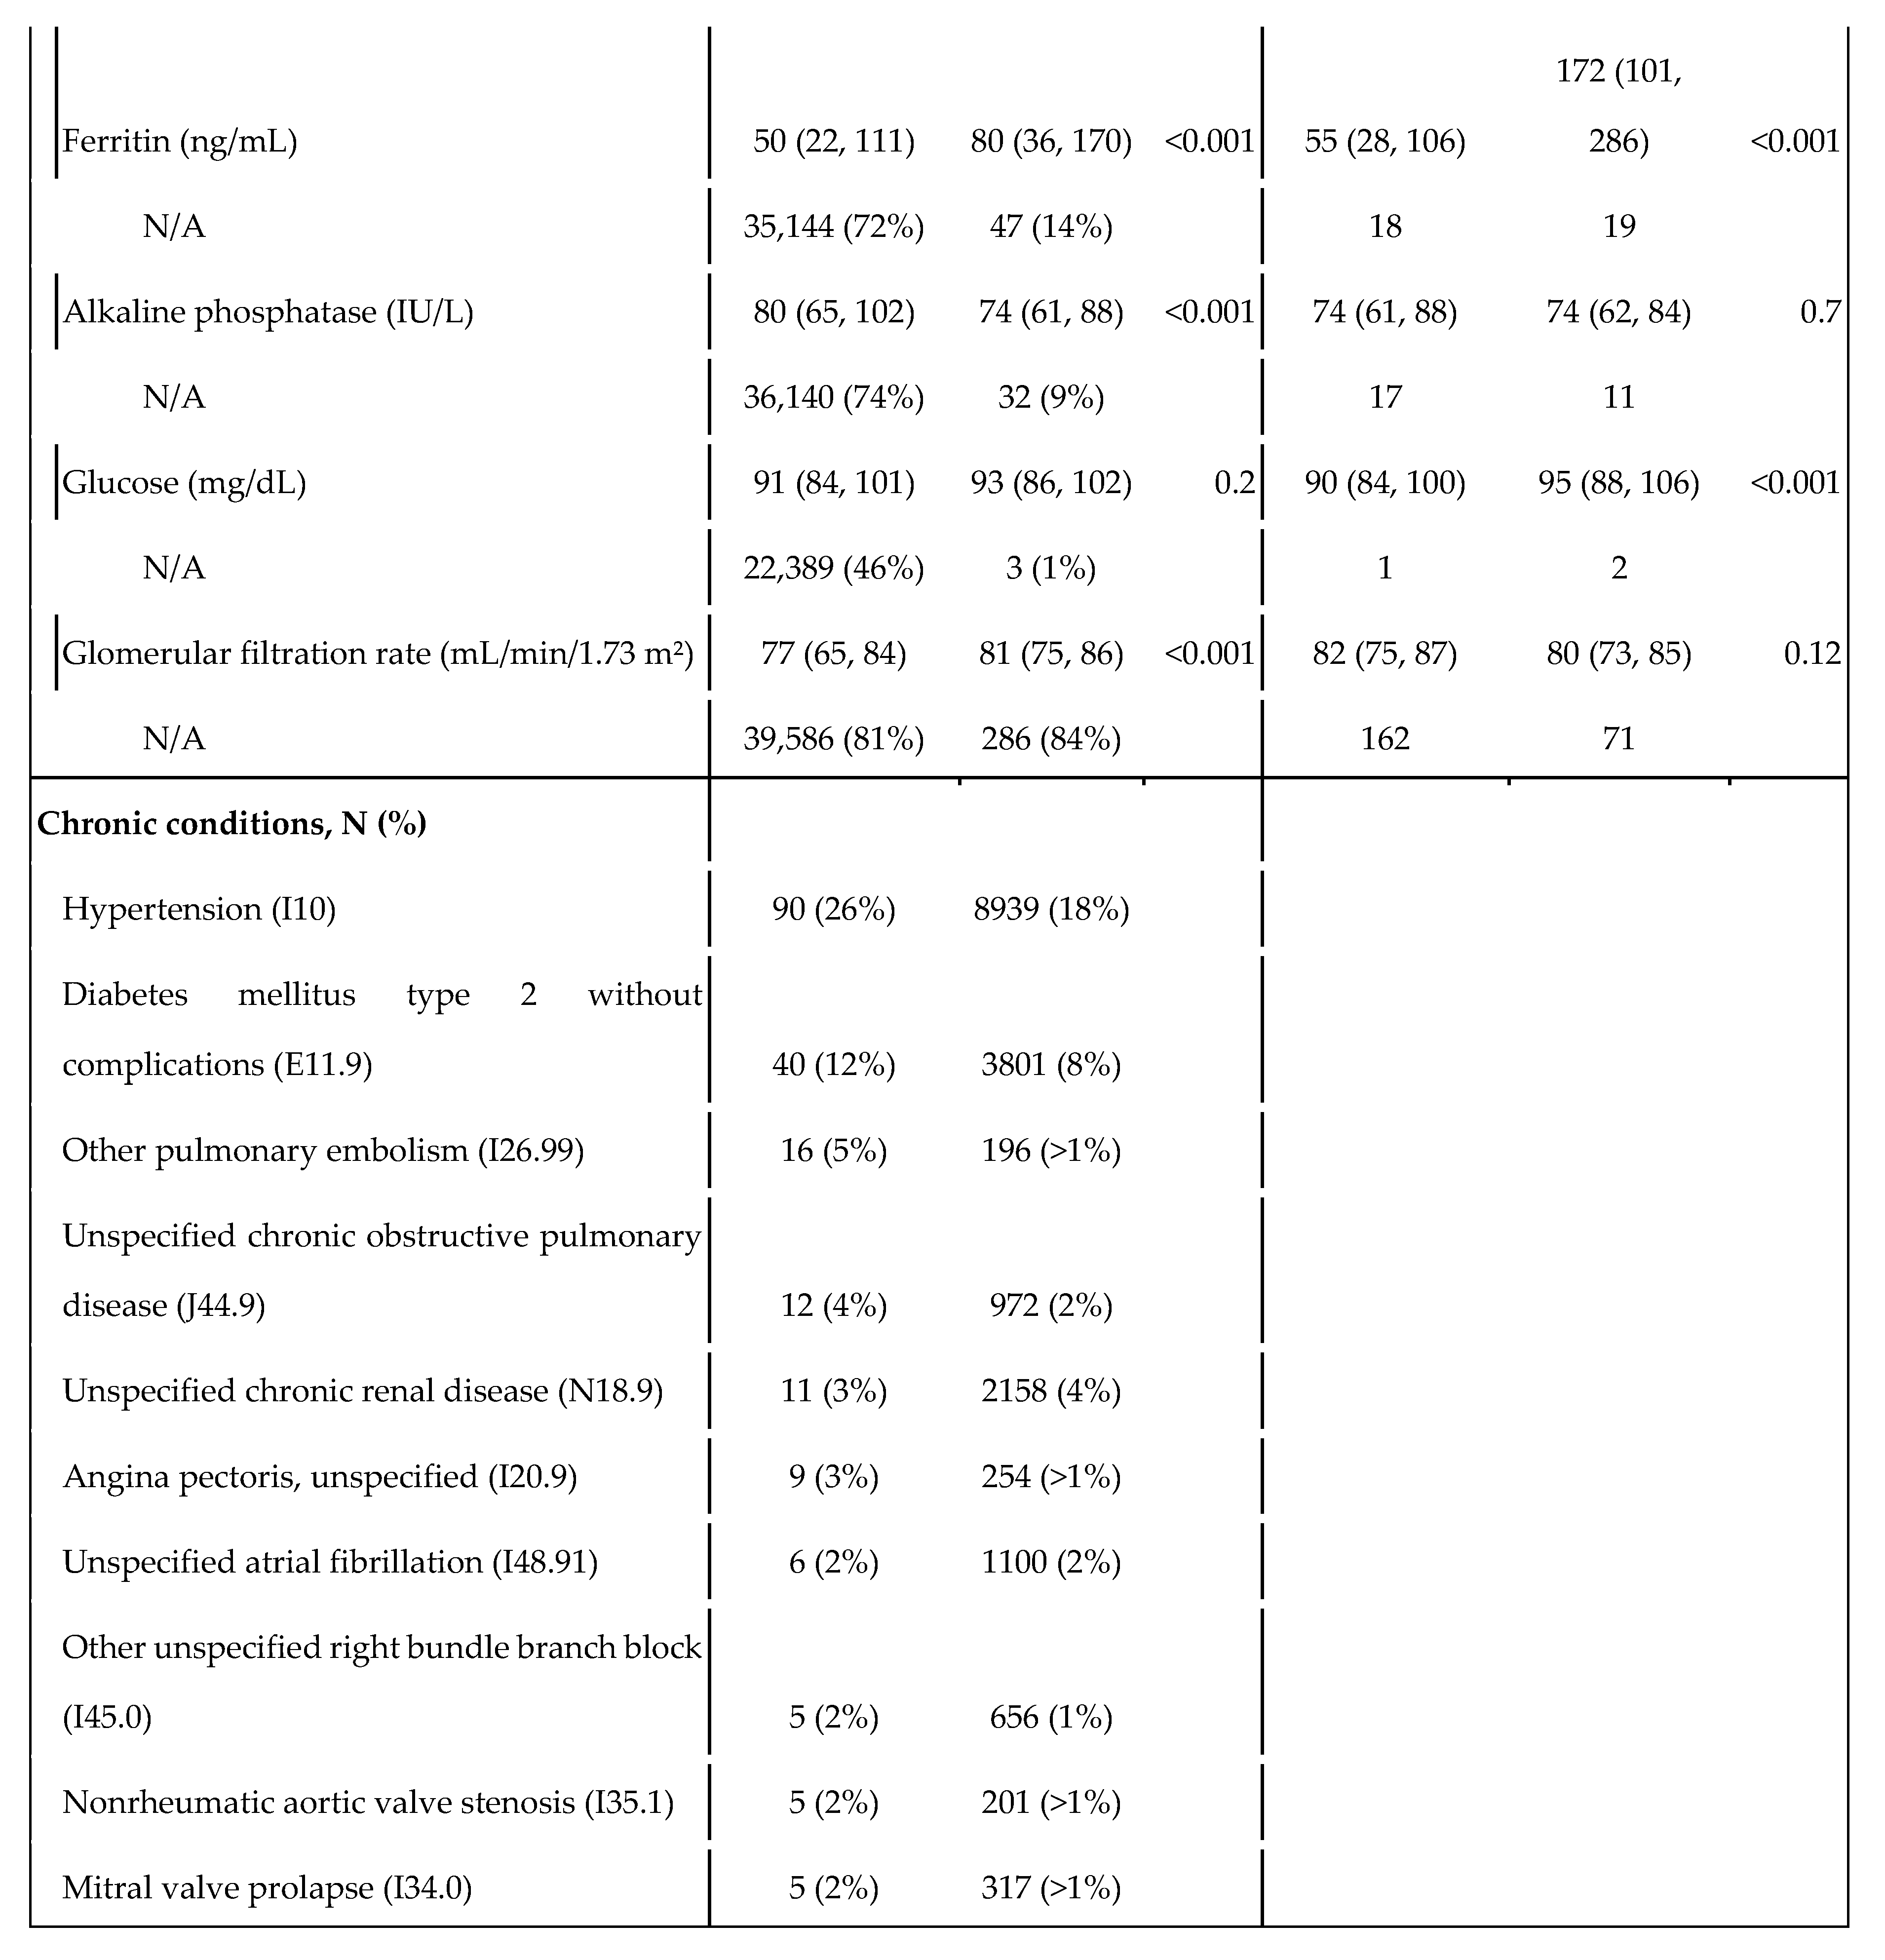
The case population had overrepresented chronic conditions, most of which share certain risk factors or comorbidities, such as cardiovascular disease, obesity, and older age, which are known to increase the risk of PCC [
4,
5,
6,
7,
11,
20]. For example, pulmonary embolism and chronic obstructive pulmonary disease are both associated with impaired lung function and decreased oxygenation, which may contribute to the persistence of COVID-19 symptoms. Similarly, angina pectoris, unspecified atrial fibrillation, mitral valve prolapse, right bundle branch blocks, and nonrheumatic aortic valve stenosis are all cardiovascular conditions that may increase the risk of adverse outcomes in COVID-19 patients.
Consistent with previous evaluations [
24,
25,
26], we found that PCC patients bore more costs on public healthcare compared to those without symptoms, with the population being older, of female sex and with comorbidities. These studies emphasise the financial implications PCC patients have on the healthcare system and the substantial increase in healthcare utilisation and direct medical costs. Other studies have instead focused on production loss and employment subsidies at a national level [
27], specifically focusing on labour supply reduction as a direct result of PCC-induced disabilities [
28,
29,
30], extending the literature on the financial implications of Long COVID beyond medical costs.
Our study, in comparison, aims to cover the reduction in costs associated with tailored, coordinated care. If treatment is structured and redirects visits from primary care, there should be less visits to primary care and other services, as most of these are driven by the patients’ desperation to obtain medical care [
11]. This situation is exacerbated by Spain’s NHS system, where care is free at point of use and demand is only managed through waiting times, which might worsen the patients’ desperation. In this context, cost reduction should not be considered an objective in itself, but rather a secondary effect of tailored treatment. The Unit looks after PCC patients in a more conscious and specific way, and consequently it also avoids potentially irrelevant expenses. As we have presented, a coordinated treatment plan increases outpatient care costs, but reduces utilisation of all other forms of care, and overall reduces the patients’ costs.
Most of our limitations overlap with those of observational studies, notably: (1) the lack of randomization, which forbids us from establishing the causal relationship that the entrance in the care unit leads to less use of healthcare resources, and (2) the constrained reproducibility, as the study is conducted in a natural setting and not in an experimental one. Furthermore, as the case cohort was created early in the pandemic (June 2020), PCC was not fully recognized and there might have been a selection bias favouring severe cases that might make more use of healthcare resources.
Two limitations arose in the data selection. First, that having suffered from COVID or sequelae was not a criteria when selecting the control population, which results in a potential bias of comparing ‘healthy’ citizens to ‘ill’ post-COVID-19 patients. Nonetheless, using an experimental design for treatment would have raised ethical concerns. Second, that some of the visits and hospitalizations during the six months previous to diagnosis in the post-COVID-19 population could be due to COVID-19. These two limitations are in line with those of observational studies in comparison with experimental studies such as RCTs, where these variables could have been controlled.
A final major limitation is the lack of measurement of health outcomes, which could have come in the form of QALYs (in the short term) and DALYs (in the long term). This restricted the evaluation to the form of a cost analysis instead of a full cost-outcome economic evaluation.
The lack of data regarding the prevalence of PCC and other COVID-19 sequelae might underestimate the estimations made regarding the burden these patients bear over the healthcare system. This study provides information regarding their use of healthcare resources and their classification as frequent attenders of care services. Further developments in PCC diagnosis and treatment should center the process around primary care and family doctors to further reduce costs, as early diagnosis of symptoms could improve recovery rates and redirect visits towards a specialized unit. As COVID-19 becomes routinely managed worldwide, its sequelae will have to be tackled in the context of the challenge of chronicity in societies that are undergoing or have undergone epidemiological and demographic transitions. To ensure the sustainability of welfare and healthcare systems, novel forms of care management such as disease management programmes and integrated/coordinated care forms will have to be implemented to depressurize health services off these frequent attenders.
In summary, this study suggests a coordinated form of care for PCC patients is associated with a reduction in costs. Considering the reduction in primary care visits, hospitalizations and use of emergency services, integrated care outperforms usual management for selected PCC patients. The implementation and management of these forms of care will have to be spread in the future to tackle the growing costs and overall burden of chronic patients in European healthcare systems.
Conflicts of Interest
JV was supported by a junior research grant from the Spanish Ministry of Education and received a fellowship from the Ramón Areces Foundation. MM No potential conflicts of interest (NTD). CL has received support for attending meetings from Gilead. SB No potential conflicts of interest (NTD). LR No potential conflicts of interest (NTD). RP has participated in advisory boards for Pfizer, Gilead, MSD, GSK, Atea, Lilly, Roche, Astra-Zeneca, ViiV Healthcare and Theratechnologies, has participated in lectures and seminars funded by Gilead, Pfizer, GSK and AstraZeneca, and has received research funds awarded to his institution from Gilead, Pfizer, and MSD. LM has received grants from Grifols, honoraria as speaker from Astra-Zeneca, Gilead, and Pfizer, and has participated in advisory boards for Gilead and MSD. FL No potential conflicts of interest (NTD).
Figure 1.
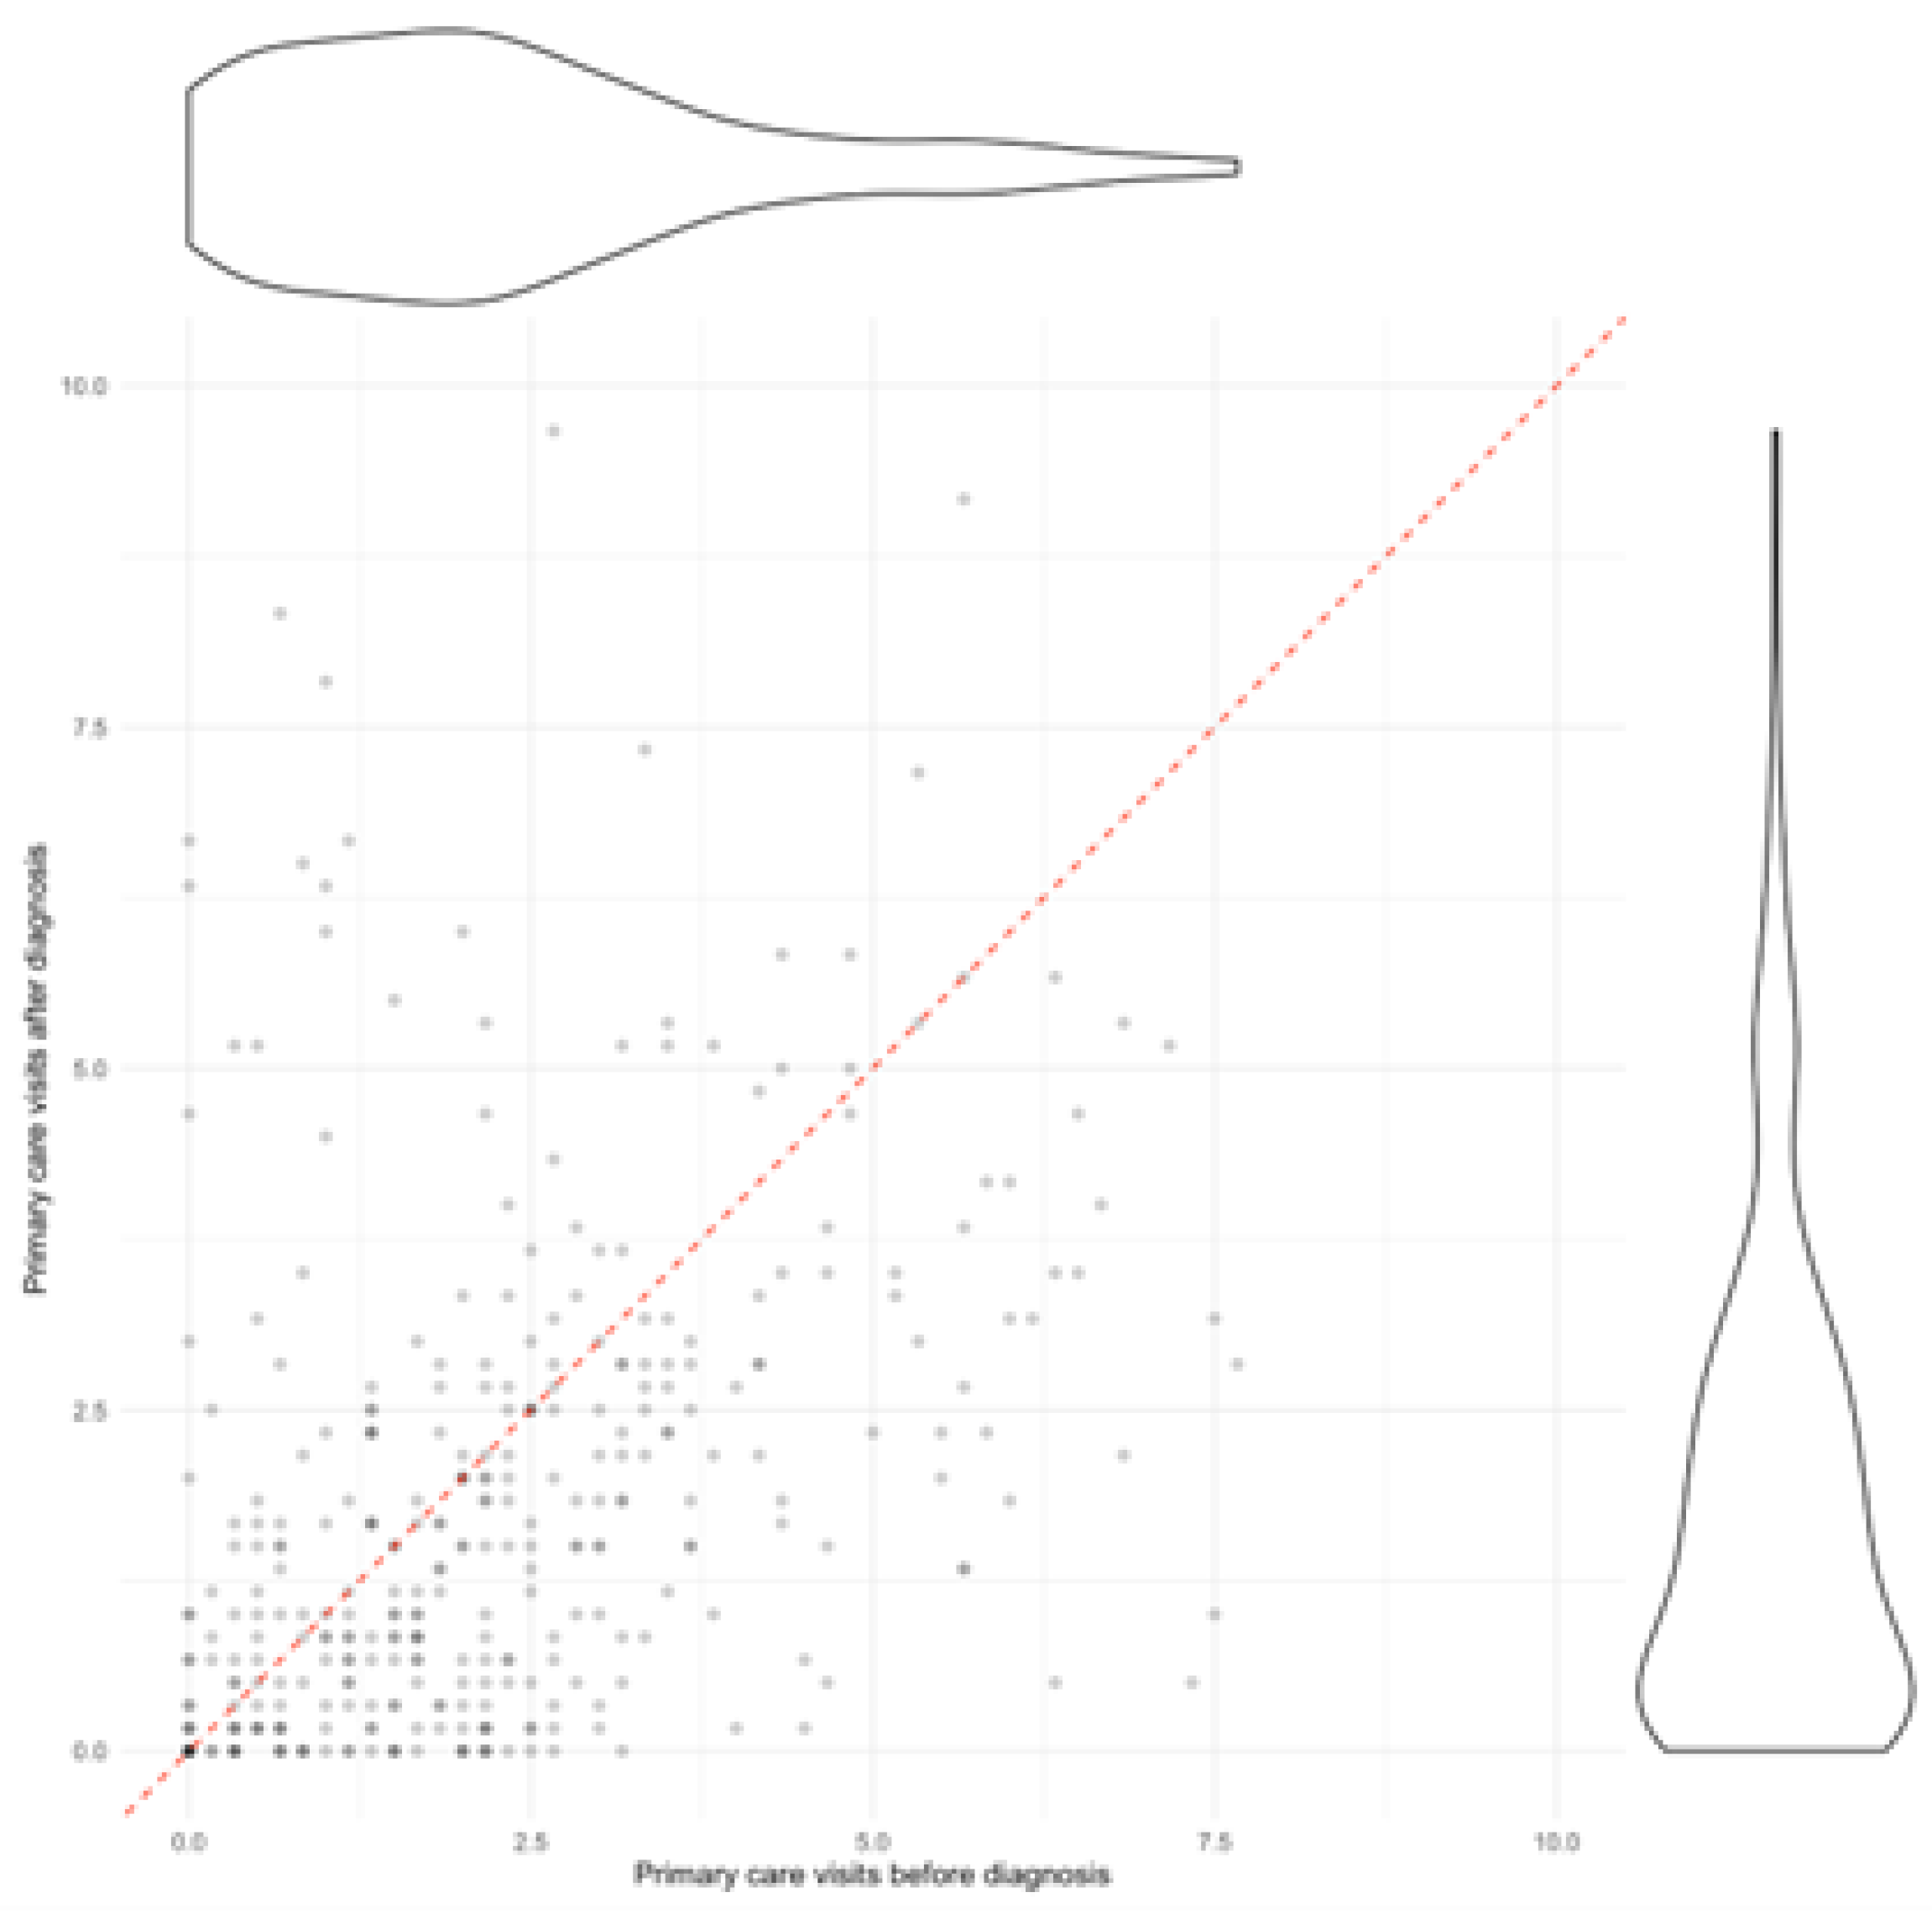
Primary care visits by patient, before and after diagnosis. Each dot represents a patient and the ratio of visits they made before diagnosis (horizontal axis) and after diagnosis (vertical axis). The dashed red line represents a 1, 1 ratio where visits would be the same before and after diagnosis. To the right and above a violin plot represents the distribution of the number of visits of the population.
Figure 2.
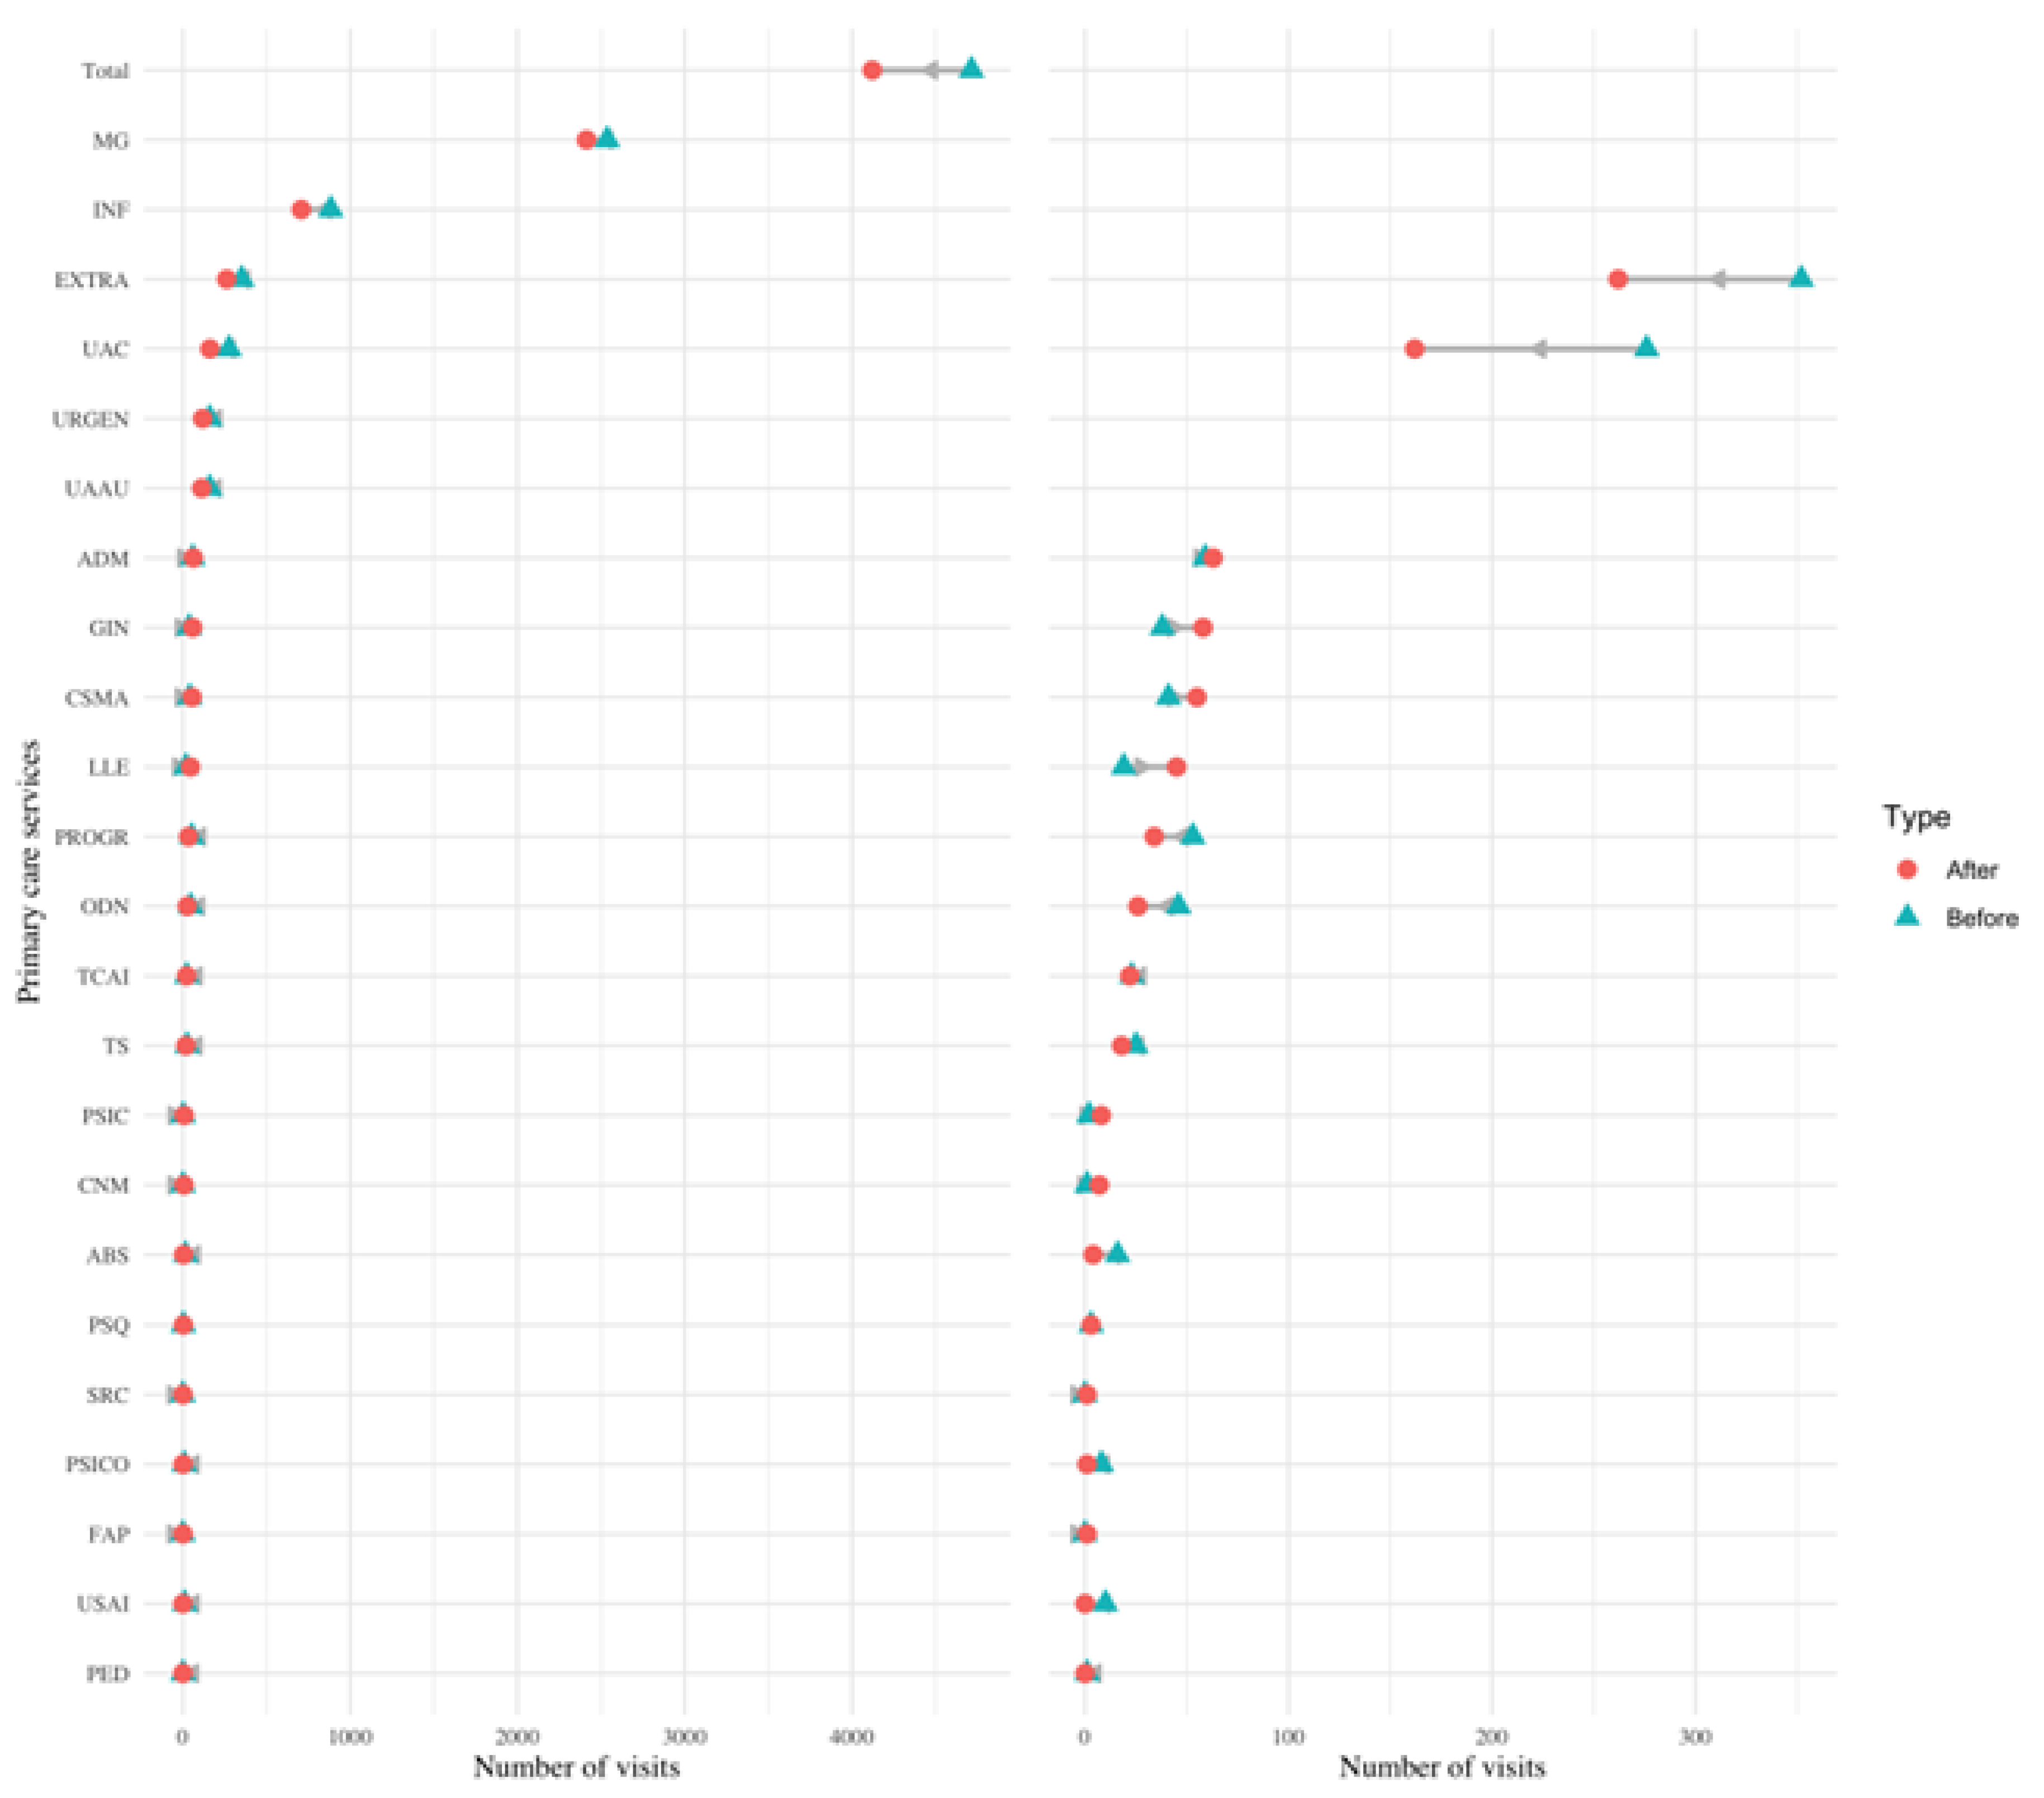
Change in visits in different services of primary care. Dumbbell plot displaying the change in the number of visits before and after diagnosis in different services of primary care. The blue triangle indicates the number of visits before diagnosis, and a red circle indicates the number of visits after diagnosis. The number of visits indicates the number of visits all PCC patients made to each service in the six months prior (and six months after) their PCC diagnosis. The grey arrow indicates the direction of change: a left leaning arrow is a decrease, while a right-leaning arrow is an increase. The plot on the left shows all categories, while the one on the right excludes the first two categories and the total to better visualise services with a smaller amount of visits (notice the change on the scale of the x-axis from 0-4000 to 0-400).
Figure 3.
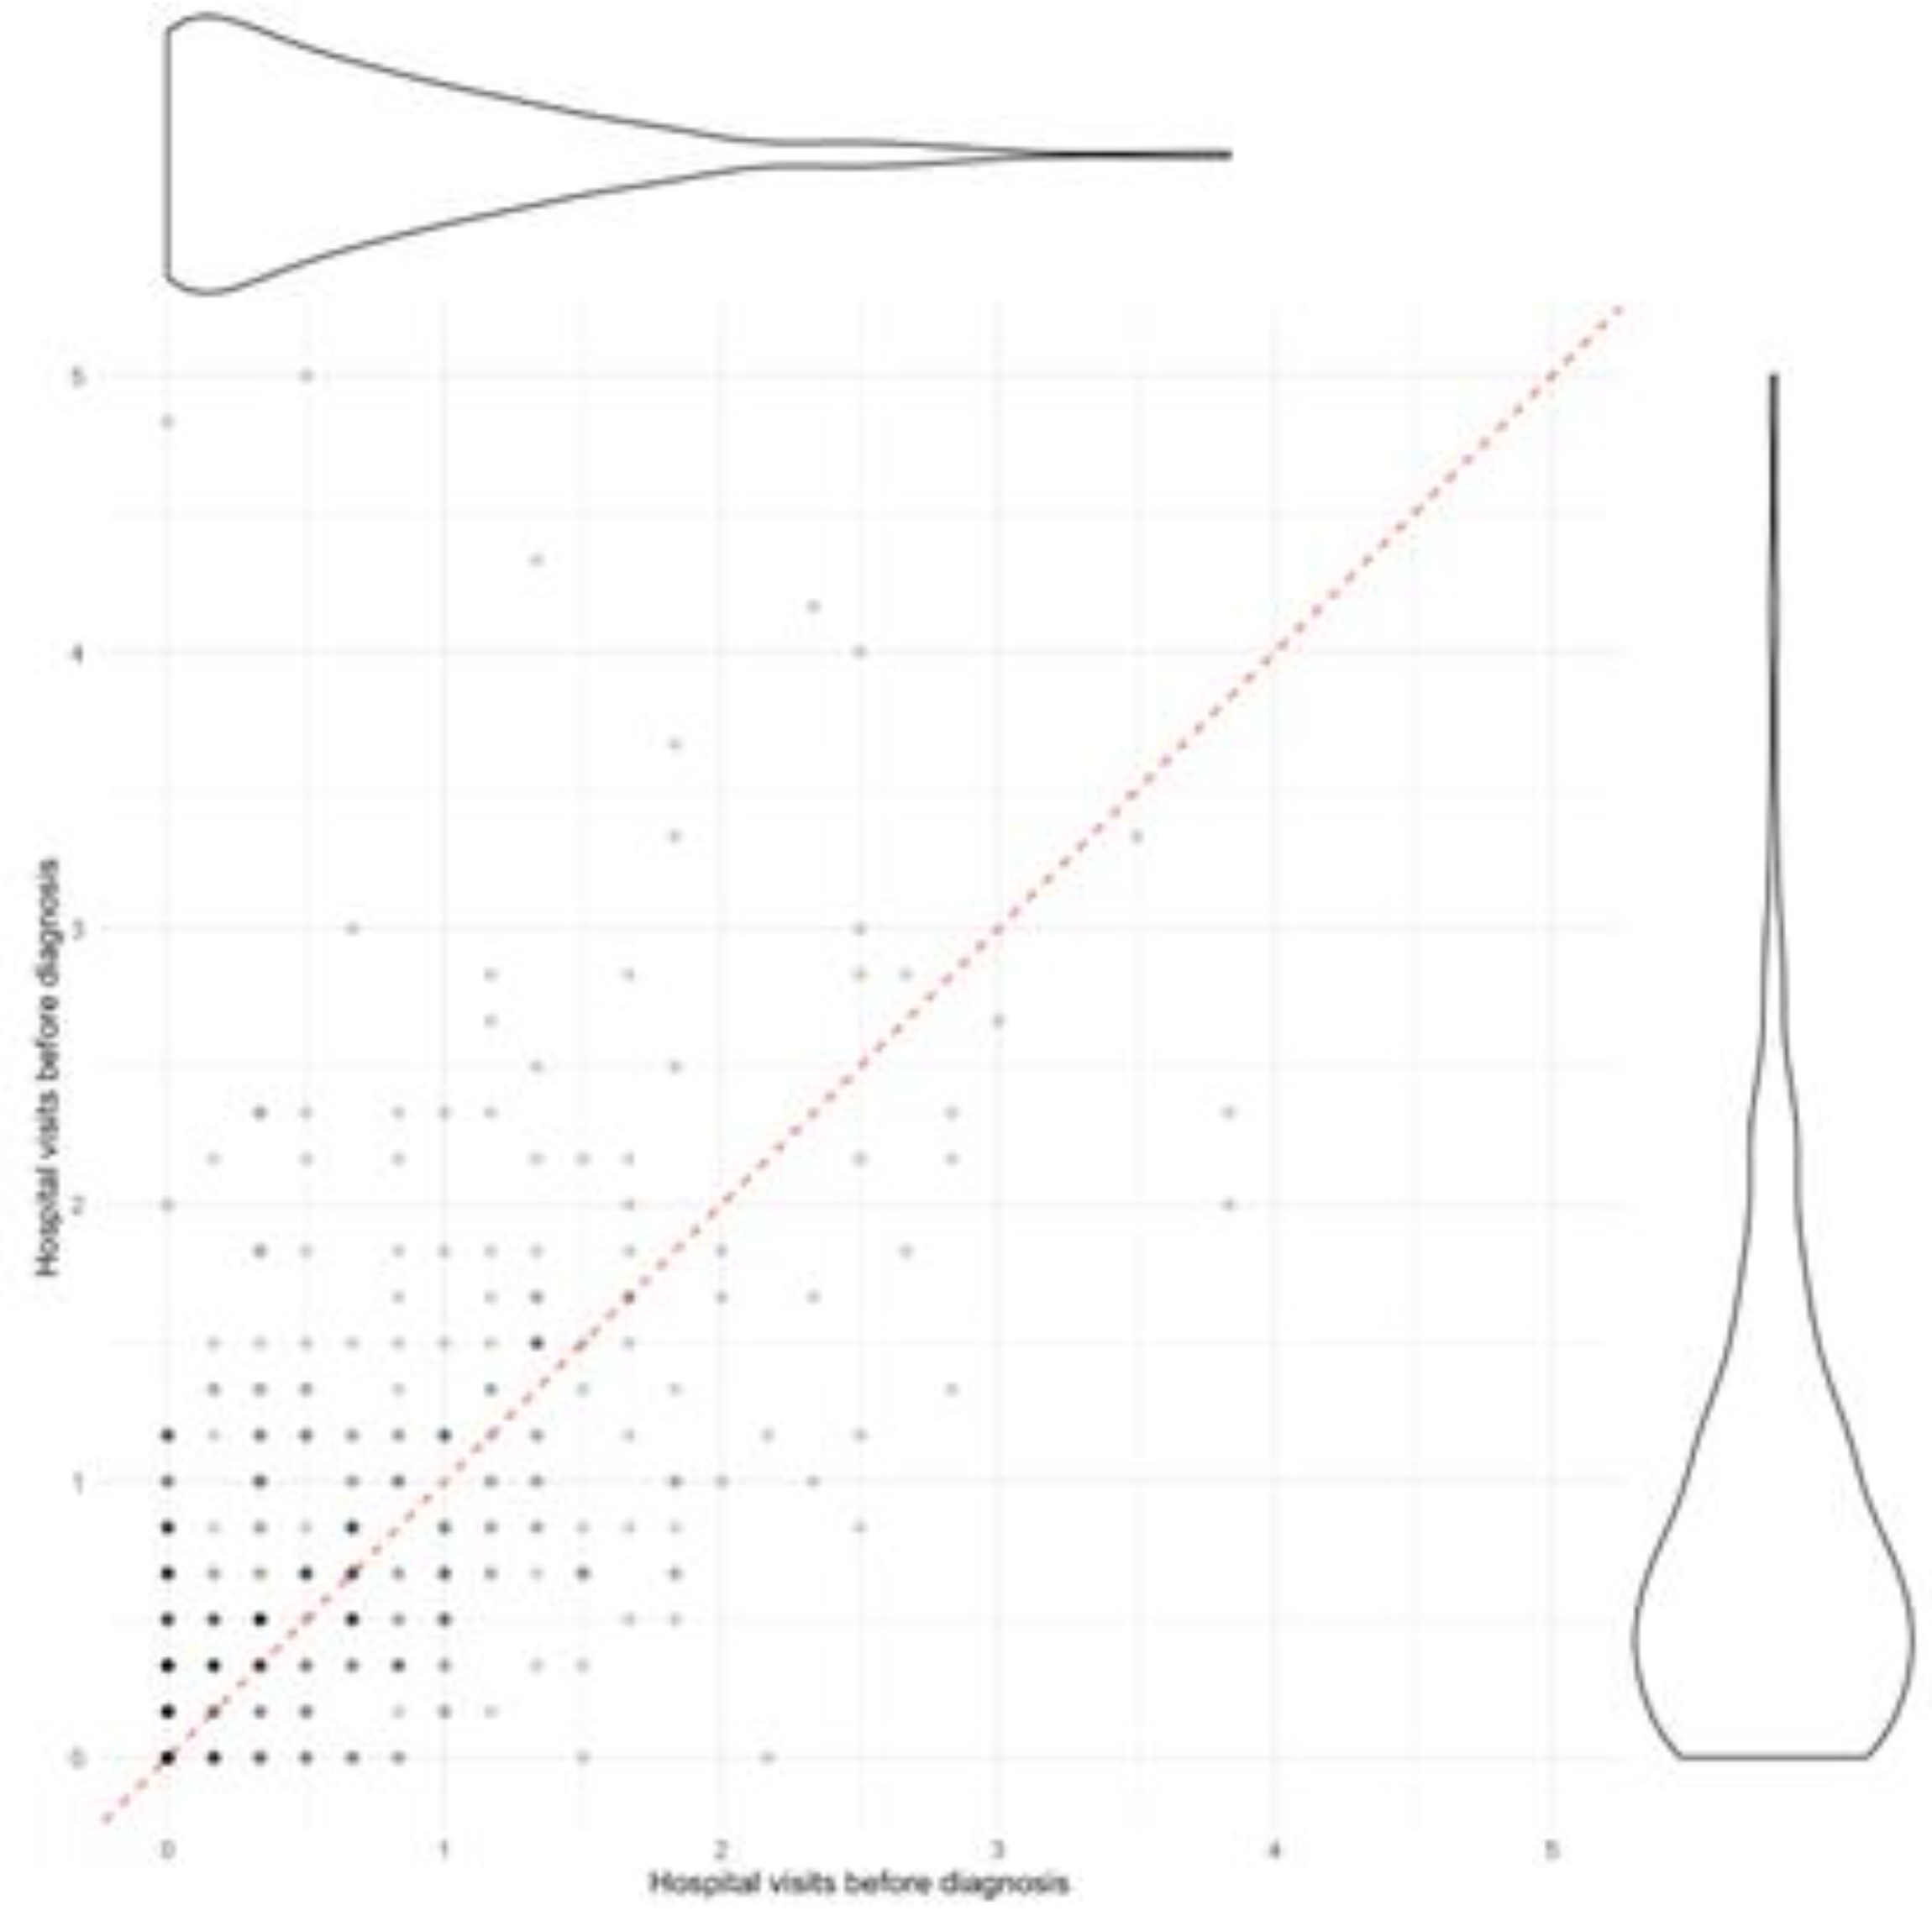
Outpatient visits by patient, before and after diagnosis. Each dot represents a patient and the ratio of visits they made before diagnosis (horizontal axis) and after diagnosis (vertical axis). The dashed red line represents a 1, 1 ratio where visits would be the same before and after diagnosis. To the right and above a violin plot represents the distribution of the number of visits of the population.
Figure 4.
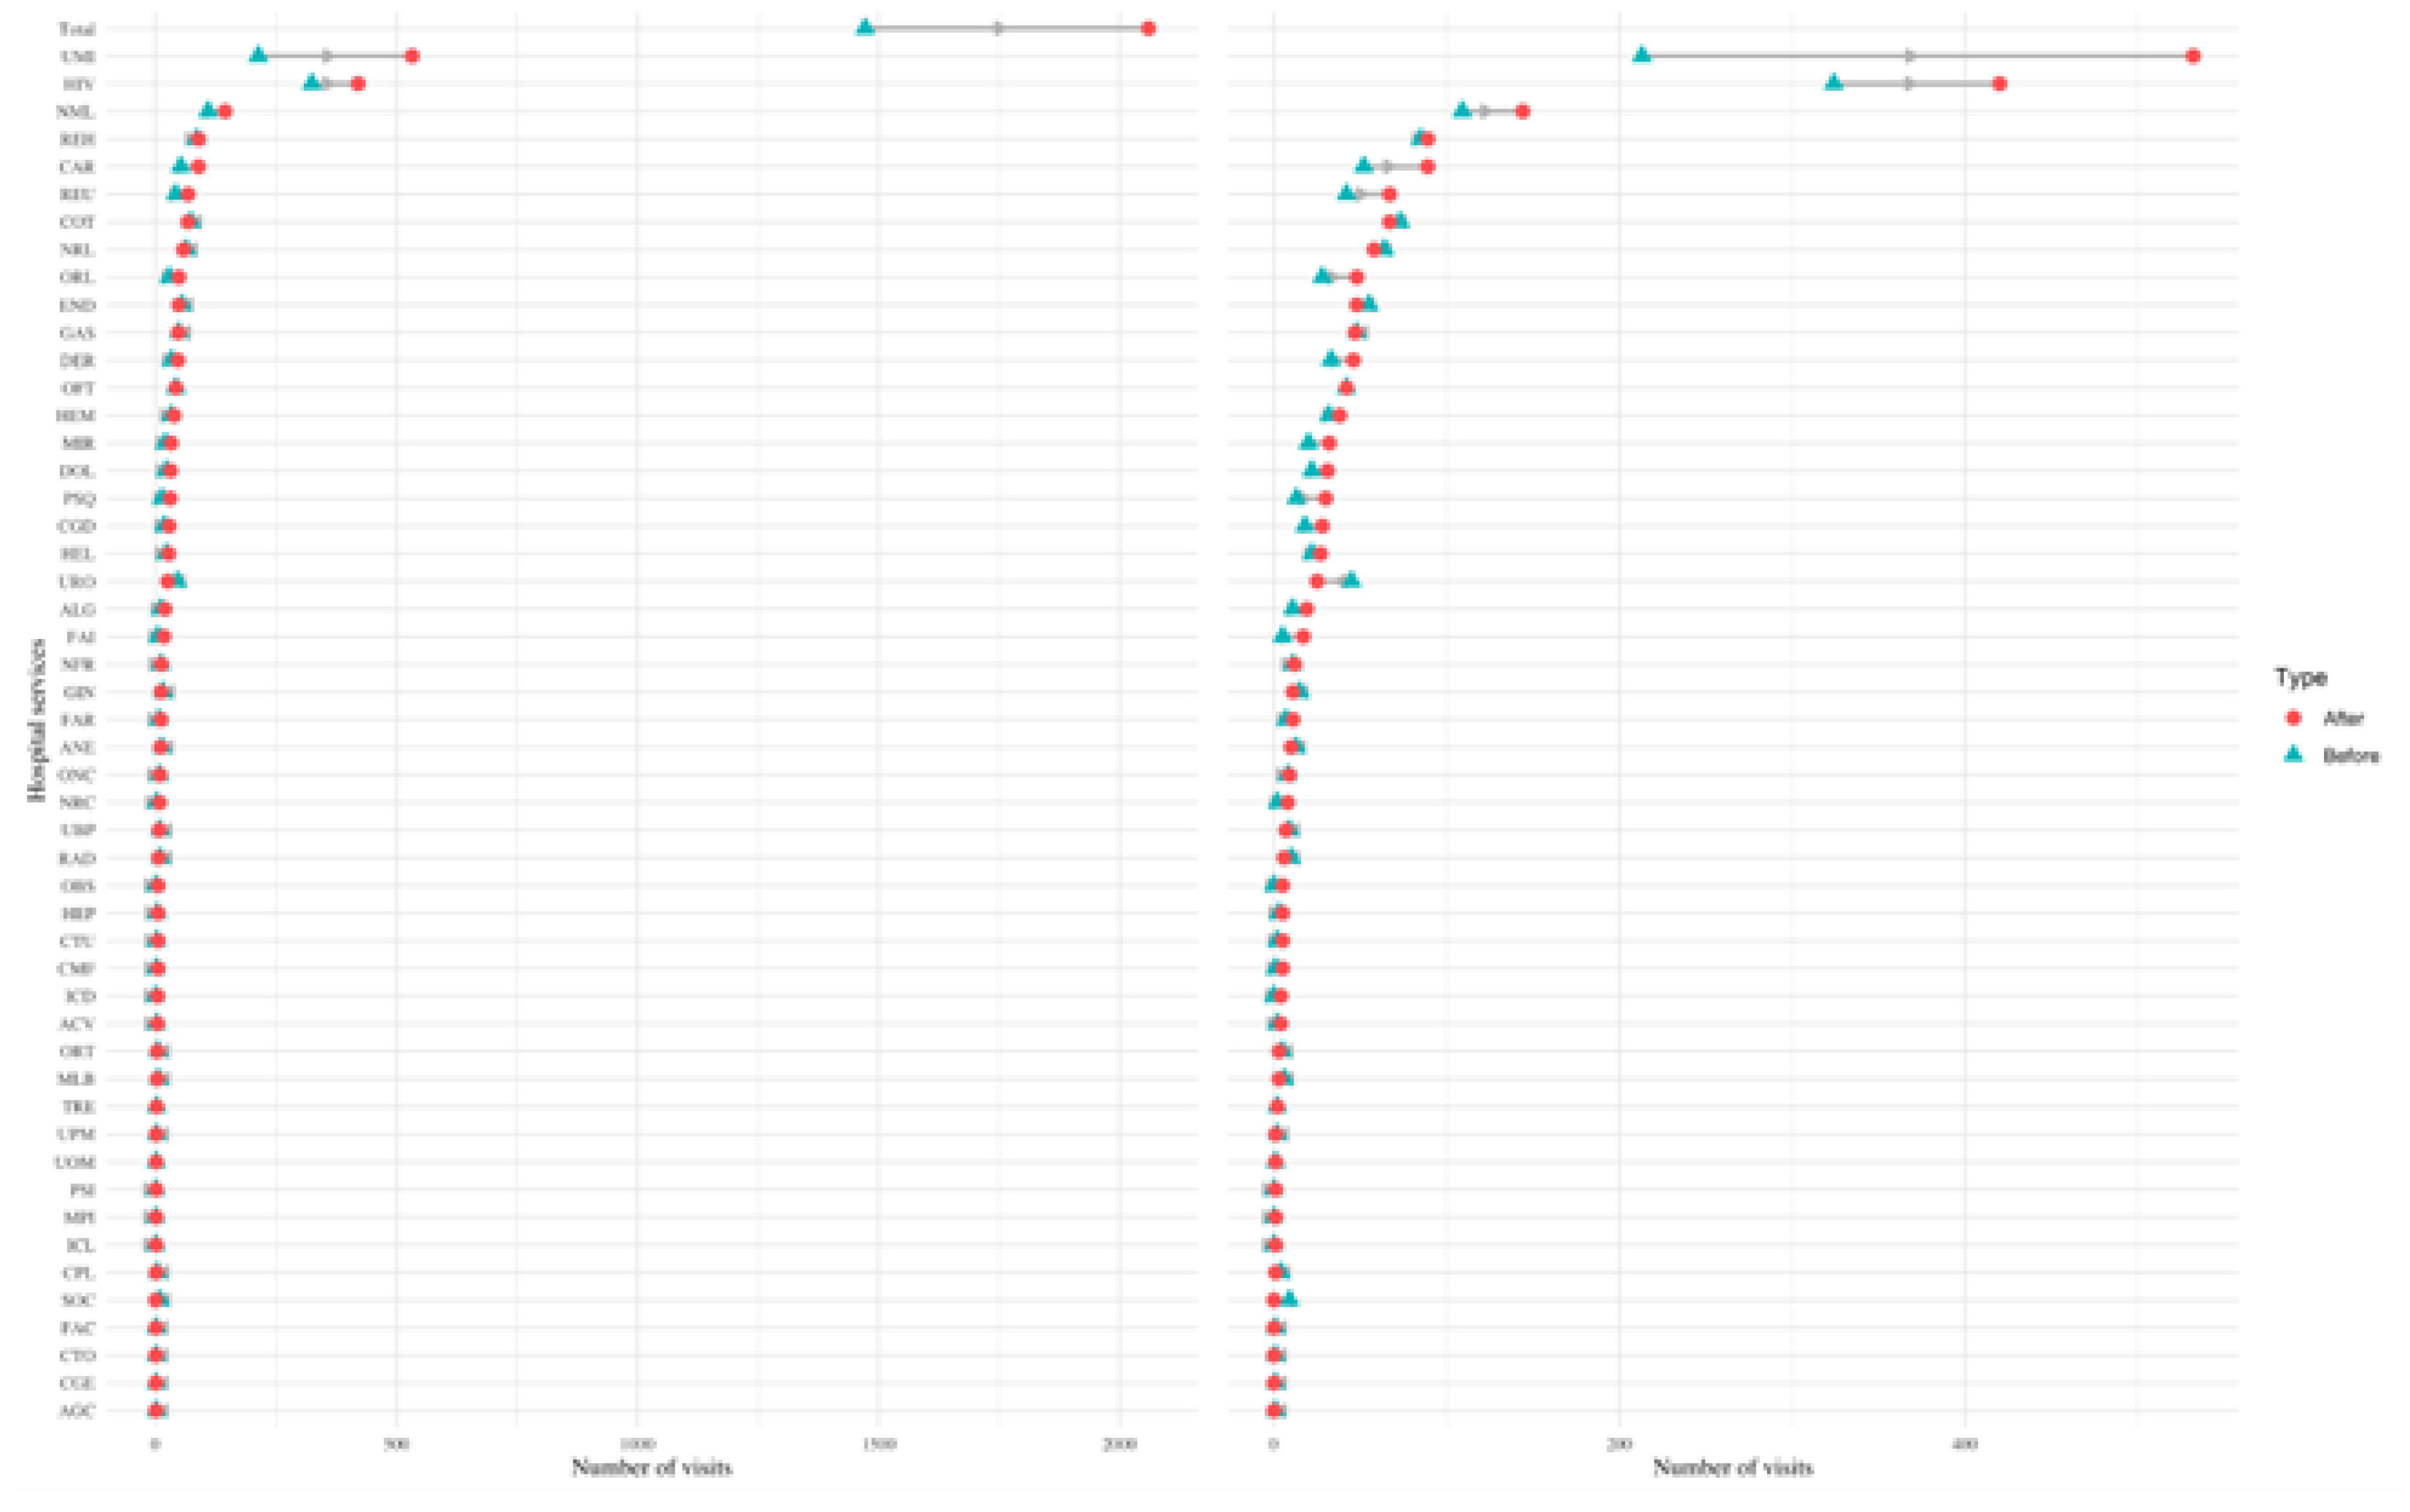
Change in visits in different services of outpatient care. Dumbbell plot displaying the change in the number of visits before and after diagnosis in different services of outpatient care. The blue triangle indicates the number of visits before diagnosis, and a red circle indicates the number of visits after diagnosis. The number of visits indicates the number of visits all PCC patients made to each service in the six months prior (and six months after) their PCC diagnosis. The grey arrow indicates the direction of change: a left leaning arrow is a decrease, while a right-leaning arrow is an increase. The plot on the left shows all categories, while the one on the right excludes the first two categories and the total to better visualise services with a smaller amount of visits (notice the change on the scale of the x-axis from 0-2000 to 0-500).
Figure 5.
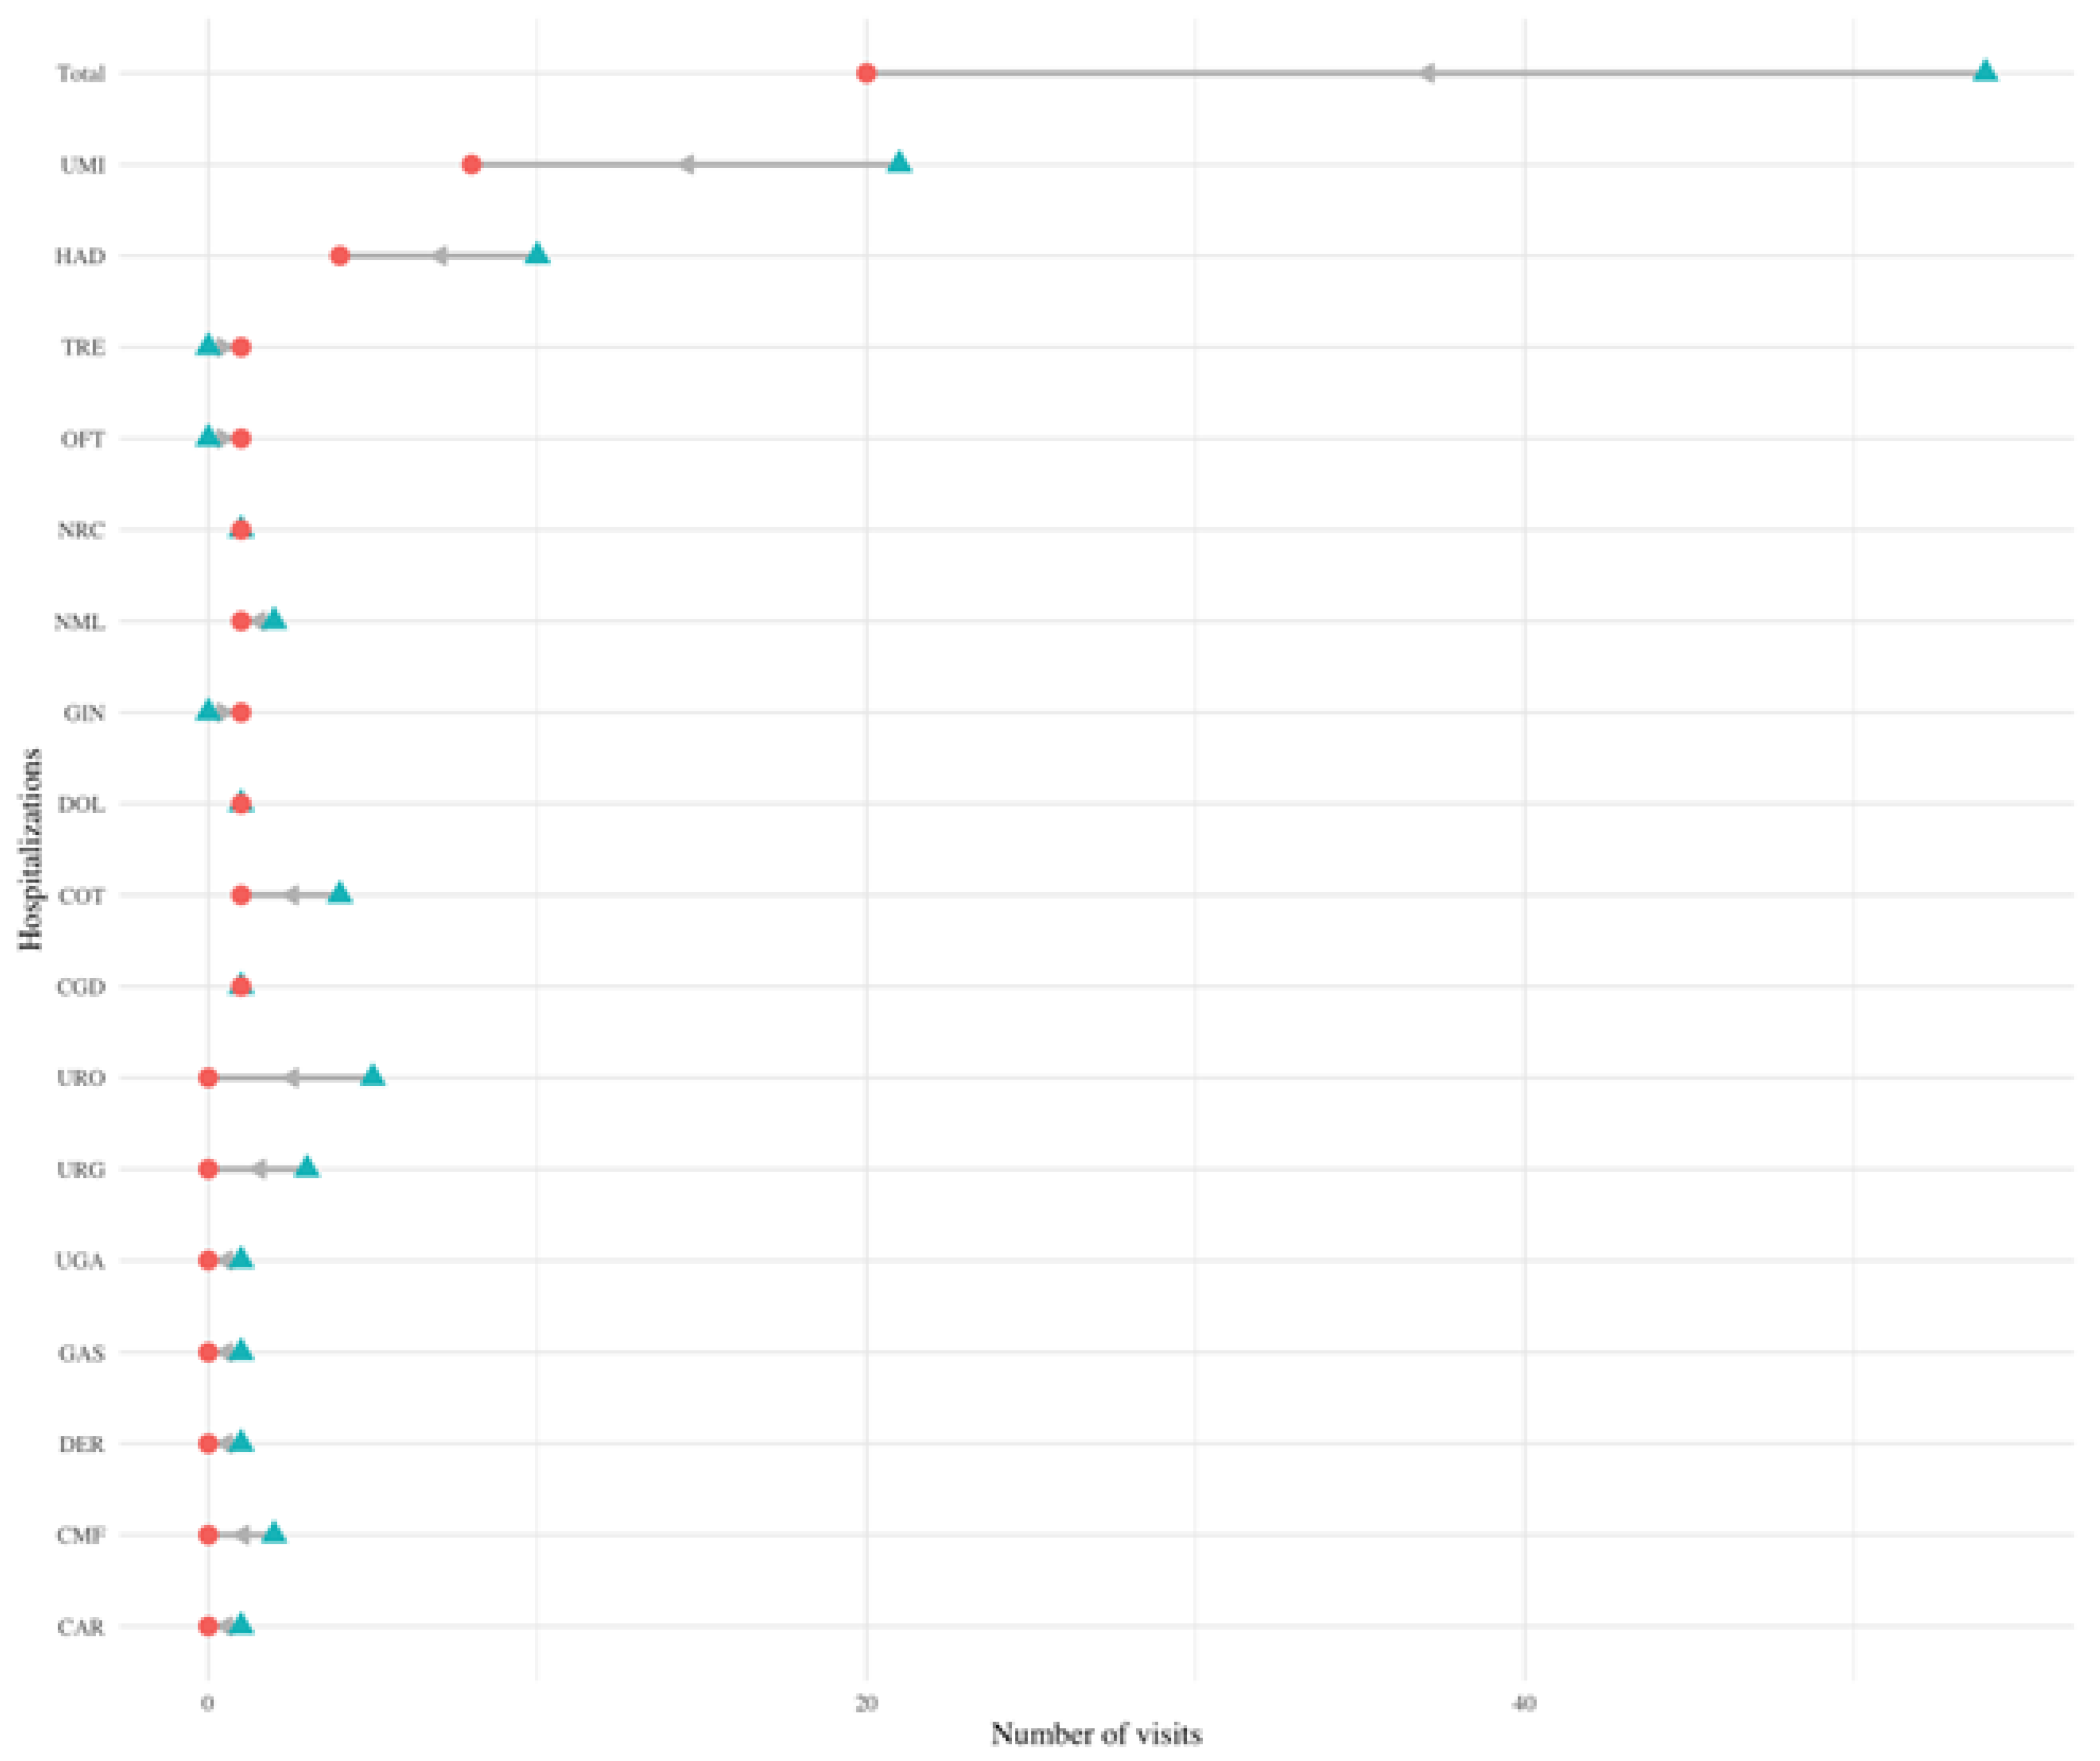
Change in hospitalizations in different services. Dumbbell plot displaying the change in the number of hospitalizations before and after diagnosis in different services. The blue triangle indicates the number of visits before diagnosis, and a red circle indicates the number of visits after diagnosis. The number of visits indicates the number of visits all PCC patients made to each service in the six months prior (and six months after) their PCC diagnosis. The grey arrow indicates the direction of change: a left leaning arrow is a decrease, while a right-leaning arrow is an increase.
Figure 6.
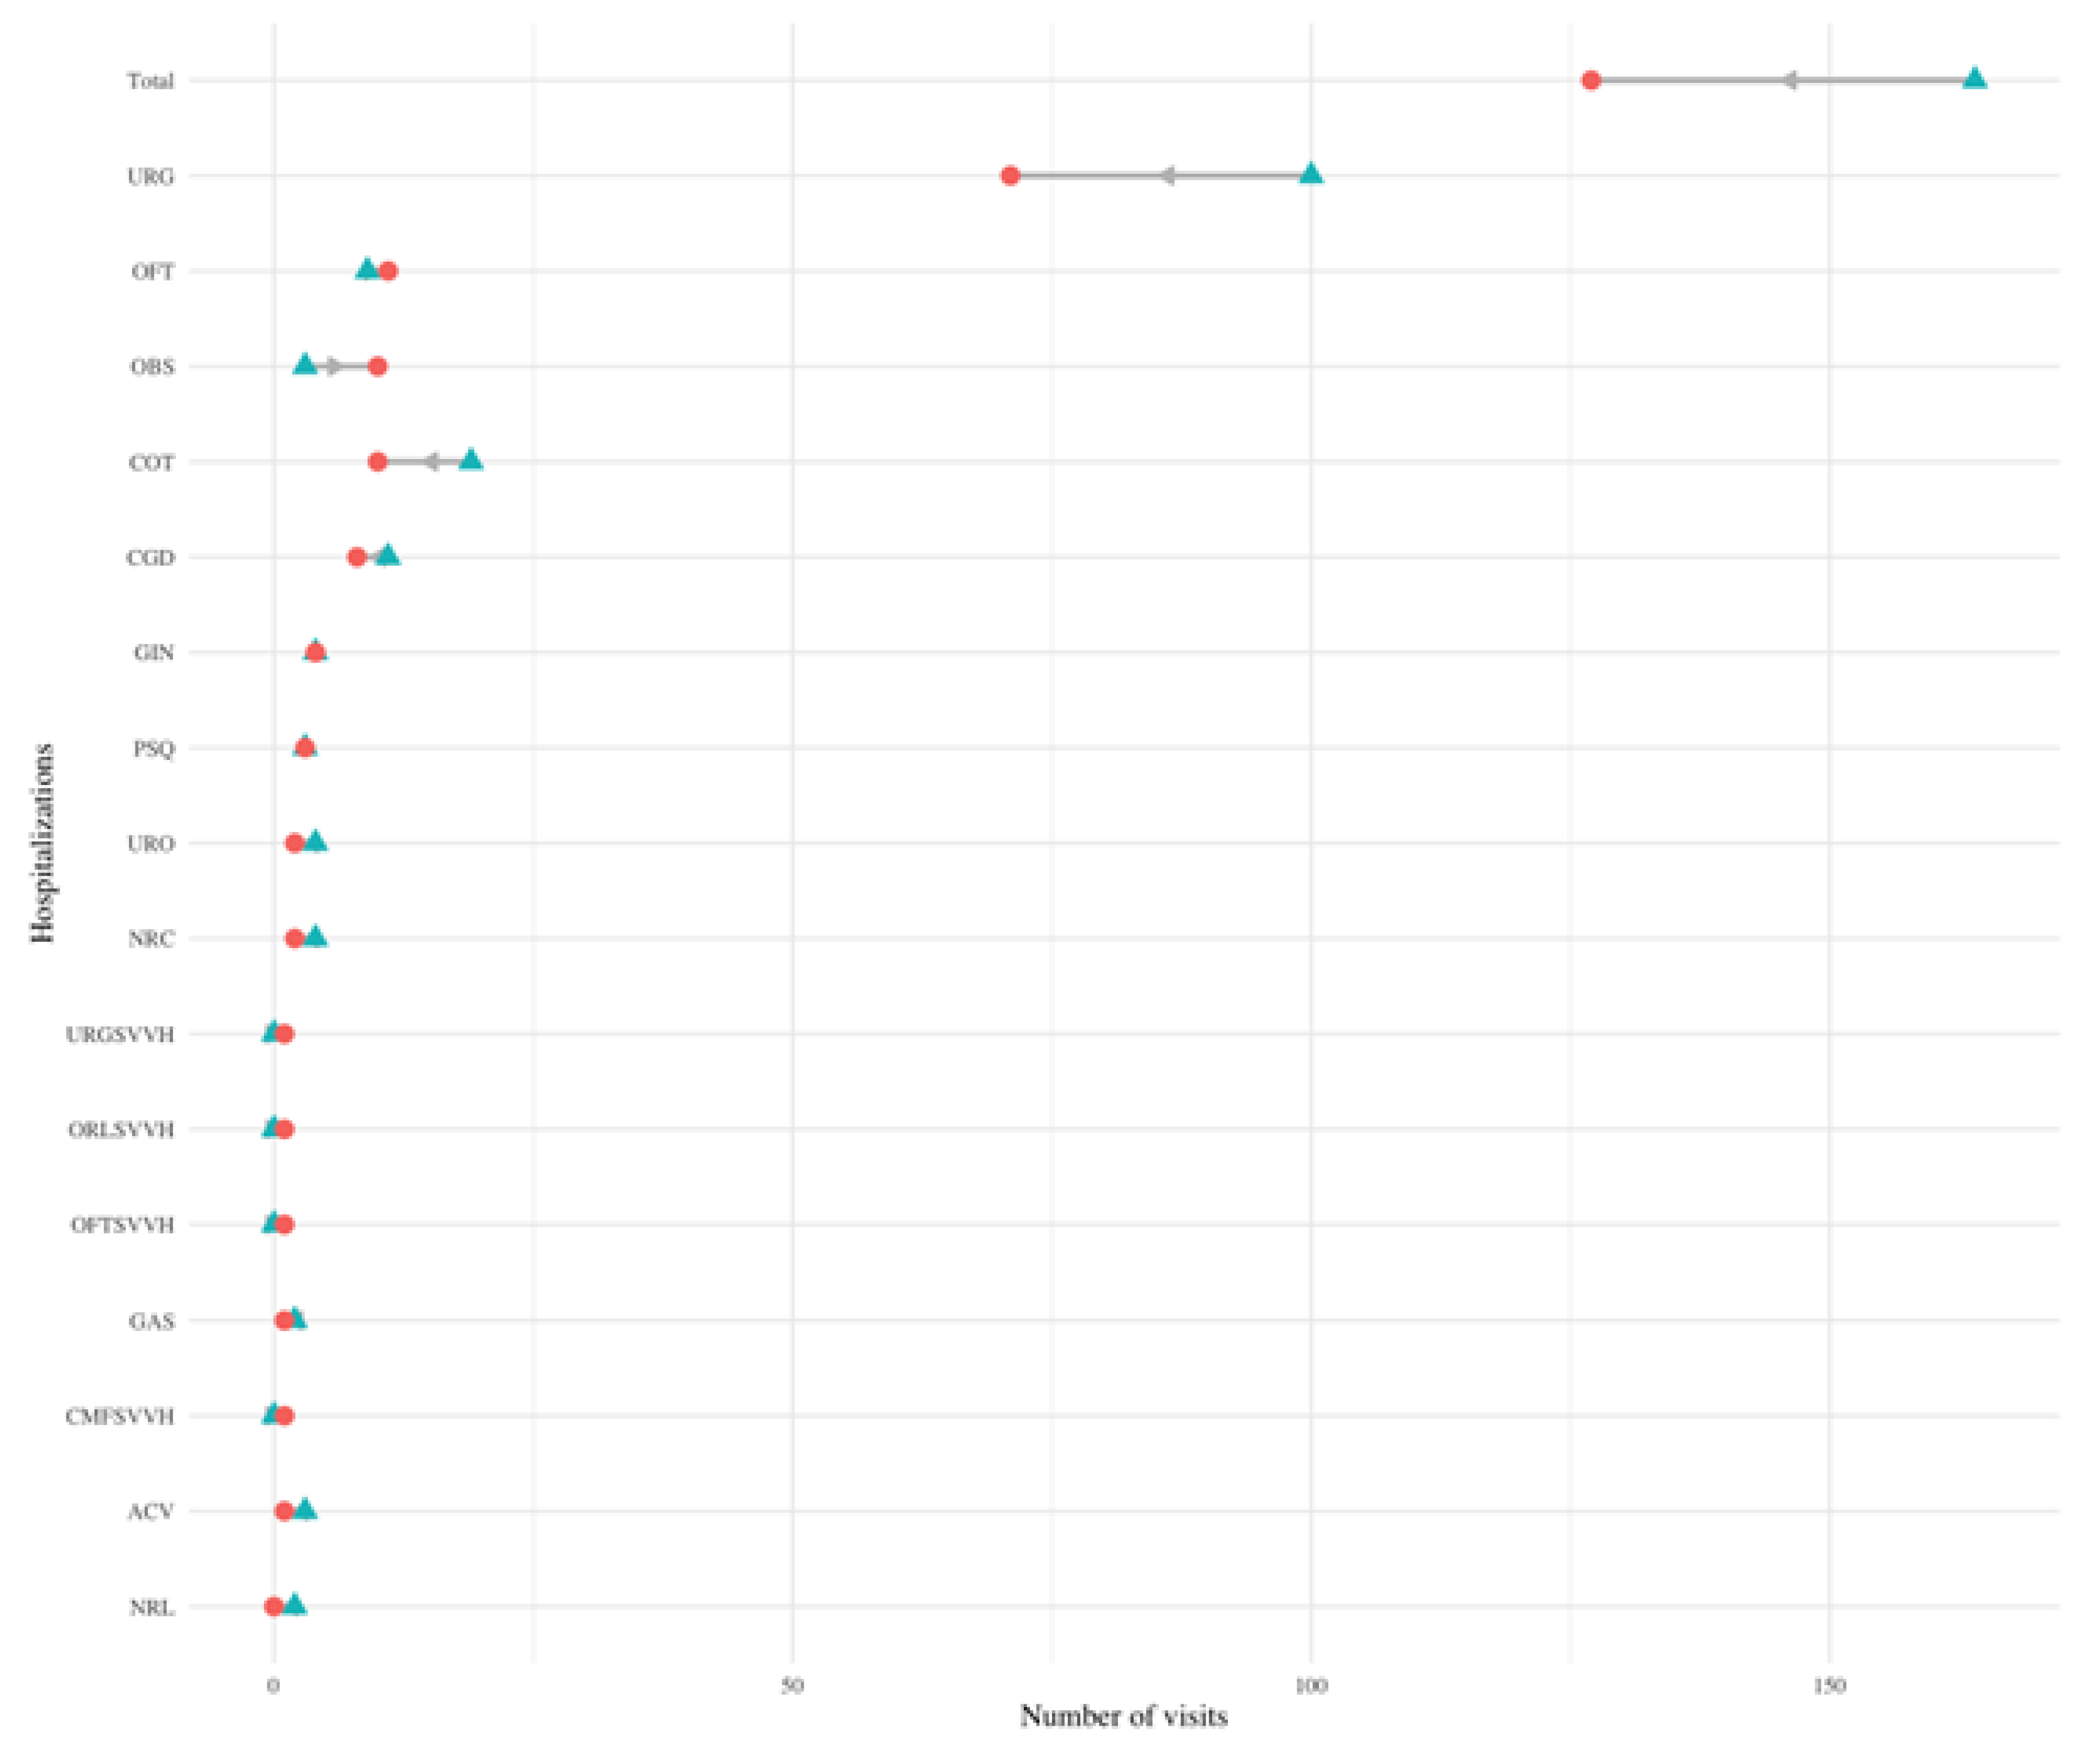
Change in emergency care visits in different services. Dumbbell plot displaying the change in the number of emergency care visits before and after diagnosis in different services. The blue triangle indicates the number of visits before diagnosis, and a red circle indicates the number of visits after diagnosis. The number of visits indicates the number of visits all PCC patients made to each service in the six months prior (and six months after) their PCC diagnosis. The grey arrow indicates the direction of change: a left leaning arrow is a decrease, while a right-leaning arrow is an increase. The plot on the left shows all categories, while the one on the right excludes the first two categories and the total to better visualise services with a smaller amount of visits (notice the change on the scale of the x-axis from 0-4000 to 0-400).
Table 1.
Statistics of the control and cases populations, and by sex within the case population. The variable TSI indicates the level of copayments in drugs. As Spain uses a progressive copayment system, it serves as a proxy for socioeconomic status. TSI 001 covers people who receive non-contributory pensions (such as people with disabilities); TSI 002 includes pensionists with annual rents under €100,000; TSI 003 covers workers with annual incomes under €18,000; TSI 004 corresponds workers with annual incomes between €18,000 and €100,000; TSI 005 covers both individuals and workers with annual rents or incomes over €100,000; and TSI 006 includes civil servants, military officers and judges under their mutualist insurance, a specific model of health insurance available to aforementioned groups.
Table 2.
Primary care visits mean broken down by gender and age-group.
Table 2.
Primary care visits mean broken down by gender and age-group.
| |
|
Pre-post |
Case-control population |
| Sex |
Age-group |
Before diagnosis |
After diagnosis |
Pre-post variation |
Control visits |
Post over control ratio |
| All |
All |
2·30 (1·79) |
1·93 (2·00) |
-19% |
0·81 (1·05) |
2·39 |
| Female |
All |
2·38 (1·72) |
2·06 (2·11) |
-16% |
0·89 (1·09) |
2·30 |
| |
15-55 |
2·46 (1·76) |
2·11 (2·35) |
-17% |
0·77 (0·97) |
2·74 |
| |
56-65 |
2·47 (1·72) |
2·27 (1·98) |
-9% |
0·93 (1·04) |
2·44 |
| |
66-80 |
1·98 (1·76) |
1·42 (1·24) |
-39% |
1·14 (1·13) |
1·25 |
| |
>81 |
1·42 (0·40) |
1·79 (1·10) |
+21% |
1·40 (1·72) |
1·28 |
| Male |
All |
2·15 (1·92) |
1·65 (1·77) |
-30% |
0·63 (0·94) |
2·62 |
| |
15-55 |
1·88 (1·64) |
1·45 (1·66) |
-30% |
0·44 (0·70) |
3·30 |
| |
56-65 |
2·74 (2·10) |
2·17 (1·93) |
-26% |
0·75 (1·12) |
2·89 |
| |
66-80 |
1·76 (2·20) |
1·53 (1·78) |
-15% |
1·05 (1·16) |
1·46 |
| |
>81 |
2·28 (1·95) |
0·38 (0·34) |
-500% |
1·27(1·60) |
0·30 |
Table 3.
Outpatient care visits mean broken down by gender and age-group.
Table 3.
Outpatient care visits mean broken down by gender and age-group.
| Sex |
Age-group |
Pre-post case population |
Case-control population |
| Before diagnosis |
After diagnosis |
Pre-post variation |
Control population visits |
After diagnosis over control ratio |
| All |
All |
0·72 (0·74) |
0·90 (0·85) |
+20% |
0·15 (0·44) |
5·93 |
| Female |
All |
0·72 (0·75) |
0·90 (0·85) |
+20% |
0·16 (0·45) |
5·68 |
| |
15-55 |
0·60 (0·74) |
0·82 (0·87) |
+27% |
0·10 (0·30) |
8·45 |
| |
56-65 |
0·76 (0·65) |
1·00 (0·87) |
+24% |
0·22 (0·55) |
4·50 |
| |
66-80 |
1·15 (0·84) |
1·02 (0·75) |
-13% |
0·32 (0·64) |
3·21 |
| |
>81 |
1·00 (1·01) |
0·66 (0·43) |
-52% |
0·28 (0·68) |
2·35 |
| Male |
All |
0·72 (0·73) |
0·90 (0·85) |
+20% |
0·14 (0·43) |
6·49 |
| |
15-55 |
0·65 (0·70) |
0·88 (0·90) |
+26% |
0·06 (0·20) |
14·55 |
| |
56-65 |
0·86 (0·79) |
0·93 (0·79) |
+8% |
0·20 (0·51) |
4·45 |
| |
66-80 |
0·62 (0·66) |
0·84 (0·88) |
+6% |
0·39 (0·75) |
2·14 |
| |
>81 |
1·06 (1·13) |
0·88 (0·69) |
-20% |
0·38 (0·76) |
2·30 |
Table 4.
Monetization of different types of healthcare resources, standardised by patient per month.
Table 4.
Monetization of different types of healthcare resources, standardised by patient per month.
| Group |
Pre- |
Post- |
Control |
Pre-post variation |
Post over control ratio |
| Primary care |
103·70 € |
86·92 € |
34·25 € |
-16% |
2·54 |
| |
General Medicine |
61·75 € |
55·82 € |
14·39 € |
-10% |
3·88 |
| |
Nursery |
14·95 € |
11·70 € |
7·98 € |
-22% |
1·47 |
| |
Home visits |
0·70 € |
0·32 € |
1·20 € |
-55% |
0·26 |
| |
Emergency primary care |
8·97 € |
4·69 € |
1·90 € |
-48% |
2·46 |
| |
Sexual and reproductive care |
1·59 € |
3·10 € |
1·85 € |
95% |
1·68 |
| |
Others |
15·73 € |
11·29 € |
6·92 € |
-28% |
1·63 |
| Hospital care |
70·81 € |
90·61 € |
14·70 € |
28% |
6·16 |
| |
First visit |
24·91 € |
35·44 € |
4·70 € |
42% |
7·54 |
| |
Successive visits and others |
45·90 € |
55·17 € |
10·00 € |
20% |
5·52 |
| Hospitalizations |
17·66 € |
6·34 € |
4·52 € |
-64% |
1·40 |
| |
General |
10·54 € |
4·61 € |
2·82 € |
-56% |
1·64 |
| |
Surgery |
4·79 € |
0·80 € |
1·58 € |
-83% |
0·51 |
| |
Home hospitalizations |
2·33 € |
0·93 € |
0·12 € |
-60% |
7·48 |
| Procedures |
6·82 € |
4·97 € |
1·70 € |
-27% |
2·93 |
| Emergency care |
19·88 € |
15·03 € |
5·40 € |
-24% |
2·78 |
| Total |
218·87 € |
203·87 € |
56·05 € |
-7% |
3·64 |
