Preprint
Article

Comparative Life Cycle Assessment of Battery and Fuel Cell Electric Cars, Trucks and Buses

Altmetrics

Downloads

375

Views

128

Comments

0

A peer-reviewed article of this preprint also exists.

Submitted:

14 February 2024

Posted:

16 February 2024

You are already at the latest version

Alerts
Abstract
Addressing the pressing challenge of global warming, reducing greenhouse gas emissions in the transportation sector is a critical imperative. Battery and fuel-cell electric vehicles have emerged as promising solutions for curbing emissions in this sector. In this study, we conducted a comprehensive life cycle assessment (LCA) for typical passenger vehicles, heavy duty trucks and city buses using either proton-exchange membrane fuel cells or Li-ion batteries with different cell chemistries. To ensure accuracy, we supplemented existing studies with data from the literature, particularly for the recycling phase, as database limitations were encountered. Our results highlight that fuel cell and battery systems exhibit large emissions in the production phase. Recycling can significantly offset some of these emissions, but a comparison of the technologies examined revealed considerable differences. Overall, battery electric vehicles consistently outperform fuel cell electric vehicles regarding absolute greenhouse gas emissions. Hence, we recommend prioritizing battery electric over fuel cell vehicles. However, deploying fuel cell electric vehicles could become attractive in a hydrogen economy scenario where other factors, e. g. the conversion and storage of surplus renewable electricity via electrolysis, become important.
Keywords: 
Subject: Engineering  -   Other

1. Introduction

The transportation industry currently contributes to over 20% of global greenhouse gas (GHG) emissions, mainly due to its reliance on oil-based products [1]. However, there is a growing trend towards adopting alternative powertrain systems, such as battery electric and hydrogen fuel cell (FC) systems. To maximize the ecological benefits of this shift, it is crucial to minimize GHG emissions through measures like recycling used components and utilizing renewable energy sources. While internal combustion engines (ICE) are still the most common powertrain technology, there has been a significant increase in the number of battery electric vehicles (BEV) and this growth is expected to continue [2]. FC electric vehicles (FCEV) are currently in use in small numbers. but also gaining popularity [3]. Both, BEV, and FCEV are often considered “zero emission” technologies. However, this is only true if the scope is limited to the tank-to-wheel phase and upstream processes, production as well as end-of-life effects are disregarded.
When comparing both technologies, a comprehensive life cycle assessment (LCA) is necessary to determine which option is more advantageous in terms of reducing GHG emissions. BEV often require larger battery packs, leading to higher weight, while FCEV with smaller battery packs typically have higher payload capacity. However, FCEV have a well-to-wheel efficiency of only 30% in passenger cars, significantly lower than the efficiency of around 70% of BEV [4]. Currently, the ecological aspects of BEV and FCEV are a subject to frequent discussions in both the scientific and engineering community. Most LCA of BEV and FCEV deal with their manufacturing and use phase. While LCA studies and inventories on recycling Li-ion batteries are widely available, LCA studies and inventories on recycling FC powertrains are scarce [5].
Hydrometallurgical and pyrometallurgical recycling of Li-ion batteries are the two most widely discussed options that raised attention in recent years. Due to the Lithium Nickel Manganese Cobalt Oxide (NMC)-111 cell chemistry's commercial success, it became prevalent in research [6,7,8,9]. However, other cell chemistries, such as Lithium Iron Phosphate (LFP), Lithium Nickel Cobalt Aluminium Oxide (NCA), and different proportions of NMC chemistries, are arousing interest in the industry and scientific community [10,11,12]. Table 1 summarizes the global warming potential (GWP) associated with the production and recycling of Li-ion batteries with different cell chemistries. Dai et al. conducted an LCA for NMC111 batteries in automotive applications, which is included in the EverBatt [13] and Ecoinvent [14] data bases [6]. Rajaeifar et al. performed an LCA for different methods of pyrometallurgical recycling [7]. The results varied between -0.77 and -1.22 kg CO2-eq./kg NMC111 Li-ion battery for the closed loop scenario. Kallitsis et al. [8] evaluated the recycling of NMC111 batteries based on the recycling methods described by Mohr et al. [10]. They supplemented the latter study with different pre-treatment steps, such as sorting, transporting, dismantling, and modelled the state-of-the-art recycling processes for copper and aluminium. For the case of battery production and recycling in Europe, the results showed a decrease in GWP by 27.4% in the case of pyrometallurgical recycling and 29.9% in the case of hydrometallurgical recycling [8]. Sun et al. assessed the production and hydrometallurgical recycling of NMC622 batteries in China [9]. They discovered that the production emits about 124.5 kg CO2 eq./kWh, while hydrometallurgical recycling reduces the total emissions to 93.6 kg CO2 eq./kWh. Mohr et al. compared hydrometallurgical, pyrometallurgical, and advanced hydrometallurgical (Duesenfeld) recycling for LFP, NMC111, and NCA batteries based on information from the industry and the GREET [15] database [10]. The NCA cell chemistry has the most substantial recycling benefit, while NMC111 has the lowest GWP from the production phase, resulting in the lowest total GWP value among all cell chemistries. Recycling LFP batteries has the slightest decrease in GWP due to the lack of cobalt, nickel, or manganese in its cathode chemistry. Ciez and Whitacre also compared NMC, NCA, and LFP cell chemistries, but included only benefits for cell materials [11]. Thus, in contrast to other research, the results showed significantly less benefits of recycling. Despite variations in the cell chemistries evaluated, functional units, and system boundaries among these studies, they consistently demonstrate certain similarities. One notable commonality is the superior efficiency of hydrometallurgical compared to pyrometallurgical recycling in lowering the life cycle GWP of batteries. This shared trend can be attributed to the various materials that can be recovered through both recycling methods. Moreover, the studies that included LFP batteries indicated that recycling LFP batteries does not necessarily benefit the overall GWP.
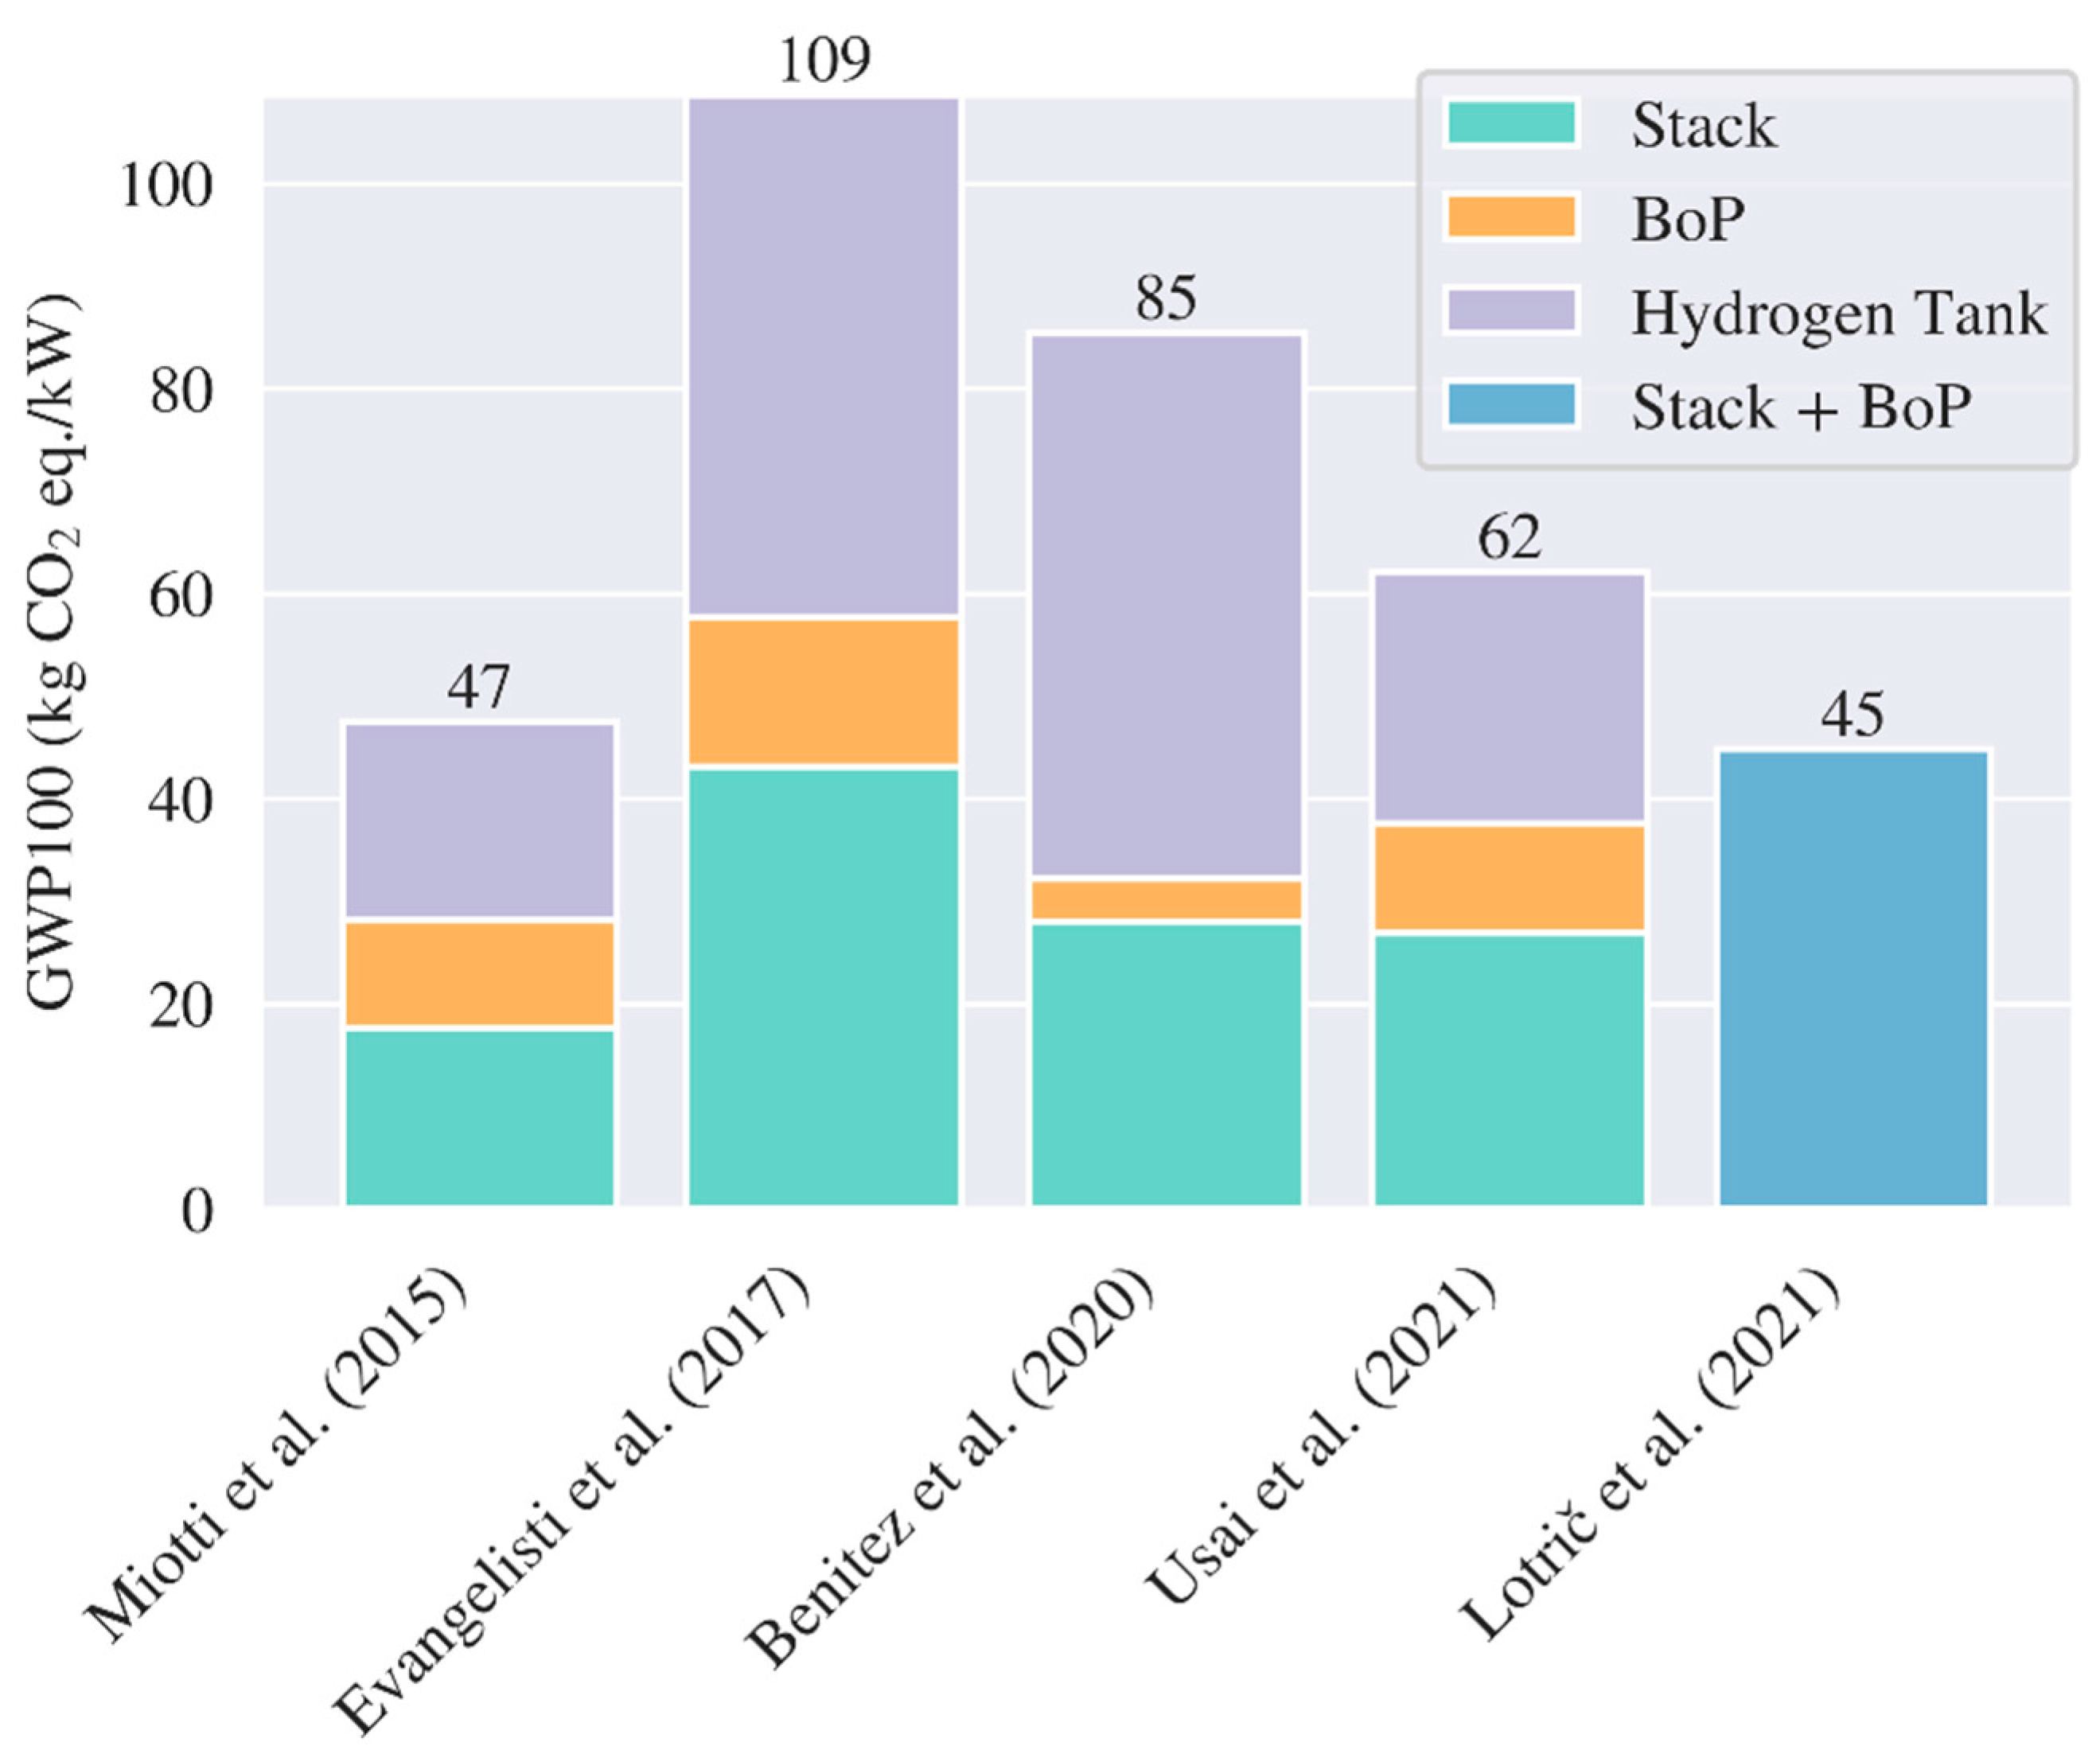
Figure 1 presents the LCA results of proton exchange membrane (PEM) FC systems. Miotti et al., Evangelisti et al., and Usai et al. analysed an 80 kW fuel cell system, while Benitez et al. and Lotrič et al. considered 100 kW and 5 kW systems. Miotti et al. analysed a modern fuel cell technology with future scenarios using different materials [16]. Usai et al. updated this study with new data on FC components [17]. Benitez et al. modified the study from Miotti et al. with a focus on the hydrogen tank [20]. Evangelisti et al. (2017) assessed an equivalent system but with variations in data regarding component production [18]. Lotrič et al. generally investigate fuel cells and hydrogen without focusing on fuel cell as an automotive application. They considered a 5 kW fuel cell system, excluded the hydrogen tank and focused on end-of-life strategies [19]. All analysed studies differ in the total GWP value per kW FC, primarily due to different platinum contents and sizes of hydrogen tanks. However, a common trend across all studies is the substantial impact of hydrogen tank production and FC stacks, as these components require platinum for catalyst production and carbon fibre for hydrogen tank production.
For evaluating the end of life (EoL) of FC systems, two studies conducted detailed assessments regarding the recycling of platinum catalysts in PEM FC systems [21,22]. These investigations involve a comparison of two distinct hydrometallurgical recycling methods, specifically ion exchange resin and solvent extraction. Duclos et al. found that both recycling approaches yield a comparable reduction in environmental impacts, emphasizing the significance of platinum recycling. Stropnik et al. analyse critical materials in PEM FC systems including the EoL [23]. Their EoL approach is based on the data by Duclos et al. [22] complemented by industry data for the stack and the balance of plant (BoP) components. Their findings indicate a 12.3% reduction in GWP when accounting for the EoL of the PEM FC system. Notably, their study excludes the hydrogen tank from consideration. Lombardi et al. compare the impacts of various powertrain technologies, including the EoL of the vehicles [24]. However, their approach is also based on the data by Duclos et al. [22]. For the hydrogen tank, they assume recycling for steel and aluminium and disposal to landfill for the remaining materials. Their results indicate a modest reduction in GWP during the EoL phase. It's essential to note that their assessment pertains to a plug-in hybrid FC vehicle, potentially featuring smaller FC power and tank sizes compared to a pure FCEV. Additionally, they used a 200-bar glass fibre tank, which may result in fewer environmental impacts than a carbon fibre tank, which was considered by the other studies.
Most studies which compare environmental impacts of BEV and FCEV deal with passenger cars [24,25,26,27]. Rüdisüli et al. emphasise the importance of the energy source in the use phase while excluding the vehicle production and EoL [27]. They underscore that the GHG emissions from electricity and hydrogen are highly dependent on the energy sources (renewable or carbon-intensive). Idris and Koestoer arrive at a similar conclusion and emphasise the significance of vehicle recycling [25]. While aforementioned studies highlight the importance of the energy sources during the use phase, Joshi et al. extend this perspective by underlining its influence on the production phase [26]. Lombardi et al. stand out by incorporating the EoL phase of vehicles [24]. Their findings reveal a noteworthy reduction in GWP trough recycling the plug-in hybrid FCEV and an increase in GWP for the EoL of BEV. It should be noted that they exclusively considered LFP batteries. Moving beyond passenger cars, Sacchi et al. examined the influence of size, payload, and range of alternative truck powertrains on GHG emissions [28]. Their results indicate that for long-range vehicles, the FCEV exhibit lower GHG emissions per tkm, while BEV emit fewer absolute emissions. This discrepancy primarily arises from FCEVs' higher payload capacity. Contrary, Booto et al. report a 20% higher reduction in GWP for battery electric trucks (BET) compared to the FC electric trucks (FCET) [29]. Shifting focus to electric buses, Grazieschi et al. and Munoz et al. found that with a similar energy source, battery electric buses (BEB) consistently outperform FC electric buses (FCEB) in terms of lowering the GWP [30,31]. However, it is crucial to note that both studies do not consider passenger kilometres, which might yield different results. This is particularly relevant as BEBs and FCEBs with similar range and size often exhibit differences in passenger capacity.
The goal of our study is to compare the climate change potential of PEM FC and Li-Ion batteries. However, the difficulty arises to compare both products by a suitable unit. FC can be compared with the help of power (kW) and batteries by their capacity (kWh). To reasonably compare FC and batteries with each other, it is necessary to consider them in the context of their application. Complementary, the analysed literature underlines the need for an LCA study that combines and compares all life phases of BEV and FCEV powertrains, using comparable vehicles, functional units, and nominalization factors. This approach makes it necessary to analyse the pack level of the batteries with different battery chemistries in BEV, the FC stack, BoP and hydrogen tank in FCEV. Considering the electricity and hydrogen mixes in various years allows to estimate the EoL and use phase for the vehicles. Therefore, we present the GWP of the individual powertrain systems for electric vehicles. We compare and evaluate their impacts in different applications, while excluding all similar parts of the vehicle.

2. Materials and Methods

The LCA of battery and FC electric powertrains follows DIN EN ISO 14044 [32], using Ecoinvent 3.9.1 as the primary data source [14]. External data sources were consulted when specific components or processes were not available in Ecoinvent. To ensure a comprehensive comparison between these technologies, this study encompasses the entire life cycle of the powertrains, including the production, use, and end-of-life phases. Recycling is considered as the EoL process for both technologies, except for the hydrogen tank (Figure 2).
The impact assessment of this LCA is based on the ReCiPe 2016, the state-of-the-art impact assessment method [33]. While our primary focus is on environmental impacts related to GWP, we have also included assessments of all ReCiPe impact categories in the supplementary materials. This study uses the consequential system model in Ecoinvent. The consequential system model incorporates various assumptions to analyse the effects of a change in a system (e.g. change in demand). In contrast to attributional LCA, marginal increase in supply chains is included, substitution is employed by crediting processes with avoided burdens from supply chains replaced by their generated by-products. This study uses the consequential approach, recycled materials are classified as avoided burdens and credited with benefits [34].

2.1. Inventory Analysis of Batteries, Fuel Cell and Hydrogen Tank

This study combined inventories for several life cycle processes for batteries and FC, hydrogen production, and electricity generation in Germany and China.
For the BEV, we compare four different cell chemistries: NCA, LFP, and NMC with varying proportions of nickel, cobalt, and manganese (NMC111 and NMC 811). The Ecoinvent 3.9.1 data base provides the production processes of all four cell chemistries [14]. These cell chemistries have a relatively high energy density, which makes them well-suited for automotive applications (Table 2). However, Ecoinvent 3.9.1 lacks data on recycling processes for these batteries [14]. To address this gap, we incorporated data from EverBatt, which considers hydrometallurgical, pyrometallurgical, and direct cathode recycling, as well as transportation and dismantling of battery packs [13]. The whole recycling process is divided into three steps. The first step involves transporting the battery pack to the recycling facility. The second step entails disassembling the battery pack, separating the battery modules from each other and the battery pack itself. This provides access to the initial recyclable components. The third step varies depending on the applied method. For hydrometallurgical recycling, the batteries need to undergo a mechanical recycling process, which separates the cathode from the rest of the battery. In this step, the disassembled battery modules are shredded into smaller pieces. Subsequently, the binder and electrolyte are burnt in a calcination process. The shredded battery pieces are then sorted to recover materials such as aluminium, steel, copper, graphite, and plastics. Eventually, the sorted rests undergo a leaching process and solvent extraction to obtain cobalt, nickel, manganese, and lithium compounds. In the case of pyrometallurgical recycling, batteries are fed into a smelter, where the electrolyte and plastics are burnt to generate heat for the thermic reaction. Some materials (Al, Li, C) are oxidized and end up in the slag, while other materials (Fe, Cu, Ni, Co, Mn) become part of the matte, which can be recycled to separate the materials. Both slag and matte can undergo further treatment to recover materials, but EverBatt only provides matte treatment data [13]. Further recycling steps for the matte are analogue to the final steps of hydrometallurgical recycling: the matte undergoes the processes of acid leaching, precipitation, and solvent extraction. All steps after dismantling are summarised in EverBatt [13] and therefore modelled in the same way in Ecoinvent [14]. The considered FC is a low-temperature PEM FC based on the inventories by [17]. To compare the vehicles, we scale the PEM FC, hydrogen tank and BoP with the respective FC power. In addition, the powertrain contains hydrogen tanks and the BoP. The weight of one tank and the BoP for the PEM FC is based on Usai et al. [17]. Each tank is considered to be a 5 kg hydrogen tank with a weight of 105 kg per tank. For the BoP, we assume a weight of 85.3 kg for an 80 kW FC stack. For the PEM FC, the production process was modelled with background processes provided by Ecoinvent 3.9.1, based on the data from Usai et al., which reflects current state-of-the-art FC technologies [17]. This data set includes the production of the FC stack, auxiliary systems, and hydrogen tank.
The FC recycling inventory follows the production process from Usai et al. [17] and covers three steps: transport of the FC to the recycling facility, disassembly and recycling the materials. According to the used production data, the FC powertrain is split into different components (supplementary materials). We assumed recycling for the FC catalyst based on Duclos et al. [22]. For other components of the FC stack and the BoP, it was assumed that plastic and electronic components are treated as waste materials. At the same time, metals such as copper, steel, and aluminium are modelled as materials for recycling. Hydrogen tanks have a lifetime up to 30 years [36]. However, no sufficient information on the EoL of hydrogen tanks was available. Therefore, no EoL process was modelled, and we accounted only one third of the production emissions to the FC system, assuming that the tank is used in three vehicle lives. The air management system's production is modelled using permanent magnets, so a recycling process for these magnets was added based on data from Jin et al. [37].

2.2. Inventory Analysis Grid Mix and Hydrogen

Electricity mixes from Germany for the years 2021, 2030 and 2050 were compared, and for the years in between, data was interpolated (Figure 3). 2021 was chosen as the representative last year instead of 2022, which included significant changes in the European energy market that led to increased consumption of fossil energy sources and is treated as an outlier. Analysing future electricity mixes is important for the consideration of the whole use phase of the analysed vehicles, which also includes the foreseeable future. Regarding the production phase, we assume that battery production takes place in China, so the Chinese electricity mix from 2021 is used. For the end-of-life phase, recycling possibilities in Germany are considered. To simulate the recycling of batteries for vehicles that are produced now, electricity mixes for 2030 are applied.
For hydrogen production, the mix of hydrogen produced by different sources was modelled (Figure 4). Data from 2020 and forecasts for 2030 and 2050 were interpolated to estimate changes of hydrogen production for each year. The dataset for 2020 also includes production of hydrogen with fossil fuels with carbon capture as 0.7% of the generated hydrogen [1]. Ecoinvent 3.9.1 includes processes for methane steam reforming and petroleum refinery operations. However, the processes for hydrogen production with coal gasification, fossil fuels with carbon capture, and by-product production were absent in Ecoinvent 3.9.1. Therefore, the coal gasification process data was taken from Burchart et al. [41]. Hydrogen production with carbon capture was deemed negligible and subsequently excluded from our study owing to the challenges associated with the implementation of processes involving carbon capture. It is assumed that hydrogen as a by-product of other processes does not impact the GWP of hydrogen, as its emissions are included in the processes of the main product. We do not factor in any rise in by-product generation; instead, we assume a yearly growth in the quantity of hydrogen generated through electrolyzers. For 2050 it is assumed that 100% of all hydrogen used in automotive applications will be produced by electrolysis. While high temperature steam electrolysis in combination with nuclear power plants can utilize the exhaust heat from nuclear reaction, in combination with renewable electricity, the heat demand must be served by natural gas [42]. Therefore, hydrogen from renewable electricity is assumed to be produced with PEM electrolyzers. The electrolysis of hydrogen is not present in Ecoinvent 3.9.1 and is therefore modelled according to [43] with the German electricity mix of 2030 and 2050. The process includes the upstream emissions for the construction of a 1MW PEM stack and BoP. The production of 1 kg hydrogen requires 55 kWh electricity for the electrolysis (efficiency 60%). The hydrogen production in 2030 is assumed as a mix of 50% of electrolysis and 50% of hydrogen mix of 2020. This conjecture is comparable to the IEAs APS scenario for 2030, where 51% of hydrogen is generated by electrolysis and the rest by a mix of fossil fuels with [1].
Table 3 depicts the GWP of electricity and hydrogen production. As of 2030, the emission-free production from by-product diminishes proportionally, and the use of non-renewable electricity for electrolysis leads to higher emissions compared to the conventional mix. Consequently, there is an observable initial increase in emissions per kilogram of hydrogen by 2030. However, by 2050, there is a significant decline in emissions per kilogram of hydrogen, aligning with the emissions trend of the grid mix. Until 2050, the GWP of electricity production in Germany decreases by 81%, the GWP of hydrogen production by 60%. When considering hydrogen’s lower heating value of 33.3 kWh/kg, the emissions per kWh are 0.393 kg CO2 eq./kWh for 2020 and 0.156 kg CO2 eq./kWh for 2050.

2.3. Selection of Typical Vehicles

In this study we selected typical vehicles in each category. We assume a lifetime of 12 years for the investigated vehicle types [44,45]. For buses and trucks, we included a battery change after six years [44,46]. The following three subsections define the details of modelled trucks, buses and passenger cars used to demonstrate application scenarios of the energy storage systems. Since the considered vehicles are comparable, we omit modelling the production and end-of-life of all similar parts (vehicle body, chassis, and electronics are not in the scope of the study). For all vehicles, we consider the nominal battery capacity. While every analysed vehicle includes a Li-Ion battery (with varying capacity), FCEV contain, in addition, the fuel cell system with auxiliaries (BoP) and a hydrogen tank.

2.3.1. Passenger Cars

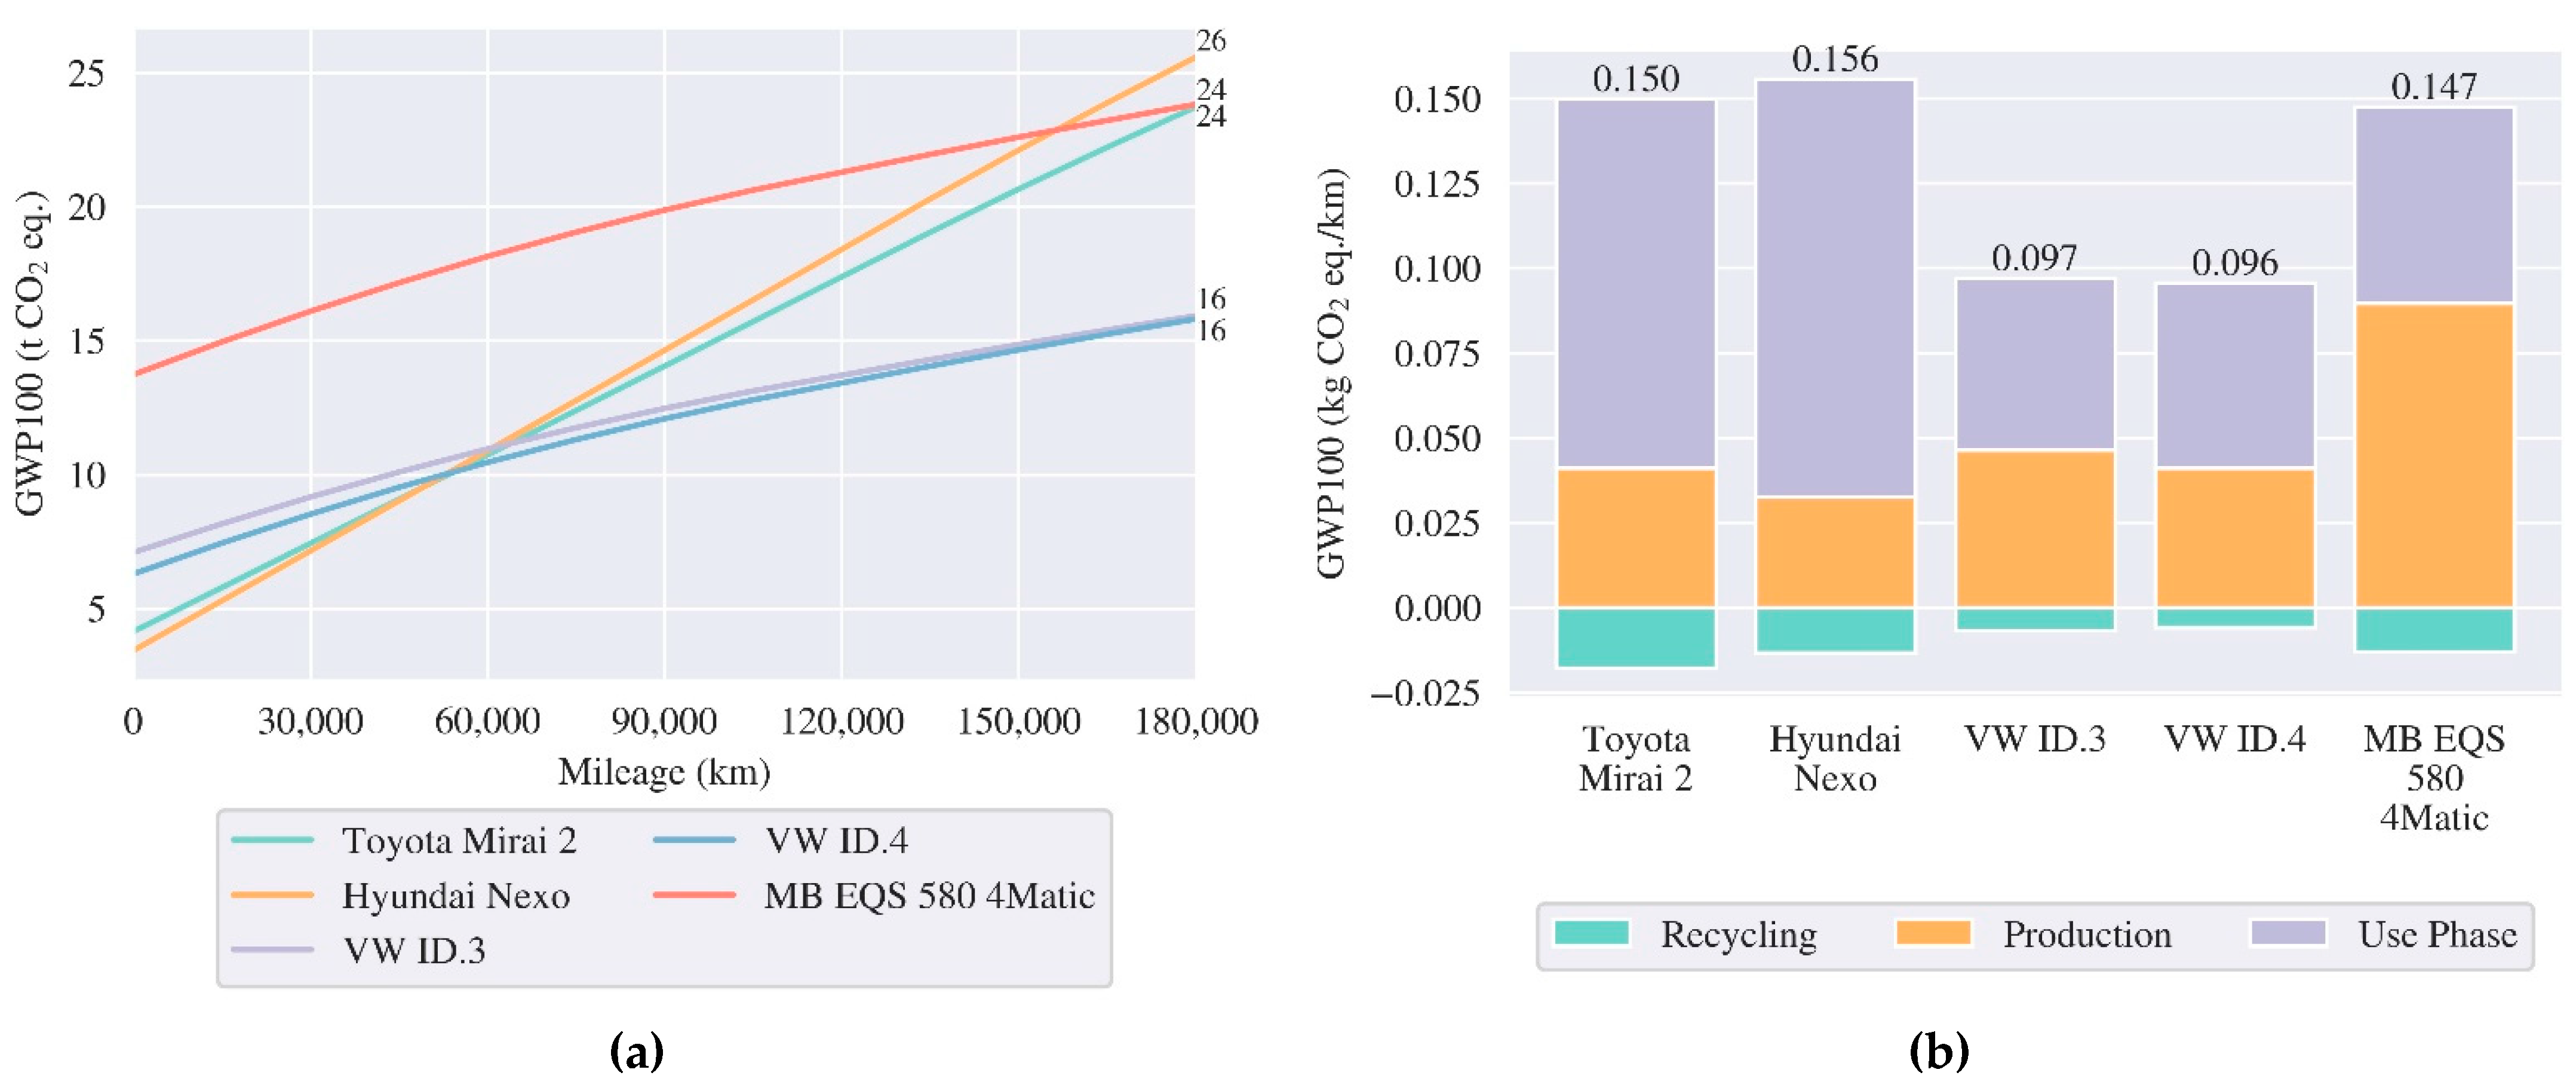
Table 4 shows the vehicle properties for different passenger cars available on the market. The vehicles are chosen to be comparable regarding their weight and vehicle class (coupé and SUV). Since the FCEV’s range is an advantage, we added the Mercedes EQS 580 4Matic to represent long vehicle ranges.
The consumption data is based on the worldwide harmonised light vehicles test procedure (WLTP) cycle with low test energy to use standardized BEV values. The SUVs consume more energy than a coupé independent of the weight, which usually is caused by larger surface areas, leading to higher aerodynamic drag. The considered lifetime mileage is 180,000 km over 12 years [47], resulting in an average yearly mileage of 15,000 km/a.

2.3.2. Heavy-Duty Trucks

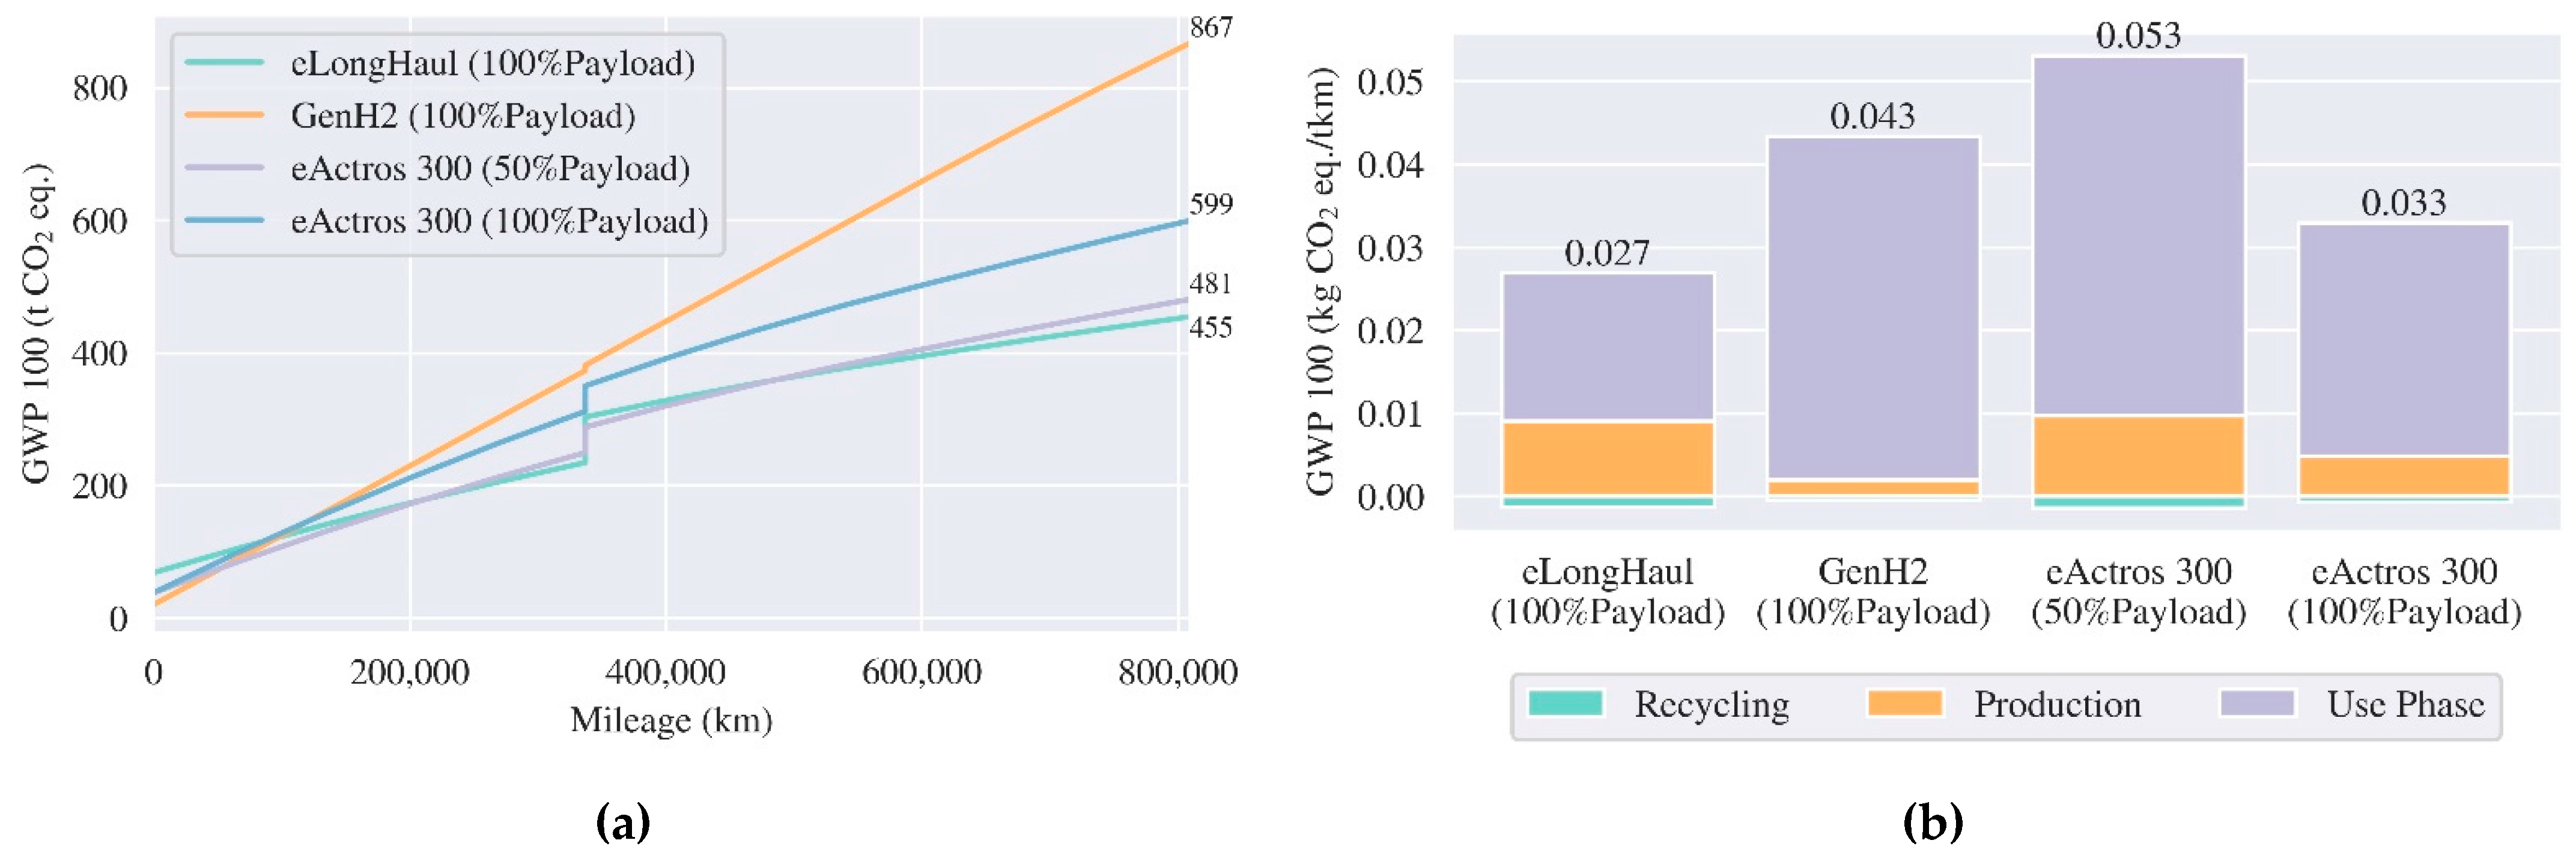
For trucks, we compare four heavy-duty trucks with a gross vehicle weight (GVW) of 40t (Table 5). For heavy-duty vehicles, the energy consumption is dependent on the payload, among others. For regional freight traffic the respective payload is normally around 50% and most manufacturers publish consumption values for 50% payload. However, in long-distance freight transport, the vehicles often use 90-100% of their payload [48]. Therefore, we compare the Daimler eActros 300 with a trailer with 50% payload and the same vehicle with 100% payload. Additionally, we compare the Daimler eActros LongHaul (eLongHaul), which represents a heavy-duty BET with a very large battery capacity and 100% payload and the Daimler GenH2 with 100% payload as an example for a heavy-duty FCET. The considered yearly mileage amounts to 67,415 km/a [45].

2.3.3. City Buses

Extensive initiatives to introduce fully electric city buses are underway in many regions of the world. FCEV city buses have also been commercially available for several years. In this study, we limit ourselves to buses in urban areas. City buses are classified in different lengths and single deck or double deck buses, the latter with a very small market share. We compare two 12 m and 18 m single deck, FCEB and BEB and adopt the vehicle specifications of the Solaris Urbino Electric and Solaris Urbino Hydrogen buses (Table 6). The 18m BEB has a significantly smaller battery and must be combined with opportunity charging at terminal stops. This infrastructure contributes additional emissions, which are not in the scope of this study. The application of depot or "opportunity charging" is based on operational and cost aspects as discussed in [44].
The energy consumption of electric buses in particular is highly dependent on the ambient temperature, as a very large passenger compartment has to be heated or cooled [59]. In this study, we used the results of a simulation which includes traction and auxiliary consumption for the BEB [58]. For the FCEV, the SFC is based on manufacturer information (Table 6). Finally, the GHG emissions per passenger kilometre are calculated. The considered yearly range is 60,000 km with an average passenger occupancy of 65%. We assume 3.8 driving days per week to compensate for maintenance days and holidays with less occupancy of the bus fleet.

3. Results

3.1. LCA Batteries – Production and End of Life

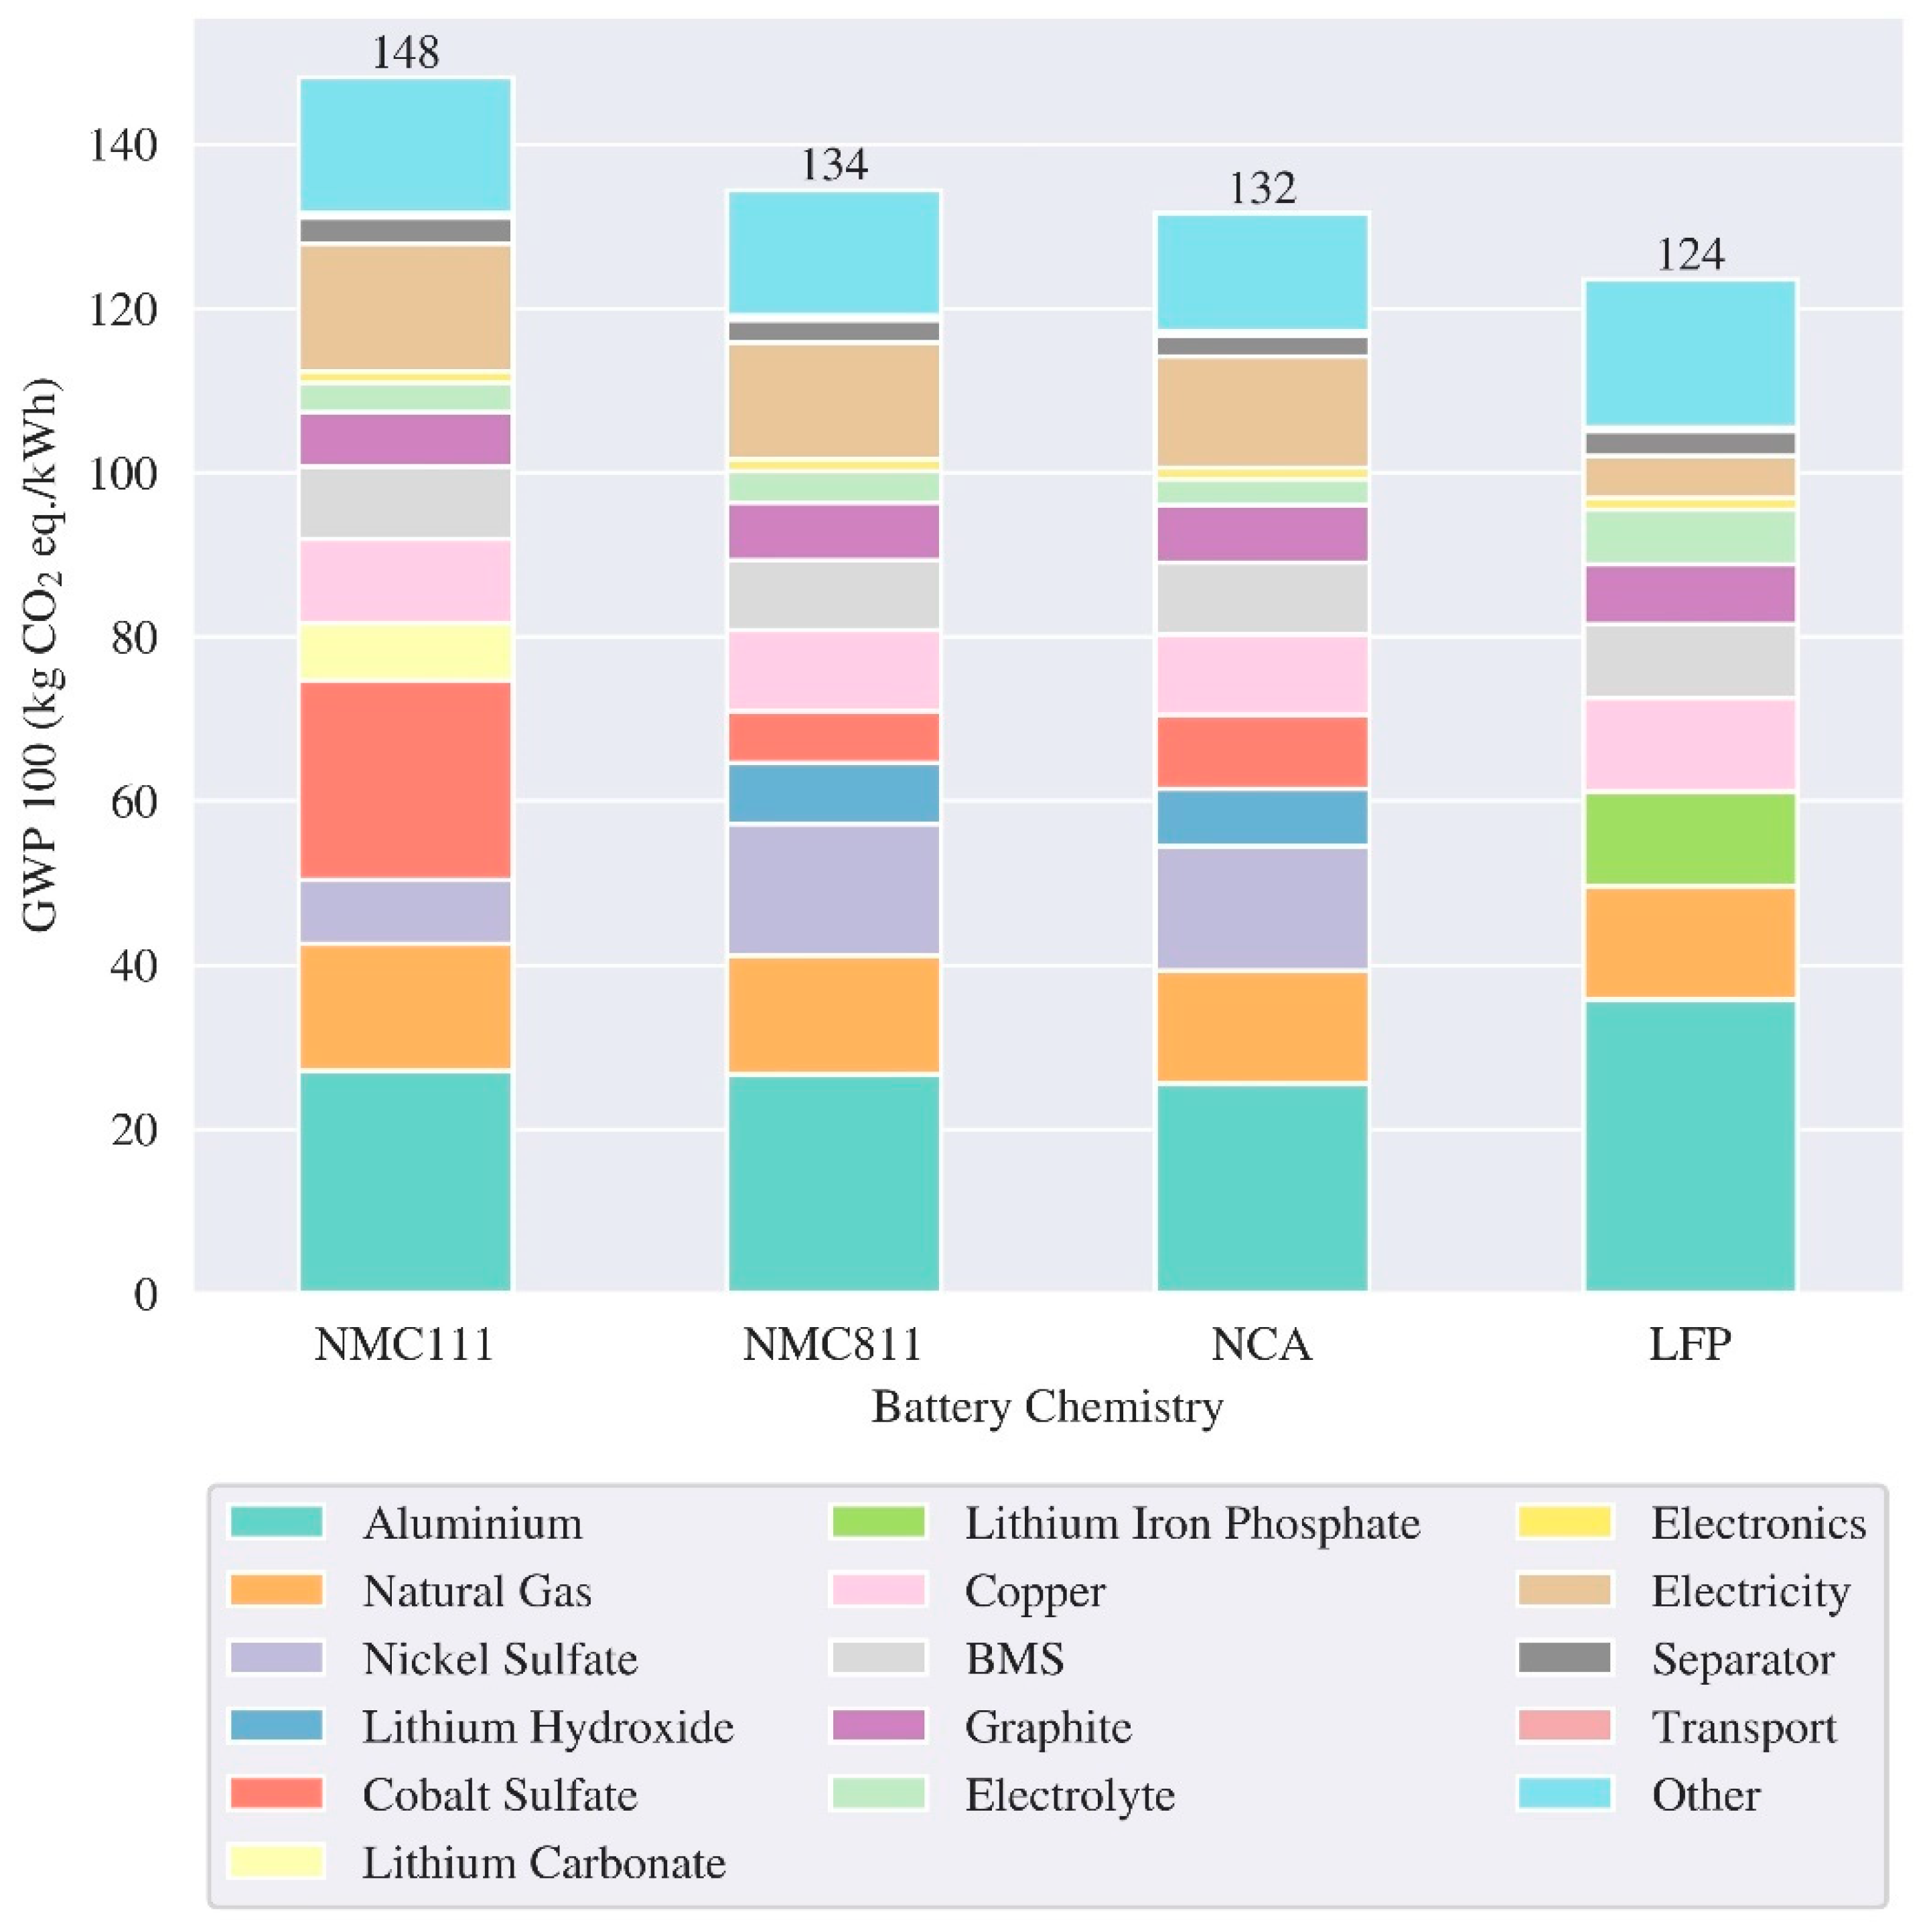
Figure 5 presents the GWP per kWh battery. Despite the relatively high energy density of NMC111, this cell chemistry has the highest GWP of all, which can be attributed to high cobalt content, significantly influencing the battery’s GWP. NMC811 and NCA have lower GWPs due to their reduced cobalt content. Both compensate the lower amount of cobalt with a higher amount of nickel, which results in higher GWP for the nickel content. Although the cobalt content of the NCA is higher than that of the NMC811, it still has a lower GWP due to its highest energy density among all examined cell chemistries. The LFP cell chemistry has the lowest GWP of all cell chemistries. This can be attributed to the absence of cobalt and nickel. However, due to its low energy density, the GWP per kWh is still close to other chemistries. Another implication of the low energy density of the LFP chemistry is the exceptionally high impact of aluminium on its GWP. Aluminium plays a significant role in the GWP of all cell chemistries, as it is used as a casing material for prismatic cells in Ecoinvent 3.9.1.
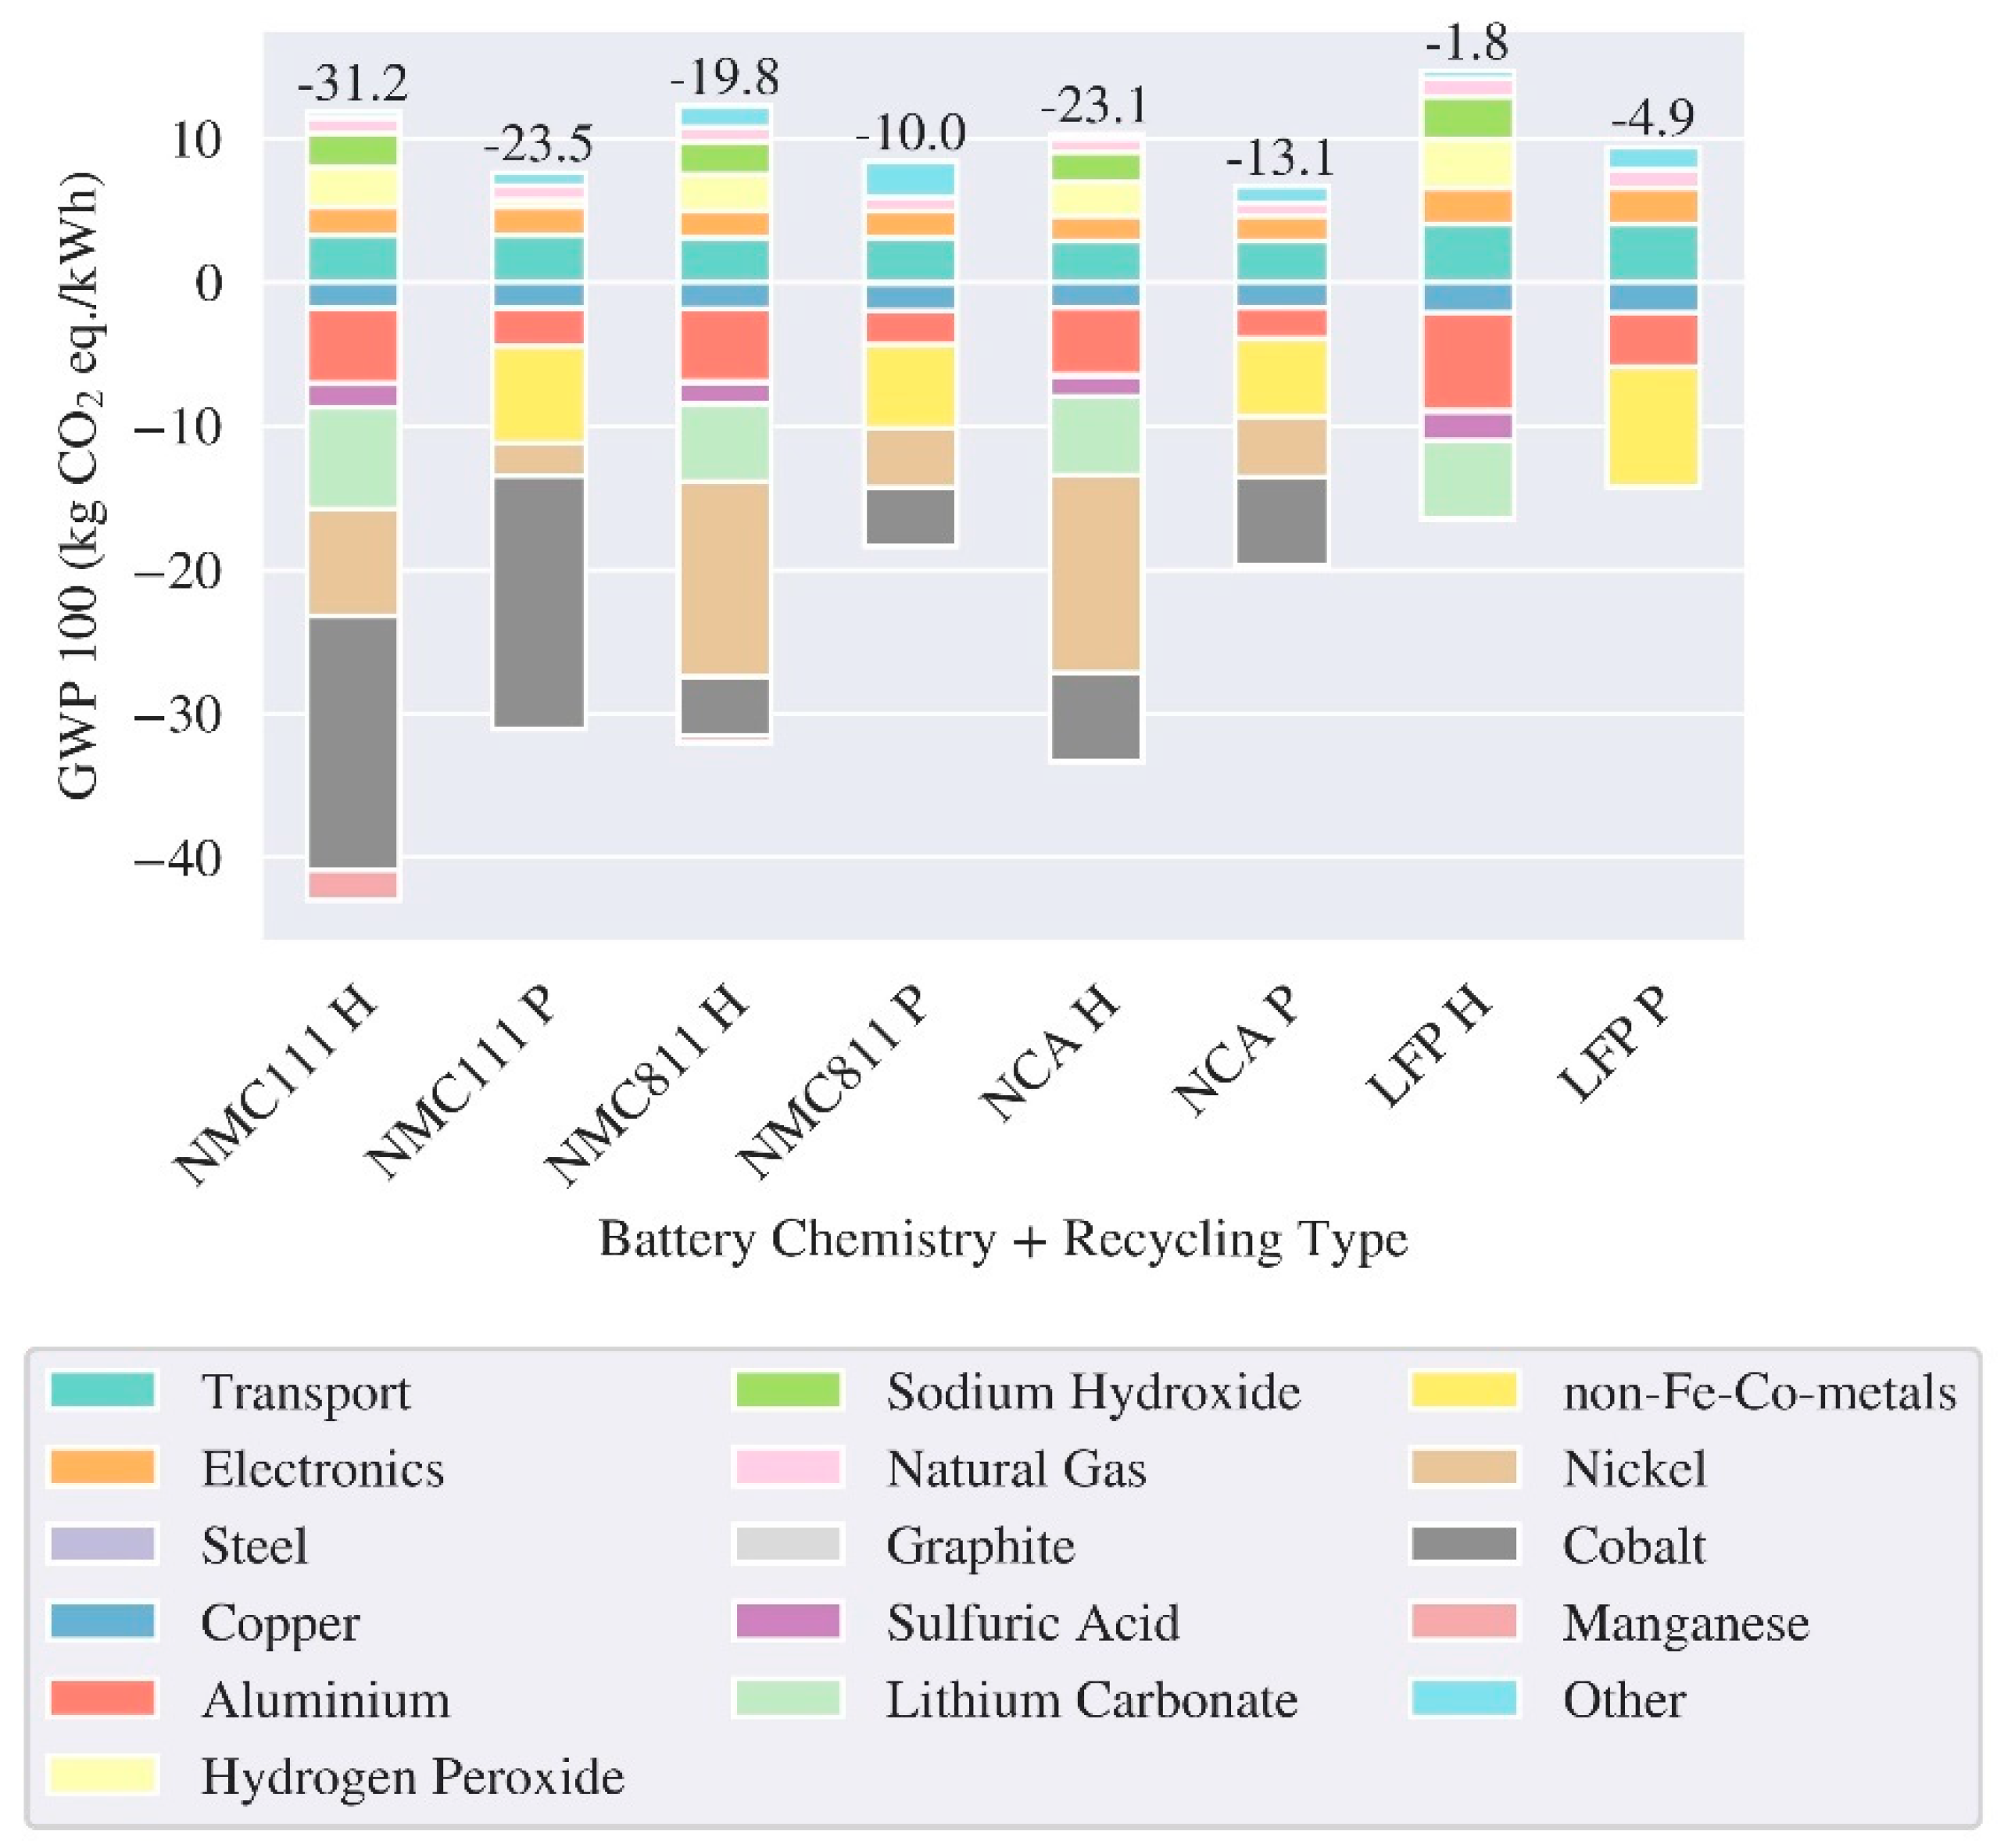
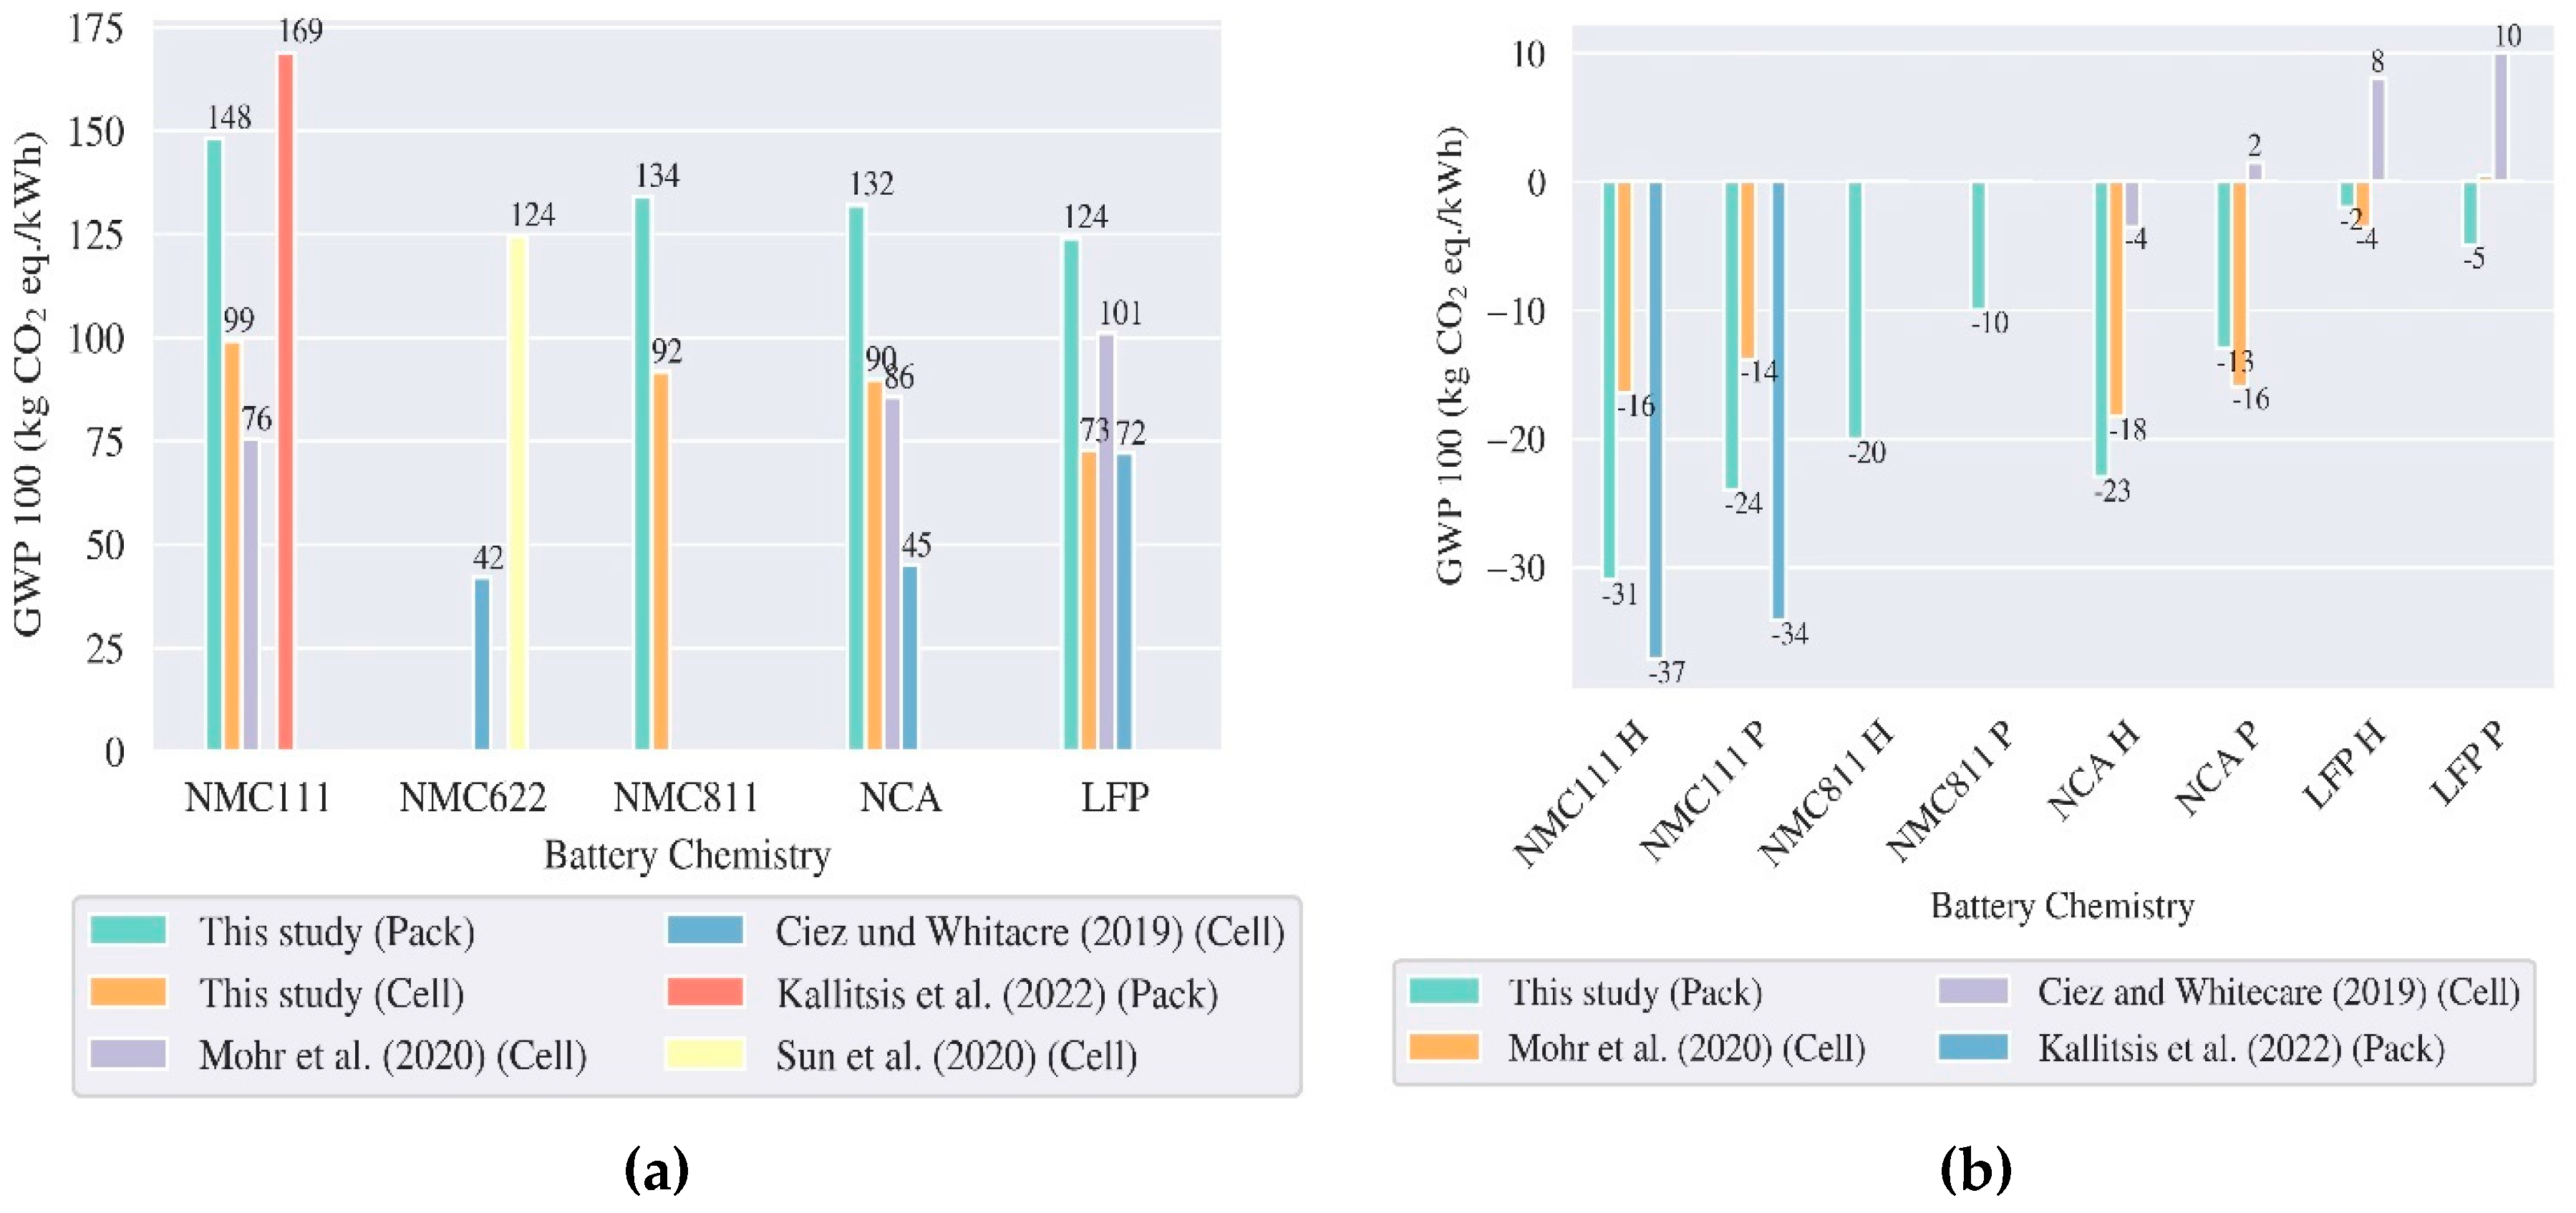
Figure 6 depicts the results of the LCA for different kinds of battery recycling applied to batteries with varying cell chemistries. The positive values show the processes marked as the effort of the recycling, and the negative processes depict the avoided GWP emissions due to decreased need of primary materials. The results demonstrate the significant advantage of hydrometallurgical recycling over pyrometallurgical in all cases. Nickel and cobalt are the materials with the most substantial influence on the overall decrease in GWP, followed by lithium carbonate. It is also noticeable that recycling LFP batteries has the slightest decrease in GWP since this cathode chemistry lacks nickel or cobalt, which have higher benefits regarding the GWP than other battery materials.
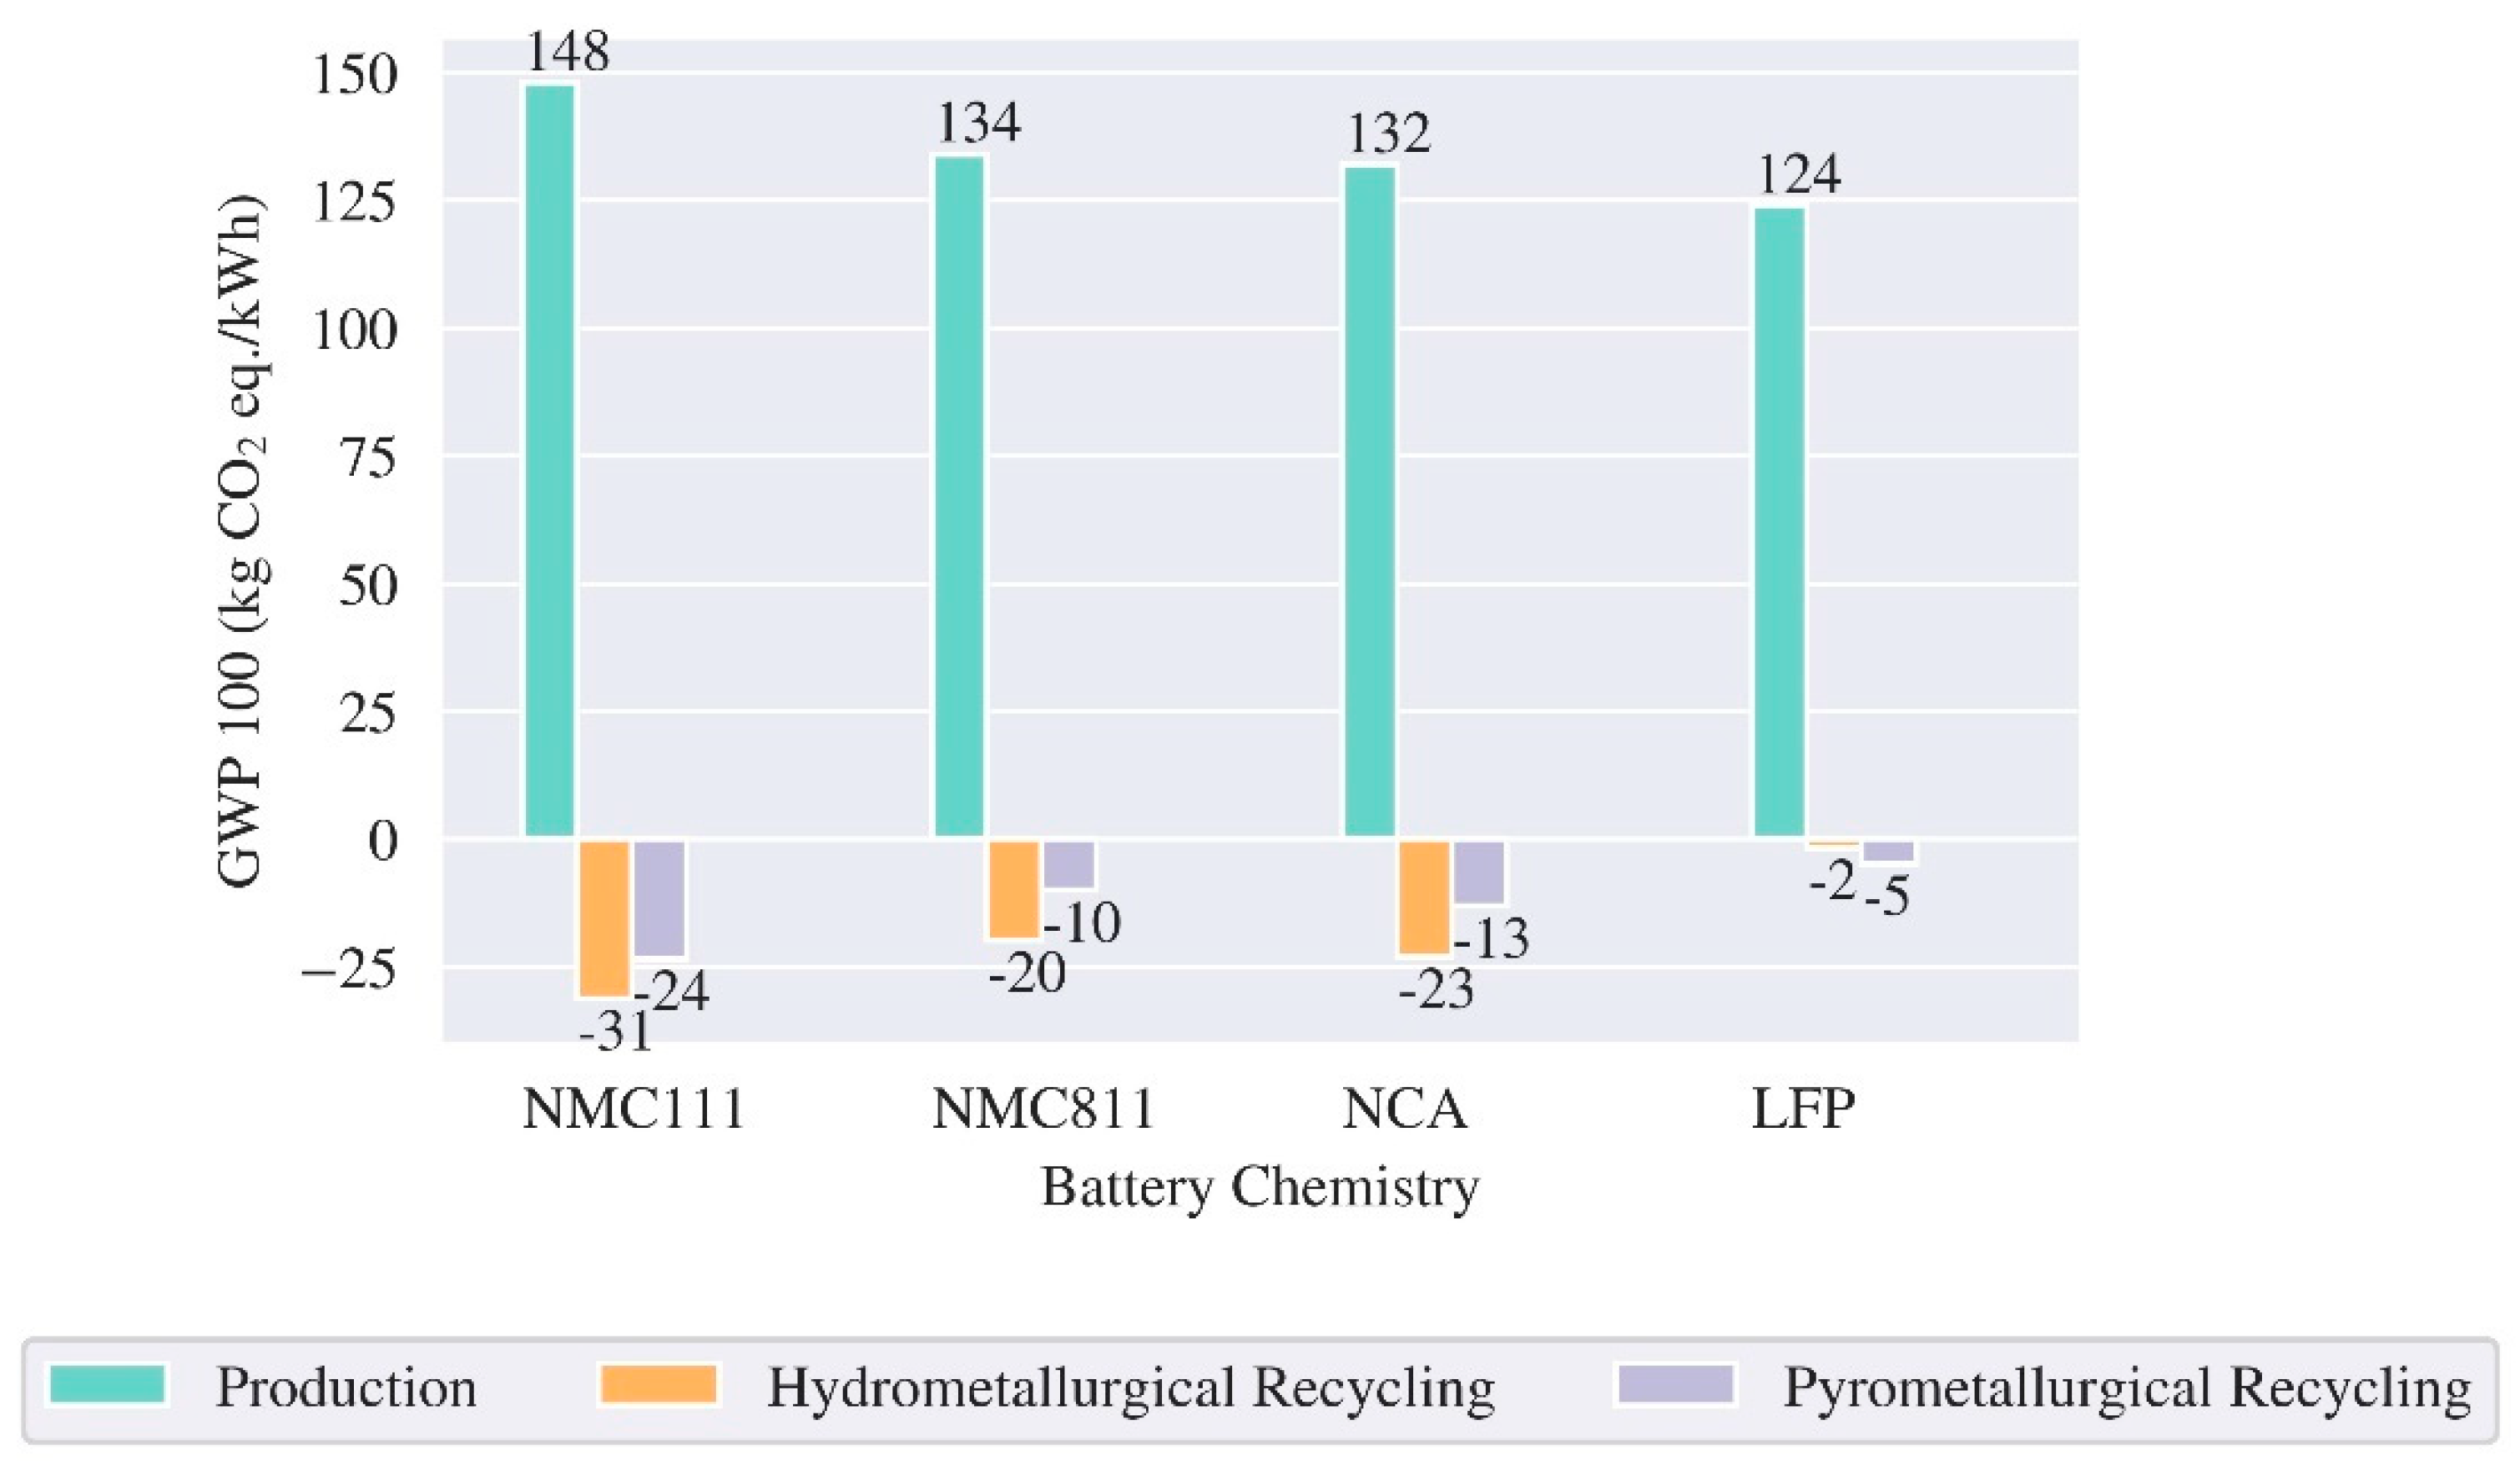
Compared to the production phase (Figure 7), hydrometallurgical recycling of NMC111 batteries shows a 21% reduction in GWP, highest among all cell chemistries and recycling methods. However, the NCA battery has the lowest GWP after the recycling phase – 108 kg CO2 eq/kWh. The LFP battery has the highest GWP after the recycling phase – 118 kg CO2 eq/kWh.

3.2. LCA Fuel Cell and Hydrogen Tank – Production and End of Life

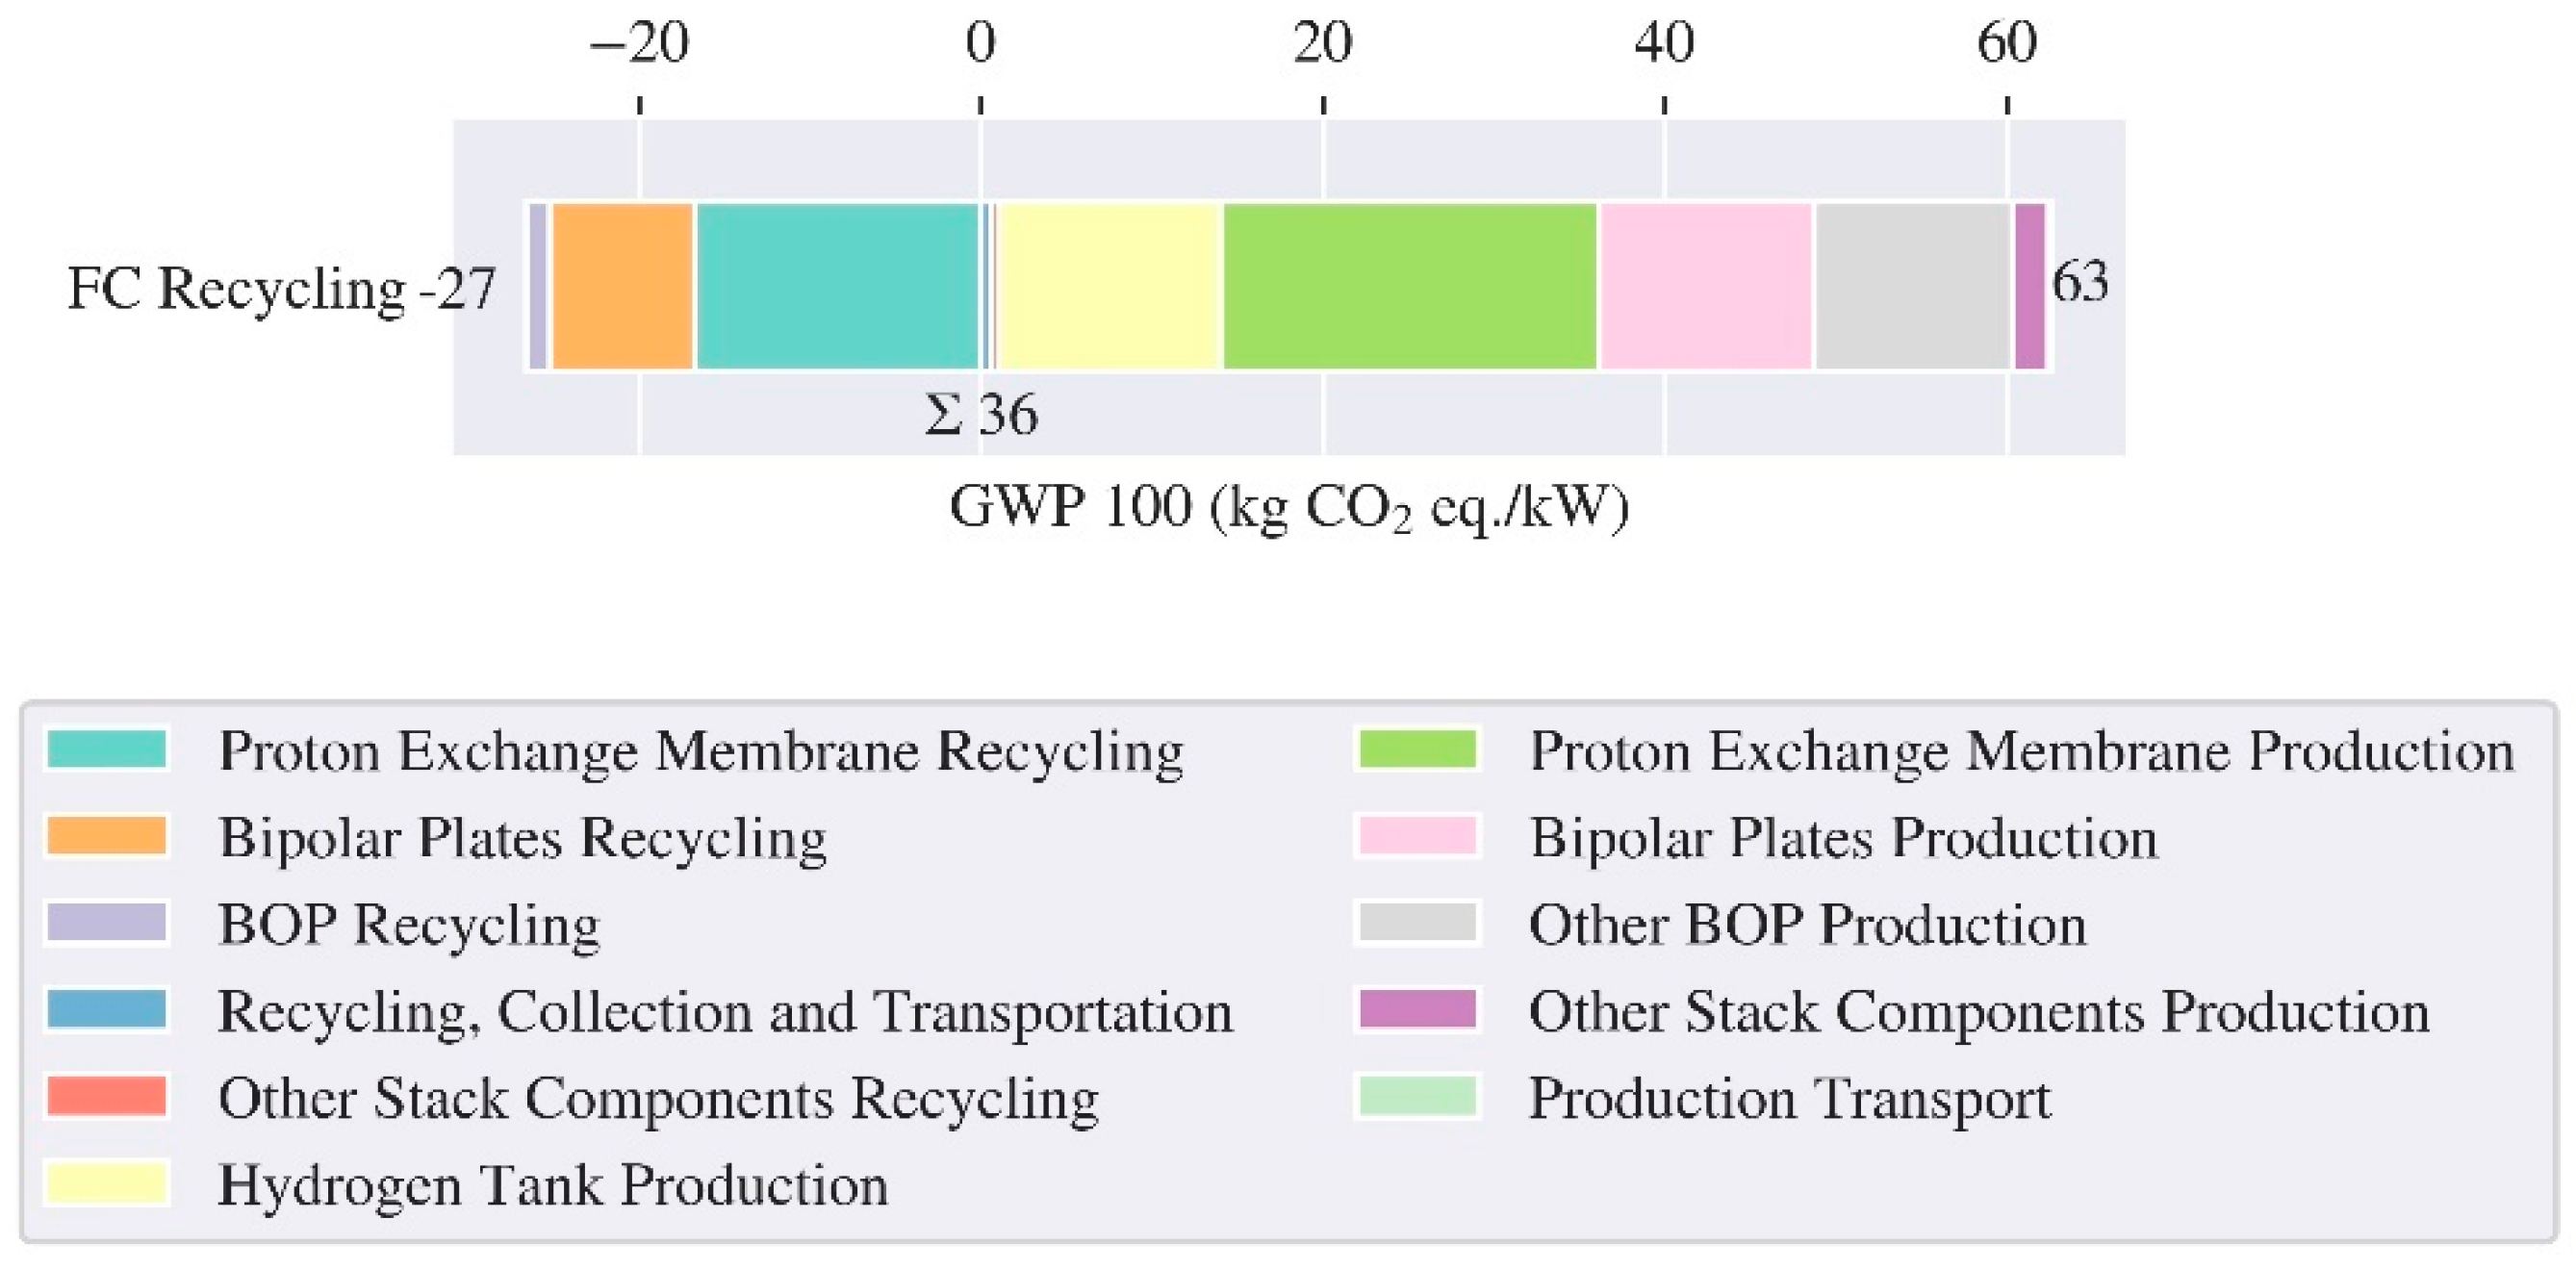
Figure 8 depicts the GWP per kW for recycling and producing a FC tank and BoP. The tank and BoP emissions refer to an 80 kW fuel cell and are therefore divided by 80 for the representation. The recycling process includes all components of the FC. The largest contributor to production GWP is the PEM production, followed by the hydrogen tank, bipolar plates and other BoP production. Despite only considering one third of the hydrogen tank’s production emissions, it still contributes to one fifth of the entire production emissions of the FC system. Recycling the PEM with the catalyst also leads to a significant reduction in GWP, followed by the recycling of the bipolar plates. As a rare metal, platinum has an exceptionally high GWP in the production phase, which can be reduced through recycling. The recycling of the BoP reduces the GWP while collection and transportation, and the recycling of other stack components increases the total GWP.

3.3. LCA Vehicles (w/o Glider, Motor, Brake and Tire)

3.3.1. Passenger Cars

The results for passenger cars show the benefits of BEV in the private-use sector (Figure 9). The VW ID.3 has the lowest overall GWP impact, which is slightly lower than that of the VW ID.4. VW ID.3 has a bigger battery than VW ID.4. However, its overall vehicle mass is lower compared to the ID.4, which reduces the energy consumption in the use phase. The FCEV have a higher GWP impact overall due to higher use phase emissions. Only the MB EQS 580 4Matic’s GWP is close to the GWP of the FCEV, caused by its large battery, high vehicle weight and therefore considerable energy consumption. It should be noted that GWP impact results only include the emissions from energy use in the use phase and the life cycle emissions of batteries and FC systems.

3.3.2. Heavy-Duty Trucks

The BET with 100% payload have a lower absolute GWP than the FCET (Figure 10). The eLongHaul exhibits the highest production share in GWP, however the low use phase emissions result in the lowest absolute GWP. While the eActros 300 with 50% payload exhibits the second lowest absolute emissions, the same truck with 100% payload shows an approximately 30% higher absolute GWP than the eLongHaul. However, regarding the emissions per tkm, the eLonghaul with 100% payload shows the lowest GWP and the eActros 300 with 100% payload performs better than the GenH2 per tkm. The eActros 300 with 50% payload has the highest GWP per tkm. The GenH2 reveals the lowest production and highest use phase share in GWP.

3.3.3. City Buses

The BEB show lower values of GWP than the FCEB (Figure 11). Despite its considerably smaller battery, the 18m BEB has slightly higher overall GHG emissions than the 12m BEB. However, regarding the emissions per passenger kilometre, the 18m BEB has the lowest GWP. The 12m BEB performs better than the 18m FCEB and the 12m FCEB has the highest emissions per passenger kilometre. The 12m BEB has the highest share of production emissions, while the 12m FCEB exhibits the highest use phase share in GWP.

5. Discussion

5.1. Comparison with other Studies

In contrast to the consequential LCA approach of this study, some of the compared studies used attributional LCA approach [8,9,11,16]. Other studies did not explicitly specify their LCA approach [10,17,18,19,20] and were therefore considered as attributional LCA. We believe that a consequential LCA approach is better suited for a comprehensive comparative study which considers a substantial transformation of the transport sector. Figure 12 shows our results for cell and pack level and the results from other studies. During the production phase, the LFP battery exhibited the lowest GWP among all the evaluated battery chemistries. In contrast to Mohr et al. and Ciez and Whitecare [10,11], the pyrometallurgical recycling of LFP batteries yielded benefits. However, it is noteworthy that recycling only slightly decreased the overall GWP for LFP batteries, which stands in contrast to the other chemistries where recycling led to a high reduction in GWP. Specifically, hydrometallurgical recycling of nickel-cobalt-based batteries yielded the most substantial benefits, while pyrometallurgical recycling resulted in intermediate gains.
For the production phase of the FC we find nearly identical results as Usai et al. [17], the slight deviation in the production of the FC stack and hydrogen fuel tank may be attributed to the fact that we use a newer version of the Ecoinvent database. As for the EoL of the FC powertrain, the results show a significant potential of the recycling technology for the catalyst. Most of the recycling processes for the FC BoP and stack components other than catalyst were simplified due to the lack of sufficient data on this topic. Therefore, electricity, heat and transportation emissions were not included, which would increase the overall GWP. Moreover, the analysed recycling approach of the FC catalyst does not depict recycling on an industrial scale, which can impact the results. Some of the process steps can be realized with improved efficiency on the industrial scale. Generally, the recycling process described by Duclos et al. [21] omits steps that are challenging to optimize for industrial applications.

5.2. Comparative Life Cycle Assessment

The findings of the study clearly show that the recycling of FC systems results in a substantial decrease in GHG emissions and that the recycling of batteries exhibits a smaller, but still significant reduction. However, even with higher production and end-of-life emissions, all BEV - except one passenger car with an exceptionally large battery and vehicle weight - exhibited a lower GWP over vehicle lifetime than their FC electric counterparts. This is attributed to lower emissions during the use phase. Hydrogen produced by fossil fuels without carbon capture or by electricity based on fossil fuels has high upstream emissions. Additionally, the overall tank-to-wheel efficiency of FCEV is lower compared to BEV. This means, FCEV would only have a smaller use phase GWP than their BEV counterparts in regions with grid mixes that are more carbon-intensive than the hydrogen mixes. At the same time, green hydrogen produced by a renewable electricity mix would always underperform direct electricity production.
The MB EQS 580 4Matic results in a higher GWP than the other BEV, close to the GWP of FC electric passenger cars. However, if comparing the MB EQS 580 4Matic with other luxury FCEV (for example the concept vehicles Audi h-tron quattro or Mercedes F-Cell), the higher consumption values of those vehicles would result in higher emissions. Consequently, for passenger cars in the same vehicle class, BEV are most likely to have lower emissions than FCEV.
The eActros 300 with 50% payload (100%) has 47% (33%) less emissions than the GenH2. The eLongHaul has the lowest GWP with 49% fewer emissions overall. However, it should be noted that the GenH2 and the eLongHaul are both prototype vehicles. Since the differences in payload for BET and FCET are noticeably small, the emissions per tonne-kilometre align with the overall results. At the same time, the eActros with 100% payload exhibits the second largest absolute emissions while having the second lowest GWP per tkm. It should be noted that the range of the vehicles drastically decreases with higher payloads. Thus, the trade-off between range, payload and consumption should be assessed in detail for individual applications.
Regarding their overall life cycle emissions, the BEB has a substantially lower GWP than the FCEB. Even when considering emissions per passenger-kilometre, the BEB show lower emissions, despite smaller passenger capacities. The 18m BEB had the lowest GWP per passenger kilometre with 0.008 kg CO2 eq/Pkm.

5.3. Limitations

The primary challenge in modelling this LCA was the consistent integration of data from various sources. For instance, the battery recycling in Everbatt [13] did not account for the prismatic casing modelled in Ecoinvent [14]. The hydrogen mix from fossil fuels neglects the possibility of carbon capture completely. Hydrogen produced by reforming or gasification with carbon capture would decrease the GWP per kg hydrogen accordingly.
Another challenge was finding comparable vehicles, as there are presently just a few vehicles on the market that can be sold in both BEV and FCEV versions. Comparing vehicles with close properties is an appropriate approximation, although it introduces uncertainty.
The calculated impacts of FC powertrain recycling demonstrate decreases in GWP comparable to recycling Li-ion batteries. Nonetheless, the described recycling processes have yet to achieve industrial scale. To evaluate the recycling of fuel cell systems, our literature review and own assessment unmistakably underscore the need for industry data and scientific studies.
The losses of hydrogen due to transportation and compression are not included in our calculations. Considering these effects would increase the emissions of FCEV, therefore enlarging the gap between FCEV and BEV.
The trucks in our study are comparable in size. However, the GenH2 offers twice the range of the eLongHaul, four times compared to eActros 300. Therefore, the GenH2 can be used for more use cases. At the same time, regulations in most parts of the world require truck drivers to take a break after 3-5 hours of driving. This break could be used to recharge/refuel the vehicle [48]. The question of which range is actually advantageous depends on numerous factors that cannot be analysed here.
Our assessment excluded all vehicle parts which are similar for FCEV and BEV. It is important to understand that our results do not display full life cycle emissions for the regarded vehicles and should only be used for comparing these two technologies used in comparable vehicles (regarding size, weight, payload, passenger capacity etc.). For comparing the vehicles with other technologies (e.g., ICEV), the differing components must be included. For a whole LCA of the vehicles, all parts of the vehicles should be considered.
This study focused on GWP. However, there are further environmental impact categories (e.g. acidification, resource depletion and air quality), but also social and economic categories which are impacted by alternative powertrains and not within the scope of this study.

6. Conclusion

The primary outcome of this study is a comparative cradle-to-grave LCA for batteries and fuel cell systems. Our results highlight that fuel cell and battery systems exhibit large emissions in the production phase. Recycling can significantly offset some of these emissions, but a comparison of the examined technologies revealed substantial differences. The recycling of fuel cell systems offers a significant potential for decarbonization primarily based on platinum recycling. The assessed recycling processes for NMC and NCA batteries primarily focus on nickel and cobalt, as the recovery of these materials is possible with high recovery rates and promising financial potential. Recycling of LFP batteries, lacking these materials, results in a smaller decarbonisation benefit. At the same time, it should be emphasized that decarbonization is just one aspect of recycling, material recovery can be of greater importance.
When comparing passenger cars, trucks and buses, battery electric vehicles consistently outperform fuel cell electric vehicles regarding absolute greenhouse gas emissions. Hence, we recommend prioritizing battery electric over fuel cell vehicles. However. deploying fuel cell vehicles could become attractive in a hydrogen economy scenario where other factors, e. g. the conversion and storage of surplus renewable electricity via electrolysis, become important.

Supplementary Materials

The following supporting information can be downloaded at the website of this paper posted on Preprints.org.

Author Contributions

Conceptualization, P.S. and A.M.S.; methodology, A.M.S., P.S., L.F.; software, L.F., P.S. and A.P.; validation, A.M.S., P.S. and D.G.; formal analysis, P.S. and A.M.S.; investigation, P.S. and L.F.; resources, A.M.S. and D.G.; data curation, P.S., L.F., A.M.S. and A.P.; writing—original draft preparation, P.S., L.F. and A.M.S.; writing—review and editing, A.M.S., P.S., A.P. and D.G.; visualization, A.P., L.F., P.S., and A.M.S.; supervision, A.M.S. and D.G.; project administration, A.M.S. and D.G.; funding acquisition, D.G. and A.M.S. All authors have read and agreed to the published version of the manuscript.

Funding

Parts of this work was funded by the Deutsche Forschungsgemeinschaft (DFG, German Research Foundation), project number 398051144 and by the Federal Ministry of Education and Research of the Federal Republic of Germany as part of the Research Campus Mobility2Grid (www.mobility2grid.de) funding code: 03SF0674A.

Data Availability Statement

Restrictions apply to the availability of inventory data. Data was obtained from Ecoinvent 3.9.1 and are available [at https://ecoinvent.org/] with the permission of Ecoinvent. All other data is publicly available or contained within the article or supplementary materials.

Acknowledgments

We acknowledge support by the German Research Foundation and the Open Access Publication Fund of TU Berlin.

Conflicts of Interest

The authors declare no conflict of interest. The funders had no role in the design of the study; in the collection, analyses, or interpretation of data; in the writing of the manuscript, or in the decision to publish the results.

References

  1. IEA. Global Hydrogen Review 2021. Available online: https://iea.blob.core.windows.net/assets/5bd46d7b-906a-4429-abda-e9c507a62341/GlobalHydrogenReview2021.pdf (accessed on 6 February 2024).
  2. Statista. Mobility Market Insights - Electric Vehicles Worldwide. Available online: https://www.statista.com/outlook/mmo/electric-vehicles/worldwide (accessed on 6 February 2024).
  3. Statista. Projected fuel cell electric vehicle deployment worldwide between 2020 and 2030. Available online: https://www.statista.com/statistics/1272505/fuel-cell-electric-vehicle-global-deployment/ (accessed on 6 February 2024).
  4. Gregor Fröhlich. Well-to-Wheel – Verbrenner versus E-Mobil. Available online: https://energiewende.eu/well-to-wheel/#Wasserstoff_Brennstoffzellenfahrzeug (accessed on 6 February 2024).
  5. Mori, M.; Stropnik, R.; Sekavčnik, M.; Lotrič, A. Criticality and Life-Cycle Assessment of Materials Used in Fuel-Cell and Hydrogen Technologies. Sustainability 2021, 13, 3565. [Google Scholar] [CrossRef]
  6. Dai, Q.; Kelly, J.C.; Gaines, L.; Wang, M. Life Cycle Analysis of Lithium-Ion Batteries for Automotive Applications. Batteries 2019, 5, 48. [Google Scholar] [CrossRef]
  7. Rajaeifar, M.A.; Raugei, M.; Steubing, B.; Hartwell, A.; Anderson, P.A.; Heidrich, O. Life cycle assessment of lithium-ion battery recycling using pyrometallurgical technologies. Journal of Industrial Ecology 2021, 25, 1560–1571. [Google Scholar] [CrossRef]
  8. Kallitsis, E.; Korre, A.; Kelsall, G.H. Life cycle assessment of recycling options for automotive Li-ion battery packs. Journal of Cleaner Production 2022, 371, 133636. [Google Scholar] [CrossRef]
  9. Sun, X.; Luo, X.; Zhang, Z.; Meng, F.; Yang, J. Life cycle assessment of lithium nickel cobalt manganese oxide (NCM) batteries for electric passenger vehicles. Journal of Cleaner Production 2020, 273, 123006. [Google Scholar] [CrossRef]
  10. Mohr, M.; Peters, J.F.; Baumann, M.; Weil, M. Toward a cell-chemistry specific life cycle assessment of lithium-ion battery recycling processes. Journal of Industrial Ecology 2020, 24, 1310–1322. [Google Scholar] [CrossRef]
  11. Ciez, R.E.; Whitacre, J.F. Examining different recycling processes for lithium-ion batteries. Nat Sustain 2019, 2, 148–156. [Google Scholar] [CrossRef]
  12. Tao, Y.; Rahn, C.D.; Archer, L.A.; You, F. Second life and recycling: Energy and environmental sustainability perspectives for high-performance lithium-ion batteries. Sci. Adv. 2021, 7, eabi7633. [Google Scholar] [CrossRef]
  13. Dai, Q.; Spangenberger, J.; Ahmed, S.; Gaines, L.; Kelly, J.C.; Wang, M. EverBatt: A Closed-loop Battery Recycling Cost and Environmental Impacts Model. Available online: https://publications.anl.gov/anlpubs/2019/07/153050.pdf (accessed on 6 February 2024).
  14. ecoinvent. Home - ecoinvent. Available online: https://ecoinvent.org/ (accessed on 6 February 2024).
  15. GREET | Argonne National Laboratory. Available online: https://www.anl.gov/topic/greet (accessed on 6 February 2024).
  16. Miotti, M.; Hofer, J.; Bauer, C. Integrated environmental and economic assessment of current and future fuel cell vehicles. Int J Life Cycle Assess 2015, 22, 94–110. [Google Scholar] [CrossRef]
  17. Usai, L.; Hung, C.R.; Vásquez, F.; Windsheimer, M.; Burheim, O.S.; Strømman, A.H. Life cycle assessment of fuel cell systems for light duty vehicles, current state-of-the-art and future impacts. Journal of Cleaner Production 2021, 280, 125086. [Google Scholar] [CrossRef]
  18. Evangelisti, S.; Tagliaferri, C.; Brett, D.J.; Lettieri, P. Life cycle assessment of a polymer electrolyte membrane fuel cell system for passenger vehicles. Journal of Cleaner Production 2017, 142, 4339–4355. [Google Scholar] [CrossRef]
  19. Benitez, A.; Wulf, C.; Palmenaer, A. de; Lengersdorf, M.; Röding, T.; Grube, T.; Robinius, M.; Stolten, D.; Kuckshinrichs, W. Ecological assessment of fuel cell electric vehicles with special focus on type IV carbon fiber hydrogen tank. Journal of Cleaner Production 2020, 278, 123277. [Google Scholar] [CrossRef]
  20. Lotrič, A.; Sekavčnik, M.; Kuštrin, I.; Mori, M. Life-cycle assessment of hydrogen technologies with the focus on EU critical raw materials and end-of-life strategies. International Journal of Hydrogen Energy 2021, 46, 10143–10160. [Google Scholar] [CrossRef]
  21. Duclos, L.; Chattot, R.; Dubau, L.; Thivel, P.-X.; Mandil, G.; Laforest, V.; Bolloli, M.; Vincent, R.; Svecova, L. Closing the loop: life cycle assessment and optimization of a PEMFC platinum-based catalyst recycling process. Green Chem. 2020, 22, 1919–1933. [Google Scholar] [CrossRef]
  22. Duclos, L.; Lupsea, M.; Mandil, G.; Svecova, L.; Thivel, P.-X.; Laforest, V. Environmental assessment of proton exchange membrane fuel cell platinum catalyst recycling. Journal of Cleaner Production 2017, 142, 2618–2628. [Google Scholar] [CrossRef]
  23. Stropnik, R.; Lotrič, A.; Bernad Montenegro, A.; Sekavčnik, M.; Mori, M. Critical materials in PEMFC systems and a LCA analysis for the potential reduction of environmental impacts with EoL strategies. Energy Science & Engineering 2019, 7, 2519–2539. [Google Scholar]
  24. Lombardi, L.; Tribioli, L.; Cozzolino, R.; Bella, G. Comparative environmental assessment of conventional, electric, hybrid, and fuel cell powertrains based on LCA. Int J Life Cycle Assess 2017, 22, 1989–2006. [Google Scholar] [CrossRef]
  25. Idris. M; Koestoer R. H. Environmental life cycle assessment of conventional and electric vehicles: lessons learned from selected countries. JIMESE 2023, 1. [Google Scholar]
  26. Joshi, A.; Sharma, R.; Baral, B. Comparative life cycle assessment of conventional combustion engine vehicle, battery electric vehicle and fuel cell electric vehicle in Nepal. Journal of Cleaner Production 2022, 379, 134407. [Google Scholar] [CrossRef]
  27. Rüdisüli, M.; Bach, C.; Bauer, C.; Beloin-Saint-Pierre, D.; Elber, U.; Georges, G.; Limpach, R.; Pareschi, G.; Kannan, R.; Teske, S.L. Prospective life-cycle assessment of greenhouse gas emissions of electricity-based mobility options. Applied Energy 2022, 306, 118065. [Google Scholar] [CrossRef]
  28. Sacchi, R.; Bauer, C.; Cox, B.L. Does Size Matter? The Influence of Size, Load Factor, Range Autonomy, and Application Type on the Life Cycle Assessment of Current and Future Medium- and Heavy-Duty Vehicles. Environ. Sci. Technol. 2021, 55, 5224–5235. [Google Scholar] [CrossRef]
  29. Booto, G.K.; Aamodt Espegren, K.; Hancke, R. Comparative life cycle assessment of heavy-duty drivetrains: A Norwegian study case. Transportation Research Part D: Transport and Environment 2021, 95, 102836. [Google Scholar] [CrossRef]
  30. Grazieschi, G.; Zubaryeva, A.; Sparber, W. Energy and greenhouse gases life cycle assessment of electric and hydrogen buses: A real-world case study in Bolzano Italy. Energy Reports 2023, 9, 6295–6310. [Google Scholar] [CrossRef]
  31. Analy Castillo Munoz, M.S.; Brian Tarroja, P.; and Scott Samuelsen, P. Life Cycle Assessment of Environmental and Economic Impacts of Deploying Alternative Urban Bus Powertrain Technologies in the South Coast Air Basin, 2019.
  32. DIN EN ISO 14044 - Umweltmanagement – Ökobilanz – Anforderungen und Anleitungen 2021.
  33. Huijbregts, M.A.J.; Steinmann, Z.J.N.; Elshout, P.M.F.; Stam, G.; Verones, F.; Vieira, M.; Zijp, M.; Hollander, A.; van Zelm, R. ReCiPe2016: a harmonised life cycle impact assessment method at midpoint and endpoint level. Int J Life Cycle Assess 2017, 22, 138–147. [Google Scholar] [CrossRef]
  34. Ekvall, T.; Björklund, A.; Sandin, G.; Jelse, K. Modeling recycling in life cycle assessment. Available online: https://www.lifecyclecenter.se/wp-content/uploads/2020_05_Modeling-recyling-in-life-cycle-assessment-1.pdf (accessed on 6 February 2024).
  35. Dai, Q.; Dunn, J.; : Kelly, C.; Elgowainy, A. Update of Life Cycle Analysis of Lithium-ion Batteries in the GREET 2017 Model. Available online: https://greet.es.anl.gov/files/Li_battery_update_2017 (accessed on 6 February 2024).
  36. NPROXX. Type 4 Pressure Vessels. Available online: https://www.nproxx.com/capabilities/type-4-pressure-vessels/ (accessed on 6 February 2024).
  37. Jin, H.; Afiuny, P.; Dove, S.; Furlan, G.; Zakotnik, M.; Yih, Y.; Sutherland, J.W. Life Cycle Assessment of Neodymium-Iron-Boron Magnet-to-Magnet Recycling for Electric Vehicle Motors. Environ. Sci. Technol. 2018, 52, 3796–3802. [Google Scholar] [CrossRef] [PubMed]
  38. Strom-Report. Strommix & Stromerzeugung. Available online: https://strom-report.de/strom/ (accessed on 6 February 2024).
  39. IEA. China - Countries & Regions - IEA. Available online: https://www.iea.org/countries/china (accessed on 30 March 2023).
  40. Öko-Institut e.V. - Institut für angewandte Ökologie, Wuppertal Institut, Prognos AG. Klimaneutrales Deutschland 2045: Wie Deutschland seine Klimaziele schon vor 2050 erreichen kann. Available online: https://www.agora-verkehrswende.de/veroeffentlichungen/klimaneutrales-deutschland-2045-langfassung/ (accessed on 6 February 2024).
  41. Burchart, D.; Gazda-Grzywacz, M.; Grzywacz, P.; Burmistrz, P.; Zarębska, K. Life Cycle Assessment of Hydrogen Production from Coal Gasification as an Alternative Transport Fuel. Energies 2022, 16. [Google Scholar] [CrossRef]
  42. Di Xu; Dong, L.; Ren, J. Chapter 2 - Introduction of hydrogen routines. In HYDROGEN ECONOMY: Supply chain, life cycle analysis and energy transition; Scipioni, A., Manzardo, A., Ren, J., Eds.; ELSEVIER ACADEMIC PRESS: [S.l.], 2023; pp. 45–65. ISBN 978-0-323-99514-6. [Google Scholar]
  43. Bareiß, K.; La Rua, C. de; Möckl, M.; Hamacher, T. Life cycle assessment of hydrogen from proton exchange membrane water electrolysis in future energy systems. Applied Energy 2019, 237, 862–872. [Google Scholar] [CrossRef]
  44. Göhlich, D.; Fay, T.-A.; Jefferies, D.; Lauth, E.; Kunith, A.; Zhang, X. Design of urban electric bus systems. Des. Sci. 2018, 4. [Google Scholar] [CrossRef]
  45. Ferrara, A.; Jakubek, S.; Hametner, C. Cost-optimal design and energy management of fuel cell electric trucks. International Journal of Hydrogen Energy 2023. [Google Scholar] [CrossRef]
  46. Kim, H.; Hartmann, N.; Zeller, M.; Luise, R.; Soylu, T. Comparative TCO Analysis of Battery Electric and Hydrogen Fuel Cell Buses for Public Transport System in Small to Midsize Cities. Energies 2021, 14, 4384. [Google Scholar] [CrossRef]
  47. Koroma, M.S.; Costa, D.; Philippot, M.; Cardellini, G.; Hosen, M.S.; Coosemans, T.; Messagie, M. Life cycle assessment of battery electric vehicles: Implications of future electricity mix and different battery end-of-life management. Sci. Total Environ. 2022, 831, 154859. [Google Scholar] [CrossRef] [PubMed]
  48. Menter, J.; Fay, T.-A.; Grahle, A.; Göhlich, D. Long-Distance Electric Truck Traffic: Analysis, Modeling and Designing a Demand-Oriented Charging Network for Germany. WEVJ 2023, 14, 205. [Google Scholar] [CrossRef]
  49. Mercedes-Benz. Der eActros und seine Services. Available online: https://www.mercedes-benz-trucks.com/de_DE/emobility/world/our-offer/eactros-and-services.html (accessed on 6 February 2024).
  50. Mercedes-Benz. Mercedes-Benz eActros LongHaul feiert Weltpremiere als eActros 600 im Oktober – Produktionswerke bereiten Serienfertigung vor. Available online: https://www.daimlertruck.com/newsroom/pressemitteilung/mercedes-benz-eactros-longhaul-feiert-weltpremiere-als-eactros-600-im-oktober-produktionswerke-bereiten-serienfertigung-vor-52260702 (accessed on 6 February 2024).
  51. Mercedes-Benz. Mercedes-Benz Trucks gibt auf der IAA Transportation 2022 in Hannover einen Ausblick auf den wasserstoffbasierten GenH2 Truck. Available online: https://www.daimlertruck.com/newsroom/pressemitteilung/mercedes-benz-trucks-gibt-auf-der-iaa-transportation-2022-in-hannover-einen-ausblick-auf-den-wasserstoffbasierten-genh2-truck-52032506 (accessed on 6 February 2024).
  52. Solaris Bus & Coach sp. z o.o. Solaris Urbino 12 hydrogen Technische Daten. Available online: https://www.solarisbus.com/public/assets/Biuro_prasowe/UITP_PR/Technische_Daten_Solaris_Urbino_12_hydrogen_de.pdf (accessed on 6 February 2024).
  53. Solaris Bus & Coach sp. z o.o. Emissionsfreie Antriebe Produktkatalog 2023. Available online: https://www.solarisbus.com/public/assets/content/pojazdy/Katalogi_2023/DE_Zeroemisyjne_1920_x_1080.pdf (accessed on 6 February 2024).
  54. Solaris Bus & Coach sp. z o.o. Solaris Urbino 18 hydrogen Technische Daten. Available online: https://www.busplaner.de/sites/default/files/public/data-news/02-technische-daten-urbino-18-hydrogen.pdf (accessed on 6 February 2024).
  55. Solaris Bus & Coach sp. z o.o. Hydrogen. Available online: https://www.solarisbus.com/de/fahrzeuge/zero-emissions/hydrogen (accessed on 6 February 2024).
  56. Solaris Bus & Coach sp. z o.o. Technische Daten – Solaris Urbino 18,75 electric. Available online: https://www.solarisbus.com/public/assets/Biuro_prasowe/2022_10_12_Transexpo/Technische_Daten_Urbino_1875_electric_Transexpo_DE.pdf (accessed on 6 February 2024).
  57. Solaris Bus & Coach sp. z o.o. Technische Daten – Solaris Urbino 12 electric. Available online: https://www.solarisbus.com/public/assets/Biuro_prasowe/2022_10_12_Transexpo/Technische_Daten_Urbino_12_electric_Transexpo_DE.pdf (accessed on 6 February 2024).
  58. Jefferies, D.; Göhlich, D. A Comprehensive TCO Evaluation Method for Electric Bus Systems Based on Discrete-Event Simulation Including Bus Scheduling and Charging Infrastructure Optimisation. WEVJ 2020, 11, 56. [Google Scholar] [CrossRef]
  59. Cigarini, F.; Fay, T.-A.; Artemenko, N.; Göhlich, D. Modeling and Experimental Investigation of Thermal Comfort and Energy Consumption in a Battery Electric Bus. WEVJ 2021, 12, 7. [Google Scholar] [CrossRef]
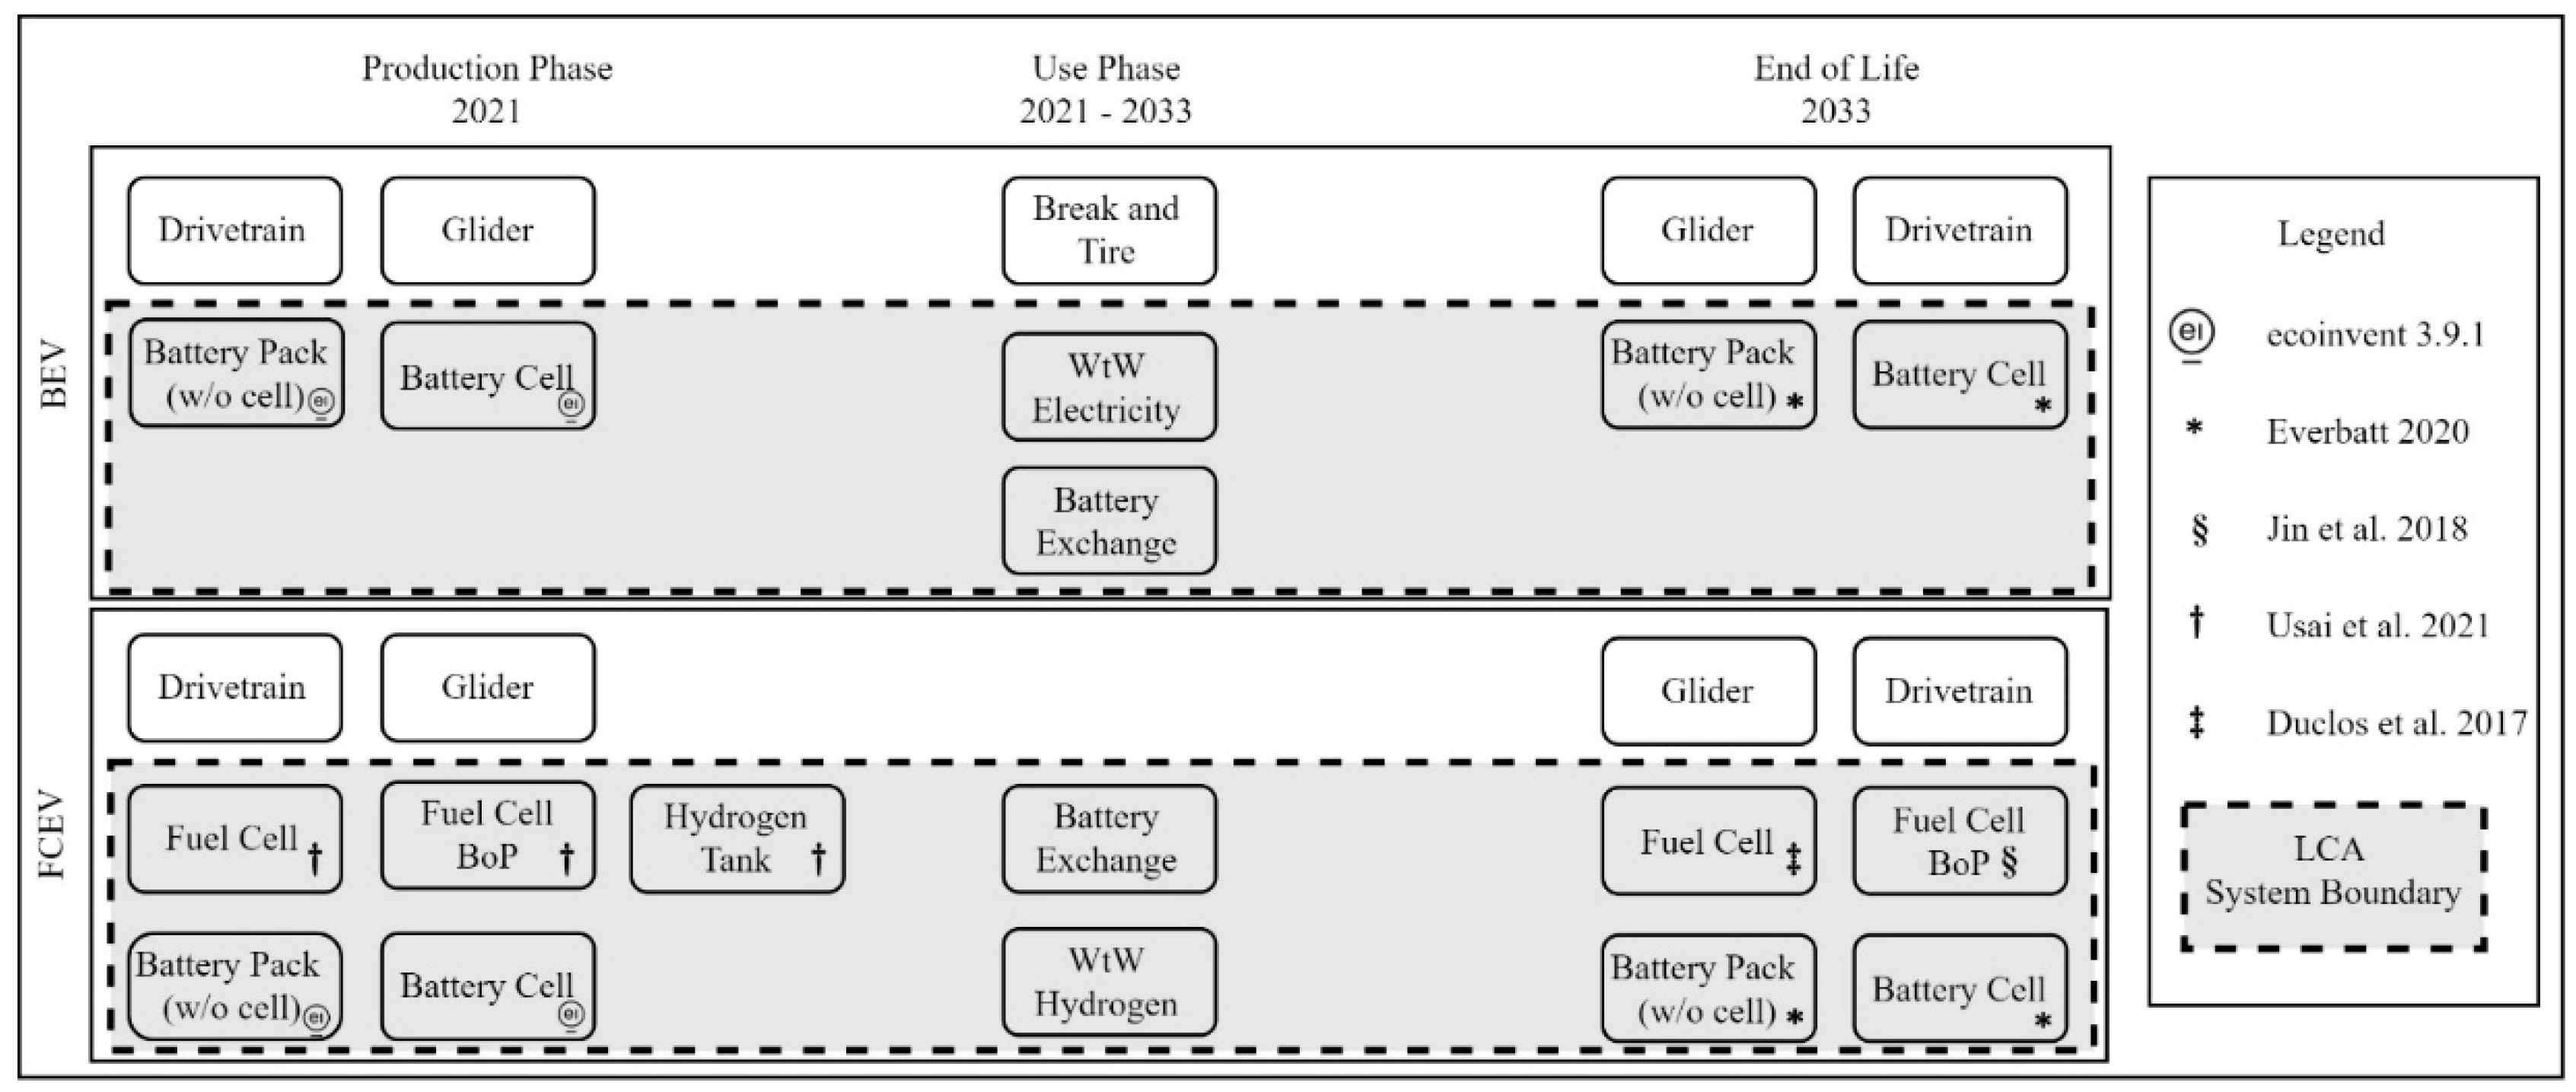
Figure 1. Comparison of the GWP of the production phase for a fuel cell system [16,17,18,19,20].
Preprints 98926 g001
Figure 2. Comparative life cycle assessment approach (product system).
Preprints 98926 g002
Figure 3. Energy sources for different electricity mixes in different regions, based on [38,39,40].
Preprints 98926 g003
Figure 4. Hydrogen production mix, based on [1].
Preprints 98926 g004
Figure 5. Battery pack materials and processes for different cell chemistries – Production.
Preprints 98926 g005
Figure 6. Battery pack materials and processes for different cell chemistries – Recycling (H – hydrometallurgical; P – pyrometallurgical).
Preprints 98926 g006
Figure 7. GWP of battery pack recycling and production.
Preprints 98926 g007
Figure 8. GWP of fuel cell system – Production and recycling.
Preprints 98926 g008
Figure 9. GWP Passenger Cars: (a) absolute GWP (b) GWP per km.
Preprints 98926 g009
Figure 10. GWP Heavy-Duty Trucks: (a) absolute GWP (b) GWP per tkm.
Preprints 98926 g010
Figure 11. GWP City Buses: (a) absolute GWP (b) GWP per Pkm.
Preprints 98926 g011
Figure 12. GWP of different cell chemistries, compared to other studies, cell and pack level (a) Production (b) Recycling .
Preprints 98926 g012
Table 1. GWP of Li-Ion battery production and recycling in different studies.
Reference Cell/ Pack level Region Cathode chemistry Energy density (Wh/kg) GWP (kg CO2 eq./kWh)
Production Recycling
Hydro. Pyro.
Dai et al. (2019, [6]) Pack USA NMC111 143 72.9 - -
Rajaeifar et al. (2021, [7]) Pack UK NMC111 - - - -0.77 (/kg)
Kallitsis et al. (2022, [8]) Pack China
NA
Europe
NMC111 105 168.8
133.8
124.1
-65.1
-45.1
-37.1
-59
-40.6
-34.1
Sun et al. (2020, [9]) Pack China NMC622 115 124.5 -30.9 -
Mohr et al. (2020, [10]) Cell
-
NMC111
NCA
LFP
170
174
108
75.5
85.6
101
-16.4
-18.3
-3.52
-13.8
-15.9
0.45
Ciez and Whitacre (2019, [11]) Cell USA NMC622
NCA
LFP
210
190
100
42
49
45
-5
-3.5
8
3
1.5
10
Table 2. Energy densities of battery cells and packs.
Battery Chemistry Energy density, cell
(Wh/kg)
Energy density, pack
(Wh/kg)
NMC111 [6] 197 143
NMC811 [35] 209 149
NCA [35] 224 158
LFP [35] 159 116
Table 3. GWP of medium voltage electricity and hydrogen production.
Process Electricity Production
(kg CO2 eq./kWh)
Hydrogen Production
(kg CO2 eq./kg)
Year 2021 2021 2030 2050 2020 2030 2050
Region China Germany Germany Germany Global Germany Germany
GWP 0.740 0.490 0.251 0.094 13.103 13.224 5.184
Table 4. Vehicle specifications passenger cars (SFC: specific fuel consumption).
Type FCEV FCEV BEV BEV BEV
Reference
Vehicle
Toyota
Mirai 2 [37]
Hyundai Nexo [38] VW
ID.3 [39]
VW
ID.4 [40]
MB EQS 580 4Matic [41]
Range (km) 650 666 426 346 672
SFC ((kg or kWh)/100 km) 0.84 0.95 15.5 16.7 17.7
Battery size (kWh) 0.95 1.56 62 55 120
Fuel Cell size (kW) 128 95 0 0 0
Hydrogen Tank (kg) 6.2 6.33 0 0 0
Passenger Capacity (P) 4.5 4.5 4.5 4.5 4.5
Vehicle weight (kg) 1950 1948 1805 1966 2585
Vehicle Class Coupé SUV Coupé SUV Coupé
Table 5. Vehicle specification FCET and BET (*calculated with range and battery/tank size, SFC: specific fuel consumption).
Type BEV BEV FCEV
Reference Vehicles Daimler eActros 300 + Trailer [49] Daimler eLongHaul
[50]
Daimler GenH2
[51]
Assumed Payload (%) 50 (100) 100 100
Max. Payload (t) 23 22 25
Range (km) 220 (170) 500 1000
SFC ((kg or kWh)/100 km) 153* (198*) 120* 8*
Battery size (kWh) 336 600 70
Fuel Cell Power (kW) - - 300
Hydrogen Tank (kg) - - 80
Table 6. Vehicle specification FCEB and BEB (*calculated with range and tank size, SFC: specific fuel consumption).
Type FCEV FCEV BEV BEV
Reference Vehicles Solaris Urbino Hydrogen [52,53,54,55] Solaris Urbino Electric [56,57,58]
Vehicle Length (m) 12 18 12 18
Range (km) 350 350 300 60
SFC ((kg or kWh)/100 km) 10.7* 14.6* 158 218
Battery size (kWh) 60 60 658 193
Fuel Cell Power (kW) 70 100 - -
Hydrogen Tank (kg) 37 51 - -
Passenger Capacity (P) 87 140 60 138
Disclaimer/Publisher’s Note: The statements, opinions and data contained in all publications are solely those of the individual author(s) and contributor(s) and not of MDPI and/or the editor(s). MDPI and/or the editor(s) disclaim responsibility for any injury to people or property resulting from any ideas, methods, instructions or products referred to in the content.
Copyright: This open access article is published under a Creative Commons CC BY 4.0 license, which permit the free download, distribution, and reuse, provided that the author and preprint are cited in any reuse.
Prerpints.org logo

Preprints.org is a free preprint server supported by MDPI in Basel, Switzerland.

Subscribe

© 2024 MDPI (Basel, Switzerland) unless otherwise stated