Preprint
Article
Fractal Dimension of Ismail’s Third Entropy with Fractal Applications to CubeSat Technologies and Education
Altmetrics
Downloads
71
Views
31
Comments
0
This version is not peer-reviewed
Mathematical Modeling
Submitted:
17 February 2024
Posted:
19 February 2024
You are already at the latest version
Alerts
Abstract
Entropy as a mathematical concept is the first of its own kind, and second to none. Barely one or two papers in literature have investigated fractal dimensions of very basic entropies, such as Shannon, Tsallis, and Rényi entropic expressions. This was a thoughtful inspiration to delve into a step forward towards a unified information- theoretic fractal theory. The storytelling of this current paper starts by introducing my third entropy formula, namely Ismail’s entropy, , as a novel generalization to Shannonian entropy with a visionary link to both long- and short-range interactions, (LRIs), (SRIs) respectively. Clearly, this would generate a fourfold unification with statistical mechanics as well as contemporary physics. Hence, this adds more credibility and weight for this study. The fractal dimension of , is identified in this paper. As an essential part of this work, it was influential to spotlight the importance of fractal geometry to space industry as well as education, which is crucial to develop our societies. Thus, some potential fractal applications to CubeSat Technologies and Education are highlighted. So, will the deep search for more ground-breaking research has come to an end. Certainly, not. This was another inspiration to propose new open problems to widen research gates to the scientific community for more research pathways. Consequently, the paper ends with closing remarks combined with some challenging open problems and the next phase of research.
Keywords:
Subject: Computer Science and Mathematics - Applied Mathematics
Introduction
The probability of the event is given by the equation .This entropy, defines the concept of information in information theory. There are several additional entropic formalisms that can be used to approach the measure of information that each distribution contains in different ways.
More fundamentally, Ismail’s third entropy, namely
reads as:
where is a positive constant, , The connection between entropy and lies in the statistical measurement of complexity within spatial dimensions.
Fractals, which exhibit a unique scaling behavior, are used to quantify the capacity of a pattern to fill space. This relationship helps us understand the intricate relationship between information theory and the geometric properties of patterns [4,5,6,7]. In [8], Lewis Fry Richardson examined how the length of the stiff stick used to measure coasts can impact the length of the coastline as measured. Mandelbrot cited this previous work in [8,9,10].
In the context of studying , there are multiple formal mathematical definitions available. One such definition involves using formulas that relate the quantity of sticks (N) required to cover a coastline, the scaling factor (𝜀), and the fractal dimension (). These formulas help quantify the complexity and scaling properties of fractal patterns in spatial dimensions.:
Figure 1.
A section of the Grand Canyon in Arizona, which is visualized using satellite images from Google Earth and edited using the GNU Image Manipulation Program. These tools allow for the creation of painted portraits or visual representations of the canyon's features[10].
Figure 1.
A section of the Grand Canyon in Arizona, which is visualized using satellite images from Google Earth and edited using the GNU Image Manipulation Program. These tools allow for the creation of painted portraits or visual representations of the canyon's features[10].
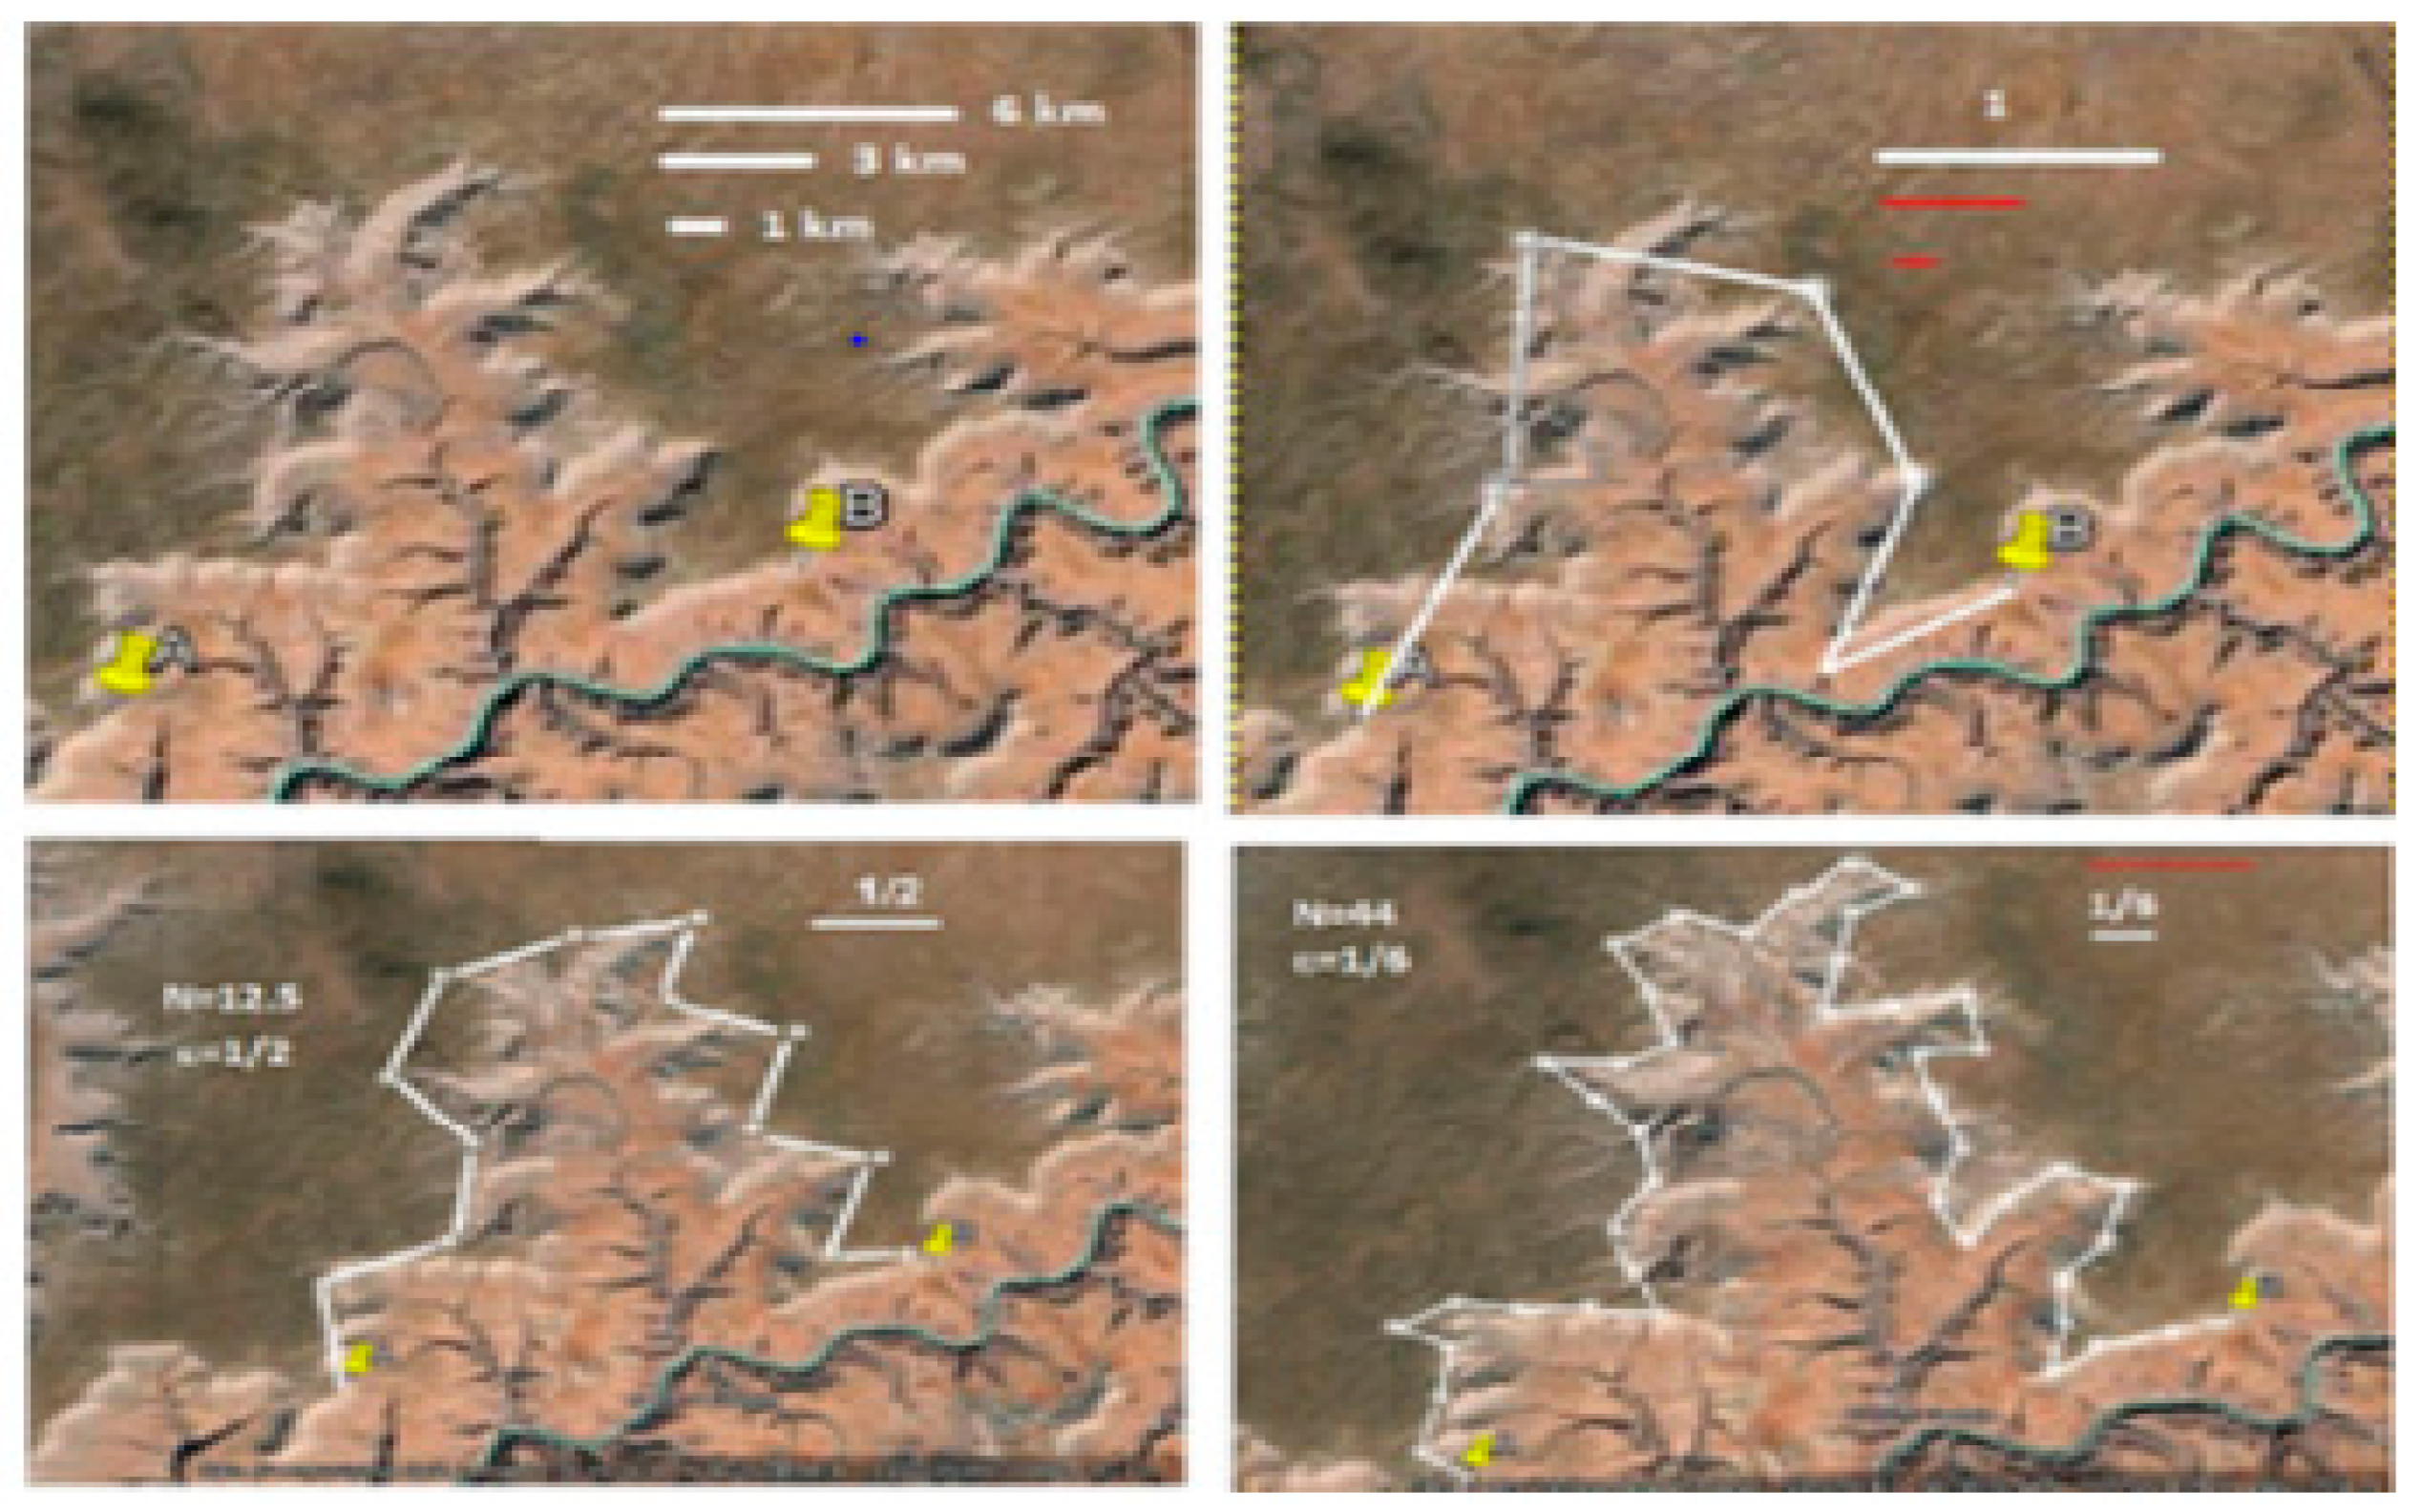
It can be seen how painted portraits were created using satellite images from Google Earth of a section of the Grand Canyon in Arizona. The reference length of 6 km was determined using the ruler tool in Google Earth, and this length was used to calculate of the canyon's rim as shown by Figure 2 and Figure 3. Figure 2 shows that as the progressive increase of N (a variable) occurs, 𝜀 (another variable) experiences a drastic heavy-tailed declination, while Figure 3 demonstrates that both 𝜀 and decline simultaneously.
This paper’s road map is. A review of existing research on how fractal dimension can be derived using entropy concepts is given in section two, as well as the provision of the relationship between entropy and fractal dimension, specifically focusing on Shannon entropy and Rényi entropy. This survey of previous work provides insights into the entropic derivation of fractal dimension. Additionally, in ssection three, results and discussion for the theory of of , with revolutionary insights into multi-interdisciplinary sciences including statistical mechanics are provided. Section four is designed to spotlight some potential fractal applications to CubeSat Technologies and Education, Section five provides a conclusion with some open problems and future pathways of research.
Methodology
Undoubtedly, fractal dimension theory is the first of its own kind in mathematics, based on its influential applicability to numerous fields of human knowledge. Having introduced my third entropy formula, namely Ismail’s entropy, , fractal dimension is applied to to uncover the dominancy of the derivations, which reduce to the corresponding subcases in information theory. Therefore, a new unified information-theoretic fractal theory is developed. More importantly, to add a more application- based approach, it was a necessity to highlight some fractal geometric applications to two important fields of knowledge in our lives, namely CubSats and education, Clearly, this will open many research thoughts on the importance of fractal geometry to revolutionize human knowledge.
Results and Discussion
In [10], an exposition of for Shannon entropy [1], Rényi entropy [3,11,12,13] and Tsallis entropy [13] was undertaken for events with equal probabilities, i.e., .
is defined by the Shannonian entropic [10] concept as follows:
The following definition applies to the "generalized dimension" or "Rényi dimension" of order [12]
It is to be noted that, generates several major entropies in the literature.
- The entropy (c.f., (2)) reduces to the in the double limit, .
- The entropy reduces to the Tsallis entropy in the double limit .
- The entropyreduces to the = k-entropy (Kaniadakisian entropy functional) in the limit .
- The entropy reduces to the Sharma–Mittal entropy [4] in the limit.
- entropy reduces to the Shannonian entropy functional in the triple limit
Theorem 1 For (c.f., (2)), () is given by
Proof
By the definition, we have
as claimed (c.f., (7)).
Corollary 2 satisfies:
- i.
- ii.
- Kaniadakis
- iii.
- iv.
applications to CubeSat technologies and education
The design, manufacture, and testing of a square Koch fractal slot antenna for the UHF band are covered in [14]. The antenna, measuring 56.56 centimeters in length, is made to fit inside the standard 10 cm by 10 cm CubeSat faces. Both the FR4-G10 and Cuclad 250 substrates work satisfactorily at the necessary frequency, according to the study; however, the FR4-G10 substrate is recommended because of its reduced cost and good performance at 458 MHz, which is a frequently utilized frequency for CubeSat tracking, telemetry, and command downlinks.
Figure 4 (c.f., [14]) depicts a schematic representation of the proposed antenna design placed on the surface of a 1 U CubeSat, which has dimensions of 10 cm × 10 cm. The diagonal length of the antenna corresponds to 14.14 cm for the 0th iteration, 28.28 cm for the 1st iteration, and 56.56 cm for the 2nd iteration, indicating the total length of the antenna at each iteration.
Figure 5 (c.f., [14]) depicts a top view of the slot antenna, which has been fabricated using a 20.4 cm × 25.4 cm PCB laminate. The slot is positioned in the central area measuring 10 cm × 10 cm. This configuration allows for a clear visualization of the antenna's physical structure and layout.
Ref. [15] describes a dual-band patch antenna that is integrated into an optical imaging system for Earth-observation CubeSats. The antenna operates at S-band frequencies and is designed to match the size of the CubeSats.
Figure 6 (c.f., [15]) depicts the formation of patch antennas for high-speed data transmission in Earth-observation systems. It proposes the concept of an S-band patch antenna operating in two bands based on an anisotropic fractal for Earth-observation CubeSats.
The antenna main characteristics’ simulations are visualized by Figure 7 and Figure 8 (c.f., [15]) show the reflection coefficient, impedance bandwidth, antenna patterns, realized gain, and efficiency at different frequencies.
Figure 9 (c.f., [15]) displays the three-dimensional radiation pattern of an antenna which provide information about how the antenna radiates electromagnetic energy in different directions at these specific frequencies.
The main payload of the BuhoSat [16] is a specialized fractal antenna, along with a Field Programmable Gate Array (FPGA) and software defined radio (SDR), that can detect synchrotron emission from electrons in the Van Allen belt. By analyzing the spectra captured by this instrument, scientists can derive information about the properties of the ionized gas in the F region of the ionosphere, providing valuable insights into the Earth's atmosphere.
On another separate note, the main instrument of the BuhoSat is designed to capture electromagnetic radiation centered at 3.8 GHz[16]. It utilizes a fractal antenna based on the Sierpinski carpet(corresponding to , which allows it to capture synchrotron radiation emitted by spinning electrons about magnetic lines. To process the captured radiation, a powerful FPGA and SDR are used, enabling analysis of the spectrum in the frequency domain. This is illustrated by Figure 10 (c.f., [16]).
Small and lightweight, CubeSats (also known as LEO satellites) can be constructed with off-the-shelf parts and are designed to operate in Low Earth Orbit (LEO). When compared to medium-sized satellites, they are less functional but can be developed more quickly and at a lower cost. CubeSats depend on the Telemetry, Tracking, and Communications (TTC) subsystem, and creating antennas for them is difficult because of their limited size, weight, and power[17]. This review examines and assesses the performance of several CubeSat antenna designs, such as patch, slot, helical, monopole, reflect arrays, mesh reflectors, and Meta surface antennas, in terms of gain, bandwidth, size, and polarization. Figure 11 (c.f., [17]) lists the three typical CubeSat types—1U, 2U, and 3U—and their corresponding sizes. 10 cm × 10 cm × 10 cm, 10 cm × 10 cm × 20 cm, and 10 cm × 10 cm × 30 cm are the dimensions of a 1U CubeSat, 2U CubeSat, and 3U CubeSat, respectively. Because of their portability, low weight, and ability to be assembled from off-the-shelf parts, these CubeSats represent affordable alternatives for space missions.
Current planar antenna designs operating in the S-band frequency range (2-4 GHz) have one major limitation, which is their size [17]. The authors developed a deployable microstrip patch antenna for 1U CubeSats with a fractal topology to solve this problem. The suggested antenna (see Figure 12 (c.f., [17])) achieves a compact size, high gain, small reflection coefficient, big bandwidth, and good impedance matching by using the Koch snowflake fractal structure (corresponding to . Its omni-directional layout does, however, result in less gain.
In [18], the theoretical and methodological foundations of fractal pedagogy, exploring its principles and features were discussed. The research aimed [18] to identify the components of personal and professional self-development for teachers, including motivation, design, practical activities, reflection, and emotional volition. So, in principle, [18] provided a new perspective on the problem of teacher self-development and suggests that fractal methodology can serve as a basis for further psychological and pedagogical research in this area.
The principle of fractality[18] is applicable to various social processes, allowing us to understand different aspects of life from a fractal perspective. Examples of fractal organization can be seen in socio-cultural systems such as language, music, architecture, and patterns, highlighting the multifaceted nature of these phenomena. The term "conceptual fractal" [18]is used to describe the self-multiplying nature of socio-cultural practices and their organization at different levels and scales, ultimately contributing to the overall structure of the socio-cultural world.
More fundamentally, Fractals [18]are not a new concept in technical sciences and are used as a basis for various scientific disciplines. Fractal methodology involves studying social systems at different levels, recognizing cyclical trends and the legitimacy of events, and creating socio-political and other fractal models[18]. In the context of personal and professional self-development in education, fractal methodology is employed to understand the process from a fractal theory perspective, with an integrated-ecological methodological approach being the leading approach in studying the organization of this process[18].
The importance of highly qualified specialists in ongoing reforms and the development of a mature training system in Uzbekistan[19] was highlighted. Consequently, the role of information technology and the application of fractal art in teaching fine and applied arts in higher education[19]. Fractals, which are complex objects based on simple laws, have similarities with natural phenomena and can be used to predict various factors, such as the growth rate of plant root systems and the mass of straw dependent on branch length[19].
According to [19], to enhance students' creative abilities, it is recommended to incorporate fine arts and teaching practices that consider the specificities of fine and applied arts. By utilizing facts in applied art compositions, color palettes, and graphics, students can develop their observation skills, stimulate their imagination, and recognize the fractal nature of objects[19]. Fractals, which are complex structures governed by simple laws, share similarities with various natural phenomena, ranging from crystals and ecosystems to biological objects, highlighting the interconnectedness of art and nature[19].
To promote independent and original computer modelling of natural processes, a novel fractal approach to the teaching of physical and mathematical disciplines is presented[20]. Encapsulation, inheritance, and polymorphism, three core tenets of object-oriented programming, have demonstrated their power in influencing how various academic fields perceive the physical and mathematical components of information architecture[20]. This method can potentially be applied to other areas of physics, as shown[20]. The study of the "Geometric Optics" and "Wave Optics" portions of physics is used to illustrate how the generated iterations of the fractal structure are displayed[20]. The inclusion of a new iteration results in a high-quality and in-depth perception of new information, demonstrating how each iteration is characterised by synergy[20].
A fractal is an information-branched structure whose spatial dimension is characterised by a fractional number in the context of the application of physical and mathematical education[20]. When creating complex structures, this property of fractality ensures the accuracy and completeness of information flows. However, minimal energy dissipation and energy-informational self-similarity are used to achieve complexity[20]. This demonstrates the effectiveness and appropriateness of their implementation in the teaching of science pedagogical subjects, which are currently underdeveloped and underargued. Geometric, algebraic, and stochastic fractal characteristics (Figure 13, [20]) can be seen as characteristics of how the instructional process works.
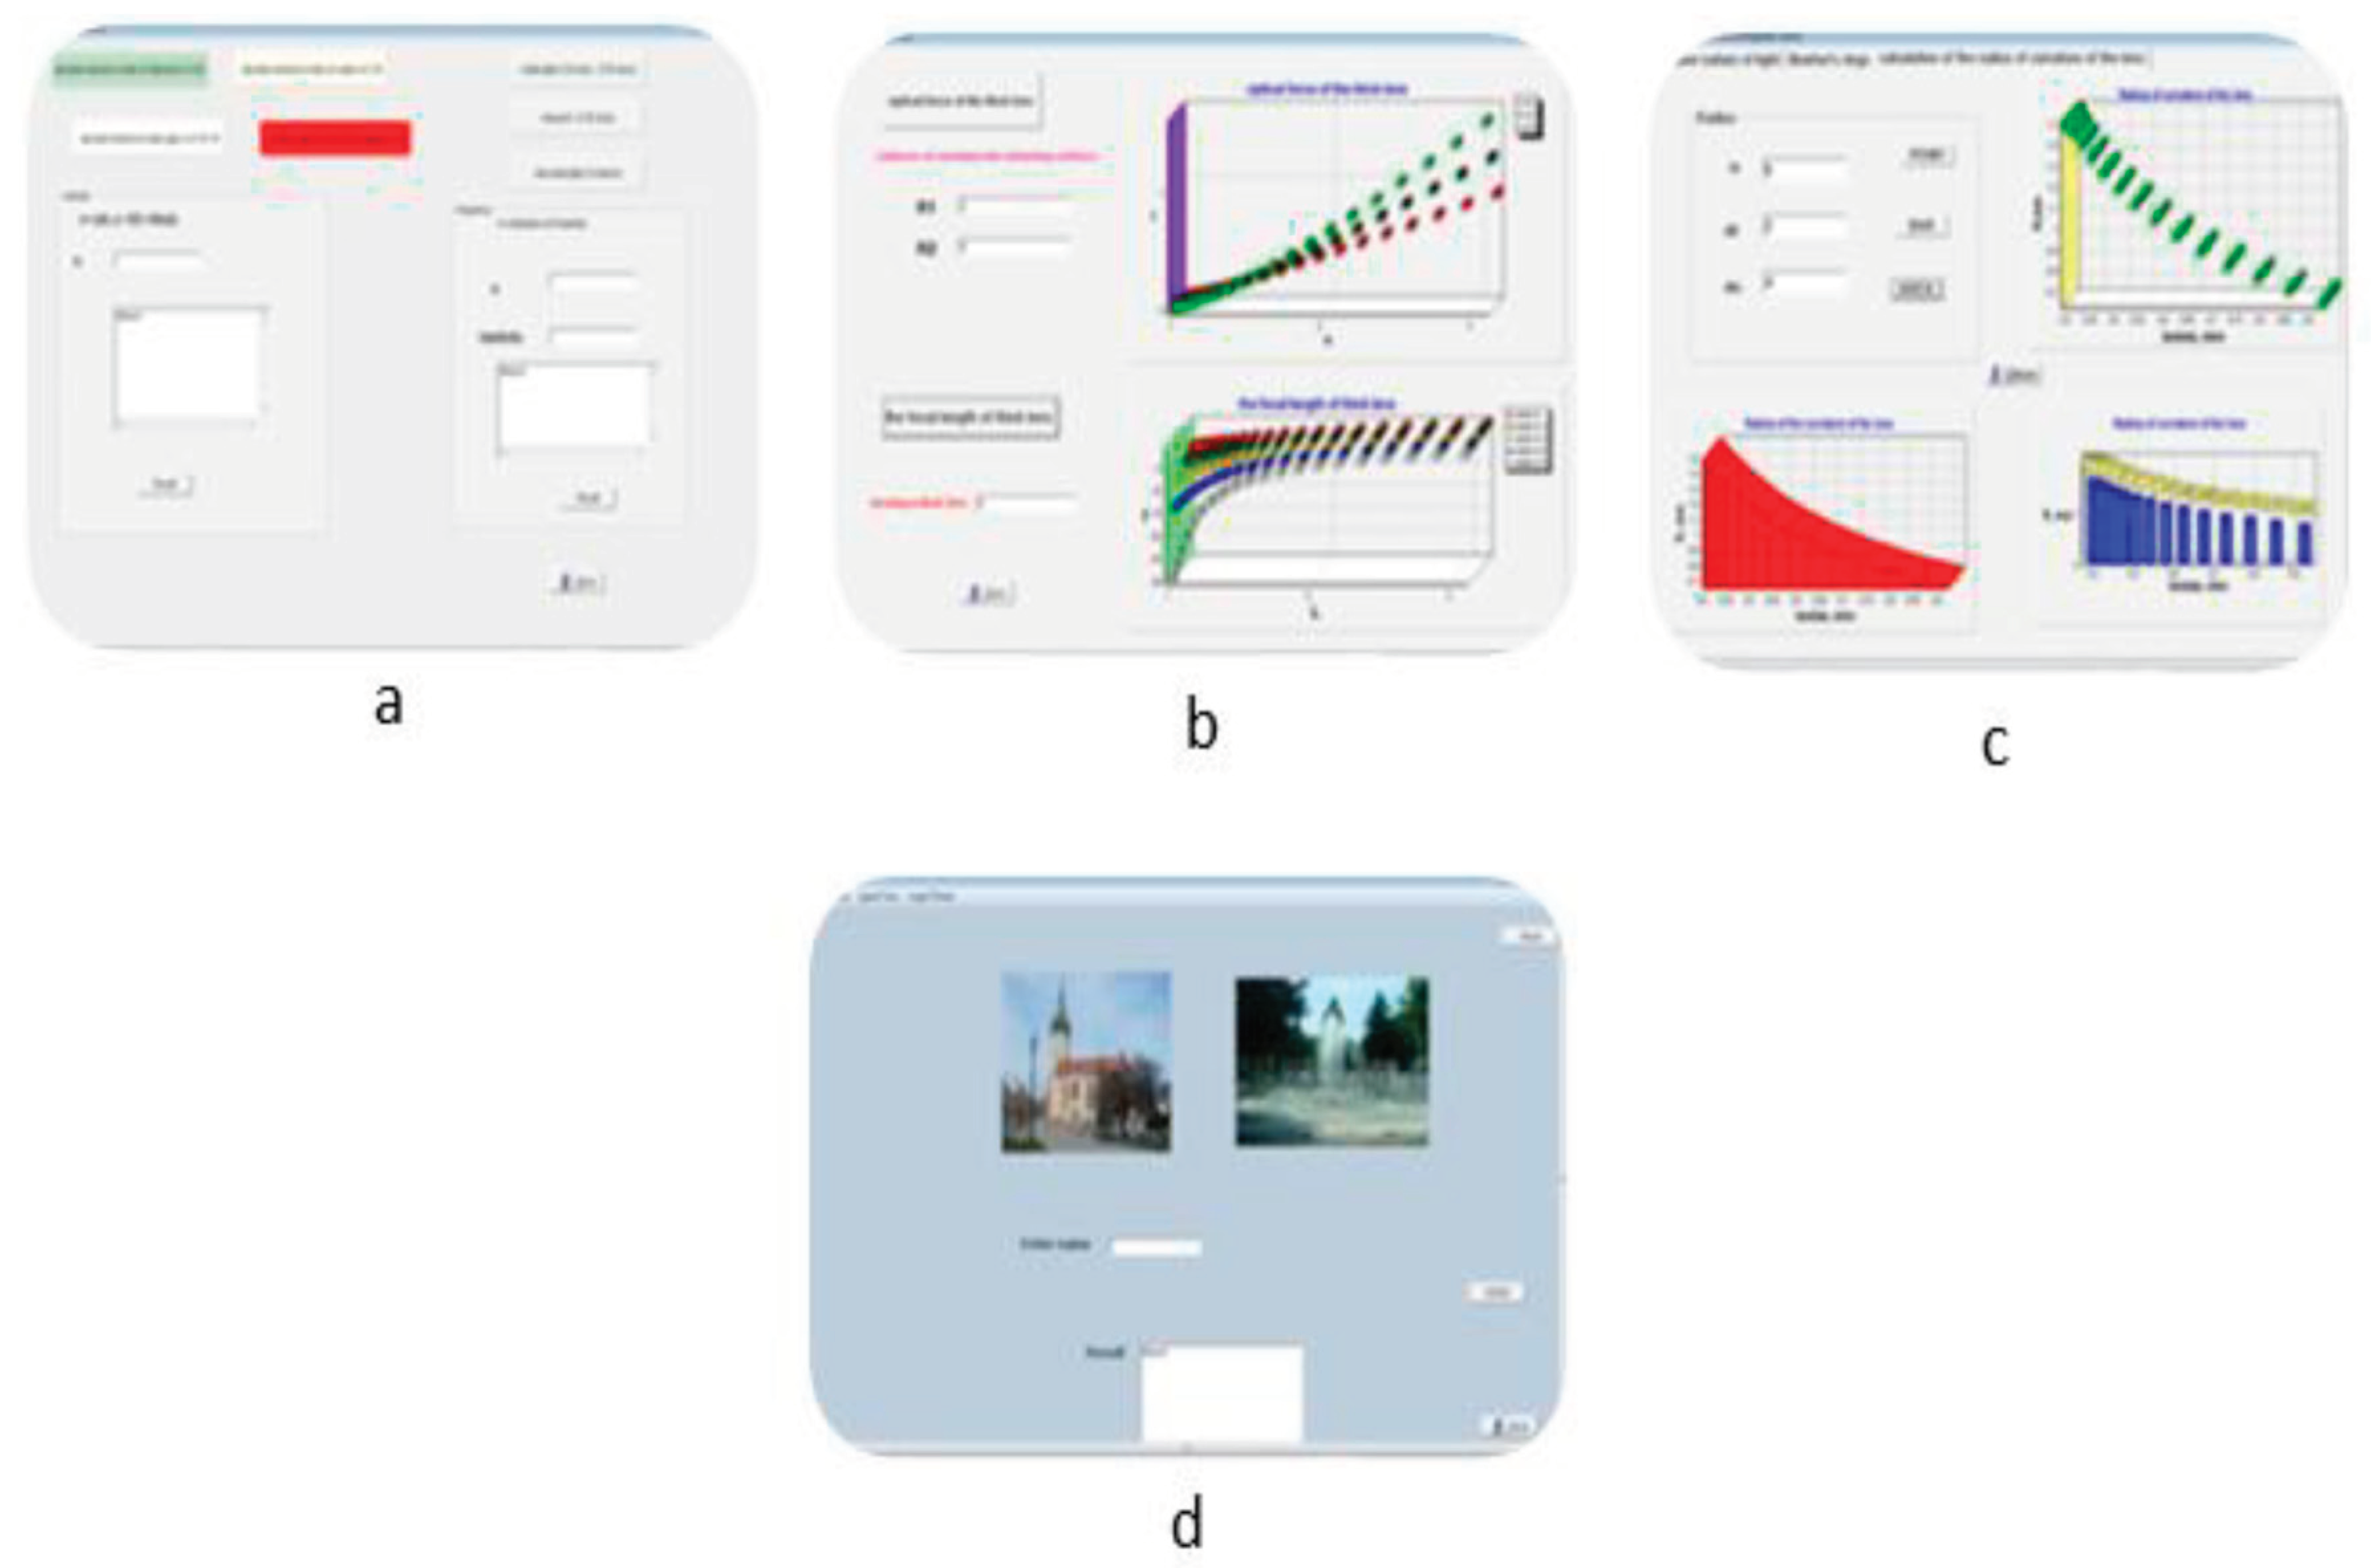
A complicated application of aspects of geometric, algebraic, and stochastic fractals was used to build iterations of the fractal structure as it relates to the study of the physics sections "Geometric Optics" and "Wave Optics." [20] In Figure 14, Figure 15 and Figure 16, the concepts and growth of the fractal structure's branches are depicted. It should be emphasised that the encapsulation, inheritance, and polymorphism concepts used in computer modelling are also founded on these concepts. It is object-oriented modelling, in other words.
Conclusion
In this exposition, the theory is determined. More potentially, this study has highlighted how fractals can advance several multi-interdisciplinary sciences.
Here are some proposed open problems:
Open Problem One
Is it possible to unlock the mathematical challenge to compute the threshold formalism of the derived fractal dimension of with respect to all the involved parameters, namely, ?
Open Problem Two
Approaching the s Snow Kochflake fractal dimension () and the Sierpiniski Gasket () , can we unlock the threshold of both fractal dimensions especially for the long-range interactions descriptor, namely to capture the missing link between statistical physics, randomness, thermodynamics, and fractal geometry?
Open Problem Three
According to [17], reconfigurable reflect arrays' main flaw is its narrow gain bandwidth, which can be as low as 4%. Therefore, the idea of tightly connected rectangular antennas is an intriguing combination and is still a challenging open problem for future CubeSat deployment.
Open Problem Four
Based on [20], It is conceivable to show that adopting the fractal approach in teaching aspiring natural science teachers at higher educational institutions is practical. Additionally, is applying tried-and-true fractal method components to science instruction at higher education institutions feasible in the real world? The problem is still unsolvable.
Open Problem Five
Based on [21], some potential fractal applications to advance ChatGPT were spotlighted. This would pose a challenging open problem, on Fractal ChatGPT advancement to education. Would this be possible in a real-life setting? This is still open.
Open Problem Six
In [22], Ismail’s fourth entropy, namely a novel generalization to Shannonian entropy with a visionary link to both long- and short-range interactions, (LRIs), (SRIs) respectively, was introduced. The fractal dimension of is identified in this paper. Following this, some potential fractal applications to algorithms. Following this pathway, can we design a revolutionary fractal geometric algorithm to advance CubSats? This is a very sophisticated open problem.
The next phase of research includes searching for solutions to the above challenging open problems and exploring in depth more extensions to Fractal dimension theory to other multi-interdisciplinary fields of human knowledge.
References
- I. A. Mageed, Q. Zhang, An Introductory Survey of Entropy Applications to Information Theory, Queuing Theory, Engineering, Computer Science, and Statistical Mechanics, In 2022 27th IEEE International Conference on Automation and Computing (ICAC) (2022) 1-6.
- I. A. Mageed,, Q. Zhang, An Information Theoretic Unified Global Theory for a Stable M/G/1 Queue With Potential Maximum Entropy Applications to Energy Works,” In 2022 IEEE Global Energy Conference (GEC), (2022)300-305.
- D. D. Kouvatsos and I. A. Mageed, V. Anisimov,and N. Limnios, Non-Extensive Maximum Entropy Formalisms and Inductive Inferences of Stable M/G/1 Queue with Heavy Tails, Advanced Trends in Queueing Theory,(2021). [CrossRef]
- I. A. Mageed, A.H. Bhat, “Generalized Z-Entropy (Gze) and Fractal Dimensions,” Appl. Math , (2022) 829-834. [CrossRef]
- L. Zhou, et al, Data-driven space-filling curves, IEEE transactions on visualization and computer graphics, (2020)1591-1600. [CrossRef]
- W. J. Wang, et al, “ Fractal growth of giant amphiphiles in langmuir-blodgett films,” Chinese Journal of Polymer Science, (2022)556-66. [CrossRef]
- Z. Sadem, B. Fathi, L. Mustapha, Image edge detection and fractional calculation, International Journal of Advanced Natural Sciences and Engineering Research, (2023) 222-225. [CrossRef]
- S. R. Nayak, J. Mishra, Analysis of medical images using fractal geometry, In Research Anthology on Improving Medical Imaging Techniques for Analysis and Intervention, IG Global, (2023)1547-1562. [CrossRef]
- G. L. Gao, et al, Do the global grain spot markets exhibit multifractal nature? Chaos, Solitons & Fractals, (2022)112663. [CrossRef]
- T. Zhao, et al Information fractal dimension of Random Permutation Set,” Chaos, Solitons & Fractals, (2023)113883. [CrossRef]
- F. Pons, G. Messori, D. Faranda, Statistical performance of local attractor dimension estimators in non-Axiom A dynamical systems, Chaos: An Interdisciplinary Journal of Nonlinear Science, (2023). [CrossRef]
- I. A. Mageed and Q. Zhang, “The Rényian-Tsallisian Formalisms of the Stable M/G/1/ Queue with Heavy Tails Entropian Threshold Theorems for the Squared Coefficient of Variation, electronic Journal of Computer Science, and Information Technology, (2023) 7-14. [CrossRef]
- I. A. Mageed, Q. Zhang, “Inductive Inferences of Z-Entropy Formalism (ZEF) Stable M/G/1 Queue with Heavy Tails. In 2022 IEEE 27th International Conference on Automation and Computing (ICAC), (2022) 1-6.
- J. Simon, et al, A second-iteration square Koch fractal slot antenna for UHF downlink telemetry applications in cubesat small satellites, International Journal of Antennas and Propagation, (2020)1-10. [CrossRef]
- T. Meirambekuly, et al, Dual-band optical imaging system-integrated patch antenna based on anisotropic fractal for earth-observation CubeSats, Ain Shams Engineering Journal, (2022)101560. [CrossRef]
- D. V . Hensiek, et al, Design of a university nanosatellite for space weather monitoring, In 2019 7th IEEE International Engineering, Sciences and Technology Conference (IESTEC) (2019 )580-585.
- S. Abulgasem, et al, Antenna designs for CubeSats: A review, IEEE Access, (2021)45289-45324. [CrossRef]
- S. S. Beknazarova, G. A. Kayumova, Fractal Methodology Of In Improving The Modern Educational Process, The American Journal of Engineering and Technology, (2021)129-133. [CrossRef]
- K. M. Amirovna, “The Application of Fractal Art in the Teaching of Fine and Applied Arts in Higher Education, International Journal on Integrated Education, (2021)75-79. [CrossRef]
- M. Marýan, M. Opachko, V. Seben, METHODS OF THE FRACTAL APPROACH IN SCIENCE EDUCATION: INNOVATIVE TECHNOLOGY, Фізикo-математична oсвіта, (2023)73 -78. [CrossRef]
- I. A. Mageed, Fractal Dimension(Df) Theory of Ismail’s Second Entropy() with Potential Fractal Applications to ChatGPT, Distributed Ledger Technologies(DLTs) and Image Processing(IP), IEEE international conference on Computers& Applications(ICCA 2023)The British University in Egypt, (2023).
- I. A. Mageed, Fractal Dimension(Df) of Ismail’s Fourth Entropy with Fractal Applications to Algorithms, Haptics, and Transportation, IEEE international conference on Computers& Applications(ICCA 2023)The British University in Egypt, (2023).
Figure 2.
Visualizing how N affects using illustrative data.
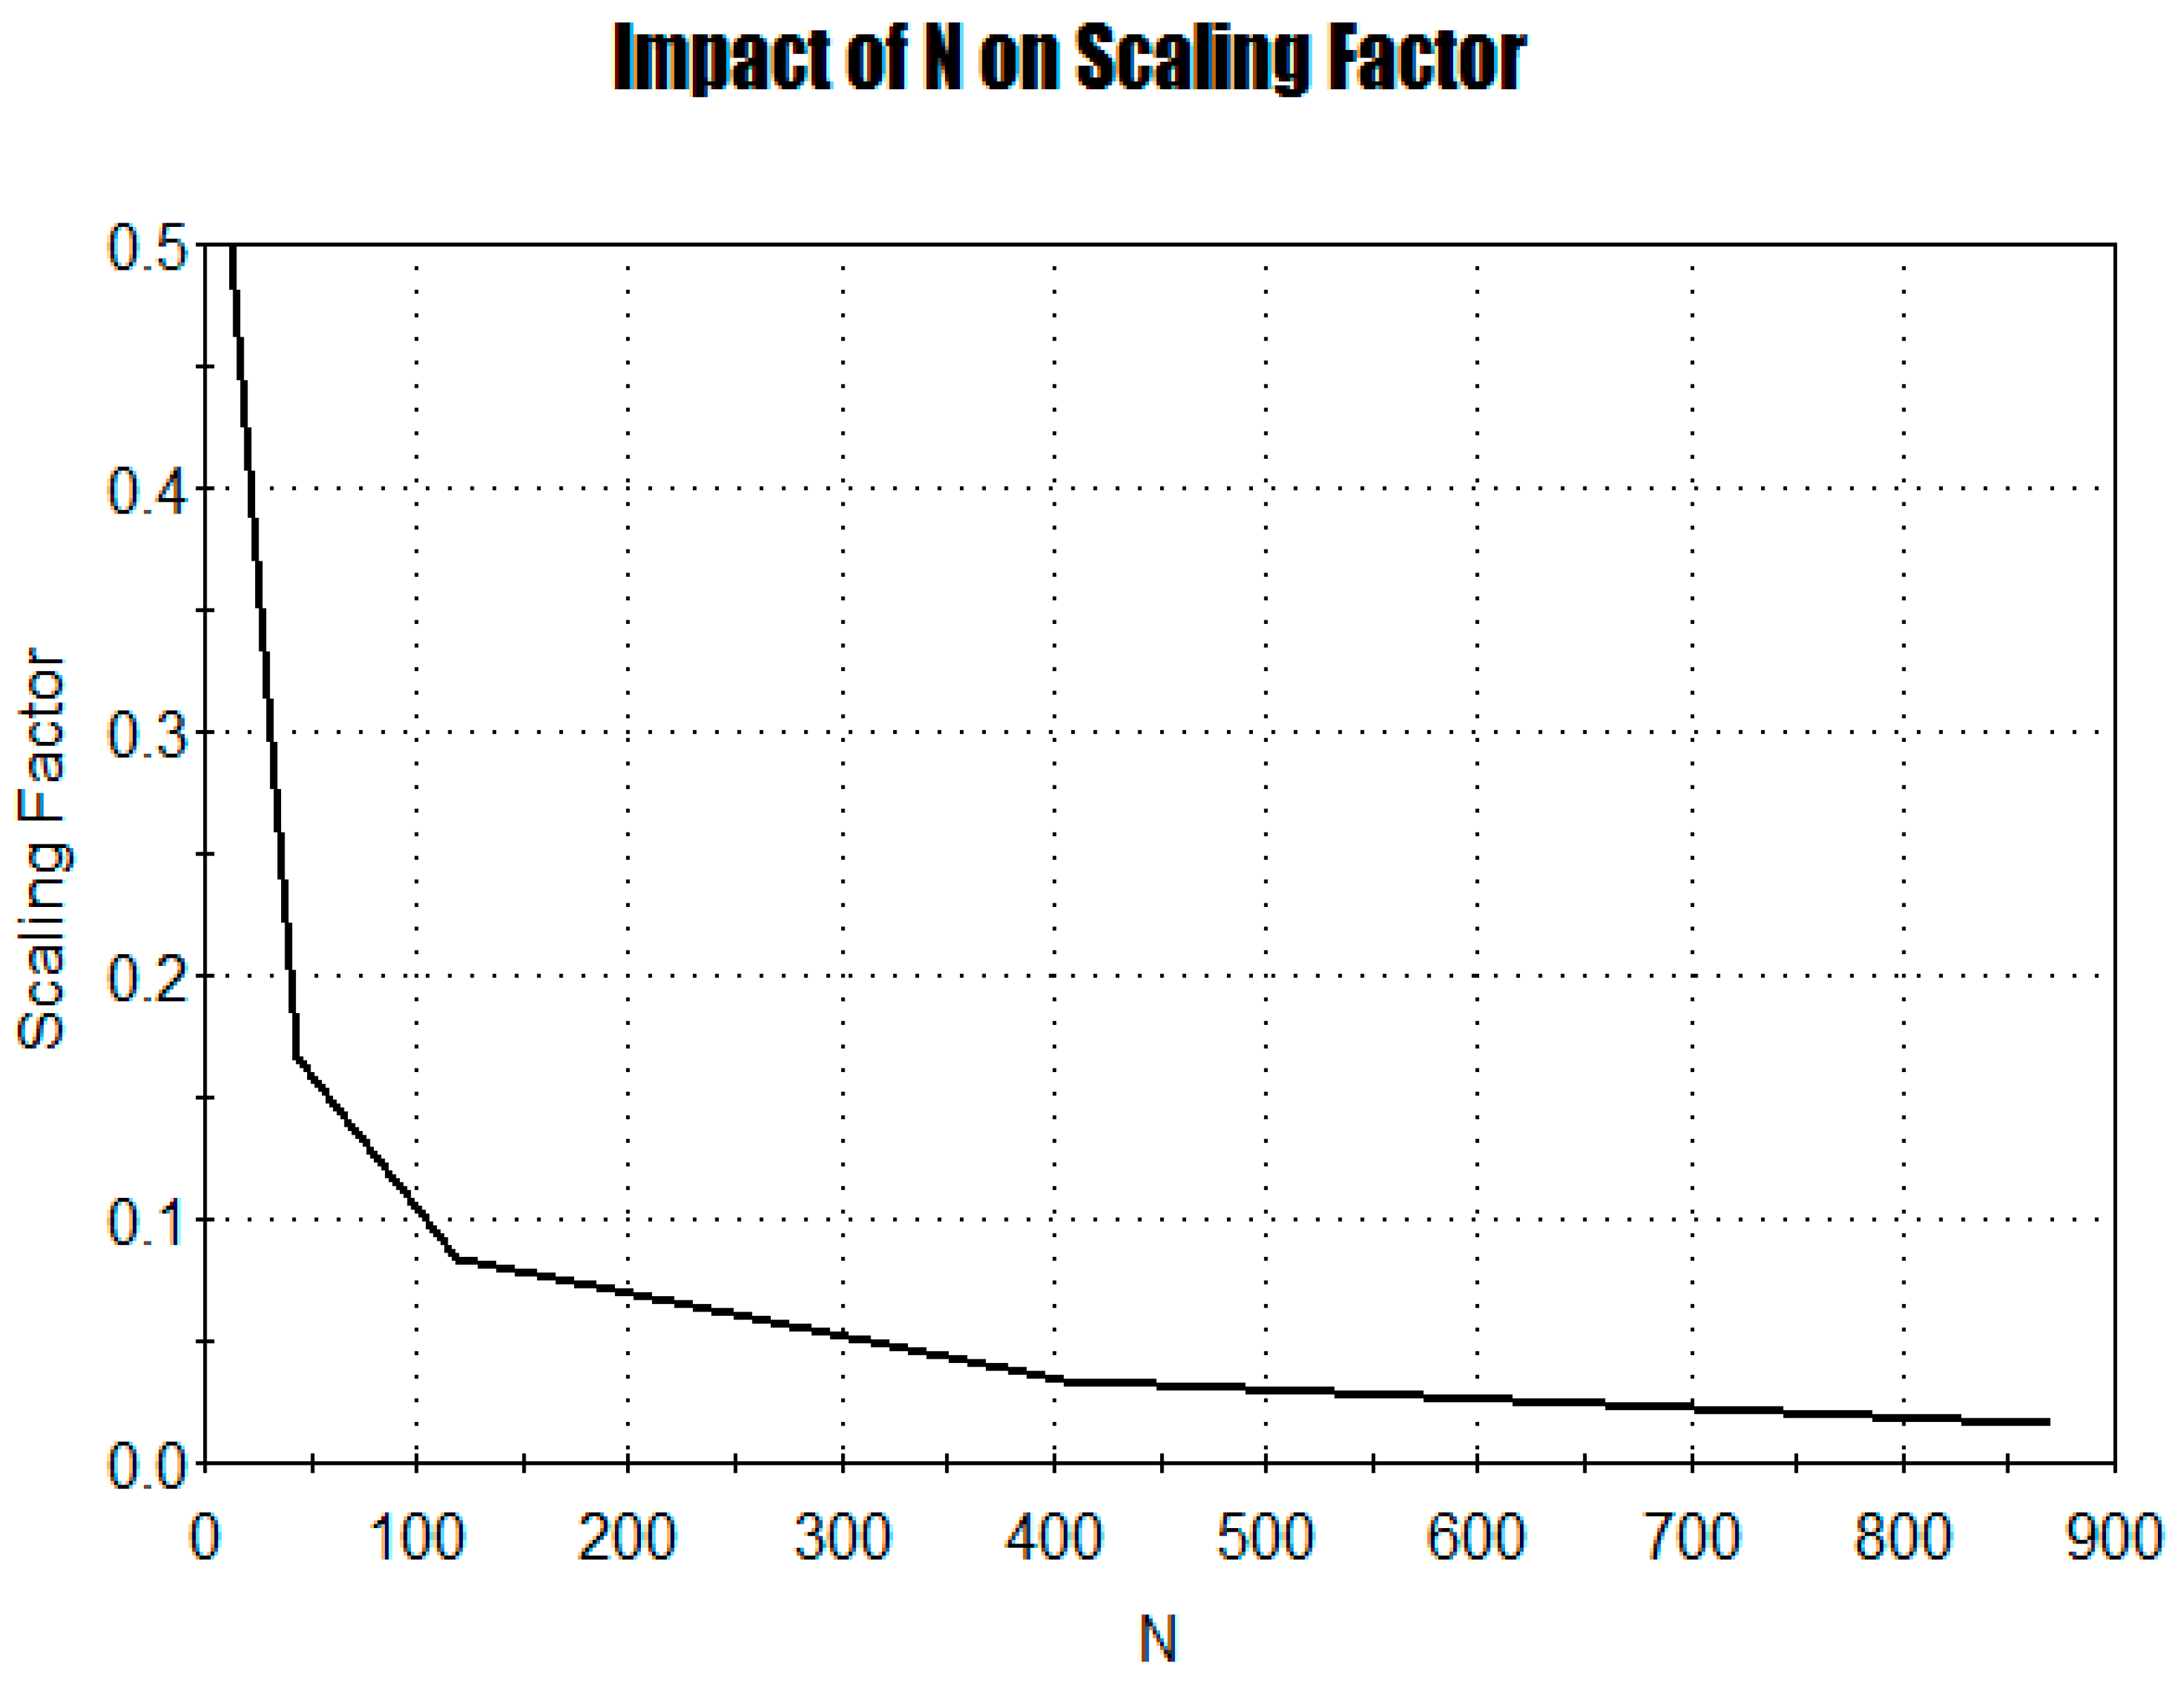
Figure 3.
An illustration on how influences using data.
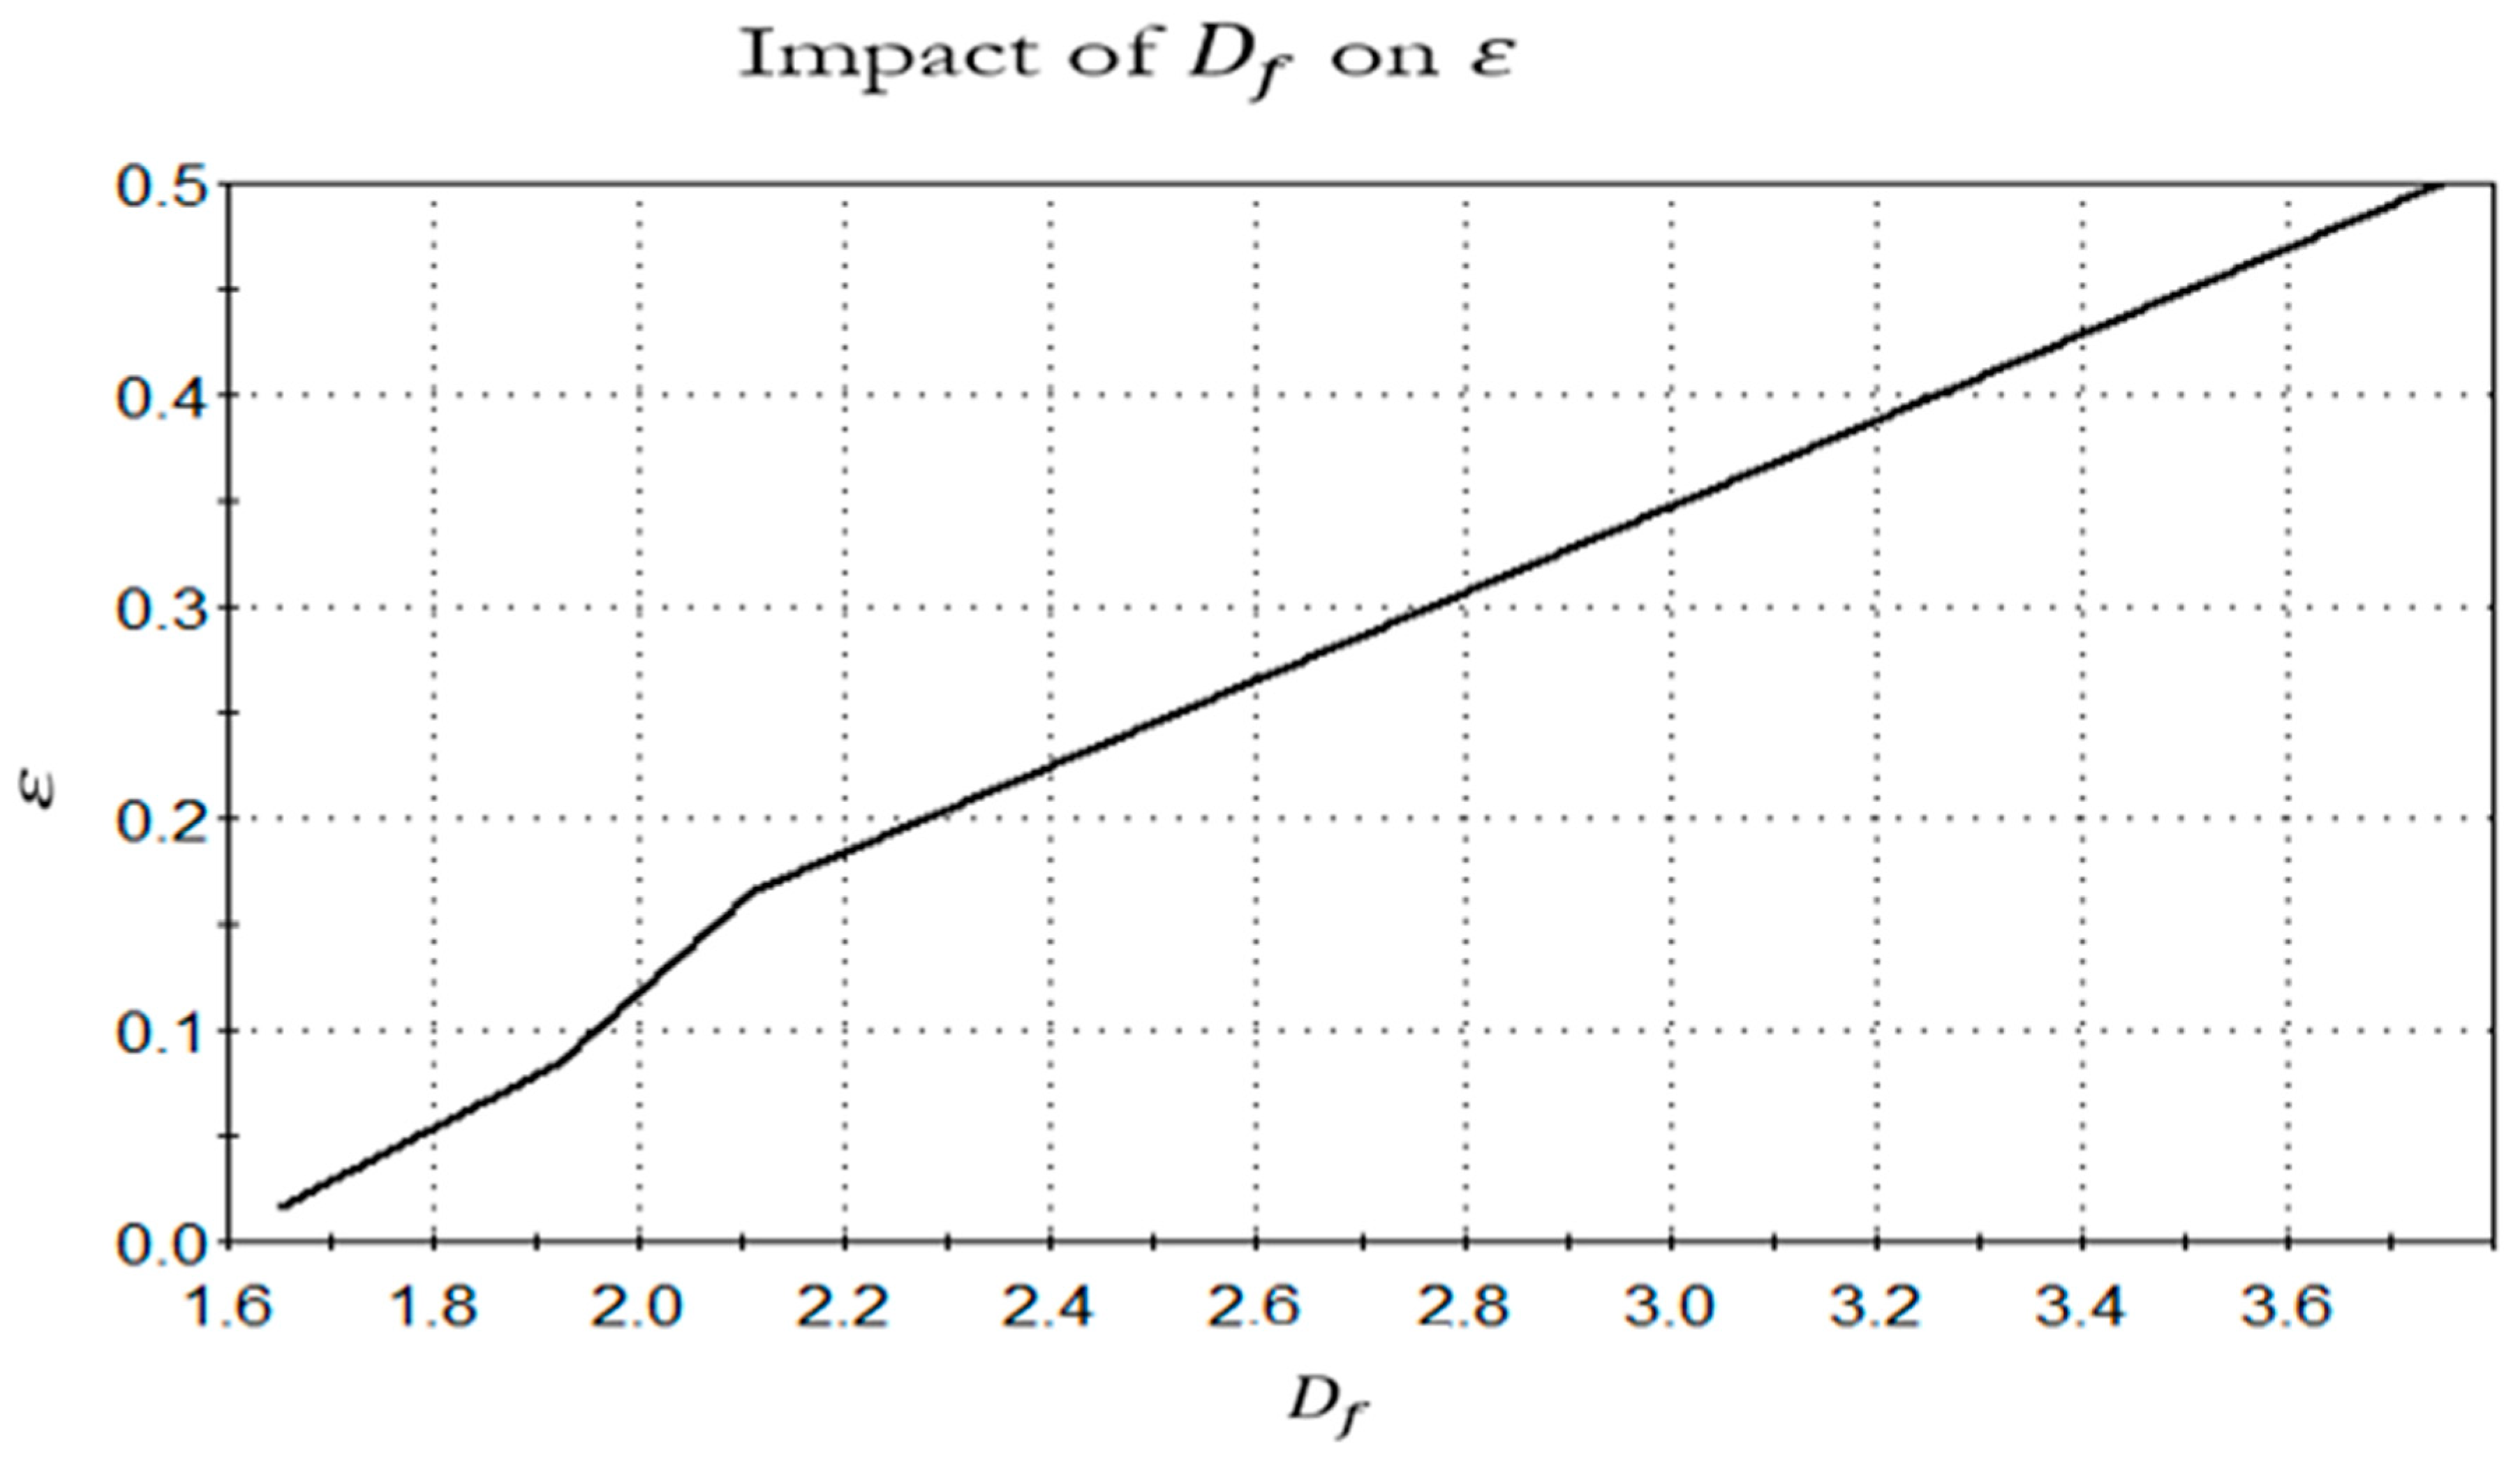
Figure 4.
A schematic of a 1 U CubeSat satellite with a fractal slot antenna mounted on one face. The antenna geometry consists of multiple iterations of Koch curves, with each iteration increasing the total length of the antenna. The dimensions and placement of the antenna feed are determined based on parametric studies and simulations to achieve better impedance matching.
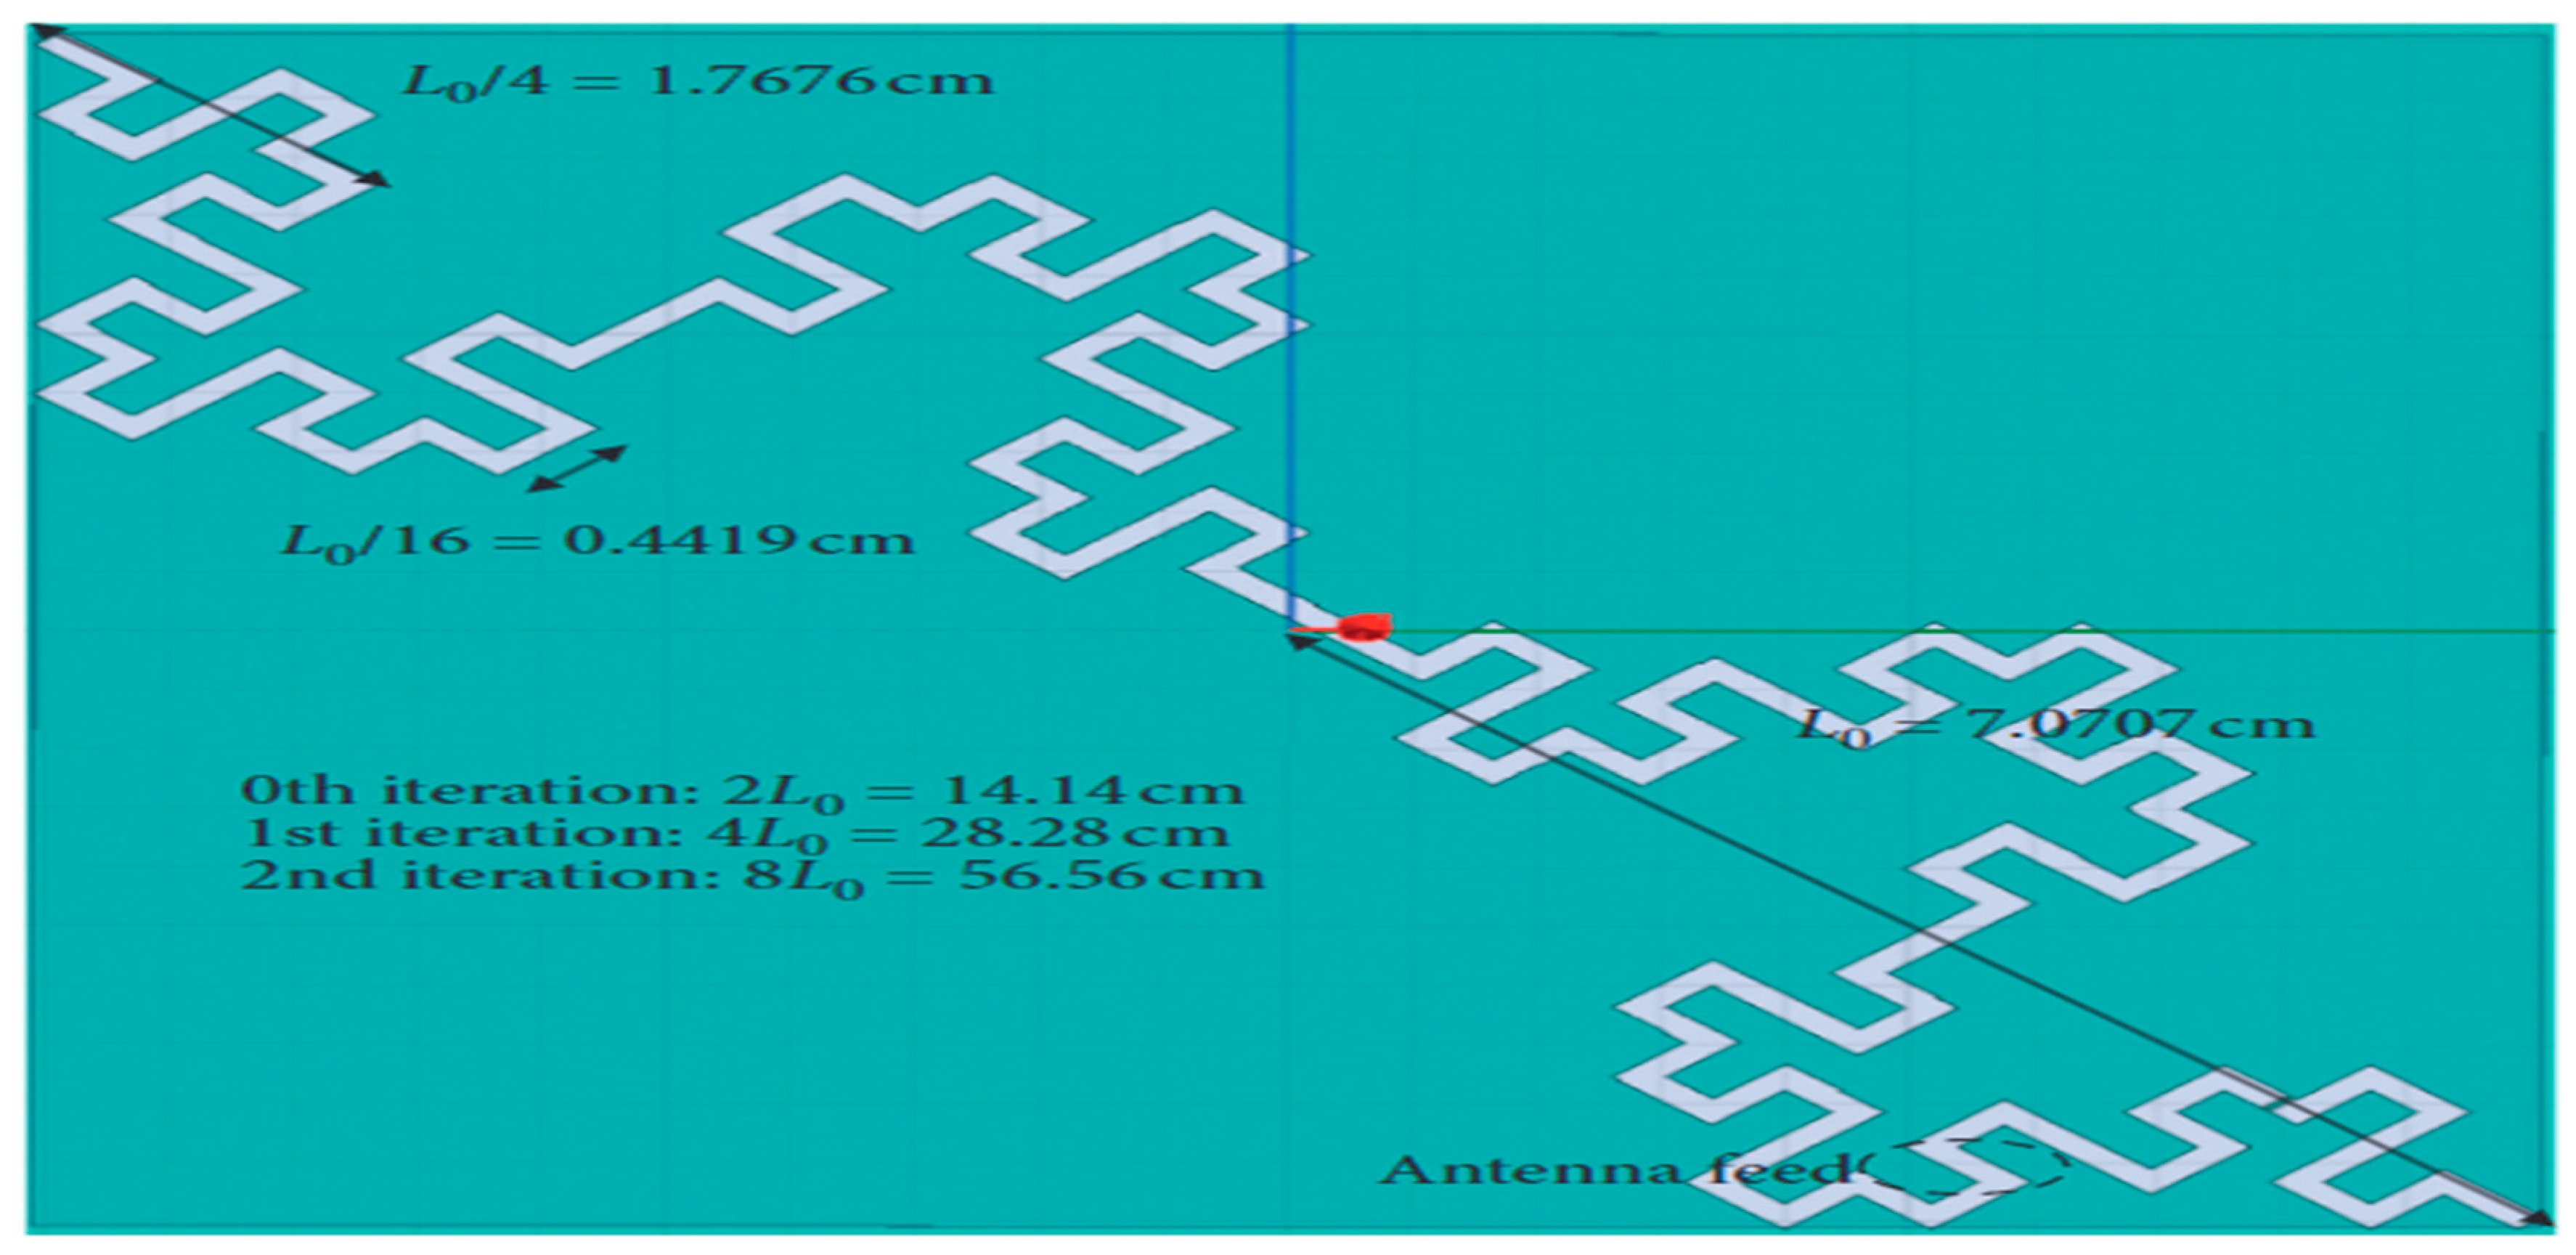
Figure 5.
The top view of the implemented antenna, which has dimensions of 20.4 cm × 25.4 cm. This antenna is designed for use in a CubeSat satellite and is part of a fractal slot antenna system. The top view shows the central part of the antenna, which measures 10 cm × 10 cm, located on a printed circuit board (PCB) laminate.
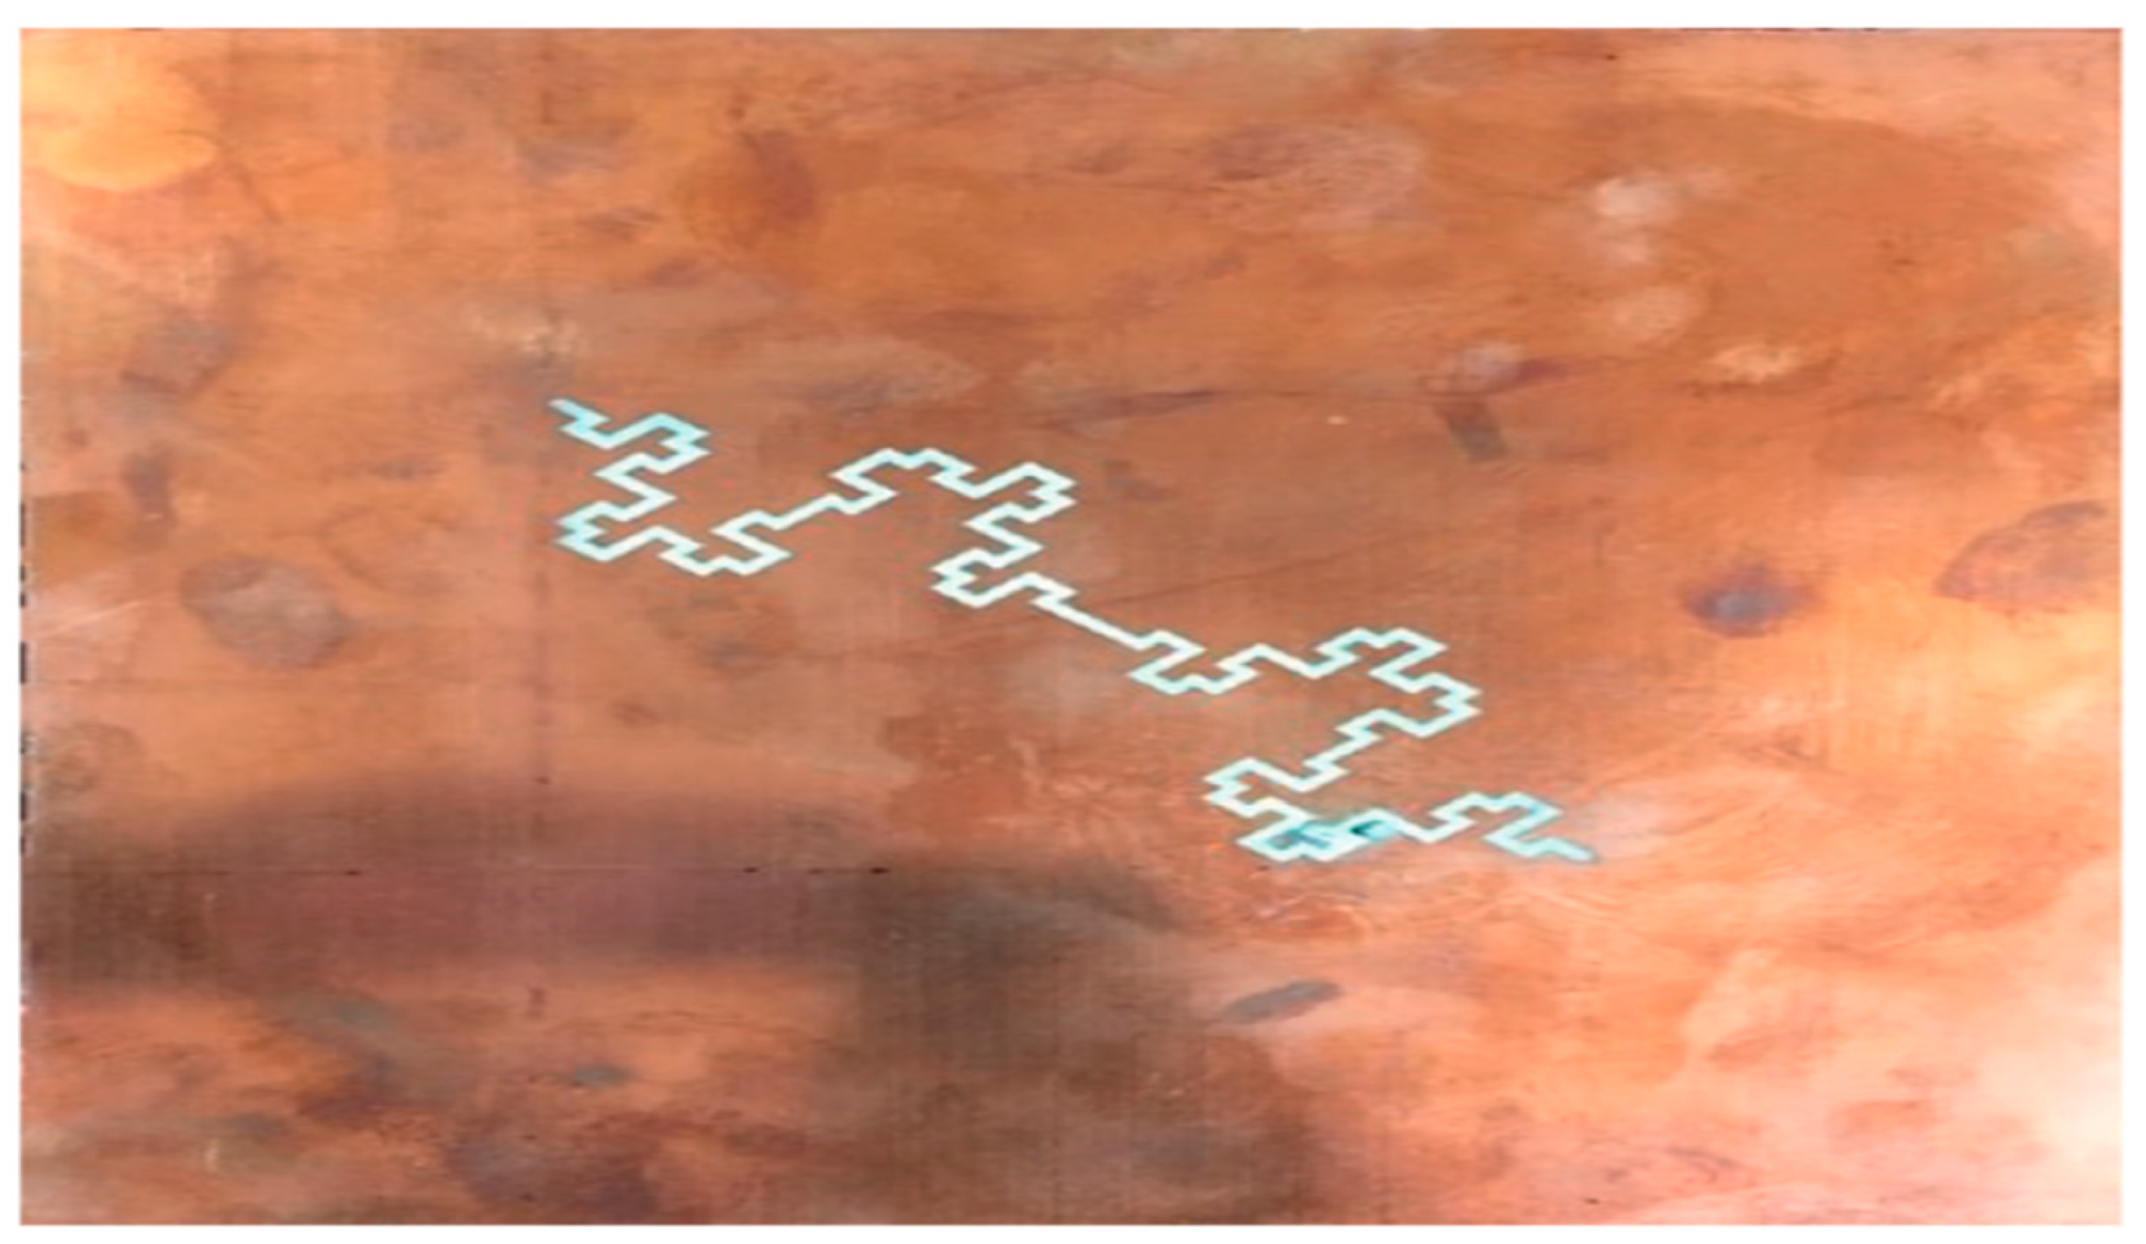
Figure 6.
An indication of the process of designing and constructing the specific component of the antenna responsible for emitting electromagnetic waves. The details regarding the specific methodology or techniques used for this formation are not provided in the given context.
Figure 6.
An indication of the process of designing and constructing the specific component of the antenna responsible for emitting electromagnetic waves. The details regarding the specific methodology or techniques used for this formation are not provided in the given context.
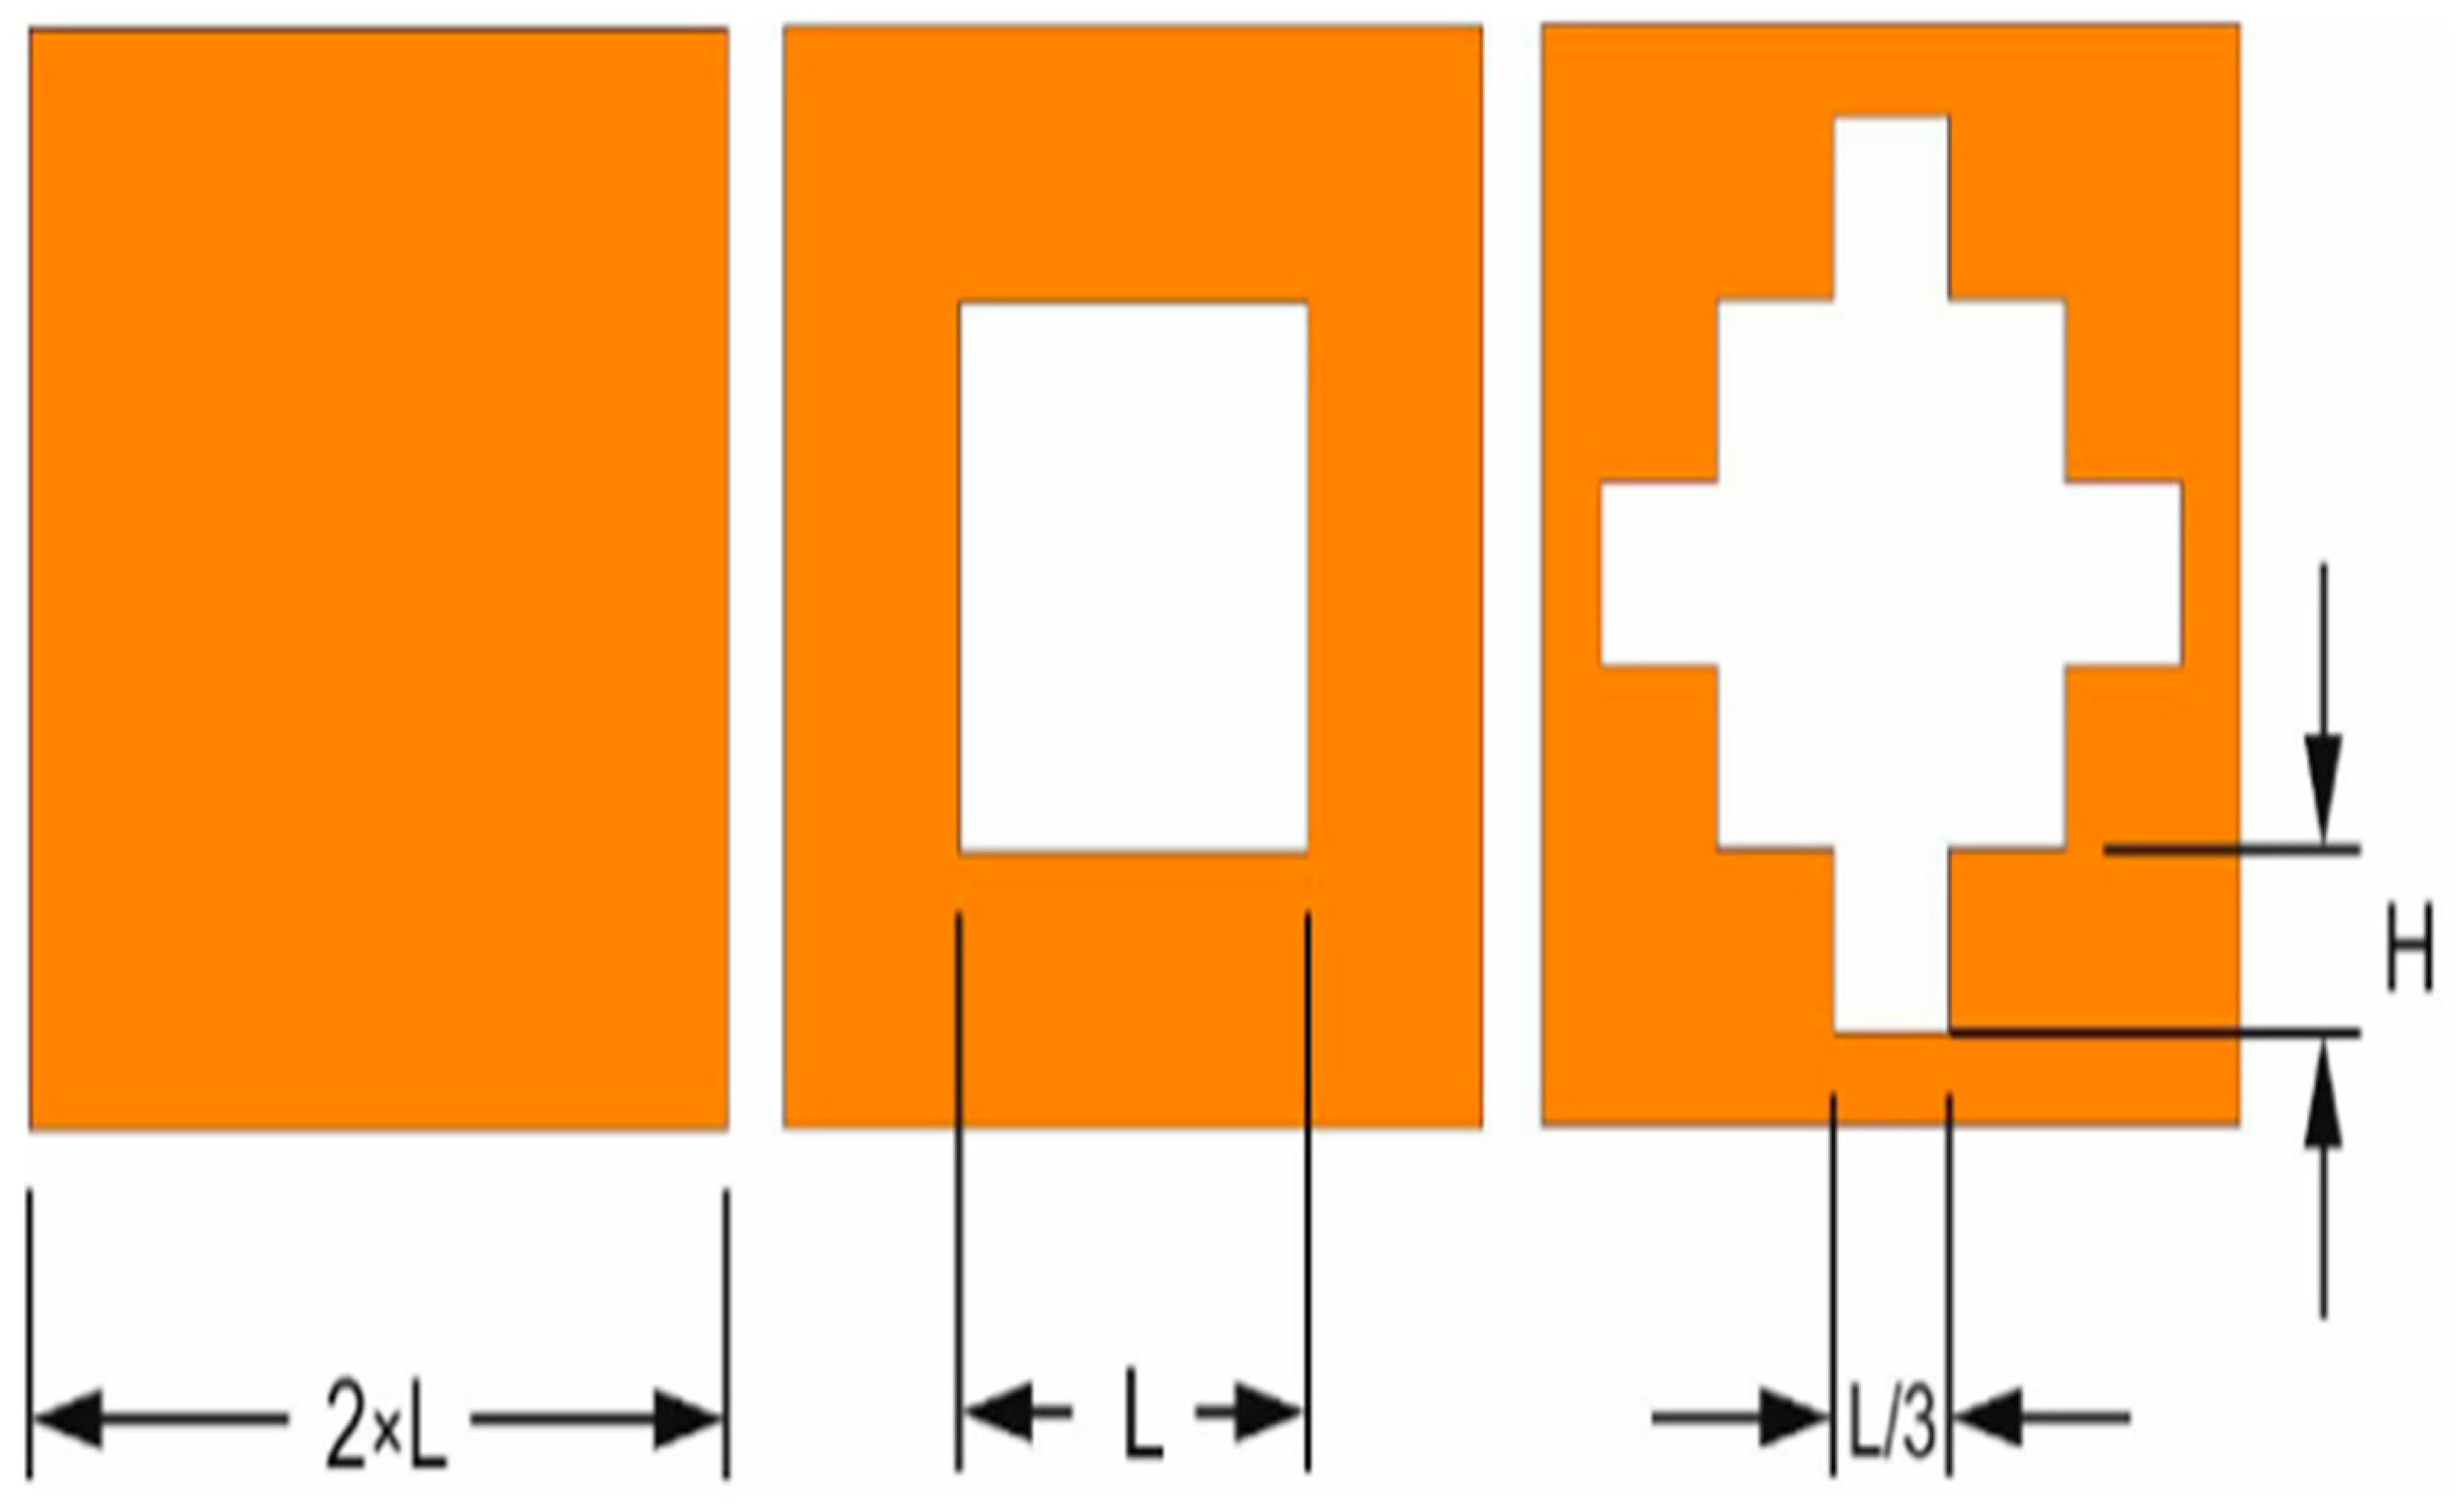
Figure 7.
The plots refer to the results of modeling and measurements of the antenna's reflection coefficient. The reflection coefficient is a parameter that quantifies the amount of electromagnetic energy reflected by the antenna compared to the incident energy. The authors [15] present these results in a graph, where the dashed line represents the modeled reflection coefficient, and the full line represents the measured reflection coefficient.
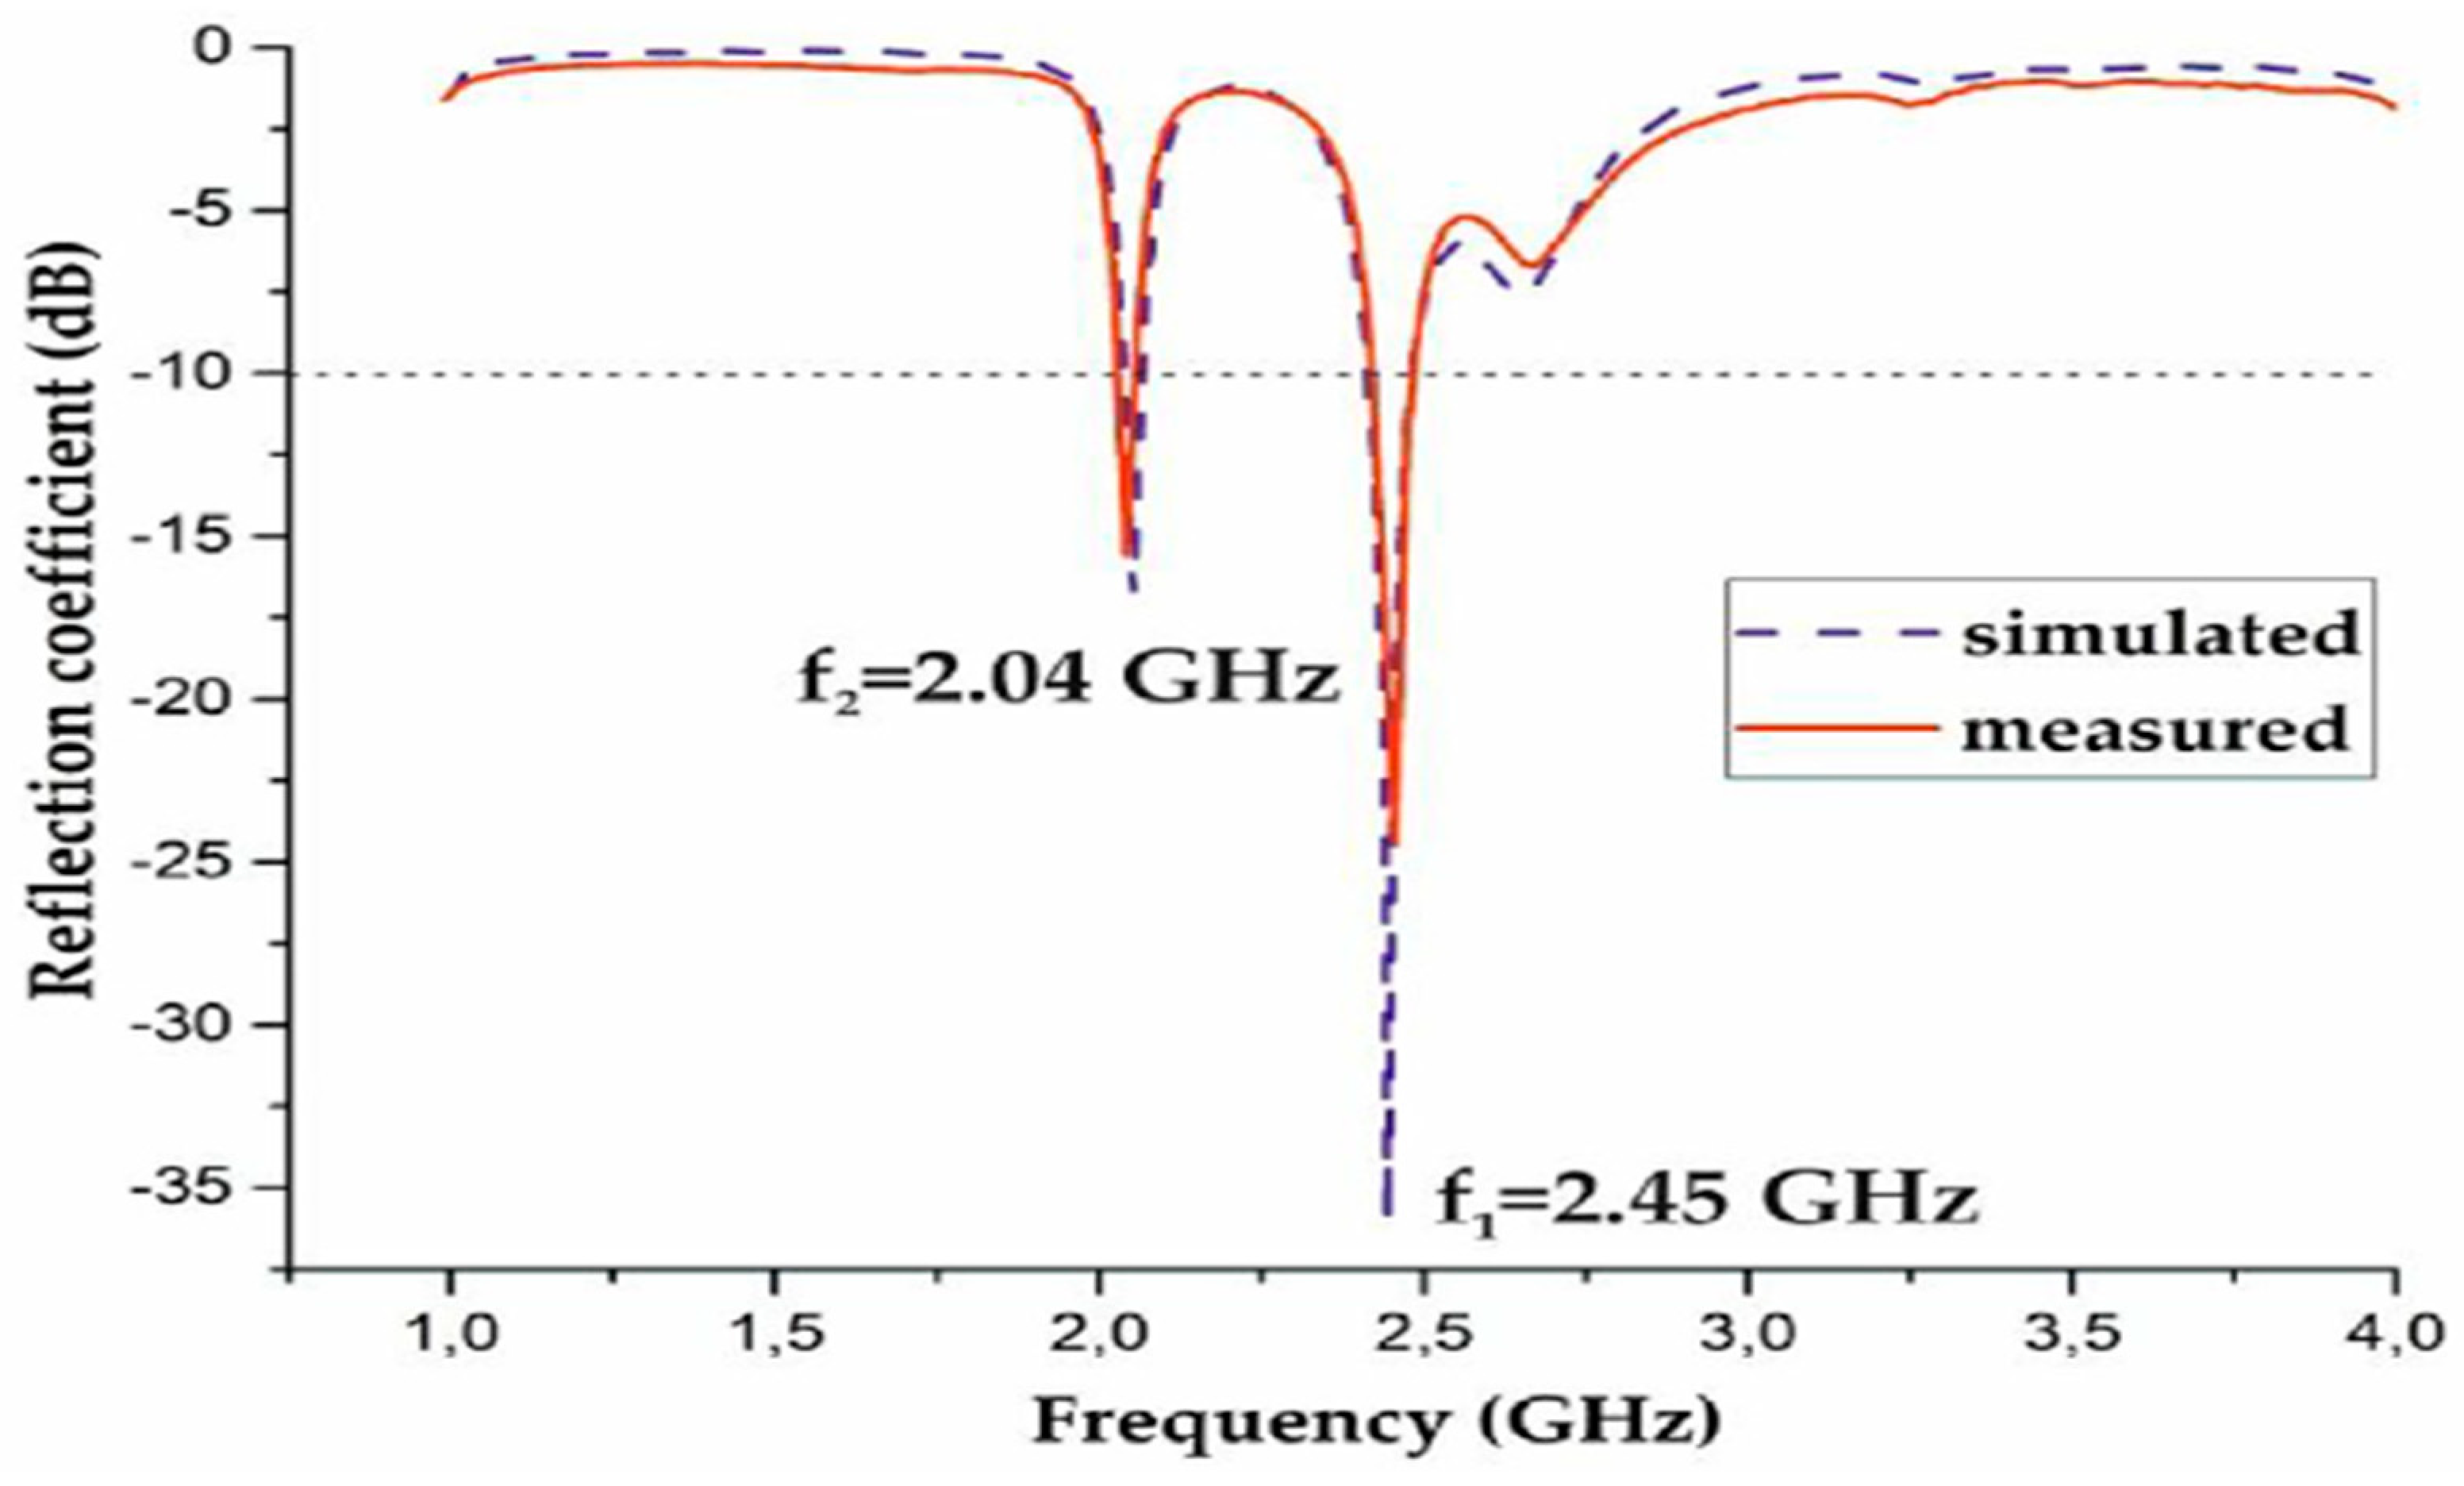
Figure 8.
Referring to the results of simulations and measurements of the two-dimensional (2D) radiation pattern of an antenna at frequencies of 2.45 GHz and 2.04 GHz. The E-plane and H-plane radiation patterns are shown in separate figures, with the simulation results represented by dashed lines and the measurement results by full lines [15].
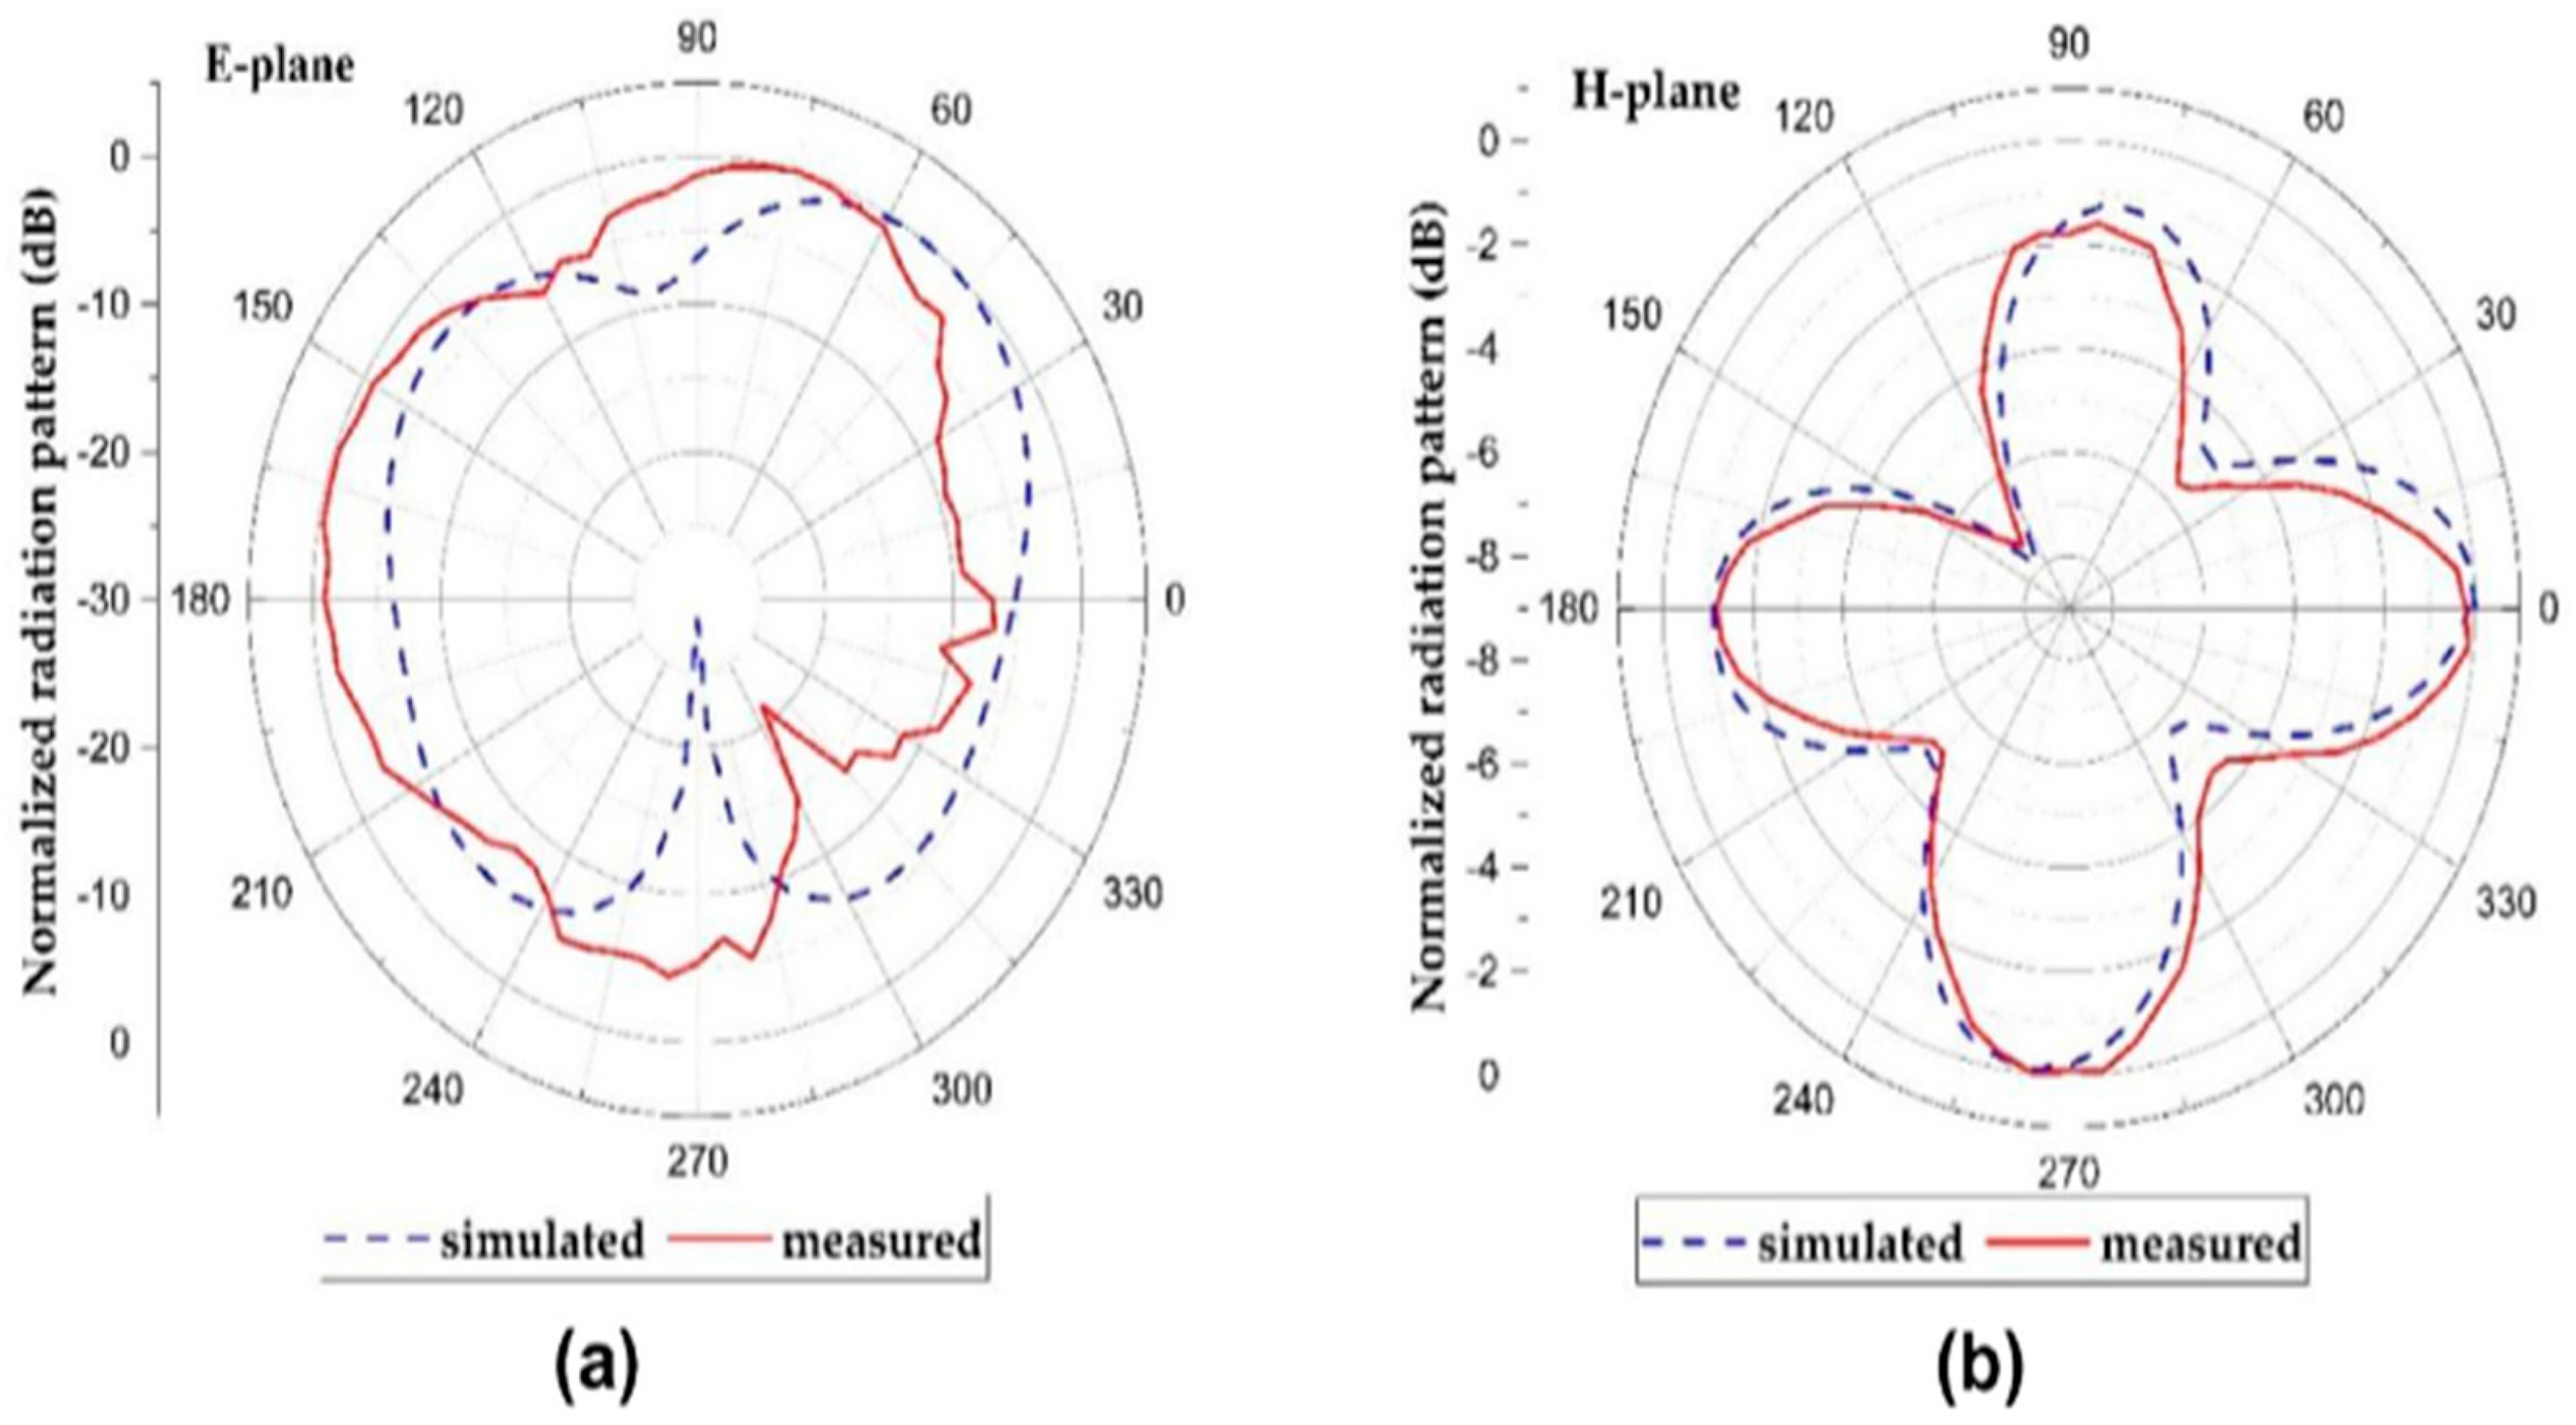
Figure 9.
The radiation pattern describes how the antenna radiates or receives electromagnetic waves in different directions. The results of simulation and measurements are presented, indicating the antenna's directional characteristics at these frequencies.
Figure 9.
The radiation pattern describes how the antenna radiates or receives electromagnetic waves in different directions. The results of simulation and measurements are presented, indicating the antenna's directional characteristics at these frequencies.
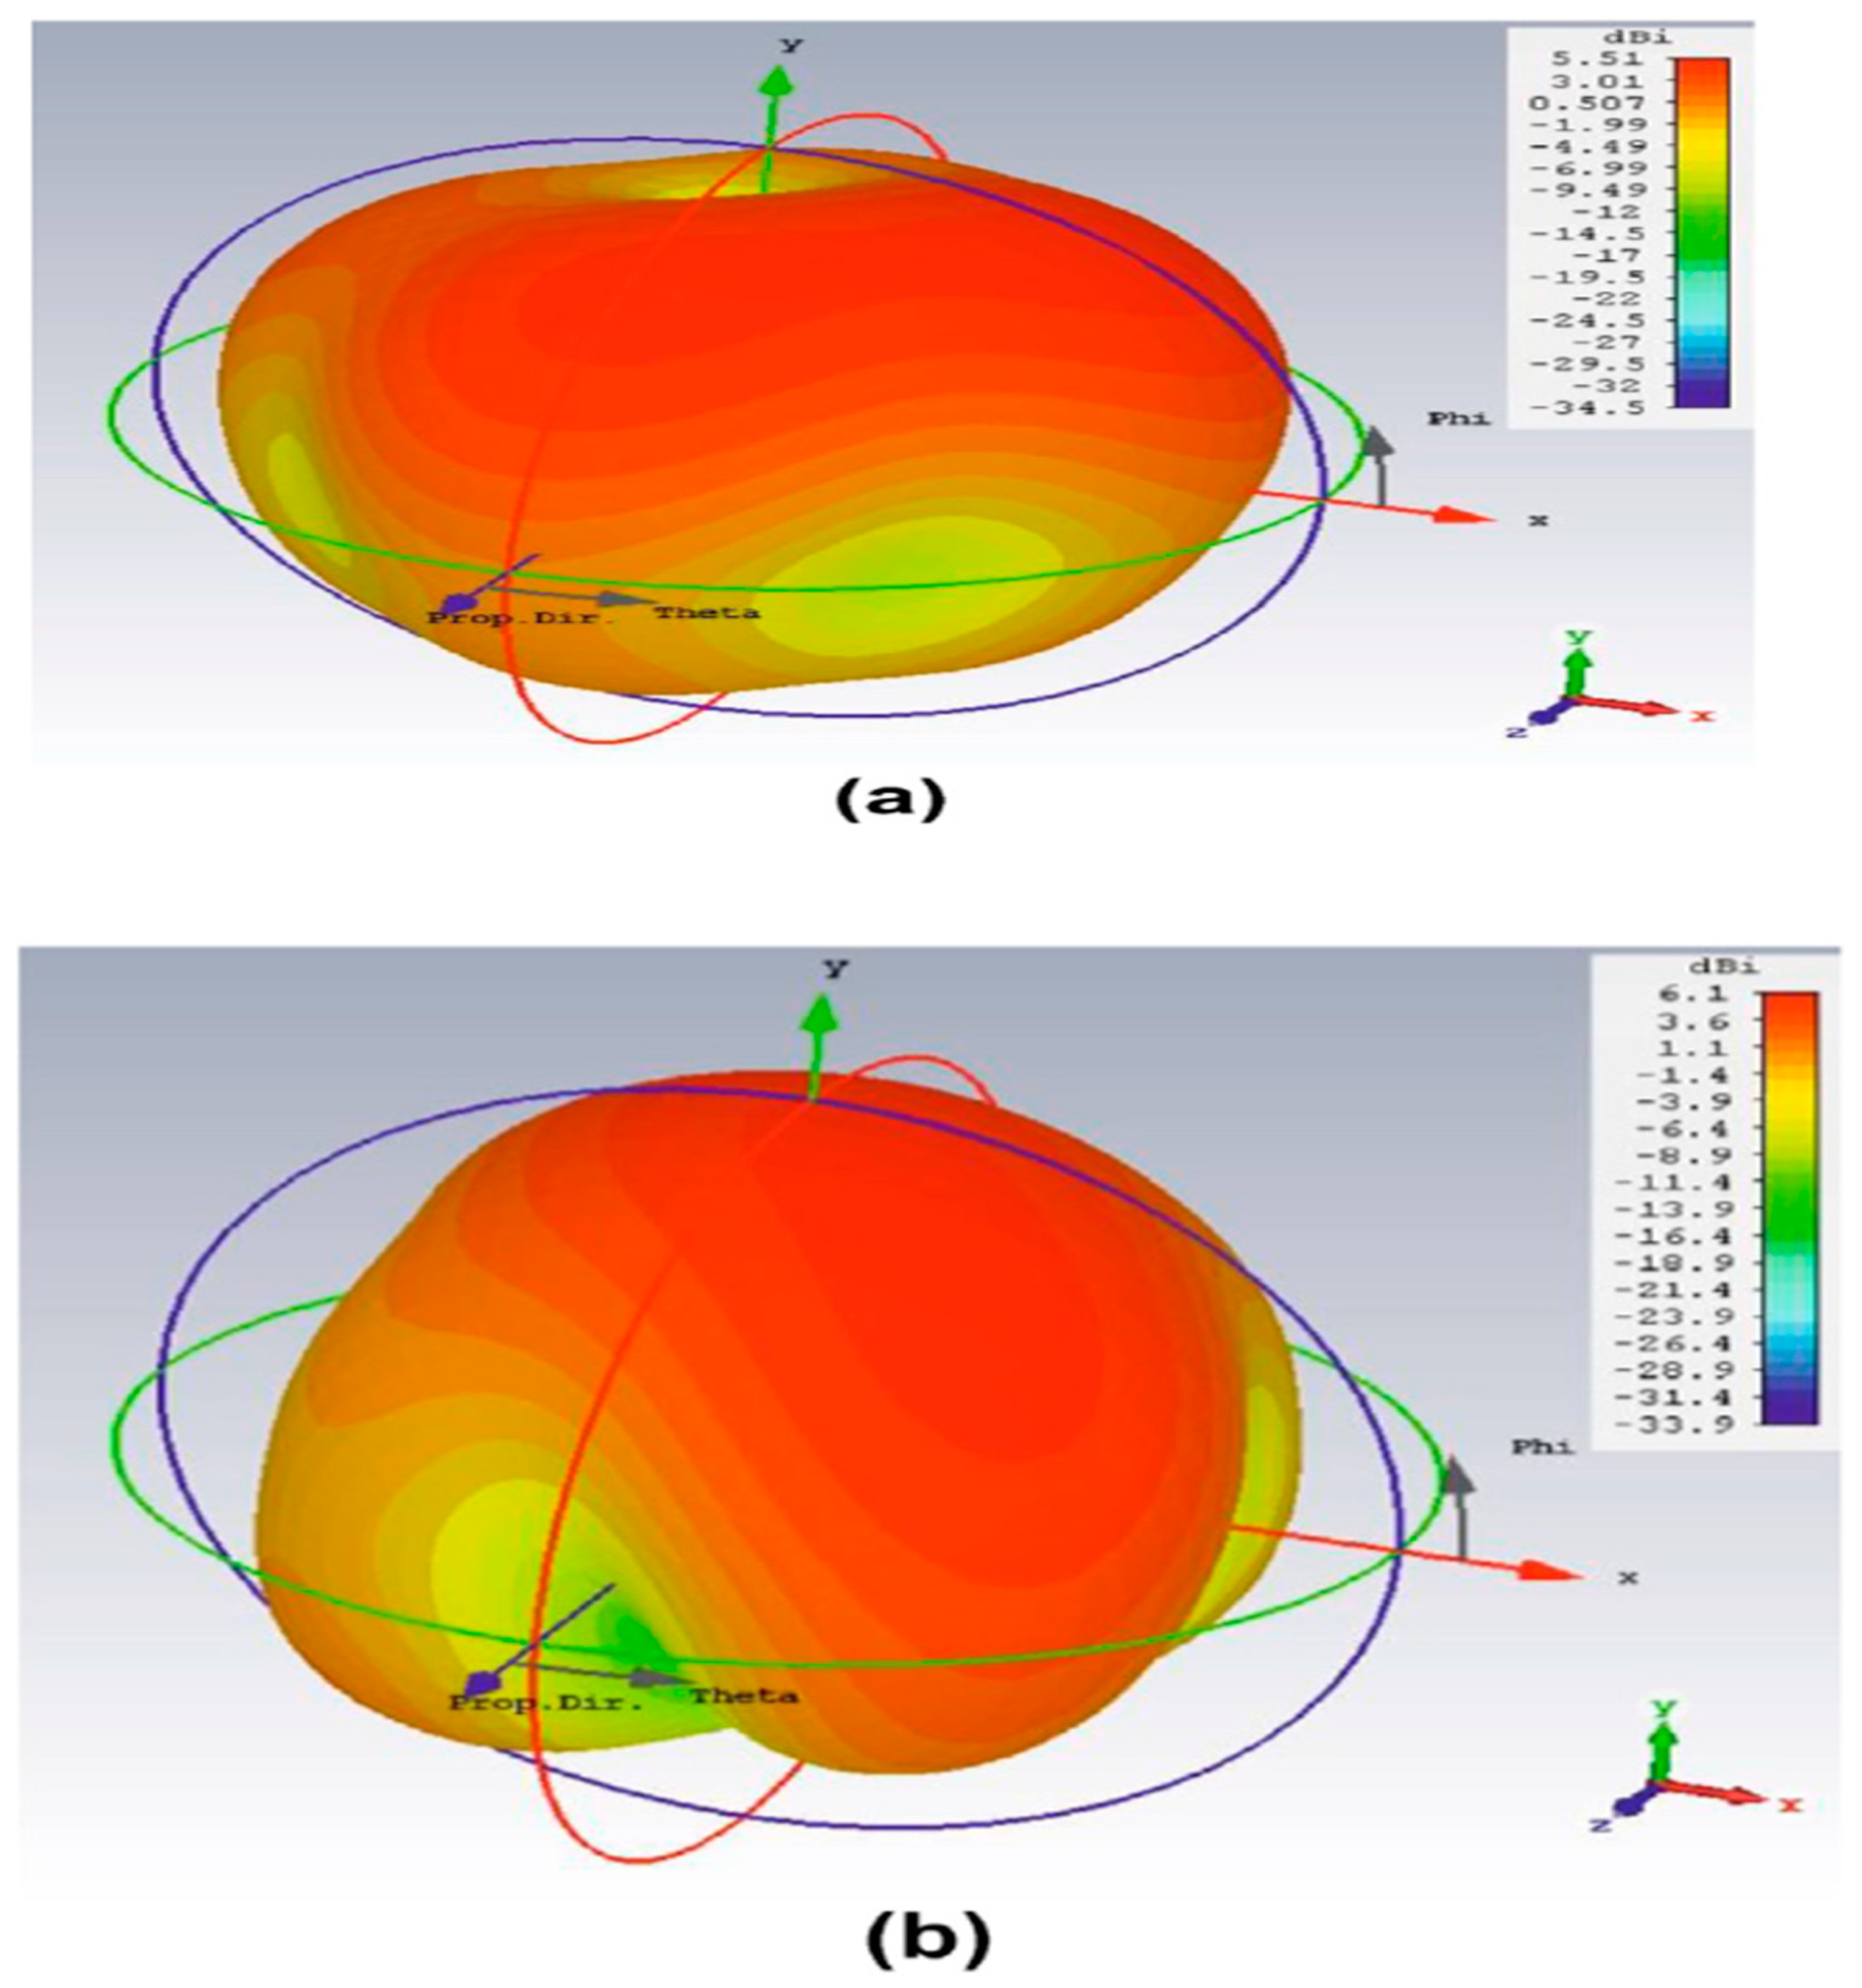
Figure 10.
The text refers to a graphical representation of BuhoSat, which is a visual depiction of the structure and mechanisms of the satellite. The BuhoSat mission requirements, provide specifications and verification criteria for various aspects of the satellite's design, such as protection of components, power supply, communication capabilities, imaging capabilities, data storage, and environmental requirements. The graphical representation serves as a visual aid to understand the overall design and functionality of BuhoSat.
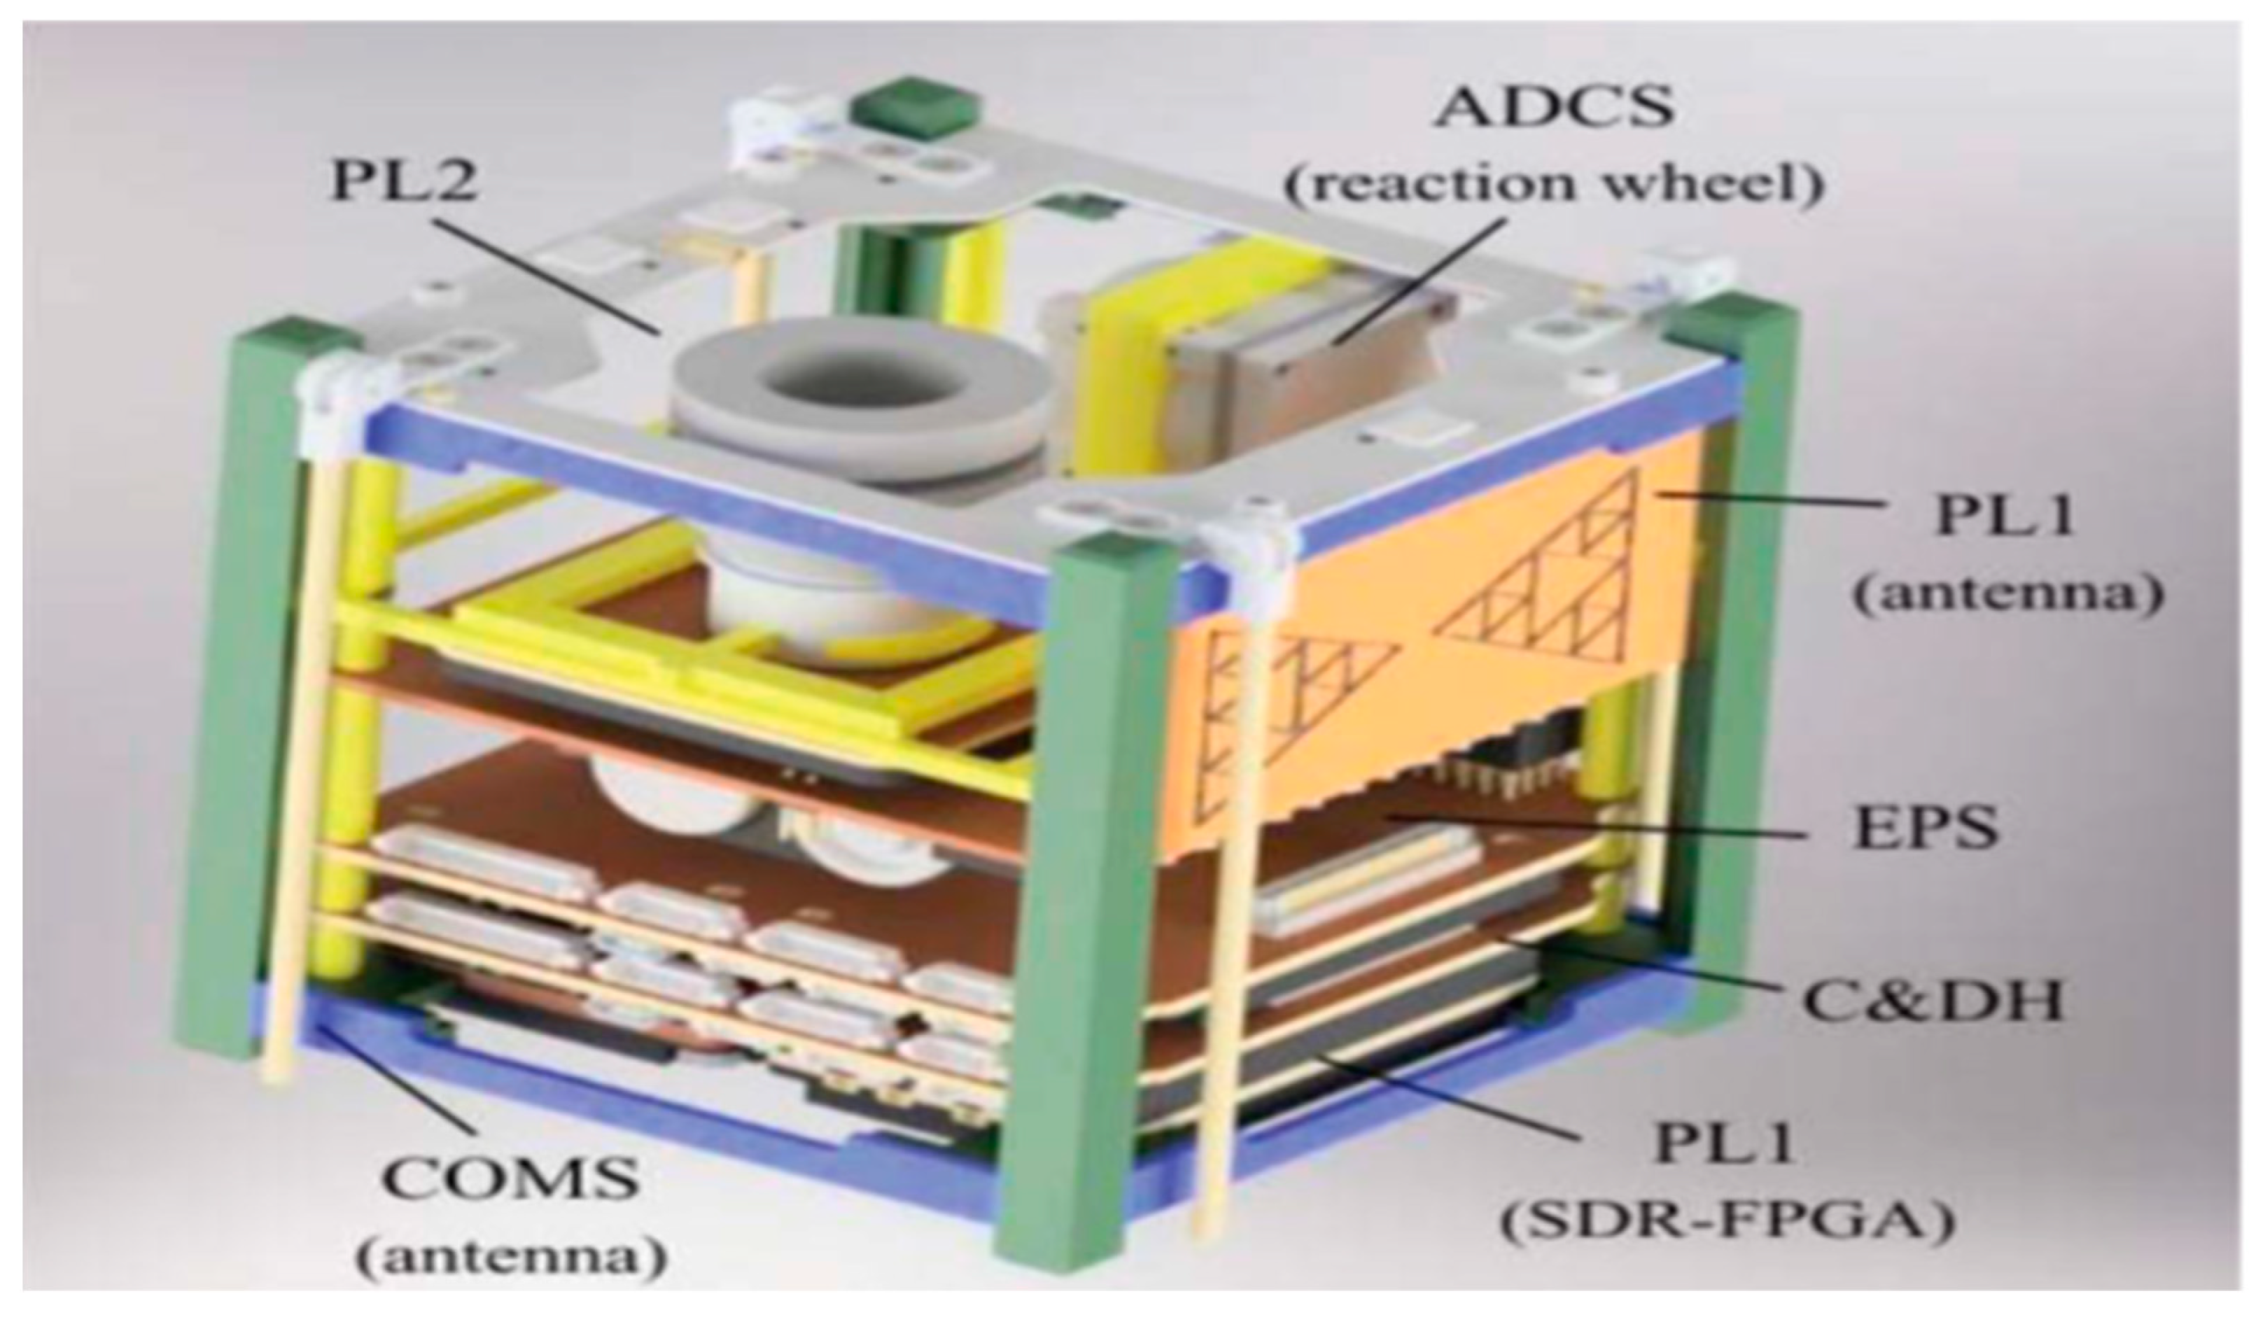
Figure 11.
Refers to different sizes of CubeSat models, specifically 1U, 2U, and 3U.
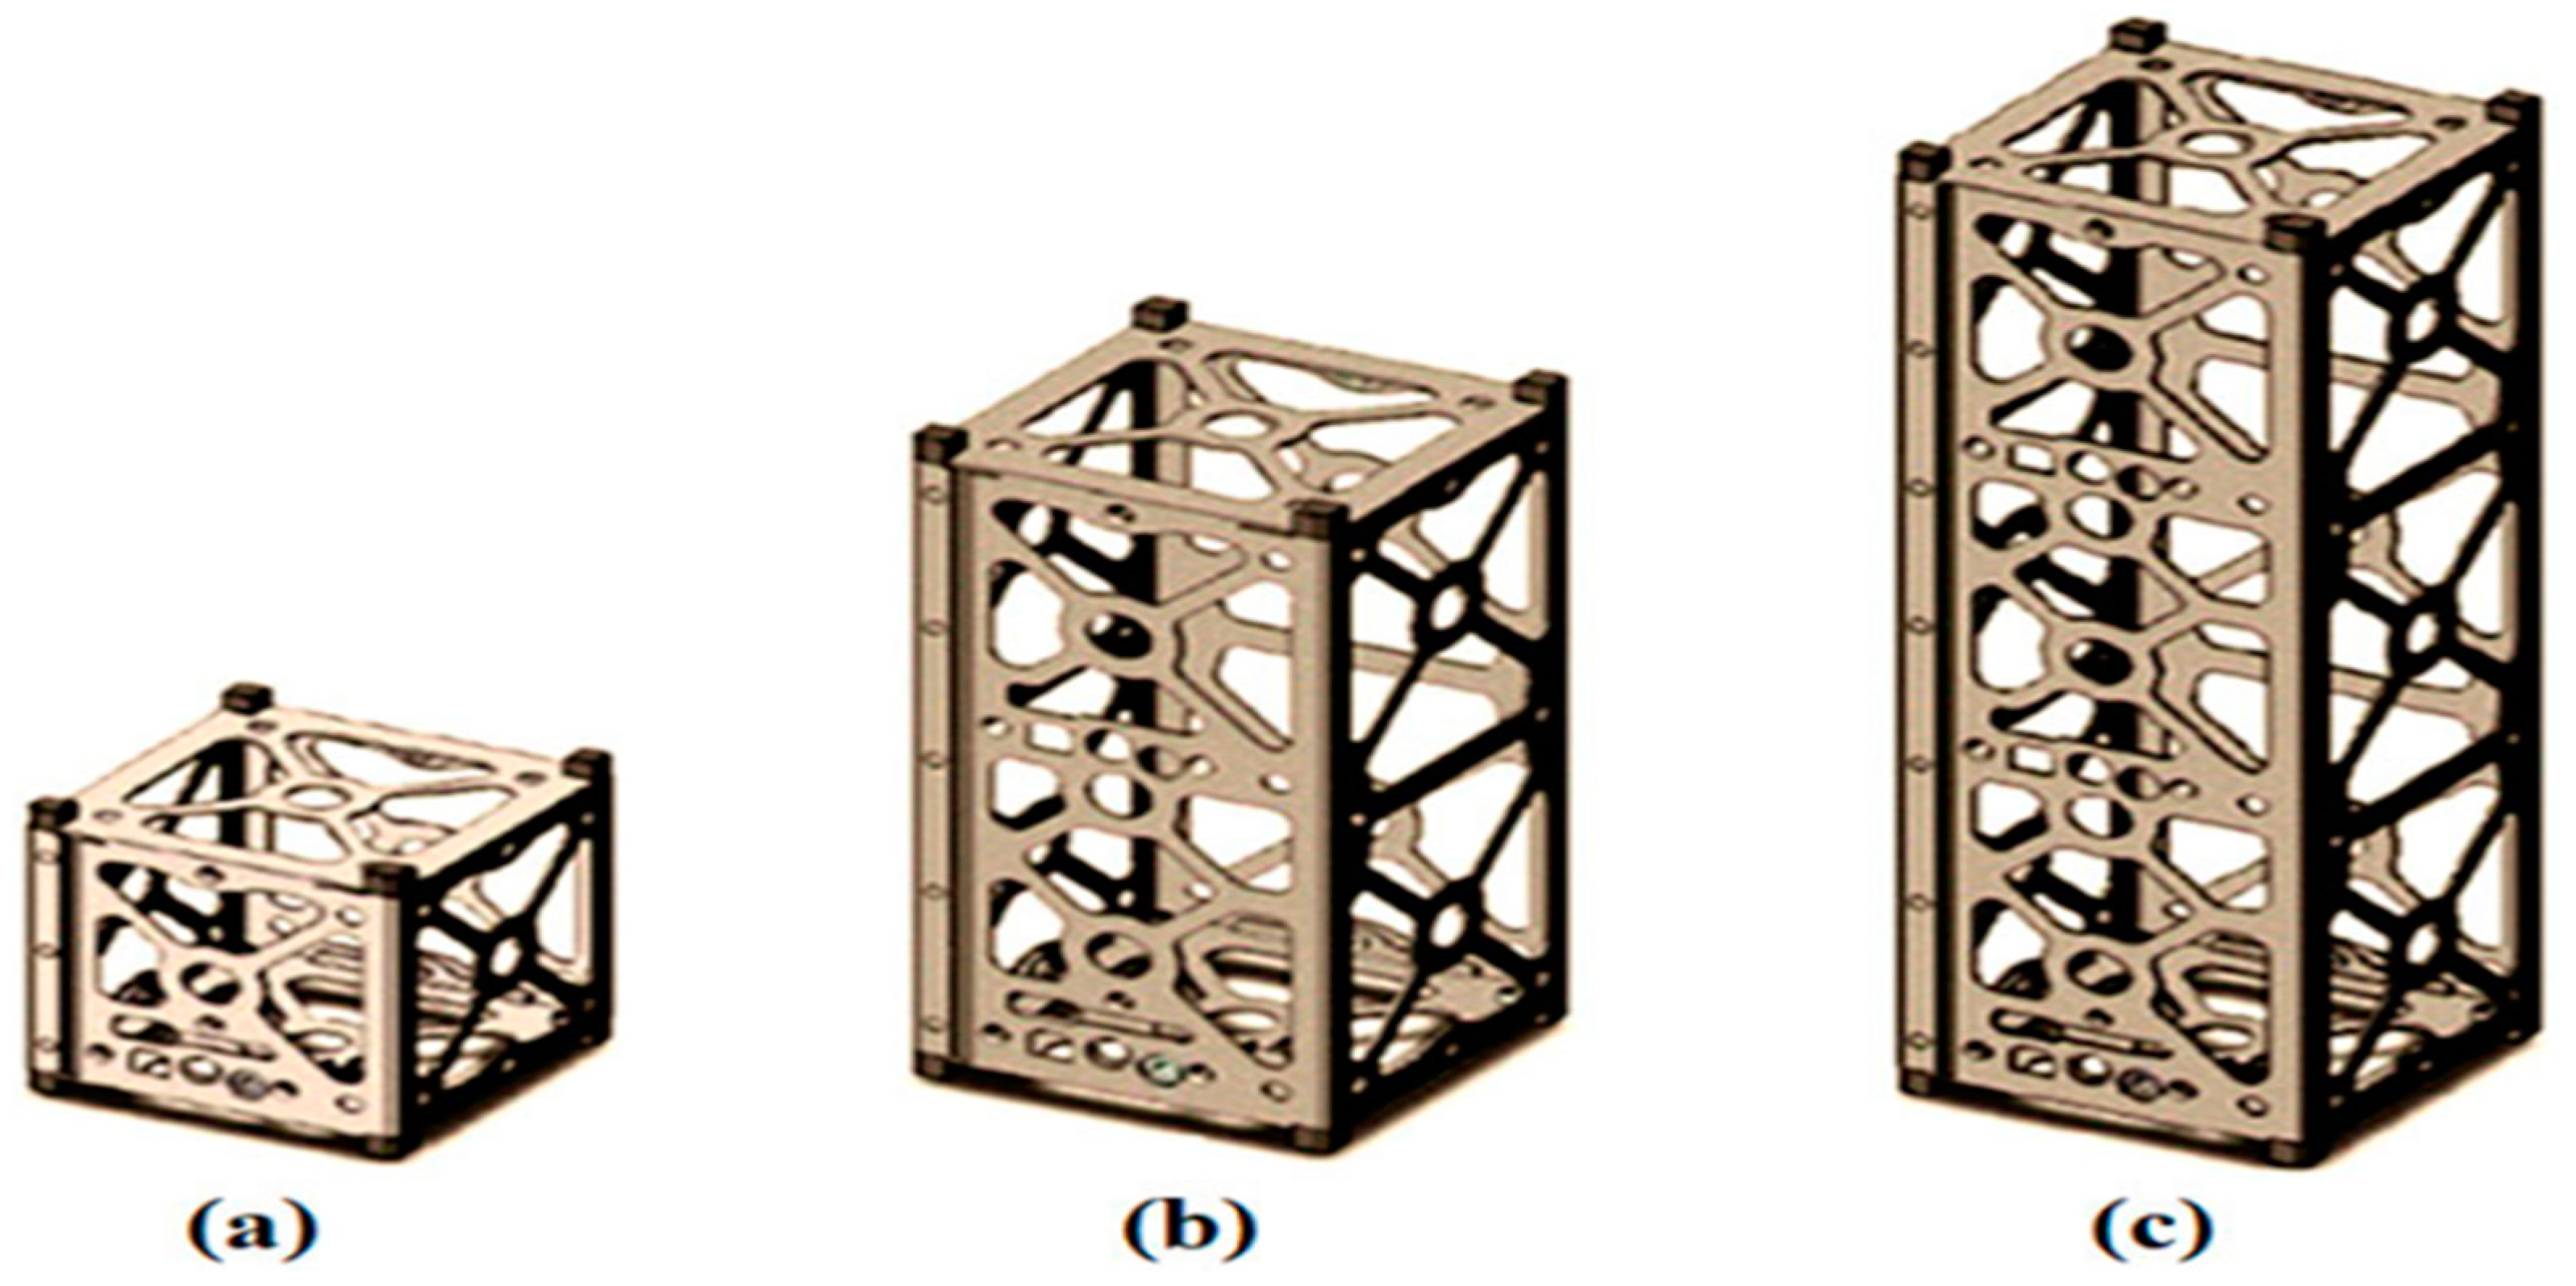
Figure 12.
The proposed fractal antenna is a compact antenna design for CubeSats that utilizes a Koch snowflake fractal structure to achieve miniaturization while maintaining high gain and good impedance matching. It has a small reflection coefficient at 2.3 GHz and a wide bandwidth. However, its omnidirectional pattern results in low gain.
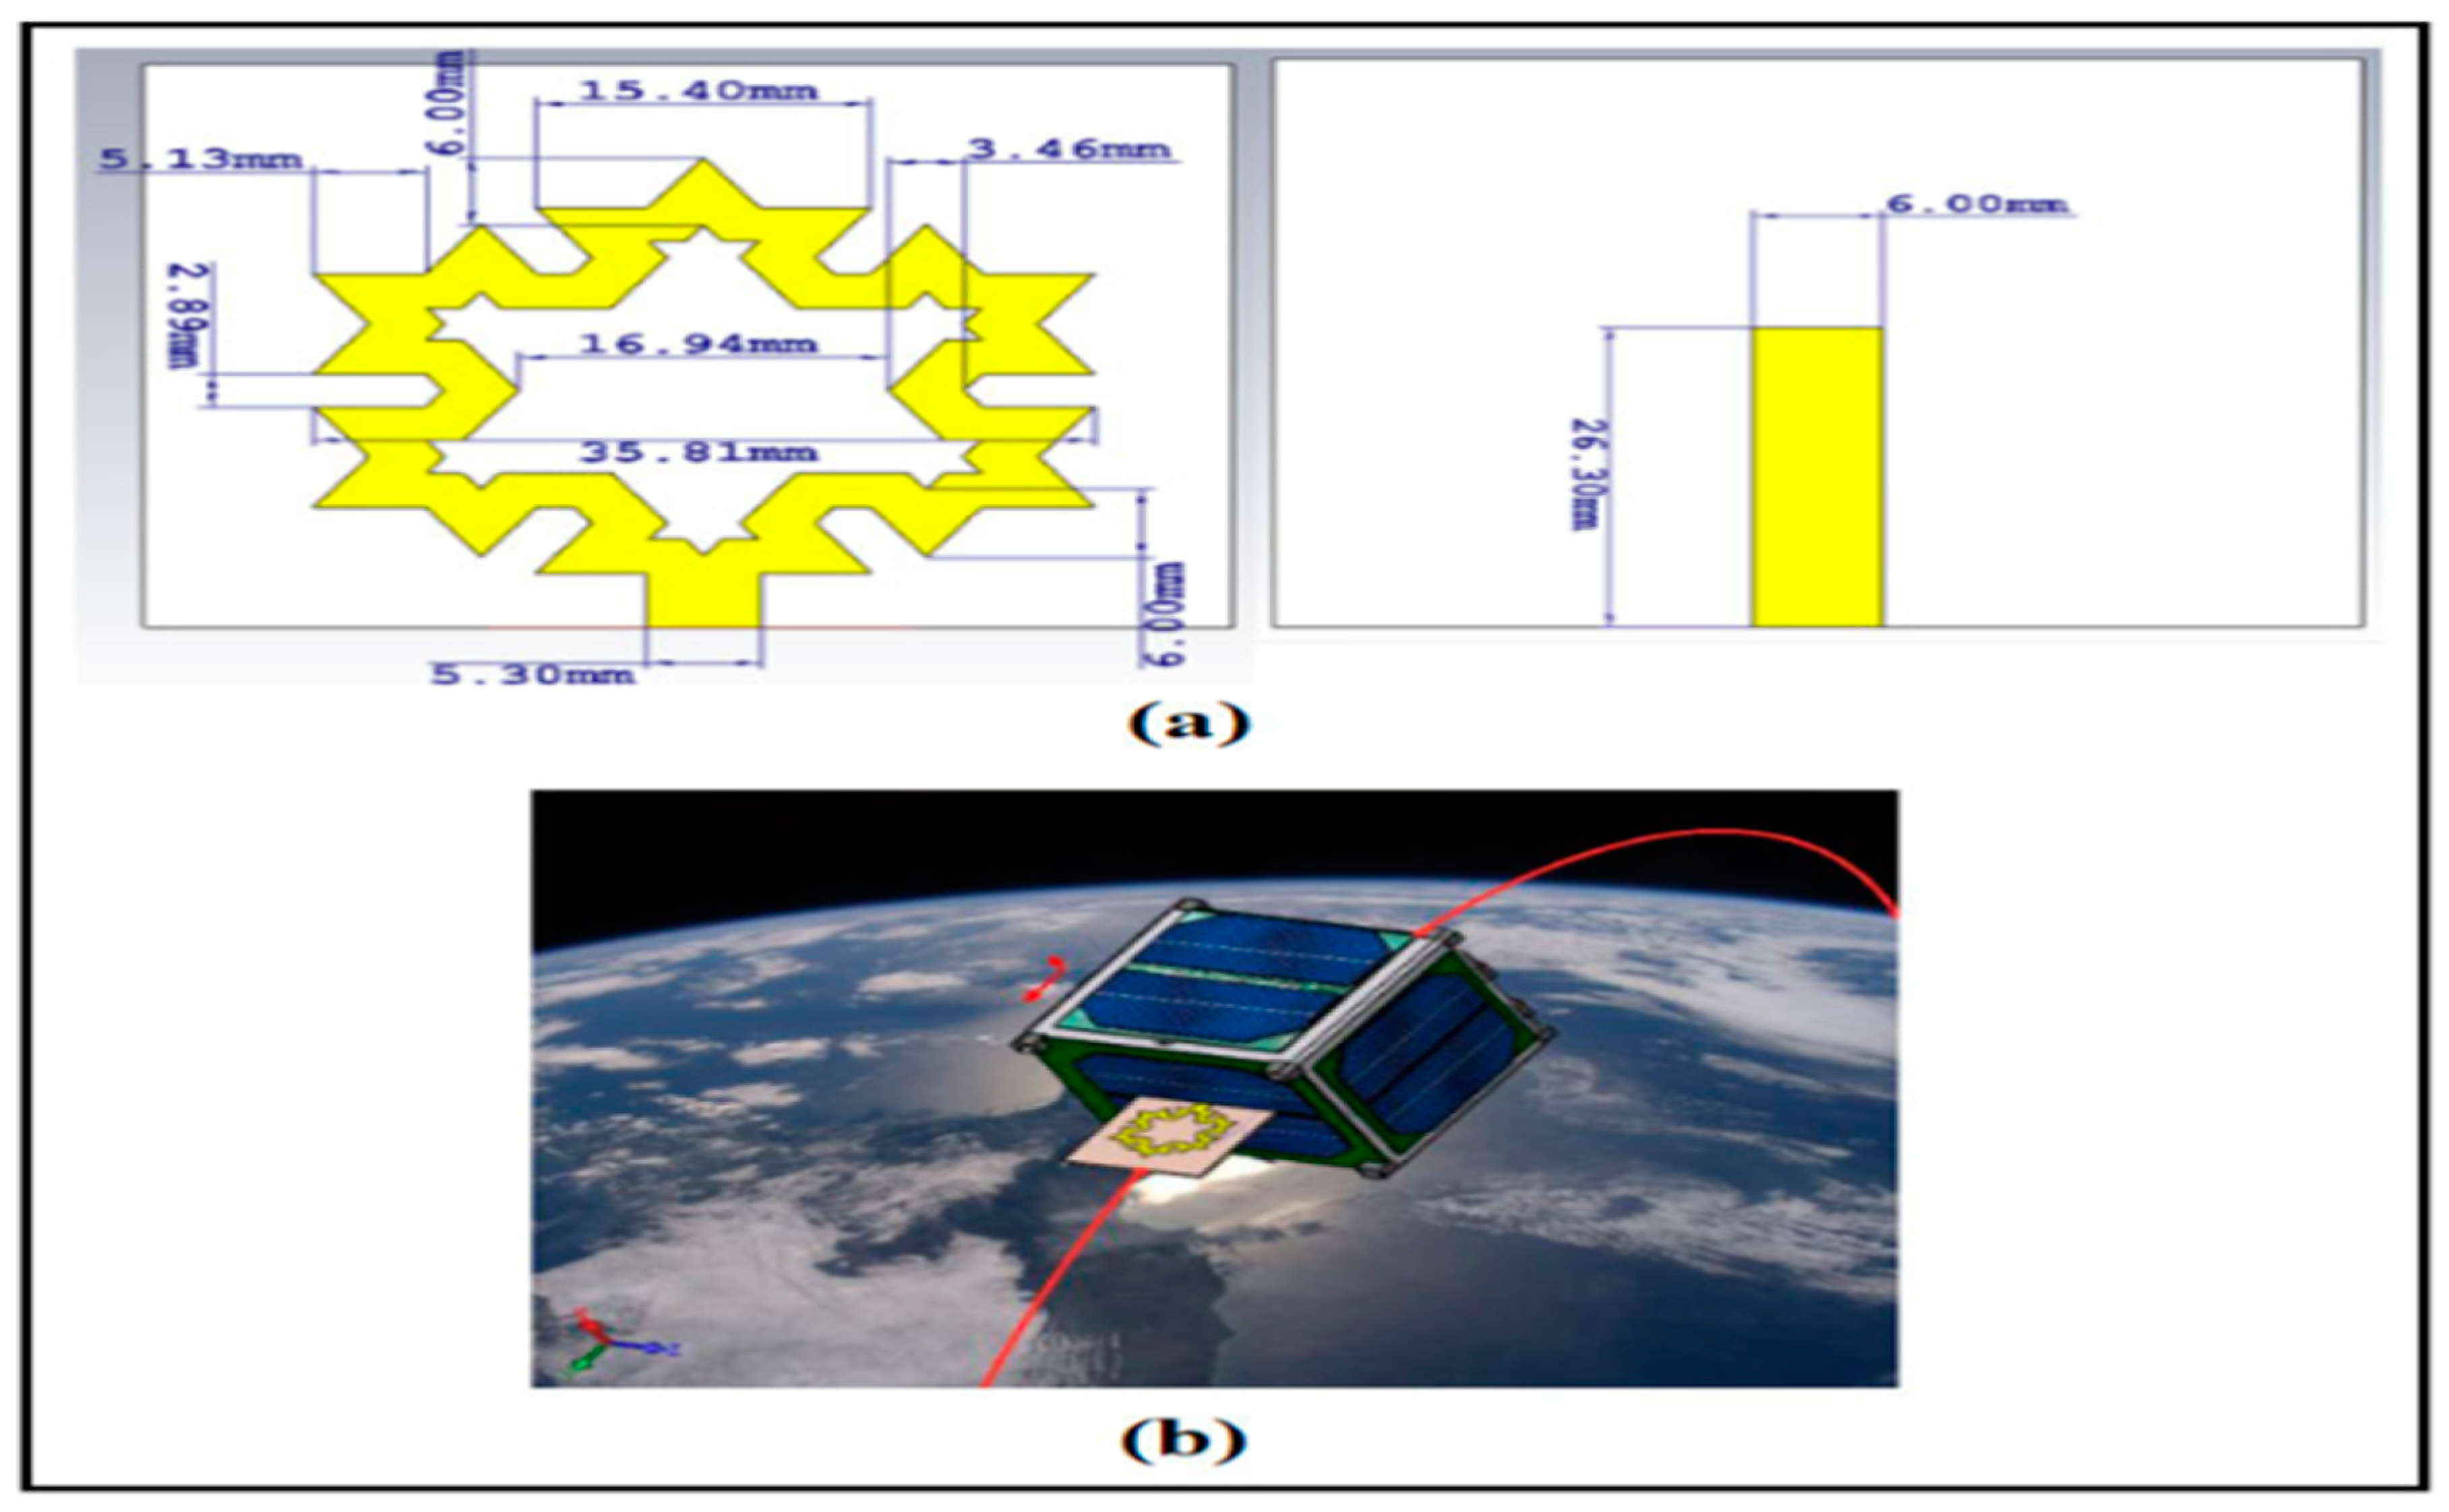
Figure 13.
The Koch's snowflake example of a geometric fractal, the Mandelbrot set illustration of an algebraic fractal, and the bubble flow illustration of a stochastic fractal.
Figure 13.
The Koch's snowflake example of a geometric fractal, the Mandelbrot set illustration of an algebraic fractal, and the bubble flow illustration of a stochastic fractal.
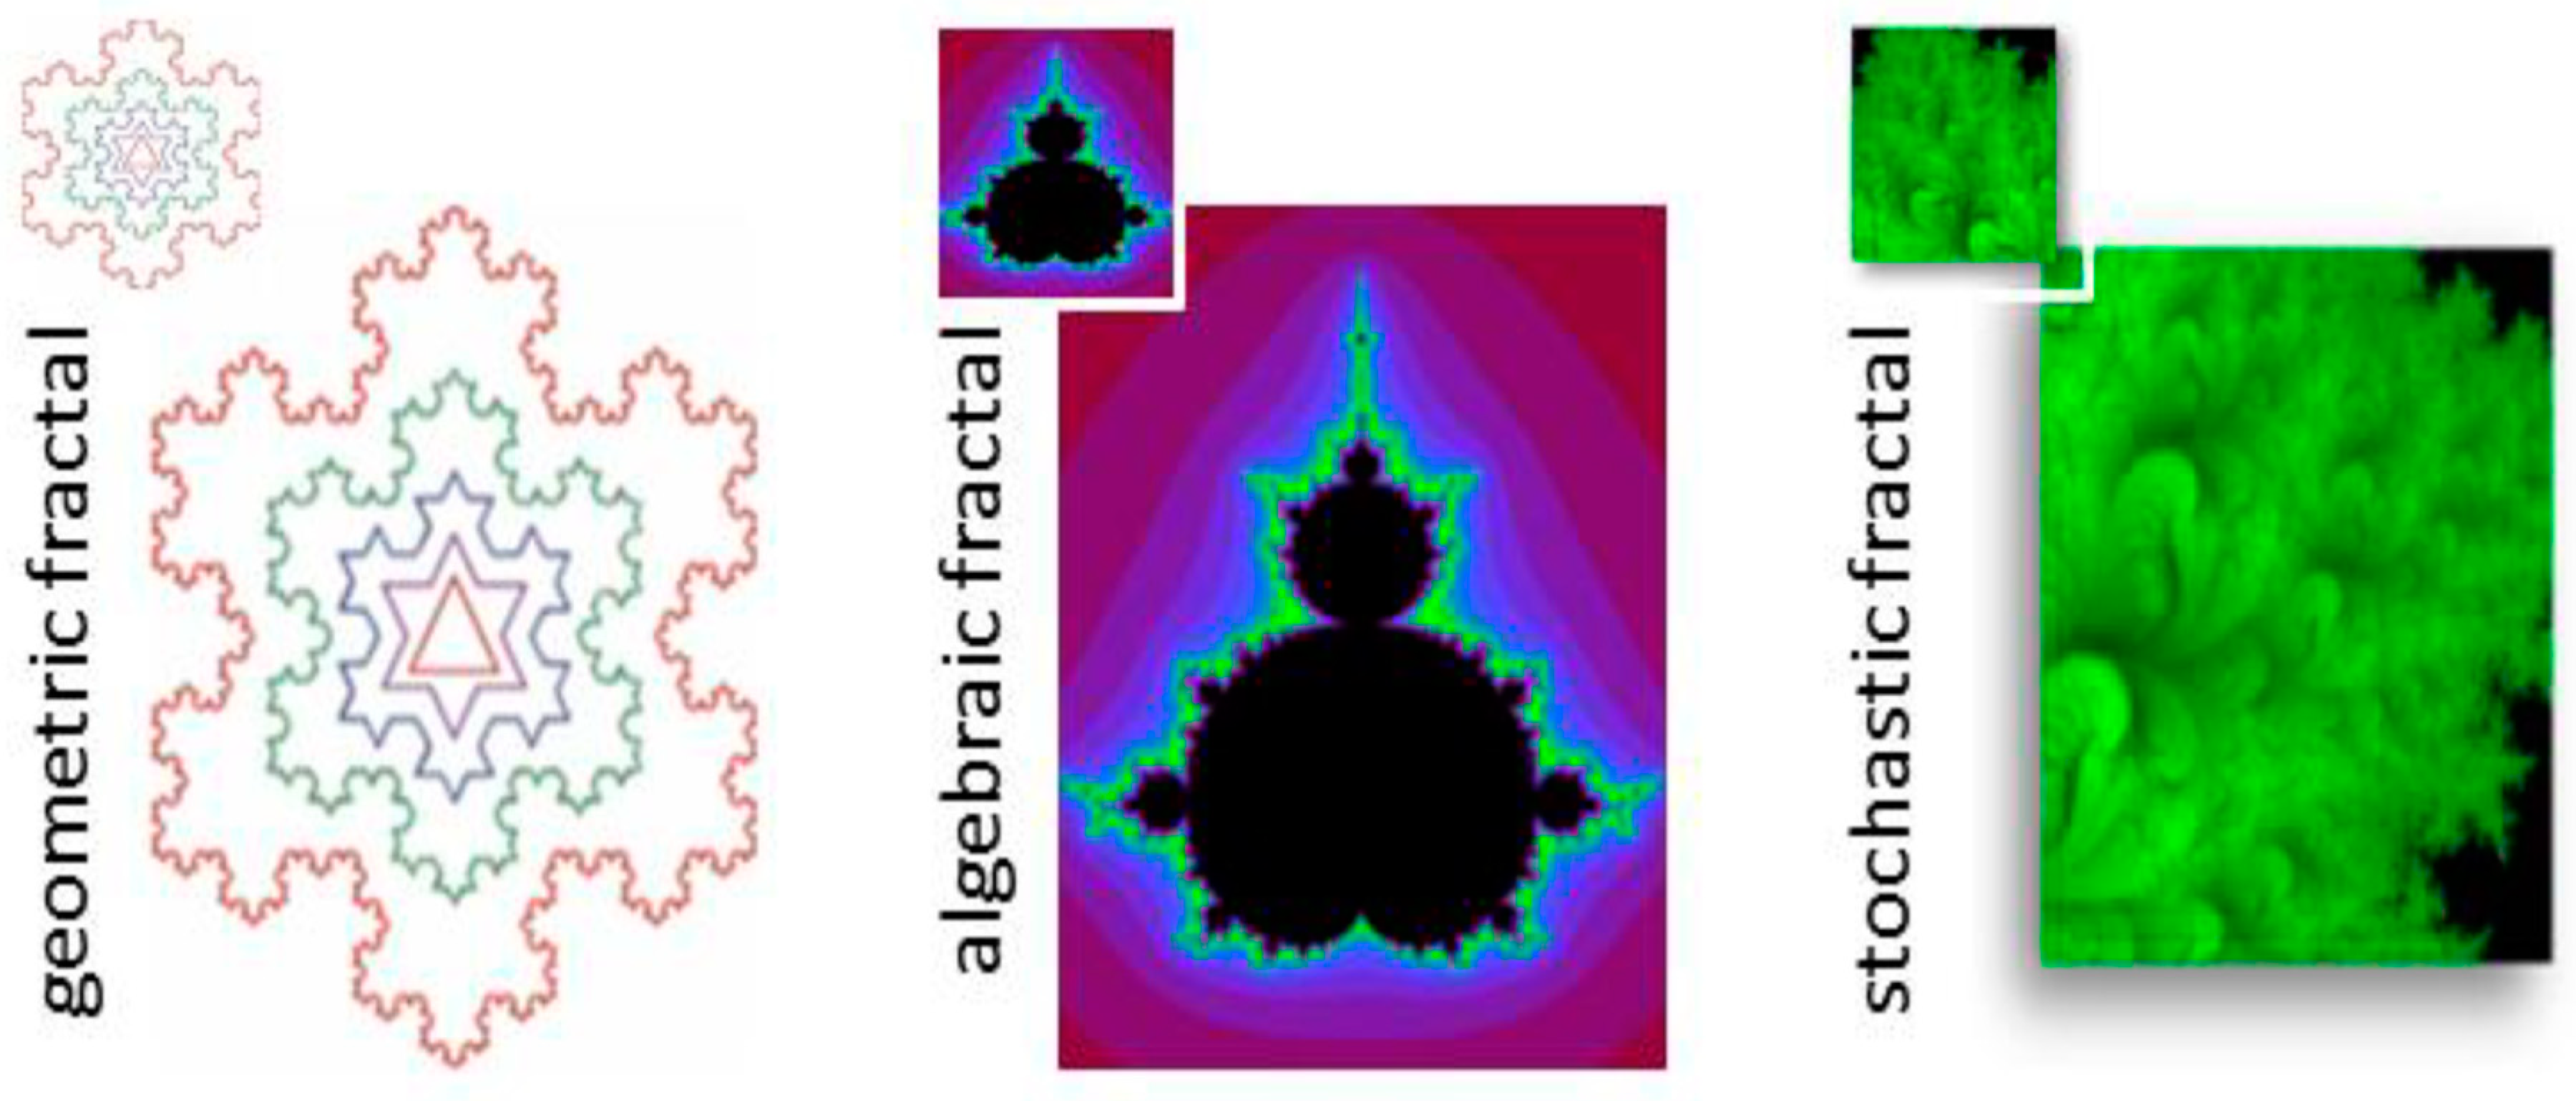
Figure 14.
Computer modelling of Snell's laws is an illustration of a branch fractal structure[20].
Figure 14.
Computer modelling of Snell's laws is an illustration of a branch fractal structure[20].
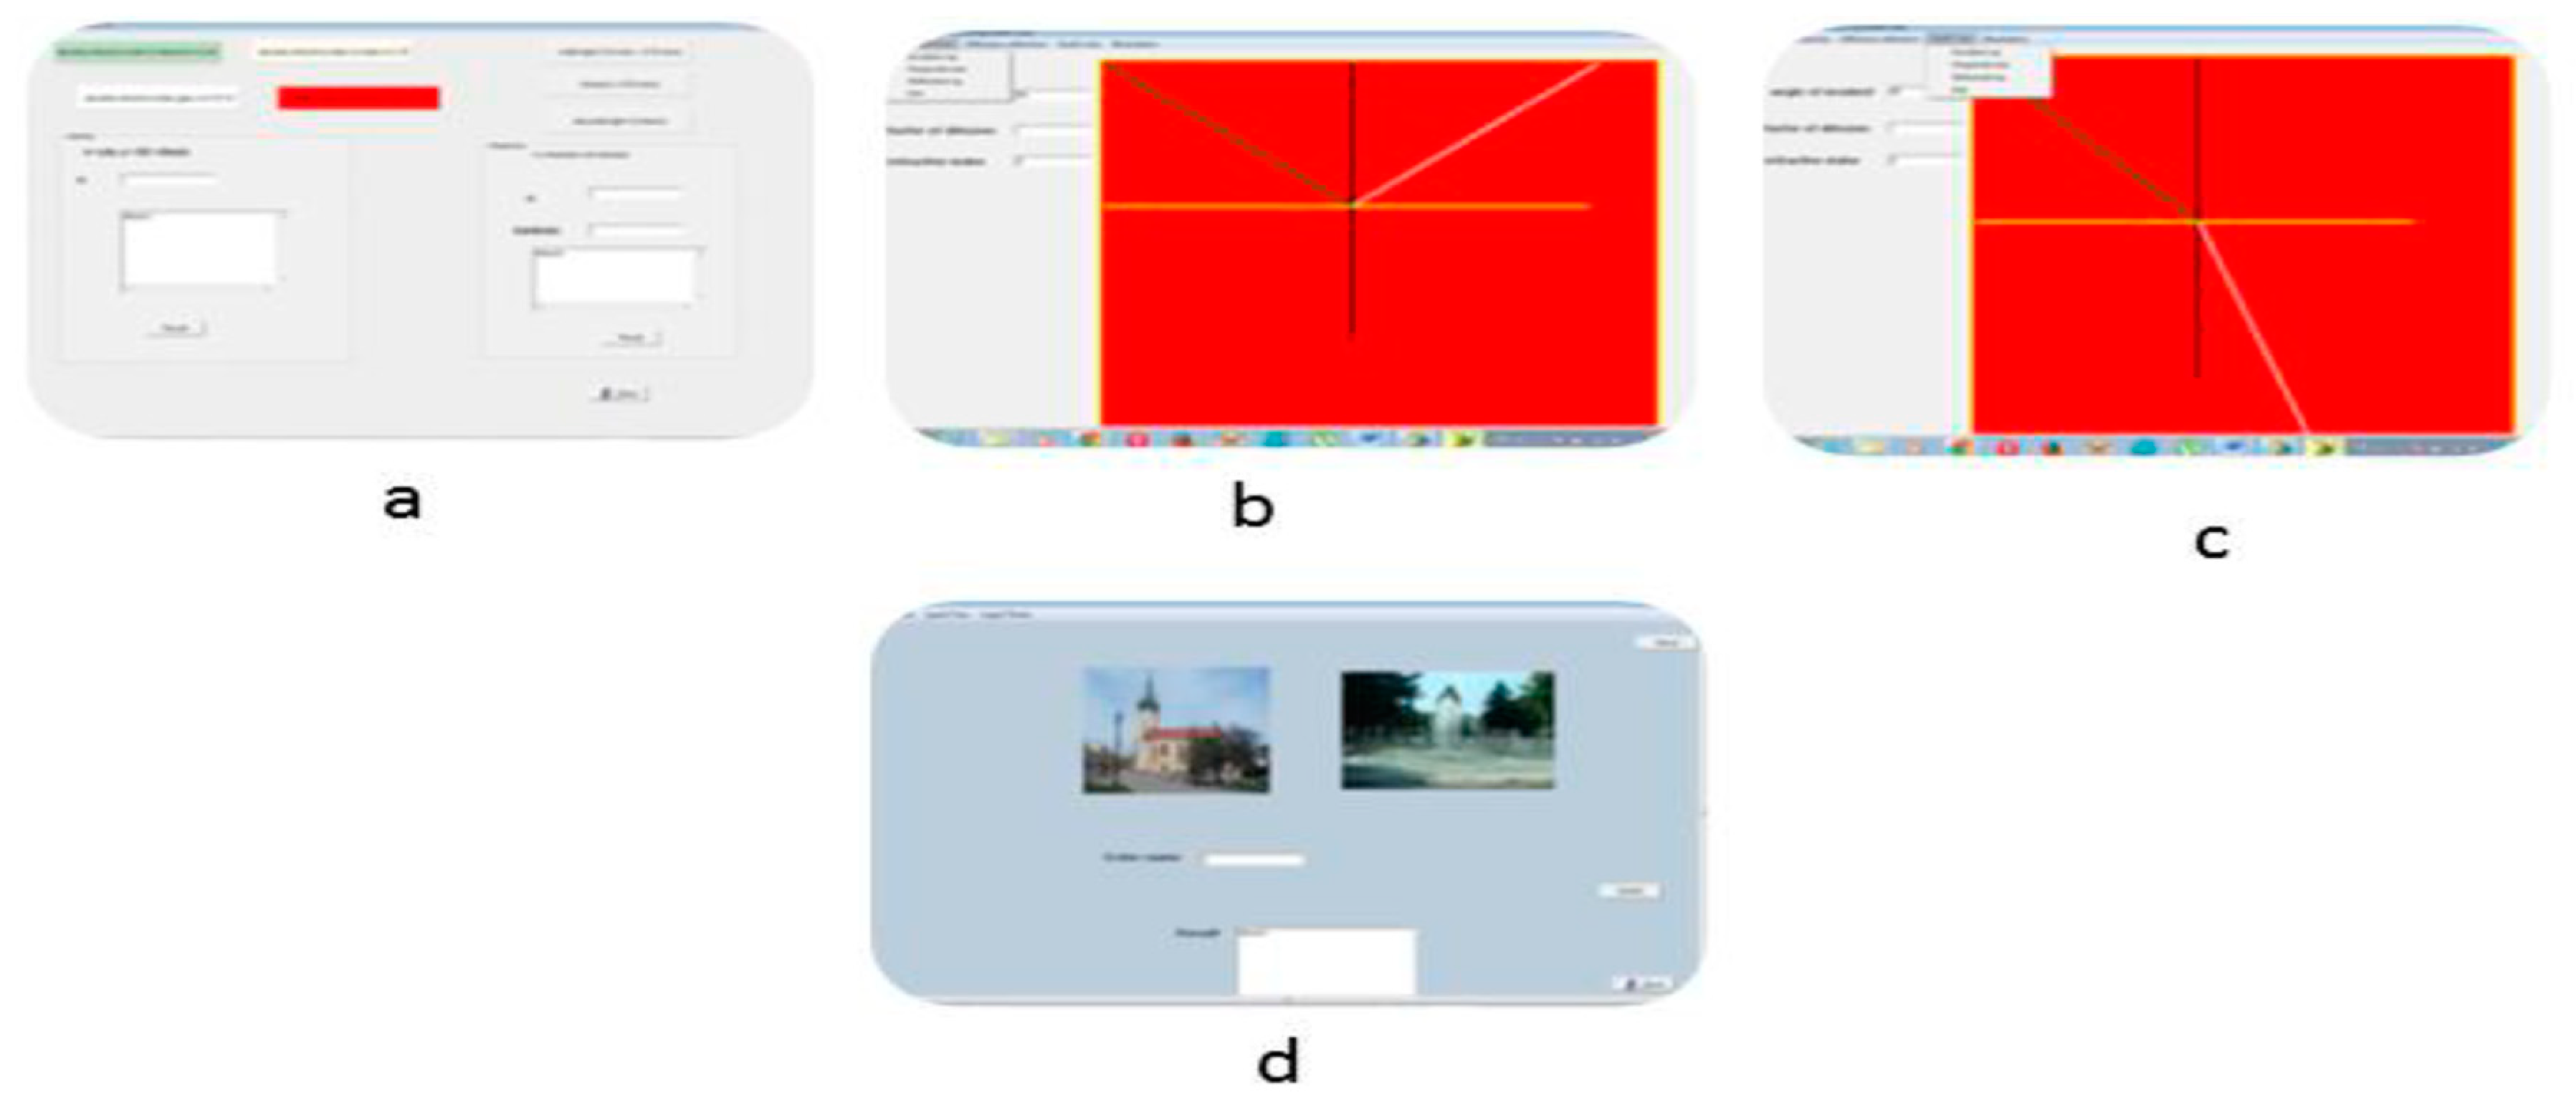
Figure 15.
The iteration process and visual interface for modelling optical parameters [20].
Figure 15.
The iteration process and visual interface for modelling optical parameters [20].
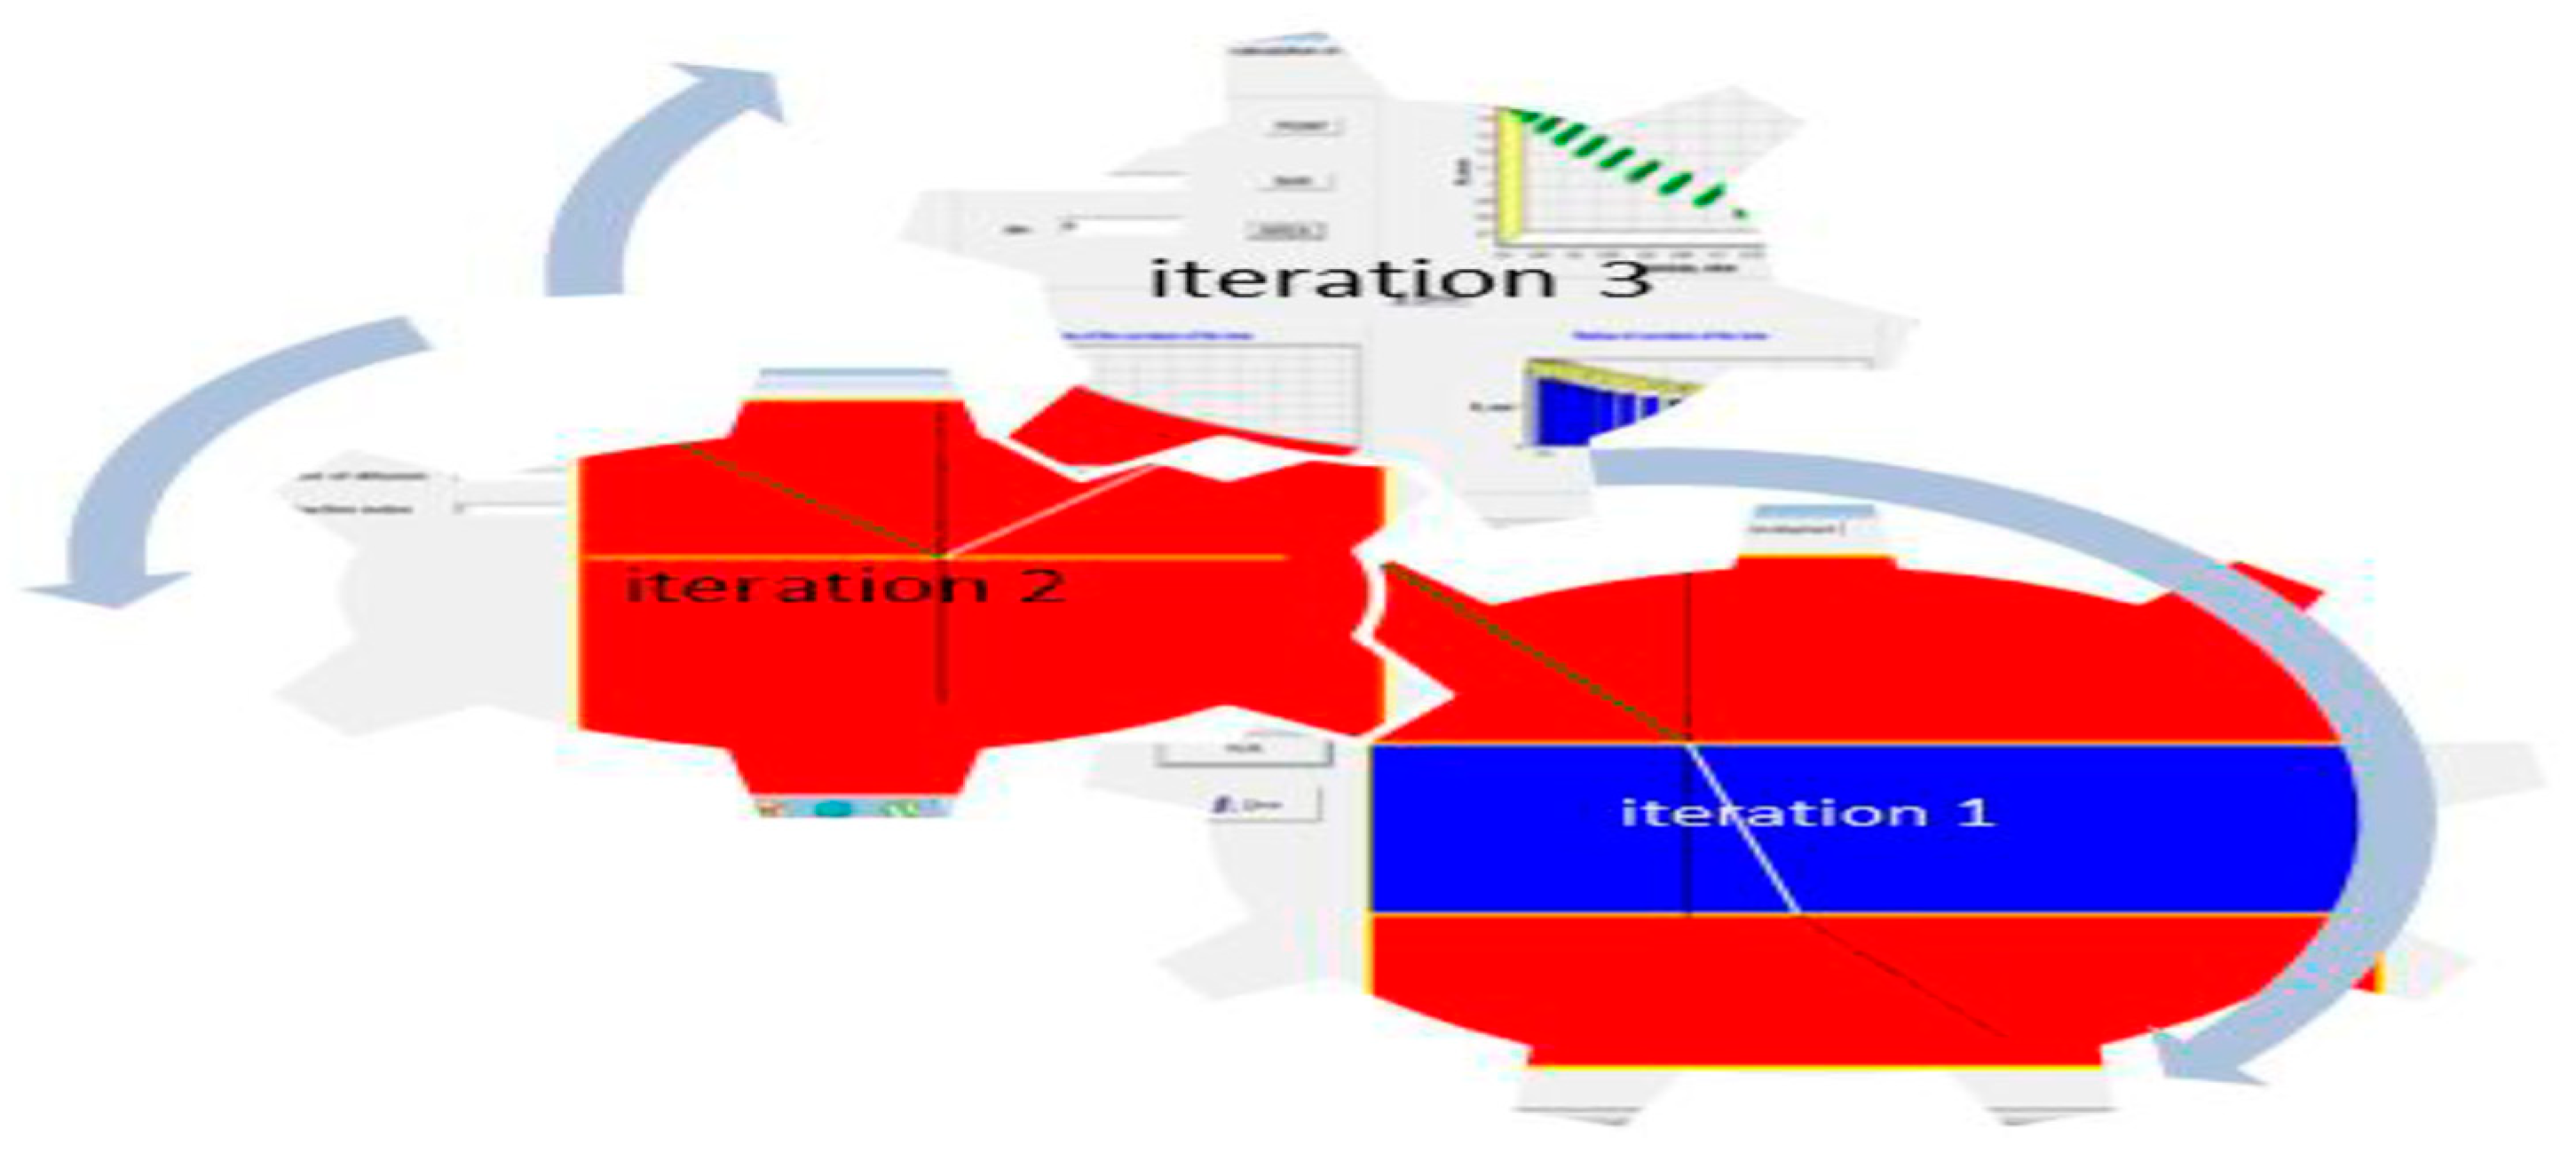
Figure 16.
The branch of a fractal structure: visual interface for modelling optical power and focal distance of a thick lens (a is numerical calculation of optical parameters, b–c represents modelling of optical parameters, and d is testing of information perception)[20].
Figure 16.
The branch of a fractal structure: visual interface for modelling optical power and focal distance of a thick lens (a is numerical calculation of optical parameters, b–c represents modelling of optical parameters, and d is testing of information perception)[20].
Disclaimer/Publisher’s Note: The statements, opinions and data contained in all publications are solely those of the individual author(s) and contributor(s) and not of MDPI and/or the editor(s). MDPI and/or the editor(s) disclaim responsibility for any injury to people or property resulting from any ideas, methods, instructions or products referred to in the content. |
© 2024 by the authors. Licensee MDPI, Basel, Switzerland. This article is an open access article distributed under the terms and conditions of the Creative Commons Attribution (CC BY) license (http://creativecommons.org/licenses/by/4.0/).
Copyright: This open access article is published under a Creative Commons CC BY 4.0 license, which permit the free download, distribution, and reuse, provided that the author and preprint are cited in any reuse.
MDPI Initiatives
Important Links
© 2024 MDPI (Basel, Switzerland) unless otherwise stated


