1. Introduction
The World Meteorological Organization of the United Nations reports that “[the] number of disasters has increased by a factor of five over the 50-year period, driven by climate change, more extreme weather and improved reporting” [
1]. Specifically, reports by organizations such as the United Nations Environment Programme highlight wildfire as the type of natural disaster with disproportionate growth in both intensity and frequency compared to others [
2]. This trend is perhaps best exemplified by the extraordinary wildfire seasons in the California between 2020 and 2022; the California Department of Forestry and Fire Protection (Cal Fire) lists 2020 as its largest fire season in recorded history, with individually record-breaking fires, such as the August Complex Fire, the first “gigafire” in California, that burned over one million acres [
3].
In responding to disasters in the United States, a key responsibility of a government agency like Federal Emergency Management Agency (FEMA) is to conduct preliminary damage assessment (PDA) so that federal funding could be unlocked and provided to disaster survivors. However, the increase in natural disasters like wildfires, along with other complicating factors such as the Covid-19 pandemic between 2020 and 2022, has introduced significant burden and process complexity to these disaster response organizations. In 2023, the author participated in a PDA process in Northern California with FEMA, Cal Fire and other government agencies, and witnessed some of the challenges firsthand. As a start, every home in an impacted area needed to be physically examined by a team of damage assessors, even when road and building structure damages have made access to some homes inaccessible; health concerns, such as maintaining appropriate distances or risks of infectious diseases, further introduce complications. The volume of the homes needed to be examined could also be overwhelming, especially if multiple disasters are happening at the same time.
Concurrent to the rise in natural disasters, artificial intelligence (AI) has experienced significant growth in recent years, such as in the field of computer vision. Computer vision, according to Stanford Computer Vision Lab, “[aspires] to develop intelligent algorithms that perform important visual perception tasks such as object recognition, scene categorization, integrative scene understanding, human motion recognition, material recognition, etc.” [
4]. In particular, with the development in deep learning, computer vision models like convolutional neural network (CNN)-based ResNet50 and VGG-16 can now perform tasks like image recognition, classification and others at an accuracy previously unimaginable [
5,
6]; another model that has captured attention is the one-shot Contrastive Language-Image Pre-Training (CLIP) model, which could take in an image and a list of categories to make a prediction without previously training the model [
7]. One advantage of recent computer vision models is its capability for Transfer Learning, where models trained on one task (e.g. classification of objects) could be re-trained to perform another similar task (e.g. classification of specific variations of the same object) with training data with the appropriate labels [
8,
9]. In 2021, Google Research published the Vision Transformer (ViT) model, based on an architecture different from CNN, that has outperformed CNN models by four times in efficiency and accuracy, thus making it the de-facto status quo for computer vision tasks [
10].
AI has been implemented in disaster response to aid survivors and responders alike. Examples include AI chatbots that connect survivors to humanitarian organizations for assistance [
11] and an open source software platform that classifies social media content to monitor the evolution of disasters [
12]. Specific to computer vision, both the research and practitioner communities have primarily focused on utilizing aerial imagery to aid with disaster response. Academic works have focused on topics such as using aerial imagery to detect disasters [
13], to develop a Disaster Impact Index [
14], to provide crisis management support [
15], and to conduct high-level damage assessment [
16]. International Conference on Computer Vision (ICCV) and Conference on Neural Information Processing Systems (NeurIPS), two of the leading computer vision academic conferences, have hosted The AI for Humanitarian Assistance and Disaster Response (AI4HADR,
https://www.hadr.ai) workshops for the past few years, where most of the accepted papers focus on aerial imagery. Similarly, online communities, such as the 2000+ member LinkedIn group called “Satellite Imagery for Deep Learning” (
https://www.linkedin.com/groups/12698393/), have also provided forums for discussions of disaster response-related applications.
Disaster response organizations, almost all of which are governmental, have focused on aerial imagery as the primary application of computer vision as well. The Department of Defense, via its Defense Innovation Unit, has put together an intergovernmental platform called xView2 that automatically runs computer vision algorithms on satellite imagery to track disaster progress over time. According to FEMA’s former Chief Geospaital Officer Christopher Vaughan, in addition to utilizing xView2 as a monitoring tool, FEMA has attempted to use aerial imagery in PDA as well. However, the computer vision model built on aerial imagery could only help the organization prioritize where to safely send the in-person damage assessors, rather than to conduct the damage assessment itself. Furthermore, despite the aid from the model, the PDA process still remains almost completely manual.
Using aerial imagery in disaster response, and specifically for damage assessment, has various limitations. The ground structures of interest may be obscured by clouds, smoke or other obstructions, particularly in a wildfire. Additionally, aerial imagery may be updated at inconsistent and unreliable rates depending on various factors such as the region of interest; processing aerial imagery may also introduce additional computational and storage overhead. Most importantly, aerial imagery often does not provide the resolution at the level of individual structure in order to more accurately quantify the scale of disaster damages. In our discussions, Mr. Vaughan from FEMA expressed a desire to do more with computer vision technologies beyond satellite imagery, especially in the context of performing damage assessment.
As such, there is an opportunity to better understand how non-satellite imagery data could be utilized in the context of disaster response, particularly for damage assessment. Recent work has explored using ground-level imagery for damage assessment. Nia and Mori demonstrate that a CNN-based model, trained on a small set of manually curated data, can yield a high accuracy in classifying building damages into different categories [
17]. The model proposed by Nguyen et al. proposes a multimodal approach in taking textual input, along with image data, to predict the damage level in a particular area [
18]. Various other research papers have built models to demonstrate the promise of using computer vision algorithms on ground-level imagery to classify damage severity [
19,
20]. At the time of this writing, most of the papers we have come across have built their models using CNN or other more traditional approaches to the image classification task, instead of some of the newer models such as ViT.
As reliable and properly labeled training data has been identified as a limitation by several of the aforementioned studies, different approaches were taken to ensure sufficient data is available for model training. In some cases, volunteers and paid crowdsourced workers were used to label data found on social media and search engines [
20]; researchers have also opted to label the data found on the Internet themselves [
17]. Others have used Google Street View as the image source with additional manual labeling [
19]. Furthermore, in some cases, damage classification models are built from, as well as used for, image data from different disaster types, despite the fact that damage from one type of disaster (e.g. wildfire) may look drastically different from another (e.g. flooding) [
18]. Manual labeling may also limit the scale of the data; for example, the model in one paper was trained on only 200 labeled images [
17]. In addition to scale, the main challenge with this approach is the potential lack of consistency in category definitions, where crowdsourced workers may not have the sufficient context in distinguishing between different types of damages, as well as the potentially disparate manifestations of damages between disaster types.
The approach in our paper addresses the limitations in the existing literature on using ground-level imagery for damage assessment in several ways. First, our research uses a self-curated large-scale (18,000+) image dataset with damage classification labeled by professional damage assessors from past PDAs; the dataset is also only limited to wildfire since damages from different disaster types are rarely considered together in a PDA. The image dataset also focuses on residential structures, the main damage type that governmental organizations use in determining an emergency declaration. Second, the base model for our classifier is the latest ViT model, which has shown to outperform CNN and other types of computer vision models; the model we built has accuracy exceeding 95%. Lastly, the authors’ affiliation to FEMA allowed for access to disaster response officials, from whom feedback and comments were collected. Thus, our paper contributes to the literature in three different ways: 1) curating and open-sourcing the largest and more comprehensive fire damage classification dataset of its kind that is labeled by professional damage assessors, 2) building a model on a latest state-of-the-art computer vision algorithm, 3) providing insights and feedback from actual disaster response practitioners who would be the users of tools built on top of such algorithm.
3. Results
3.1. Classifier Performance Evaluation
Once we have chosen ViT-B-16, we proceeded to train the model using 80% of the overall dataset (15,222 images) with 20% (3738) being used as the evaluation dataset. We trained the model through both one epoch and four epochs and yielded the following results:
Table 2.
Training Loss, Evaluation Loss and Accuracy between 1-Epoch and 4-Epoch Training.
Table 2.
Training Loss, Evaluation Loss and Accuracy between 1-Epoch and 4-Epoch Training.
| Training Epochs |
Training Loss |
Evaluation Loss |
Accuracy |
| 1 |
0.23 |
0.16 |
0.94 |
| 4 |
0.17 |
0.26 |
0.93 |
Table 2 shows that, while training on 4 epochs decreased the Training Loss, it has led to increased Evaluation Loss and decreased Accuracy. This could be because the dataset is sufficiently large, and that training on 4 epochs has simply led to overfitting. As such, we decided to proceed to train with the data on just one epoch, yielding the following the results:
Table 3.
Confusion Matrix of the ViT-B-16 model on 1 Epoch.
Table 3.
Confusion Matrix of the ViT-B-16 model on 1 Epoch.
| |
Affected
(Predicted) |
Destroyed (Predicted) |
No Damage (Predicted) |
Affected
(Groundtruth)
|
193 |
11 |
126 |
Destroyed
(Groundtruth)
|
7 |
1860 |
10 |
| No Damage (Groundtruth) |
14 |
3 |
1514 |
The Confusion Matrix preliminary indicates that images that are “Affected” have the most misclassification, particularly as “No Damage.” This is consistent with the previous analysis of the relatively low Cosine Similarity of the “Affected” and “No Damage” groups, and the relatively high Cosine Similarity across the whole dataset. The overall Accuracy calculated is 3567/3738=95.43%.
Table 4 and
Table 5 provide further break-downs.
The model built has produced 0.99 Precision, Recall and F1-Score for the “Destroyed” group and similarly high score for the “No Damage” group. However, the model performs significantly worse on the “Affected” group, particularly with its Recall and F1-Score. One reason for such low statistics is the low Cosine Similarity Score that has already been noted. However, another reason that could be attributed to the poorer performance is the relatively lower representation of the group in both the training and test datasets, as the support (number of samples, of 330) is significantly lower than the other groups. However, in aggregate, the model has high Precision, Recall and F1-Score.
2.2. Evaluation Loss Investigation
While the overall Precision, Recall and Accuracy values are quite high, there are opportunities to further examine the per-category misclassifications in the test set. The distribution of the 171 misclassified results is as follows:
“Affected” misclassified as “Destroyed”: 11 (6.43% of all misclassifications)
“Affected” misclassified as “No Damage”: 126 (73.68% of all misclassifications)
“Destroyed” misclassified as “Affected”: 7 (4.09% of all misclassifications)
“Destroyed” misclassified as “No Damage”: 10 (5.85% of all misclassifications)
“No Damage” misclassified as “Affected”: 14 (8.18% of all misclassifications)
“No Damage” misclassified as “Destroyed”: 3 (1.75% of all misclassifications)
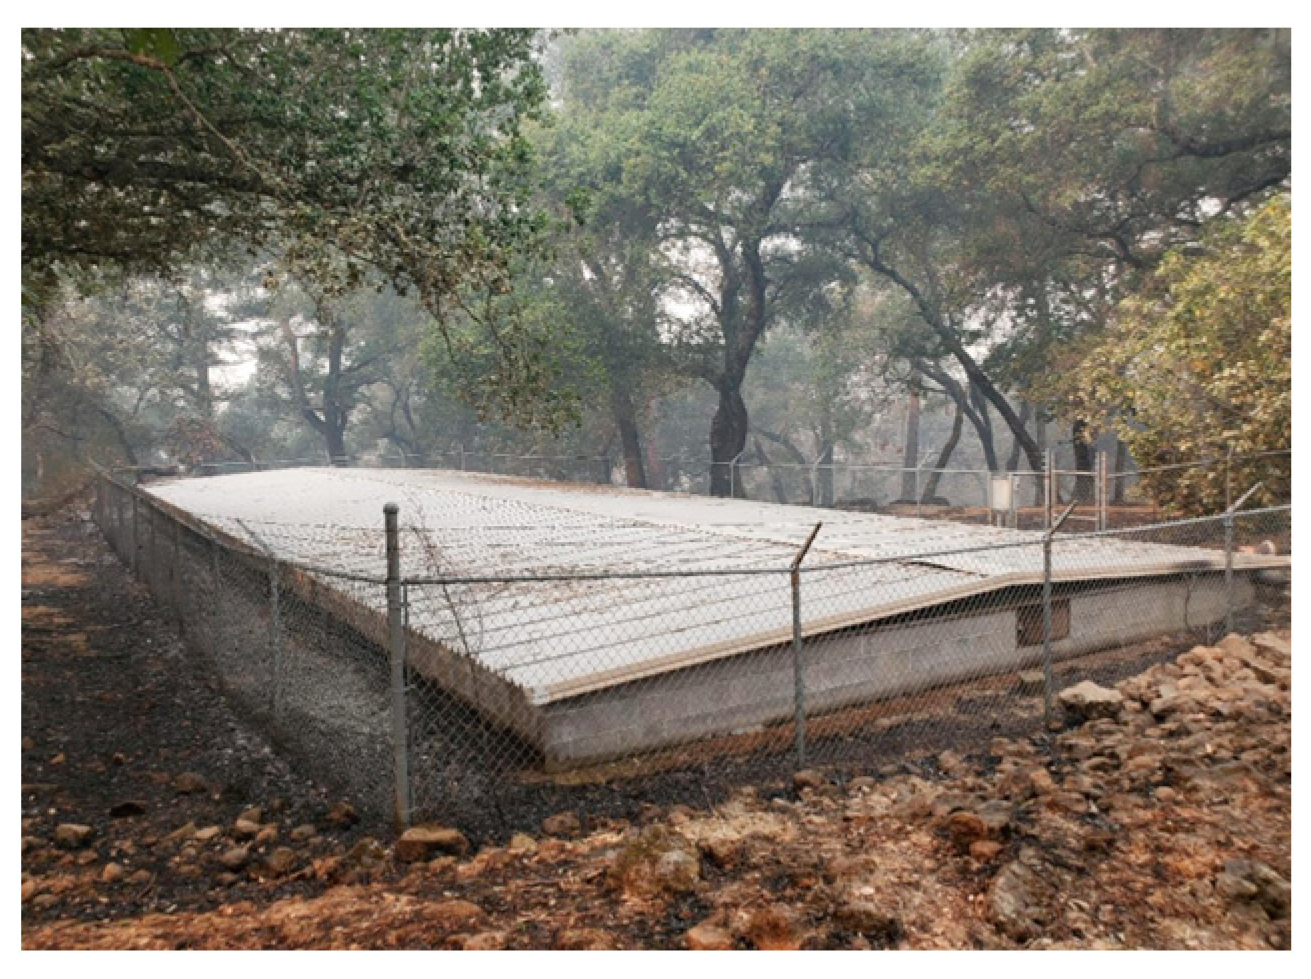
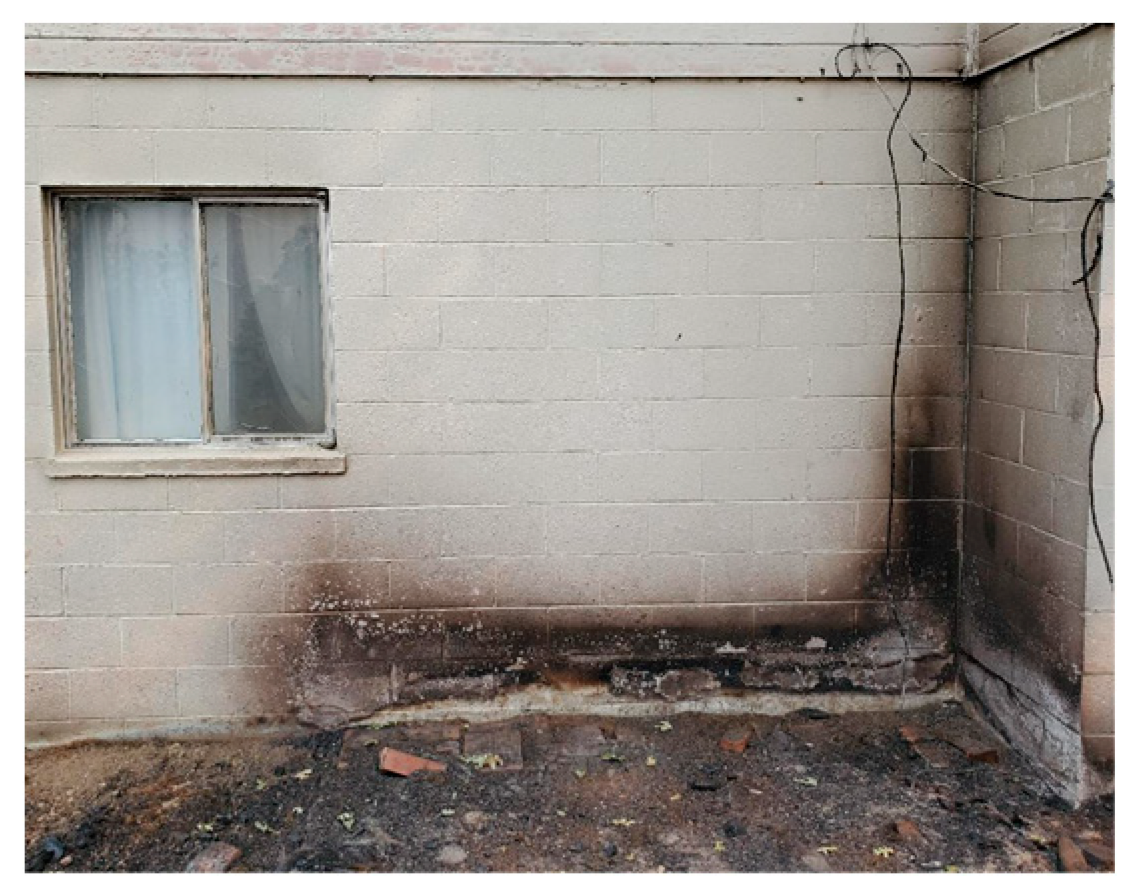
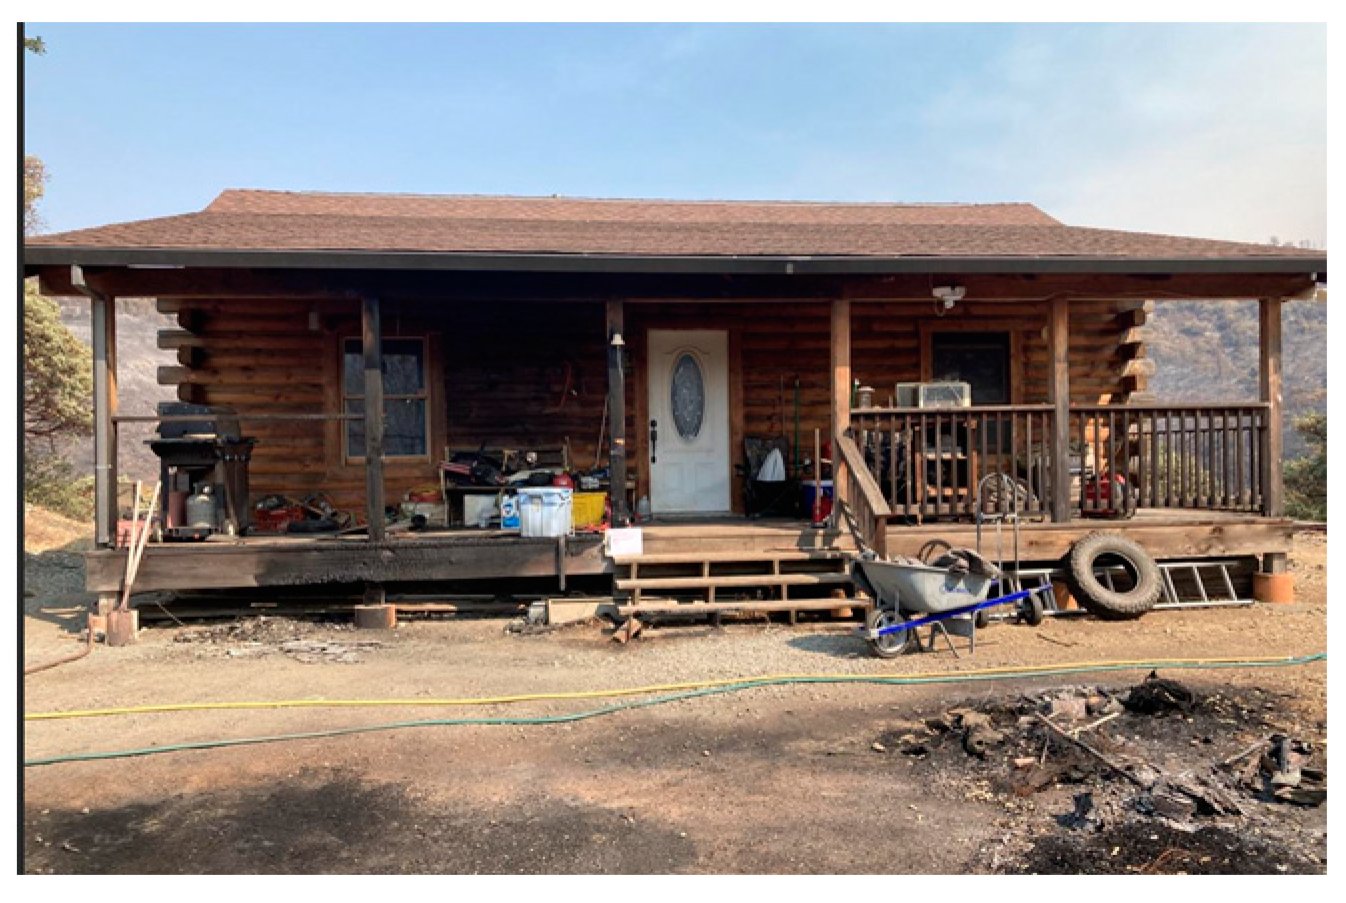
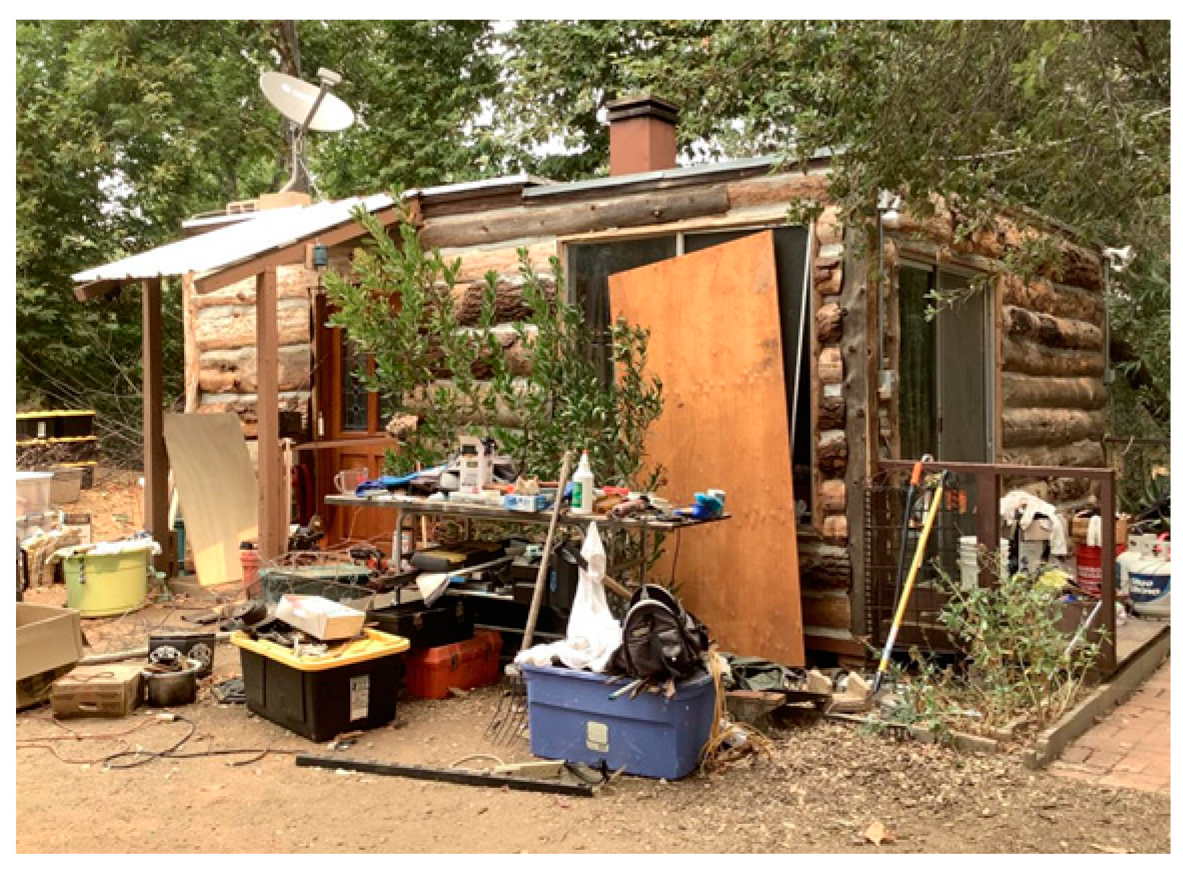
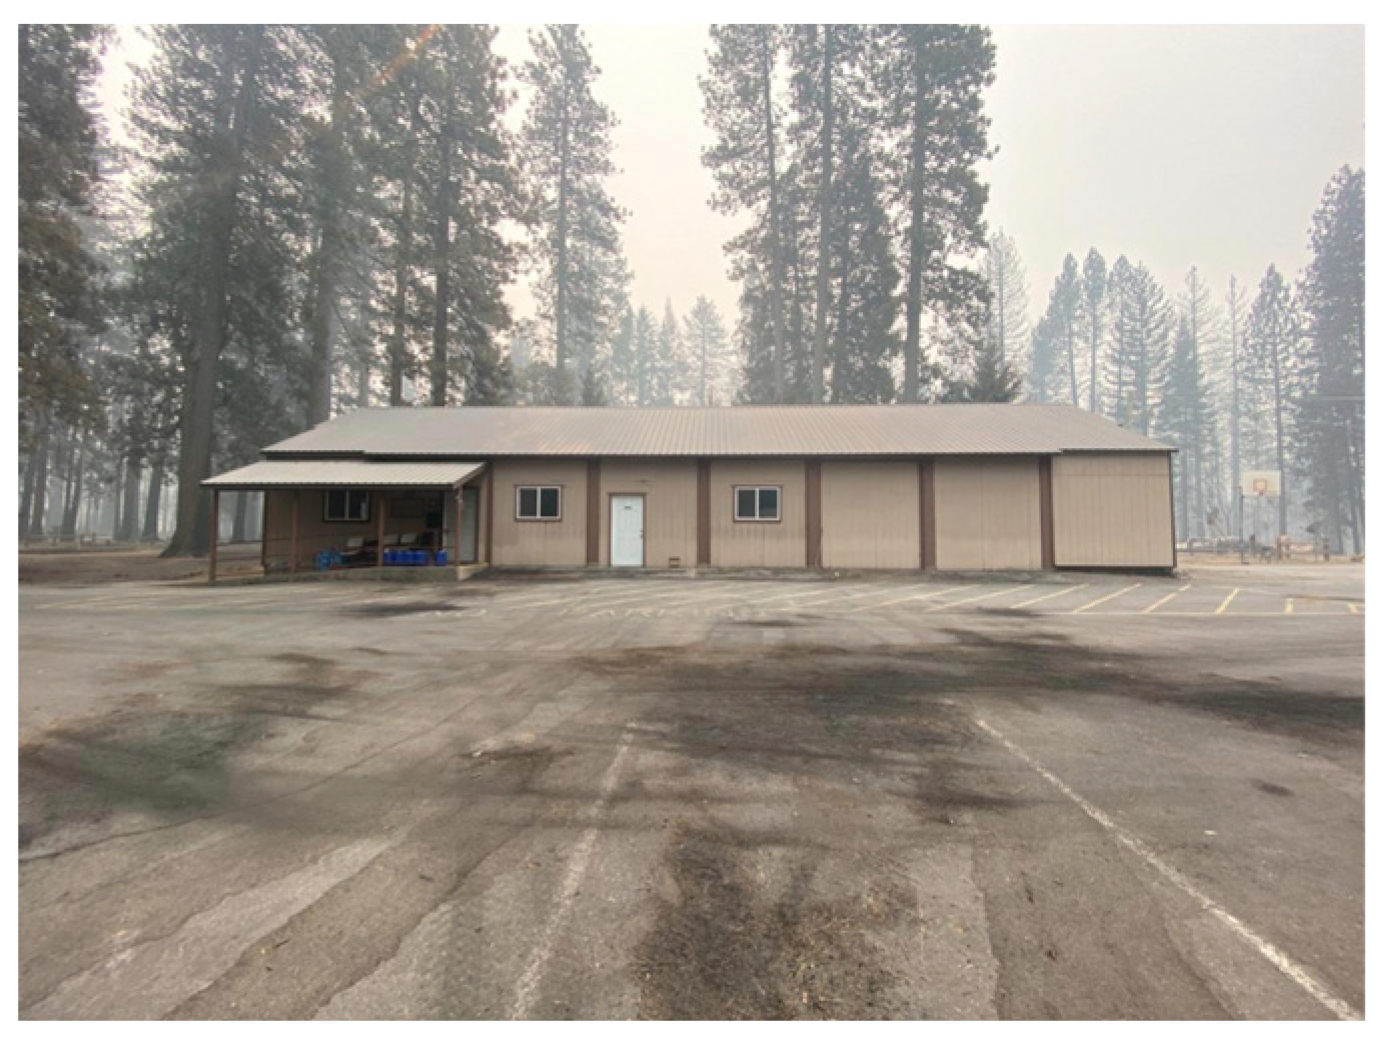
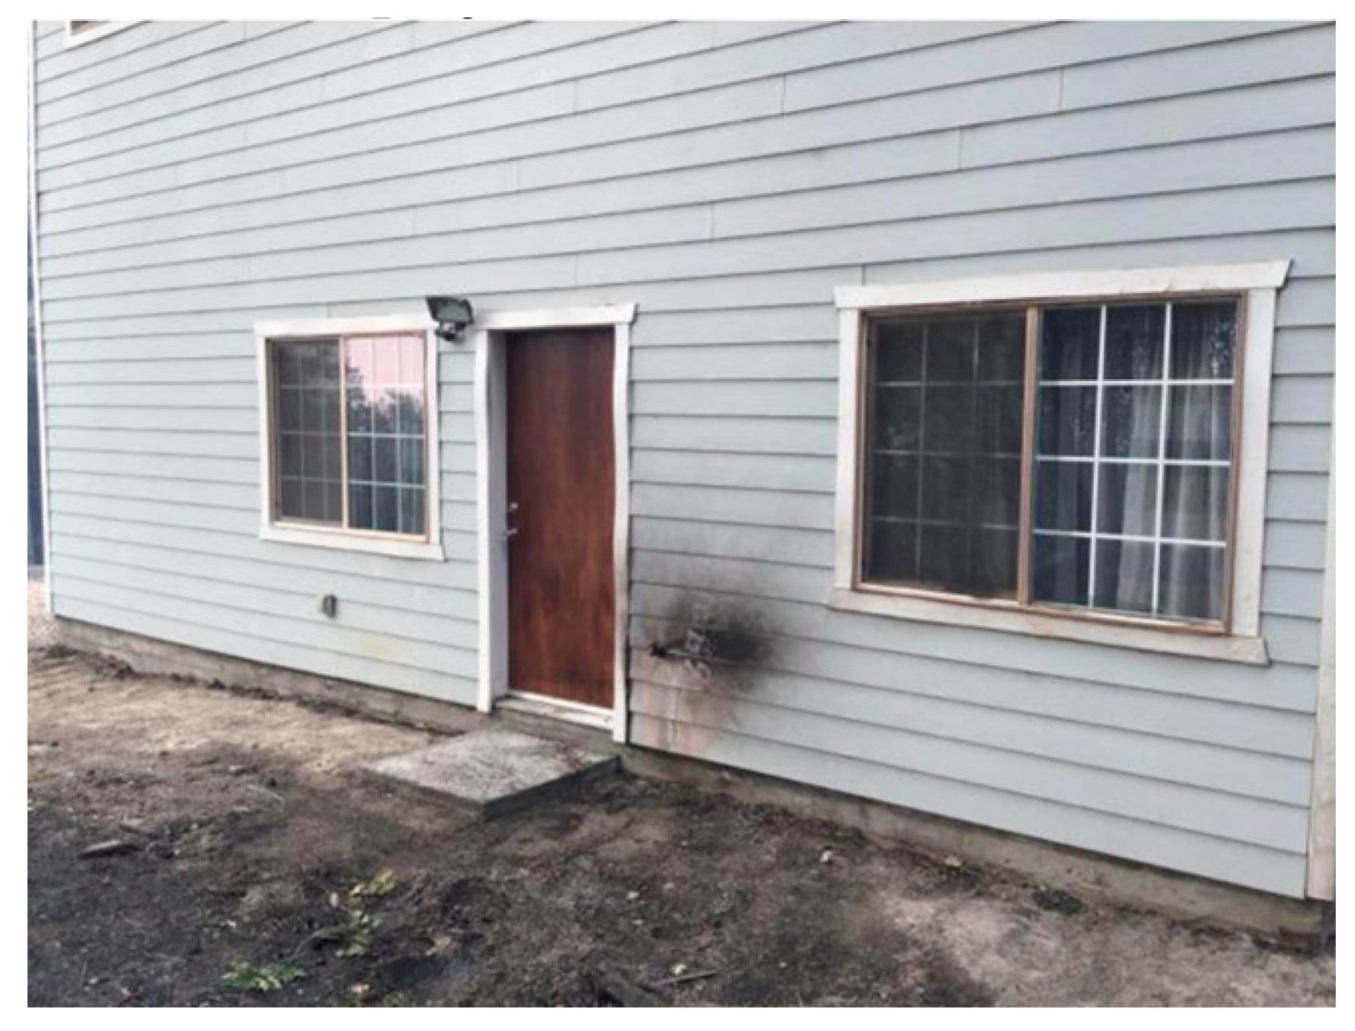
We went through all 171 misclassification cases to investigate the characteristics of images that the classifier failed on, and realized the misclassifications more often than not highlight issues with the dataset, rather than the algorithm itself. Some images contain fundamental issues and should actually be excluded from the evaluation, such as images of non-residential structures (e.g.
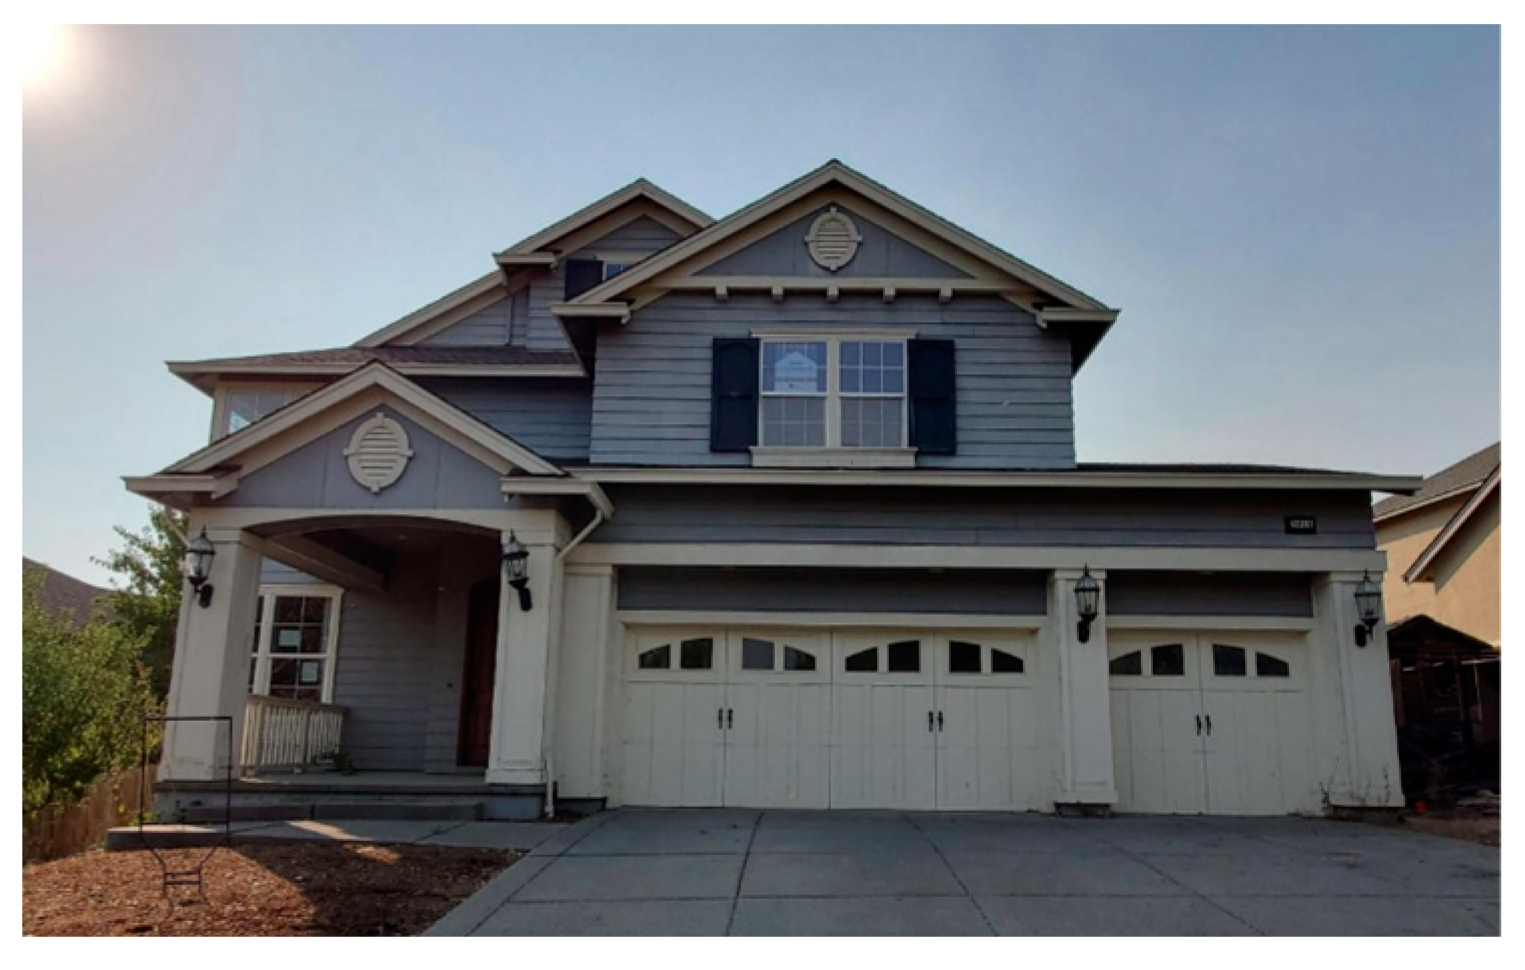
Figure 7, for which the ground truth label is “Affected” and the classifier classified it as “No Damage”) and residential structures for which the damages are not captured by the image (e.g. Figure 8, for which the ground truth label is “Affected” and the classifier classified it as “No Damage” but no damage could be observed upon our inspection).
Figure 7.
Non-Residential Structure.
Figure 7.
Non-Residential Structure.
Figure 8.
Damage is not Visible.
Figure 8.
Damage is not Visible.
As such, these “Unusable” images are removed and the metrics are recalculated:
“Affected” misclassified as “Destroyed”: 4 (-7 from 11)
“Affected” misclassified as “No Damage”: 85 (-41 from 126)
“Destroyed” misclassified as “Affected”: 3 (-4 from 7)
“Destroyed” misclassified as “No Damage”: 6 (-4 from 10)
“No Damage” misclassified as “Affected”: 8 (-6 from 14)
“No Damage” misclassified as “Destroyed”: 1 (-2 from 3)
Overall Accuracy: 97.09% (+1.66% from 95.43%)
Table 6.
Precision and Recall by Damage Severity Category without “Unusable” Images.
Table 6.
Precision and Recall by Damage Severity Category without “Unusable” Images.
| Severity Category |
Precision |
Recall |
| Affected |
0.95 (+0.05) |
0.68 (+0.10) |
| Destroyed |
0.99 (+0.00) |
0.99 (+0.00) |
| No Damage |
0.94 (+0.02) |
0.99 (+0.00) |
There are other images that could potentially be excluded since the classification is actually also quite ambiguous upon our examination. For example,
Figure 9 and
Figure 10, for both the actual label is “No Damage”, demonstrate the lack of clarity on whether the source of the damage is actually the wildfire event (hence mislabeled) or otherwise.
If those ambiguous images were also to be removed, then metrics such as the overall Accuracy Rate and the by-category Recall Rates would further improve significantly.
2.3. Comparison with Other Models
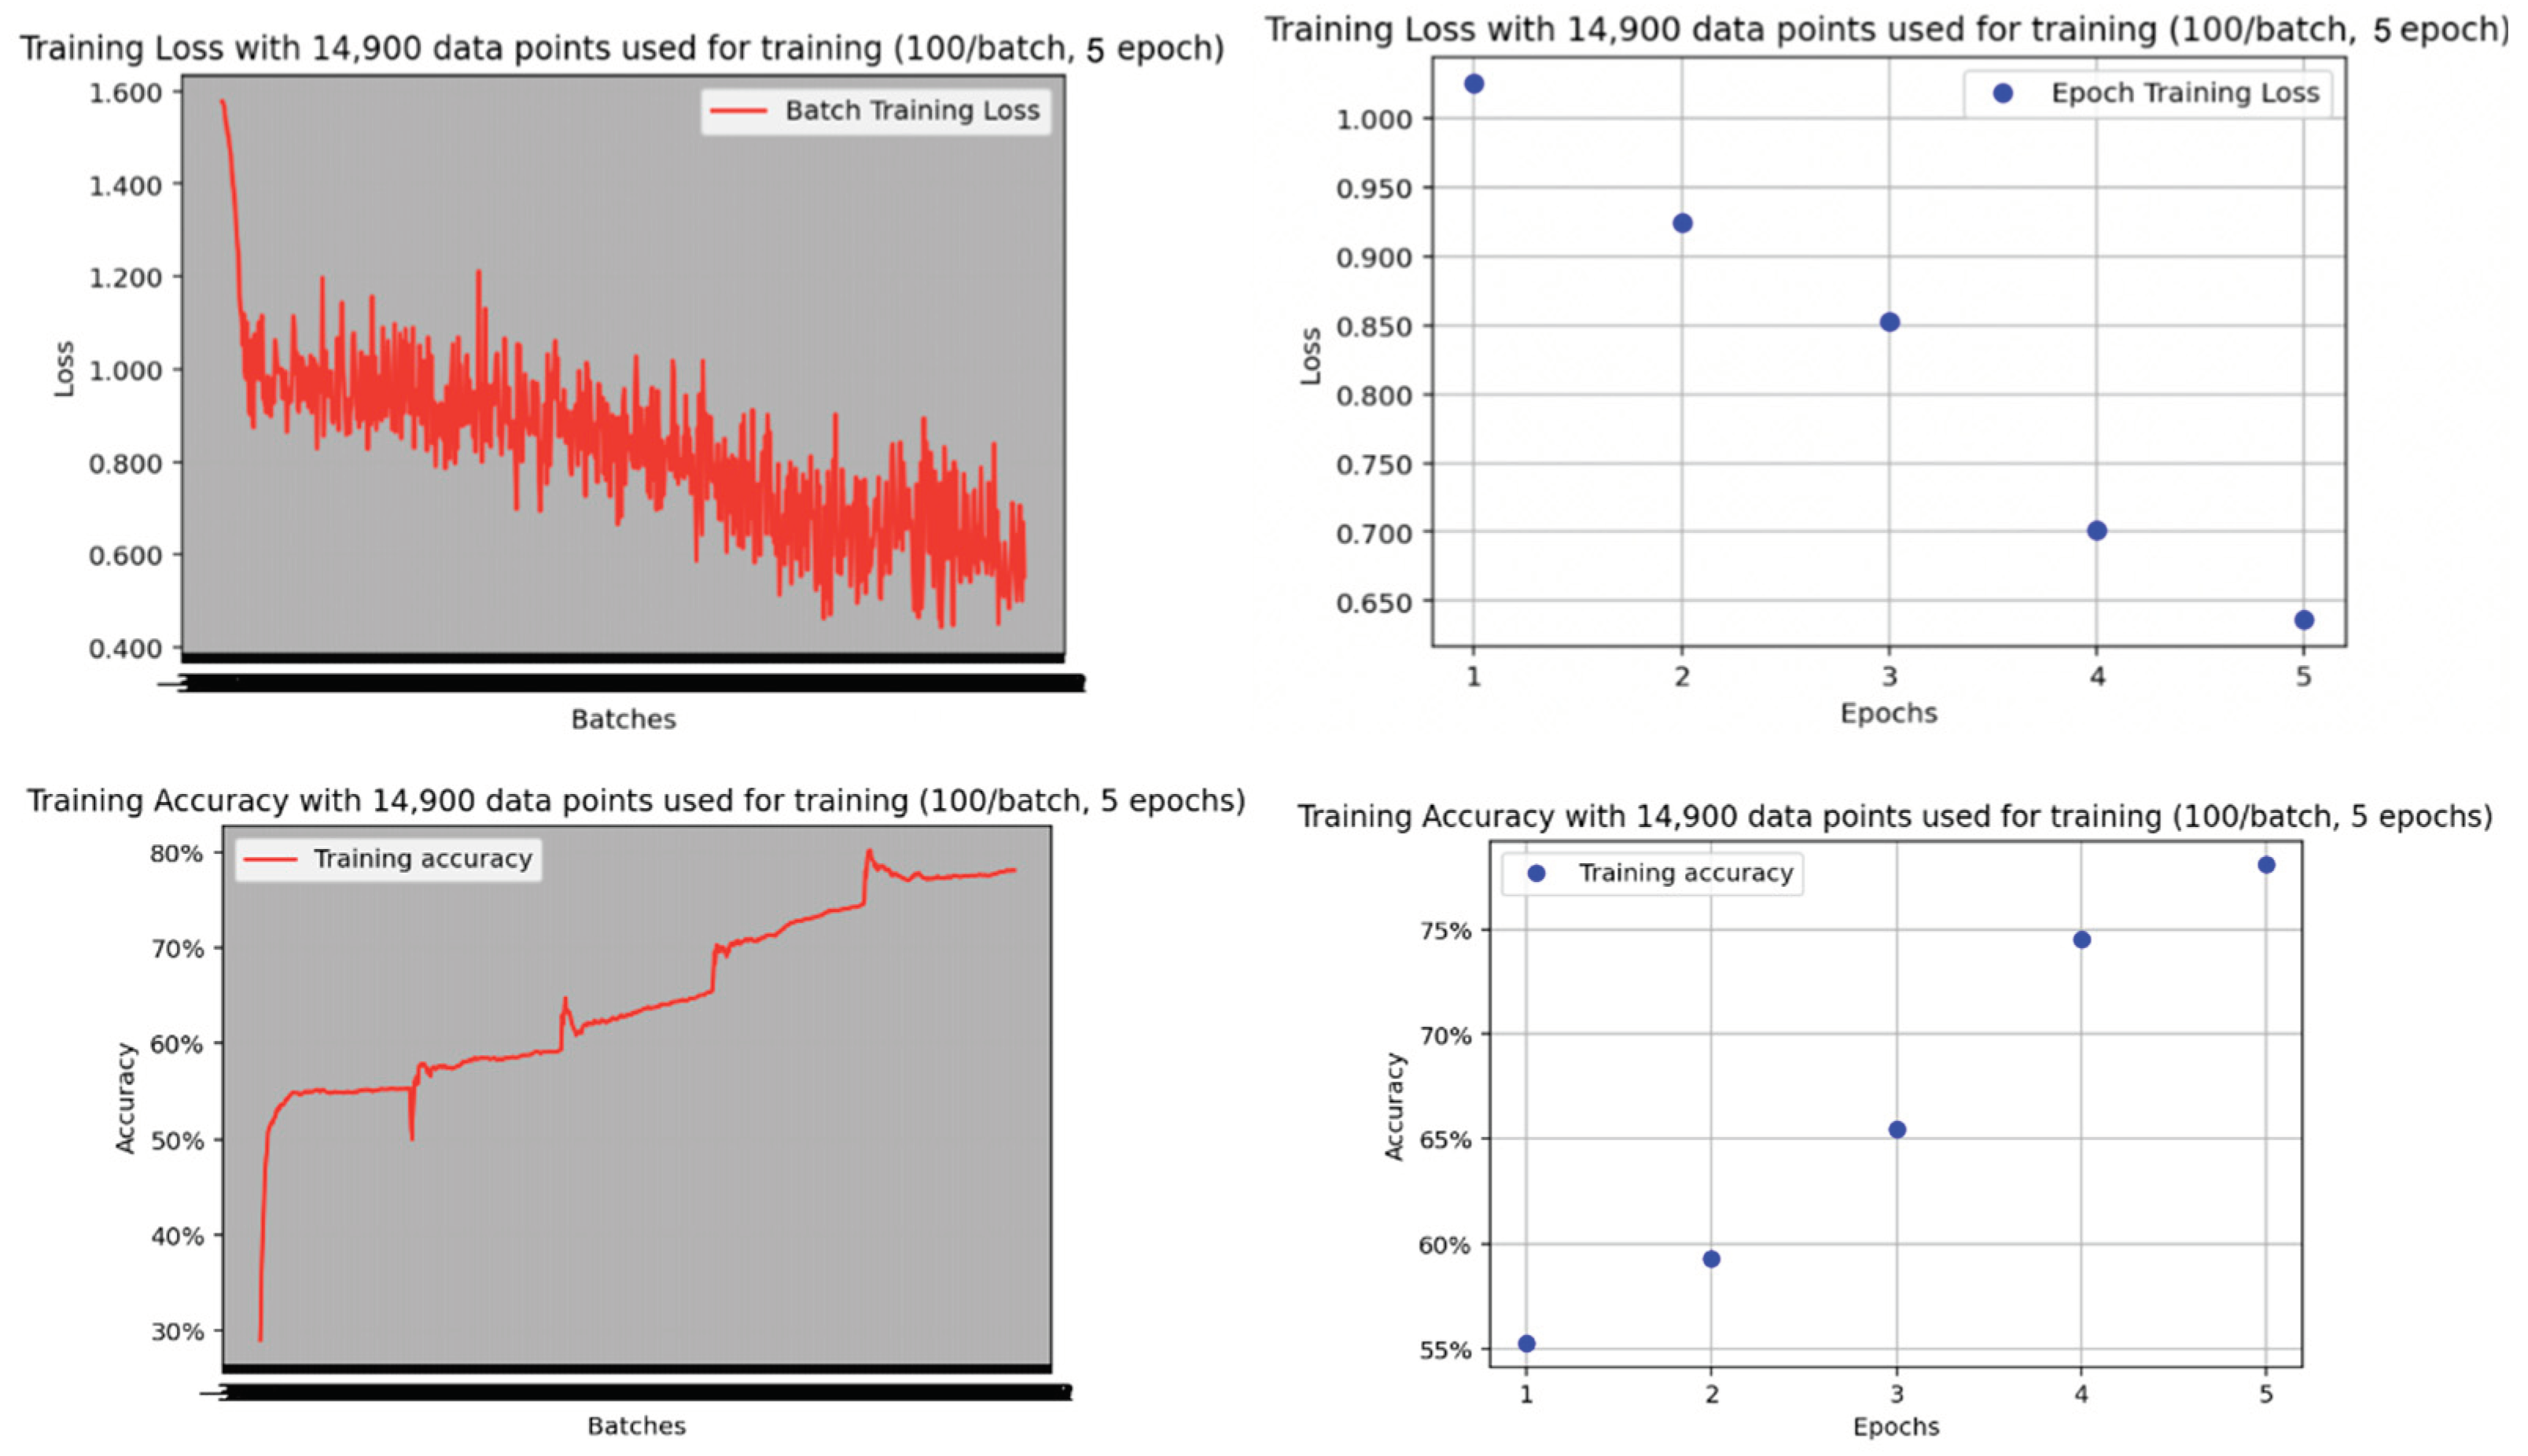
To illustrate the effectiveness of the ViT model against other existing models, we trained a CNN-based model and used the one-shot CLIP model on the same dataset and calculated metrics such as accuracy. For the CNN-based model, we initialized a naive CNN and trained the model over five epochs on the training data split, then evaluated against the test dataset, yielding the following results:
Figure 10.
Training Loss and Accuracy over Five Epochs for Naive CNN Model.
Figure 10.
Training Loss and Accuracy over Five Epochs for Naive CNN Model.
Table 7.
Precision By Damage Severity Against, Compared Against ViT Model.
Table 7.
Precision By Damage Severity Against, Compared Against ViT Model.
| Severity Category |
Precision |
Against ViT |
| Affected |
0.28 |
-0.62 (against 0.90) |
| Destroyed |
0.87 |
-0.12 (against 0.99) |
| No Damage |
0.84 |
-0.08 (against 0.92) |
The overall Accuracy is 0.78, which is -0.17 (against 0.95). This demonstrates ViT’s significantly better performance, against a naively trained CNN model.
To compare against the CLIP model, we ran all the images of the test set with the three options: "a photo of a damaged home", "a photo of a destroyed home", "a photo of a home with no damage.” The model yielded the following results:
Table 8.
Confusion Matrix of the CLIP model.
Table 8.
Confusion Matrix of the CLIP model.
| |
Affected
(Predicted) |
Destroyed (Predicted) |
No Damage (Predicted) |
Affected
(Groundtruth)
|
13 |
4 |
313 |
Destroyed
(Groundtruth)
|
52 |
1329 |
496 |
| No Damage (Groundtruth) |
29 |
13 |
1489 |
Table 9.
Precision and Recall by Damage Severity Category of CLIP model.
Table 9.
Precision and Recall by Damage Severity Category of CLIP model.
| Severity Category |
Precision
TP/(TP+FP) |
Precision Against ViT |
Recall
TP/(TP+FN) |
Recall Against ViT |
| Affected |
0.14 |
-0.76 (against 0.90) |
0.04 |
-0.54 (against 0.58) |
| Destroyed |
0.99 |
-0.00 (against 0.99) |
0.93 |
-0.06 (against 0.99) |
| No Damage |
0.65 |
-0.27 (against 0.92) |
0.97 |
-0.02 (against 0.99) |
The overall Accuracy is 0.76, which is -0.19 (against 0.95). Like the CNN classifier, the CLIP model performed worse than ViT overall but was especially bad in the “Affected” category. Part of it could be due to the imprecise wording of the option for the model (“a photo of a damaged home”). However, the model has a very high Precision and Recall for “Destroyed” and “No Damage,” especially given the fact that it was not trained on any data prior. The ViT model still performed much better than the CLIP model at the end.
2.3. Application Demonstration and Feedback
Many enhancements for the application are in the works to provide better experience and utilization for the users, based on feedback we’ve already received. Some of the application enhancements under development include:
The ability to submit multiple images for a single structure and get a weighted result of classification based on the multiple submissions.
The ability to submit images for multiple structures and receive the results in bulk.
The ability to export the results as a CSV file for further analysis.
The ability to export the results as a GIS layer to be integrated with a GIS map.
The ability to integrate with another application interface to allow for human reviewers to provide Quality Assurance, and then subsequently improving the model.
More focus groups with end users in the disaster management field are planned and updates to the application will be provided.
4. Discussion
I. Dataset Improvement
There are many opportunities to improve the dataset that we have submitted for open source use by the research community. As a start, there can be a lot more further cleaning done to remove images that are mislabeled or irrelevant to the classification tasks (i.e. the “Unusable” category mentioned above). For example, there are several images that consist of close-up imagery of machinery that would not be helpful for the structural damage classification tasks, as well as a few aerial images that were erroneously updated to the datasets. Those could be removed to increase the overall quality of the data.
This paper could also help inform future data collection to continuously enrich the dataset. For instance, we could go back to the Cal Fire agency and ask them to implement guidance when it comes to what types of images are taken when conducting a PDA; providing such guidance would not only benefit future models trained on the dataset but better facilitate the operational workflows of these government agencies in this regard. One potential guidance could be to always include the whole structure in an image, in addition to a close up of the part of the structure that makes the assessor determine its damage classification.
There are many other data points that would enrich the dataset. For instance, due to our relationship with FEMA, we have access to data on how much these property owners have been compensated for the damage of these homes. Linking the financial data, as well as property value data, could provide a more comprehensive understanding of the concept of damage in the disaster context. There are also many ongoing projects in the field that both produce and assess satellite imagery of disaster-impacted structures; there is a great opportunity to see how this data set could be linked or connected to existing datasets that have the same properties from an aerial view.
A dataset like ours could incorporated into some of the existing projects that are consolidating and building disaster image datasets as well, such as the Incident1M Dataset, which contains almost one million disaster images with other associated information that is compiled by Qatar Computing Research Institute (QCRI) and MIT researchers [23].
II. Model and Application Improvement
In our paper, we utilized the state-of-the-art ViT model in order to build our classifier. However, there are many opportunities to further enrich the data to introduce more complexity to the model. Even without the data enhancements proposed in the previou sections, there are many additional metadata fields that could be incorporated into the model building that is already available, such as the addresses of the structures, the materials used for different components of the structures, as well as free-text inspection notes fields. Given the advancement in large language models, there are great opportunities to investigate how to integrate textual inputs into the model to improve performance.
Even without adding in more input sources to the model, there are also improvement opportunities for the classifier For example, there can be different penalty schemes developed for misclassification, since misclassifying a “Destroyed” home as “No Damage” causes more operational challenges than misclassifying a “No Damage” home as “Destroyed” from the perspective of disaster management. There can also be a certain level of acceptability threshold developed such that the workflow can be automated, and that any structure that the model doesn’t have a certain level of confidence in determining the damage classification for could be funneled to a human reviewer. This would help disaster management organizations to better optimize their staffing resources. There is also an opportunity to explore the effective storage of all the data.
Another potential area of exploration is sequencing different computer vision algorithms together to provide a streamlined workflow. For example, a first model could perform the function of determining whether the image fits the requirements specified (e.g. whether this is a residential structure) then another classifier model could then classify the damage level of the structure. Some existing work has already taken to the integrated approach of using both ground-level imagery data and satellite imagery data [24]. We could also explore having a method of isolating the home structure first, before running it through the damage severity classifier.
Since artificial intelligence and computer vision are rapidly developing fields, there are also many new models and variants that could be explored and used in image classification tasks in addition to the ViT model. There is a great opportunity to conduct an even more thorough survey on the performance of different image classification datasets on this dataset.
From a workflow standpoint, we hope that, as the research project progresses, an actually deployed version of the application could be fully utilized by disaster response staff, like those at FEMA, as well as the disaster survivors directly. A tool like this would helpfully cut down the time and resources needed to conduct a PDA, so that survivors could receive help as soon as possible. This would also better incorporate citizens into the disaster workflow, as proposed by some existing research [25].
