Submitted:
16 February 2024
Posted:
19 February 2024
You are already at the latest version
Abstract
Keywords:
1. Introduction
- I. Current work ability compared with lifetime best;
- II. Work ability in relation to the demands of the job;
- III. Number of current diseases diagnosed by a physician;
- IV. Estimated work impairment due to illness;
- V. Sick leave during the past 12 months;
- VI. Personal prognosis of work ability 2 years from now;
- VII. Mental resources.
- Is the WAI score significantly influenced by the age, gender, or occupational category of the workers?
- Does the questionnaire have a unifactorial structure, or is it better to recognize two distinct factors within it?
- Does the simplified questionnaire, without the list of diseases, have an acceptable correlation with the complete version?
- Does the shortest version of the questionnaire (limited to the first dimension) have an acceptable correlation with the final score obtained from the complete questionnaire?
- Is the assessment of the demands of the job reliable, i.e., do workers who carry out the same job consider it equally demanding from a physical or psychological point of view?
- Is there a correspondence between the diseases reported in the questionnaire and those reported to the occupational doctor during the medical examination carried out at the workplace?
- Are illnesses not diagnosed by a doctor, and which therefore do not contribute to the WAI score, irrelevant for the purposes of assessing work capacity?
- Is there an association between the WAI and sickness absence?
- Which group of pathologies determines the greatest impairment of the WAI? And which determines the highest burden of sickness absence?
- Are mental resources correlated with the presence of mental illnesses?
2. Materials and Methods
2.1. Population
2.2. Questionnaire and Objective Data
2.4. Statistics
3. Results
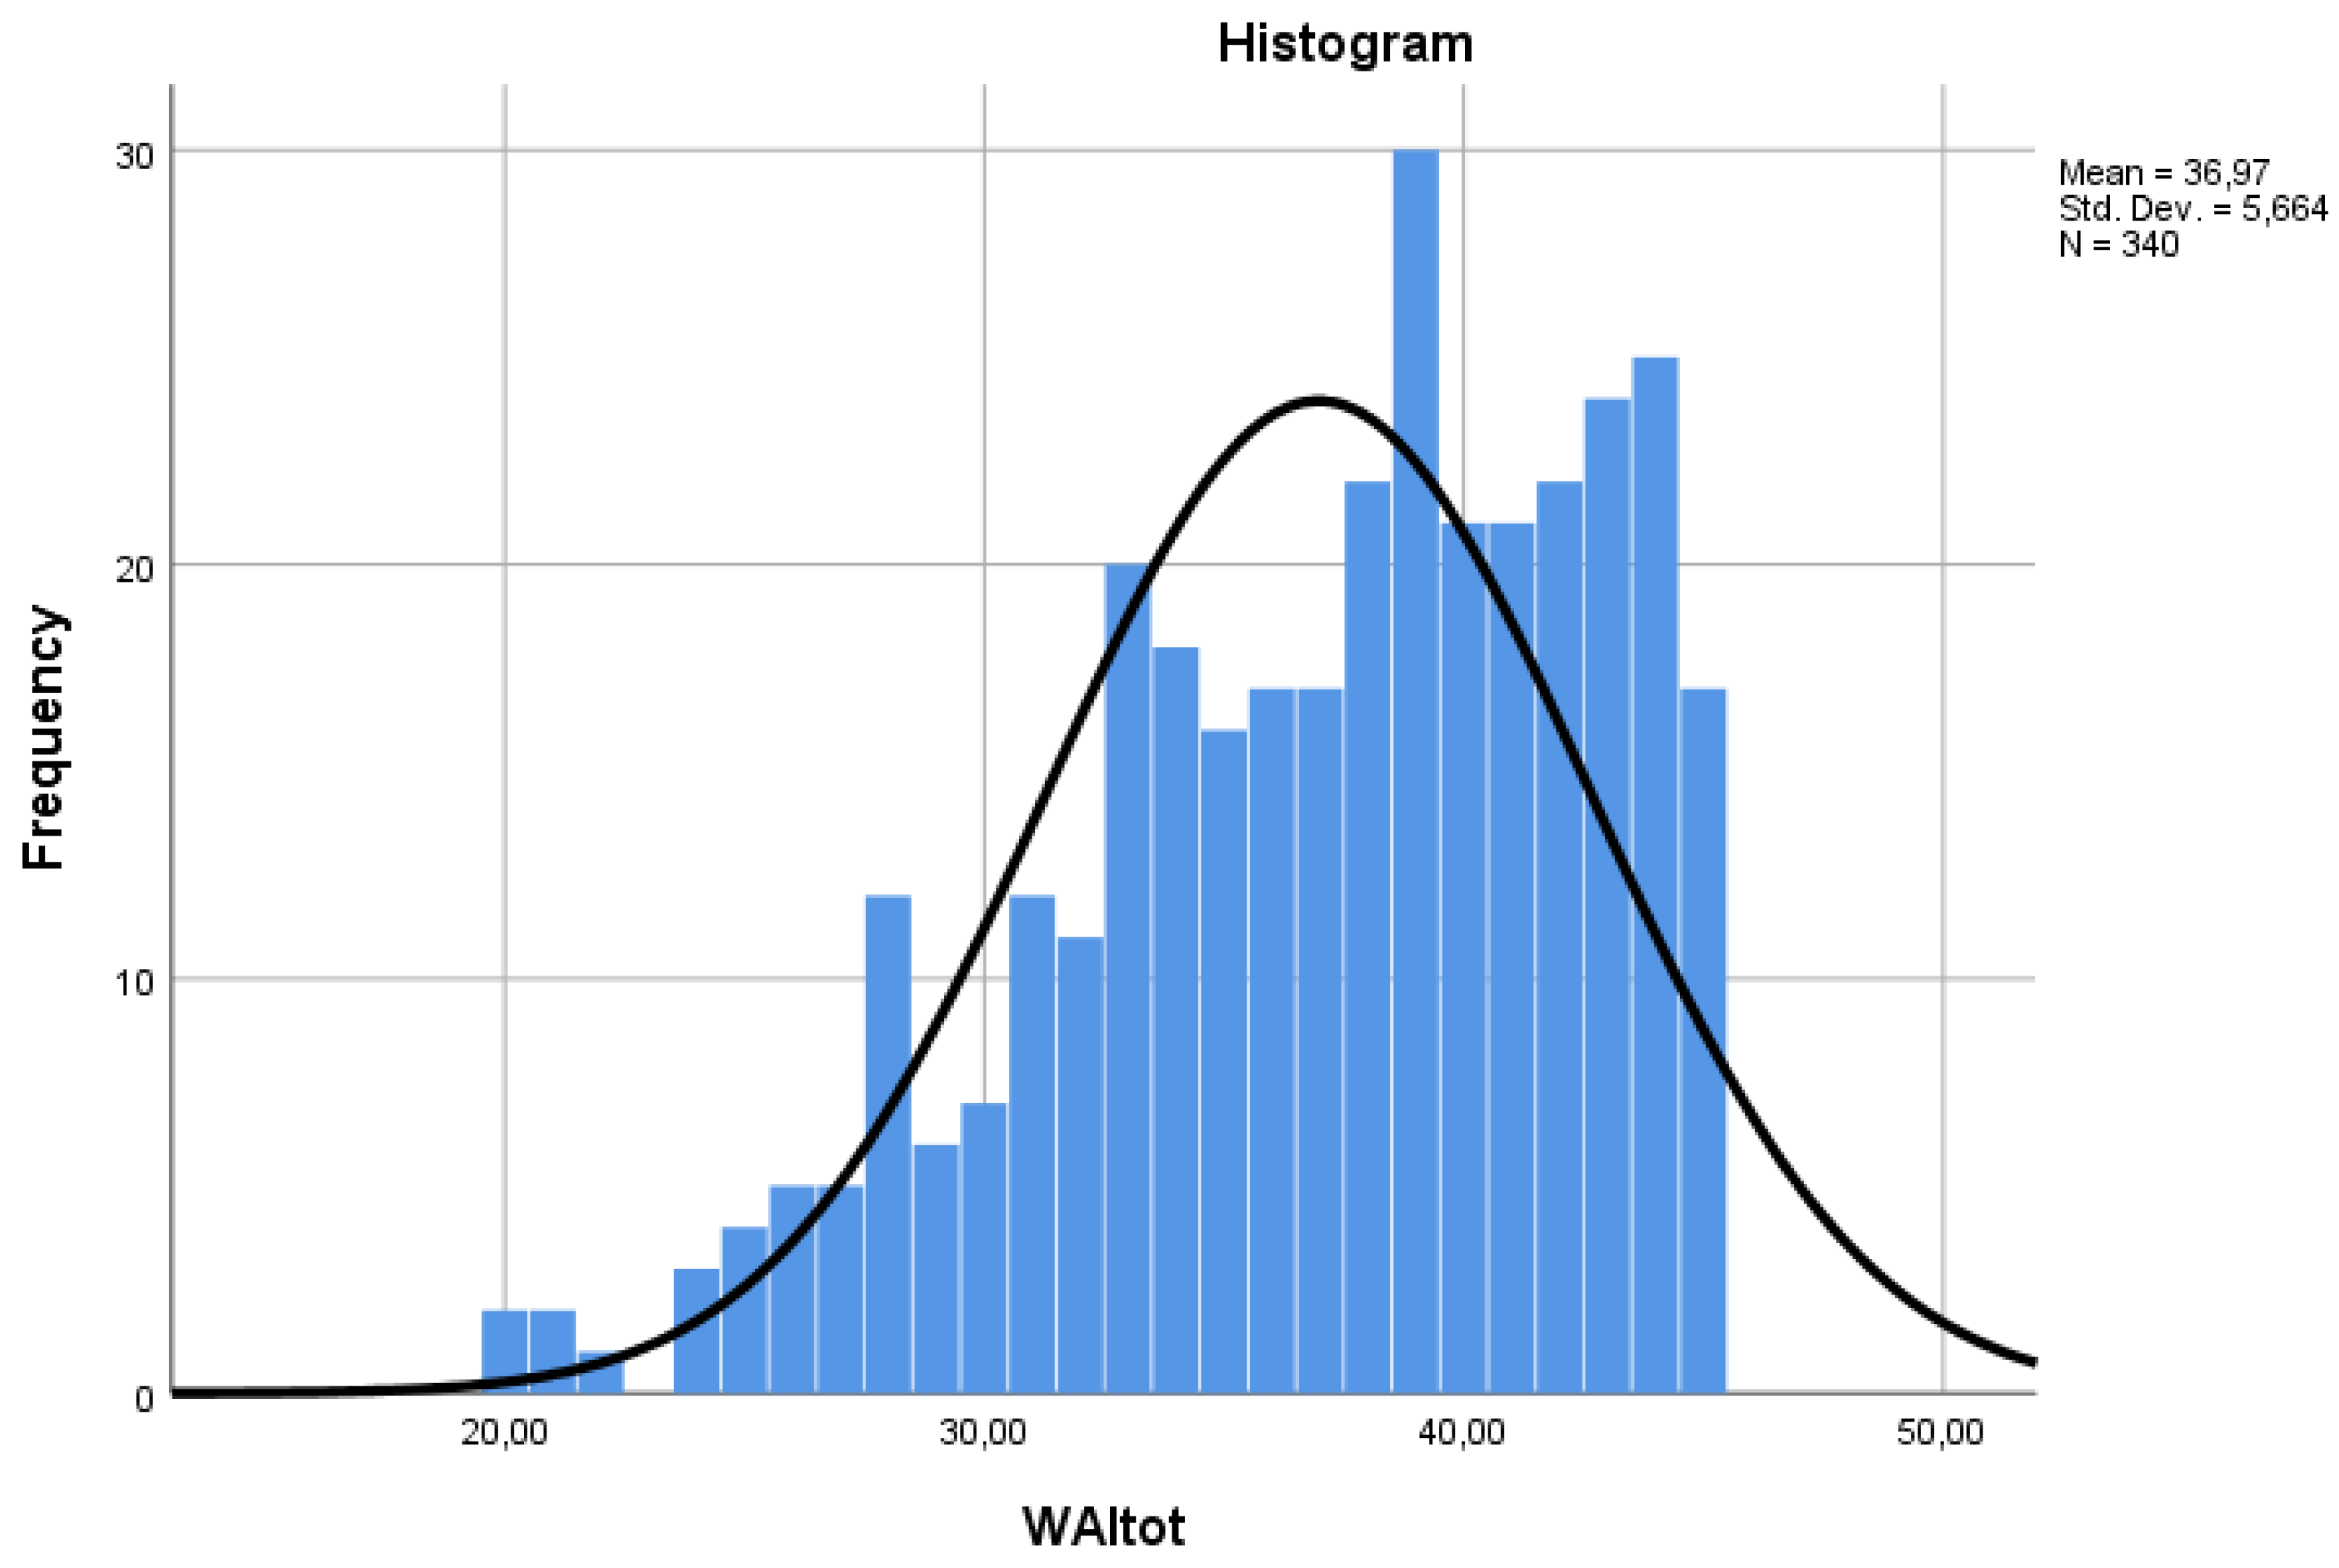
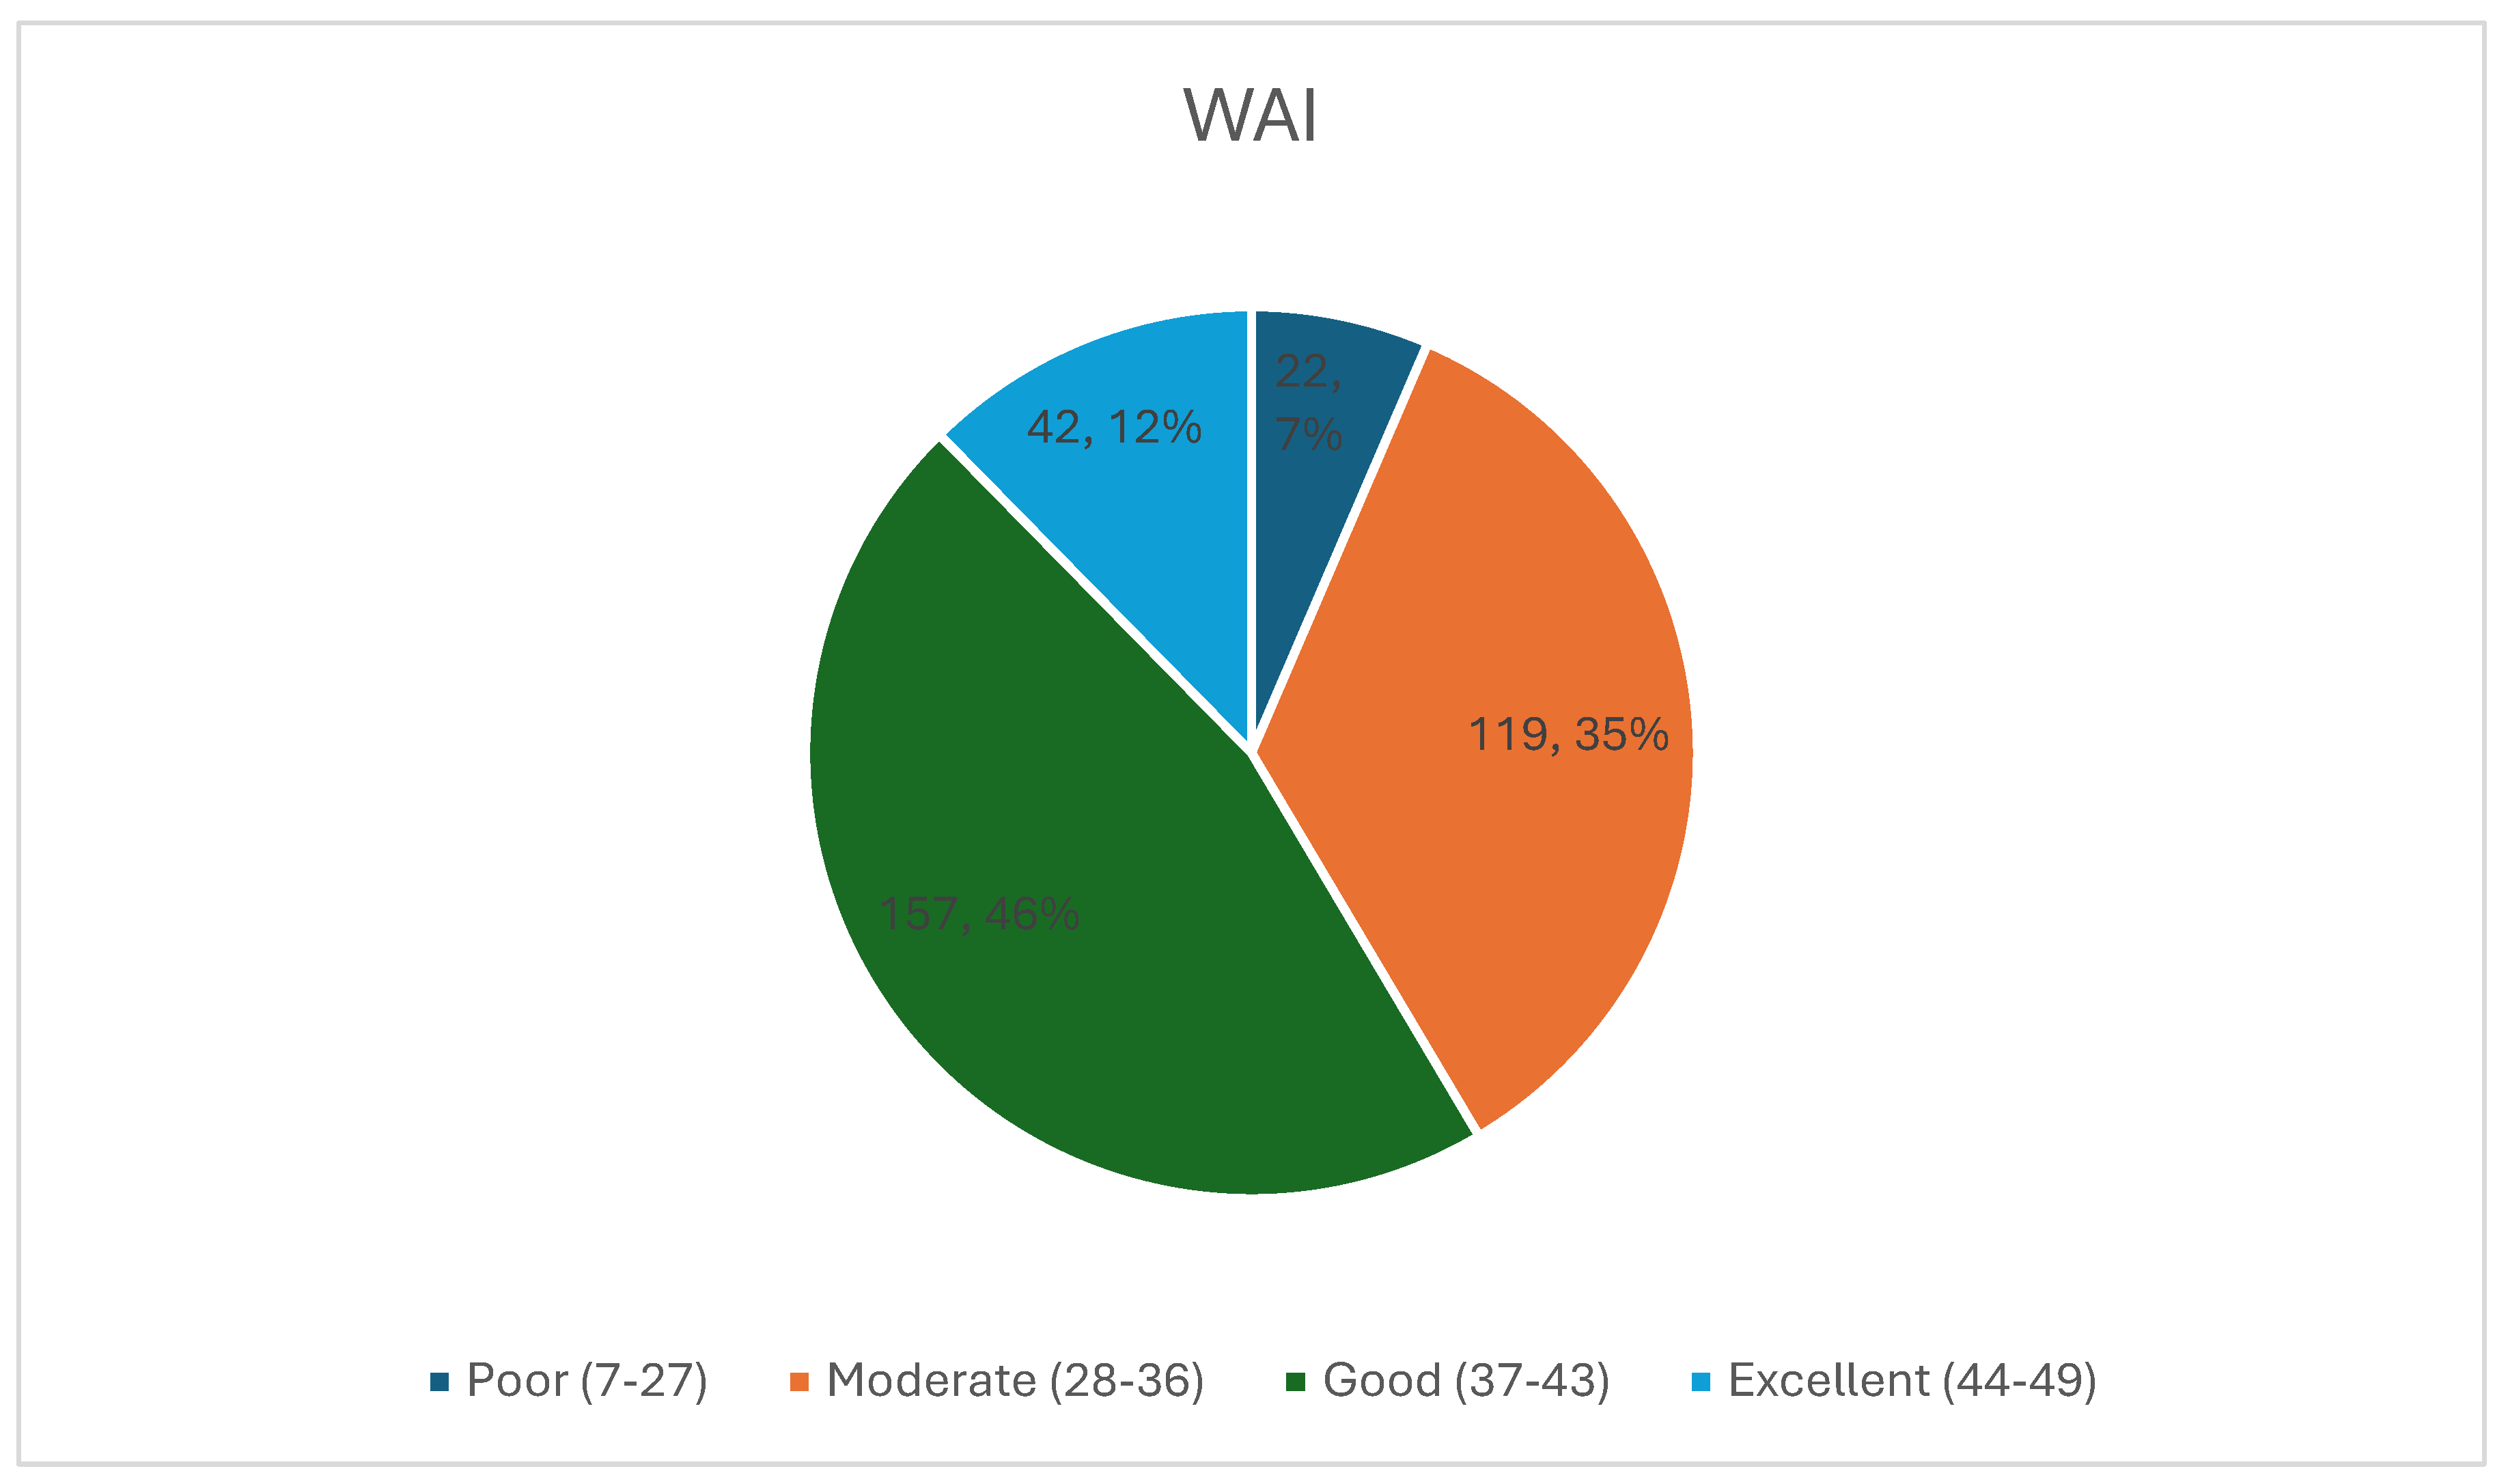
3.1. Distribution of Work Ability by Age, Gender and Occupational Category
3.2. Factorial Structure of the Work Ability Index
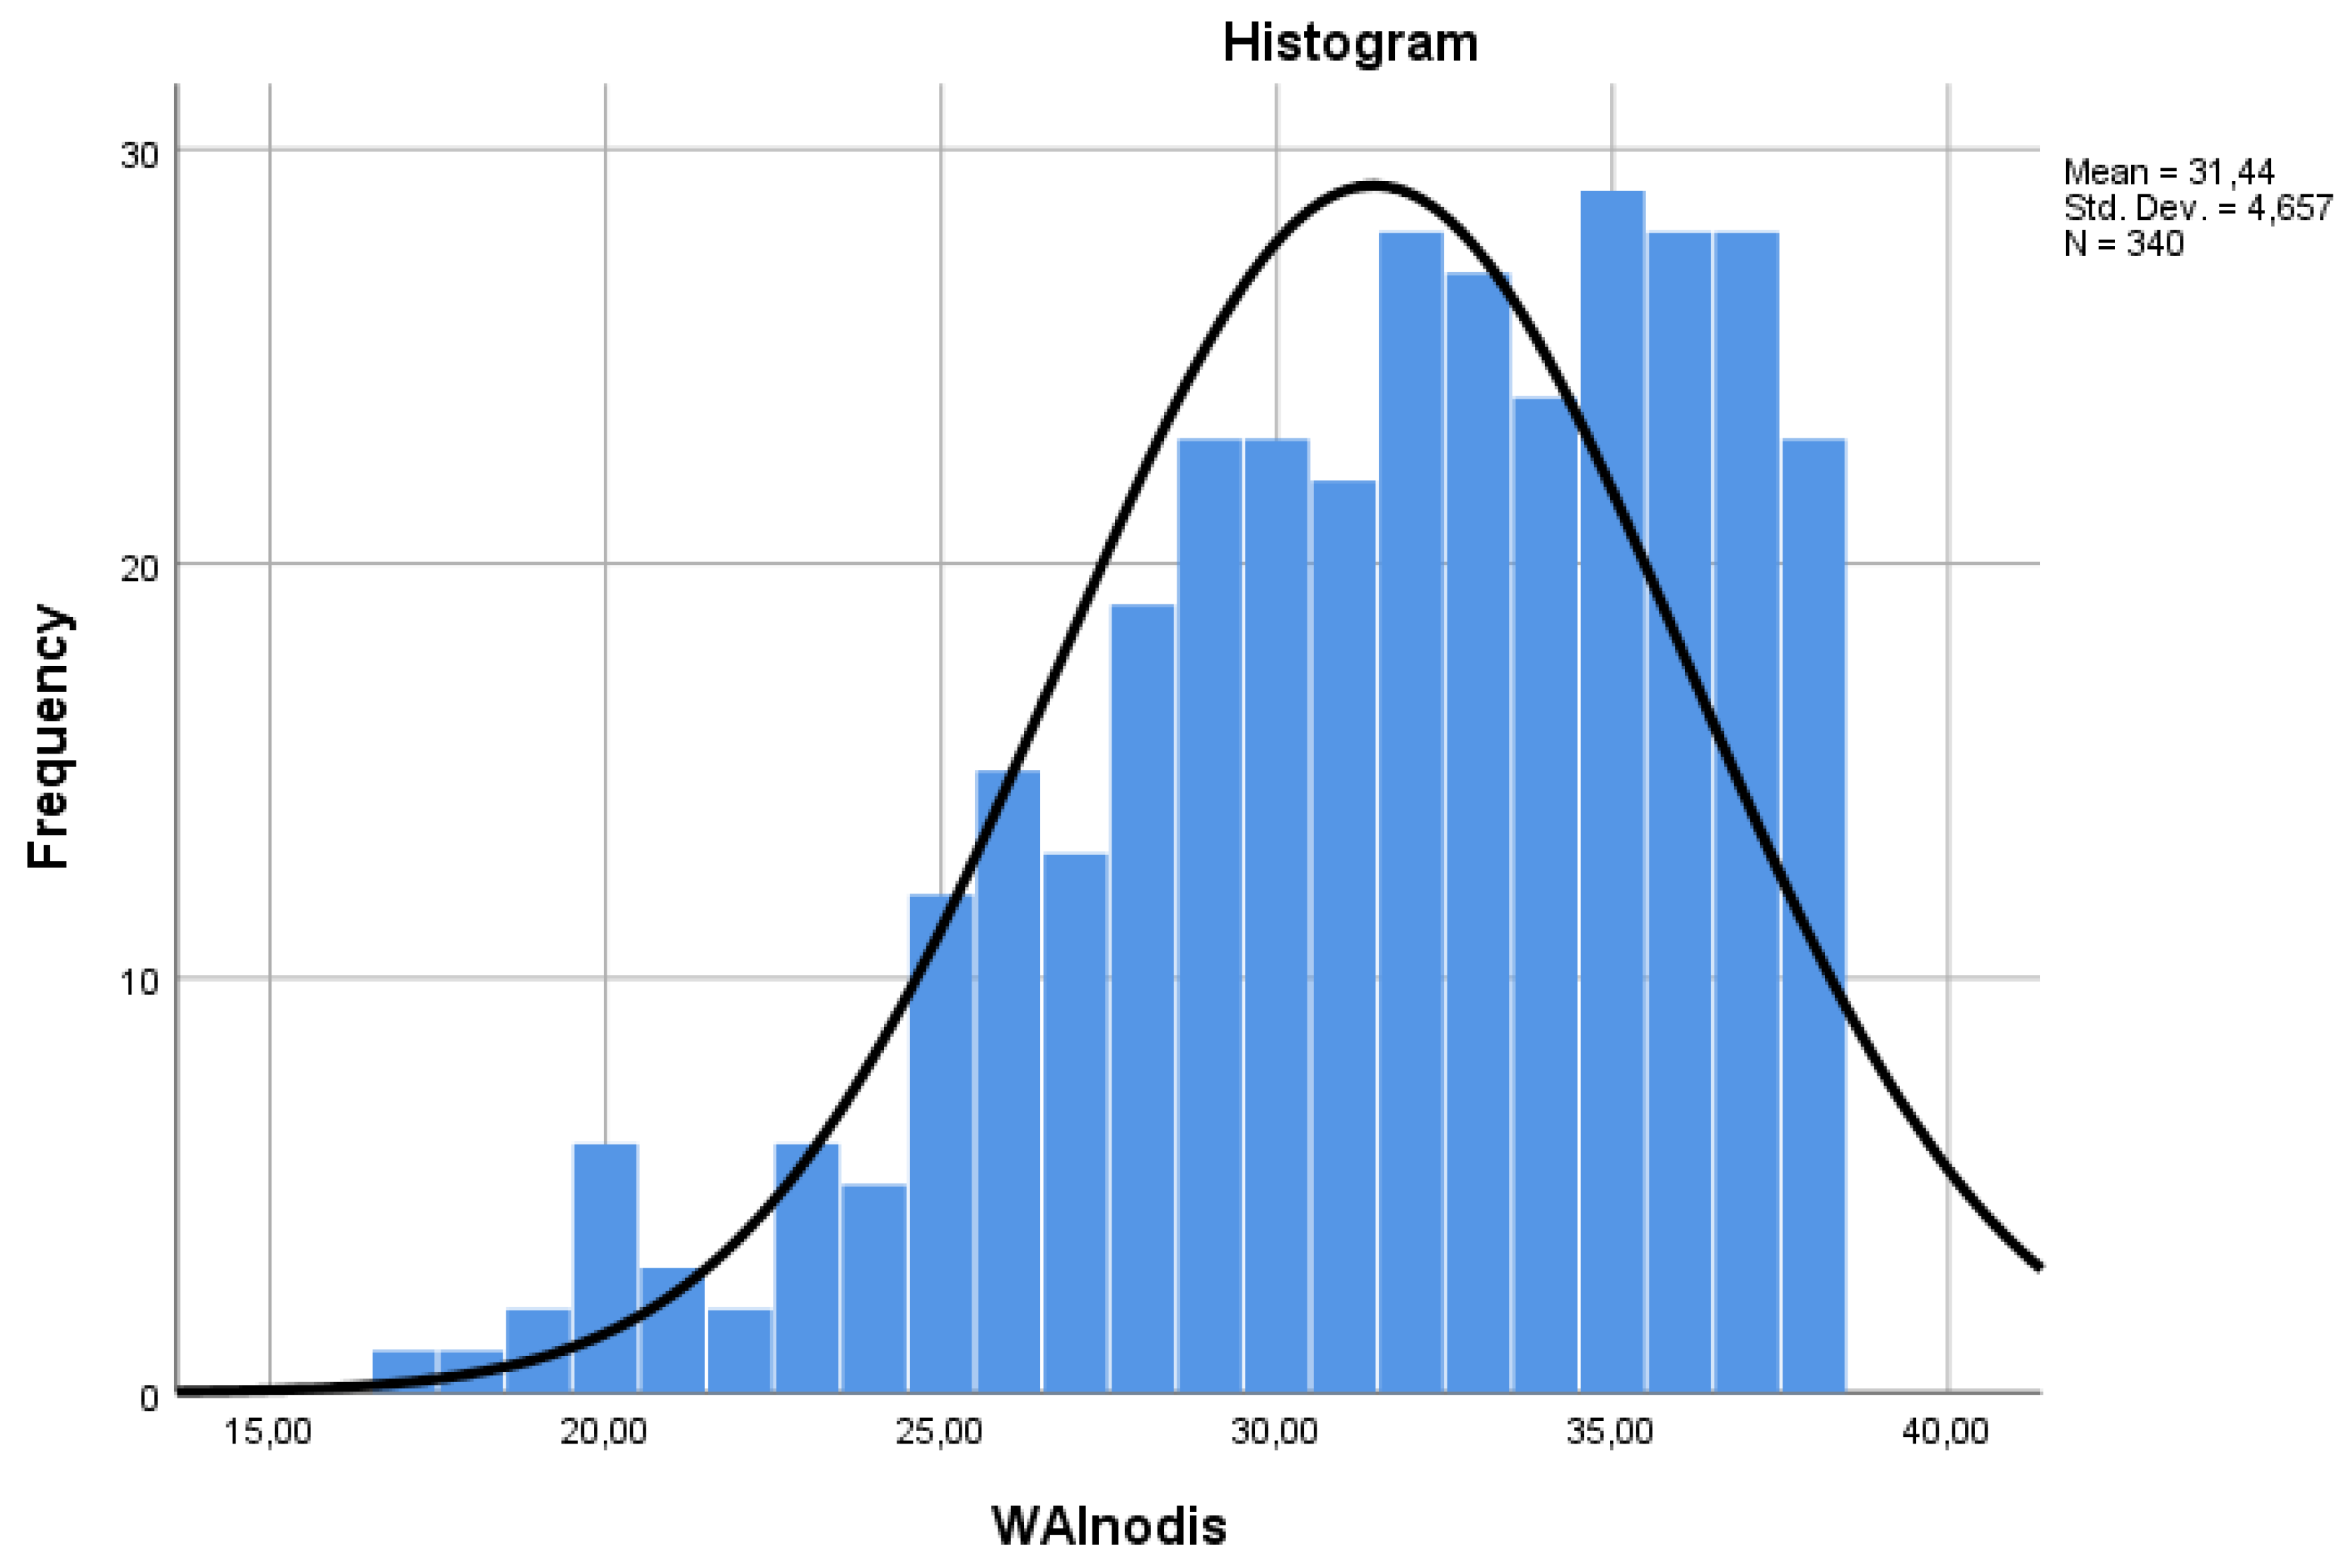
3.3. Relationships between the Complete WAI and the Shortened Version
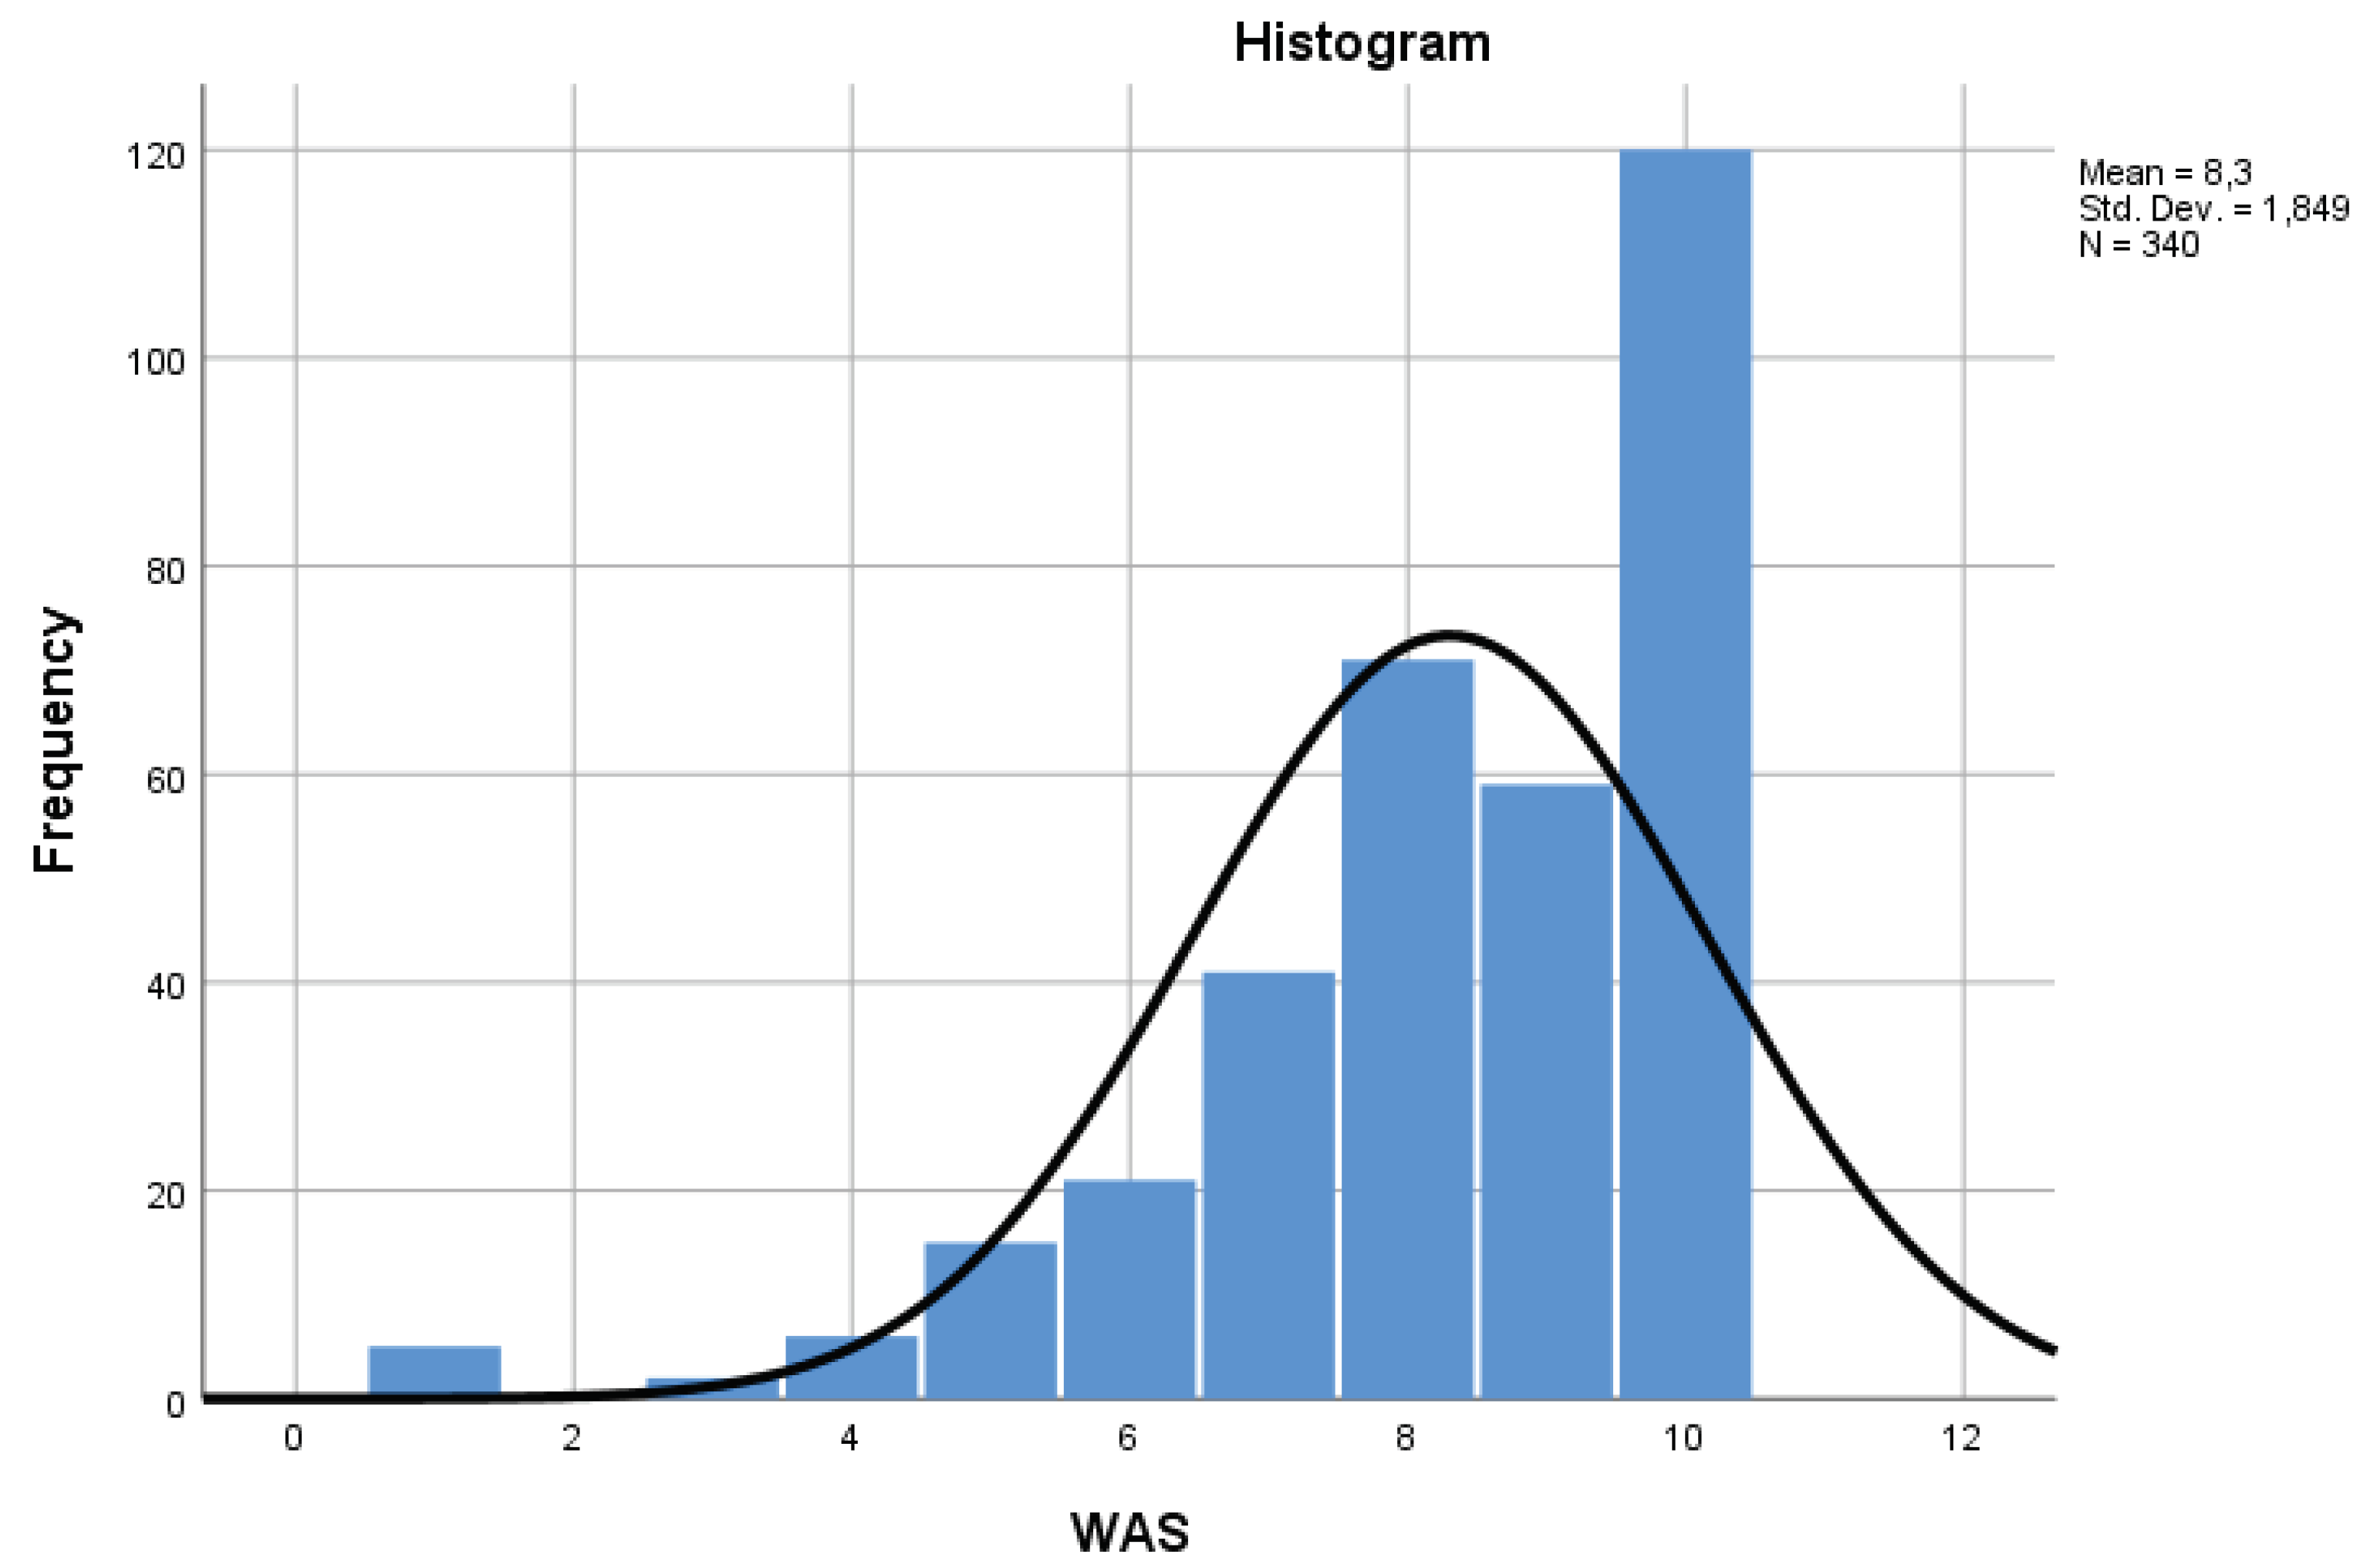
3.4. Relationships between the Complete WAI and the One-Item Version
3.5. Reliability of the Question on Job Characteristics
3.6. Reliability of the Reported Diseases
3.7. Relevance of Diseases Not Confirmed by a Doctor
3.8. Association between Diseases and Impairment
3.9. Reliability of Reported Sickness Absences
3.10. Relationship between Mental Resources and Psychiatric Diseases
4. Discussion
5. Conclusions
Author Contributions
Funding
Institutional Review Board Statement
Informed Consent Statement
Data Availability Statement
Acknowledgments
Conflicts of Interest
References
- Tuomi, K.; Ilmarinen, J.; Jahkola, A.; Katajarinne, L.; Tulkki, A. Work Ability Index, 2nd ed. Finnish Institute of Occupational Health: Helsinki, Finland, 1998.
- Coomer, K.; Houdmont, J. Occupational health professionals’ knowledge, understanding and use of work ability. Occup. Med. 2013, 63, 405–409. [Google Scholar] [CrossRef] [PubMed]
- Romero-Sánchez, J.M.; Porcel-Gálvez, A.M.; Paloma-Castro, O.; García-Jiménez, J.; González-Domínguez, M.E.; Palomar-Aumatell, X.; Fernández-García, E. Worldwide prevalence of inadequate work ability among hospital nursing personnel: A systematic review and meta-analysis. J. Nurs. Scholarsh. 2022, 54, 513–528. [Google Scholar] [CrossRef]
- Mateo Rodríguez, I.; Knox, E.C.L.; Oliver Hernández, C.; Daponte Codina, A.; The esTAR Group. Psychometric Properties of the Work Ability Index in Health Centre Workers in Spain. Int. J. Environ. Res. Public. Health 2021, 18, 12988. [Google Scholar] [CrossRef] [PubMed]
- Nubling, M.; Hasselhorn, H.M.; Seitsamo, J.; Ilmarinen, J. Comparing the use of the short and the long disease list in the Work Ability Index Questionnaire. In Assessment and Promotion of Work Ability, Health, and Wellbeing of Ageing Workers, Costa, G., Goedhard, W., Ilmarinen, J., Eds.; Elsevier: Amsterdam, 2004. [Google Scholar]
- Radkiewicz, P.; Widerszal-Bazyl, M. Psychometric properties of Work Ability Index in the light of comparative survey study. Int. Congr. Ser. 2005, 1280, 304–309. [Google Scholar] [CrossRef]
- Schouten, L.S.; Bültmann, U.; Heymans, M.W.; Joling, C.I.; Twisk, J.W.; Roelen, C.A. Shortened version of the work ability index to identify workers at risk of long-term sickness absence. Eur. J. Public. Health 2016, 26, 301–305. [Google Scholar] [CrossRef]
- European Union. Council Directive 89/391/EEC of 12 June 1989. Available at: https://eur-lex.europa.eu/legal-content/IT/TXT/?uri=CELEX:31989L0391. Accessed January 24, 2024.
- Legislative Decree 9 April 2008, n. 81 Implementation of article 1 of law 3 August 2007, n. 123, regarding the protection of health and safety in the workplace. Gazzetta Ufficiale della Repubblica Italiana. Serie Generale n.101 del 30-04-2008 - Suppl. Ordinario n. 108. Available at: https://www.gazzettaufficiale.it/eli/gu/2008/04/30/101/so/108/sg/pdf. Accessed 24 January, 2024.
- ICOH. International Commission on Occupational Health. Code of ethics. Available at: https://www.icohweb.org/site/code-of-ethics.asp. Accessed January 24, 2024.
- Converso, D.; Sottimano, I.; Garzaro, G.; Guidetti, G.; Pira, E.; Viotti, S. Contribution to validation of the Italian version of work ability personal radar. Med. Lav. 2022, 113, e2022051. [Google Scholar] [CrossRef] [PubMed]
- Lumley, T.; Diehr, P.; Emerson, S.; Chen, L. The importance of the normality assumption in large public health data sets. Annu. Rev. Public. Health 2002, 23, 151–169. [Google Scholar] [CrossRef]
- Ilmarinen, J. The work ability index (WAI). Occup. Med. 2007, 57, 160. [Google Scholar] [CrossRef]
- Gould, R.; Ilmarinen, J.; Järvisalo, J. Dimensions of work ability. Results from the Health 2000 Survey. Helsinki (Finland): Finnish Centre for Pensions, 2008, 25–34. Occup Environ Health 2008, 81, 495–501. [Google Scholar] [CrossRef]
- Gajewski, P.D.; Rieker, J.A.; Athanassiou, G.; Bröde, P.; Claus, M.; Golka, K.; Hengstler, J.G.; Kleinsorge, T.; Nitsche, M.A.; Reinders, J.; Tisch, A.; Watzl, C.; Wascher, E.; Getzmann, S. A Systematic Analysis of Biological, Sociodemographic, Psychosocial, and Lifestyle Factors Contributing to Work Ability Across the Working Life Span: Cross-sectional Study. JMIR Form. Res. 2023, 7, e40818. [Google Scholar] [CrossRef]
- Suorsa, K.; Mattila, V.M.; Leskinen, T.; Heinonen, O.J.; Pentti, J.; Vahtera, J.; Stenholm, S. Work ability and physical fitness among aging workers: The Finnish Retirement and Aging Study. Eur. J. Ageing 2022, 19, 1301–1310. [Google Scholar] [CrossRef] [PubMed]
- Ezzatvar, Y. , Calatayud, J., Andersen, L.L., Vieira, E.R., López-Bueno, R., Casaña, J. Muscular Fitness and Work Ability among Physical Therapists. Int. J. Environ. Res. Public. Health 2021, 18, 1722. [Google Scholar] [CrossRef] [PubMed]
- Rypicz, Ł.; Witczak, I.; Rosińczuk, J.; Karniej, P.; Kołcz, A. Factors affecting work ability index among Polish nurses working in hospitals - A prospective observational survey. J. Nurs. Manag. 2021, 29, 468–476. [Google Scholar] [CrossRef]
- Firoozeh, M.; Saremi, M.; Kavousi, A.; Maleki, A. Demographic and occupational determinants of the work ability of firemen. J. Occup. Health 2017, 59, 81–87. [Google Scholar] [CrossRef] [PubMed]
- Cotrim, T.P.; Ribeiro, C.; Teles, J.; Reis, V.; Guerreiro, M.J.; Janicas, A.S.; Candeias, S.; Costa, M. Monitoring Work Ability Index During a Two-Year Period Among Portuguese Municipality Workers. Int. J. Environ. Res. Public. Health 2019, 16, 3674. [Google Scholar] [CrossRef]
- Cotrim, T.; Soares, G.; Ferreira, P.; Barnabé, R.; Teles, J.; Prata, N. Measuring psychosocial factors and predicting work ability among cemetery workers. Work. 2020, 65, 111–119. [Google Scholar] [CrossRef] [PubMed]
- Kim, J.W.; Yang, S.; Chung, I.; Lee, M.Y. Factors that determine the Work Ability Index of street cleaners. Yeungnam Univ. J. Med. 2019, 36, 219–224. [Google Scholar] [CrossRef]
- Garzaro, G.; Sottimano, I.; Di Maso, M.; Bergamaschi, E.; Coggiola, M.; Converso, D.; Iavicoli, S.; Pira, E.; Viotti, S. Work Ability among Italian Bank Video Display Terminal Operators: Socio-Demographic, Lifestyle, and Occupational Correlates. Int. J. Environ. Res. Public. Health 2019, 16, 1653. [Google Scholar] [CrossRef]
- Thanapop, S.; Thanapop, C. Work ability of Thai older Workers in Southern Thailand: A comparison of formal and informal sectors. BMC Public. Health 2021, 21, 1218. [Google Scholar] [CrossRef]
- Padula, R.S.; da Silva Valente Ldo, S.; de Moraes, M.V.; Chiavegato, L.D.; Cabral, C.M. Gender and age do not influence the ability to work. Work. 2012, 41, 4330–4332. [Google Scholar] [CrossRef]
- Žmauc, T.; Železnik, D.; Težak, O. Work ability index in Slovenian hospital nurses aged over fifty years. Arh. Hig. Rada Toksikol. 2019, 70, 265–272. [Google Scholar] [CrossRef] [PubMed]
- Garzaro, G.; Clari, M.; Ciocan, C.; Albanesi, B.; Guidetti, G.; Dimonte, V.; Sottimano, I. Physical Health and Work Ability among Healthcare Workers. A Cross-Sectional Study. Nurs. Rep. 2022, 12, 259–269. [Google Scholar] [CrossRef]
- Ronchese, F.; Ricci, F.; Peccolo, G.; Persechino, B.; Rondinone, B.M.; Buresti, G.; Negro, C.; Bovenzi, M.; Miani, A. Relation of the work ability index to fitness for work in healthcare and public employees in a region of Northeastern Italy. Int. Arch. Occup. Environ. Health 2023, 96, 1203–1210. [Google Scholar] [CrossRef]
- Abbasi, M.; Zakerian, A.; Kolahdouzi, M.; Mehri, A.; Akbarzadeh, A.; Ebrahimi, M.H. Relationship between Work Ability Index and Cognitive Failure among Nurses. Electron. Physician 2016, 8, 2136–2143. [Google Scholar] [CrossRef]
- Ohta, M.; Higuchi, Y.; Kumashiro, M.; Yamato, H.; Sugimura, H. Decrease in Work Ability Index and sickness absence during the following year: A two-year follow-up study. Int. Arch. Occup. Environ. Health 2017, 90, 883–894. [Google Scholar] [CrossRef] [PubMed]
- Palmlöf, L.; Skillgate, E.; Talbäck, M.; Josephson, M.; Vingård, E.; Holm, L.W. Poor work ability increases sickness absence over 10 years. Occup Med (Lond) 2019, 69, 359–365. [Google Scholar] [CrossRef] [PubMed]
- Lundin, A.; Leijon, O.; Vaez, M.; Hallgren, M.; Torgén, M. Predictive validity of the Work Ability Index and its individual items in the general population. Scand. J. Public. Health 2017, 45, 350–356. [Google Scholar] [CrossRef]
- Reeuwijk, K.G.; Robroek, S.J.; Niessen, M.A.; Kraaijenhagen, R.A.; Vergouwe, Y.; Burdorf, A. The Prognostic Value of the Work Ability Index for Sickness Absence among Office Workers. PLoS ONE 2015, 10, e0126969. [Google Scholar] [CrossRef]
- Notenbomer, A.; Groothoff, J.W.; van Rhenen, W.; Roelen, C.A. Associations of work ability with frequent and long-term sickness absence. Occup Med (Lond) 2015, 65, 373–379. [Google Scholar] [CrossRef]
- Oberlinner, C.; Yong, M.; Nasterlack, M.; Pluto, R.P.; Lang, S. Combined effect of back pain and stress on work ability. Occup Med (Lond) 2015, 65, 147–153. [Google Scholar] [CrossRef]
- Schouteten, R. Predicting absenteeism: Screening for work ability or burnout. Occup Med (Lond) 2017, 67, 52–57. [Google Scholar] [CrossRef] [PubMed]
- Pranjic, N.; Males-Bilic, L. Work ability index, absenteeism and depression among patients with burnout syndrome. Mater. Sociomed. 2014, 26, 249–252. [Google Scholar] [CrossRef]
- La Torre, G.; Grima, D.; Romano, F.; Polimeni, A. Perceived work ability and work-family conflict in healthcare workers: An observational study in a teaching hospital in Italy. J. Occup. Health 2021, 63, e12271. [Google Scholar] [CrossRef] [PubMed]
- Li, H.; Liu, Z.; Liu, R.; Li, L.; Lin, A. The relationship between work stress and work ability among power supply workers in Guangdong, China: A cross-sectional study. BMC Public. Health 2016, 16, 123. [Google Scholar] [CrossRef]
- Yong, M.; Nasterlack, M.; Pluto, R.P.; Lang, S.; Oberlinner, C. Occupational stress perception and its potential impact on work ability. Work 2013, 46, 347–354. [Google Scholar] [CrossRef] [PubMed]
- Amirmahani, M.; Hasheminejad, N.; Tahernejad, S.; Reza Tohidi Nik, H. Evaluation of work ability index and its association with job stress and musculoskeletal disorders among midwives during the Covid-19 pandemic. Med. Lav. 2022, 113, e2022031. [Google Scholar] [CrossRef]
- Kazemi, R.; Zamanian, Z.; Khalifeh, M.; Hemmatjo, R. The Effects of Noise and Heat Strain on the Work Ability Index (WAI) among Rubber Factory Workers. Ann. Glob. Health 2019, 85, 96. [Google Scholar] [CrossRef]
- Bernburg, M.; Vitzthum, K.; Groneberg, D.A.; Mache, S. Physicians’ occupational stress, depressive symptoms and work ability in relation to their working environment: A cross-sectional study of differences among medical residents with various specialties working in German hospitals. BMJ Open 2016, 6, e011369. [Google Scholar] [CrossRef]
- Abdelrehim, M.G.; Eshak, E.S.; Kamal, N.N. The mediating role of work-family conflicts in the association between work ability and depression among Egyptian civil workers. J Public Health (Oxf) 2023, 45, e175–e183. [Google Scholar] [CrossRef]
- Björkelund, C.; Saxvik, A.; Svenningsson, I.; Petersson, E.L.; Wiegner, L.; Larsson, M.; Törnbom, K.; Wikberg, C.; Ariai, N.; Nejati, S.; Hensing, G.; Hange, D. Rehabilitation cooperation and person-centred dialogue meeting for patients sick-listed for common mental disorders: 12 months follow-up of sick leave days, symptoms of depression, anxiety, stress and work ability - a pragmatic cluster randomised controlled trial from the CO-WORK-CARE project. BMJ Open 2023, 13, e074137. [Google Scholar] [CrossRef]
- Onell, C.; Holm, L.W.; Bohman, T.; Magnusson, C.; Lekander, M.; Skillgate, E. Work ability and psychological distress in a working population: Results from the Stockholm Public Health Cohort. Scand. J. Public. Health 2023, 51, 595–601. [Google Scholar] [CrossRef]
- Yong, M.; Nasterlack, M.; Pluto, R.P.; Elmerich, K.; Karl, D.; Knauth, P. Is health, measured by work ability index, affected by 12-hour rotating shift schedules? Chronobiol. Int. 2010, 27, 1135–1148. [Google Scholar] [CrossRef] [PubMed]
- Camerino, D.; Conway, P.M.; Sartori, S.; Campanini, P.; Estryn-Béhar, M.; van der Heijden, B.I.; Costa, G. Factors affecting work ability in day and shift-working nurses. Chronobiol. Int. 2008, 25, 425–442. [Google Scholar] [CrossRef] [PubMed]
- Rotenberg, L.; Griep, R.H.; Fischer, F.M.; Fonseca Mde, J.; Landsbergis, P. Working at night and work ability among nursing personnel: When precarious employment makes the difference. Int. Arch. Occup. Environ. Health 2009, 82, 877–885. [Google Scholar] [CrossRef] [PubMed]
- Pavanello, S.; Stendardo, M.; Mastrangelo, G.; Casillo, V.; Nardini, M.; Mutti, A.; Campisi, M.; Andreoli, R.; Boschetto, P. Higher Number of Night Shifts Associates with Good Perception of Work Capacity and Optimal Lung Function but Correlates with Increased Oxidative Damage and Telomere Attrition. Biomed. Res. Int. 2019, 2019, 8327629. [Google Scholar] [CrossRef] [PubMed]
- Abdolalizadeh, M.; Arastoo, A.A.; Ghsemzadeh, R.; Montazeri, A.; Ahmadi, K.; Azizi, A. The psychometric properties of an Iranian translation of the Work Ability Index (WAI) questionnaire. J. Occup. Rehabil. 2012, 22, 401–408. [Google Scholar] [CrossRef]
- Bethge, M.; Radoschewski, F.M.; Gutenbrunner, C. The Work Ability Index as a screening tool to identify the need for rehabilitation: Longitudinal findings from the Second German Sociomedical Panel of Employees. J. Rehabil. Med. 2012, 44, 980–987. [Google Scholar] [CrossRef]
- Martinez, M.C.; Latorre Mdo, R.; Fischer, F.M. Validity and reliability of the Brazilian version of the Work Ability Index questionnaire. Rev. Saude Publica 2009, 43, 525–532. [Google Scholar] [CrossRef]
- Martus, P.; Jakob, O.; Rose, U.; Seibt, R.; Freude, G. A comparative analysis of the Work Ability Index. Occup. Med. 2010, 60, 517–524. [Google Scholar] [CrossRef]
- Peralta, N.; Godoi Vasconcelos, A.G.; Härter Griep, R.; Miller, L. Validity and reliability of the Work Ability Index in primary care workers in Argentina. Salud Colectiva 2012, 8, 163–173. [Google Scholar] [CrossRef]
- Alexopoulos, E.; Merekoulias, G.; Gnardellis, C.; Jelastopulu, E. Work Ability Index: Validation of the Greek version and descriptive data in heavy industry employees. Br. J. Med. Med. Res. 2013, 3, 608–621. [Google Scholar] [CrossRef] [PubMed]
- Freyer, M.; Formazin, M.; Rose, U. Factorial Validity of the Work Ability Index Among Employees in Germany. J. Occup. Rehabil. 2019, 29, 433–442. [Google Scholar] [CrossRef] [PubMed]
- Ebener, M.; Hasselhorn, H.M. Validation of Short Measures of Work Ability for Research and Employee Surveys. Int. J. Environ. Res. Public. Health 2019, 16, 3386. [Google Scholar] [CrossRef] [PubMed]
- Mokarami, H.; Cousins, R.; Kalteh, H.O. Comparison of the work ability index and the work ability score for predicting health-related quality of life. Int. Arch. Occup. Environ. Health 2022, 95, 213–221. [Google Scholar] [CrossRef] [PubMed]
- El Fassi, M.; Bocquet, V.; Majery, N.; Lair, M.L.; Couffignal, S.; Mairiaux, P. Work ability assessment in a worker population: Comparison and determinants of Work Ability Index and Work Ability score. BMC Public. Health 2013, 13, 305. [Google Scholar] [CrossRef] [PubMed]
- Magnavita, N.; Arnesano, G.; Di Prinzio, R.R.; Gasbarri, M.; Meraglia, I.; Merella, M.; Vacca, M.E. Post-COVID Symptoms in Occupational Cohorts: Effects on Health and Work Ability. Int. J. Environ. Res. Public. Health 2023, 20, 5638. [Google Scholar] [CrossRef] [PubMed]
- Magnavita, N.; Di Prinzio, R.R.; Meraglia, I.; Vacca, M.E.; Arnesano, G.; Merella, M.; Mauro, I.; Iuliano, A.; Terribile, D.A. Supporting Return to Work after Breast Cancer: A Mixed Method Study. Healthcare 2023, 11, 2343. [Google Scholar] [CrossRef] [PubMed]
- Magnavita, N. Workplace Health Promotion Embedded in Medical Surveillance: The Italian Way to Total Worker Health Program. Int. J. Environ. Res. Public. Health 2023, 20, 3659. [Google Scholar] [CrossRef]
- Bernal, D.; Campos-Serna, J.; Tobias, A.; Vargas-Prada, S.; Benavides, F.G.; Serra, C. Work-related psychosocial risk factors and musculoskeletal disorders in hospital nurses and nursing aides: A systematic review and meta-analysis. Int. J. Nurs. Stud. 2015, 52, 635–648. [Google Scholar] [CrossRef]
- Del Campo, M.T.; Romo, P.E.; de la Hoz, R.E.; Villamor, J.M.; Mahíllo-Fernández, I. Anxiety and depression predict musculoskeletal disorders in health care workers. Arch. Environ. Occup. Health 2017, 72, 39–44. [Google Scholar] [CrossRef]
- Lindegård, A.; Larsman, P.; Hadzibajramovic, E.; Ahlborg, G. Jr. The influence of perceived stress and musculoskeletal pain on work performance and work ability in Swedish health care workers. Int. Arch. Occup. Environ. Health 2014, 87, 373–379. [Google Scholar] [CrossRef] [PubMed]
- Oakman, J.; Neupane, S.; Proper, K.I.; Kinsman, N.; Nygård, C.H. Workplace interventions to improve work ability: A systematic review and meta-analysis of their effectiveness. Scand. J. Work. Environ. Health 2018, 44, 134–146. [Google Scholar] [CrossRef] [PubMed]


| Category | WAI (mean±s.d.) | Significant Comparisons1 |
|---|---|---|
| 1. Physician (n=38) | 37.1±4.7 | none |
| 2. Nurse (n=97) | 35.3±6.2 | 2 vs. 3 p<0.001; 2 vs. 4 p<0.01 |
| 3. Assistant nurse (n=75) | 38.8±5.6 | 3 vs. 2 p<0.001; 3 vs. 5 p<0.05 |
| 4. Clerk (n=50) | 38.6±4.8 | 4 vs.2 p<0.01 |
| 5. Technician (n=80) | 36.2±5.4 | 5 vs. 4 p<0.05 |
| Items | Principal component analysis | Principal Component Analysis1 | |
|---|---|---|---|
| Factor 1 | Factor 1 | Factor 2 | |
| 1. Current work ability compared with lifetime best | 0.71 | 0.73 | |
| 2. Current work ability in relation to its demands | 0.74 | 0.75 | |
| 3. Number of current diseases diagnosed by a physician | 0.62 | 0.59 | |
| 4. Estimated work impairment due to disease | 0.70 | 0.68 | |
| 5. Sick leave during the past year (12 months) | 0.49 | 0.83 | |
| 6. Own prognosis of work ability two years from now | 0.55 | 0.71 | |
| 7. Mental resources (feelings of joy, alertness, or optimism) | 0.68 | 0.67 | |
| Variance of the component (%) | 42.09 | 42.09 | 13.57 |
| WAInodis | WAS | WAI | |
|---|---|---|---|
| WAInodis | 1.000 | 0.832** | 0.958** |
| WAS | 1.000 | 0.789** | |
| WAI | 1.000 |
|
Class of Disease |
0 No disease N (mean ± s.d.) |
1 Personal diagnosis N (mean ± s.d.) |
2 Medical diagnosis N (mean ± s.d.) |
Anova p |
Bonferroni p |
||
|---|---|---|---|---|---|---|---|
| 0 vs.1 | 0 vs.2 | 1 vs.2 | |||||
| Injury | 256 (32.5±4.0) | 49 (27.9±5.0) | 35 (28.7±4.8) | <0.001 | <0.001 | <0.001 | n.s. |
| Musculoskeletal | 160 (33.8±3.4) | 82 (28.4±4.7) | 98 (30.1±4.5) | <0.001 | <0.001 | <0.001 | <0.05 |
| Cardiovascular | 276 (32.0±4.3) | 51 (29.1±5.2) | 13 (28.9±5.5) | <0.001 | <0.001 | <0.05 | n.s. |
| Respiratory | 312 (31.7±4.5) | 17 (28.2±5.1) | 11 (30.1±6.1) | <0.01 | <0.01 | n.s. | n.s. |
| Psychiatric | 267 (32.7±3.7) | 15 (27.9±5.1) | 58 (26.5±4.7) | <0.001 | <0.001 | <0.001 | n.s. |
| Neurological | 271 (32.4±4.2) | 32 (28.1±4.5) | 37 (27.3±4.4) | <0.001 | <0.001 | <0.001 | n.s. |
| Gastroenteric | 264 (32.1±4.5) | 38 (29.5±4.3) | 38 (28.9±4.7) | <0.001 | <0.01 | <0.001 | n.s. |
| Genitourinary | 302 (31.7±4.7) | 24 (29.8±4.0) | 14 (29.3±4.6) | <0.05 | n.s. | n.s. | n.s. |
| Skin | 288 (31.9±4.4) | 28 (28.5±4.7) | 24 (28.6±5.3) | <0.001 | <0.001 | <0.01 | n.s. |
| Cancer | 324 (31.5±4.7) | 12 (30.3±2.5) | 4 (32.5±3.4) | n.s. | n.s. | n.s. | n.s. |
| Endocrine | 277 (31.7±4.6) | 48 (30.0±5.1) | 15 (31.4±4.3) | n.s. | n.s. | n.s. | n.s. |
| Blood | 324 (31.5±4.6) | 11 (30.1±4.2) | 5 (28.2±7.8) | n.s. | n.s. | n.s. | n.s. |
| Abortion | 320 (31.5±4.7) | 16 (29.5±4.4) | 4 (33.5±2.5) | n.s. | n.s. | n.s. | n.s. |
| Other | 316 (31.7±4.5) | 16 (27.2±5.4) | 8 (30.9±5.9) | <0.01 | <0.001 | n.s. | n.s. |
| Beta | t | p | |
|---|---|---|---|
| (Constant) | 16,187 | ,000 | |
| Age | -,142 | -2,304 | ,022 |
| Sex | -,123 | -2,125 | ,034 |
| Night shift | ,086 | 1,312 | ,191 |
| Category | ,071 | 1,124 | ,262 |
| Absence | -,259 | -4,317 | ,000 |
| Medical diagnosis Class of Disease |
Days of absence 2021 range (mean ± s.d.) |
Days of absence 2022 range (mean ± s.d.) |
Days of absence 2023 range (mean ± s.d.) |
Days of absence 2021-23 range (mean ± s.d.) |
|---|---|---|---|---|
| Injury | 0-21 (5.0±5.2) | 0-36 (11.0±10.1) | 0-31 (7.9±8.3) | 1-83 (23.9±18.5) |
| Musculoskeletal | 0-54 (7.5±10.4) | 0-120 (11.8±16.8) | 0-83 (9.0±13.4) | 1-172 (28.3±31.5) |
| Cardiovascular | 0-14 (7.0±4.9) | 0-33 (12.6±10.5) | 0-134 (2.7±39.7) | 1-179 (40.4±49.1) |
| Respiratory | 0-172 (21.7±53.1) | 0-24 (9.7±8.2) | 0-21 (7.4±7.7) | 2-196 (39.8±52.3) |
| Psychiatric | 0-172 (14.8±30.6) | 0-64 (11.3±12.6) | 0-134 (15.2±27.0) | 1-179 (37.0±47.0) |
| Neurological | 0-36 (7.3±9.2) | 0-45 (13.0±12.7) | 0-134 (15.2±27.0) | 1-179 (35.5±39.7) |
| Gastroenteric | 0-172 (12.1±29.7) | 0-45 (11.4±12.3) | 0-83 (10.3±17.3) | 2-196 (33.8±42.6) |
| Genitourinary | 0-172 (22.4±47.4) | 0-40 (10.9±12.7) | 0-83 (10.2±21.7) | 1-196 (34.5±60.6) |
| Skin | 0-172 (23.2±45.5) | 0-45 (11.3±11.0) | 0-41 (8.1±9.2) | 2-196 (42.6±48.9) |
| Cancer | 0-10 (4.7±4.2) | 0-16 (7.3±8.5) | 2-19 (7.5±7.8) | 2-35 (19.5±15.6) |
| Endocrine | 0-10 (4.9±4.5) | 0-24 (11.0±8.1) | 0-66 (11.7±20.7) | 2-80 (27.6±23.2) |
| Blood | 0-172 (37.2±75.4) | 0-24 (9.2±10.0) | 0-19 (7.2±7.6) | 2-196 (53.6±80.6) |
| Abortion | 0-6 (2.2±2.8) | 0-13 (3.2±6.5) | 2-19 (7.2±7.9) | 2-35 (12.7±15.4) |
| Other | 0-172 (29.6±63.4) | 0-24 (7.0±8.8) | 0-19 (6.0±6.6) | 2-196 (42.6±69.2) |
|
Class of Disease |
0 No psychiatric disease N = 267 |
1 Personal diagnosis N = 15 |
2 Medical diagnosis N = 58 |
Anova p |
Bonferroni p |
||
|---|---|---|---|---|---|---|---|
| 0 vs.1 | 0 vs.2 | 1 vs.2 | |||||
| Mental resources (mean ± s.d.) |
3.57±0.61 | 2.93±0.70 | 2.83±0.75 | <0.001 | <0.001 | <0.001 | n.s. |
Disclaimer/Publisher’s Note: The statements, opinions and data contained in all publications are solely those of the individual author(s) and contributor(s) and not of MDPI and/or the editor(s). MDPI and/or the editor(s) disclaim responsibility for any injury to people or property resulting from any ideas, methods, instructions or products referred to in the content. |
© 2024 by the authors. Licensee MDPI, Basel, Switzerland. This article is an open access article distributed under the terms and conditions of the Creative Commons Attribution (CC BY) license (http://creativecommons.org/licenses/by/4.0/).


