1. Introduction
Primary liver cancer is the disease with the sixth highest incidence rate and the third highest mortality rate among all types of cancer globally [
1]. Hepatocellular carcinoma (HCC) is a common type of liver cancer, accounting for around 75-85% of all liver cancer cases [
2].
Oxidative stress is known linked to tumor regulation, especially during initiation and progression. It is generally recognized that low content of reactive oxygen species (ROS) promotes the development of cancer cells, such as proliferation, differentiation, migration, and cell death. On the other hand, high content of ROS which increases oxidative damage and enhances ROS-dependent death signaling, can effectively prevent tumorigenesis and progression [
3,
4,
5]. The efficacy of some chemotherapy drugs is related to the production of ROS, such as sorafenib, which targets the mitochondrial electron transport chain complexes and directly induces ROS production in HCC cells, while cisplatin increases ROS production and nuclear DNA damage in cancer cells. However, cancer cells develop resistance to sorafenib by resisting the formation of ROS. Furthermore, cytoplasmic scavengers such as glutathione (GSH) can accelerate the clearance of cisplatin by cancer cells, which is one of the factors leading to cisplatin resistance [
4,
6]. Therefore, the use of various nutraceuticals or synthetic compounds as antioxidants in anti-cancer treatment is controversial because in some chemotherapy treatments that cause cancer cell death with high levels of ROS, the use of antioxidants such as GSH and thioredoxin will reduced ROS levels, resulting in insufficient induction of cancer cell apoptosis [
7].
Tumor progression is regulated by complex mechanisms. Tumors need to establish new vasculature to transport nutrients and oxygen, so angiogenesis is a key factor in determining the continued growth and distant metastasis of tumor cells [
8]. In addition, pro-angiogenic factors in tumors induce downregulation of adhesion molecules on endothelial cells in the tumor vasculature and induce unresponsiveness to inflammatory signals such as TNF-α and IL-1, so tumors with an angiogenic phenotype may escape infiltration of cytotoxic leukocytes [
9]. The remodeling of the extracellular matrix (ECM) in cancer cells involves the creation of invadopodia, which have the ability to adhere to the ECM, physically penetrate it, and degrade it through proteolysis [
10]. The dynamic remodeling of the ECM and tumor microenvironment (TME) is mediated by proteases, such as matrix metalloproteases (MMPs), cathepsins, and plasmin. Plasmin whose activation from its precursor plasminogen is tightly regulated by the activators (uPA, uPAR, and tPA), the inhibitors (PAI-1, PAI-2), and plasminogen receptors. Among them, MMPs are the most important proteases in ECM proteolysis, helping to remodel ECM and release ECM and membrane-bound growth factors, promoting tumor progression, metastasis, and tumor-related angiogenesis [
9].
In addition, the Wnt/β-catenin signaling pathway is very important in angiogenesis, stem cell differentiation, embryonic development, and self-renewal of adult tissues. Its core component, β-catenin, is responsible for the transcription of multiple downstream target genes, such as vimentin, cyclin D1, c-myc and MMPs, of the Wnt pathway, and the regulatory role in cell proliferation, apoptosis, invasion, and metastasis; thus, plays a crucial role in mediating cancer cell progression and tumor metastasis [
11,
12].
Cancer development and its response to treatment are regulated by inflammation, which can promote or inhibit tumor progression and may have opposite effects on treatment outcomes. The acute inflammatory process involves tumor immune surveillance and anti-tumor immune system responses, which may lead to tumor regression or elimination. The impact of chronic inflammation on cancer is a microenvironment that promotes tumor growth and immune evasion [
13,
14]. In addition to the duration of inflammation, the scope of inflammation is also important for cancer progression. Systemic inflammation is characterized by a cancer-promoting immune response and is an indicator of poor prognosis in cancer patients. Localized inflammation confined to intra-cancer has been shown to be associated with a better prognosis in a variety of cancers. Increased TNF-α expression in chronic inflammation induces an intact TNF/TNF receptor (TNFR) complex and activates the NF-κB signaling pathway, thereby further promoting cell survival and tumor growth, while acute inflammation caused by local administration of TNF-α induces cancer cell apoptosis and tumor regression [
15].
Conventional treatments for liver cancer have disadvantages such as drug resistance, cancer recurrence, and adverse reactions. On the other hand, traditional herbal medicine has the advantage of anti-cancer effects while has low side effects. Evidence has shown in clinical use that, herbal medicines and drugs containing natural products have significant effects in delaying tumor progression, preventing cancer recurrence and metastasis, relieving clinical symptoms, enhancing the immune function, and eventually improving the quality of life, and prolonging life expectancy in patients with liver cancer [
16,
17].
Siegesbeckia orientalis L. is an annual herb that grows in the wild. In traditional Chinese medicine treatment, it plays an important role in treating rheumatism, acute arthritis, waist and knee weakness, detoxification, and maintenance of human health [
18]. Previous studies have shown that
S. orientalis ethanolic extract (SOE) possesses the anti-cancer effect [
19,
20,
21]. Treating RL95-2 endometrial cancer cells with SOE caused proliferation of cells arrested at G2/M phase, and apoptosis induced by up-regulating the pro-apoptotic genes while down-regulating the anti-apoptotic protein expression [
19]. In addition, under the stimulation of transforming growth factor β1 (TGFβ1), SOE could effectively inhibit the migration and invasion of RL95-2 and HEC-1A endometrial cancer cells [
20].
The objective of this study was to employ an allogeneic HCC mouse model for validating the inhibitory impact of SOE on tumor growth and metastasis in vivo, and to investigate the related effects of SOE on the antioxidant system and inflammatory response within tumor tissue.
2. Materials and Methods
2.1. Preparation of SOE
S. orientalis plant was purchased from a local store (Yuanshan Herbal Medicine Store, Kaohsiung City, Taiwan). Its nucleotide sequence was detected and compared with the NCBI DNA database, and it was confirmed to be
S. orientalis [
22]. The dried aerial parts of
S. orientalis were ground into powder with a sieve plate with a pore size of 0.5 mesh. The powder was extracted with 95% ethanol for 24 h and repeated 2 more times. The extracts were then pooled and filtered with a Buchner funnel filter. The ethanol extract solution was collected, concentrated under reduced pressure with Rotary Vacuum Evaporator (Panchum Scientific, Kaohsiung City, Taiwan) to remove ethanol, and dried by a freeze-dryer (Panchum Scientific). The freeze-dried product was stored in a −20°C refrigerator for later use. The extraction rate was 5.26%.
2.2. Administration of Experimental Animals
The protocol of the present animal experimental procedures has been approved by the Institutional Animal Care and Use Committee of I-Shou University (AUP-109-43-05). All experiments were conducted following the guidelines and regulations of the local and central government. Three-week-old male mice of C57BL/6JNarl strain (about 9−12 g in weight) were purchased from the National Laboratory Animal Center (Nangang District, Taipei City, Taiwan). The rearing conditions were automatic control of light (12-h light-dark cycle), room temperature (maintained at 25°C), and relative humidity (55%). Mice were provided free access with a certified rodent diet and the water was purified using reverse osmosis.
2.3. Experimental Design
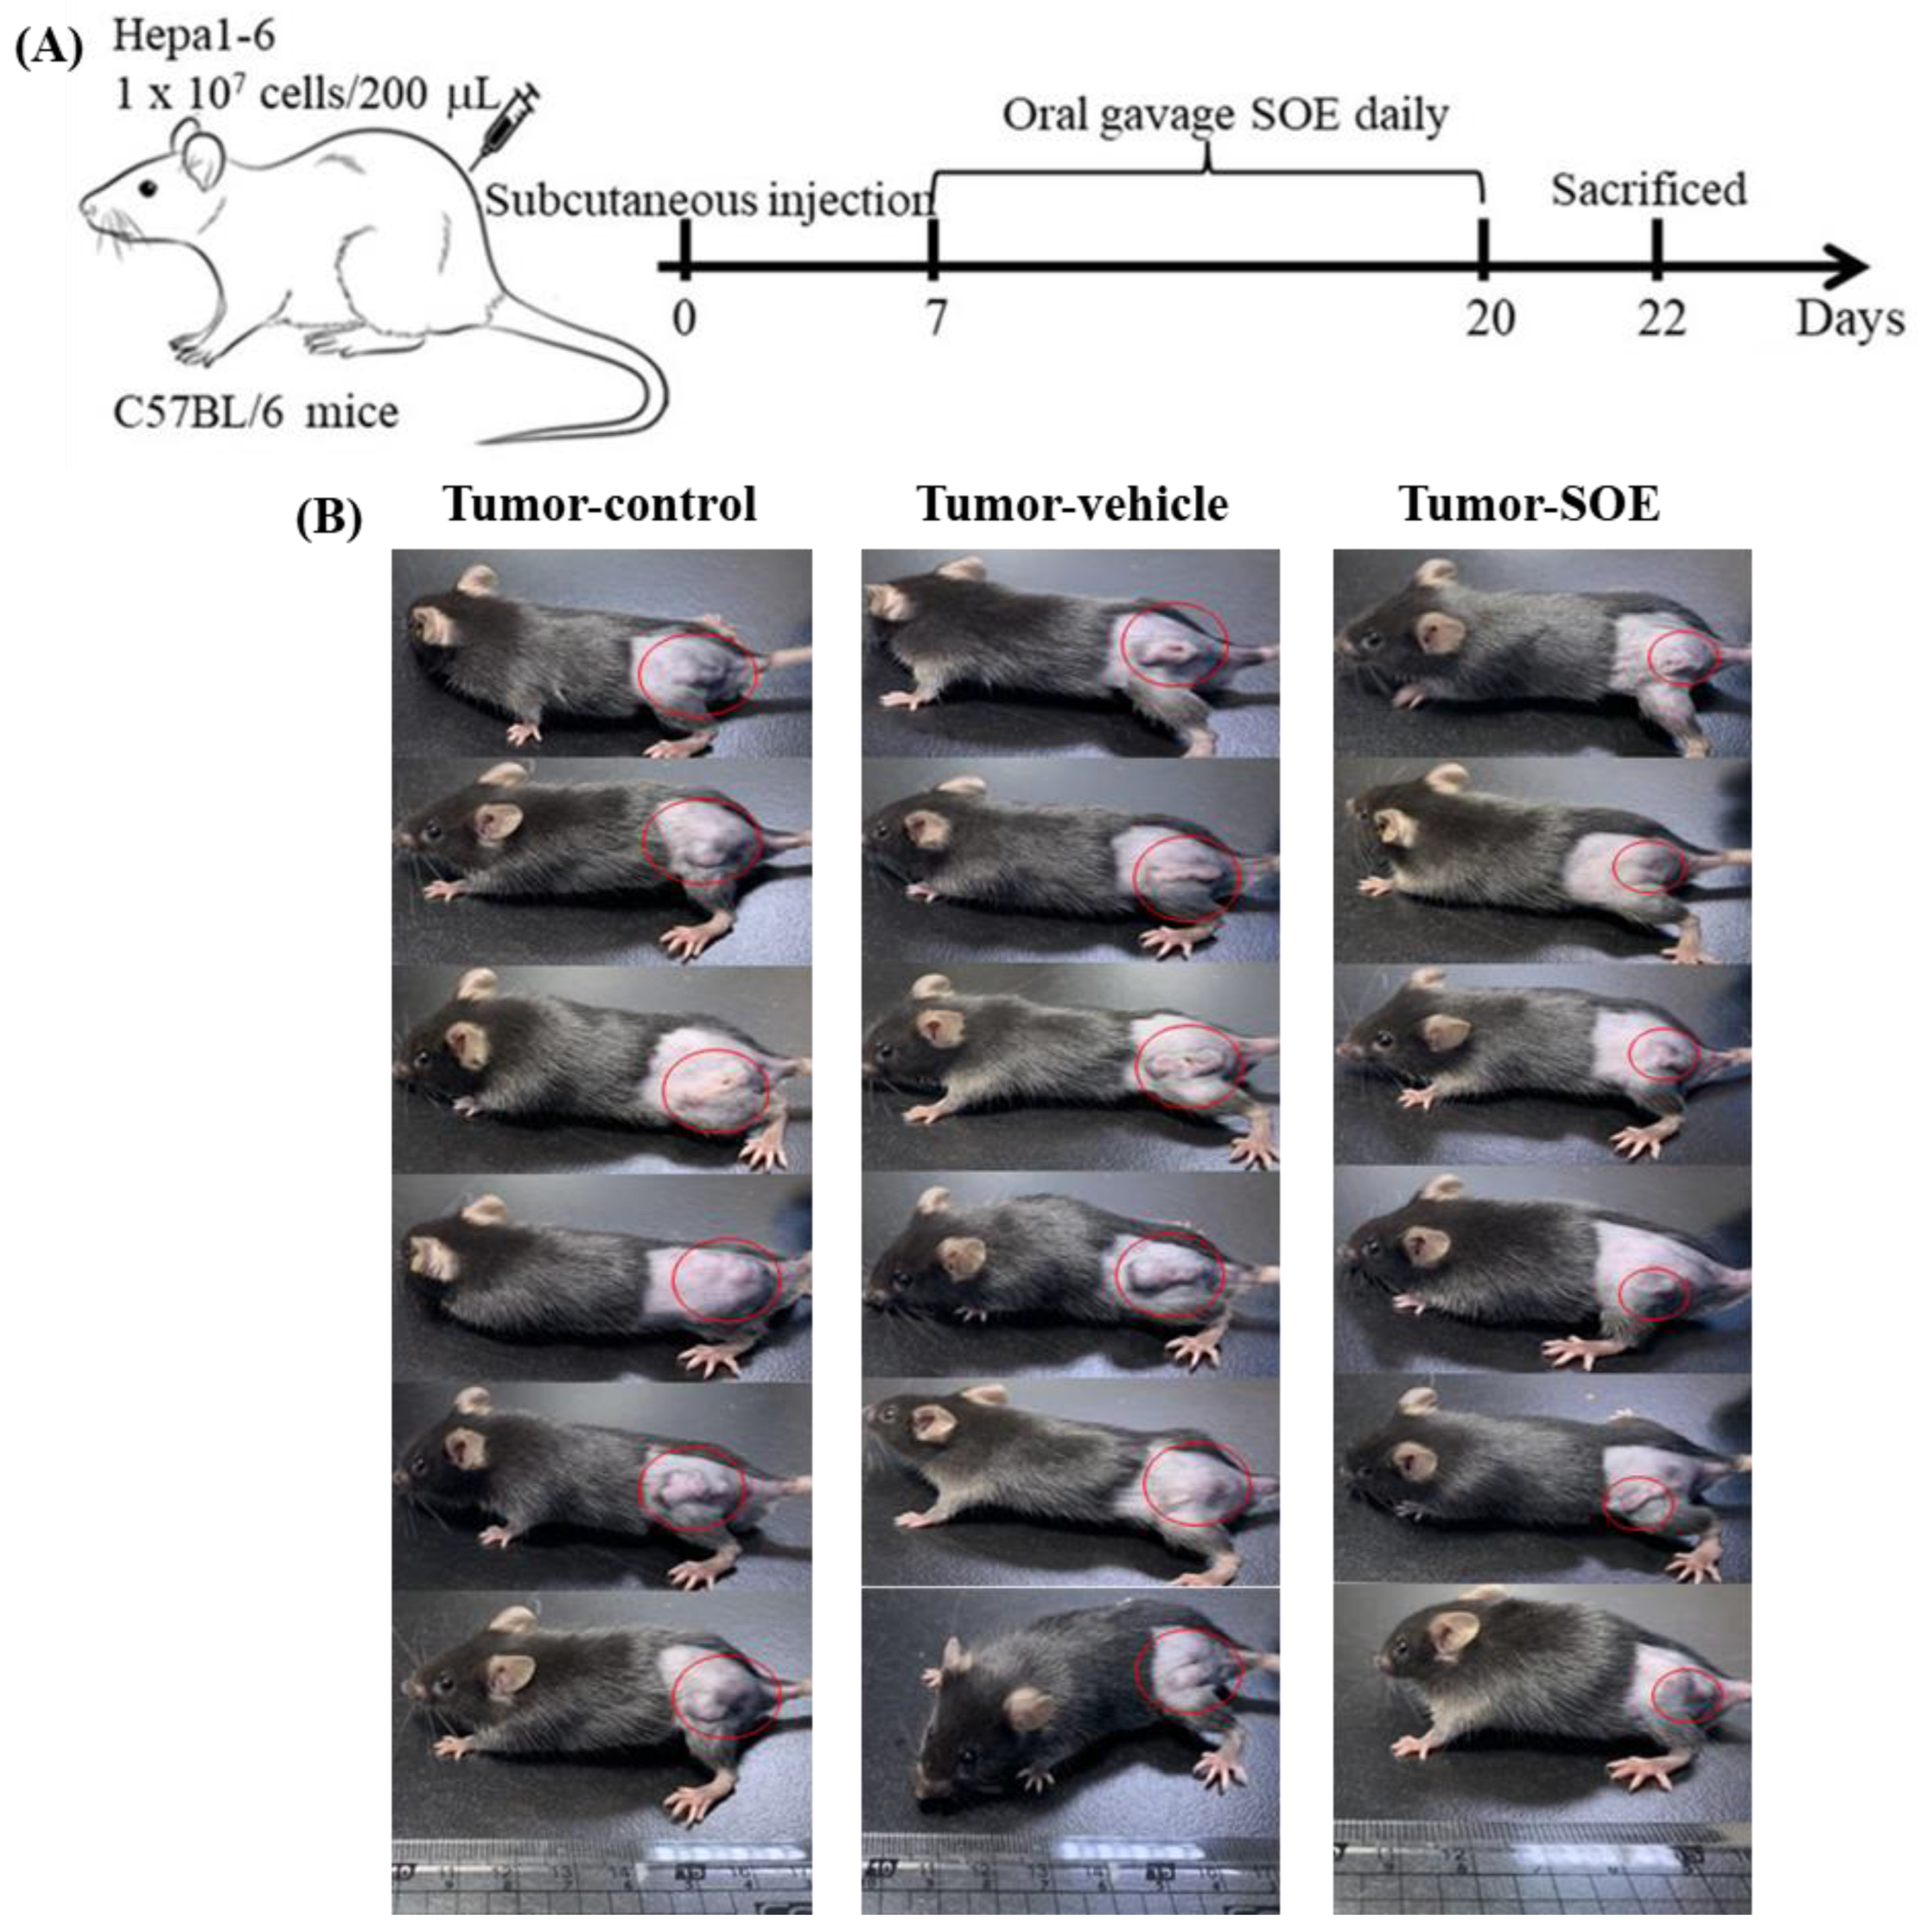
After a one-week adaptation period, dietary intervention was started. The experiment was divided into the following 4 groups, each group randomly selected 6 mice:
(1) Control group: Untransplanted liver cancer cells and normal diet.
(2) Tumor-control group: Transplanted liver cancer cells and normal diet.
(3) Tumor-vehicle group: Transplanted liver cancer cells for 1 week, then fed 5% ethanol (1 mL/kg BW) once daily for 2 weeks.
(4) Tumor-SOE group: Transplanted liver cancer cells for 1 week, then fed SOE (25 mg/kg BW) once daily for 2 weeks.
For cancer cell transplantation, Hepa1-6 murine hepatoma cells (at a density of 1×10⁷ cells/mL) were injected subcutaneously in the back of the mice. In order to avoid individual differences in feeding dose (25 mg/kg), the vehicle (ethanol) and SOE were orally gavaged using a dedicated tube. After 2 weeks of feeding, all mice were sacrificed, and the blood, tumor, liver and kidney were collected for analysis.
2.4. Hematoxylin and Eosin Stain
The collected tumor tissues were washed with phosphate buffered saline (PBS, pH 7.4) for 20 min, fixed in 4% neutral buffered formalin (Sigma-Aldrich Chemicals, St. Louis, MO, USA) for 4 h, embedded in paraffin blocks, sectioned to 4-μm slices, and air-dried on a glass slide. Thereafter, used xylene and ethanol to remove paraffin. Slides were first stained with Harris hematoxylin solution (Sigma-Aldrich) for 10 min, washed with water until colorless. The slides were then stained with eosin solution (J.T. Baker, Phillipsburg, NJ, USA) for 3 min, and used xylene to remove paraffin and make slide transparent. After mounting, the image of the tissues was observed with an optical microscope equipped with camera (model Ckx41, Olympus, Japan).
2.5. Assay of ROS Content in Tumor Tissue
The ROS content was analyzed by dichlorofluorescin assay kit (Sigma-Aldrich). The tumor tissue was minced and homogenized by lysis buffer. After centrifugation at 67,000 ×g for 20 min at 4°C, the supernatant was taken for ROS content determination. A PBS solution containing 10 μM 2´,7´-dichlorofluorescin diacetate was added to react for 1 h. The ROS content was then determined by fluorescence with excitation at 502 nm and emission at 524 nm in an ELISA reader (SynergyTM 2, BioTek, Winooski, VT, USA).
2.6. Gene Expression in Hepatoma Tissue
mRNA was extracted from mouse tumor tissue using the Qiagen RNeasy kit (Qiagen, Venlo, The Netherlands). The mRNA was reverse transcribed into cDNA using the Magic RT cDNA Synthesis Kit (Bio-Genesis, Taipei, Taiwan). The obtained cDNA fragments were then amplified in a Fast Dx Real-Time PCR Instrument (Model 7500, Applied Biosystems, Foster City, CA, USA) using the IQ2 SYBR Green Fast qPCR Synthesis Master Mix LOW ROX kit (Bio-Genesis).
Table 1 lists various primers used in RT-qPCR gene amplification operations. GAPDH mRNA was used as an internal control for quantification. The operating conditions of the gene amplification reaction are as follows: the first stage was 50°C for 2 min, the second stage was 95°C for 10 min, the third stage was 95°C for 15 sec, and then kept at 60°C for 1 min. A total of 40 cycles were executed in the third stage. The iQ5 Optical System software (version 2.0, Bio-Rad, California, CA, USA) was applied to quantify the obtained data.
2.7. Protein Expression in Hepatoma Tissue
The expression of related proteins was detected by Western blot. Briefly, after measuring the protein concentration of the homogenized and centrifuged tumor tissue supernatant, the protein was denatured by heating at 95°C for 5 min, and then electrophoresis was performed. Took out the SDS-PAGE gel and then transferred onto a polyvinylidene difluoride (PVDF) membrane (Bio-Rad). Subsequently, the primary antibody was added for reaction, followed by hybridization with horseradish peroxidase-conjugated secondary antibody. All the antibodies used were from Sigma-Aldrich (
Table 2). Finally, protein expression was detected using the ChemiDoc XRS+ System (Bio-Rad) with the aid of enhanced chemiluminescence (ECL) and Western blot detection reagents (Amersham Bioscience, Uppsala, Sweden).
2.8. Analysis of Pro-Inflammatory Cytokine Content
Blood was collected by cardiac puncture before the mice were sacrificed. After the blood was centrifuged, the supernatant was the mouse serum sample. The content of pro-inflammatory cytokines TNF-α, IL-1β, and IL-6 in tumor tissue supernatant and mouse serum was measured using the BD OptEIATM Sets (BD Biosciences Pharmingen, San Diego, CA, USA). Added 100 μL capture Ab (anti-mouse monoclonal antibodies) to the 96-well plate and placed it at 4°C overnight. After washing with wash buffer, 200 μL assay diluent were added and incubated at room temperature for 1 h. After washing, 100 μL of tumor tissue homogenate or serum sample were added to react at room temperature for 2 h. After washing, added 100 μL working detector (1:500 detection antibody and 1:250 enzyme reagent) and reacted at room temperature for 1 h. After washing, 50 μL substrate solution was added to react at room temperature for 30 min. Finally, 50 μL stop solution were added, and the absorbance value was measured at a wavelength of 450 nm with an ELISA reader. The data were calculated according to the cytokine concentration standard curve.
2.9. Analysis of Chemical Composition
The content of main phenolic components contained in SOE was determined by high-performance liquid chromatography (HPLC, Shimadzu, Kyoto, Japan). Analytical column was a C18 column (250 mm × 4.6 mm, 5 μm; Supelco, Bellefonte, PA, USA). Mobile phase was acetonitrile (solvent A) and 0.1% acetic acid solution (solvent B), elution was carried out in a programmed gradient with steps of 0–18 min: 12–14% A, 18–22 min: 14–17% A, 22–50 min: 17–20% A, and 50–80 min: 20–35% A. The flow rate of the mobile phase was 1.0 mL/min, the sample injection volume was 30 μL, and the detection was performed at a wavelength of 320 nm. The five phenolic components were compared and identified with commercially available reference compounds (Sigma-Aldrich). Their content in the extract was estimated by interpolation from the standard curve of concentration vs integral area prepared by the respective commercially available reference compounds.
2.10. Statistical Analysis
The experimental results were based on data obtained from 6 mice in each group, expressed as arithmetic means ± standard deviation (SD). The significance of data difference between each group was evaluated by one-way analysis of variance (ANOVA) and Duncan’s multiple range test, and expressed by *p < 0.05, **p < 0.01, and ***p < 0.001. Statistical calculations were performed using SPSS 25.0 software (SPSS Inc., Chicago, IL, USA).
4. Discussion
Some Chinese herbal medicines have been shown to possess the curative effects of delaying the progression of liver tumors, preventing recurrence and metastasis, relieving clinical discomfort, increasing immune function, improving quality of life, and prolonging the life span of cancer patients [
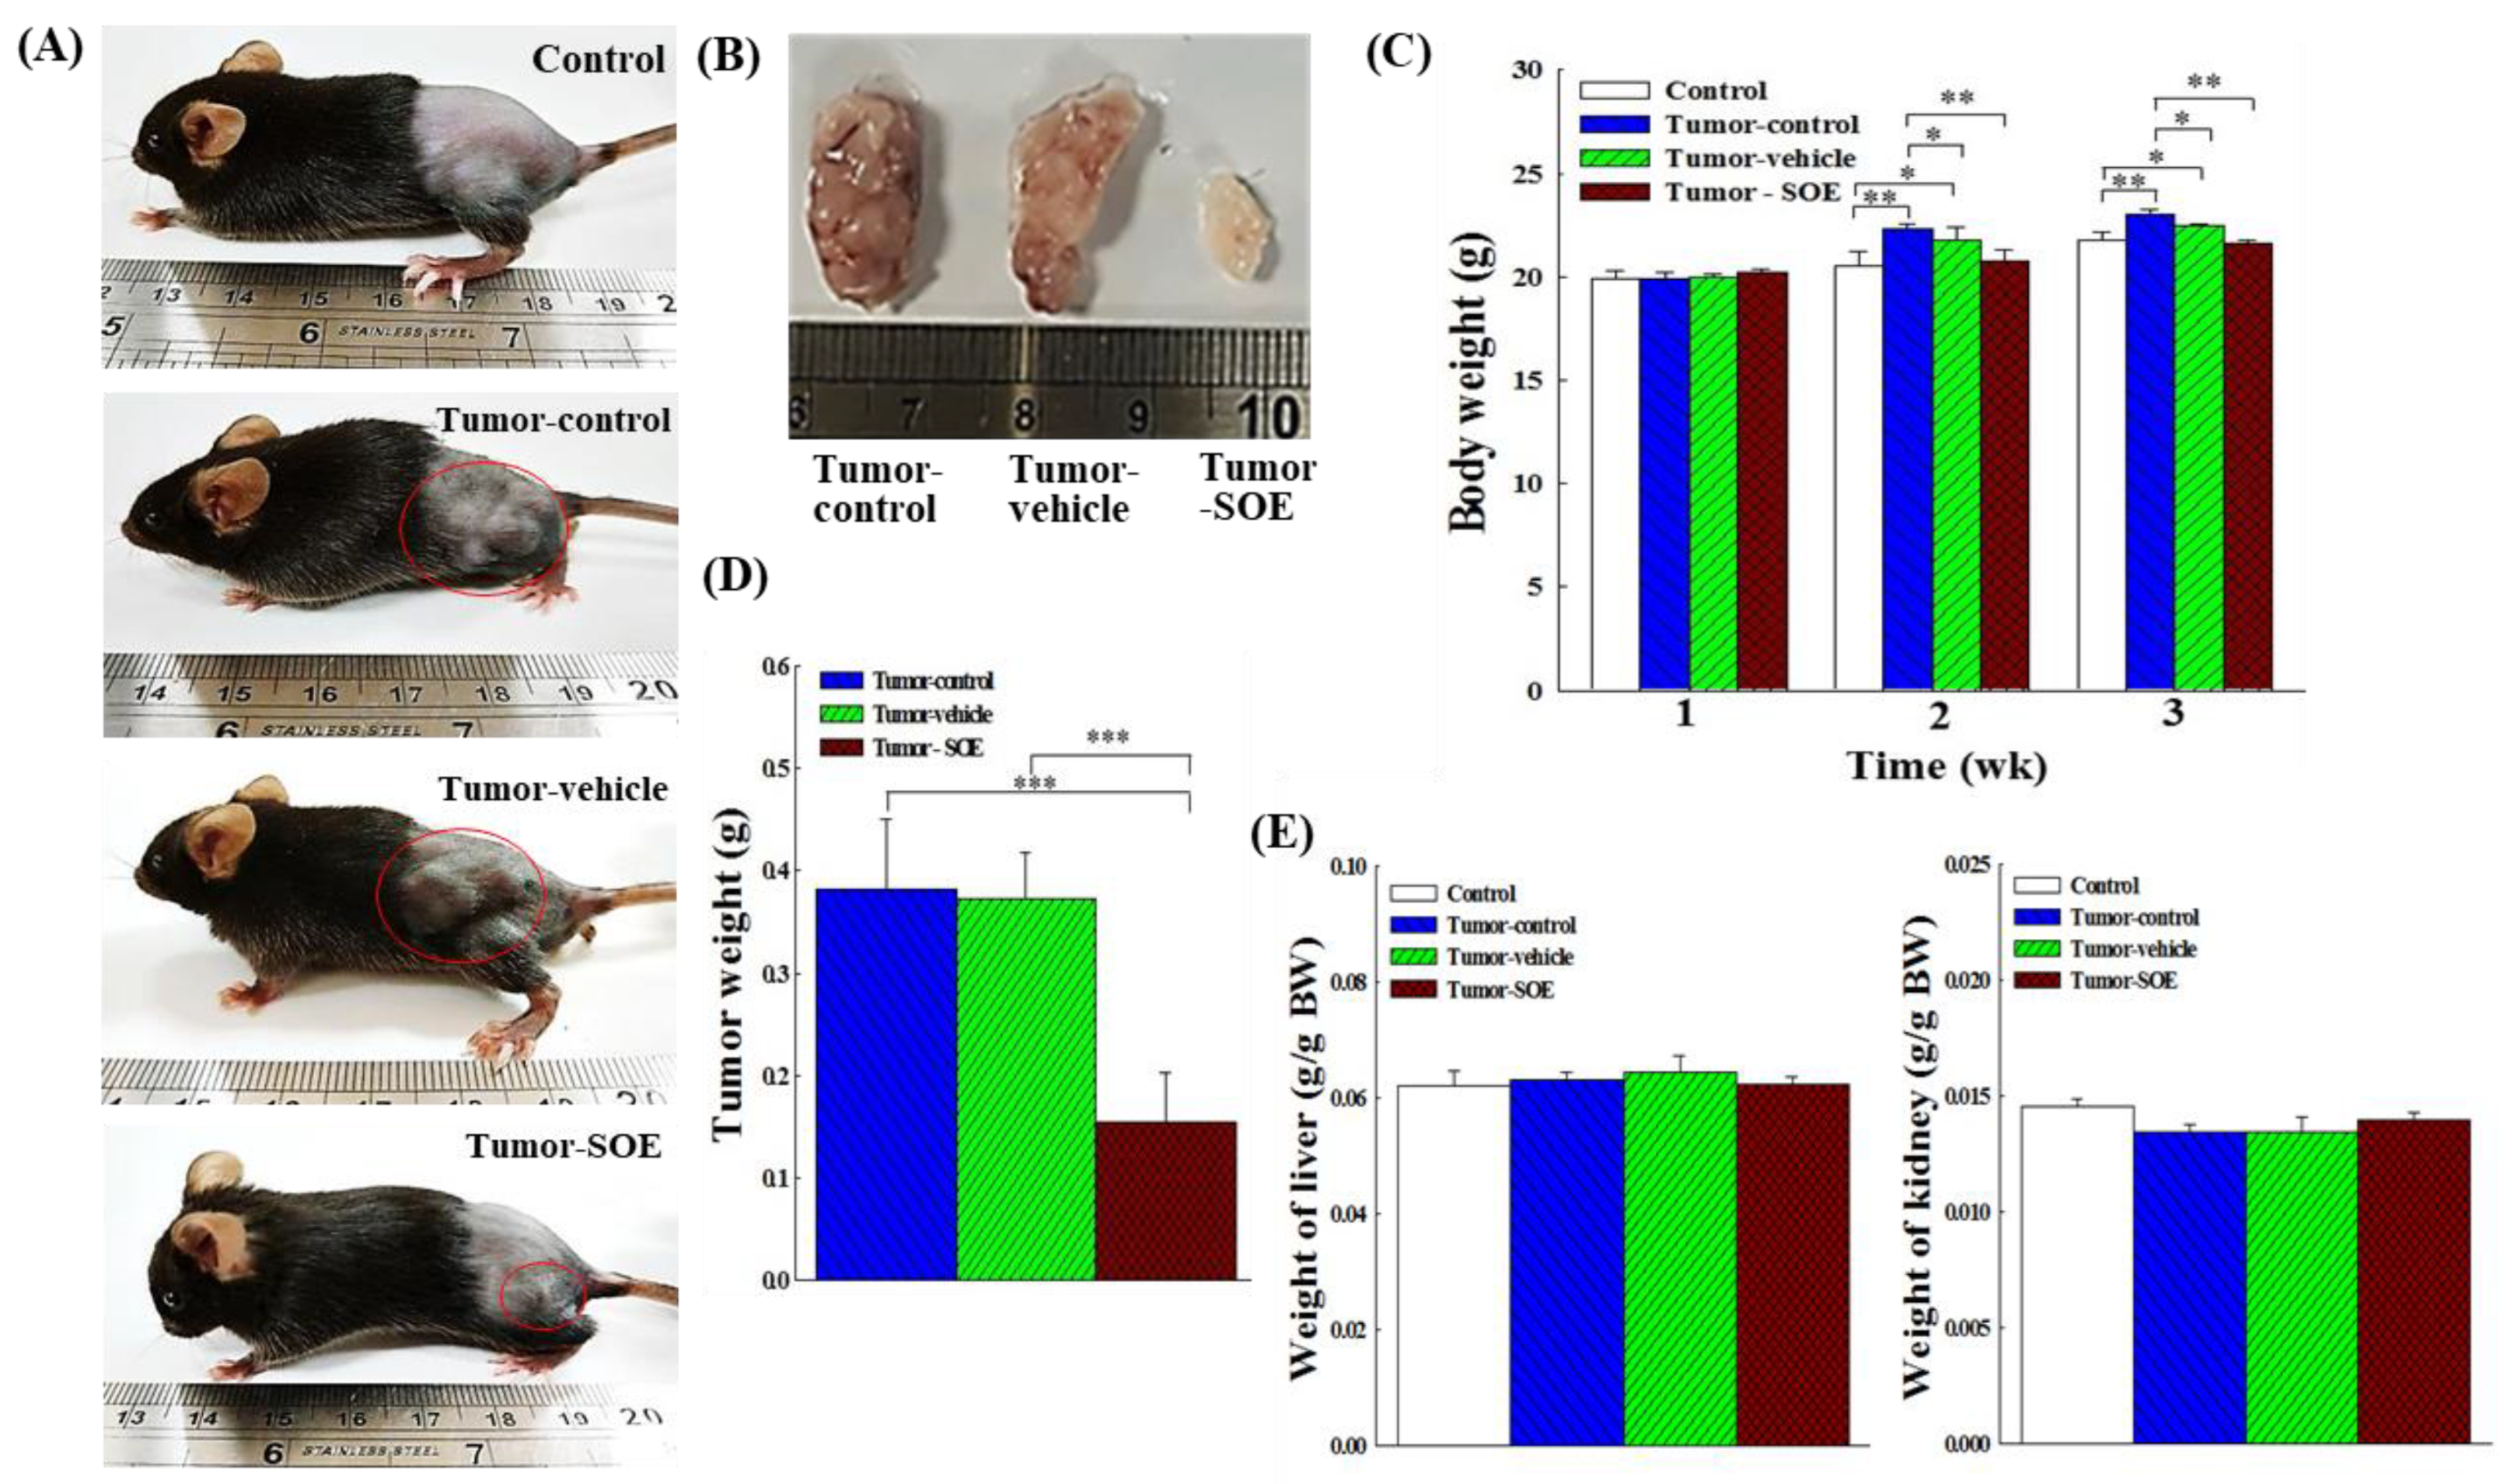
16]. This study examined the inhibitory effect of SOE on the development of liver tumors in mice, and the mechanism underlying this effect. The dose of 25 mg SOE/kg BW was used to feed liver tumor-bearing mice for 14 days, and tumor weight was reduced by a mean of 59.7% (
Figure 2D), implying that SOE intervention can indeed inhibit the growth of tumors in mice.
It is known that Bcl-2 protein family regulates pro-apoptotic and anti-apoptotic members, and Bcl-2 is an important anti-apoptotic gene [
26,
27]. Results in our previous
in vitro study have shown that SOE can reduce the protein expression of Bcl-2 and Bcl-xL, and promote the production of caspases, Bad, Bak and Bax and induce apoptosis in RL95-2 human endometrial cancer cells [
19]. The experimental results of this
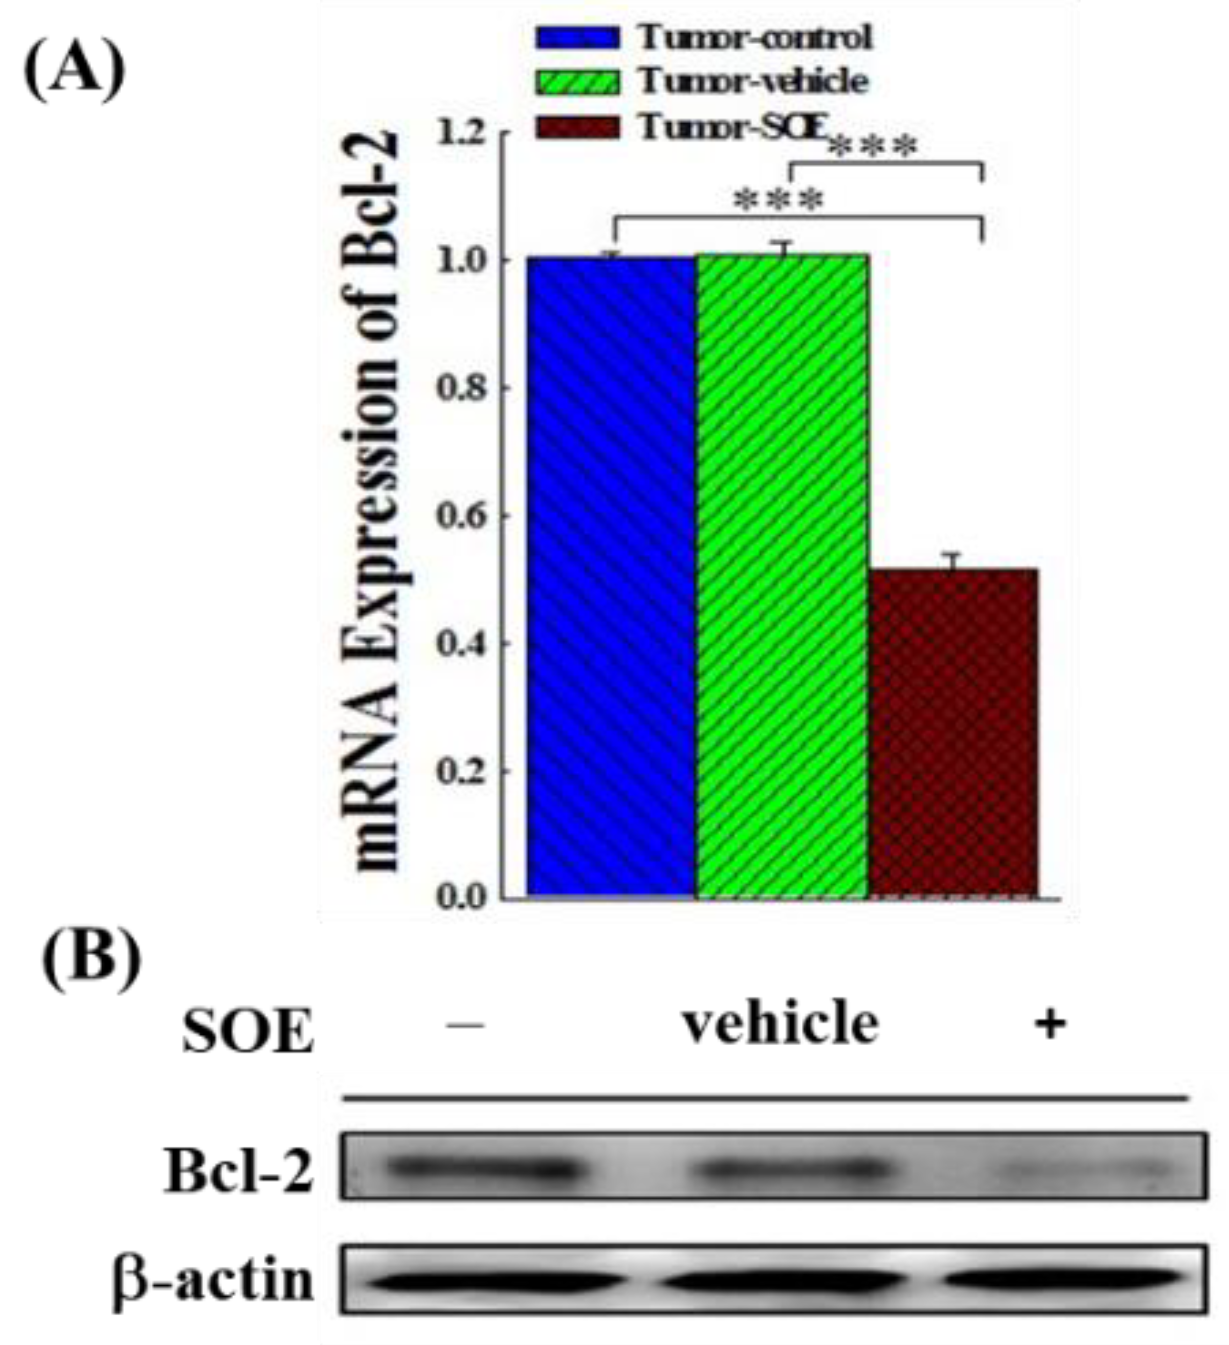
in vivo study showed that SOE intervention could significantly reduce the expression of Bcl-2 gene and protein in the tumor tissue of tumor-bearing mice (
Figure 3A and 3B), indicating that SOE feeding can promote the apoptosis of cancer cells in the tumor tissue of mice.
Oxidative stress, with ROS as an indicator, has different effects on the progression of cancer cells. Some studies have pointed out that even a small amount of ROS can promote the early development of cancer, such as proliferation, differentiation and migration. On the other hand, a large amount of ROS generated by chemotherapy or radiotherapy in the stage of cancer treatment would cause the oxidative stress by stimulating the apoptosis signaling pathway, and effectively inhibit the development of tumor [
3,
4,
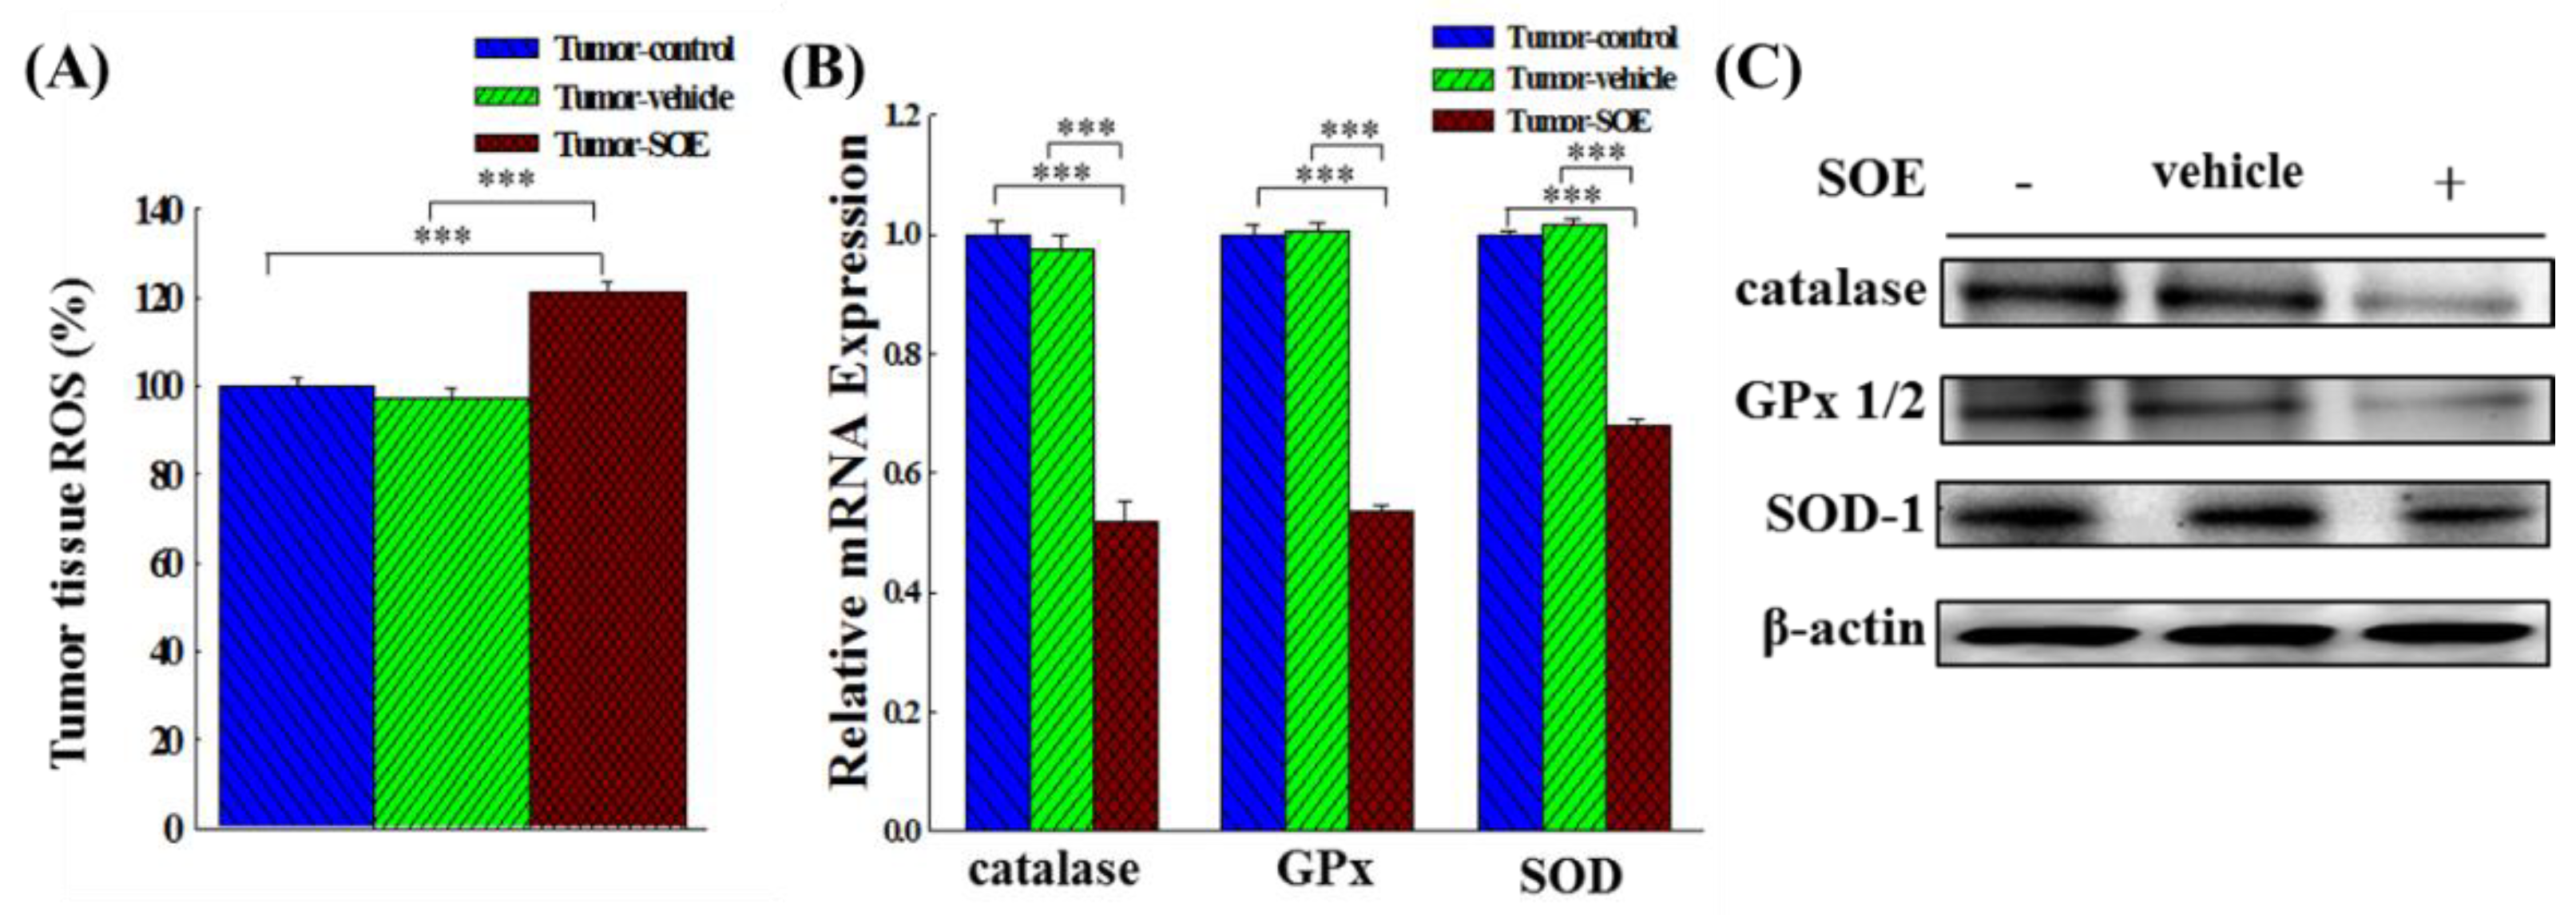
5]. Results in this study are in consistence with these findings that SOE intervention increased the ROS content in the tumor tissue by around 21.4% (
Figure 4A), decreased the Bcl-2 gene expression by 48.5% (
Figure 3A), and reduced the tumor weight by 59.7% (
Figure 2D). Our results show that SOE intervention can inhibit tumor growth by increasing the ROS content in tumor tissue.
When ROS accumulate, in order to maintain redox homeostasis, cancer cells generally enhance their antioxidant system. In this instance, the activities of SOD, GPx, catalase, ascorbate peroxidase, glutathione peroxidase, glutathione reductase were all elevated in order to exclude ROS and reduce the toxicity produced by ROS, thereby decreasing the efficacy of cancer treatments. In response to this, new cancer therapies have been developed. By changing the redox homeostasis and blocking the DNA synthesis in cancer cells
via inducing the generation of ROS and inhibiting the antioxidant system through mitochondria, this process can trigger apoptosis or autophagic death of cancer cells [
3,
6,
28]. In this study, we found that SOE intervention could reduce the gene and protein expression of SOD, GPx, and catalase in the tumor tissue of tumor-bearing mice (
Figure 4B and 4C), which is in line with the idea behind the above-mentioned new cancer treatment method.
Malignant tumors often form blood vessels or lymphatic networks through angiogenesis to provide nutrition, promote tumor growth, and enter the circulatory system
via tumor metastasis. The greater the density of new blood vessels in the tumor, the greater the chance of cancer cells will escape and metastasize [
29]. Studies have shown that many plant extracts or components have the ability to inhibit the proliferation of blood vessels in tumor tissue [
30,
31]. In this study using the H&E staining analysis, we showed that there was less neovascularization in the tumor tissue of mice fed with SOE, indicating that SOE has the ability to suppress angiogenesis (
Figure 5A−5C). To the best of our knowledge, this is the first report to show the anti-angiogenic effects of
S. orientalis. More studies are required to further explore this beneficial effect.
It is known that Wnt/β-catenin signaling pathway is closely related to angiogenesis, stem cell differentiation and embryonic development. β-Catenin is the core of the Wnt signaling pathway and involved in regulating the transcription of multiple target genes downstream of Wnt, such as MMPs, c-myc, cyclin D1 and vimentin, thereby mediating cell proliferation, apoptosis, migration and invasion [
11,
12]. MMP-2, -7 and -9 have been shown to be involved in the regulation of migration and invasion of liver cancer cells, and MMP-9 also plays regulatory roles in angiogenesis [
32]. SOE has been reported to effectively suppress the expression of MMP-2, -9 and u-PA, thereby inhibit the migration and invasion of RL95-2 endometrial cancer cells [
20]. In this
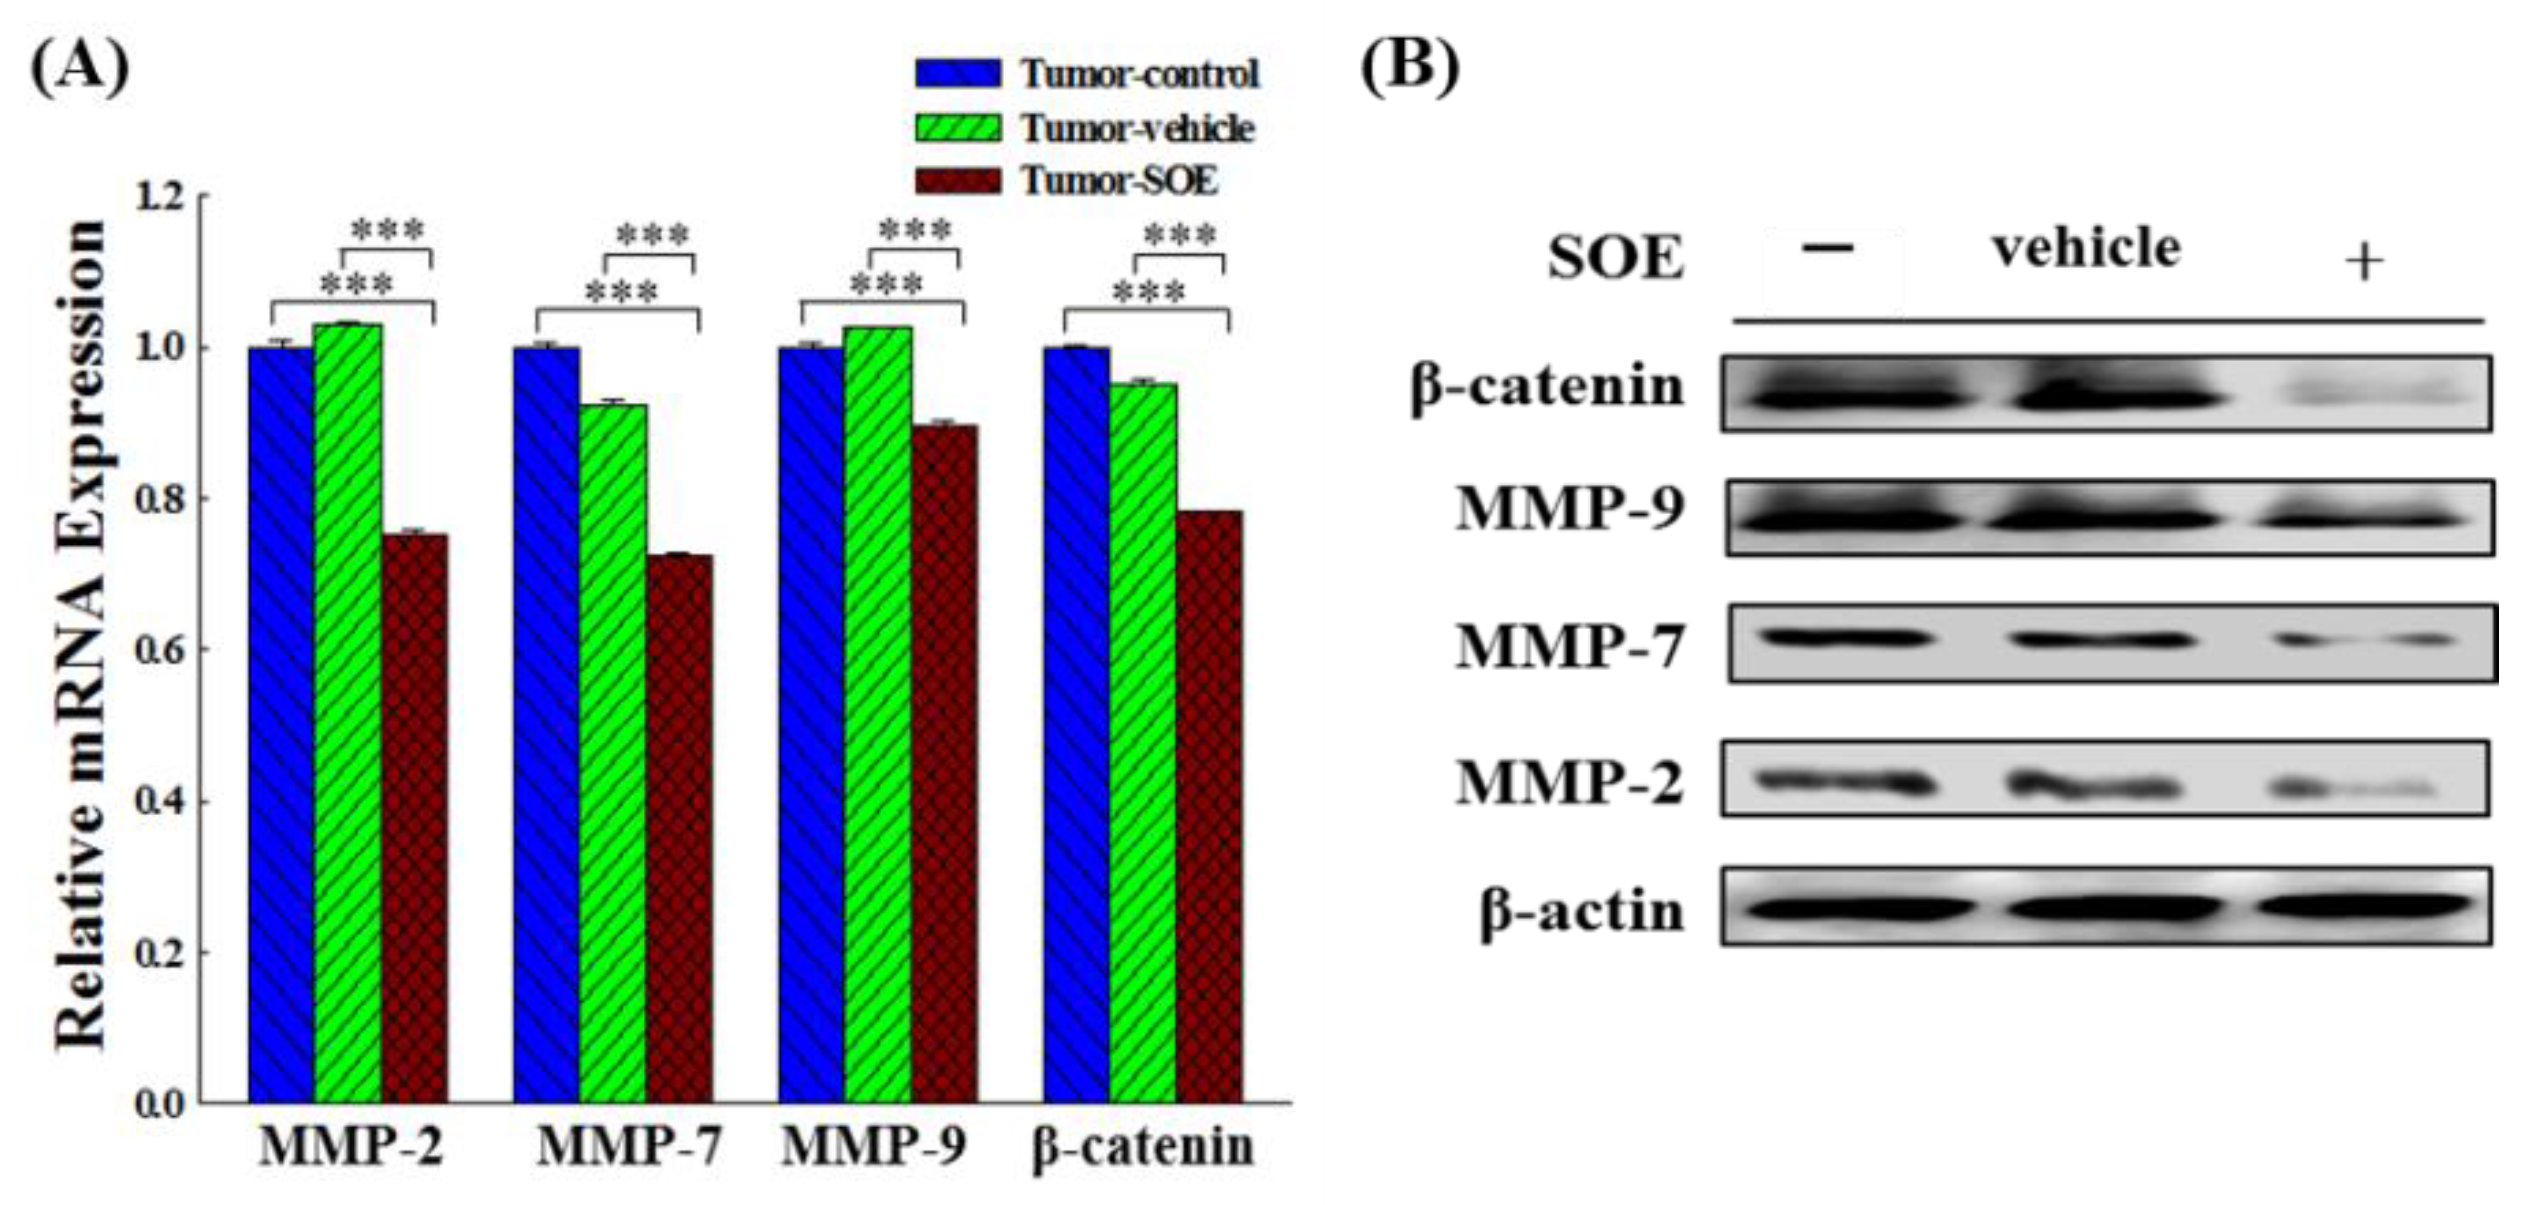
in vivo study we confirmed that SOE feeding could significantly reduce the protein and gene expression of β-catenin, MMP-2, -7 and -9 in the tumor tissue of tumor-bearing mice, and SOE indeed has an anti-migration effect on tumor cells (
Figure 6A and 6B).
The duration and extent of inflammation play pivotal roles in influencing treatment response and tumor advancement. Inflammation can either foster or impede tumor progression and might yield contrasting impacts on treatment efficacy. Acute inflammatory responses often induce the maturation of dendritic cell and the presentation of antigen, leading to an immune response that retards tumor development. On the other hand, if a therapy triggers chronic inflammation, it will provide a good microenvironment for tumor proliferation and metastasis, which will promote tumor progression and treatment resistance [
13,
25]. The latest study points out that IL-6 can increase the expression of CD5 on dendritic cells and improve immune checkpoint blockade therapy [
33]. Previous study has reported that SOE has a significant anti-inflammatory effect in the acute inflammation of RAW264.7 murine macrophages induced with lipopolysaccharide (LPS), and in the mouse model induced by 𝜆-carrageenan or LPS [
34].
Systemic inflammation is characterized by a cancer-promoting immune response and is an indicator of poor prognosis in cancer patients. Localized inflammation confined to intra-cancer has been shown to be associated with a better prognosis in a variety of cancers. Increased TNF-α expression in chronic inflammation can induce an intact TNF/TNF receptor (TNFR) complex and activate the NF-κB signaling pathway, thereby further promoting cell survival and tumor growth, while the local acute inflammation caused by TNF-α can induce cancer cell apoptosis and tumor regression [
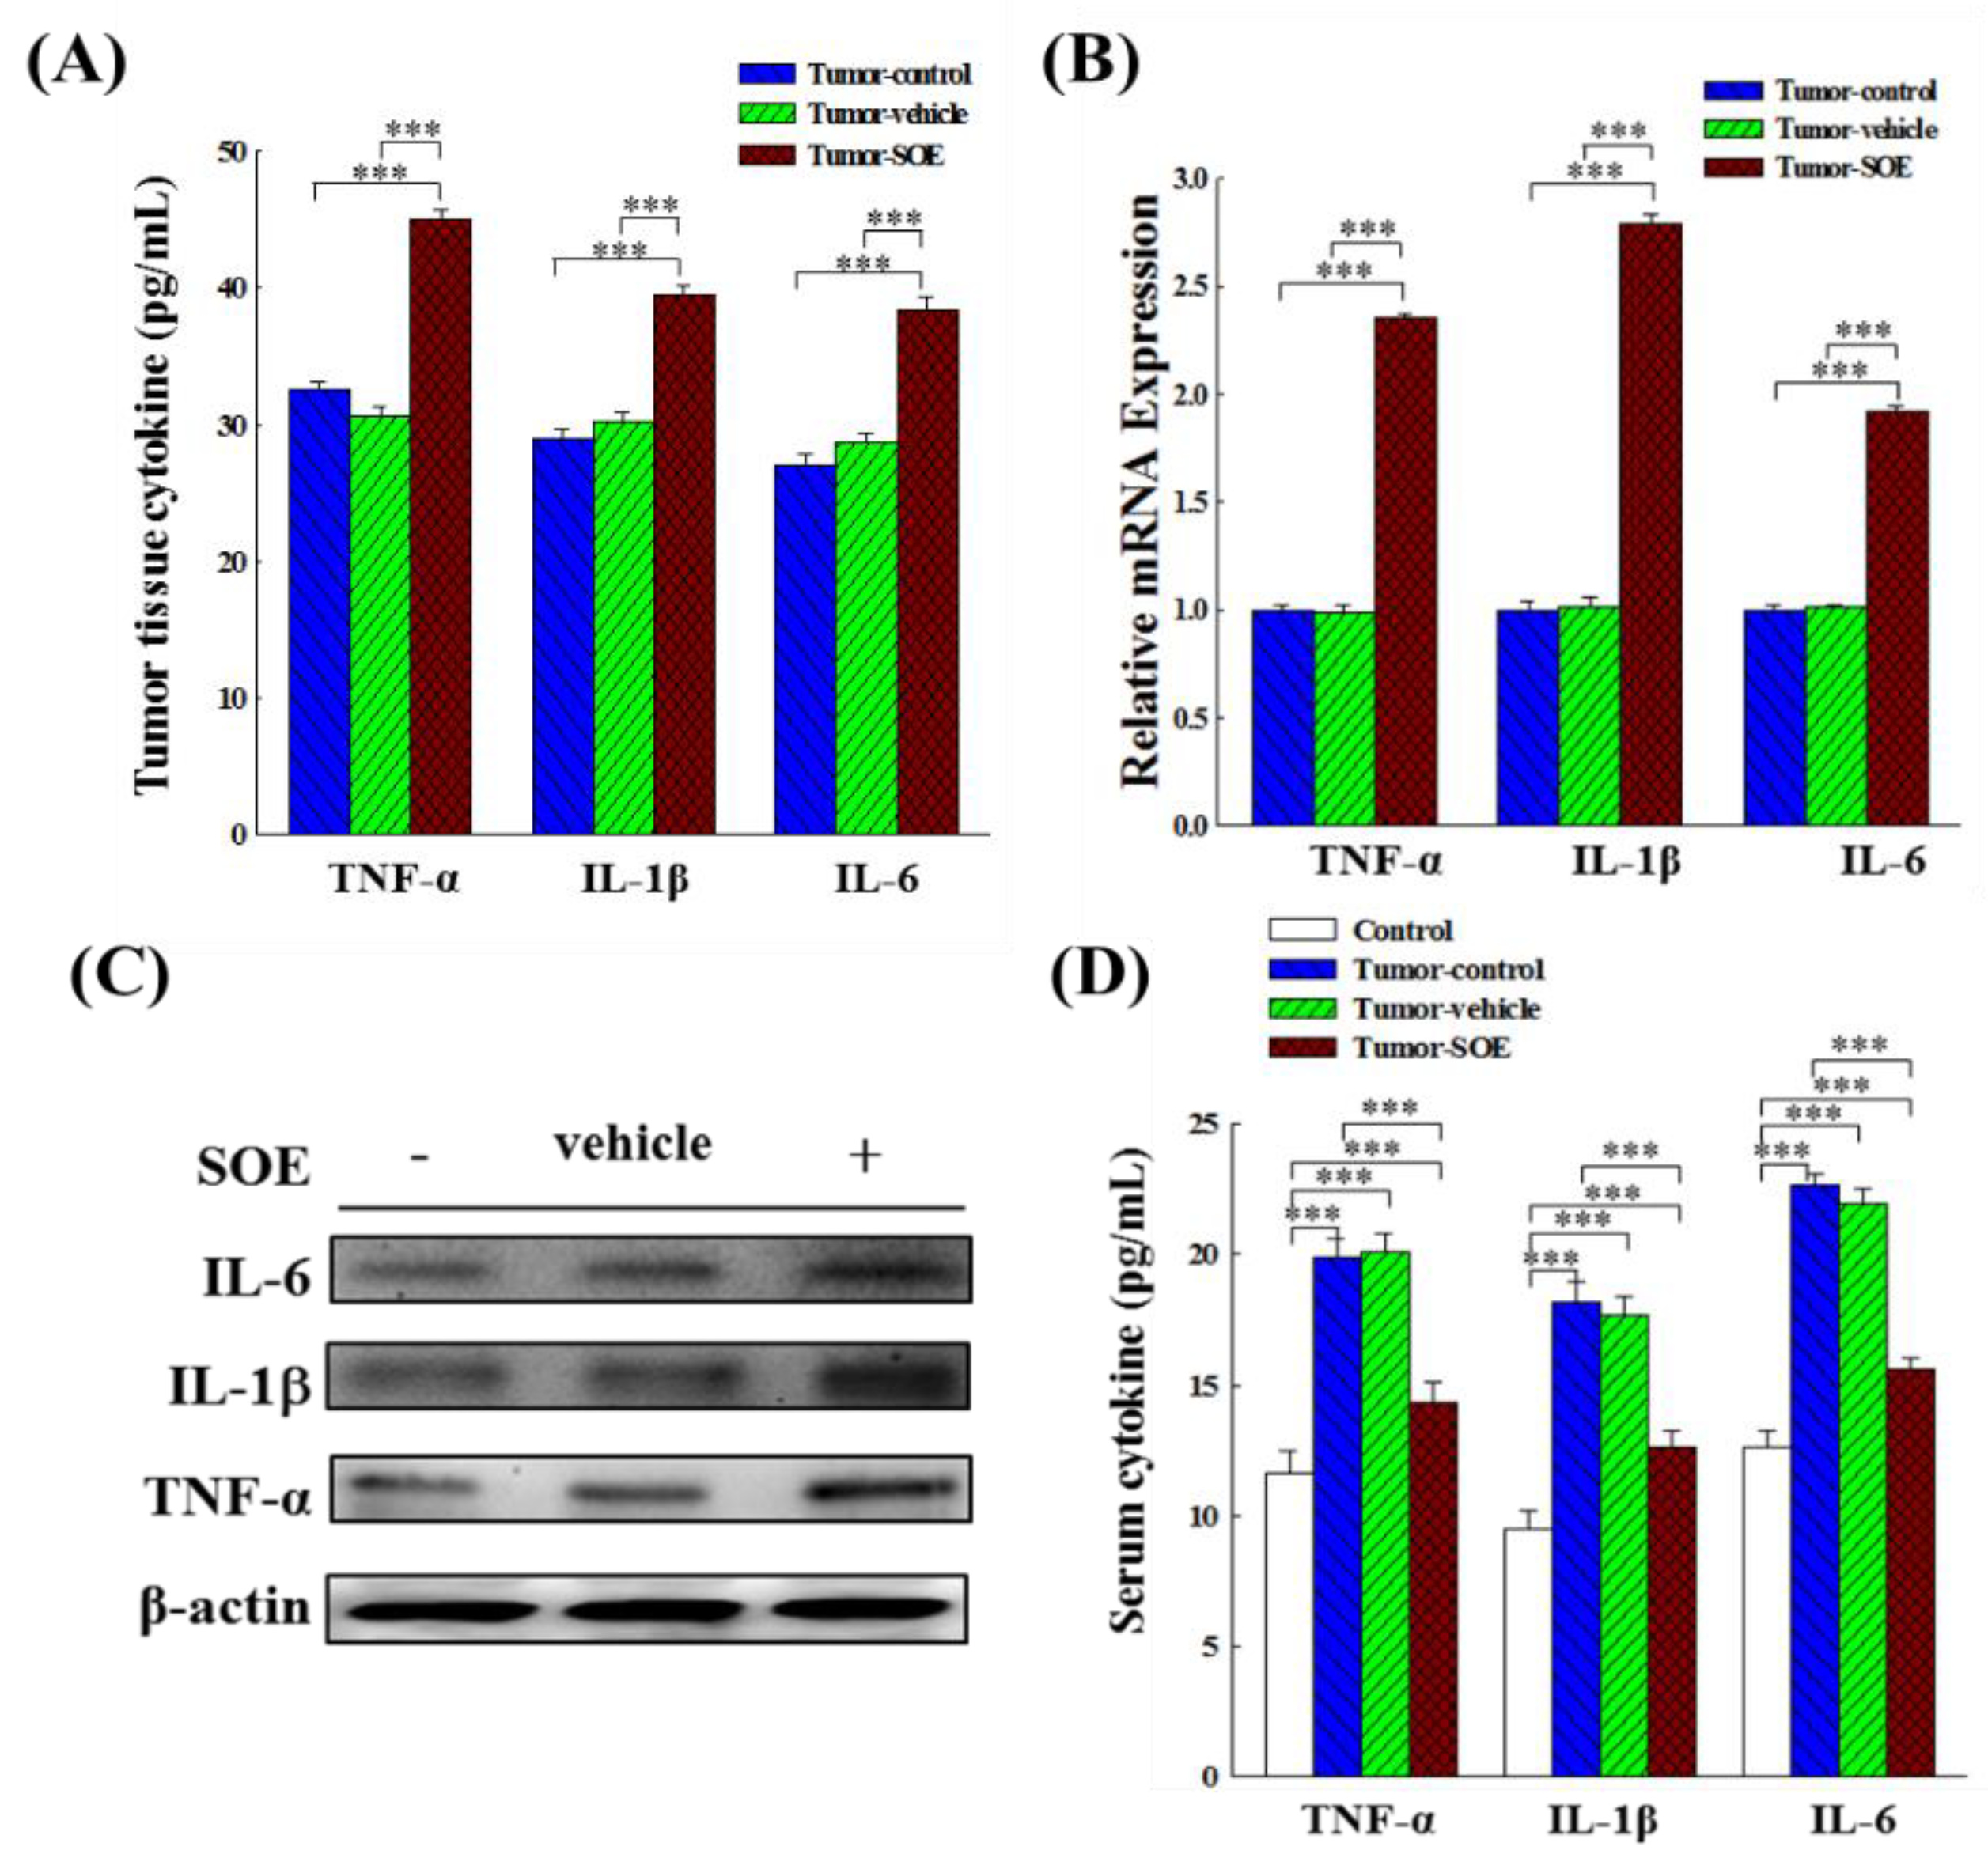
15]. Results in the present study showed that SOE treatment significantly increased the expression and content of TNF-α, IL-1β, and IL-6 in tumor tissues in tumor-bearing mice (
Figure 7A−7C), implying that feeding SOE could induce acute inflammation of liver tumors. On the other hand, the levels of pro-inflammatory cytokines in the serum of mice were lower than those in the tumor control group (
Figure 7D), indicating that SOE could locally enhance the intratumoral inflammatory responses and avoid causing systemic inflammation.
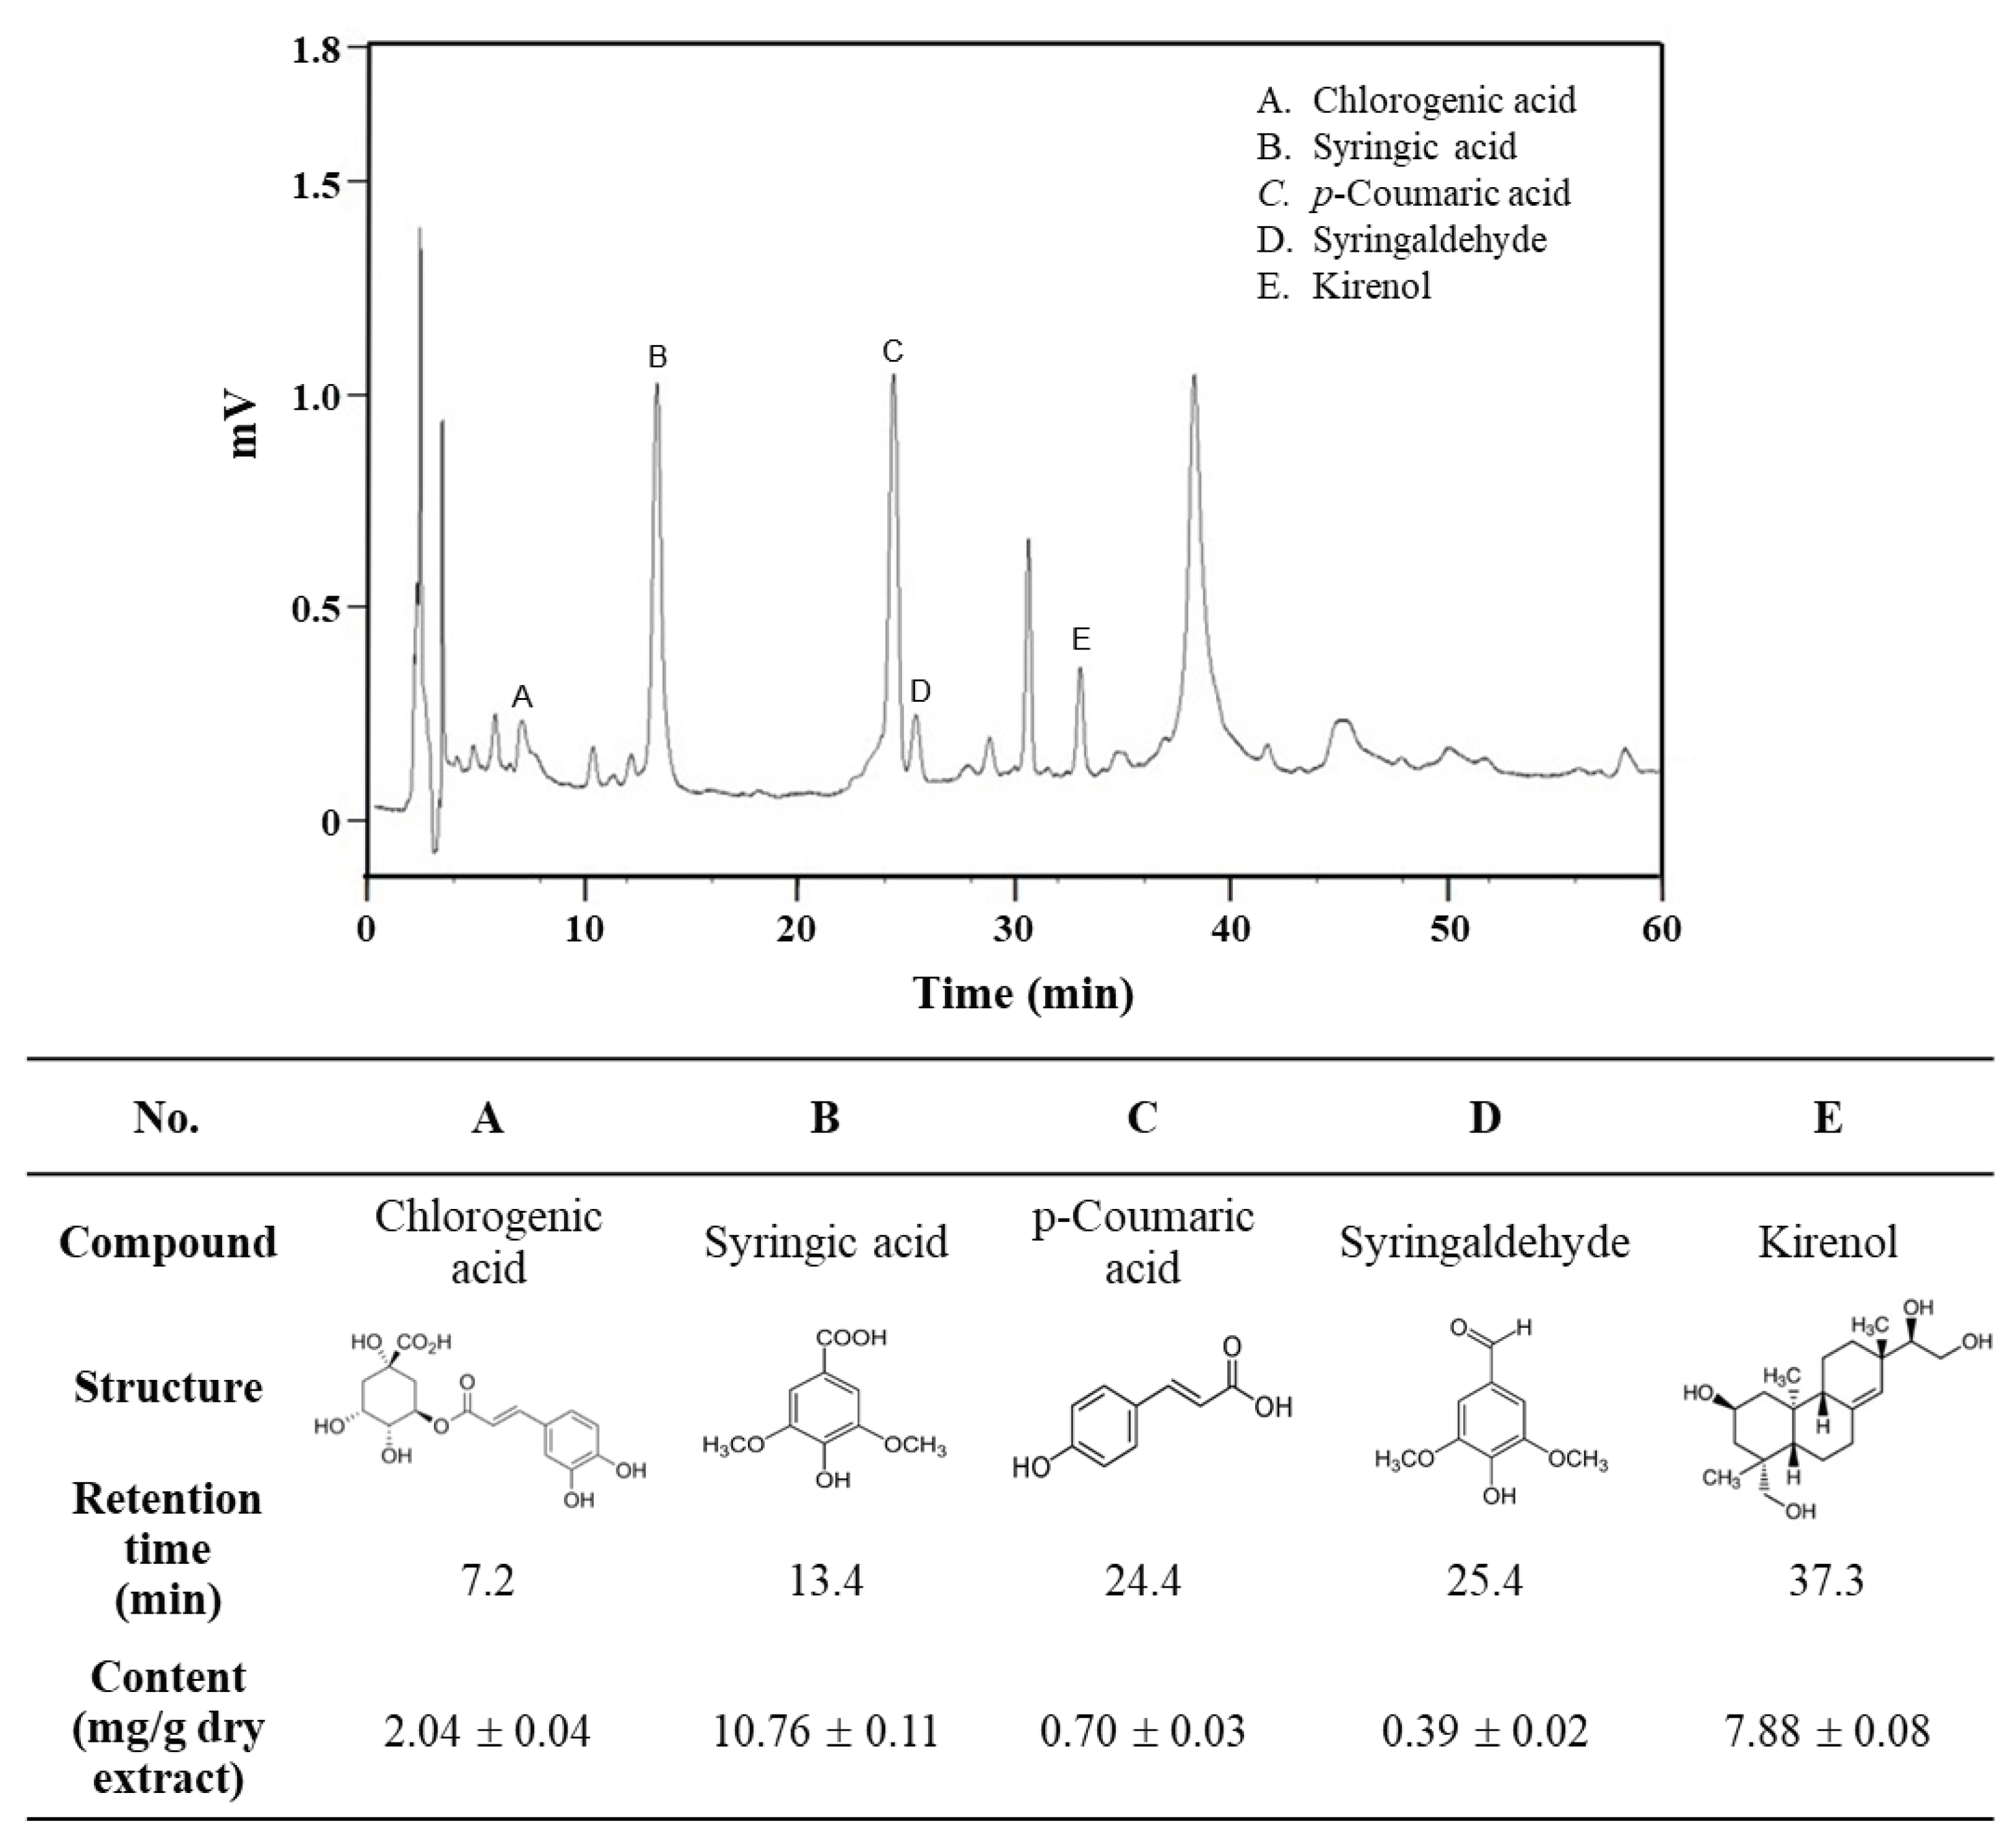
From the HPLC analysis results, the components of SOE were listed in descending order of content as follows: syringic acid > kirenol > chlorogenic acid > p-coumaric acid > syringaldehyde (
Figure 8). It has been reported in the literature that these five ingredients possess anti-cancer properties. Specifically, syringic acid targets glioblastoma, gastric cancer, and ovarian teratoma cancer [
35,
36,
37]; kirenol exhibits efficacy against thyroid cancer, gastric cancer, and myeloid leukemia [
38,
39,
40]; chlorogenic acid shows potential against pancreatic cancer, colorectal cancer, ovarian cancer, and oral squamous carcinoma [
41,
42,
43,
44]; p-coumaric acid demonstrates activity on epidermoid carcinoma, colorectal cancer, osteosarcoma, and glioblastoma [
45,
46,
47,
48]; syringaldehyde is effective against breast cancer [
49]. However, the impact of these ingredients on liver cancer needs further exploration.
Figure 1.
Effect of SOE intervention on tumor growth in vivo. (A) Design of the xenograft experiment. C57BL/6JNarl mice were inoculated with 1×10⁷ Hepa1-6 cells (200 μL). From day 7 to day 20 after inoculation, mice were tube-fed with SOE (25 mg/kg BW) daily, and sacrificed and dissected on day 22. The control group was not transplanted with Hepa1-6 cells. The mice in the tumor-control group were transplanted with Hepa1-6 cells. The Tumor-vehicle group received Hepa1-6 cells transplanted and oral gavaged with the SOE solvent (5% ethanol, 1 mL/kg BW) daily from day 7 to day 20. All mice were fed a normal diet. (B) Appearance of tumor-bearing mice before sacrifice: tumor-control group, tumor-vehicle group, and tumor-SOE group, with 6 replicates each.
Figure 2.
Effect of SOE intervention on tumor growth in vivo. (A) Typical appearance photos of different groups of mice on day 22. (B) Photos of typical tumor size in different groups of mice. (C) Effect of SOE feeding on body weight of mice. (D) Effect of SOE feeding on tumor weight in mice. (E) Effect of SOE feeding on liver weight of tumor-bearing mice. (F) Effect of SOE feeding on kidney weight of tumor-bearing mice. Each group consisted of 6 mice. Data are presented as mean ± standard deviation. The significance levels of the data difference between each group are expressed as *p < 0.05, **p < 0.01 and ***p < 0.001.
Figure 3.
Effects of SOE feeding on Bcl-2 expression in hepatoma tissues of tumor-bearing mice. (A) The expression of Bcl-2 genes analyzed by qRT-PCR. (B) The expression of Bcl-2 proteins analyzed by Western blot. The significance level of the data difference between each group is expressed as ***p < 0.001.
Figure 4.
Effects of SOE feeding on ROS content and antioxidant enzyme (catalase, GPx and SOD) expression in hepatoma tissues of tumor-bearing mice. (A) Analysis of ROS content in tumor-bearing mice by ELISA. (B) The expression of antioxidant enzyme genes analyzed by qRT-PCR. (C) The expression of antioxidant enzyme proteins analyzed by Western blot. The significance level of the data difference between each group is expressed as ***p < 0.001.
Figure 5.
H&E stain pathological manifestations of hepatoma tissue after subcutaneous inoculation of HCC in C57BL/6JNarl mice. (A) Tumor-control group, (B) Tumor-vehicle group, and (C) Tumor-SOE group. The images of the tissues were obtained under an optical microscope (model Ckx41, Olympus, Japan; magnification 200×). The arrow points to the neovascularization.
Figure 6.
Effect of SOE on the gene and protein expression of MMPs and β-catenin in liver tumor tissues of tumor-bearing mice. (A) Gene expression analyzed by qRT-PCR. The significance level of the data difference between each group is expressed as ***p < 0.001. (B) Protein expression analyzed by Western blot.
Figure 7.
Effect of SOE intervention on gene and protein expression of the pro-inflammatory cytokines (TNF-α, IL-1β and IL-6). (A) Analysis of cytokines content in tumor tissues by ELISA kits. (B) Analysis of gene expression in hepatoma tissues by qRT-PCR. (C) Analysis of protein expression in hepatoma tissues by Western blot. (D) Analysis of cytokines content in serum of tumor-bearing mice by ELISA kits. The significance level of the data difference between each group is expressed as ***p < 0.001.
Figure 8.
HPLC chromatogram of main phenolic constituents of SOE. HPLC analysis was performed by a Supelco C18 column with a mobile phase using a gradient of acetonitrile and 0.1% acetic acid with detection at 320 nm. Commercially available reference compounds were used to carry out the comparison and identification of the five ingredients, and their content in the extract was calculated by interpolation from the standard curve prepared by the respective commercially available reference compounds.
Table 1.
The primers used in qRT-PCR assay.
Table 1.
The primers used in qRT-PCR assay.
| Gene |
Sequence |
| Bcl-2 |
5′- CTGAGTACCTGAACCGGCA -3′ |
| |
5′- GAGAAATCAAACAGAGGCCG -3′ |
| Catalase |
5′- GCCATTGCCACAGGAAAGTA -3′ |
| |
5′- CCTTGGTGAGATCGAATGGA -3′ |
| GPx |
5′- CCAAGCTCATCACCTGGTCT -3′ |
| |
5′- TCGATGTCAATGGTCTGGAA -3′ |
| SOD |
5′- TGGCCGATGTGTCTATTGAA -3′ |
| |
5′- CACCTTTGCCCAAGTCATCT -3′ |
| β-Catenin |
5′- ATTGATTCGAAACCTTGCCC -3′ |
| |
5′- AGCTCCAGTACACCCTTCTA -3′ |
| MMP-2 |
5′- AGAACTTCCGATTATCCCATGATGA -3′ |
| |
5′- TGACAGGTCCCAGTGTTGGTG -3′ |
| MMP-7 |
5′- GGCGGAGATGCTCACTTTGAC -3′ |
| |
5′- AATTCATGGGTGGCAGCAAAC -3′ |
| MMP-9 |
5′- GCCCTGGAACTCACACGACA -3′ |
| |
5′- TTGGAAACTCACACGCCAGAAG -3′ |
| IL-6 |
5′- TGGAGTACCATAGCTACCTGGAGT -3′ |
| |
5′- TCCTTAGCCACTCCTTCTGTGACT -3′ |
| IL-1β |
5′- GGTCAAAGGTTTGGAAGCAG -3′ |
| |
5′- TGTGAAATGCCACCTTTTGA -3′ |
| TNF-α |
5′- CAGGTTCTGTCCCTTTCACTCACT -3′ |
| |
5′- GTTCAGTAGACAGAAGAGCGTGGT -3′ |
| GAPDH |
5′- TGCACCACCAACTGCTTAGC -3′ |
| |
5′- GGCATGGACTGTGGTCATGAG -3′ |
Table 2.
The antibodies used in Western blot assay.
Table 2.
The antibodies used in Western blot assay.
| Antibody |
Company |
Commercial Number |
| Catalase |
Sigma-Aldrich |
SAB4503383 |
| GPx 1-2 |
Sigma-Aldrich |
SAB2500468 |
| SOD-1 |
Sigma-Aldrich |
SAB1406464 |
| Bcl-2 |
Sigma-Aldrich |
SAB5701336 |
| β-Catenin |
Sigma-Aldrich |
SAB4500545 |
| MMP-2 |
Sigma-Aldrich |
SAB5700824 |
| MMP-7 |
Sigma-Aldrich |
SAB4501894 |
| MMP-9 |
Sigma-Aldrich |
SAB5700152 |
| IL-6 |
Sigma-Aldrich |
SAB1408594 |
| IL-1β |
Sigma-Aldrich |
SAB1406017 |
| TNF-α |
Sigma-Aldrich |
SAB5700627 |
| β-Actin |
Sigma-Aldrich |
SAB3500350 |
