1. Introduction
Radix Ranunculus ternate is a dry root of
Ranunculus ternatus Thunb. Wild
R. ternate was found in Xinyang, Henan Province, in the 1950s; it has been recorded in the
Chinese Pharmacopoeia since 1977 and has been listed as one of the three types of Chinese medicinal materials with national priority [
1].
R. ternate can be used to resolve phlegm and disperse nodules as well as for detoxification and detumescence [
2]. Because of its significant anti-tuberculosis and anti-tumor effects,
R. ternate is mainly used clinically to treat pulmonary tuberculosis, lymph node tuberculosis, lung cancer, liver cancer, lymph cancer, chronic hepatitis B, chronic pharyngitis, and other diseases [
3,
4,
5]. Research has found that the main chemical components of
R. ternate are polysaccharides, fatty acids, saponins, alcohols, esters, volatile oils, alkaloids, flavonoids, and trace elements; and its active anti-tumor ingredients are mainly saponins, polysaccharides, fatty acids, alcohols, and some compounds in esters [
6,
7,
8]. The alcohol-soluble extract of
R. ternate is an important control item in the quality standards of the 2020 edition of the
Chinese Pharmacopoeia.
Fermentation technology is widely used in food, chemical, and pharmaceutical industries. Fermentation is also a main process in traditional Chinese medicine. In the process of fermentation, microorganisms may consume some components of Chinese medicine as carbon and nitrogen sources or increase the effective components through secondary metabolism, thus changing the contents of ingredients of Chinese medicine [
9]. Based on the changes in the ingredients, their efficacy will change, which can be multifaceted, such as improving efficacy, reducing toxicity, expanding indications, and generating new therapeutic effects. The optimal solid-state fermentation process of
Quercus liaotungensis by
Bacillus subtilis was studied in terms of the inoculation amount, the soybean meal addition amount, the fermentation temperature and the ratio of material to water, and the Quercus liaotungensis extract fermented markedly increased the tannin content and antioxidant effect [
10]. However, it has been found that many important biochemical reactions cannot be realized when relying on a single microorganism and can only be realized with a co-culture of more than two microorganisms, that is, mixed-strains fermentation [
11]. Strain selection is an important research topic in the microbial fermentation of traditional Chinese medicine. Endophyte are an important component of a plant’s internal environment, as they have formed stable and mutually beneficial relationships with plants during long-term coevolution. Endophyte not only produce special bioactive substances themselves but also induce and promote the synthesis or accumulation of effective ingredients in medicinal materials [
12,
13,
14,
15]. The fungi isolated from
Changium smyrnioides was co cultured with
C. smyrnioides floating culture cells, and the results showed that the cell growth and polysaccharide content increased by 31.86% and 38.01%, respectively [
16]. In the early stage of this study, an endophytic fungus
Fusarium equiseti was obtained from
R. ternate, which produce extracellular polysaccharides with strong antioxidant activity [
17]. Therefore, endophytic fungi are important potential raw materials for new medicinal active ingredients.
In this experiment, two endophytic fungi of R. ternate were used for the solid fermentation of R. ternate (FRT), and unfermented R. ternate (RT) was used as a control. The optimal fermentation time, sieve size, liquid-to-material ratio, fermentation temperature, and inoculation amount of the strains were selected by optimizing the fermentation process, and the changes in the main components, the antioxidant and hypoglycemic activities of the extracts before and after fermentation were compared, which provided an important theoretical basis for the application of R. ternate.
2. Materials and Methods
2.1. Reagents and Strains
R. ternate was collected in the Huaibin area of Xinyang, Henan Province. Chaetomium globosum (R12) and Fusarium equiseti (S4) were isolated from the wild R. ternate in the laboratory. DPPH (2,2-Diphenyl-1-Picrylhydrazyl) and ABTS+ (2,2′-Azinobis-(3-ethylbenzthiazoline-6-sulphonate) were purchased from Yuanye Biotechnology Co., Ltd. (Shanghai, China). An amino acid reference substance was purchased from Sigma-Aldrich Biotechnology Co., Ltd. (Shanghai, China).
2.2. Preparation of Strain Seed Liquid
The PDA (potato dextrose agar) medium was prepared from 200 g of potato, 20 g of glucose, 15 g of agar, and 1000 mL of distilled water via sterilization at 121 °C for 15 min. Mycelium was inoculated onto the PDA slope medium using the streak plate method on a sterile super-clean bench and cultured in an incubator at 28 °C for 7–10 d. The activated strains were added to the liquid PDA medium for expansion and cultured on a table at 30 °C and 220 r·min−1 for 24 h.
The suspensions of endophytic fungi were vacuumized and filtered, and the mycelium was collected. The obtained mycelium was dried to a constant weight at 60 °C, and the growth curve was drawn via continuous weighing for 7 days. The strain seed liquid was selected after the expansion culture reached the growth index stage, and the concentration of the endophytic fungi was adjusted to 108 CFU/mL.
2.3. Screening of Fermentation Strains
R. ternate was washed, dried, crushed, and passed through a 40-mesh sieve. Then, 15 g of R. ternate powder was accurately weighed as the substrate for fermenting strains, poured into a 250 mL triangle bottle, and sterilized at 120 °C for 15 min.
Single strain fermentation: After sterilizing the fermentation substrate, inoculations of 2% activated R12 and S4 were added separately and treated at 28 °C and 150 rpm for 0–7 days. The fermentation products were taken out at the same time every day and dried at 40 °C for 1 h.
Mixed-strains fermentation: Different proportions of the mixed suspensions of endophytic fungi (R12/S4 = 1:1; R12/S4 = 1:2; R12/S4 = 2:1; R12/S4 = 1:3; and R12/S4 = 3:1) were added to the sterilized fermentation substrate. The total inoculation amount was 2%, and the fermentation culture was carried out at 28 °C and 150 rpm for 0–7 days. The fermentation products were taken out at the same time every day and dried at 40 °C for 1 h.
The yield of the ethanol-soluble extract (ESE) of
R. ternate was calculated according to the following equation [
1]:
where
M is the mass of the alcohol-soluble extract (g) and
N is the mass of
R. ternate powder (g).
2.4. Optimization of Solid-State Fermentation Process of R. ternate
2.4.1. Single-Factor Experiments
First, 15 g of R. ternate was accurately weighed, sieved with 20-mesh, 40-mesh, 60-mesh, 80-mesh, and 100-mesh sieves, and added to 250 mL triangle bottles with liquid/material ratios of 0.5:1 mL·g−1, 0.75:1 mL·g−1, 1:1 mL·g−1, 1.25:1 mL·g−1, and 1.5:1 mL·g−1. The additional inoculation amounts were 2%, 4%, 6%, 8%, and 10%, and the fermentation temperatures were 26 °C, 28 °C, 30 °C, 32 °C, and 34 °C, respectively. Five days later, the fermentation products were sterilized again and dried at 40 °C. Using the ASE yield from the fermentation products as the evaluation index, the effects of sieve size, liquid/material ratio, inoculation amount, and fermentation temperature on the solid-state fermentation of R. ternate were investigated using single-factor tests.
2.4.2. Response Surface Method Experiments
On the basis of the single-factor tests, Box–Behnken tests were designed with four factors and three levels, including sieve size (A), liquid-to-material ratio (B), fermentation temperature (C), and inoculation amount (D) (
Table 1). The Box–Behnken experiment (BBD) test designs were generated using the Design-Expert 10.0.3 software.
2.5. Determination of Active Constituent Content
The water-soluble extracts (WSEs) were determined according to the extraction method of the Chinese Pharmacopoeia 2020 (General Rule 2201), in which the water used was distilled water. The distilled water was replaced with dilute ethanol as the solvent to determine the ESE.
First, 5 g of dried
R. ternate powder was placed in a triangle bottle. Then, 200 mL of distilled water was added and extracted using ultrasound at 80 °C for 2 h. The filtrate was concentrated and then mixed with 4 volumes of absolute ethanol at 4 °C for 24 h. Subsequently, the precipitates were obtained via centrifugation at 4000 rpm for 10 min. The precipitates were dried to give the desired polysaccharides. According to the phenol–sulfuric acid method [
18], D-glucose was used as a standard reference material. The extraction was dissolved in water and fixed to 50 mL in a volumetric flask. The liquid to be tested, 5% phenol, and concentrated sulfuric acid were mixed at a ratio of 1 mL:2.5 mL:10 mL and bathed at 100 °C for 15 min. After cooling, the absorbance of the solution at 490 nm was used to calculate the glucose concentration in the solution according to the standard curve using the linear equation A
490 = 0.0596C
g − 0.0027 (R
2 = 0.9998), where A
490 is the absorbance at 490 nm and C
g is the glucose concentration (mg/mL).
Then, 5 g of dried
R. ternate powder was placed in a triangle bottle with 200 mL of 60% aqueous ethanol. The flavonoids, saponins, and phenolic acids in the
R. ternate were extracted using ultrasound at 80 °C for 2 h. According to the Al(NO
3)
3-NaNO
2-NaOH method, rutin was used as a standard reference material for the determination of total flavonoids. The total flavonoid contents in the fermentation products were determined according to a previously described method, with some modifications [
19]. The liquid to be tested, 60% aqueous ethanol, and 5% sodium nitrite were mixed at a ratio of 1 mL:5 mL:1 mL. Then, 1 mL of 10% aluminum nitrate was added 6 min later and diluted to 25 mL with 60% aqueous ethanol. The absorbance of the solution at 274 nm was used to calculate the rutin concentration in the solution according to the standard curve using the linear equation A
274 = 0.002C
g − 0.0142 (R
2 = 0.9996), where A
274 is the absorbance at 274 nm and C
g is the rutin concentration (mg/mL).
According to the vanillal–glacial acetic acid method, oleanolic acid was used as a standard reference material for the determination of total saponins. The measurement of total saponins was performed using a modified version of a previously described method [
20]. The liquid to be tested was diluted to 10 mL with methanol and then evaporated to dryness. Then, 0.2 mL of a 5% vanillin–glacial acetic acid solution and 0.8 mL of perchloric acid were added, followed by heating in a bath at 60 °C for 10 min and quickly cooling to room temperature using ice crystals. Next, 5 mL of anhydrous acetic acid was added to terminate the reaction. The absorbance of the solution at 544 nm was used to calculate the oleanolic acid concentration in the solution according to the standard curve using the linear equation A
544 = 17.015C
g − 0.2084 (R
2 = 0.9997), where A
544 is the absorbance at 544 nm and C
g is the oleanolic acid concentration (mg/mL).
Referring to the Folin–Ciocalteu reagent (FCR) method, gallic acid was used as a standard reference material for the determination of total phenols. A previously described protocol was followed, with some modifications [
21]. The liquid to be tested and FCR were mixed at a ratio of 1 mL:5 mL and incubated at room temperature for 5 min. Then, 4 mL of a 6% sodium carbonate solution was added and allowed to stand in the dark at room temperature for 30 min. The absorbance of the solution at 725 nm was used to calculate the gallic acid concentration in the solution according to the standard curve using the linear equation A
725 = 0.1012C
g + 0.0453 (R
2 = 0.9997), where A
725 is the absorbance at 725 nm and C
g is the gallic acid concentration (mg/mL).
Next, 5.0 g of R. ternate powder was precisely weighed in a triangle bottle with 200 mL of an 80% ethanol solution and extracted using ultrasound for 30 min. The organic acid content was determined according to the potentiometric titration method of the Chinese Pharmacopoeia 2020 (General Rule 0701).
Then, 20 mL of the test solution was accurately measured and placed in a 200 mL beaker. Subsequently, 20 mL of a 0.05 mol·L
−1 NaOH solution was added. This mixture was placed in a constant-temperature magnetic stirrer and titrated with a 0.05 mol·L
−1 HCl standard solution. The amount of HCl consumed was recorded. Then, 20 mL of a 0.05 mol·L
−1 NaOH solution was used as a blank control and titrated with a 0.05 mol·L
−1 HCl standard solution. The total organic acid content in the sample was calculated via potentiometric titration using the following formula [
22] (calculated as citric acid (C
6H
8O
7) per dry sample, where 1 mL of HCl titrant is equivalent to 3.302 mg of citric acid):
where V is the volume of the HCl standard solution consumed by the titrating sample (mL), V0 is the volume of HCl consumed by the blank (mL), and W is the sample mass (g).
Next, 0.1 g of
R. ternate powder was weighed and placed in a hydrolysis tube, 4 mL of a 6 mol·L
−1 HCl solution containing 0.1% w/v phenol was added, nitrogen was blown with a nitrogen blower for 15 min, and the tube was tightly closed and hydrolyzed at 110 °C for 24 h. After hydrolysis, the tubes were cracked open and filtered. Then, 0.5 mL of hydrolysate was moved to a 10 mL EP tube and blown dry with nitrogen. The residue was dissolved in 6 mL of diluent (0.2 mol·L
−1 sodium citrate, pH 2.2, containing 0.1% w/v phenol) and passed through a 0.22 µm filter column. The mixed amino acid standard solution and sample determination solution are injected into the amino acid analyzer, respectively. The composition of the free amino acids in the filtrate was directly measured using an L-8900 ion-exchange HPLC system (HITACHI, Tokyo, Japan), utilizing postcolumn ninhydrin derivatization and detected at wavelength 570 nm (440nm for proline) [
23]. The amino acids content in the sample was calculated from the areas of standards obtained from the integrator using external standard method.
2.6. Antioxidant Activity
The scavenging ability of DPPH was estimated by a method according to [
24] with some modifications. Dilute the ESE of
R. ternate with ethanol to 20 mg/mL, 10 mg/mL, 5 mg/mL, 2.5 mg/mL, 1.25 mg/mL, and 0.625 mg/mL of the test solution, respectively. The DPPH radical solution was produced by gently mixing 100 µL of 0.1 mmol·L
−1 DPPH solution and 100 µL of the sample solution with various concentrations. This was allowed to stand in the dark for 30 min, and absorbance was measured at 517 nm. V
C solutions with different mass concentrations were used as positive controls. The free radical scavenging activity was calculated as following:
where A1 is the absorbance of DPPH and sample, A2 is the absorbance of the reagent blank without DPPH, and A0 is the absorbance of the solvent control.
The scavenging ability of ABTS
+ was estimated by a method according to [
19] with some modifications. The ABTS
+ radical solution was produced by adding an equal volume of 7 mmol·L
−1 ABTS
+ solution and 1.4 mmol·L
−1 potassium persulfate solution. This was allowed to stand in the dark for 24 h. Then, the ABTS
+ solution was diluted with ethanol to an absorbance of 0.7 ± 0.01 at 734 nm, the ABTS
+ working solution was obtained. 100 µL ABTS
+ solution was added with 50 µL of the sample solution with various concentrations, and the mixture was allowed to stand at 30 °C for 6 min in dark. The absorbance was measured at 734 nm. V
C solutions with different mass concentrations were used as positive controls. The free radical scavenging activity was calculated as following:
where A1 is the absorbance of ABTS+ and sample, A2 is the absorbance of the reagent blank without ABTS+, and A0 is the absorbance of the solvent control.
The scavenging ability of ·OH was measured according to [
18] with some modifications. 1 mL of the sample solution with different concentrations was mixed with 1 mL of 9 mmol·L
−1 FeSO
4 solution and 1 mL of 9 mmol·L
−1 salicylic acid solution, and this was kept at room temperature for 10 min. Subsequently, 1 mL of 8.8 mmol·L
−1 H
2O
2 solution was added to start the Fenton reaction and the mixture was heating in a bath at 37 °C for 30 min. The absorbance was measured at 510 nm. V
C solutions with different mass concentrations were used as positive controls. The free radical scavenging activity was calculated as following:
where A1 is the absorbance of H2O2 and sample, A2 is the absorbance of the reagent blank without H2O2, and A0 is the absorbance of the solvent control.
2.7. Hypoglycemic activity
The inhibiting ability of α-amylase was measured referring to [
25] with some modifications. Dilute the ESE of
R. ternate with 0.1 mol·L
−1 sodium phosphate buffer (PBS, pH 5.6) to 64 mg/mL, 32 mg/mL, 16 mg/mL, 8 mg/mL, 4 mg/mL, and 2 mg/mL of the test solution, respectively. 200 µL of the sample solution with various concentrations was mixed with 100 µL of PBS containing α-amylase (1.5 mg·mL
−1), and this was kept at 37 °C for 10 min. Then, 200 µL of 1% starch solution were added to the mixture at 40 °C for 30 min. Terminate the reaction with 400 µL of DNS reagent (1% dinitrosalicylic acid, 12% potassium sodium tartrate), and the mixture was heating in a boiling water for 10 min and cooled to room temperature. Next, the reaction mixture was diluted by adding 2mL of distilled water and the absorbance was measured at 540 nm. Acarbose solution with different mass concentrations was used as the positive control. Theα-amylase inhibiting activity was calculated as following:
where A1 is the absorbance of α-amylase, starch solution, DNS reagent and sample, A2 is the absorbance of the reagent blank without α-amylase, A3 is the absorbance of α-amylase, starch solution and DNS reagent, and A4 is the absorbance of the solvent control.
2.8. Model Verification and Statistical Analysis
The Design-Expert 10.0.3 software was used for the regression analysis and the optimization. The model adequacy was tested by calculating the coefficient of determination (, R2, and ). The analysis of variance utilized an ANOVA procedure. All experiments were repeated thrice. The data were analyzed using SPSS 20.0, and the results are expressed as means ± standard deviations. The significance level was p < 0.05.
3. Results and Analysis
3.1. The Growth Curves of R12 and S4
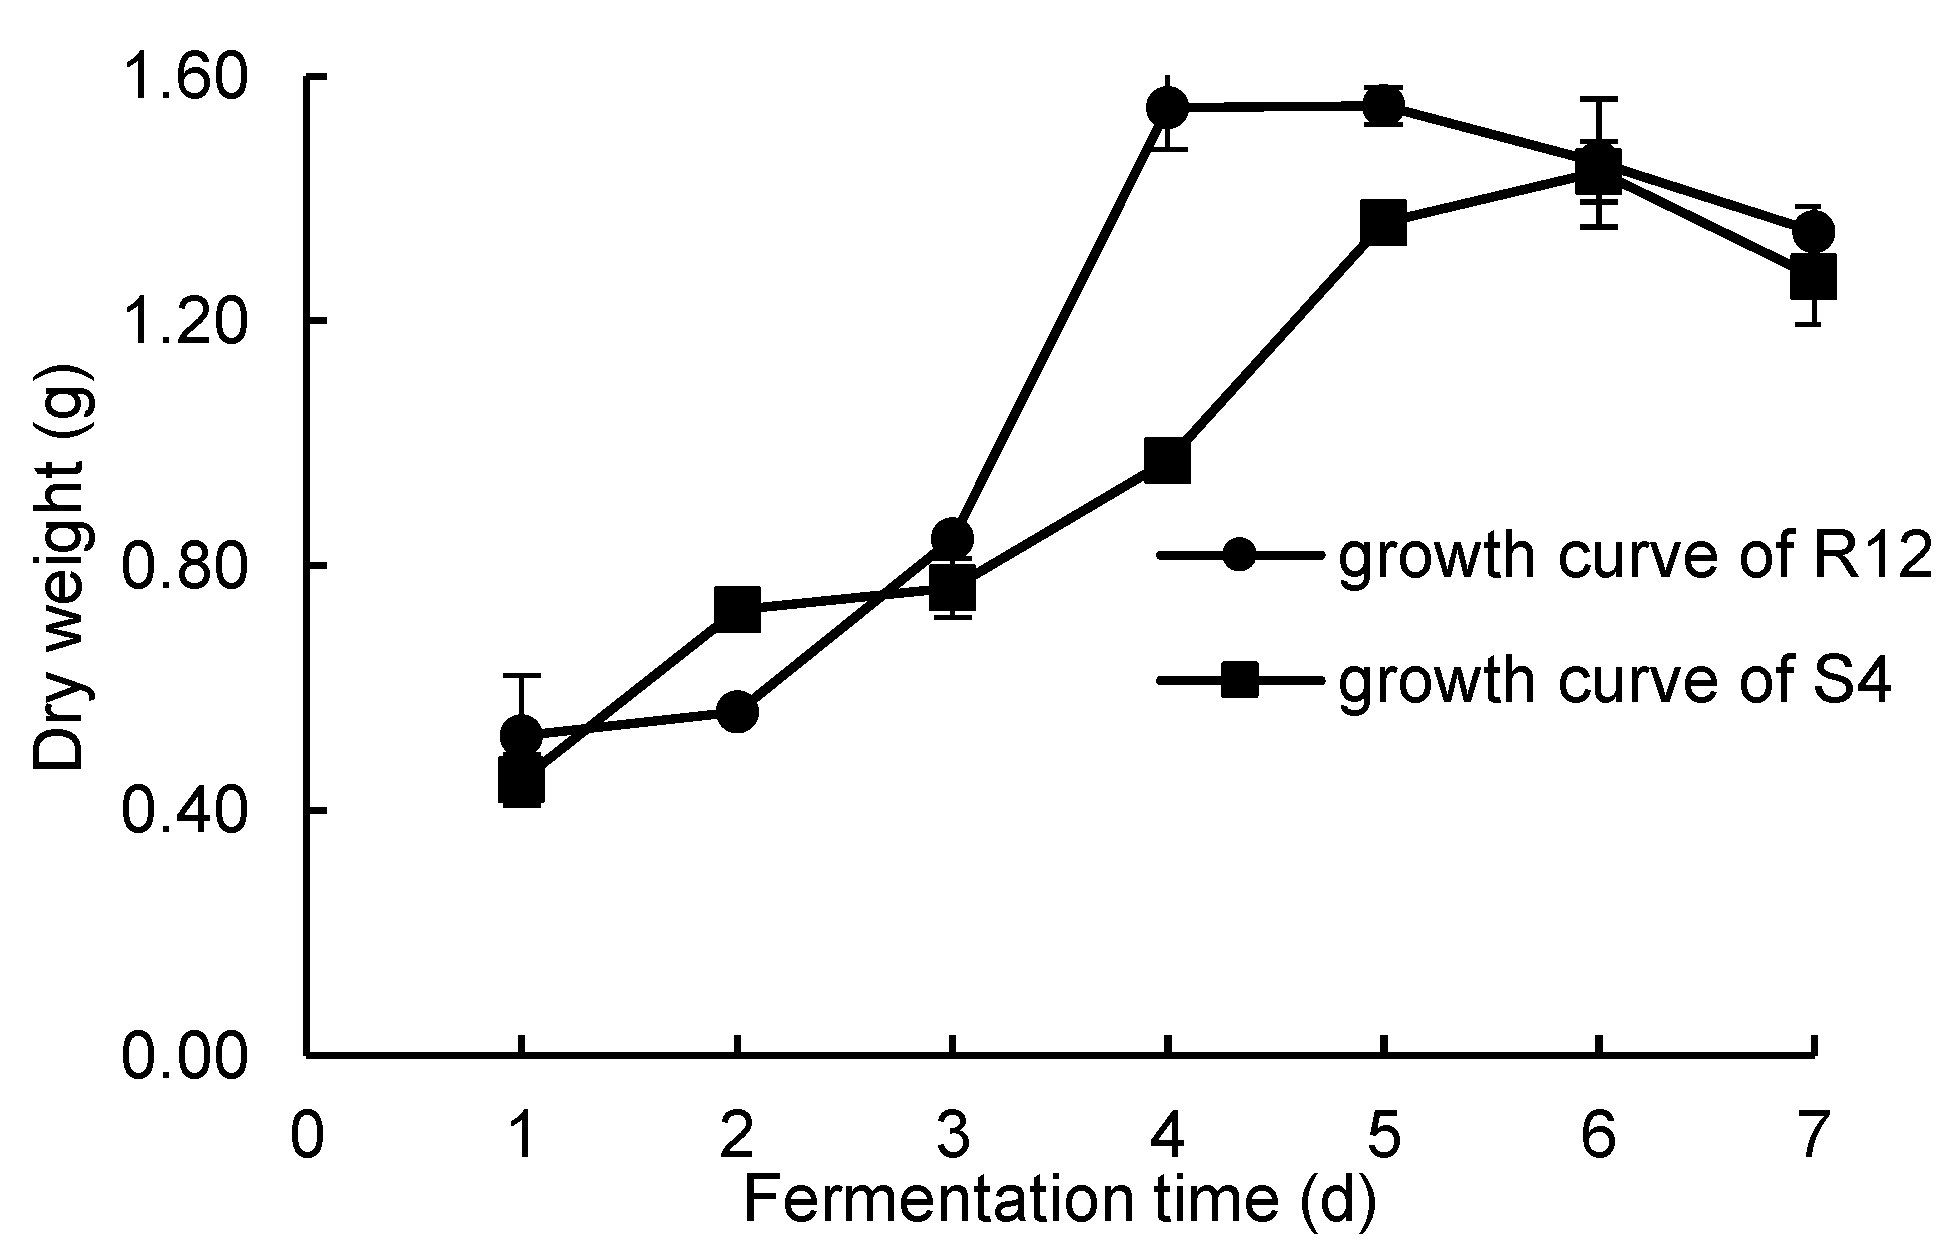
Growth curves were measured using the mycelium dry weight method. The growth curves of R12 and S4 are shown in
Figure 1. It can be seen that the mycelium dry weight of R12 did not change much over the first two days. On the 3rd day, the mycelium dry weight increased rapidly. After the 4th day, the mycelium dry weight reached its maximum value and remained stable, so it was determined that R12 entered the rapid growth phase on the 4th day. According to the growth curve of S4, it was found that over days 1–4, the strain grew slowly and the dry weight changed little. After the 5th day, the mycelium dry weight reached its maximum value and remained stable, so it was determined that S4 entered the rapid growth stage on the 5th day. Therefore, for the experiment, we selected R12 and S4 cultured for 4 and 5 days, respectively, as the fermentation seed liquids.
3.2. Screening of Fermentative Strains
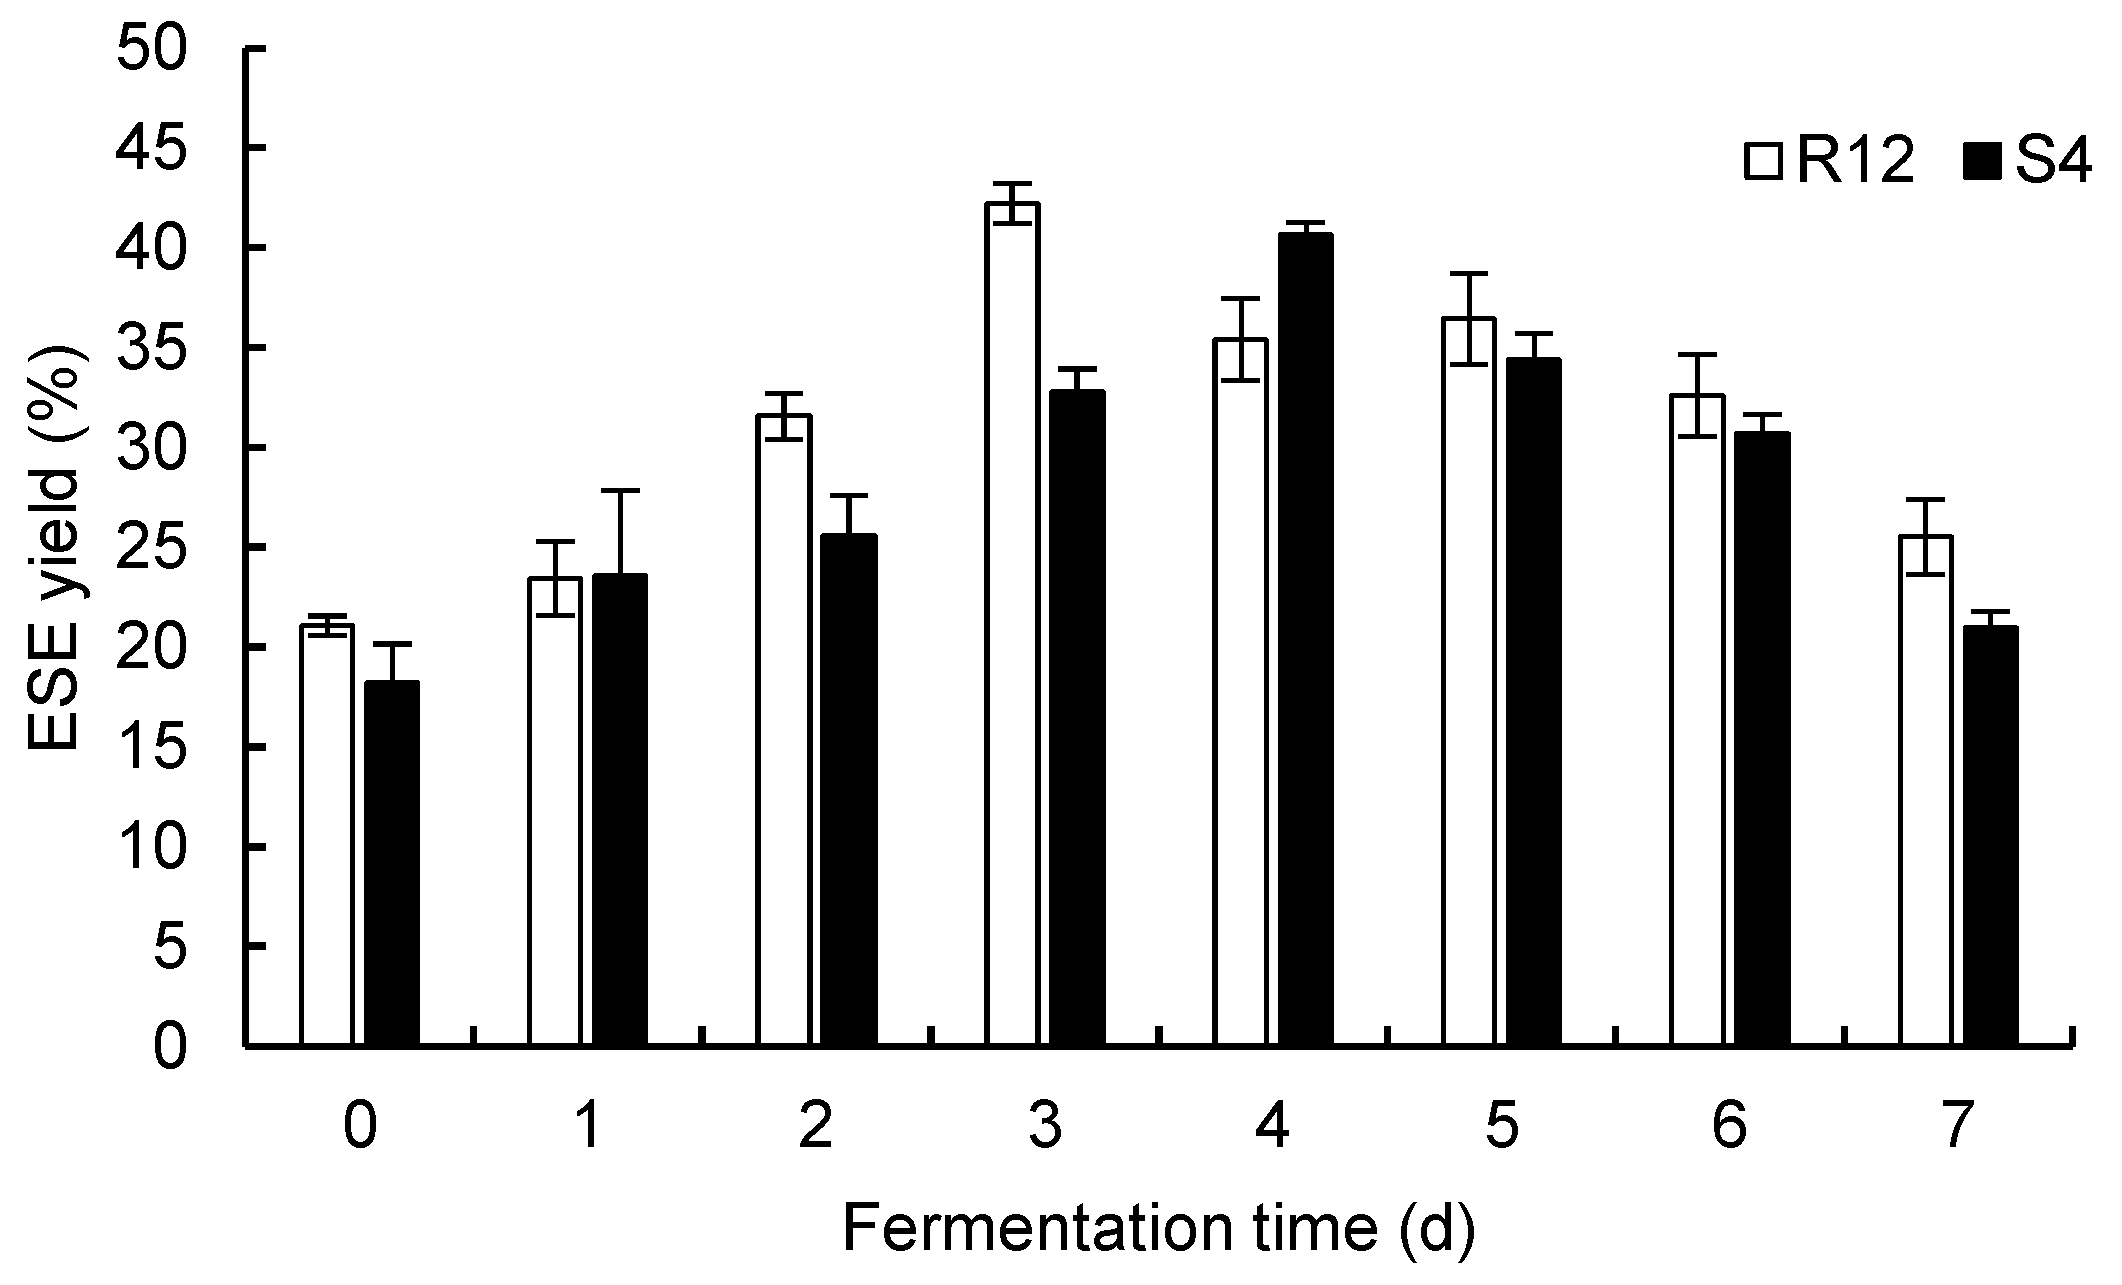
The ESE yields from
R. ternate from the single fermentation of two endophytic fungi are shown in
Figure 2. The content of the alcohol-soluble extract first increased during the single fermentation of R12, reached its maximum of 42.22% on the 3rd day, and decreased after the 3rd day. The yield of the ESE was lowest on the 7th day. This may have been due to the use of the liquid PDA medium during fermentation. No other nutrients were added, and the fermentation products were consumed by the endophytic fungi as carbon and nitrogen sources during the late fermentation period. When S4 was used alone as a fermentation strain, the yield of the ESE of
R. ternate first increased, reached its maximum value of 40.66% on the 4th day, and then decreased. Comparing the two groups of data, it was found that the ESE yield and efficiency of R12 as a fermentation strain were higher than those of S4. Therefore, in the fermentation of single strains, R12 should be selected as the superior fermentation strain, and its fermentation time is 3 d.
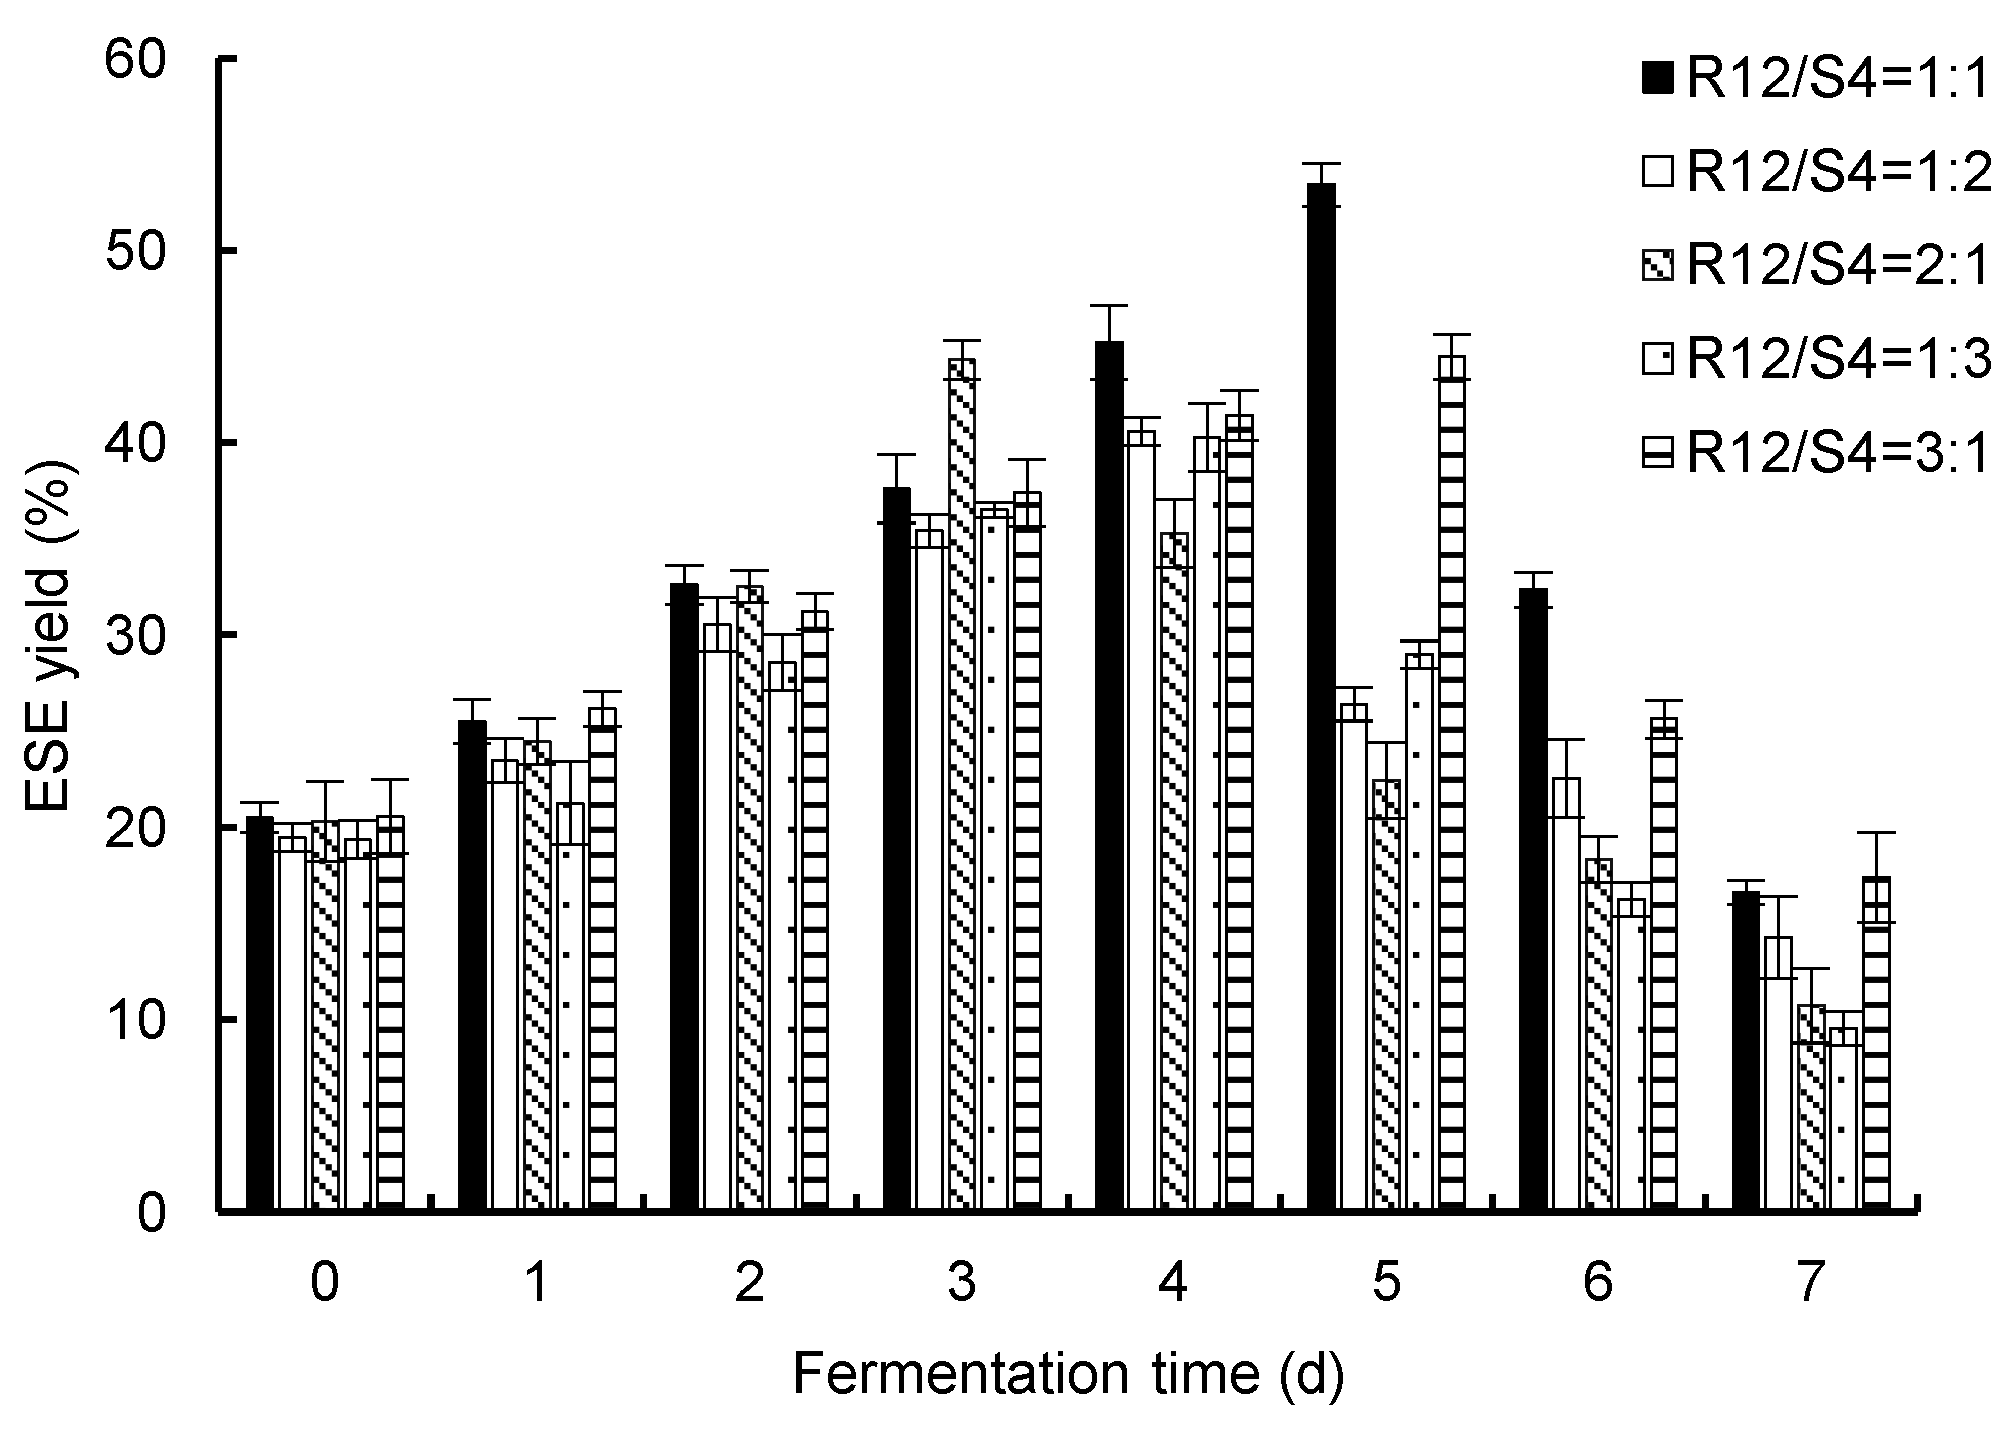
The ESE yields from
R. ternate from the fermentation of two endophytic fungi (R12 and S4) are shown in
Figure 3. The yields of the ESE of
R. ternate increased with an increase in fermentation time with different addition ratios. They generally reached their maximum values on the 4th or 5th day and gradually decreased on the 6th and 7th days. When R12/S4 = 1:1, the maximum ESE yield was 53.52% on the 5th day. Therefore, compared with single fermentation, it was found that mixed fermentation could effectively increase the content of the ESE of
R. ternate.
3.3. Single-Factor Experiment of Fermentation Process Optimization
3.3.1. Effects of Sieve Size on the Yield of ESE
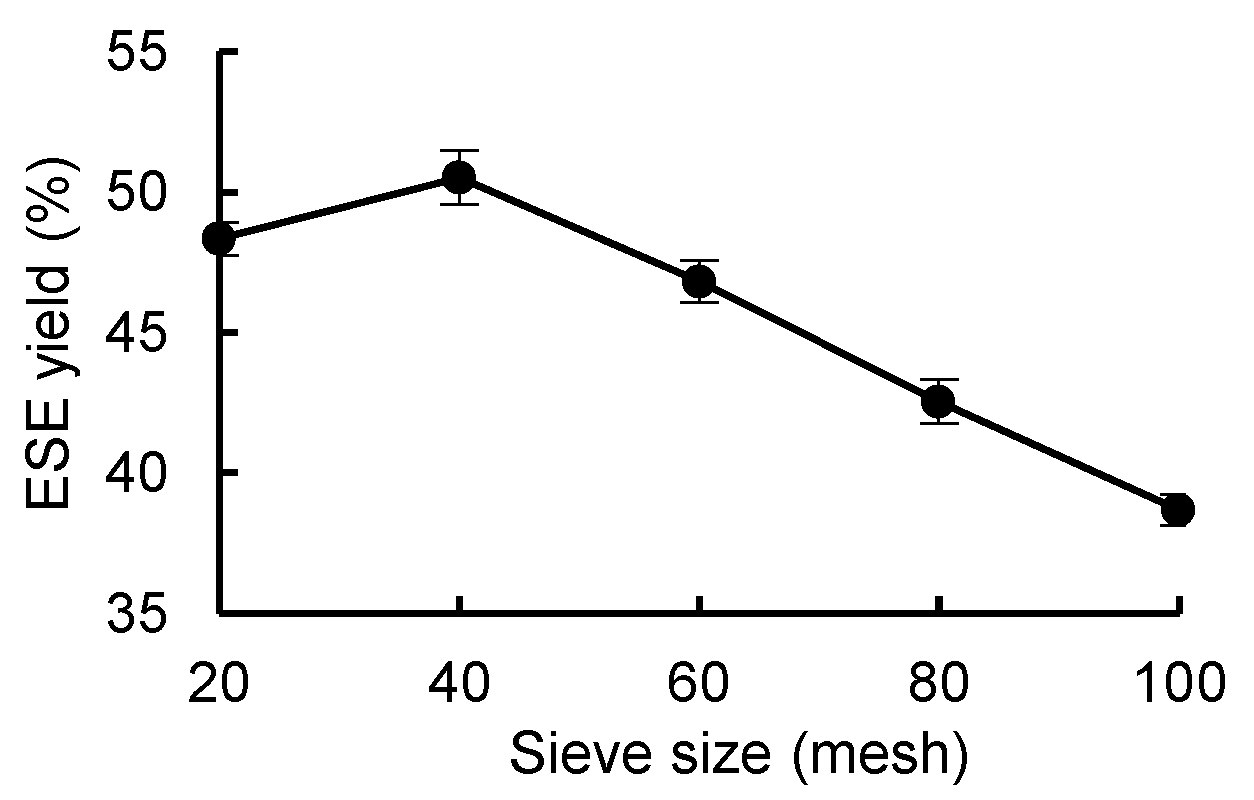
As shown in
Figure 4, the ESE yield of
R. ternate increased between samples sieved with a 20-mesh sieve and samples sieved with a 40-mesh sieve and decreased between samples sieved with 40-mesh sieve and samples sieved with a 100-mesh sieve, so the optimal sieve size was 40. Therefore, the sieve size was lower, the aperture of the sieve was larger, and the coarse impurities in the powder could not be completely removed. When the sieve size was larger, the aperture of the sieve was smaller and the effective ingredients may have been lost, so the ESE yield decreased.
3.3.2. Effect of Liquid-to-Material Ratio on the Yield of ESE
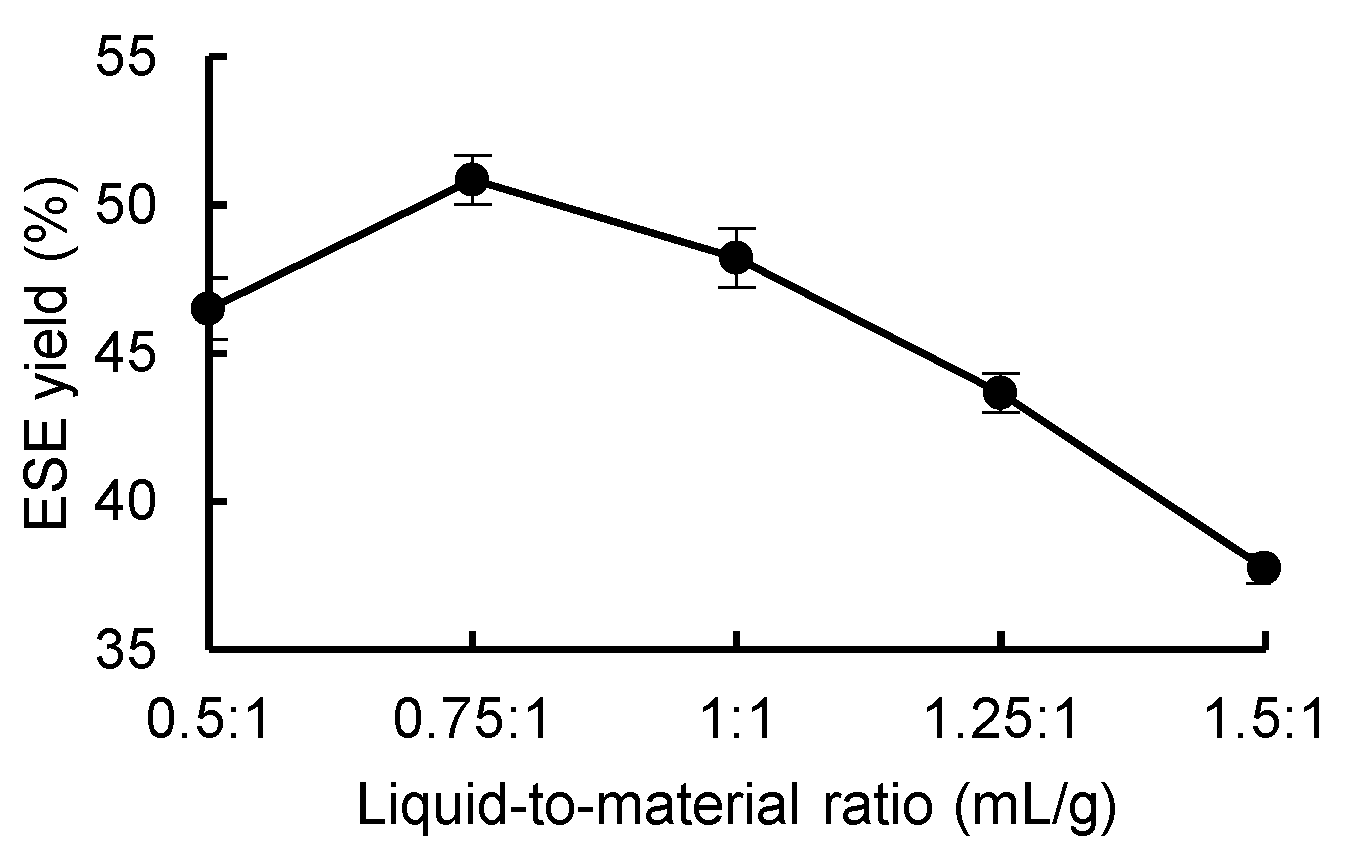
As shown in
Figure 5, the ESE yield of
R. ternate increased between the liquid-to-material ratios of 0.5:1 and 0.75:1 and decreased between the liquid-to-material ratios of 0.75:1 and 1.5:1. The optimal liquid-to-material ratio was 0.75:1. Therefore, it was hypothesized that when the liquid-to-material ratio was low, the amount of water in the substrate was relatively low, which resulted in the slowing down of the metabolism of the mycelium, and that when the liquid-to-material ratio was too large, the oxygen capacity in the substrate was low, which led to the incomplete growth of the mycelium, which in turn affected the yield of the ESE.
3.3.3. Effect of Fermentation Temperature on the Yield of ESE
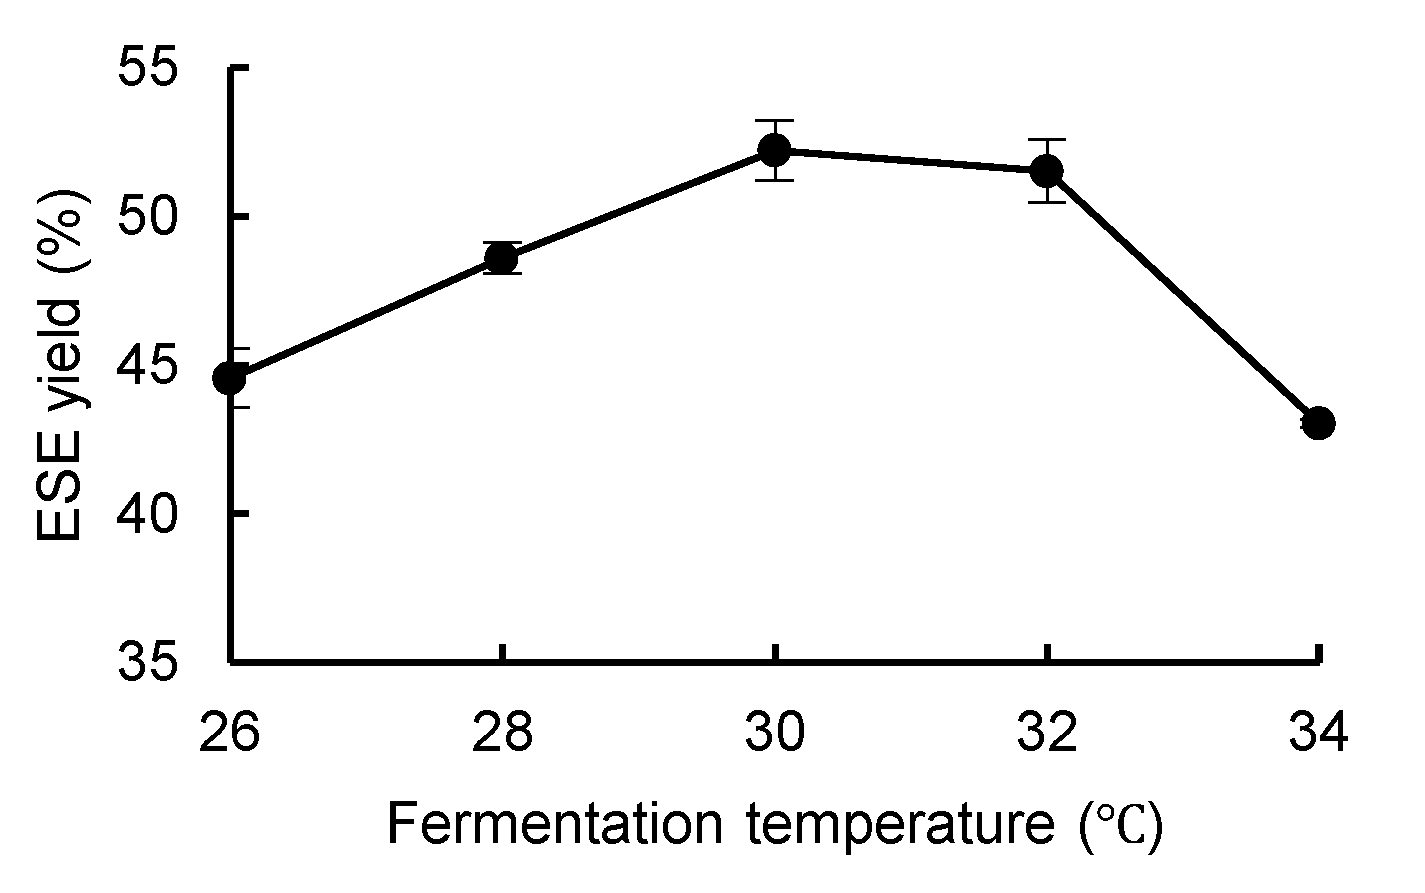
As shown in
Figure 6, the yield of the ESE of
R. ternate increased continuously when the fermentation temperature was between 26 °C and 30 °C, while it decreased continuously when the fermentation temperature was between 30 °C and 34 °C. Therefore, the optimal fermentation temperature was 30 °C, and it is speculated that the optimal growth temperature of the two endophytic fungi is about 30 °C. When the temperature is lower than the optimal growth temperature, mycelial metabolism is inhibited, and when the temperature is higher than the optimal growth temperature, mycelial metabolic capacity decreases, which affects the yield of the ESE in fermentation.
3.3.4. Effect of Inoculation Amount on the Yield of ESE
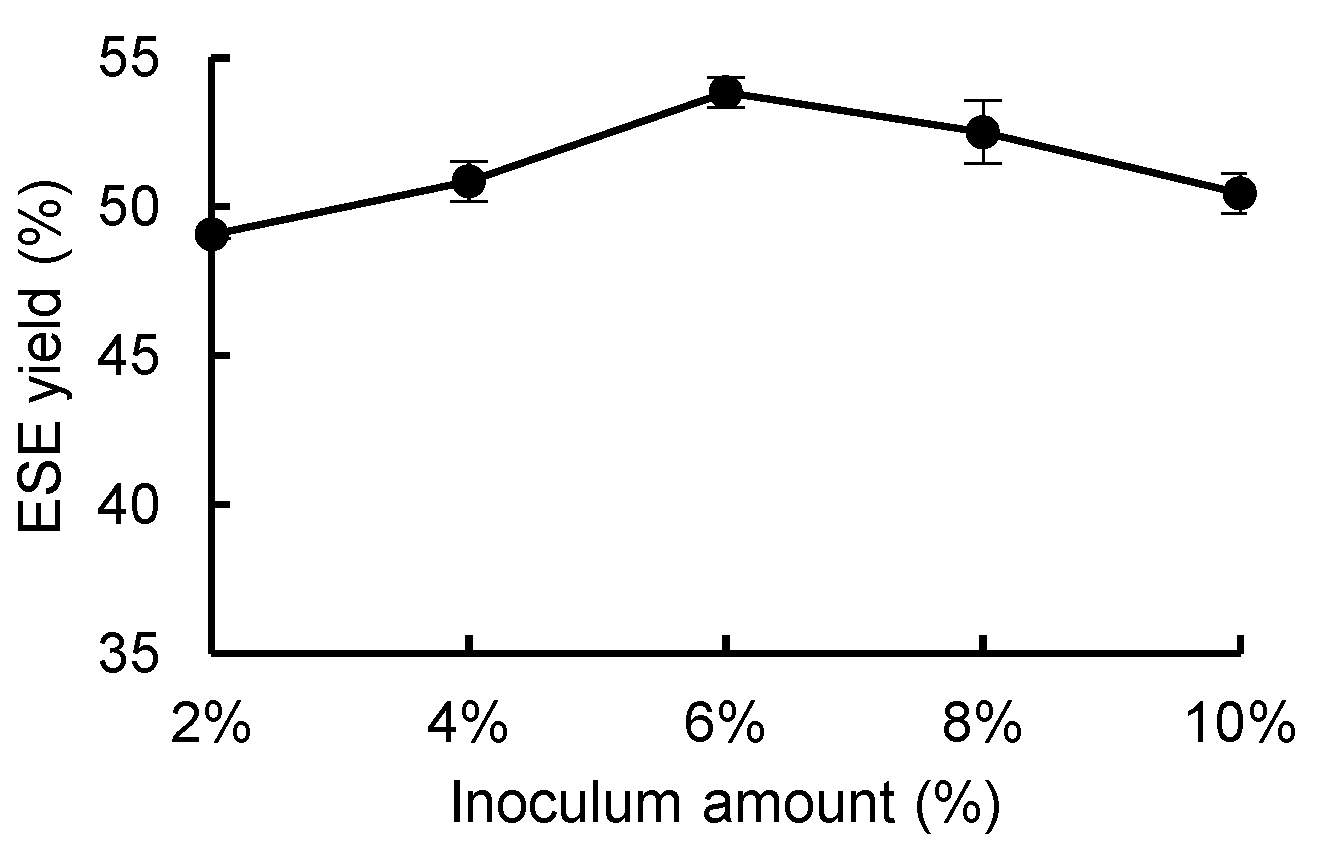
As shown in
Figure 7, between the inoculation amounts of 2% and 6% the
R. ternate ESE yield increased, while between the inoculation amounts of 6% and 10% the ESE yield decreased. Therefore, the optimal inoculation amount was 6%. It is assumed that when the inoculation amount is low, the mycelium in contact with the raw material is less able to maximize the fermentation activity of the microorganisms. With an increase in the inoculation amount, to a certain extent, the raw material in the carbon and nitrogen source is not able to meet the growth of the mycelium, resulting in mycelium metabolism inhibition. Therefore, the ESE yield showed a trend of increasing and then decreasing.
3.4. Response Surface Method for Fermentation Process Optimization
On the basis of a one-way test, the sieve size (A), liquid-to-material ratio (B), fermentation temperature (C), and inoculation amount (D) were used as the investigating factors; the yield of the alcoholic leachate of the fermentation product (Y) was used as the response value; and a BBD using a response surface methodology (RSM) was designed to optimize the fermentation process of
R. ternate. The design scheme and the resultant data are shown in
Table 2. A multiple quadratic regression model equation was obtained, which demonstrated the relationship between the response variables and the measured variables: Y = −1017.29 + 0.88 * A + 35.96 * B + 65.96 * C + 11.2 * D − 0.19 * AB + 0.04 * AC − 0.096 * AD + 2.56 * BC + 4.06 * BD − 0.1 * CD − 0.01 * A
2 − 81.81 * B
2 − 1.13 * C
2 − 0.58 * D
2.
According to the variance analysis of the model (
Table 3), the B (liquid-to-material ratio) and C (fermentation temperature) in the primary term had an extremely significant impact on the response value (
p < 0.01), the AD (sieve size number and inoculation amount) in the interaction term had an extremely significant impact on the response value (
p < 0.01), the BD (liquid-to-material ratio and inoculation amount) in the interaction term had a significant impact on the response value (
p < 0.05), and the other terms were not significant (
p > 0.05). In the square term, A
2, B
2, C
2, and D
2 all had significant effects on the response value (
p < 0.01). The fitting model obtained from the experimental data had an F-value of F = 14.74 (
p < 0.0001), indicating that the model fit the data well. The misfit term (
p = 0.1204 > 0.05) indicated that the misfit was not significant, and the experimental value was in good agreement with the predicted value. The correlation coefficient (R
2 = 0.9365), the adjusted determination coefficient (
= 0.8729), and the coefficient of variation (C.V. = 3.48%) of the model indicated that the linear relationship between the independent variables and the response values of the model was significant and appropriate to predict the ESE yield of
R. ternate under different fermentation conditions.
Table 2.
Box–Behnken design and results of tests.
Table 2.
Box–Behnken design and results of tests.
| Run |
Sieve Size (mesh) |
Liquid-to-Material
ratio (mL·g−1) |
Fermentation
Temperature (°C) |
Inoculation
Amount (%) |
ESE Yield (%) |
| 1 |
20 |
0.75:1 |
30 |
4 |
41.22 |
| 2 |
40 |
0.5:1 |
32 |
6 |
46.73 |
| 3 |
40 |
0.75:1 |
30 |
6 |
56.7 |
| 4 |
40 |
0.5:1 |
30 |
4 |
47.26 |
| 5 |
20 |
0.75:1 |
30 |
8 |
52.92 |
| 6 |
40 |
0.75:1 |
28 |
8 |
46.76 |
| 7 |
60 |
0.75:1 |
32 |
6 |
48.22 |
| 8 |
40 |
0.75:1 |
32 |
8 |
49.36 |
| 9 |
60 |
0.75:1 |
28 |
6 |
42.37 |
| 10 |
20 |
0.75:1 |
32 |
6 |
45.62 |
| 11 |
40 |
0.5:1 |
30 |
8 |
44.25 |
| 12 |
20 |
0.5:1 |
30 |
6 |
39.38 |
| 13 |
40 |
0.75:1 |
28 |
4 |
46.05 |
| 14 |
40 |
0.75:1 |
30 |
6 |
55.11 |
| 15 |
60 |
0.75:1 |
30 |
4 |
49.68 |
| 16 |
60 |
0.75:1 |
30 |
8 |
46.04 |
| 17 |
40 |
0.75:1 |
30 |
6 |
56.5 |
| 18 |
20 |
0.75:1 |
28 |
6 |
45.53 |
| 19 |
40 |
1:1 |
28 |
6 |
43.02 |
| 20 |
60 |
1:1 |
30 |
6 |
46.37 |
| 21 |
40 |
0.5:1 |
28 |
6 |
44.21 |
| 22 |
40 |
0.75:1 |
30 |
6 |
54.34 |
| 23 |
40 |
1:1 |
30 |
8 |
53.83 |
| 24 |
40 |
1:1 |
32 |
6 |
50.65 |
| 25 |
40 |
0.75:1 |
32 |
4 |
50.27 |
| 26 |
60 |
0.5:1 |
30 |
6 |
45.36 |
| 27 |
40 |
1:1 |
30 |
4 |
48.72 |
| 28 |
20 |
1:1 |
30 |
6 |
44.24 |
| 29 |
40 |
0.75:1 |
30 |
6 |
55.15 |
Table 3.
Analysis of variance.
Table 3.
Analysis of variance.
| Parameter |
Sum of Squares |
Df |
Mean Square |
F-Value |
p-Value |
Significance |
| Model |
577.77 |
14 |
41.27 |
14.74 |
<0.0001 |
** |
| A |
6.95 |
1 |
6.95 |
2.48 |
0.1376 |
|
| B |
32.14 |
1 |
32.14 |
11.48 |
0.0044 |
** |
| C |
43.74 |
1 |
43.74 |
15.62 |
0.0014 |
** |
| D |
8.27 |
1 |
8.27 |
2.95 |
0.1078 |
|
| AB |
3.71 |
1 |
3.71 |
1.32 |
0.2693 |
|
| AC |
8.29 |
1 |
8.29 |
2.96 |
0.1073 |
|
| AD |
58.83 |
1 |
58.83 |
21.01 |
0.0004 |
** |
| BC |
6.53 |
1 |
6.53 |
2.33 |
0.1491 |
|
| BD |
16.48 |
1 |
16.48 |
5.89 |
0.0294 |
* |
| CD |
0.66 |
1 |
0.66 |
0.23 |
0.6358 |
|
| A2
|
233.29 |
1 |
233.29 |
83.31 |
<0.0001 |
** |
| B2
|
169.60 |
1 |
169.60 |
60.56 |
<0.0001 |
** |
| C2
|
132.35 |
1 |
132.35 |
47.26 |
<0.0001 |
** |
| D2
|
34.94 |
1 |
34.94 |
12.48 |
0.0033 |
** |
| Residual |
39.20 |
14 |
2.80 |
|
|
|
| Lack of fit |
35.16 |
10 |
3.52 |
3.48 |
0.1204 |
|
| Pure error |
4.04 |
4 |
1.01 |
|
|
|
| Cor total |
616.97 |
28 |
|
|
|
|
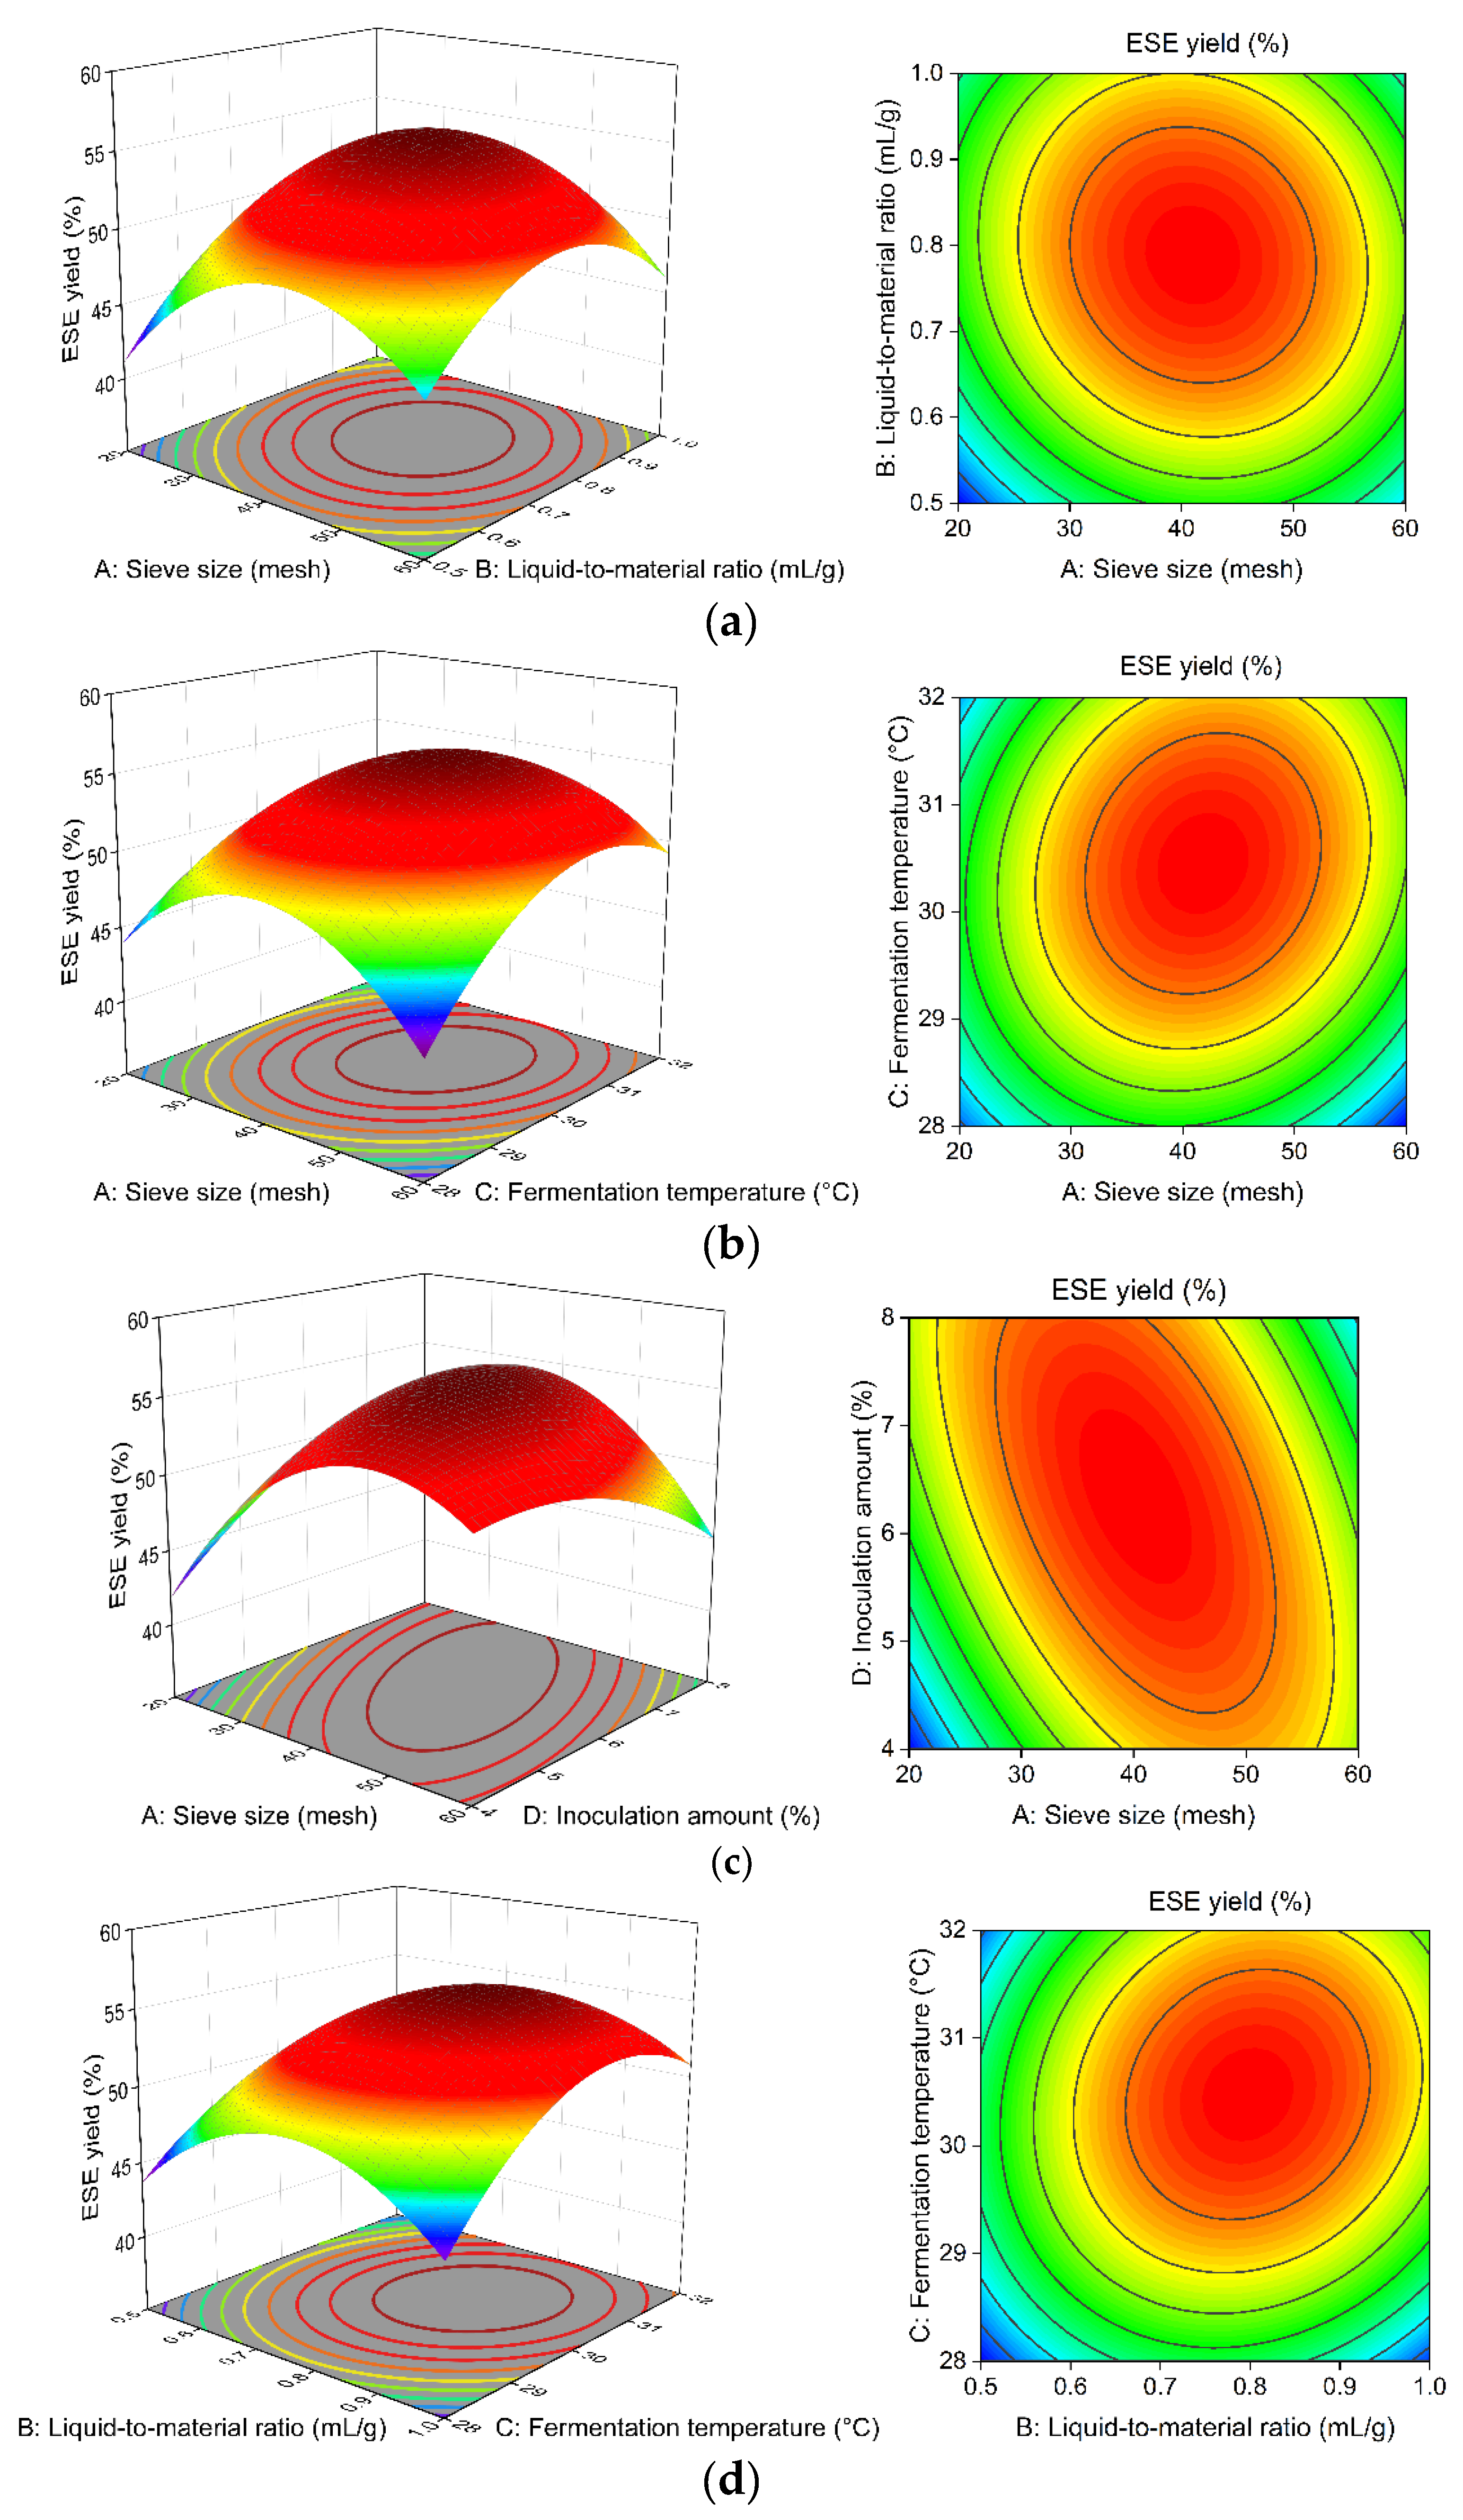
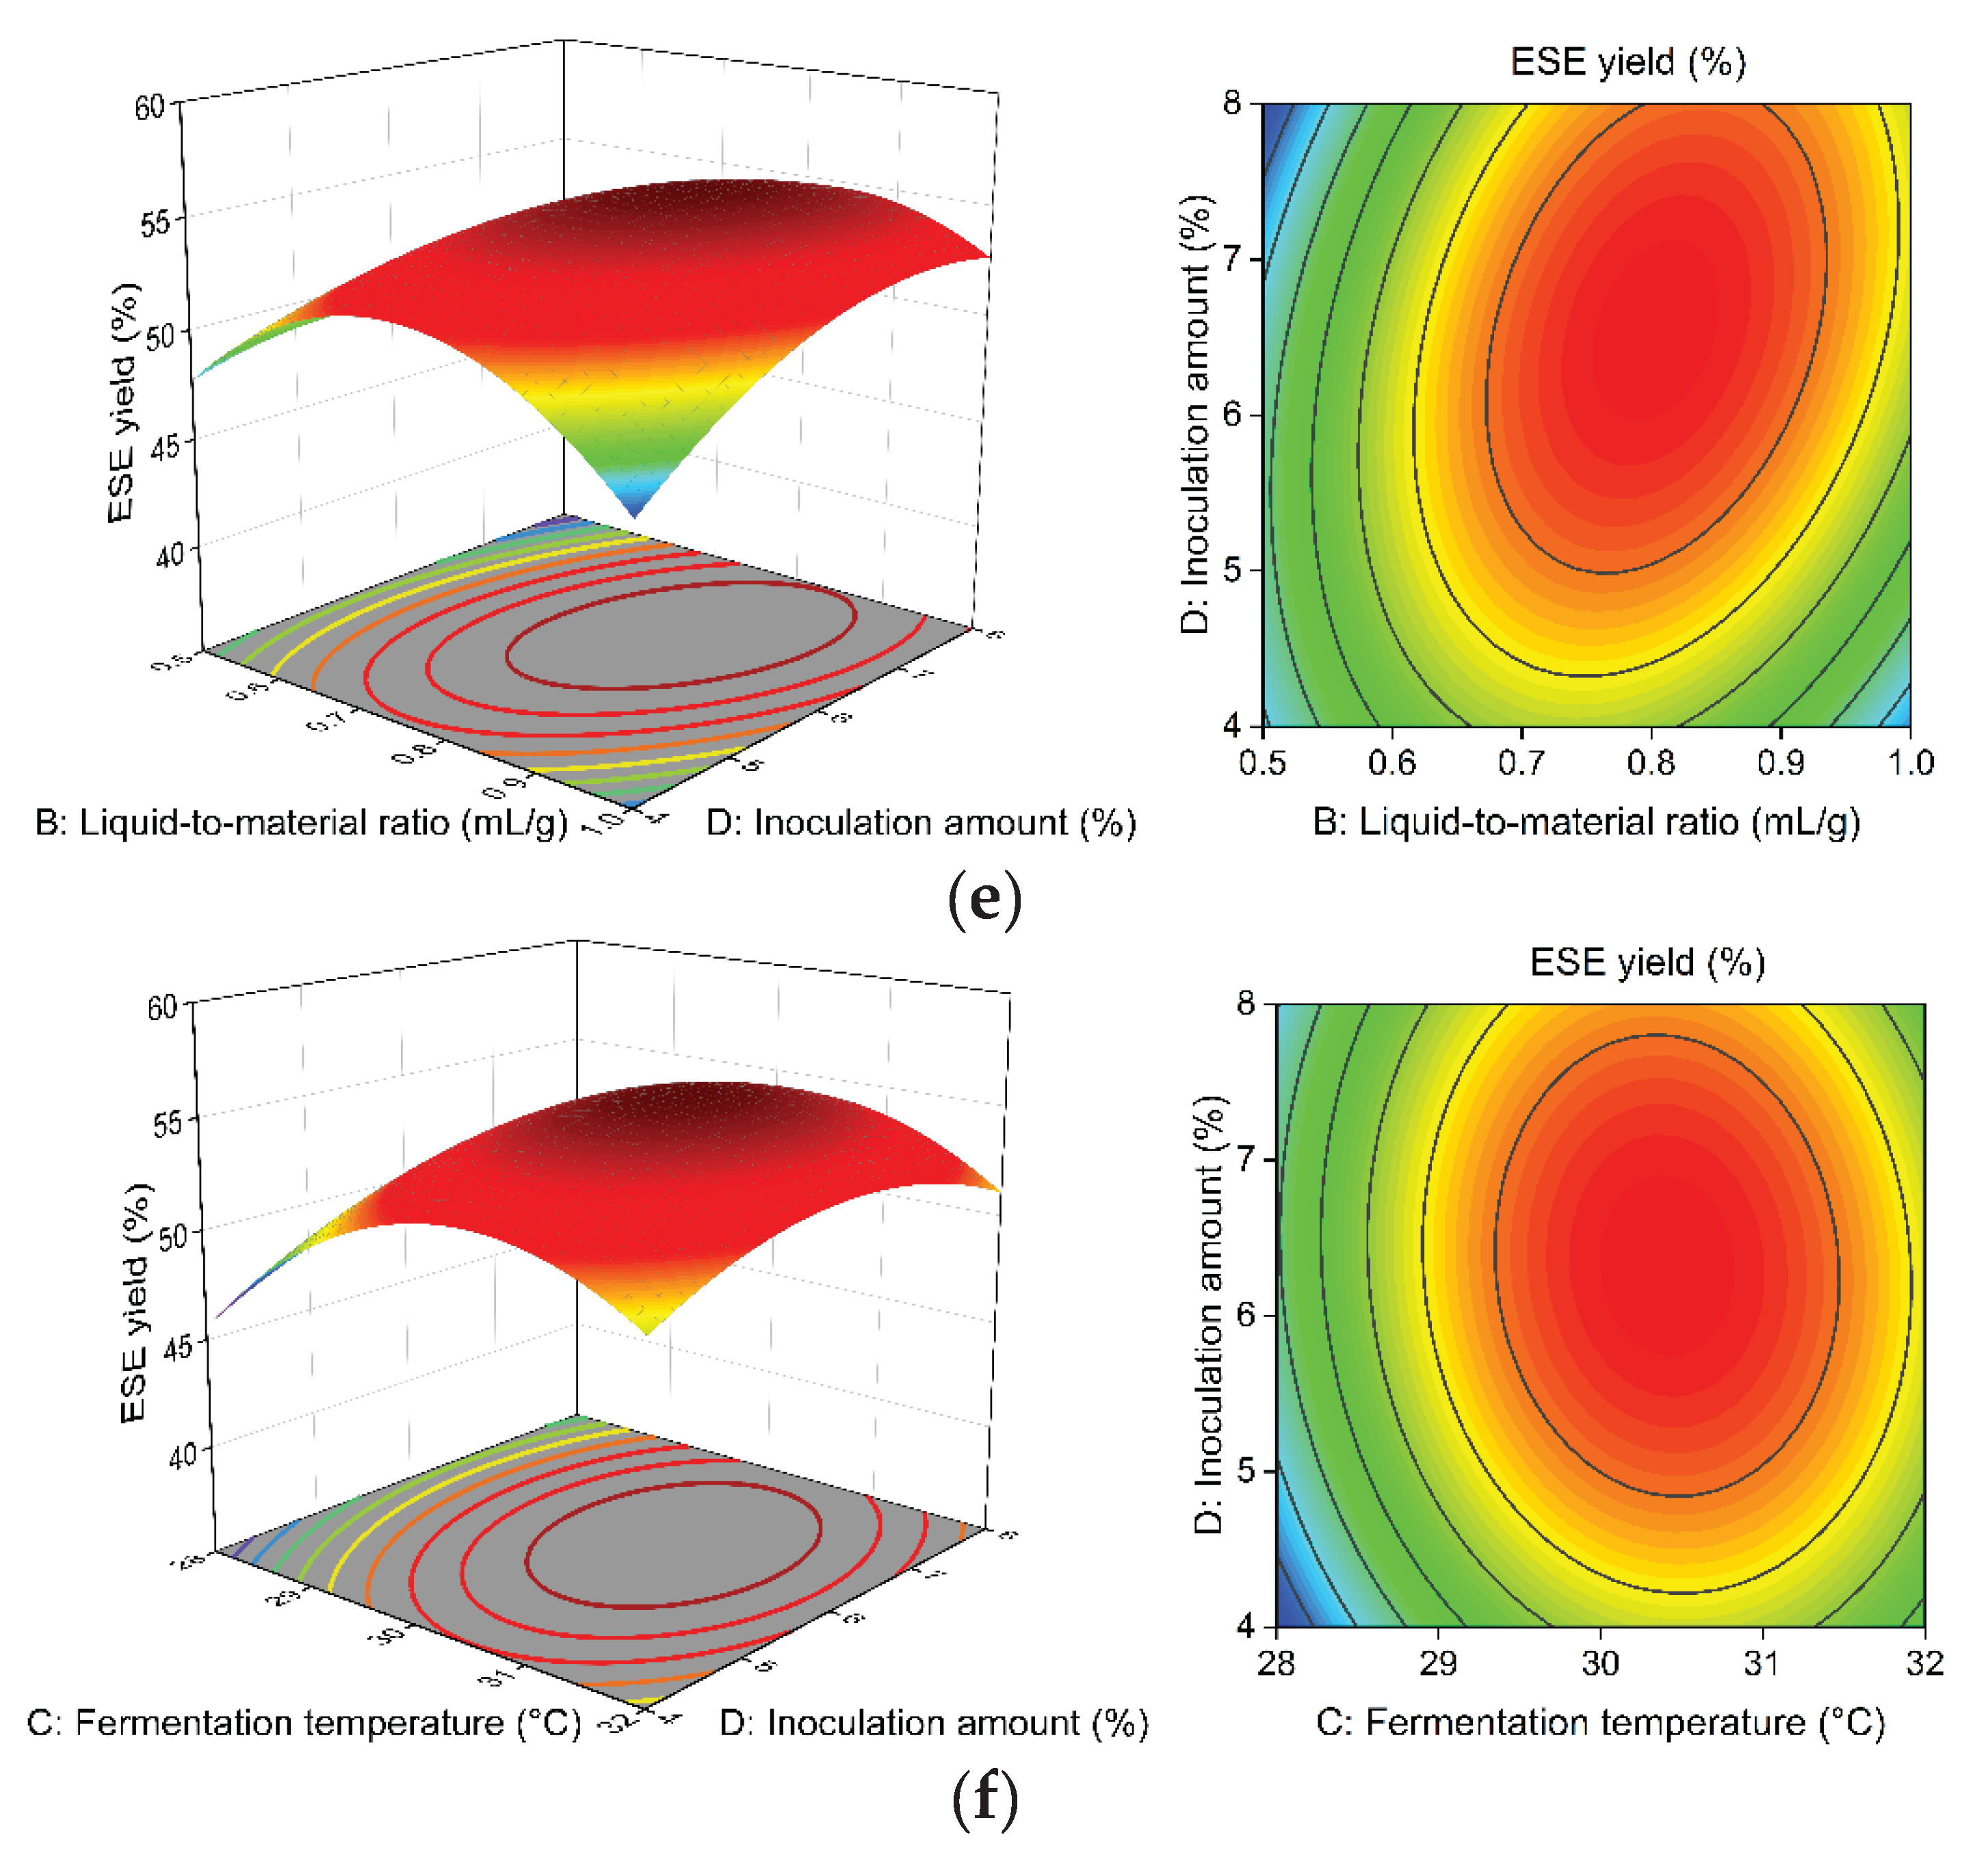
Figure 8a–f illustrate the effects of A, B, C, and D on the ESE yield of
R. ternate. The steeper and more skewed response surface plots and the denser and closer elliptical contour lines indicate that the interaction of the factor has a more significant effect on the yield of ESE [
26].
After fitting using Design-Expert 10.0.3, the optimal solid-state fermentation process was determined as follows: the sieve size is 36.932 mesh, the liquid-to-material ratio is 0.796:1 mL·g−1, the fermentation temperature is 30.737 °C, and the inoculation amount is 7.532%. Therefore, the yield of the ESE is predicted to be 55.452%. Considering the actual operation, the sieve size was 40 mesh, the liquid-to-material ratio was 0.8:1 mL·g−1, the fermentation temperature was 31 °C, and the inoculation amount was 7.5%. According to the above conditions, three extractions were carried out, and the ESE yield was 55.36%.
3.5. Changes in the Contents of Active Ingredients Before and After Fermentation
After the solid-state fermentation of
R. ternate by endophytic fungus (R12/S4 = 1:1) for 5 d, the contents of the WSE, ESE, polysaccharides, flavonoids, saponins, and polyphenols of
R. ternate powder were significantly different. As shown in
Table 4, the WSE and polysaccharide contents of
R. ternate showed decreases of 12.71% and 12.95% (
p < 0.05), respectively, after fermentation, while the content of the ESE, flavonoids, saponins, polyphenols, organic acids, and amino acids increased by 19.77%, 57.14%, 79.67%, 14.29%, 17.63%, and 3.82% (
p < 0.05), respectively, after fermentation. Except for alanine, lysine, and proline, the contents of the other 14 amino acids increased, of which 12 increased by more than 60%, while the contents of medicinal amino acids (Glu, Asp, Arg, Gly, Phe, Tyr, Met, Leu, and Lys) and essential amino acids (Thr, Val, Met, Phe, Lys, Ile, and Leu) increased by 66.39%, 74.9%, 74.9%, and 75.9% (
p < 0.05), respectively.
3.6. Changes in Antioxidant Capacity of ESE Before and After Fermentation
In
Figure 9a–c, it can be seen that within a certain range, the ESEs of unfermented and fermented
R. ternate both had a certain scavenging capacity for DPPH radicals, ABTS
+ radicals, and ·OH radicals, and the scavenging rate tended to increase with increasing concentrations of the alcoholic extracts, but none of them had less antioxidant capacity than V
C. When the ESE concentration was 20 mg·mL
−1, the DPPH, ABTS
+ and ·OH free radicals scavenging rate of FRT reached 87.2%, 81.3% and 70.31%, respectively, which were higher than the scavenging rate of RT of 68.18%, 67.13% and 62.78%, respectively. As can be seen in
Table 5, the IC
50 values (the half maximal inhibitory concentration) of DPPH free radicals, ABTS
+ free radicals, and ·OH free radicals scavenged by the ESE of fermented
R. ternate were lower than those unfermented, indicating that the antioxidant capacity of the ESE of
R. ternate significantly increased after fermentation.
3.6. Changes in Hypoglycemic Activity of ESE Before and After Fermentation
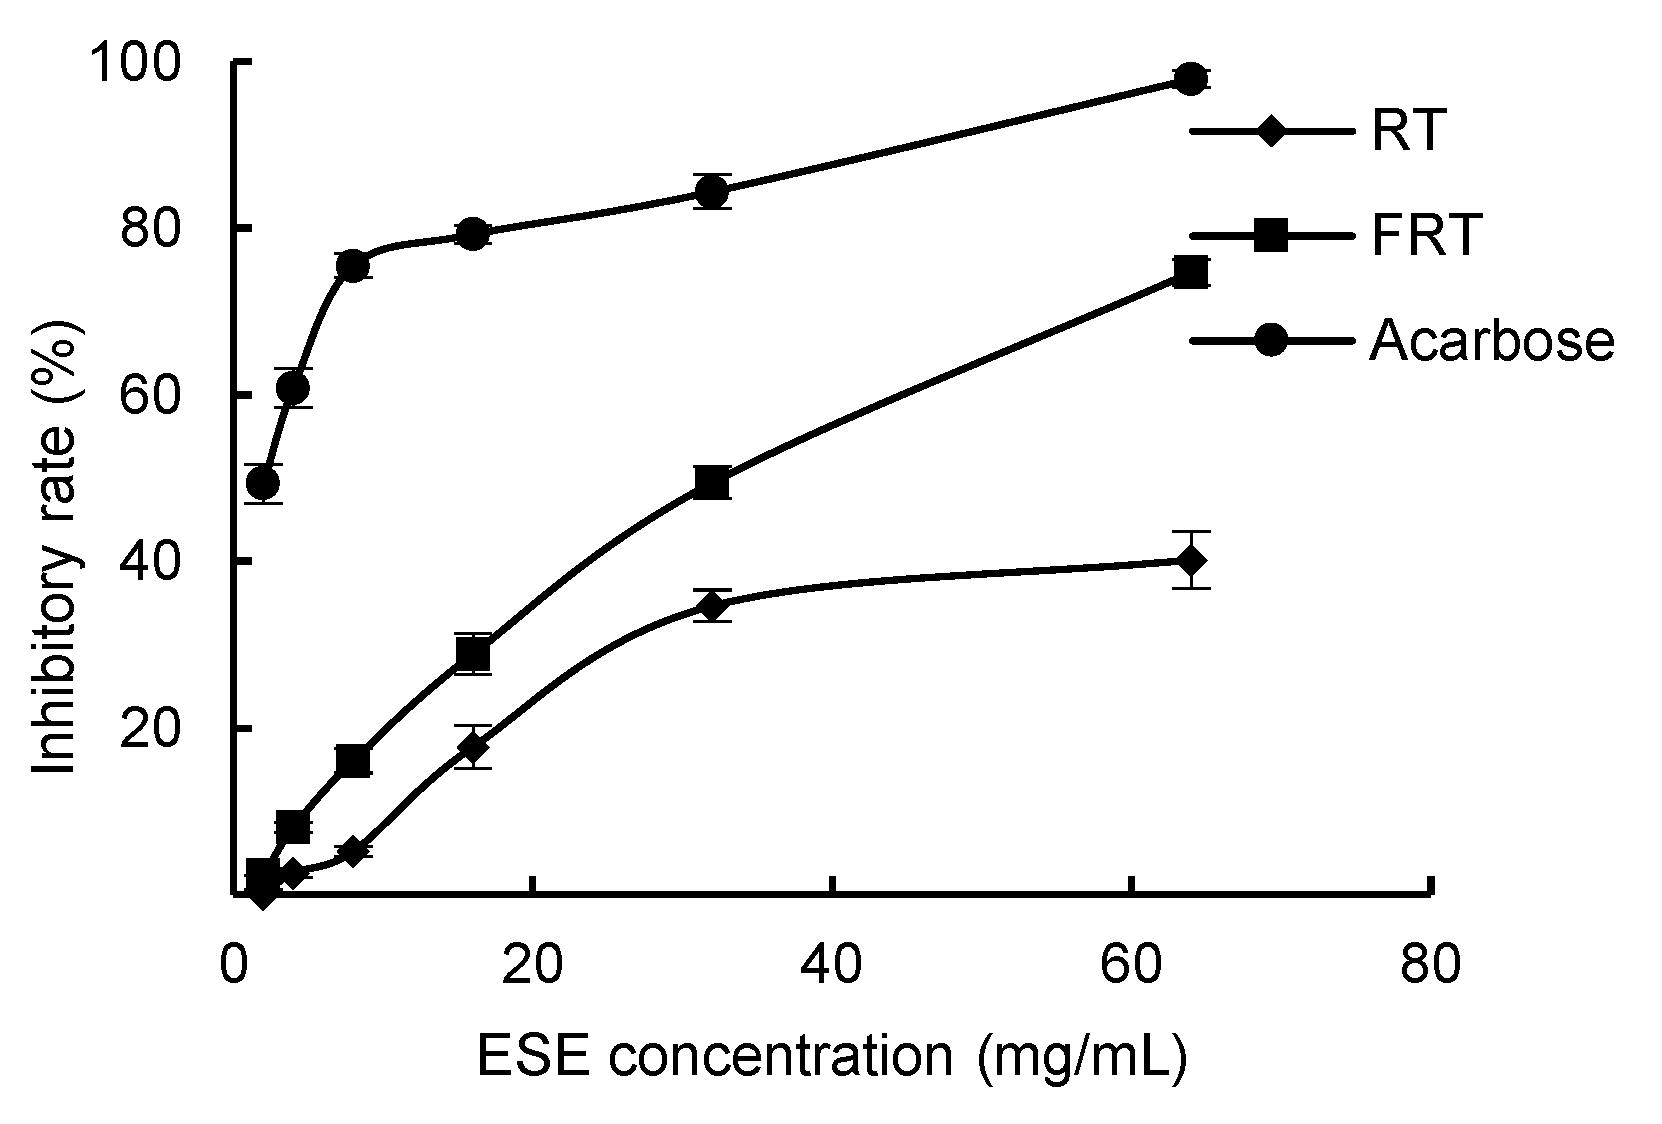
In
Figure 10, with the increase of sample concentration, the inhibitory effect of ESE of unfermented and fermented
R. ternate on α-amylase gradually increases, indicating a dose-response relationship between the extract and inhibitory activity. When the ESE concentration was 64 mg·mL
−1, the inhibitory rate of FRT reached 74.68%, which was higher than the inhibition rate of RT of 40.14%. Moreover, as can be seen in
Table 5, the IC
50 value of the fermented
R. ternate was lower than the IC
50 value of the unfermented, indicating that the ESE of
R. ternate has an enhanced inhibitory effect on α-amylase after fermentation.
4. Discussion
Microbial fermentation is an important method for the processing of traditional Chinese medicine. During the microbial fermentation process of traditional Chinese medicine, due to the metabolic effects of microorganisms and the presence of active enzymes, biological transformation reactions occur to modify and transform the active ingredients of traditional Chinese medicine. The transformed products often lead to changes in certain types of Chinese medicine components, increases or decreases in their efficacy, or changes in their properties [
27,
28].
According to the different types of fermentation, microbial fermentation methods can be divided into solid-state fermentation and liquid fermentation. The process of solid fermentation and the equipment it requires are simple, and it is currently mainly used for the direct fermentation of Chinese medicinal materials. Su found that the polyphenol content in
Acanthopanax senticosus was increased by 40% after solid-state fermentation [
29]. Strain selection is an important research topic in the microbial fermentation of Chinese medicine. Endophyte and host plants use the same or similar pathways for effective ingredient synthesis. Compared with single-strain fermentation, there is usually a good interaction between different mixed strains, which improves the yield of microbial fermentation [
30]. During the fermentation process, microorganisms can produce proteases, cellulases, and esterases, promoting the release of active ingredients and increasing the contents of effective ingredients. Therefore, in this study, the fermentation strain and fermentation endpoint were first determined based on the yields of ethanol-soluble extracts. It was found that the best ratio of strains was 1:1 for
Chaetomium globosum and
Fusarium equiseti. After 5 days of fermentation, the yield of ethanol-soluble extracts was the highest, indicating that the fermentation endpoint was reached. Then, using the yield of ethanol-soluble extracts as the indicator, single-factor tests and RSM experiments were used to determine the solid-state fermentation conditions of endophytic fungus in
R. ternate.
Microorganisms can only achieve efficient fermentation at appropriate fermentation temperatures, and high or low growth environment temperatures may cause activity to decrease or be lost, thereby affecting the contents of the fermentation products. The suitable temperature range for microbial growth is 16–30 °C, with a maximum temperature range of 37–43 °C. Therefore, in this research, a temperature suitable for microbial growth was selected to optimize the fermentation temperature. When the temperature is low, microbial growth is slow and metabolism is affected. When the temperature is high, it is easy to cause microbial deactivation, leading to a decreasing trend in the contents of fermentation products. Due to the different optimal growth temperatures of different strains, significant differences in fermentation temperatures were reported in a previous study, but temperatures of 28–32 °C had a good fermentation effect [
24,
31,
32]. The research results indicate that the fermentation effect is optimal when the fermentation temperature reaches 31 °C.
The moisture content in the fermentation substrate has an important impact on solid fermentation. When the liquid-to-material ratio is low, there is insufficient water and the mycelium grows slowly. When the liquid-to-material ratio is too high, it results in poor breathability and heat transfer, which are not conducive to the growth of strains [
29]. Due to the use of aerobic endophytic fungi in this study, the results showed that the highest yield of the ESE was achieved when the liquid-to-material ratio was 0.8:1 mL·g
−1. The inoculation amount also affects the fermentation effect. When the nutrient substrate is constant, at the beginning, the nutrients are sufficient for the growth of the mycelium, and the yield of the ESE has an upward trend. However, as the inoculation amount increases, the nutrients required for mycelial growth are insufficient, which is not conducive to mycelial growth and leads to a downward trend in the yield of the ESE. The research results indicate that the fermentation effect is best when the inoculation amount is 7.5%. Traditional Chinese medicine sieving refers to the process of screening Chinese medicinal materials through a mesh to remove some coarse and difficult-to-crush fibrous components in order to ensure the quality and purity of Chinese medicinal materials. The number of a sieve refers to the pore size of the sieve, which is the number of holes per inch on the sieve. If the number of a sieve is too large and the aperture of the sieve is smaller, it may lead to the loss of effective Chinese medicine ingredients, affecting the efficacy of the medicine. If the number of a sieve is too small and the aperture of the sieve is larger, it may prevent the complete removal of impurities from Chinese medicines, which affects their quality. The research results indicate that 40 mesh is the most suitable sieving number for the fermentation of
R. ternate to improve the ESE yield.
The contents of the active ingredients of the products of FRT by endophytic fungi were determined. The contents of the WSE and polysaccharides decreased by 12.71% and 12.95%, respectively, but the contents of the ESE, flavonoids, saponins, polyphenols, organic acids, and amino acids increased by 19.77%, 57.14%, 79.67%, 14.29%, 17.63%, and 3.82%, respectively, compared with RT. During the fermentation process, polysaccharides may be decomposed and consumed by the strains as a fermentation substrate, which may lead to a decrease in the polysaccharide content. Polysaccharides are water-soluble extracts, thus leading to a similar decrease in the yield of the WSE of
R. ternate after fermentation. Meanwhile, the results of the antioxidant and hypoglycemic capacities experiments found that the scavenging rates of FRT for DPPH radicals, ABTS
+ free radicals, and ·OH free radicals and the inhibitory rate of FRT for α-amylase increased compared with RT. Type 2 diabetic mellitus (T2DM) is one of the most common endocrine and metabolic diseases. Inhibition α- amylase can delay the digestion of starch in food in the intestinal tract, thus inhibiting the rise of postprandial blood sugar level, which is helpful for the diet treatment of T2DM. Although chemically synthesized drugs have clear therapeutic effects on lowering blood sugar, most drugs have side effects. Medicinal plants and their phytochemicals have a good therapeutic effect on T2DM [
33], which is not only safer, but also helps improve the body's antioxidant system and insulin resistance [
34]. Studies have shown that the antioxidant activity of plant extracts is related to the content of flavonoids, saponins, polyphenols and other substances [
35,
36,
37]. Polyphenols and flavonoids can regulate blood sugar level by promoting the synthesis and secretion of insulin, so as to inhibit glucose uptake and transport [
38]. Therefore, the increases in the contents of above substances in the fermented
R. ternate contribute to the enhancement in the antioxidant and digestive enzyme inhibitory activities of fermentation products produced by endophytic fungi. However, the antioxidant and hypoglycemic mechanism of the ESE of FRT is not yet clear, and the monomer substances of the ESE require further separation and purification. The protective effects of ESE of FRT need further comparative in vivo examination.
5. Conclusions
In this experiment, we used single-factor tests and an RSM to optimize the process for the solid-state fermentation of R. ternate: strain addition ratio of R12/S4 =1:1, fermentation for 5 d, sieve size of 40 mesh, liquid-to-material ratio of 0.8:1 mL·g−1, fermentation temperature of 31 °C, and inoculation amount of 7.5%. Under optimal conditions, the ESE, flavonoid, saponin, polyphenol, organic acid, and amino acid contents, and the antioxidant and hypoglycemic activities of the solid-sFtate endophytic fungus fermentation of R. ternate significantly increased, and the product quality was significantly improved. This experiment aimed to investigate the effects of endophyte on the fermentation of traditional Chinese medicine, which helped to explore the synergistic symbiotic effects between plants and microorganisms. Furthermore, the findings of in vitro antioxidant and digestive enzyme inhibition studies show that the ESE of fermented R. ternate has the potential to lower blood sugar, and may be used as the food supplements and medicinal production. This study can provide theoretical basis for the development of products with auxiliary hypoglycemic effects for R. ternate.
Author Contributions
Conceptualization, D.H. and X.Q.; methodology, X.L. and B.X.; software, D.D.; investigation, X.L., B.X., S.Z. and Z.L.; resources, Q.C.; data curation, J.C.; writing—original draft preparation, X.L.; writing—review and editing, D.H.; visualization, D.H.; supervision, Q.C.; project administration, D.H.; funding acquisition, D.H., X.Q. and Q.C. All authors have read and agreed to the published version of the manuscript.
Funding
This work was funded by Science and Technology Research Projects in Henan Province (222102110247 and 222102310440); the Innovation Demonstration Project for Major Special Projects of Henan Province (2011111310900); the Innovative Research Team in Xinyang Agriculture and Forestry University (XNKJTD-009); and the Youth Fund Project of Xinyang College of Agriculture and Forestry (QN2022025).
Institutional Review Board Statement
Not applicable.
Informed Consent Statement
Not applicable.
Data Availability Statement
Data are contained within the article.
Conflicts of Interest
The authors declare no conflict of interest.
References
-
Part 1: Medicinal Materials and Pieces; Pharmacopoeia of the People’s Republic of China; Chemical Industry Press: Beijing, China, 2020.
- Huang, X.; Zhao, Y.; Jin, X. Structural characterisation of a polysaccharide from Radix Ranunculus ternati. Iran. J. Pharm. Res. 2014, 13, 1403. [Google Scholar] [PubMed]
- Wang, A.W.; Tian, J.K.; Yuan, J.R.; Wu, L.M. The study survey and expectation of Chinese drug Radix Ranuunculi ternati. Chin. Pharm. 2005, 14, 25–27. [Google Scholar]
- Niu, L.; Zhou, Y.; Sun, B.; Hu, J.; Kong, L.; Duan, S. Inhibitory effect of saponins and polysaccharides from Radix ranunculi ternati on human gastric cancer BGC823 cells. Afr. J. Tradit. Complement. Altern. Med. 2013, 10, 561–566. [Google Scholar] [CrossRef]
- Zhang, L.; Li, R.; Li, M.; Qi, Z.; Tian, J. In vitro and in vivo study of anti-tuberculosis effect of extracts isolated from Ranunculi ternati Radix. Sarcoidosis Vasc. Diffus. Lung Dis. Off. J. Wasog 2015, 31, 336–342. [Google Scholar]
- Zhan, Z.; Feng, Z.; Yang, Y.; Li, L.; Jiang, J.; Zhang, P. Ternatusine A, a new pyrrole derivative with an epoxyoxepino ring from Ranunculus ternatus. Org. Lett. 2013, 15, 1970–1973. [Google Scholar] [CrossRef]
- Fang, M.; Shinomiya, T.; Nagahara, Y. Cell death induction by Ranunculus ternatus extract is independent of mitochondria and dependent on Caspase-7. 3 Biotech 2020, 10, 123. [Google Scholar] [CrossRef]
- Sun, D.; Xie, H.B.; Xia, Y.Z. A study on the inhibitory effect of polysaccharides from Radix ranunculus ternate on human breast cancer MCF-7 cell lines. Afr. J. Tradit. Complement. Altern. Med. 2013, 10, 439–443. [Google Scholar] [CrossRef] [PubMed]
- Pei, Y.; Cheng, F.; Li, W.; Yu, Q.; Ma, C.; Zou, Y.; Xu, T.; Liu, S.; Zhang, S.; Wang, Q. Enhancement of anti-inflammatory effect of cattle bile by fermentation and its inhibition of neuroinflammation on microglia by inhibiting NLRP3 inflammasome. J. Biosci. Bioeng. 2022, 133, 146–154. [Google Scholar] [CrossRef]
- Li, C.; Ma, L.; Wang, L.; Zhang, Z.; Chen, Y.; Chen, J.; Jiang, Q.; Song, Z.; He, X.; Tan, B.; et al. Optimization of Solid-State Fermentation Conditions of Quercus liaotungensis by Bacillus subtilis. Fermentation 2023, 9, 75. [Google Scholar] [CrossRef]
- Lee, S.O.; Choi, S.Z.; Choi, S.U.; Ryu, S.Y.; Lee, K.R. phytochemical constituents of the aerial parts from Aster hispidus. Nat. Prod. Sci. 2005, 10, 335–340. [Google Scholar]
- Kaul, S.; Sharma, T.; Dhar, M.K. “Omics” Tools for understanding the plant-endophyte interactions. Front. Plant Sci. 2016, 7, 955. [Google Scholar] [CrossRef] [PubMed]
- Saikkonen, K.; Wäli, P.; Helander, M.; Faeth, S.H. Evolution of endophyte–plant symbioses. Trends Plant Sci. 2004, 9, 275–280. [Google Scholar] [CrossRef] [PubMed]
- Toofanee, S.B.; Dulymamode, R. Fungal endophytes associated with Cordemoya integrifolia. Fungal Divers. 2002, 11, 169–175. [Google Scholar]
- Chithra, S.; Jasim, B.; Sachidanandan, P.; Jyothis, M.; Radhakrishnan, E.K. Piperine production by endophytic fungus Colletotrichum gloeosporioides isolated from Piper nigrum. Phytomedicine 2014, 21, 534–540. [Google Scholar] [CrossRef]
- Jiang, S.; Duan, J.A.; Tao, J.H.; Yan, H.; Zheng, J.B. Ecological distribution and elicitor activities of endophytic fungi in Changium smyrnioides. Chin. Tradit. Herbal. Drugs 2010, 41, 121–125. [Google Scholar]
- Qiao, X.R.; Wang, Z.X.; Ye, R.; Chen, Q. Study on antioxidant activity and optimization of fermentation conditions of extracellular polysaccharide produced by endophytic fungus Radix Ranunculi Ternate. Cereals & Oils 2022, 35, 131–136. [Google Scholar]
- Zhang, A.; Shen, Y.; Cen, M.; Hong, X.; Shao, Q.; Chen, Y.; Zheng, B. Polysaccharide and crocin contents, and antioxidant activity of saffron from different origins. Ind. Crops Prod. 2019, 133, 111–117. [Google Scholar] [CrossRef]
- Jing, C.L.; Dong, X.F.; Tong, J.M. Optimization of Ultrasonic-Assisted Extraction of Flavonoid Compounds and Antioxidants from Alfalfa Using Response Surface Method. Molecules 2015, 20, 15550–15571. [Google Scholar] [CrossRef]
- Hu, X.; Tang, J.R.; Zhang, G.L.; Deng, J.; Kan, H.; Zhang, Y.J.; Zhao, P.; Liu, Y. Optimization of extraction process and antioxidant activities of saponins from Camellia fascicularis leaves. J. Food Meas. Charact. 2021, 15, 1889–1898. [Google Scholar] [CrossRef]
- Nag, S.; Sit, N. Optimization of ultrasound assisted enzymatic extraction of polyphenols from pomegranate peels based on phytochemical content and antioxidant property. J. Food Meas. Charact. 2018, 12, 1734–1743. [Google Scholar] [CrossRef]
- Yang, X.; Xu, D. Determination of organic acid content of R. ternate from different origins. Anhui Med. 2011, 15, 1214–1215. [Google Scholar]
- Ijarotimi, O.S.; Olopade, A.J. Determination of amino Acid content and protein quality of complementary food produced from locally available food materials in ondo state, Nigeria. Mal. J. Nutr. 2009, 15, 87–95. [Google Scholar]
- Li, C.; Ma, L.; Wang, L.; Zhang, Z.; Chen, Y.; Chen, J.; Jiang, Q.; Song, Z.; He, X.; Tan, B.; et al. Optimization of Solid-State Fermentation Conditions of Quercus liaotungensis by Bacillus subtilis. Fermentation 2023, 9, 75. [Google Scholar] [CrossRef]
- Chen, S.H.; Chen, H.X.; Tian, J.G.; Wang, Y.W.; Xing, L.S.; Wang, J. Chemical modification, antioxidant and α-amylase inhibitory activities of corn silk polysaccharides. Carbohyd. Polym 2013, 98, 428–437. [Google Scholar] [CrossRef] [PubMed]
- Ye, C.L.; Jiang, C.J. Optimization of extraction process of crude polysaccharides from Plantago asiatica L. by response surface methodology. Carbohydr. Polym. 2011, 84, 495–502. [Google Scholar] [CrossRef]
- Fu, Y.; Yin, Z.; Wu, L.; Yin, C. Fermentation of ginseng extracts by Penicillium simplicissimum GS33 and anti-ovarian cancer activity of fermented products. World J. Microbiol. Biotechnol. 2014, 30, 1019–1025. [Google Scholar] [CrossRef]
- Eom, S.H.; Lee, D.S.; Kang, Y.M.; Son, K.T.; Jeon, Y.J.; Kim, Y.M. Application of yeast Candida utilis to ferment Eisenia bicyclis for enhanced antibacterial effect. Appl. Biochem. Biotechnol. 2013, 171, 569–582. [Google Scholar] [CrossRef]
- Su, J.; Fu, X.; Zhang, R.; Li, X.; Li, Y.; Chu, X. Exploring the Effects of Solid-State Fermentation on Polyphenols in Acanthopanax senticosus Based on Response Surface Methodology and Nontargeted Metabolomics Techniques. J. Food Biochem. 2023, 2023, 6711132. [Google Scholar] [CrossRef]
- Hua, H. Research on the Process of Fermentation to Enhance the Flavonoids and Anti-Radiation Function of Serratia marcescens; Northeast Forestry University: Harbin, China, 2018. [Google Scholar]
- Maurya, D.P.; Singh, D.; Pratap, D.; Maurya, J.P. Optimization of solid state fermentation conditions for the production of cellulase by Trichoderma reesei. J. Environ. Biol. 2012, 33, 5. [Google Scholar]
- Jin, Y.L.; Ding, F.; Shen, W.L.; Fang, Y.; Yi, Z.L.; Yang, L.; Zhao, H. Production of microbiological protein feed from sweet potato (Ipomoea batatas L. lam) residue by co-cultivation saccharomyces cerevisiae and Candida utilis. JAPS J. Anim. Plant Sci. 2023, 33, 592–600. [Google Scholar]
- Ota, A.; Ulrih, N. P. An overview of herbal products and secondary metabolites used for management of type two diabetes. Front. Pharmacol. 2017, 8, 436. [Google Scholar] [CrossRef] [PubMed]
- Vinayagam, R.; Xu, B.J. Antidiabetic properties of dietary flavonoids: a cellular mechanism review. Nurt. Metab. 2015, 12, 1–20. [Google Scholar] [CrossRef] [PubMed]
- Shakya, S.; Danshiitsoodol, N.; Sugimoto, S.; Noda, M; Sugiyama, M. Anti-oxidant and anti-inflammatory substance generated newly in Paeoniae Radix Alba extract fermented with plant-derived Lactobacillus brevis 174A. Antioxidants 2021, 10, 1071. [Google Scholar] [CrossRef] [PubMed]
- Wang, Z.; Li, C.; He, X.; Xu, K.; Xue, Z.; Wang, T.; Xu, Z.; Liu, X. Platycodon grandiflorum root fermentation broth reduces inflammation in a mouse IBD model through the AMPK/NF-κB/NLRP3 pathway. Food Funct. 2022, 13, 3946–3956. [Google Scholar] [CrossRef]
- Tan, J.; Li, Q.; Xue, H.; Tang, J. Ultrasound-assisted enzymatic extraction of anthocyanins from grape skins: Optimization, identification, and antitumor activity. J. Food Sci. 2020, 85, 3731–3745. [Google Scholar] [CrossRef]
- Hanhineva, K.; Törrönen, R.; Bondia-Pons, I.; Pekkinen, J.; Kolehmainen, M.; Mykkänen, H.; Poutanen, K. Impact of dietary polyphenols on carbohydrate metabolism. Int. J. Mol. Sci. 2010, 11, 1365–1402. [Google Scholar] [CrossRef]
|
Disclaimer/Publisher’s Note: The statements, opinions and data contained in all publications are solely those of the individual author(s) and contributor(s) and not of MDPI and/or the editor(s). MDPI and/or the editor(s) disclaim responsibility for any injury to people or property resulting from any ideas, methods, instructions or products referred to in the content. |
© 2024 by the authors. Licensee MDPI, Basel, Switzerland. This article is an open access article distributed under the terms and conditions of the Creative Commons Attribution (CC BY) license (http://creativecommons.org/licenses/by/4.0/).
