1. Introduction
SARS-CoV-2 is a human-infecting β-coronavirus found in Wuhan in December 2019 [
1]. The disease caused by its infection was initially named 2019-nCoV by the World Health Organization (WHO) on January 12, 2020, and then formally named COVID-19, or novel coronavirus pneumonia, on February 1 [
2]. According to WHO, more than 770 million cases have been reported, with 7 million reported deaths [
3]. In this outbreak, SARS-CoV-2 from an unknown animal source possibly in seafood market might have crossed the species barrier to infect humans [
4]. Although the likelihood of food-to-human transmission is considered lower than other ways such as respiratory droplets and cs, it should not be neglected as a risk factor given the large volumes of refrigerated foods being transported across different countries and regions [
5]. SARS-CoV-2 virions adhering on the solid surface are reported to be sable, with a viability up to longer than 72 h (on plastic) [
6]. Therefore, sensitive, fast, and low-cost SARS-CoV-2 detection is urgently needed for cold-chain foods.
SARS-CoV-2 is a spherical or pleomorphic enveloped particles containing single-stranded (positive-sense) RNA associated with a nucleoprotein within a capsid comprised of matrix protein [
7]. The four main structural proteins encoded by COVID-19 are envelope protein (E protein), spike protein (S protein), membrane protein (M protein) and nucleocapsid protein (N protein) [
8]. These four proteins are important for viral infection of cells and replication and transcription [
7,
9]. Among them, S protein is a protruding protein widely distributed on the surface of the viral envelope that mainly mediates the fusion of the viral and host cell membranes [
10]. It consists of two subunits, S1 and S2: S1 mainly contains the receptor binding domain (RBD), which is responsible for recognizing cellular receptors [
11]. A recent study has shown that N-protein-based assays are more sensitive for detecting SARS-CoV-2 infection, while S-protein-based assays are more specific [
12], and thus S-proteins are equally valuable as assay targets and can be used as biomarkers in antigen detection.
Currently, there are various detection methods for SARS-CoV-2, which are broadly classified into three categories: (1) Nucleic acid detection [
13], including fluorescence quantitative PCR [
14], microfluidic chip [
15], Isothermal amplification technique [
16], etc. Real-time fluorescence quantitative PCR (RT-qPCR) is the method for detecting the viral RNA in the samples from the upper respiratory tract, featuring high specificity, high sensitivity, and pre-infection detectability [
13]. Since the outbreak of the epidemic, nucleic acid testing has been used as the “gold standard” for the diagnosis of SARS-CoV-2. (2) Serological test [
17]. Serologic testing is a method for detecting the presence of SARS-CoV-2 specific antibodies (IgM/IgG) in a patient’s blood. (3) Antigen detection [
18]. Antigen detection is a method that utilizes specific monoclonal antibodies prepared against the antigenic proteins of the SARS-CoV-2 to detect the intrinsic components of the virus, such as the N and S proteins of the SARS-CoV-2, using immunofluidic chromatography [
19], enzyme-linked immunosorbent assay [
20], chemiluminescence [
21], and other methods. One of them, colloidal gold immunochromatographic assay [
22] is widely utilized due to its simplicity, speed, and low cost for quick detection in food safety and public healthcare.
Lateral flow assays (LFAs) [
19] are one type of diagnostic schemes that can provide rapid, point-of-care results. Aptamers are single strand nucleic acid sequences that fold into secondary structures and have target binding affinities on par with antibodies [
23]. As chemically synthesized agents, aptamers are also produced more affordably and reproducibly than antibodies [
24], and also have multifarious other advantages such as good specificity, long-term stability during storage, ease to produce, liable modification, and meritful flexibility in different sensing formats, making them well suited for rapid virus detection. Currently, the application of the combination of aptamers and lateral flow assays to the development of target identification has yielded many results [
25,
26,
27]. DNA aptamers against SARS-CoV-2 S protein have been successfully identified using an in vitro iterative library selection process called the systematic evolution of ligands by exponential enrichment (SELEX) [
28].
In this work, the “universal” aptamer MSA52 was chosen as the detection aptamer, which showed generally high affinity for wild-type SARS-CoV-2 spiking proteins, as well as Alpha, Beta, Gamma, Epsilon, Kappa, Delta and Omicron proteins, with KD values ranging from 2-10 nM [
29]. A lateral flow chromatography test strip based on nucleic acid aptamers using nanogold as a chromogenic agent was successfully developed, and an aptamer engineering approach was used to select a capture aptamer with high binding affinity, and the application of the optimized conditions was successfully validated for the on-site screening of SARS-CoV-2 SP in cold-chain food packages, both visually and quantitatively.
3. Discussion
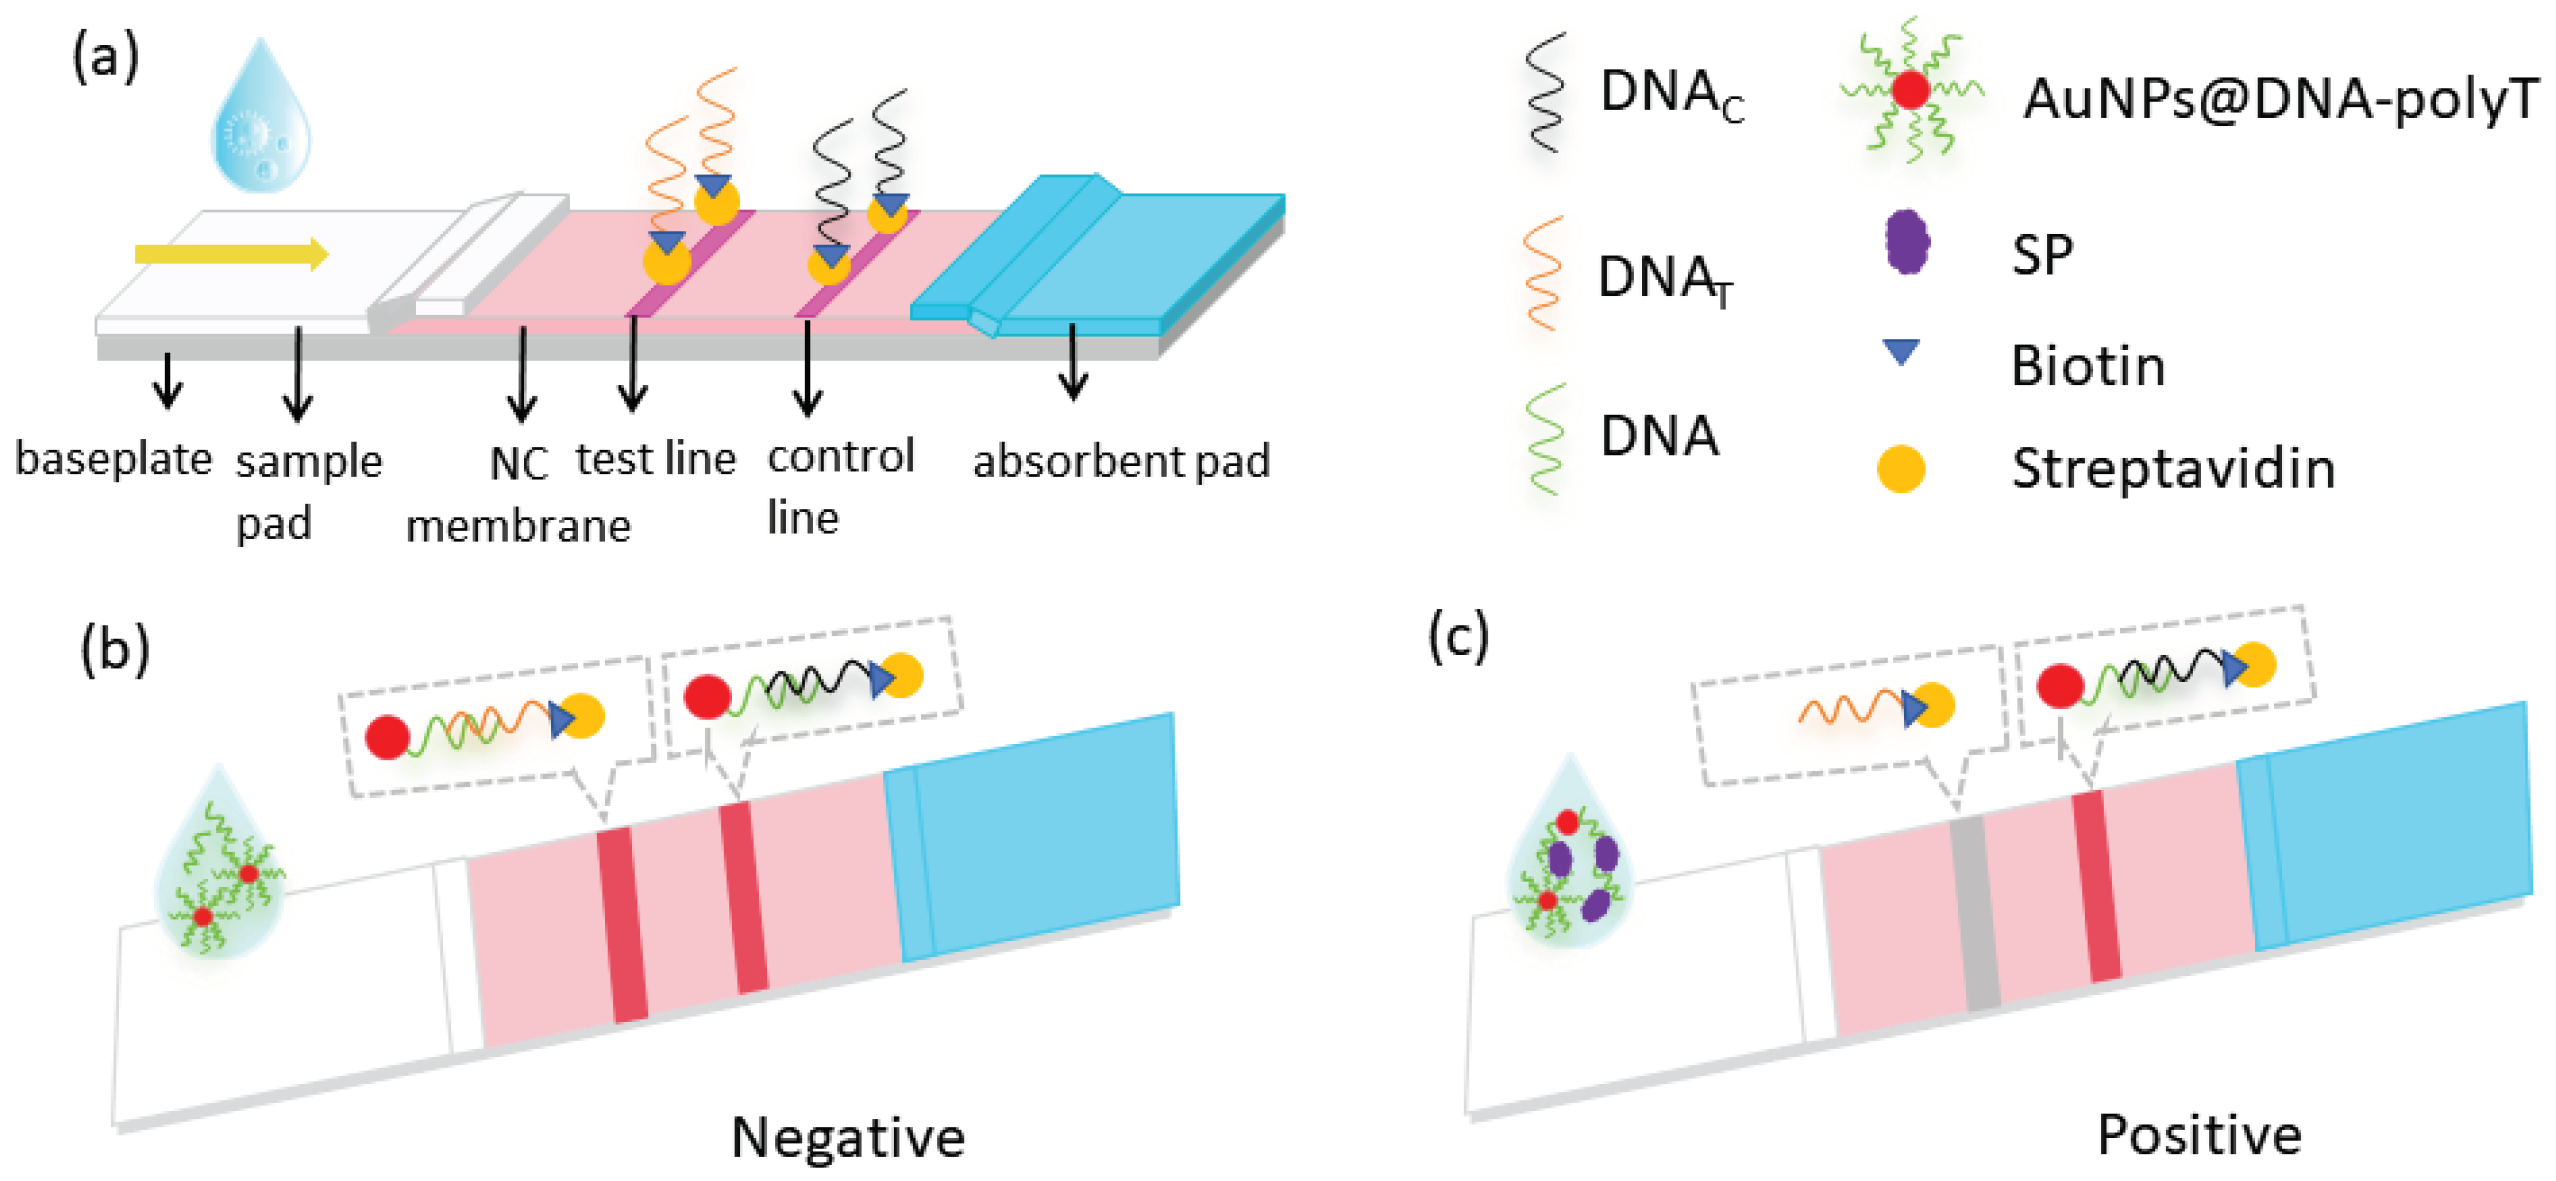
In this experiment, the principle of competition method was designed as shown in
Figure 8, which is essentially a competitive interaction between the aptamer-complementary chain on the T-line and the SP for AuNPs−aptamer conjugates. The paper strip was formed by using AuNPs as color developer, aptamer coupled with AuNPs as recognition element, and the aptamer complementary chain as capture probe. One end of the aptamer that binds to the S protein modiifies sulfhydryl groups and couples AuNPs, and the other end adds 10 T bases (ploy T) to form AuNPs−aptamer-poly T complex. The sample solution flows along the NC membrane by capillary action. In the absence of SP in the sample solution, the aptamers in complexes will pair with the complementary pairing of the T-line, while the DNA
C (poly A) immobilized in the C-line binds complementarily to poly T, causing two red bands to appear; when SP exists in the sample, the AuNPs-aptamers in the sample binds to the SP, thus weakening the binding force of the complementary sequences on the T-line, and the color of the test line will become lighter. As the concentration of the SP is larger, the color of the T-line becomes lighter until it disappears.
The effect of AuNPs-aptamers is critical to the sensitivity of the assay. Due to electrostatic repulsion, colloidal gold produced by the reduction method of trisodium citrate is negatively charged by the encapsulation of trinitrate citrate anion and distributed in an aqueous solution [
31]. It is well known that owing to the negatively charged colloidal gold particles can be sheltered by the Na
+, which causes the colloidal gold particles to combine due to hydrophobic interaction and van der Waals forces. The aptamer should be covalently joined to the AuNPs through Au-S to create functionalized AuNPs. In terms of the three coupling methods (salt aging [
30], freezing [
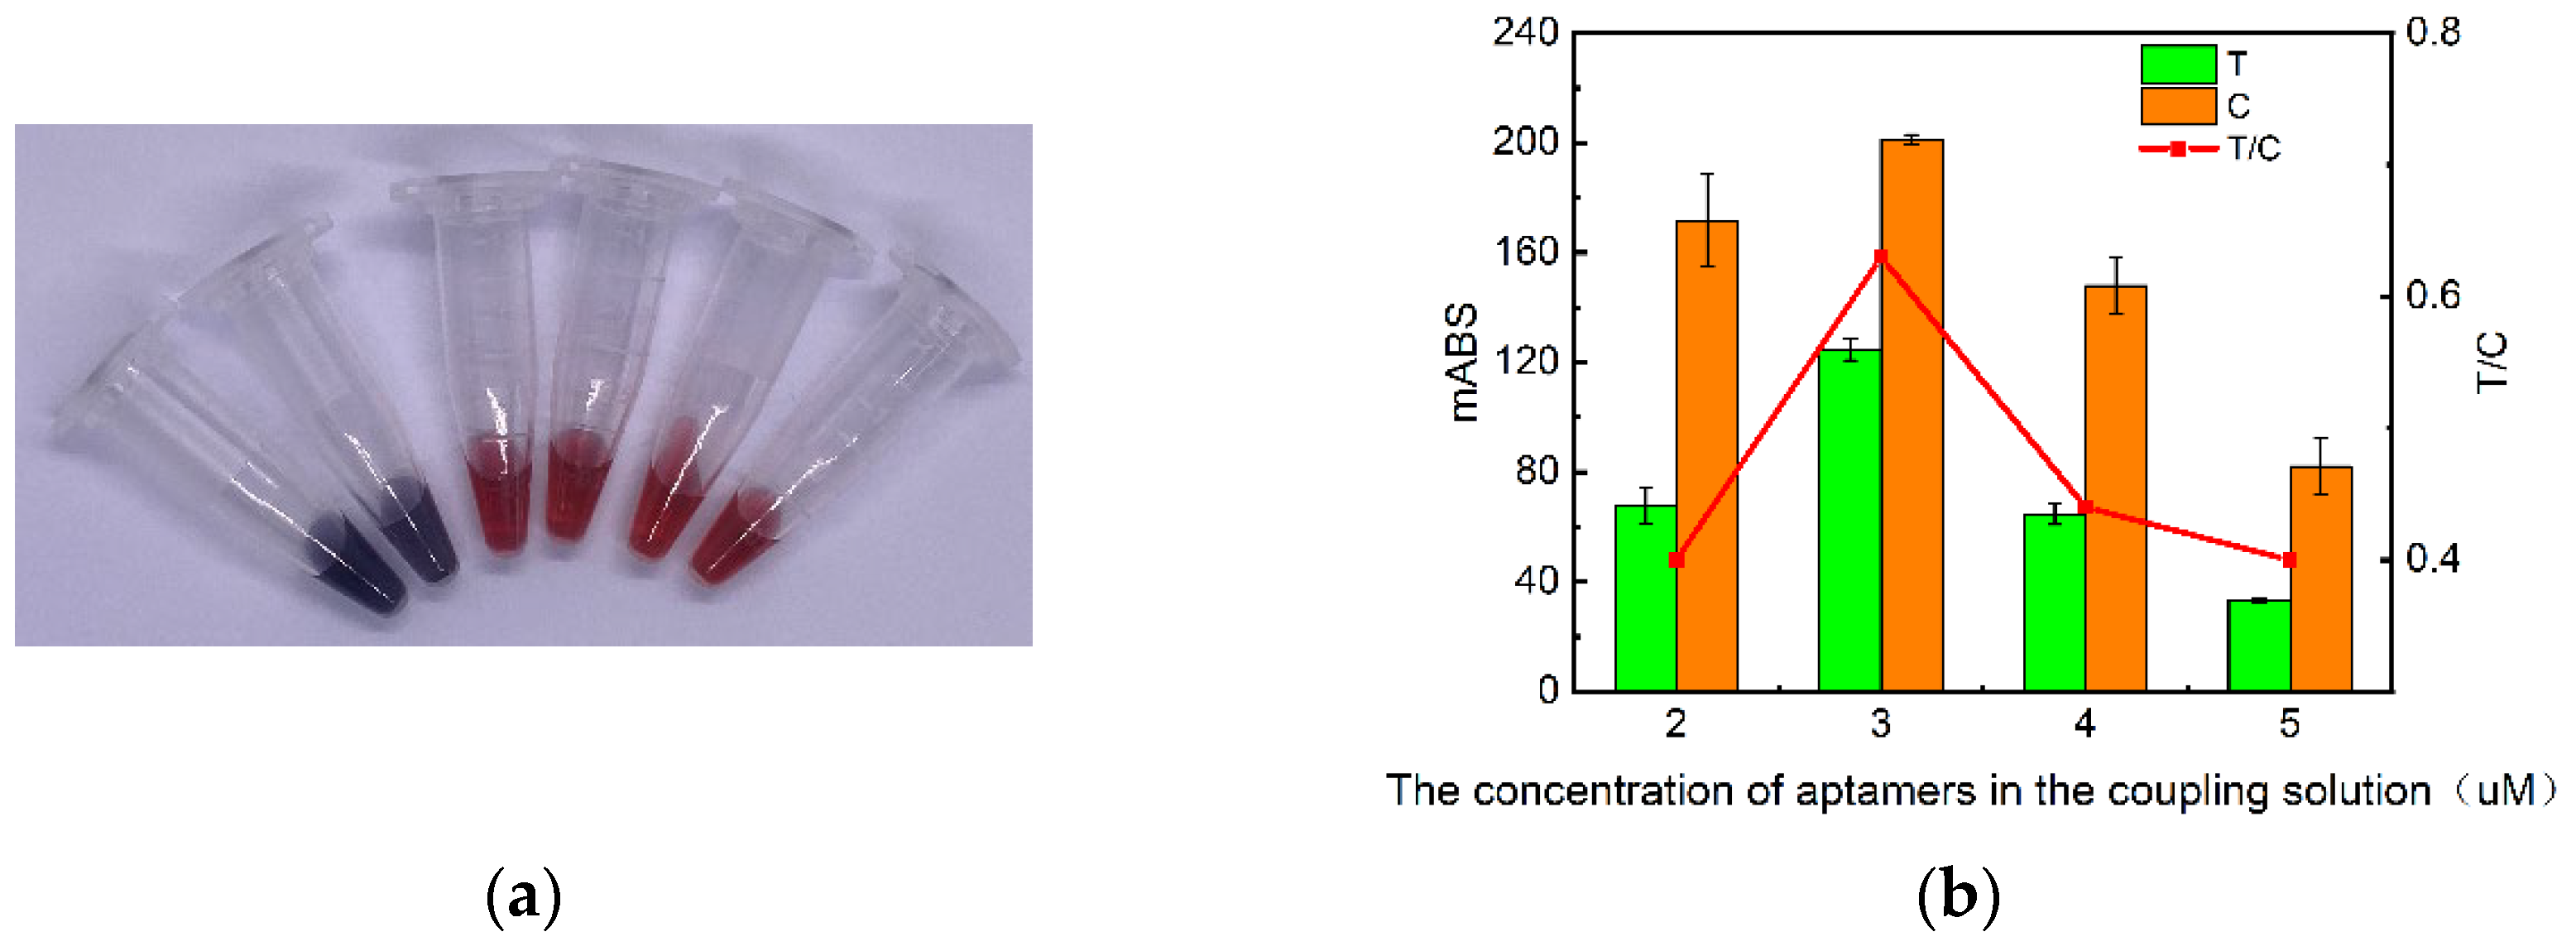
32], and low pH), the solution coupled by the traditional salt aging method is relatively time-consuming, but its coupled solution is the most stable and can be left for at least one month. In the coupling process, too little aptamer addition is not enough to protect the nanogold. Too much aptamer addition will result in too much free aptamer in the coupling solution, reducing the binding of the aptamer of the coupled AuNPs to the S protein, so that even after the addition of the protein there is still free aptamer binding to the complementary chain. Therefore, the optimal amount of aptamer to be added was determined by the state of the coupling solution and the color development of the test strip.
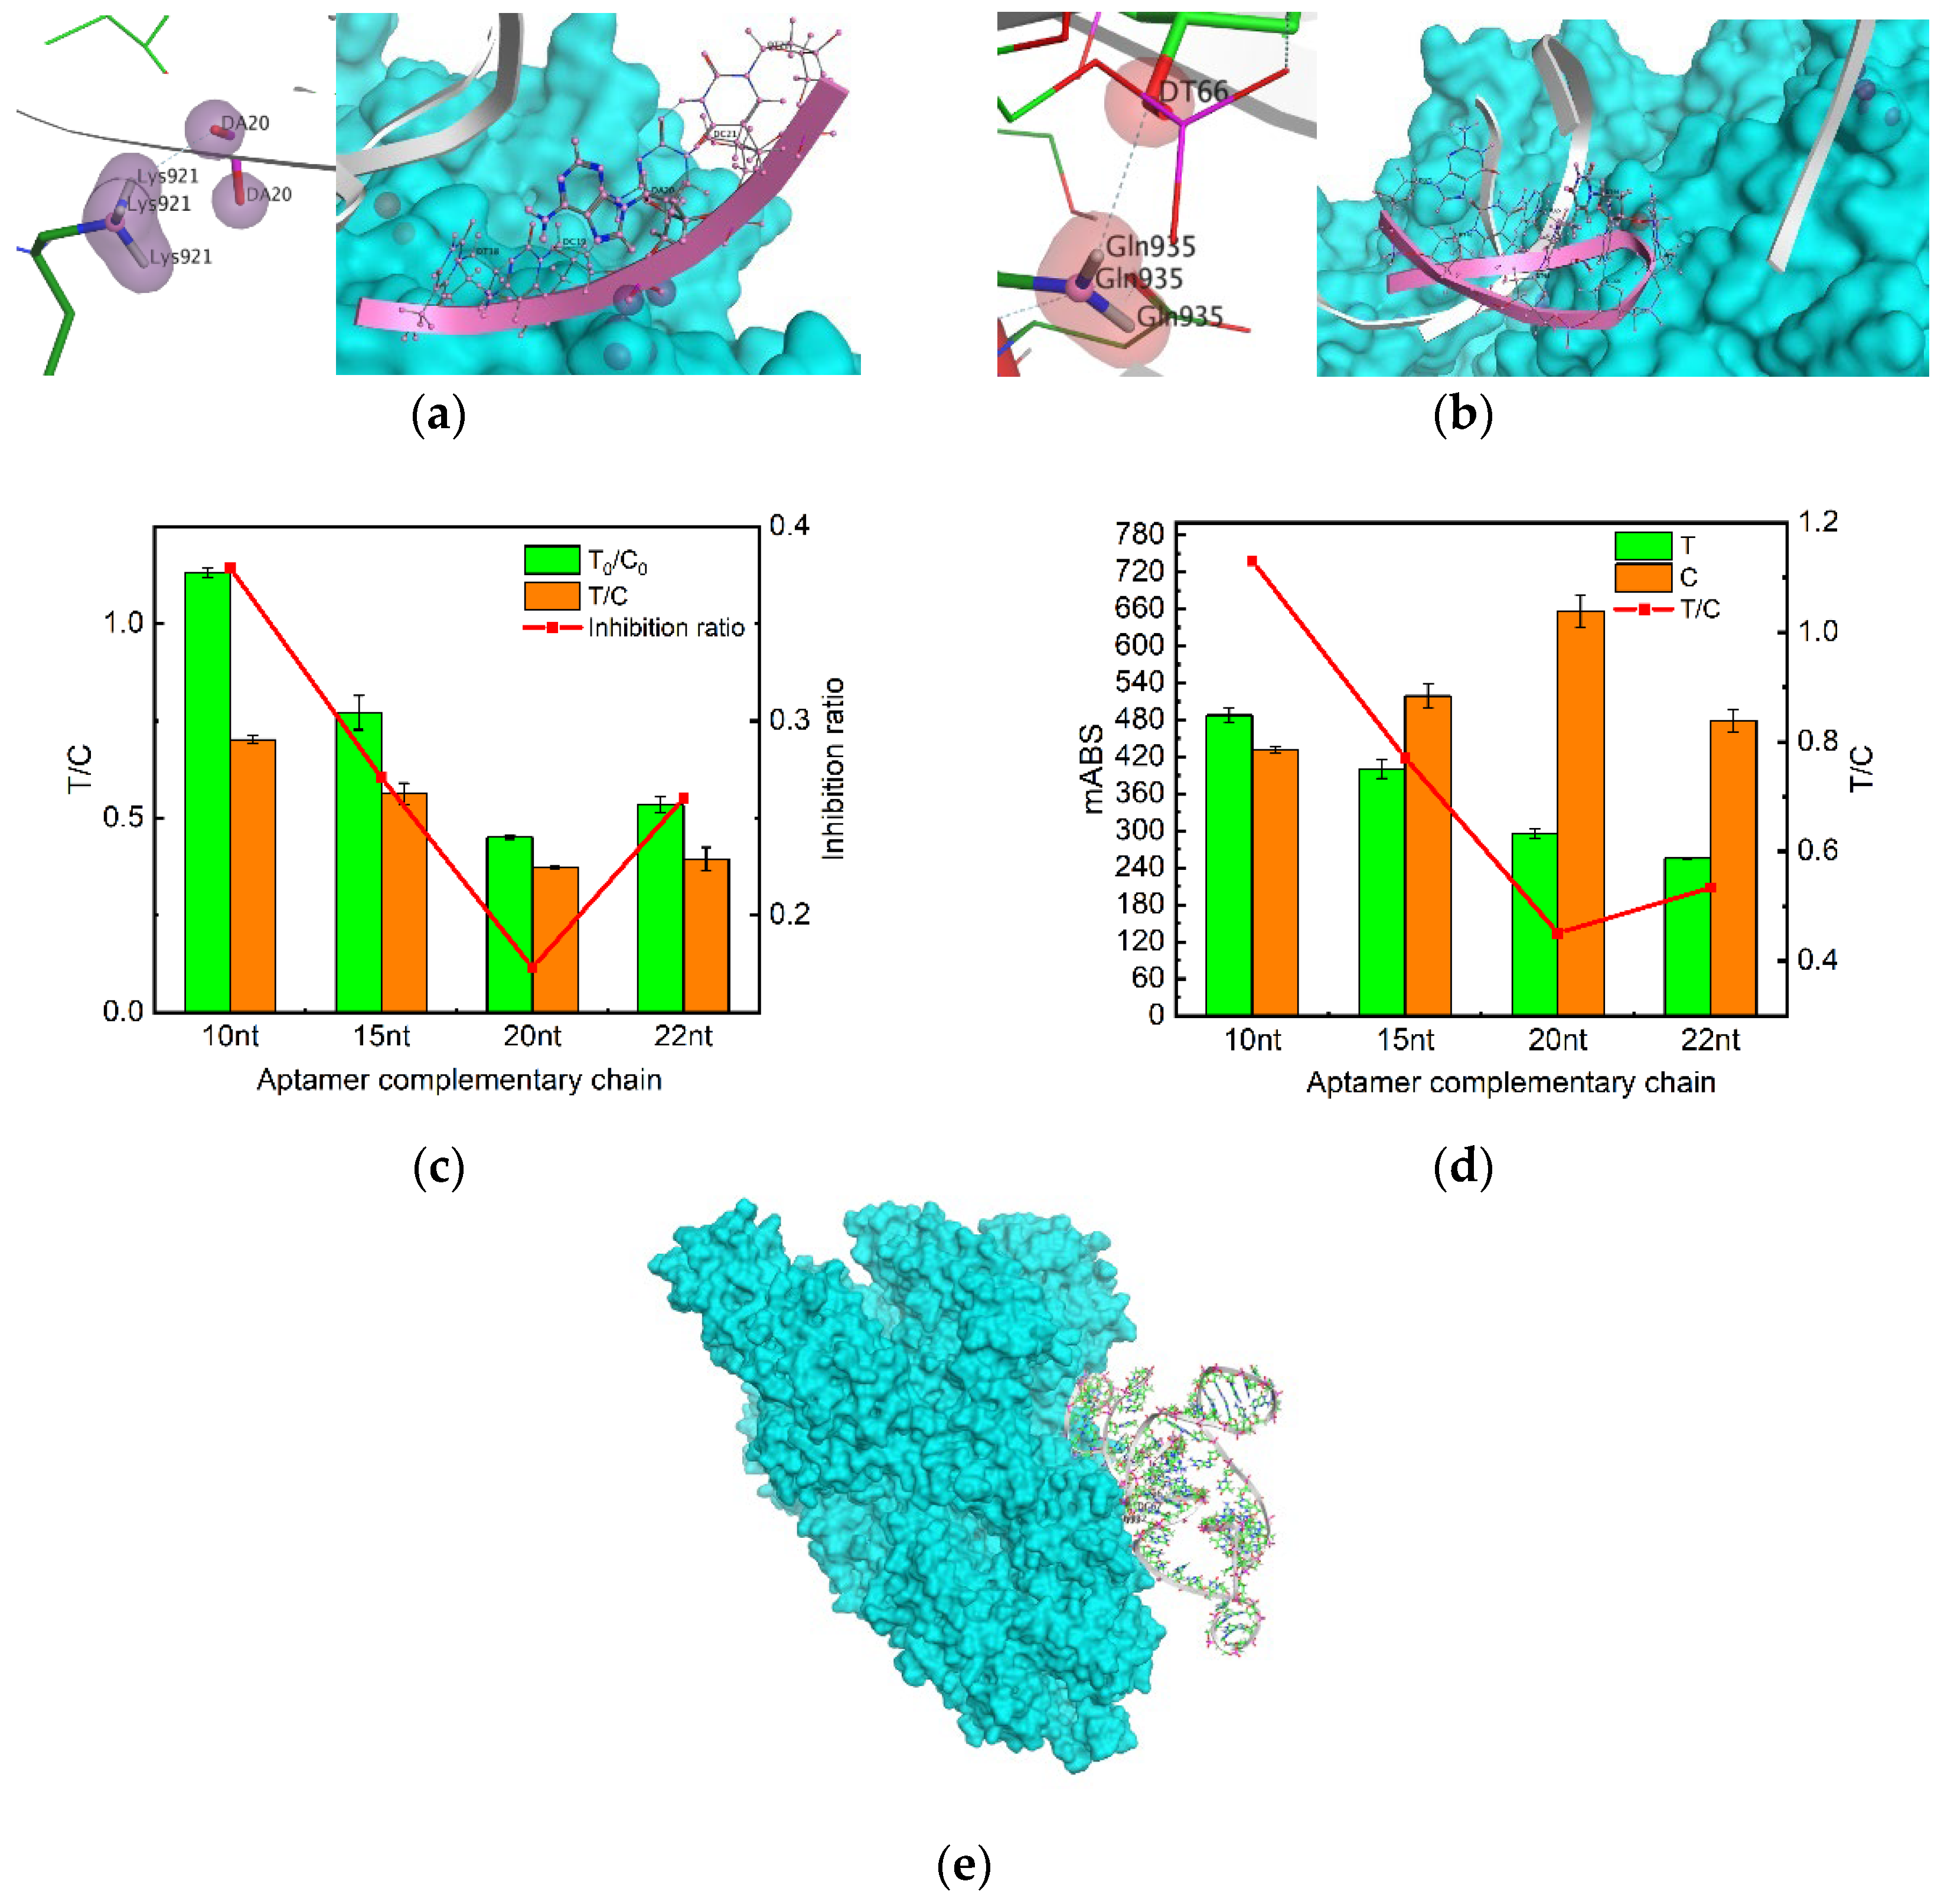
In addition, another decisive factor is the choice of T-line aptamer complementary chains. The aptamers screened from nucleic acid libraries generally have a length of ~80 bases, but the region that exerts target binding is only 10-15 nucleotides [
33]. If the selected complementary chain is not its active site for protein binding, the complementary chain will still be complementary to the aptamer, even if the SP binds to the aptamer after adding the SP, resulting in a decrease in sensitivity, which is not conducive to the experiment. Therefore, MOE molecular docking was utilized to simulate effective binding sites and simplify the selection process of complementary sequences. On this basis, different complementary chain lengths were set to obtain the best reaction result. Finally, we decided to retain the four truncated aptamers, MSA52-10, MSA52-15, MSA52-20, and MSA52-22. Then the blank and spiking experiments were carried out respectively, in which the best color development and the highest inhibition rate were found to be MSA52-10. This may be due to the fact that the base that is not at the effective site will still bind to the complementary chain, even if the aptamer and SP successfully bind. In this way, we can save costs and improve the sensitivity of the experiment.
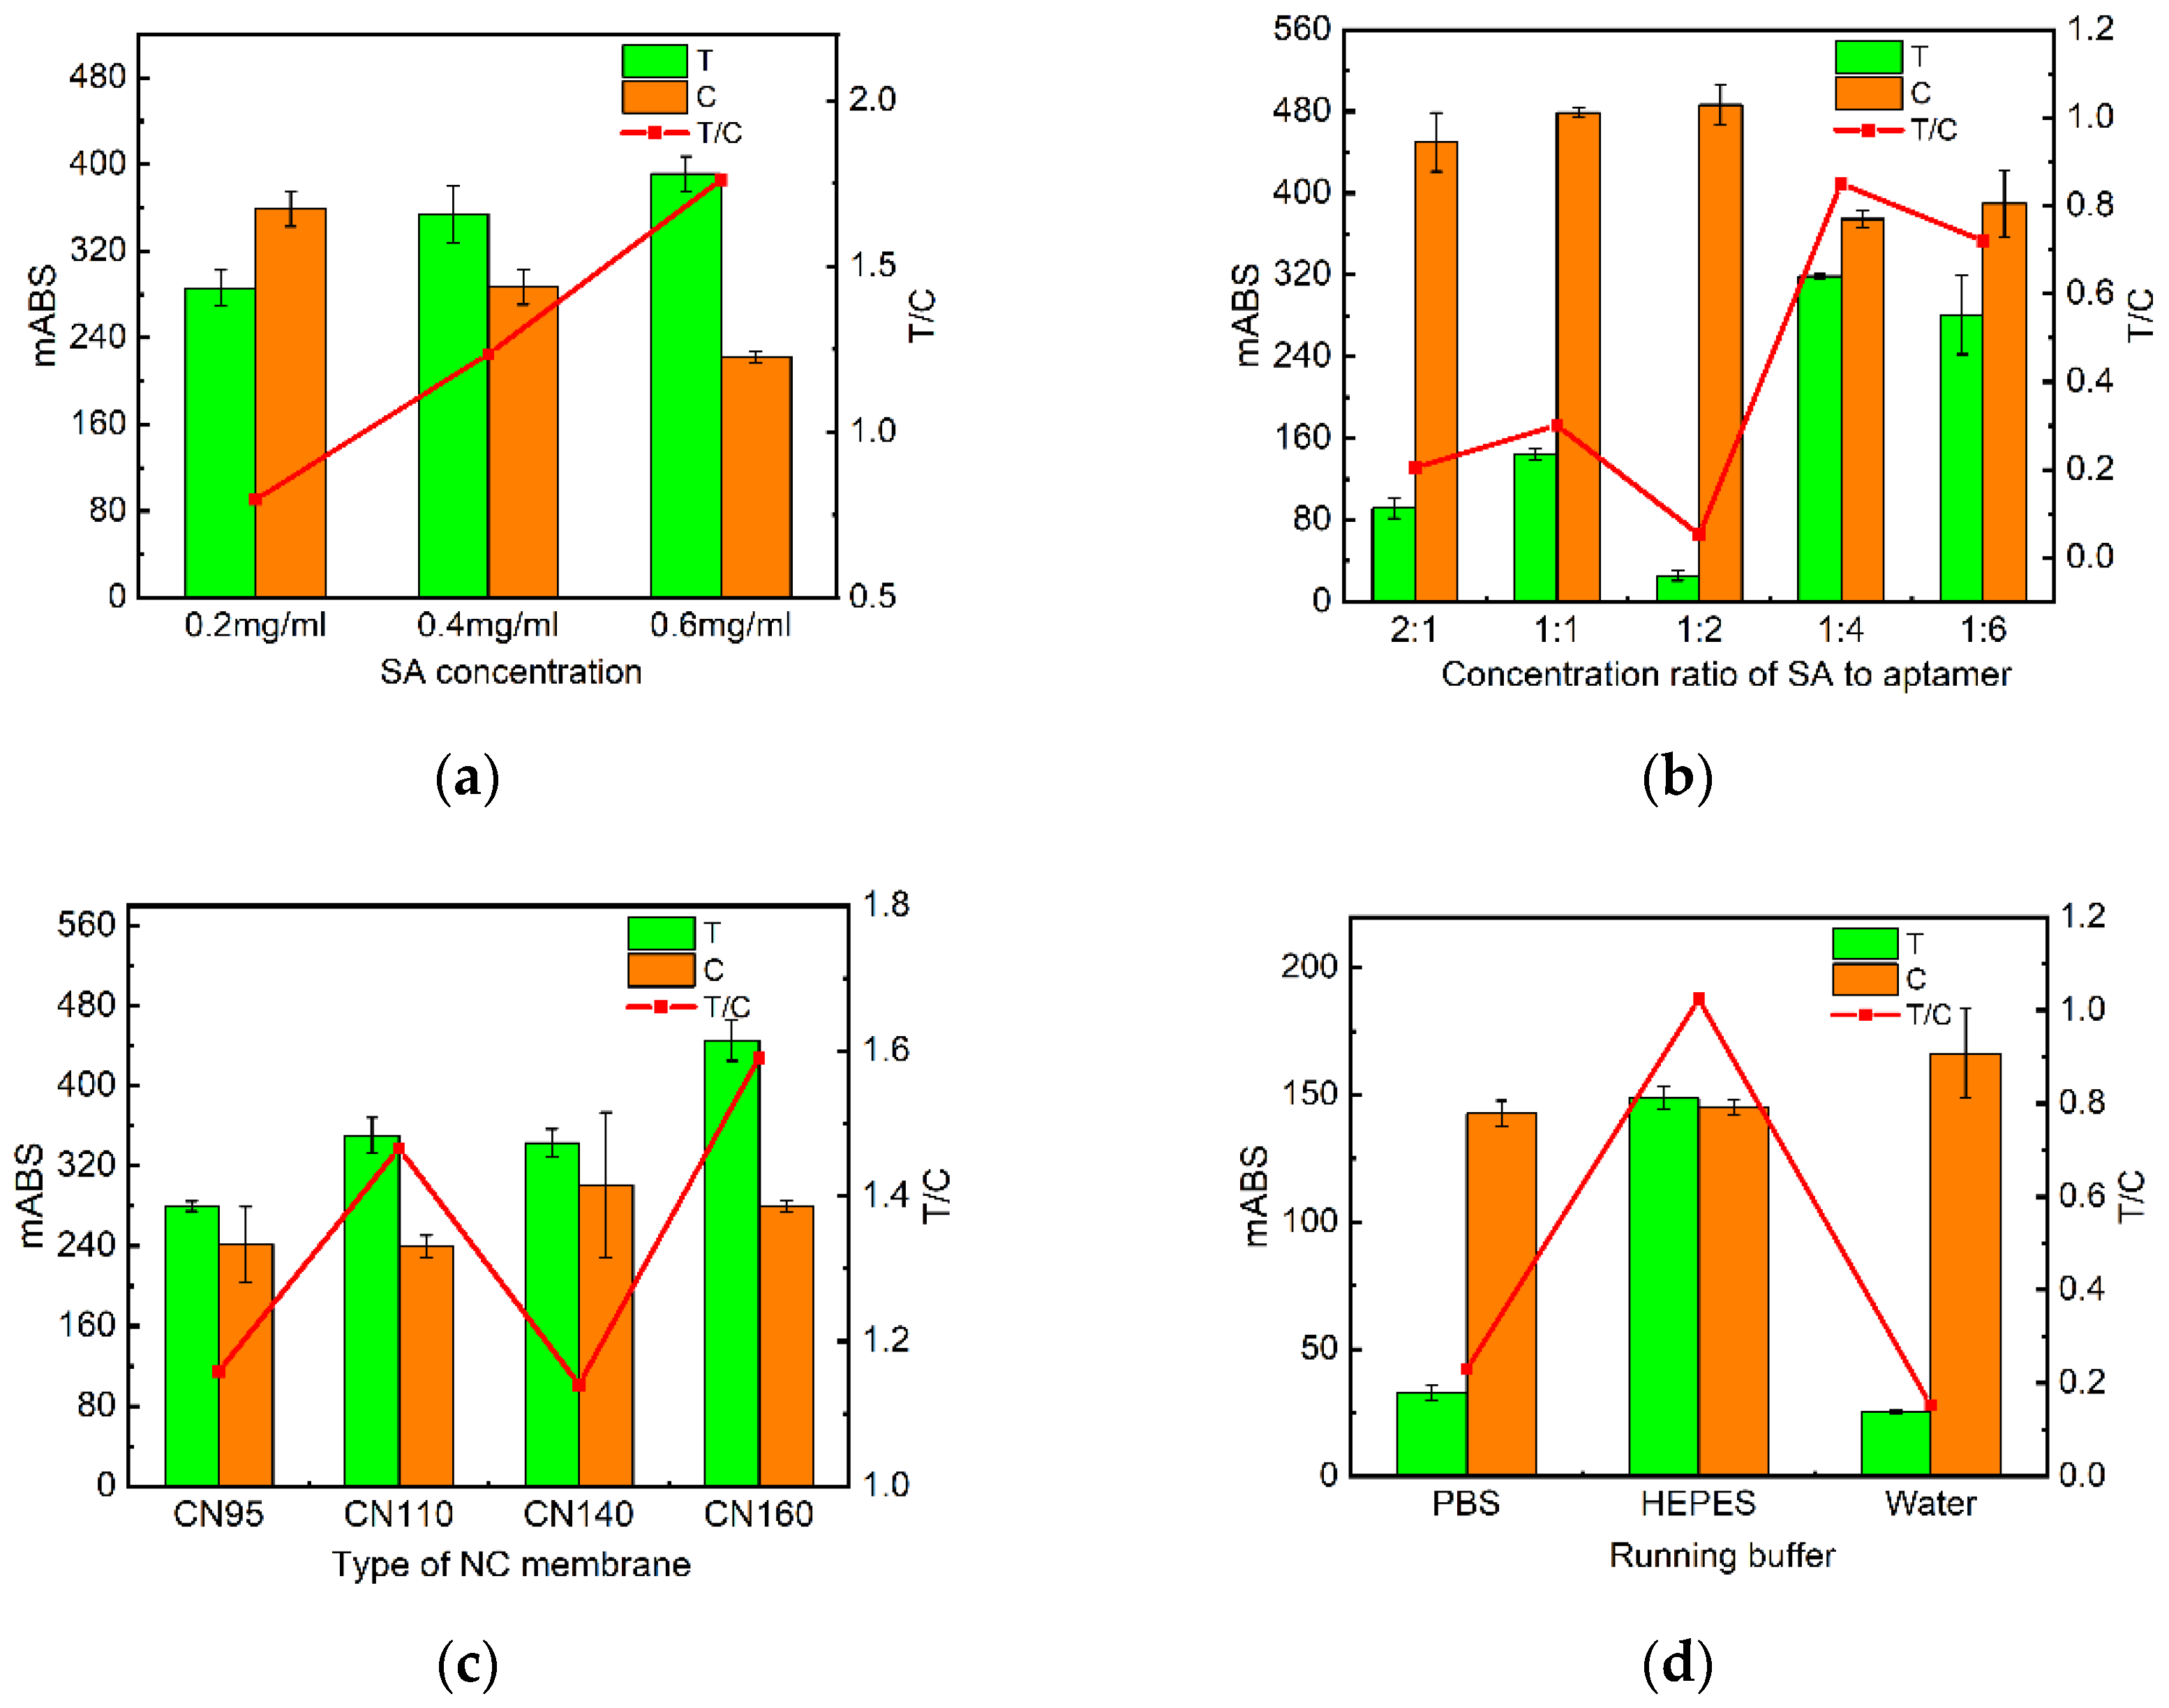
Then the conditions of the test strip were optimized. The coupling status of SA with biotin-modified probes not only impacts the amount of probe immobilization on NC membranes but also influences the binding efficiency of probes to nucleic acids [
34]. The higher the SA concentration, the more aptamers are bound. However, too much SA will cover the aptamers, resulting in insufficient aptamers. Nitrocellulose membrane is the largest pad in the test strip, which is decisive for the sensitivity of the test strip [
35]. Different NC membrane types have different pore sizes and chromatographic properties with different flow rates. In addition, the running buffer is vital for the spatial structure of the aptamer and directly contributes to the binding of the aptamer to the target [
36].Excessive addition of AuNPs-Aptamer will interfere with the experimental detection limit, and the addition of too little sample is not enough to develop the color. Finally, an effective detection time frame is the most important. We select the best reaction conditions by color rendering and absorbance.
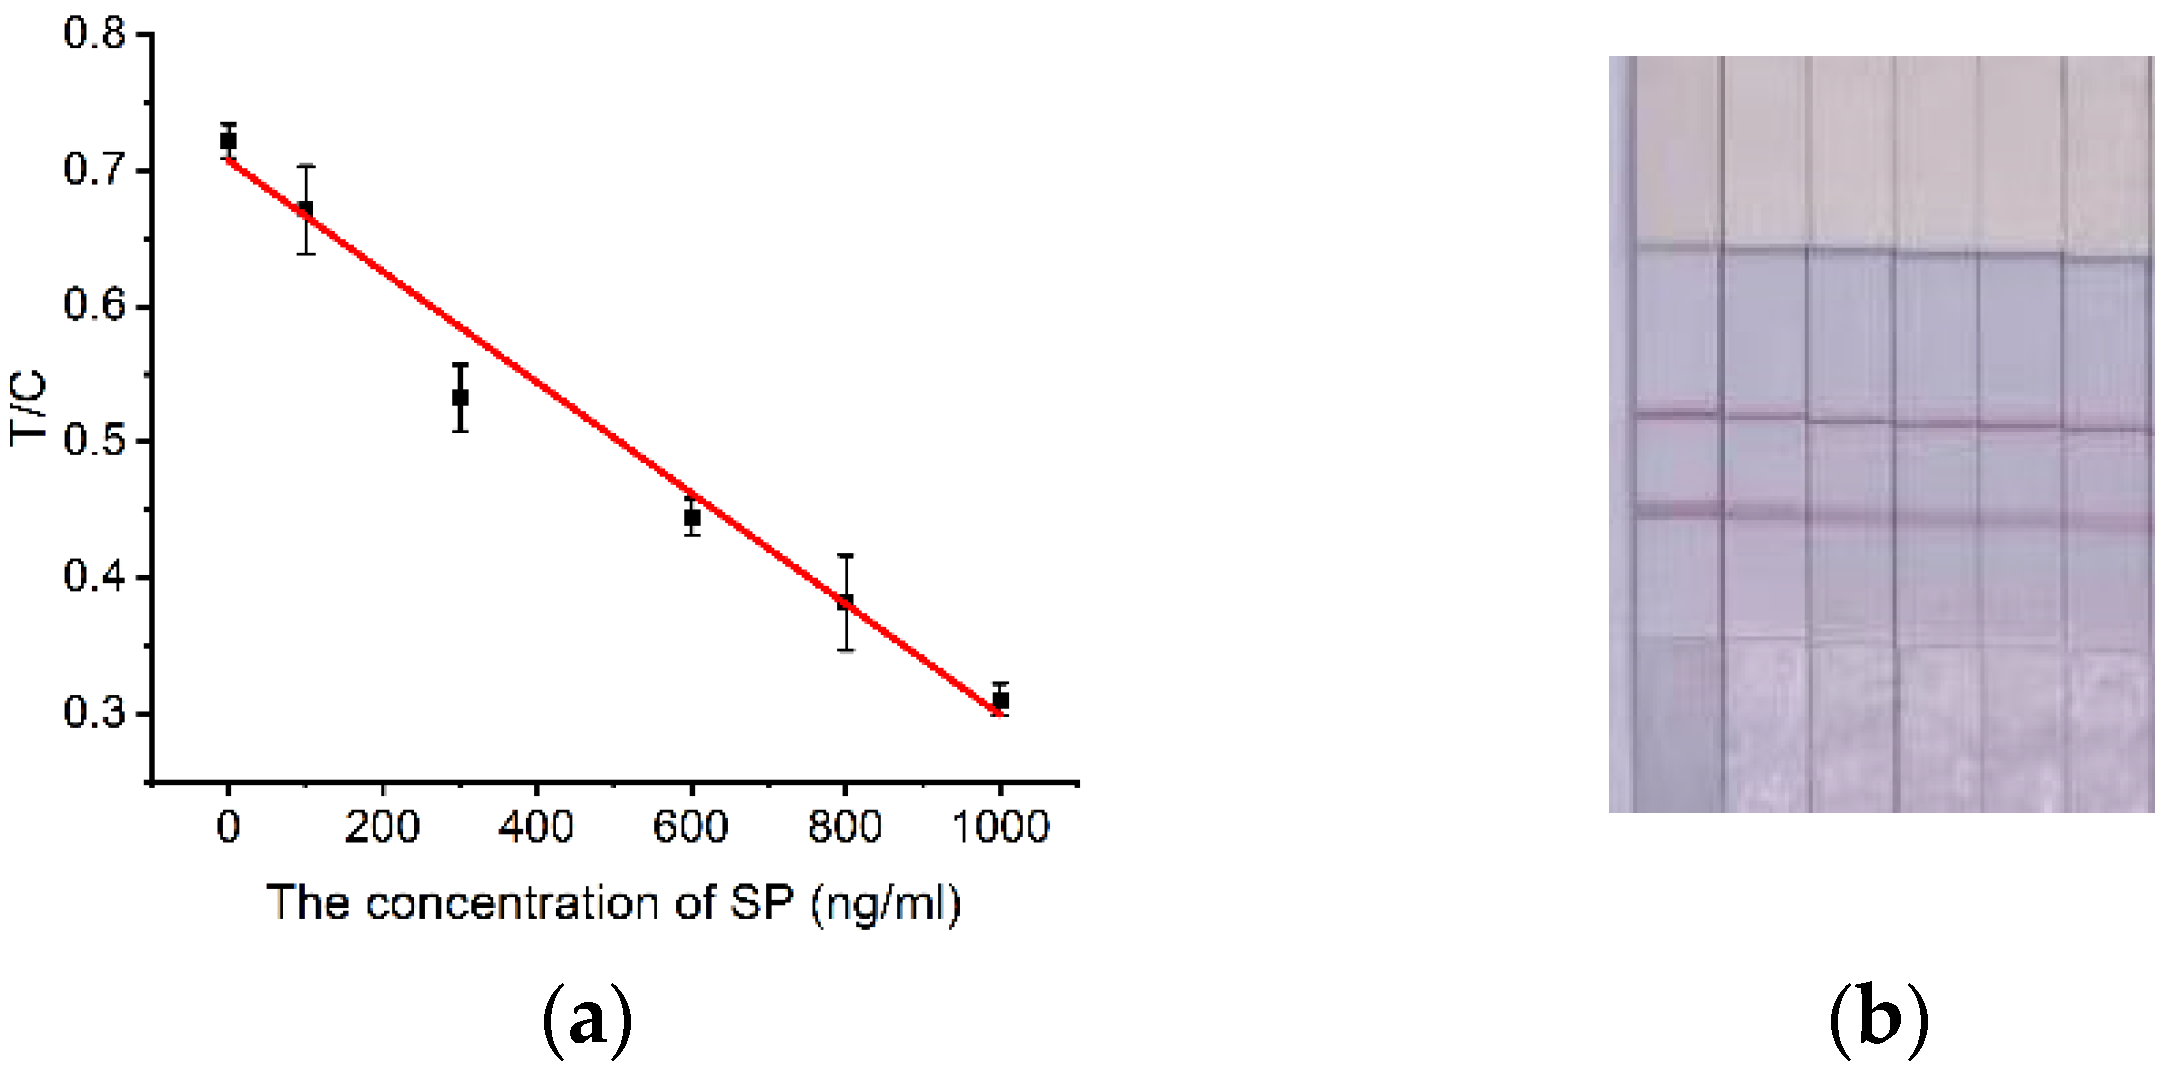
In this study, we successfully developed a competitive label-free lateral flow immunochromatographic strip method that uses gold nanoparticles immobilized with high affinity aptamers to detect SARS-CoV-2 S proteins in cold-chain foods. y= -0.000408x+0.70 (R2=0.97) was the linear equation and the detection sensitivity was calculated to be LOD=91.16 ng/mL (≈0.68 nM). Meanwhile, we examined the detection specificity of the aptamer test strip method and verified the analytical accuracy and practical application performance of this lateral chromatography test strip.
An assay kit was constructed herein to detect multiple variants of the S protein using aptamers that bind different mutant epitopes. The sensitivity of the test strips was improved by molecular docking, selecting complementary sequence of aptamers with high affinity, and optimizing several experimental conditions. At present, the paper strip detection of SP and other macromolecules mostly uses the sandwich method. In this work, the competition method based on aptamers was successfully used to detect macromolecular proteins. And a new method for the development of alternative antibody test strips for the detection of other viral targets. LFA can also be used to detect multiple viruses simultaneously and specifically. In addition, the test strip delivers results in less than 20 min and costs less than $1 per test to manufacture in our hands. By enabling more frequent home testing, more accessible diagnostic tools such as test strip may reduce the burden of viral epidemics on the healthcare system.
4. Materials and Methods
4.1. Reagents and Materials
The recombinant baculovirus-produced SARS-CoV-2 S protein (40589-V08B1) was obtained from Beijing Yiqiao Shenzhou Technology Co., Ltd. (Beijing, China). The sequence of aptamer binding to the SARS-CoV-2 S protein is 5′-SH-TTTTTTACGCCAAGGTGTCACTCCGTAGGGTTGGCTCCGGGCCTGGCGTCGGTCGCGAAGCATCTCCTTGGCGTTTTTTTTTT-3′ and the probe sequence of line C is biotin-AAAAAAAAAA. The other aptamer sequences are shown in
Table 2. Aptamers and DNA probes were commercially synthesized and purified by Sangon Biotech Co., Ltd. (Shanghai, China). Streptavidin (SA) and bovine serum albumin (BSA) were ordered from Sigma-Aldrich (Saint Louis, MO). Phosphate buffer saline (PBS, PH 7.4) and 4-(2-hydroxyethyl)-1-piperazineethanesulfonic acid (HEPES) were purchased from Beijing Solarbio Company (Beijing, China). HAuCl
4·4H
2O, Proclin300, Tris(2-carboxyethyl)phosphine (TCEP), Tween-20, and sucrose were purchased from China Pharmaceutical Group Co., Ltd. (Beijing, China). Trisodium citrate and other reagents were purchased from Beijing Chemical Works. All inorganic chemicals and organic solvents were of at least analytical grade and buffer solutions were prepared with ultrapure water.
Plastic adhesive backing (6 × 30 cm), sample pad (8975), and absorbent pad (S270) were purchased from Hang Zhou Bulus Trading Co., Ltd. (Hangzhou, China), and the nitrocellulose (NC) membrane was obtained from Shenzhen Baisui Kang Industrial Co., Ltd. (Shenzhen, China). The NC membrane types and parameters are shown in
Table 3. All plates were dispensed by an IsoFlow Dispenser (Imagine Technology, USA) and then cut into strips for experiments using a programmable strip cutter (HGS201, AUTOKUN, China). The signal values of the test strips were read by an immunochromatographic reader C10066- 10 (Hamamatsu Corporation, Japan).
4.2. Preparation of gold nanoparticles
According to previous reports [
37], AuNPs were prepared using a modified citric acid reduction method. Initially, 1 ml of 1% HAuCl
4 aqueous solution was added to 100 mL ultrapure water in a 250 mL conical flask wrapped in tinfoil, stirred (300 rpm), and heated to boiling. Then, 2 ml of 1% sodium citrate solution was quickly added while the rotational speed was adjusted to 350 rpm and maintained for 1 min. The solution was continued to be heated for 14 min with stirring (300 rpm) until the color changed to burgundy, after which it was cooled to room temperature. The nanoparticles were stored at 4°C away from light and were used at least 24 hours after synthesis was completed.
4.3. Conjugation of Aptamer and Nanogolds
The conventional method for aptamer attachment on nanogold particles was typically performed by using a salt-aging process [
30]. 50 μL 5’-sulfide aptamer (3 μM) was activated by 1 μL TCEP (10 mM) for 1 h at room temperature. During this time, 1 ml of the nanogold solution prepared above was concentrated 10-fold and the pH was reduced to 3.0. After mixing, the mixture was incubated for 2 h, and then 2 M NaCl was added to a final concentration of 75 mM over a 6 h period. Finally, it was stored at 4°C for over 6 h until use.
4.4. Selection of T-line complementary sequence
T-line complementary sequences were selected as per the original literature [
29] and MOE molecular docking results. Secondary and tertiary structures of the aptamer were predicted by the DNA Fold Web server [
38] and the 3dRNA/DNA Web server [
39], and the structure of the S protein was obtained from PubChem [
40]. The MOE was utilized to dock the aptamer to the SP to obtain the optimal binding site. All complementary chain sequences are shown in
Table 2.
4.5. Pre-treatment of test strips
The sample pad, NC membrane, absorbent pad, and PVC plastic adhesive backing are the four material elements that compose the aptamer-based lateral flow test strip [
19]. To load the probe in the detection region, streptavidin (SA) was used as the connector between the probe and the membrane because of the adsorption of proteins by the nitrocellulose membrane. Utilizing biotin- and SA-specific binding properties, the probe with one end of which was modified with biotin and complementary to the AuNP-aptamer coupler was immobilized onto the NC membrane. Fixed SA with a 1:4 molar ratio of aptamer, T-line SA concentration of 0.4 mg/ml and C-line SA concentration of 0.4 mg/ml were incubated with biotin-DNA
T and biotin-DNA
C, respectively, for 2 h to form SA-biotin-DNA complexes. The tubes were then washed three times for 30 min each with ultrafiltration centrifuge tubes (30 kD) to remove excess probe. The remaining solution was added to HEPES, and the final volume was the same as the original solution volume.
The sample pads need to be immersed in HEPES containing 1% BSA, 0.25% Tween-20, and 1% sucrose, dried at 37°C, and stored in a cool, ventilated area to minimize non-specific adsorption between SA and AuNPs.
4.6. Assembly of test strips
The NC membrane, sample pad, and absorbent pad were sequentially laminated for 2 mm and pasted onto a plastic backing plate. Then, the T-line and C-line solutions were sprayed onto the NC membrane using an IsoFlow Dispenser and dried at 37°C for 30 min. The T-line: 0.4 mg/ml SA, SA and biotinylated aptamer (DNAT) concentration ratio = 1:4; the C-line: 0.2 mg/ml SA, SA and biotinylated aptamer (DNAC) concentration ratio = 1:4. The test strip plate was cut into 4 cm strips using the HGS201 programmable strip cutter and stored in a self-sealing bag with desiccant.
4.7. Sample Test and Evaluation Methods
In this work, we used commercially available frozen solutions from frozen food packages as samples to verify the accuracy and reliability of aptamer-based lateral flow test strips. The ice on the surface of frozen food packages was melted at room temperature and mixed with different concentrations of SP to prepare sample solutions with different SP concentrations. 2ul of successfully coupled AuNPs-aptamer coupling, 28 μL of binding buffer, and 20 μL of sample solution were taken and incubated for half an hour and then added dropwise into the sample pad of the test strip. 10 min later, the absorbance of the T- and C-lines by immunochromatography was scanned and recorded with an immunochromatographic reader C10066-10.
The inhibition rate is introduced to evaluate the optimization results of various properties throughout this study and is calculated as follows: [
41]
Inhibition=
T0 and C0 represent the absorbance of the T and C lines when there is no SP in the sample, while T and C represent the absorbance of the T and C lines when the sample has different S proteins. The absorbance ratio of T and C lines versus concentration was used for quantitative analysis and a standard calibration curve was plotted.
Author Contributions
Conceptualization, Z.L and Y.D; methodology, X.L. and J.W.; Investigation X.L., J.W and X.F.; resources, Z.L, Y.D and X.F.; validation, X.L, J.W, X.F. and L.Z.; writing—original draft preparation, X.L.; writing—review and editing, X.L. Y.D. and L.Z.; supervision, J.W., L.Z. and Z.L. All authors have read and agreed to the published version of the manuscript.
Figure 1.
TEM test results. (a)AuNPs; (b) AuNPs-Aptamer; (c) AuNPs-Aptamer.
Figure 1.
TEM test results. (a)AuNPs; (b) AuNPs-Aptamer; (c) AuNPs-Aptamer.
Figure 2.
Effect of aptamer concentration on test strip results. (a) Physical diagram of coupling solution at different aptamer concentrations: from left to right aptamer concentrations were 0.5 µM, 1 µM, 2 µM, 3 µM, 4 µM, 5 µM; (b) Absorbance values of test strips measured by the immunochromatographic reader at different aptamer concentrations.
Figure 3.
Optimization of test strip conditions. (a) Absorbance values of test strips measured by the immunochromatographic reader at different SA concentrations; (b) Absorbance values of test strips measured by the immunochromatographic reader at different aptamer concentrations at different ratio of SA to C and T line aptamers; (c) Absorbance values of test strips measured by the immunochromatographic reader at different NC membrane type; (d) Absorbance values of test strips measured by the immunochromatographic reader at different binding buffers.
Figure 4.
Molecular docking and aptamer complementary chain element optimization. (a) DA20 docking site and its aptamer sequence; (b) DA66 docking site and its aptamer sequence; (c) Absorbance values of test strips measured by the immunochromatographic reader at different aptamer complementary sequence with blank conditions; (d) Absorbance values of test strips measured by the immunochromatographic at different aptamer complementary sequence with SP 500ppb conditions; (e) MOE molecular docking result.
Figure 5.
Optimization of detection conditions. (a) T/C and inhibition ratio at different amount of coupling solution added; (b) Test strip experiments with different coupling solution spiking amounts under blank conditions, from left to right: 1 ul, 2 ul, 3 ul, 4 ul, 5 ul; (c) Test strip experiments with different coupling solution spiking amounts under 500ppb SP conditions, from left to right: 1 µl, 2 µl, 3 µl, 4 µl, 5 µl; (d) T/C and inhibition rate change over time.
Figure 6.
Quantitative detection of SP. (a) Standard curve; (b) Calibration curve and color development of test strips established at 15 min detection time, from left to right: 0 ng/ml, 100 ng/ml, 300 ng/ml, 600 ng/ml, 800 ng/ml, 1000 ng/ml.
Figure 6.
Quantitative detection of SP. (a) Standard curve; (b) Calibration curve and color development of test strips established at 15 min detection time, from left to right: 0 ng/ml, 100 ng/ml, 300 ng/ml, 600 ng/ml, 800 ng/ml, 1000 ng/ml.
Figure 7.
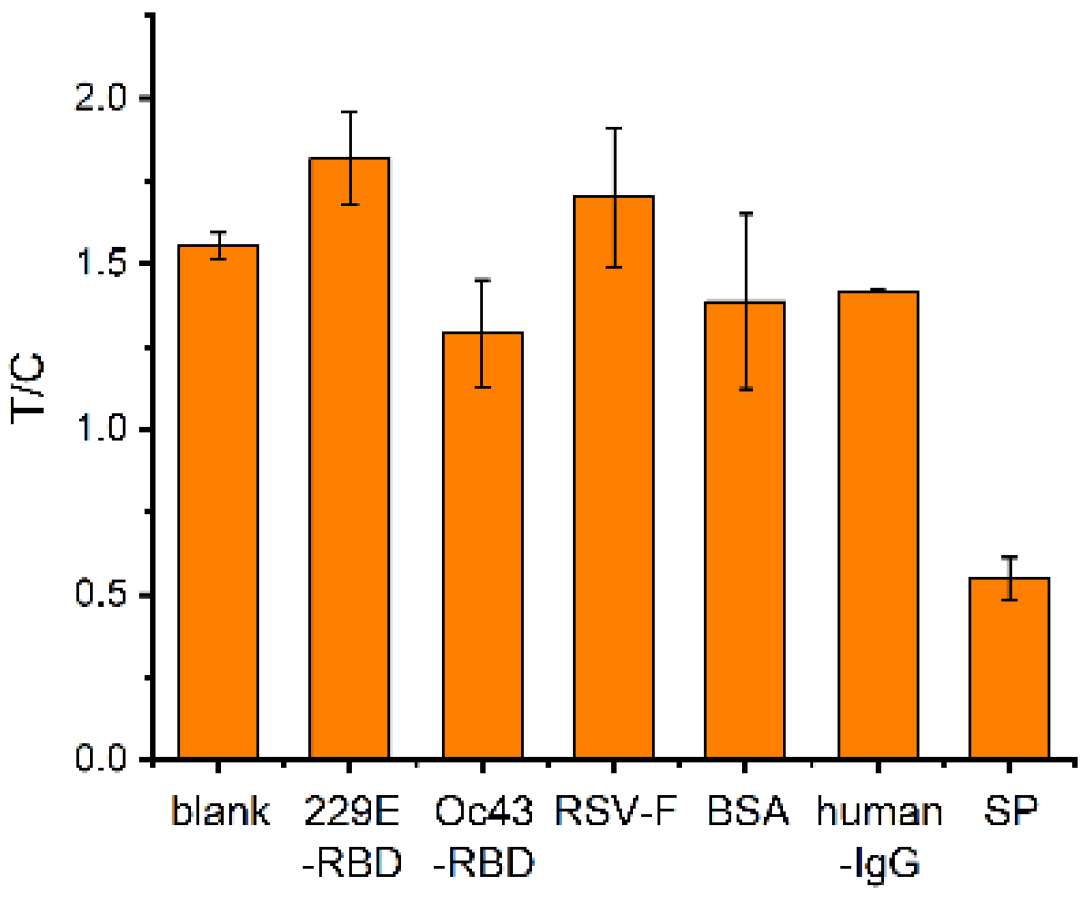
Results of a selectivity study of nucleic acid aptamer test strips for SP detection.
Figure 7.
Results of a selectivity study of nucleic acid aptamer test strips for SP detection.
Figure 8.
Schematic representation of SP detection via Apt-LFA. (a) Structure of LFA strip; (b) Negative result of Apt-LFA (without SP); (c) Positive result of Apt-LFA (with SP).
Figure 8.
Schematic representation of SP detection via Apt-LFA. (a) Structure of LFA strip; (b) Negative result of Apt-LFA (without SP); (c) Positive result of Apt-LFA (with SP).
Table 1.
Aptamer and protein binding site.
Table 1.
Aptamer and protein binding site.
| Number |
Energy |
Aptamer binding site |
Protein binding site |
Aptamer sequence |
| 1 |
-15.89 |
DA20 |
Lys921 |
DT18-DT22 |
| 2 |
-0.9 |
DT66 |
Gln935 |
DC65-DG71 |
| 3 |
-0.72 |
DT80 |
Lys285 |
DT77-DT84 |
| 4 |
-0.64 |
DT82 |
Lys278 |
DT77-DT84 |
Table 2.
Truncated Aptamer Sequences and C-Line Complementary Sequence.
Table 2.
Truncated Aptamer Sequences and C-Line Complementary Sequence.
| Name |
Sequences (5′-3′) |
| MSA-10 |
Biotin-ACGCCAAGGA |
| MSA-15 |
Biotin-ACGCCAAGGAGATGC |
| MSA-20 |
Biotin-ACGCCAAGGAGATGCTTCGC |
| MSA-22 |
Biotin-CGCCAGGCCCGGAGCCAAACCC |
| Control-line DNA |
Biotin-AAAAAAAAAA |
Table 3.
Results of spiked recovery experiments of new crown S protein in cold chain food pouch samples (n=3).
Table 3.
Results of spiked recovery experiments of new crown S protein in cold chain food pouch samples (n=3).
| Sample |
Concentration of SP (ng/mL) |
Detection result |
Test strip concentration (ng/mL) |
Recovery rate (%) |
RSD (%) |
Cold chain food packaging bags—tap water rinsing
(1 ml) |
0 |
Negative |
Undetected |
Undetected |
Undetected |
| 200 |
Positive |
166.7 |
83.3 |
2.6 |
| 400 |
Positive |
435.2 |
108.8 |
2.3 |
| 600 |
Positive |
571.7 |
95.2 |
5.8 |
| 800 |
Positive |
752.4 |
94.1 |
6.2 |
| 900 |
Positive |
860.2 |
95.6 |
4.6 |
| 1000 |
Positive |
968.1 |
96.8 |
3.0 |
Table 3.
The NC membrane types and parameters.
Table 3.
The NC membrane types and parameters.
| Name |
Speed (s/4cm) |
Diameter (um) |
| BSK95 |
100±20 |
12-15 |
| BSK110 |
120±30 |
8-12 |
| BSK140 |
140±30 |
5-8 |
| BSK160 |
160±30 |
4-6 |

