Submitted:
20 February 2024
Posted:
20 February 2024
You are already at the latest version
Abstract
Keywords:
1. Introduction
- A product or service’s environmental consequences may be measured over the course of its whole life cycle using the life cycle assessment (LCA) approach. It stands for instruments and methods intended to support long-term sustainable development and aid in environmental management [4]. The precise steps needed to complete it are outlined in the standards established by the International Organisation for Standardisation (ISO). More precisely, the following standards are related with [5, 6]. ISO 14040: Objective and Scope. The objectives of the study are defined, the main methodological choices are developed and all the assumptions made are reported.
- Life Cycle Inventory (LCI) (ISO 14041). During this phase, the system under study’s inputs and outputs are quantified through data collection and processing.
- Life Cycle Impact Assessment (LCIA), ISO 14042. The environmental categories and associated indicators have a correlation with the LCI outcomes. In addition, the emissions are divided into effect categories before being transformed into a single unit for comparison.
- ISO 14043: Outcomes. Lastly, the specified purpose and scope are taken into consideration when interpreting the LCI and LCIA results. Additionally, assessments of completeness, sensitivity, consistency, uncertainty, and accuracy are performed on the collected results.
- The following steps are included in the incredibly extensive life cycle assessment (LCA) of a whole product process [4].
- Raw materials, i.e., the acquisition of the necessary natural resources.
- Manufacturing, i.e., the conversion of raw materials into the final product, which may require various inputs of energy and resources.
- Distribution and Transportation, i.e., the product transport from the production facility to the consumer, including packaging, storage and supply.
- Use and Operation, and, more specifically, energy and resources consumed during the useful lifetime of the product, taking into account maintenance, repairs and any necessary consumables.
- End of Life (EOL), i.e., the disposal or recycling of the product, including waste management.
- Reduce: This tactic refers to a decrease in the amount of primary material used in the product’s design.
- Reuse: This approach entails using the product in its whole or as separate components in a second life cycle without making any major changes.
- Recycle: Another alternative is to recycle the materials that can be extracted from a product, so that they can be used anew as raw materials.
- Recover: This strategy involves energy recovery from product waste, via incineration of non-hazardous materials.
- Landfill: The last option is landfilling of the products after their EOL, which is a high-cost option, without positive returns.
- Mining of raw materials, such as ores and fossil fuels.
- Material processing, and in particular metal melting, alloy purification, Si and wafer production.
- Manufacturing, i.e., PV cells and panel production, as well as transportation and installation.
- Use, which involves PV panel operation and maintenance.
- Decommissioning, i.e., PV panel EOL and dismantling.
- Recycling. If the PV panel is not gravely damaged, then it can reenter the material processing stage for reuse.
- Treatment/Disposal, i.e., the collection, shredding, materials separation of the PV panel and treatment or disposal of any waste.
- Reduce: The reduction of hazardous materials included in the PV panel production process will improve the potential for recycling and resource recovery.
- Reuse: This strategy concerns the reuse of an aging or damaged PV panel or part of it, which is inextricably linked to its expected lifetime.
- Recycle: Hydrometallurgical processes are utilized for the materials recovery from waste. These processes depend on differences in the solubility and wettability of materials.
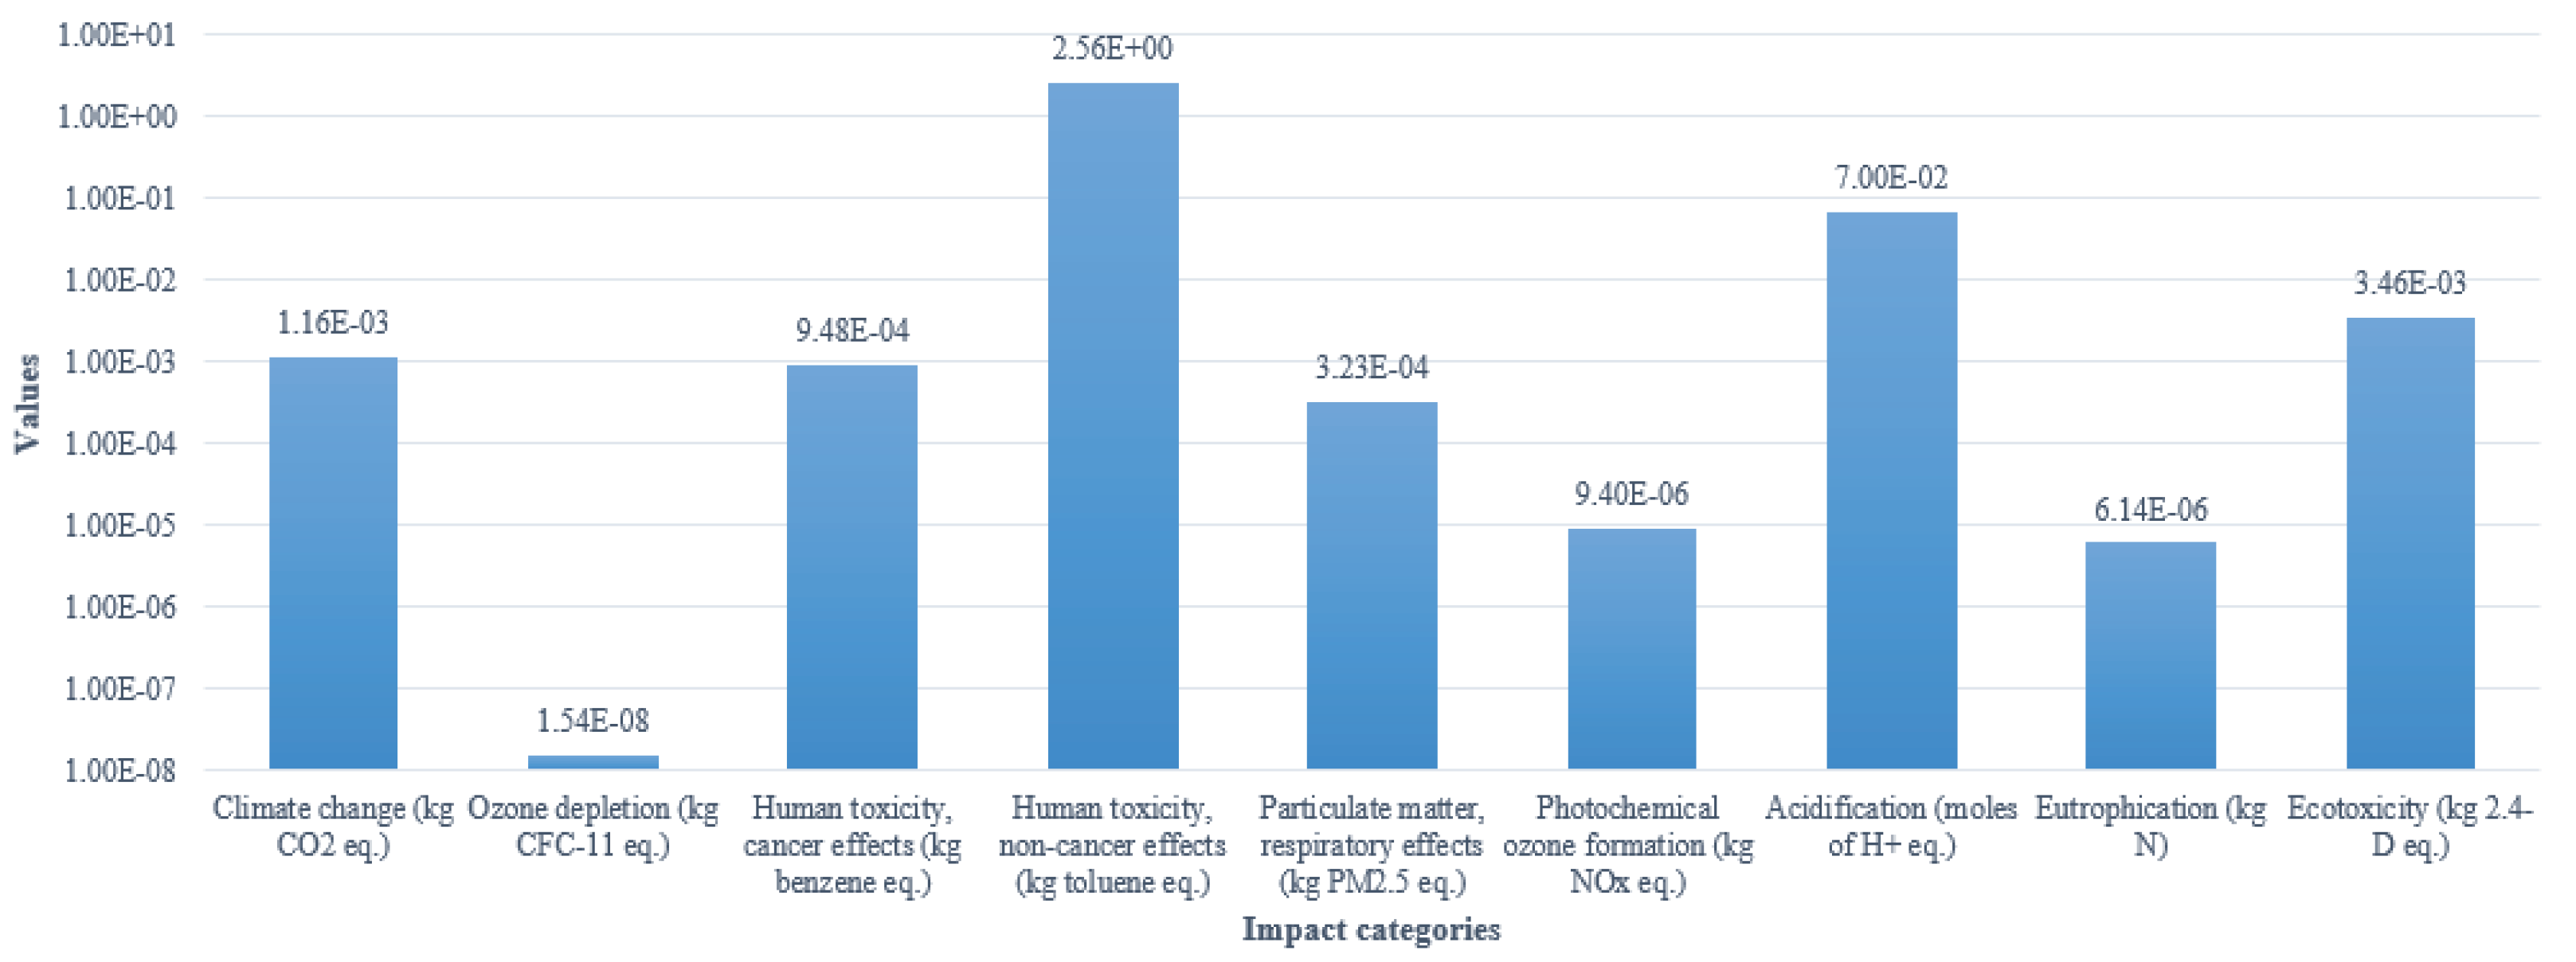
- Throughout a PV panel life cycle, significant impact categories emerge, such as [10]:
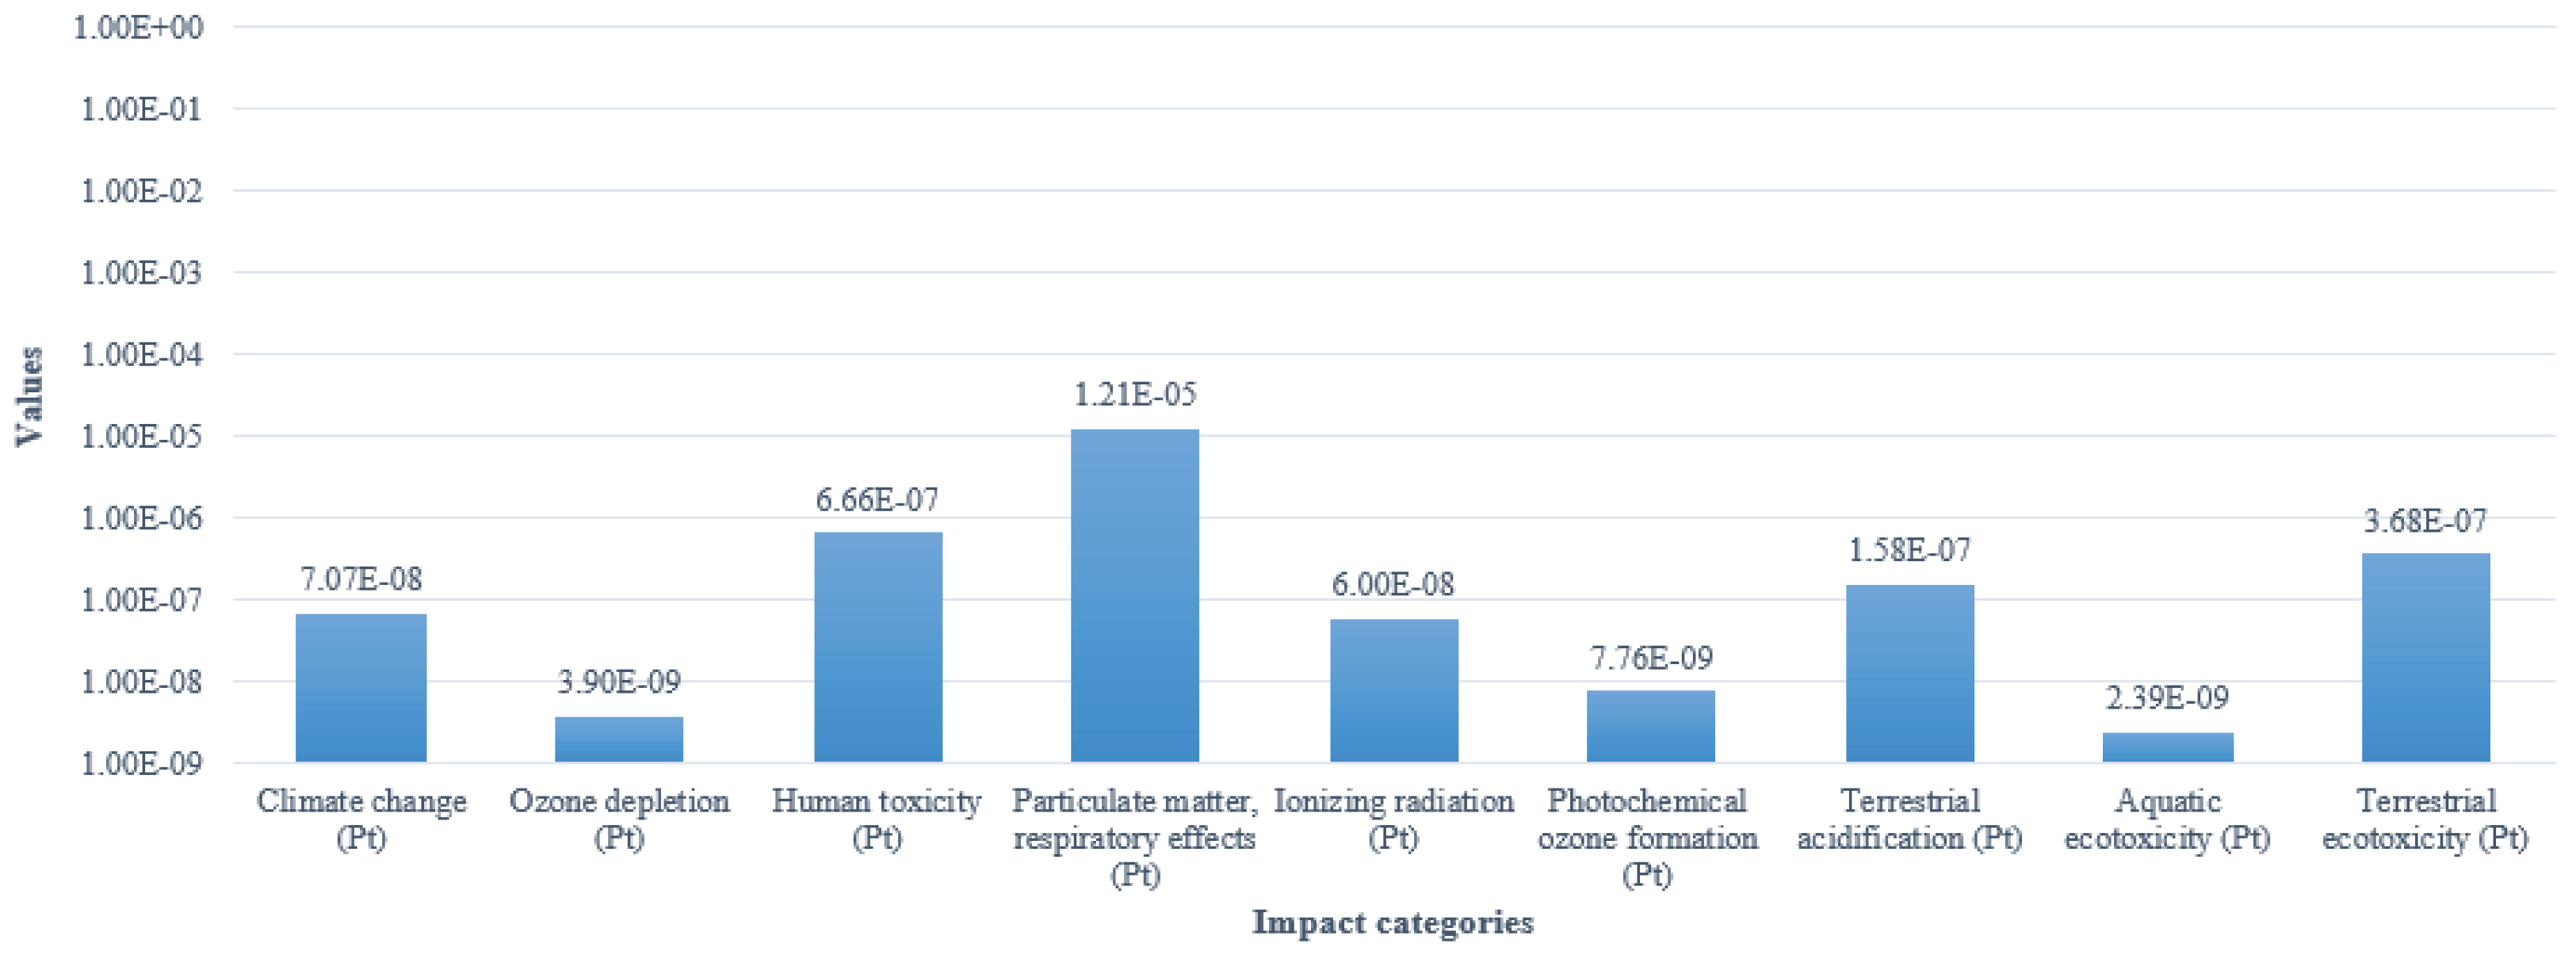
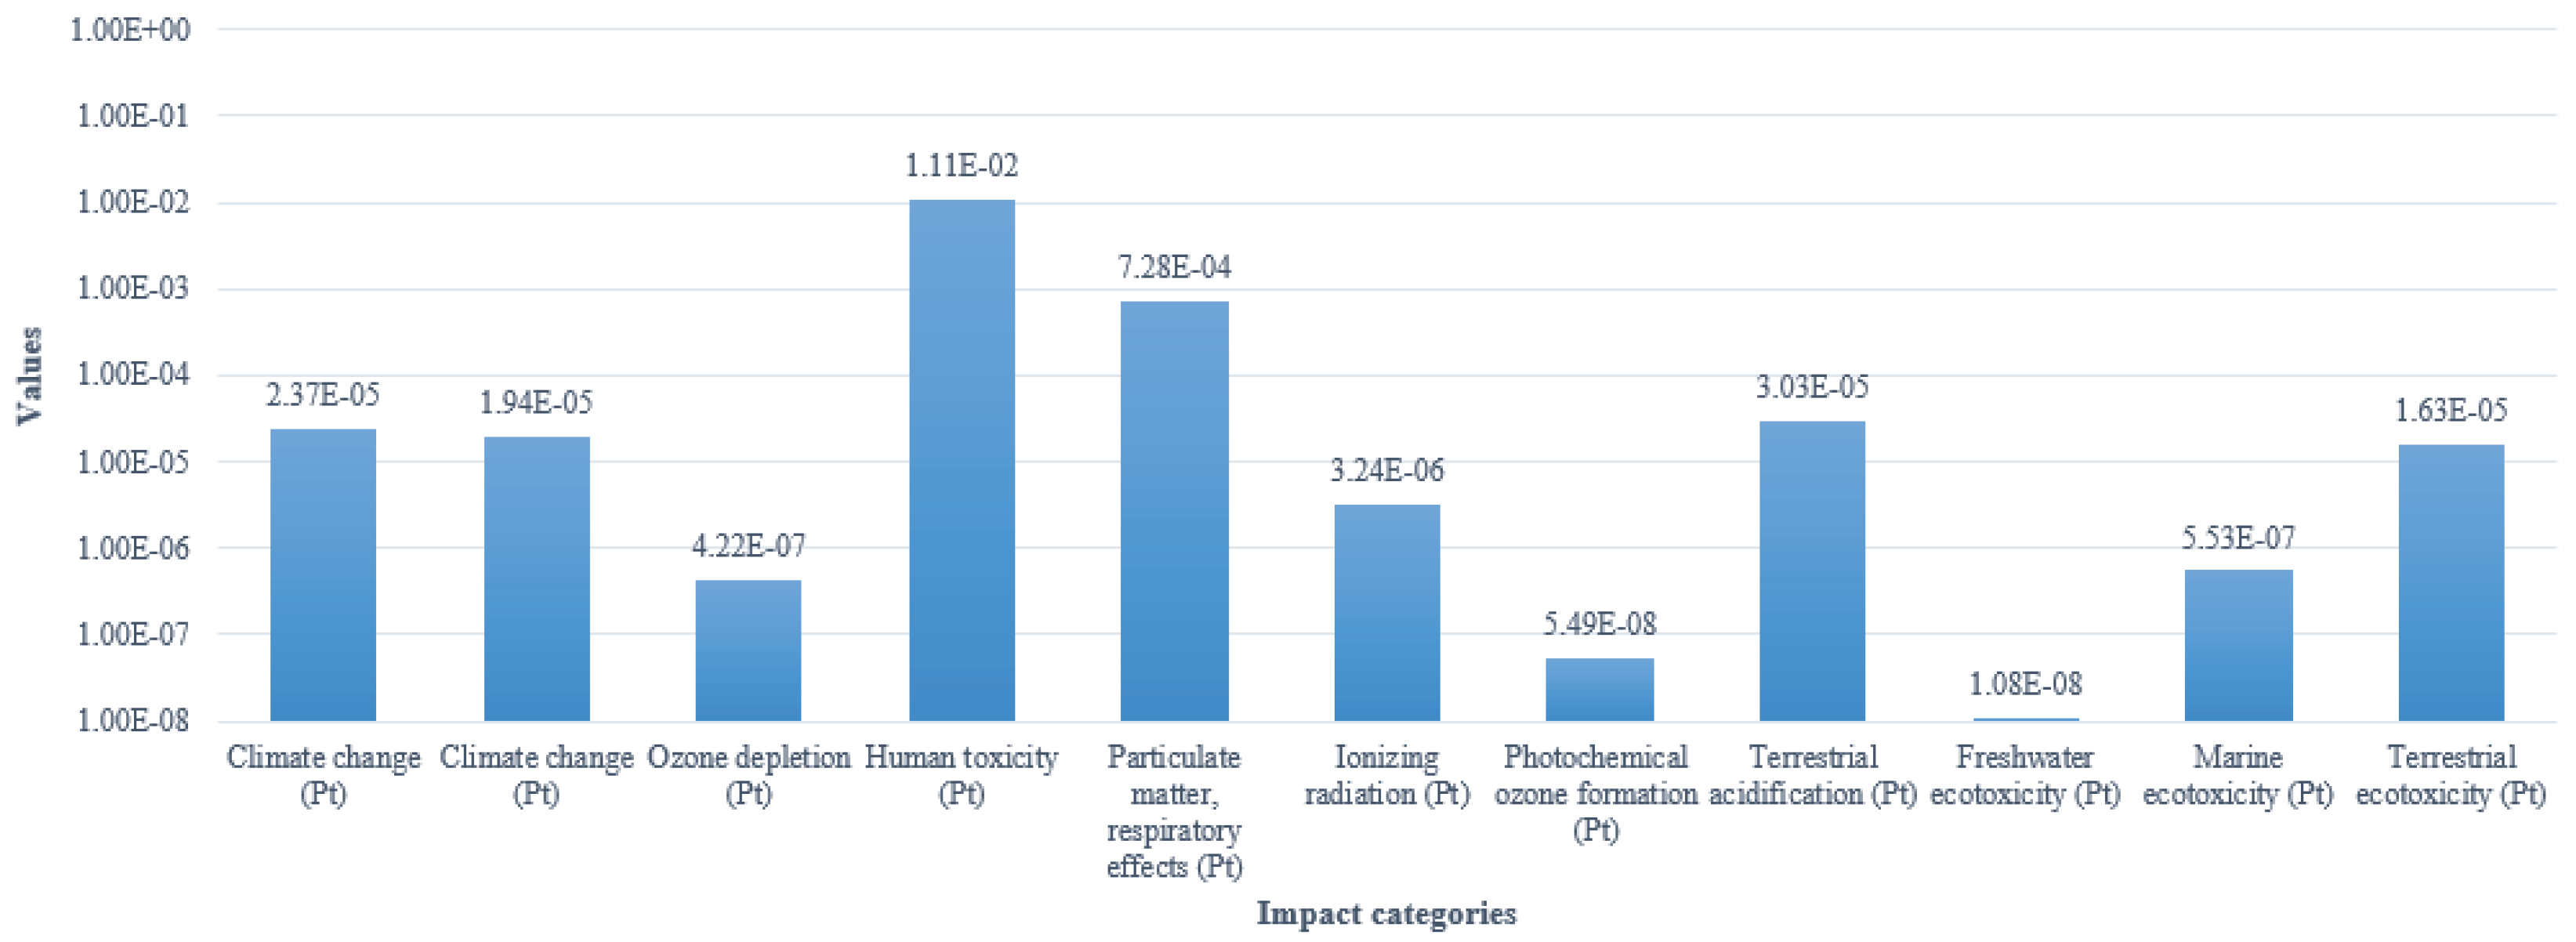
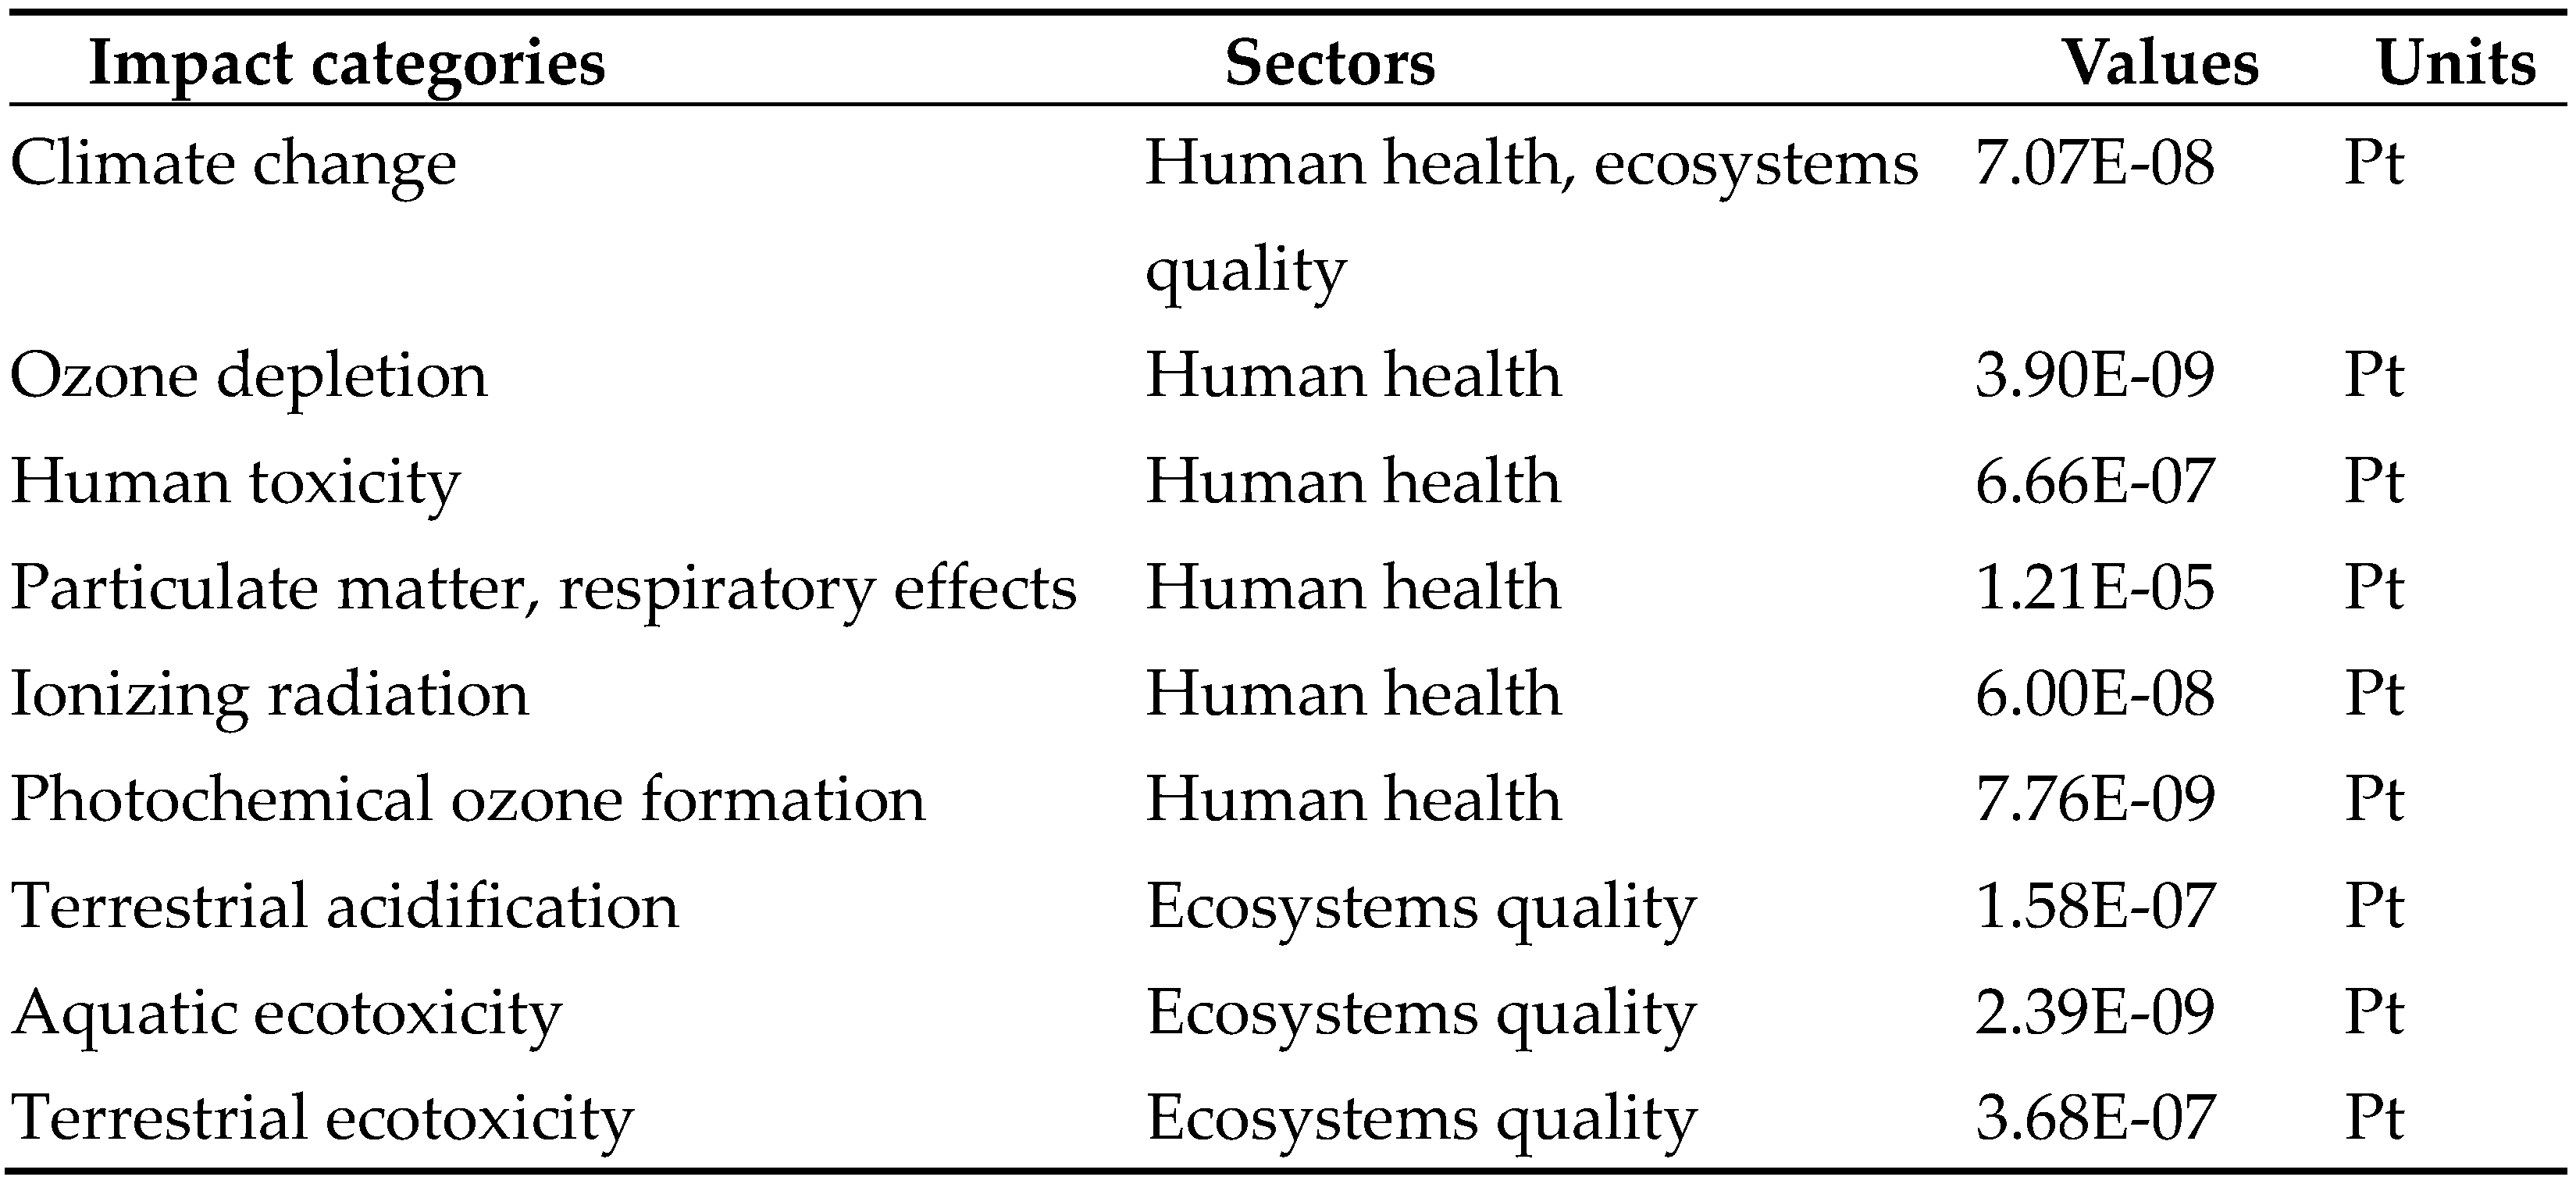
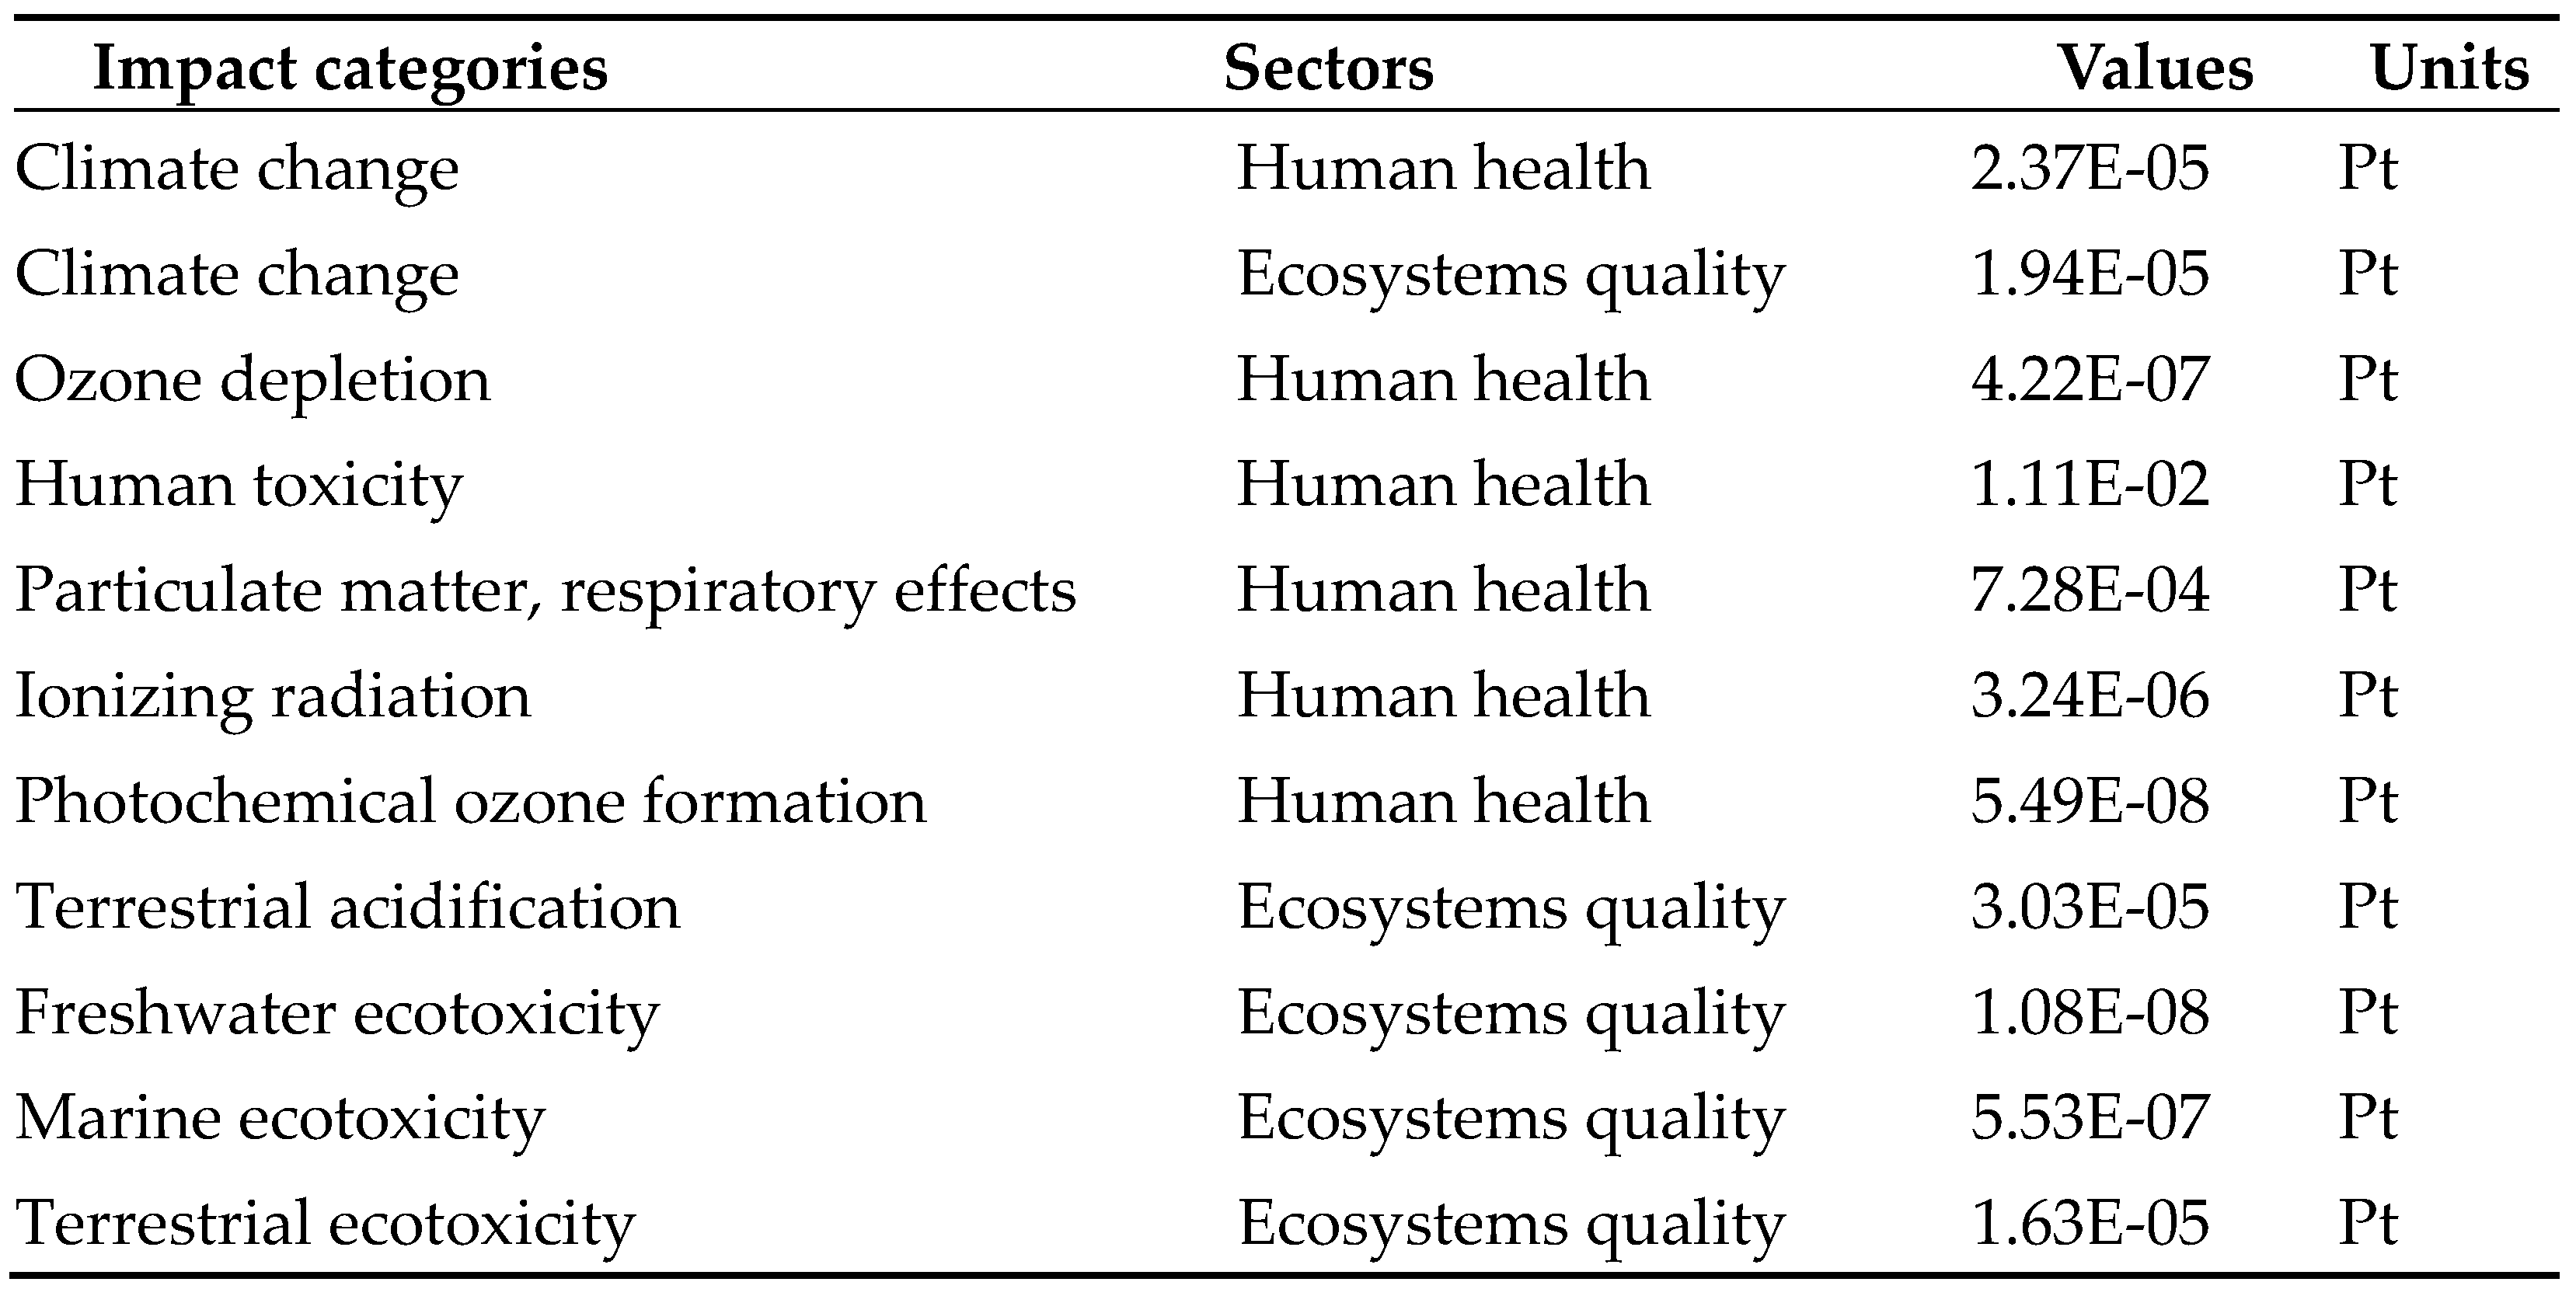
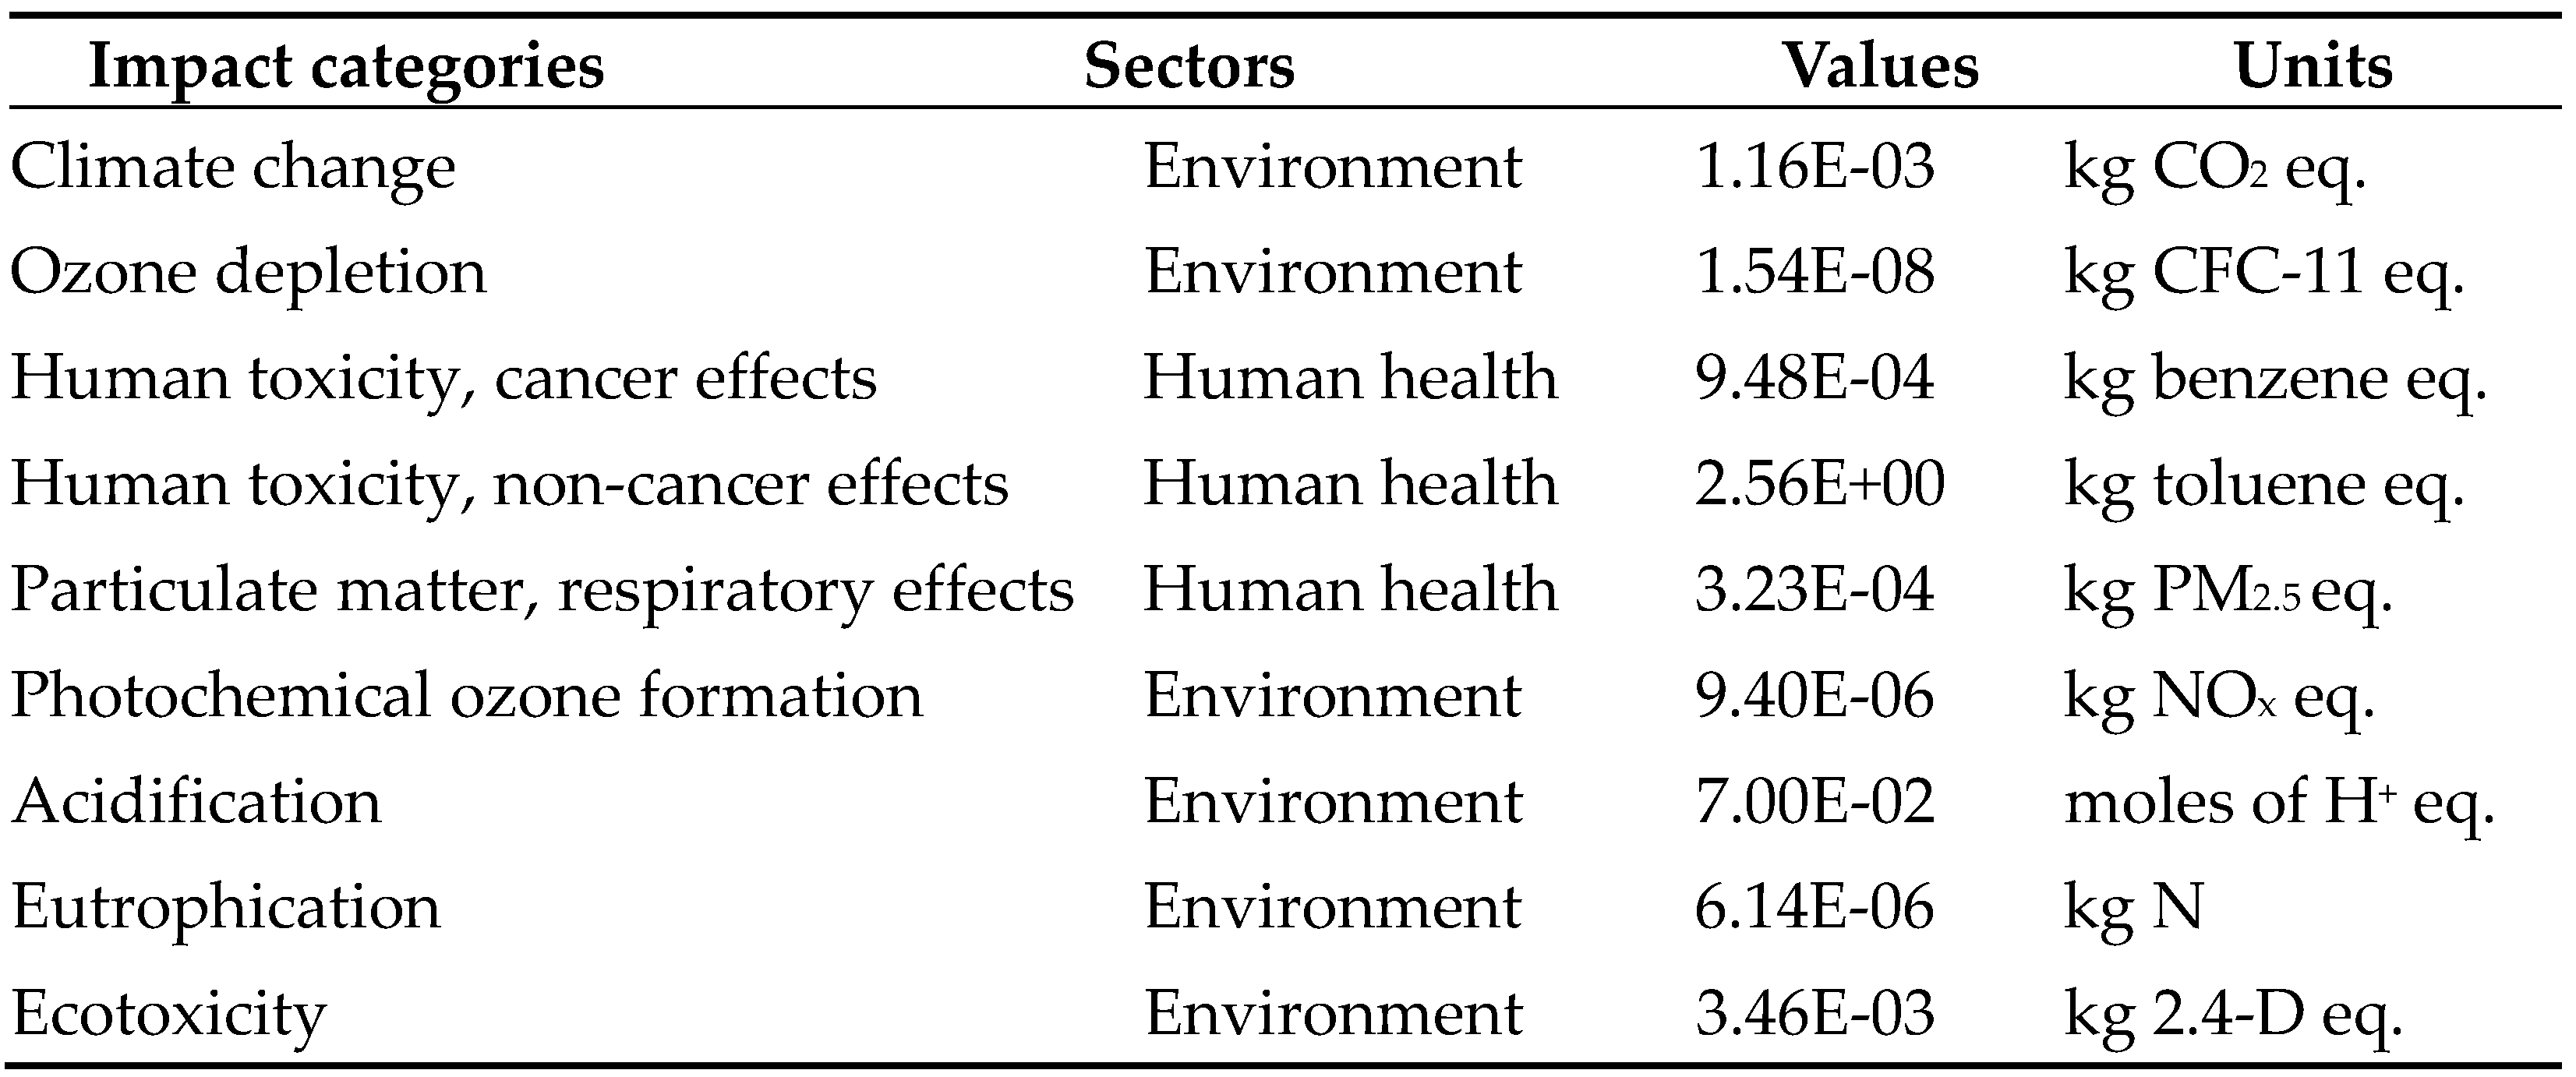
- Ozone depletion: Earth’s surface is exposed to more UV radiation as the ozone layer thins, posing a threat to both ecosystems and people. The creation of PV cells is the main life cycle event that leads to ozone depletion [13]. Human toxicity: PV cell production requires significant amounts of chemicals, gases and metals with multiple human toxicity effects, which may be carcinogenic or non-carcinogenic [14].
- Particulate matter: Air pollution from particulate matter has many different causes, making it a complicated problem. Furthermore, deposits of solid particles on PV surfaces may drastically lower the quantity of incoming solar energy that the panels use [15]. Ionizing radiation: PV panels produce low levels of non-ionizing radiation, so this is not a health risk [16].
- Production of photochemical ozone: The material that contributes to this process is ethylene (C2H4), which has an impact on human health, agriculture, and ecosystems [13]. Acidification: This is the result of air pollution, which is composed of nitrogen (N), sulphur (S) in the form of nitrogen oxide (NOx) or ammonia (NH3) [17]. With regard to PV, acidification is mainly caused during the process of PV panel production [13].
- Classification: All substances are allocated into categories based on their environmental footprint.
- Characterization: Each impact category has a numerical value that indicates a unique component that adds to the total environmental effect and gives a particular outcome for the substance’s concentration.
- Normalisation: To enable comparisons between all impact categories, a measured impact category is tested against a predetermined reference value.
- Weighting: The normalized results of every impact category are scaled by a weighting factor, indicating their respective significance.
- One of the most well-known approaches is the eco-indicator 99 technique. Points, abbreviated Pt, are its standard measuring unit. By identifying three “archetypes,” as follows, this technique compares goods [24, 26].
- Hierarchist (H): It achieves a manageable degree of evidence by consensus-based assimilation, balances the short- and long-term perspectives, and is capable of preventing several issues through appropriate policy.
- Individualist (I): It relies on a short-term temporal viewpoint, is manageable through technology that can avert many problems, and can only provide the necessary degree of evidence through consequences that have been demonstrated.
- Egalitarian (E): It has a very long-term time horizon, is manageable in terms of problems that may degenerate, and obtains the necessary degree of proof by considering all potential outcomes.
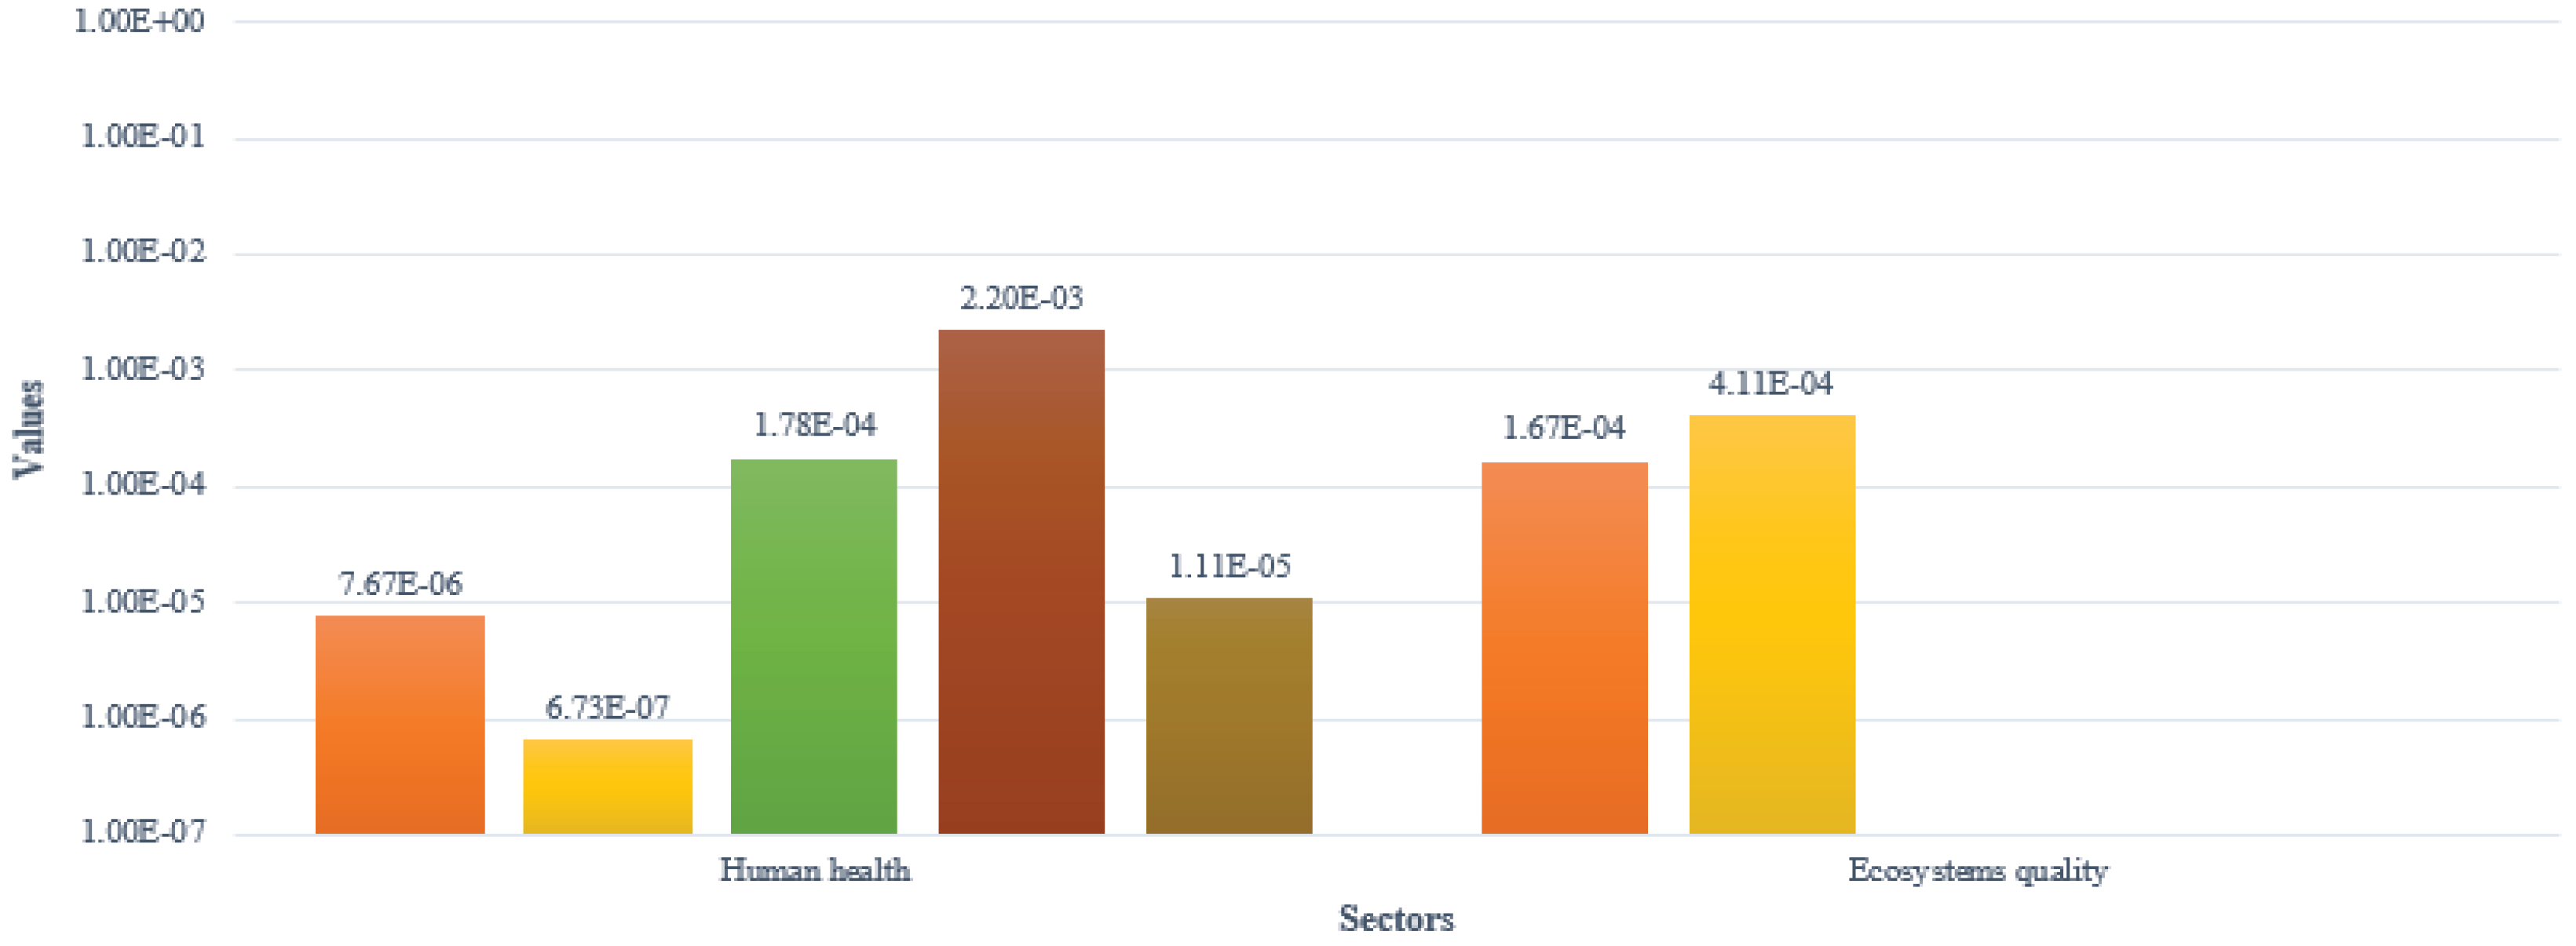
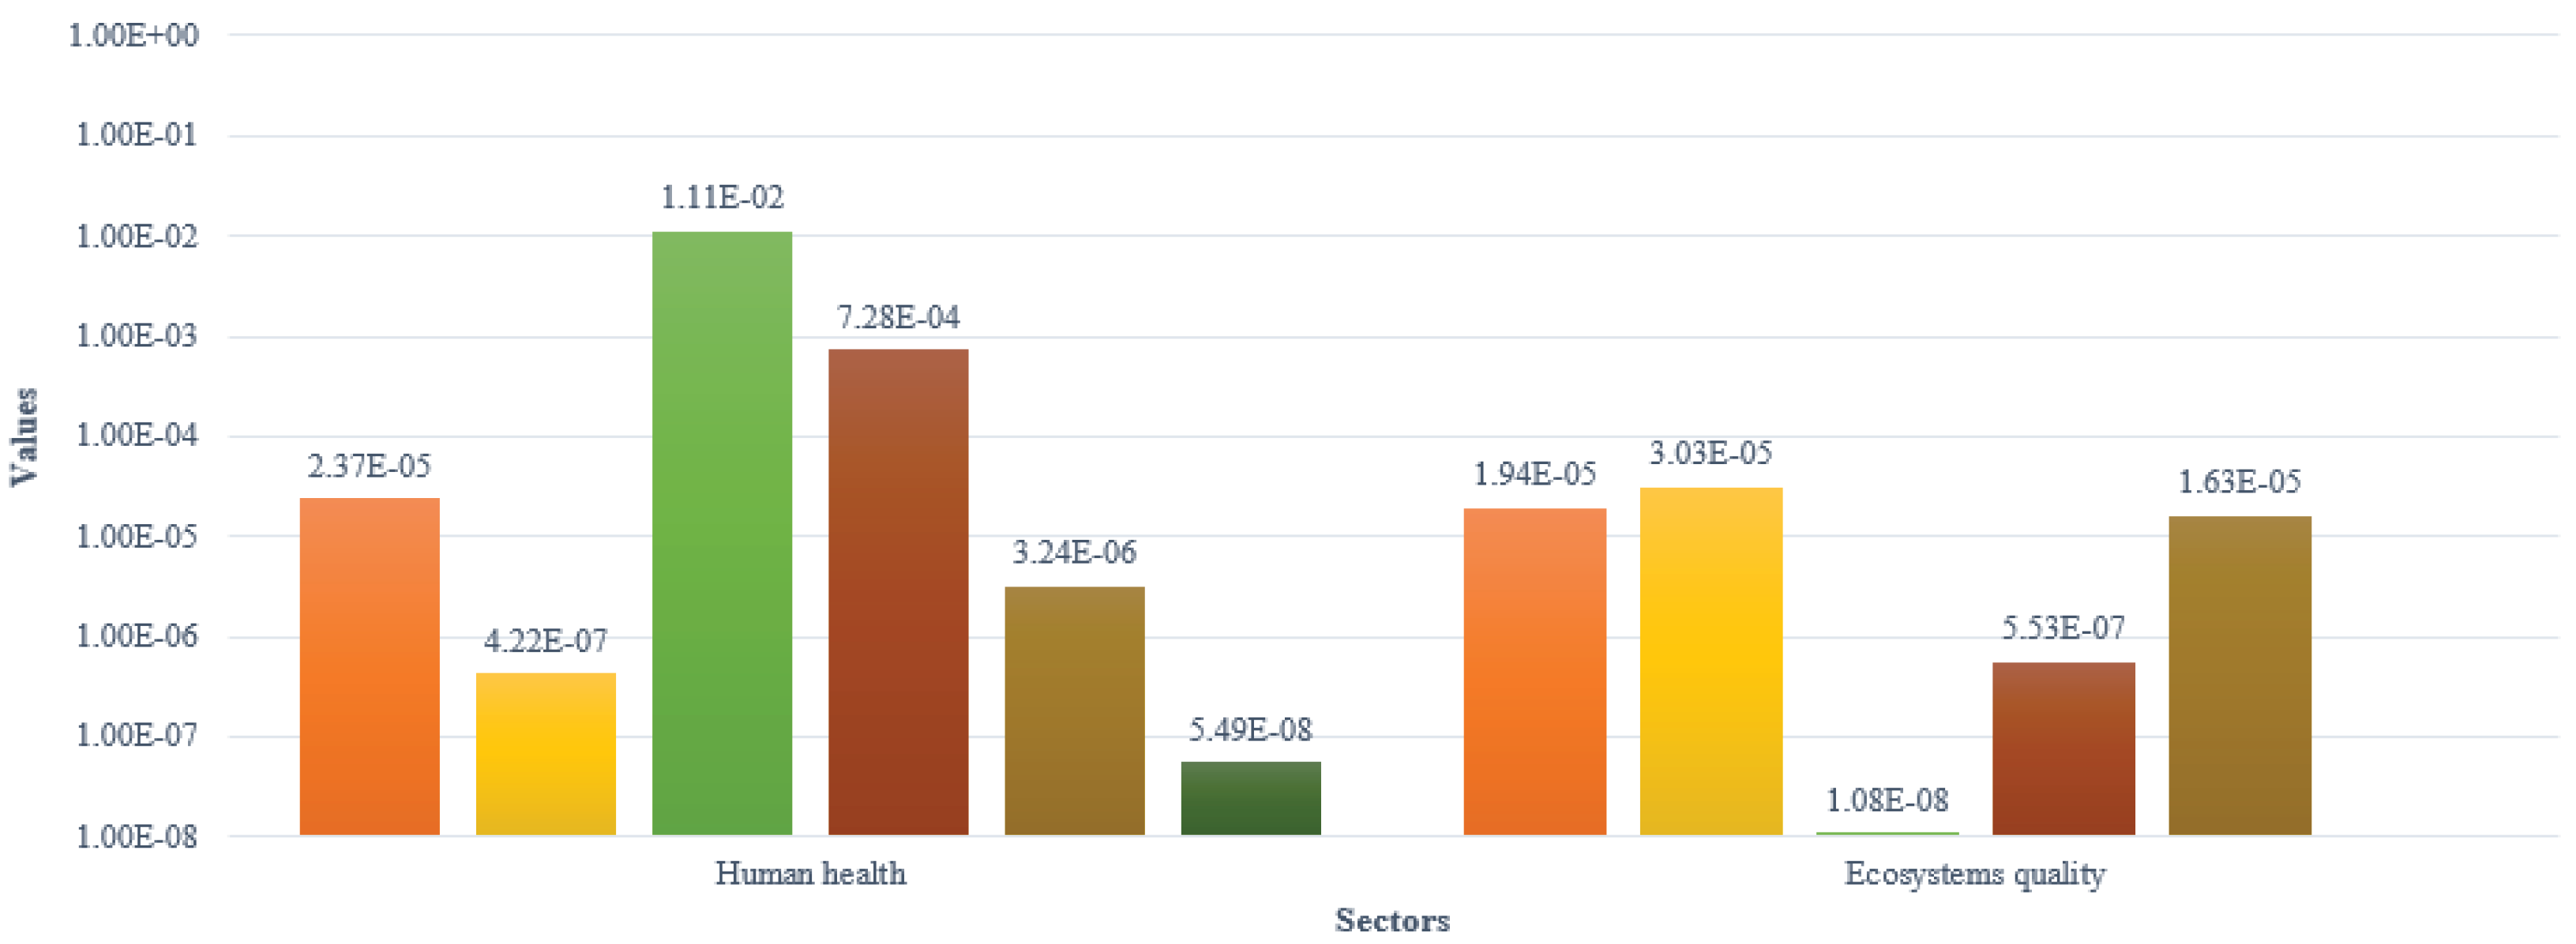
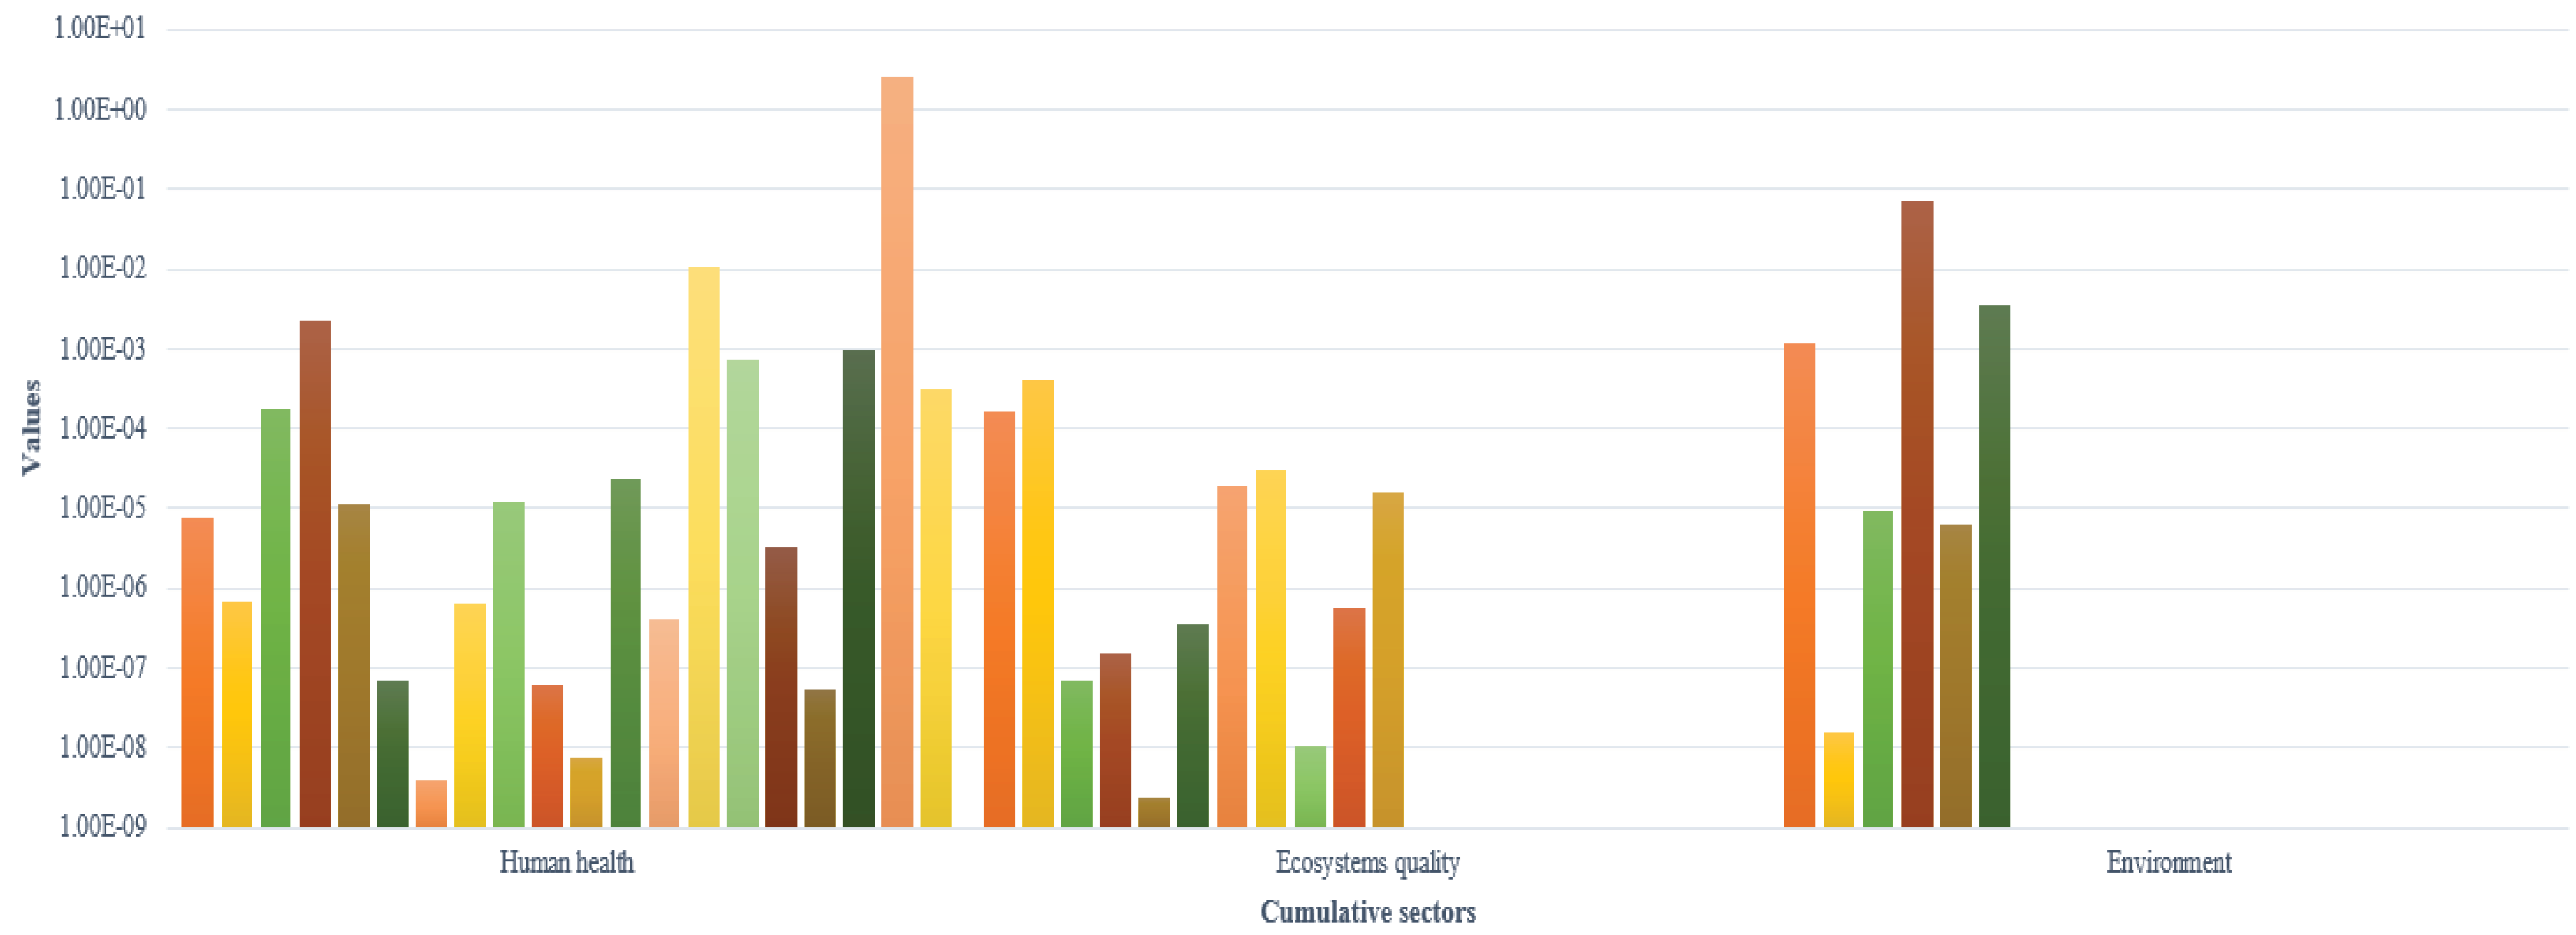
- Human health: This can be considered as the count of years of life lost and years lived with disability.
- Ecosystems quality: This can be regarded as the extinction of species within a specific region over a particular period.
- Resources: These might be thought of as the extra energy needed to extract minerals and fossil fuels in the future.
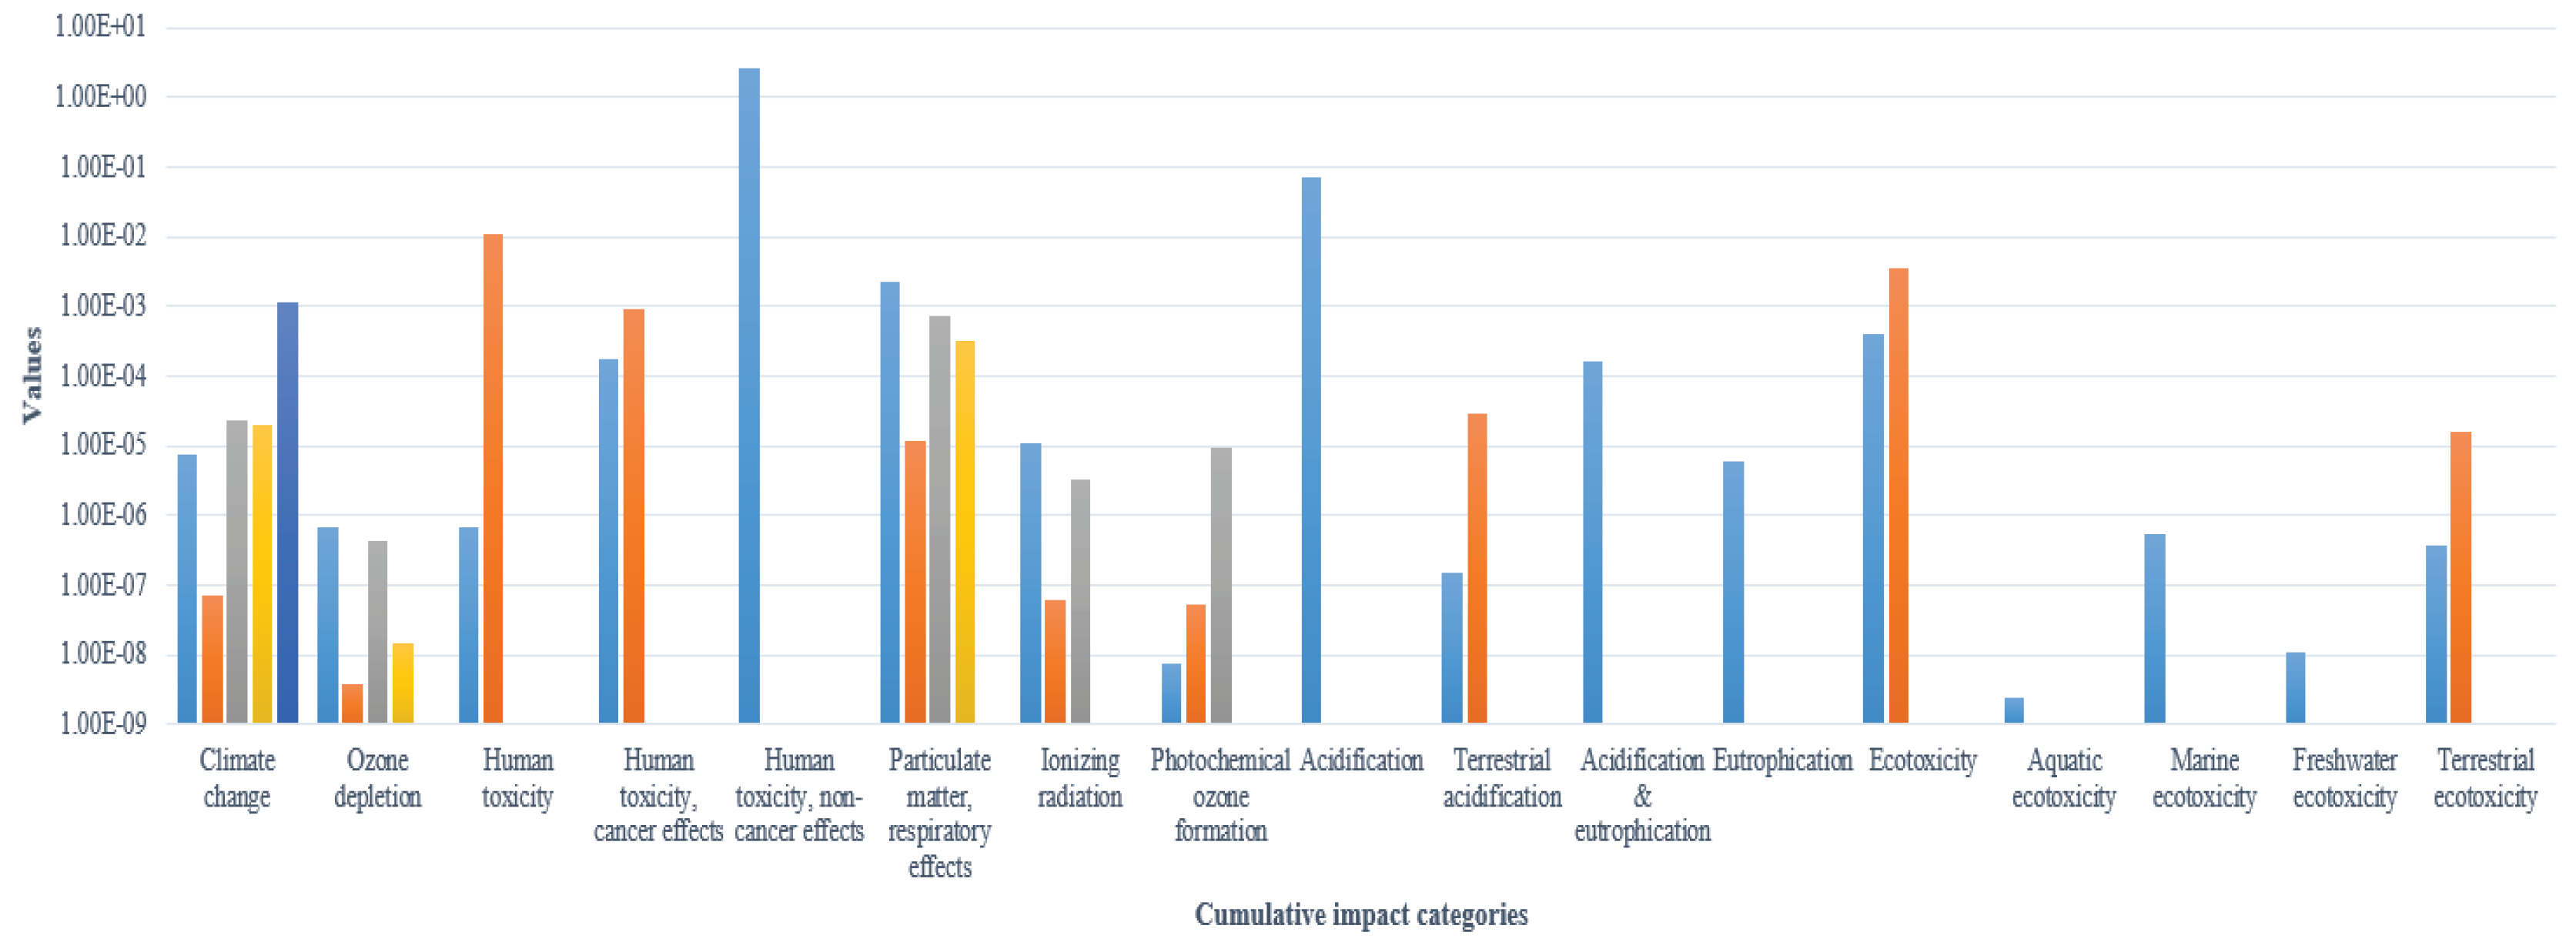
- A useful use of the midpoint and endpoint combination, connecting outcomes from all LCI kinds, is suggested by the IMPACT 2002+ technique. Four categories of protection are used to categorise the impacts of this approach [27].
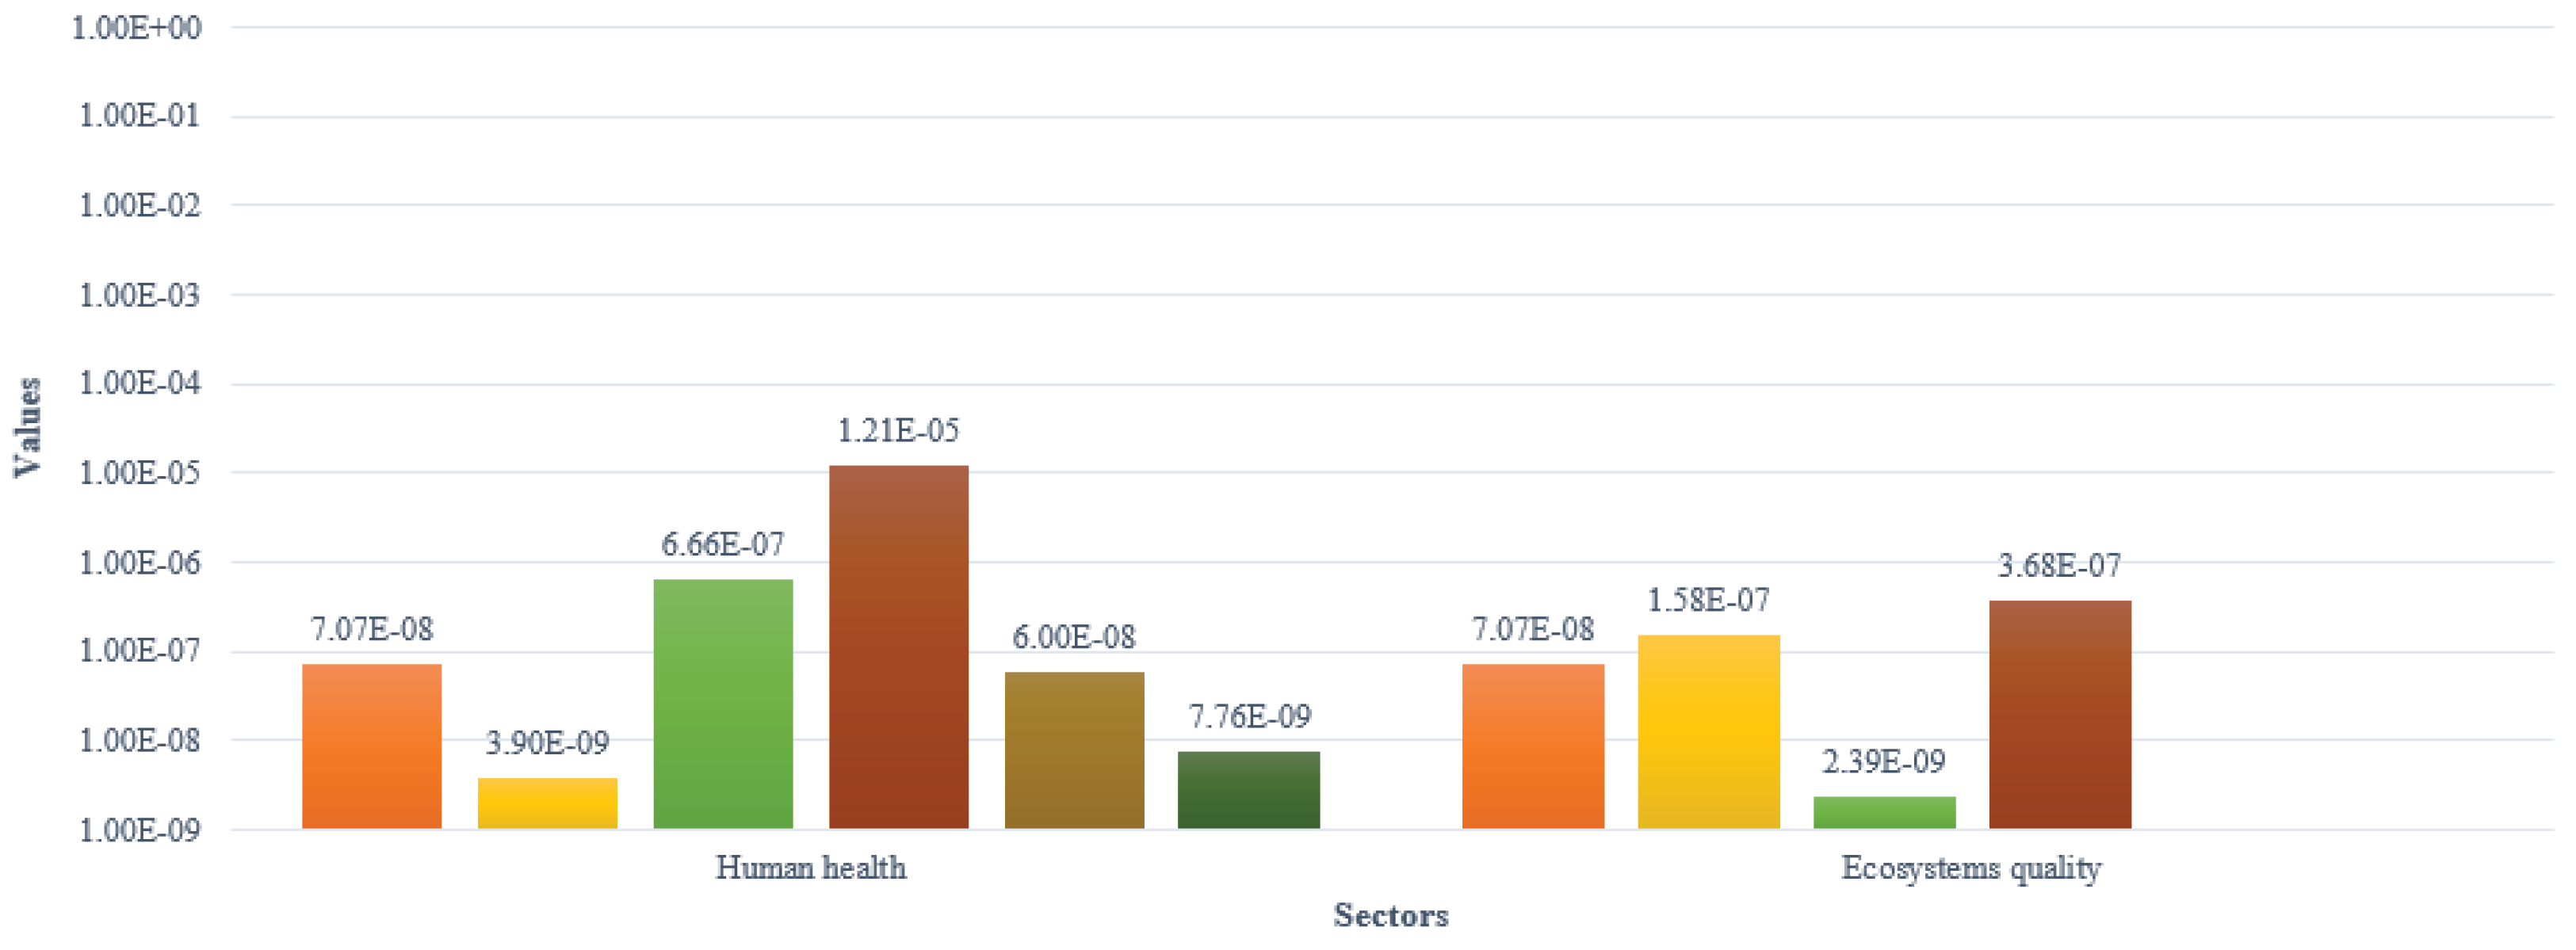
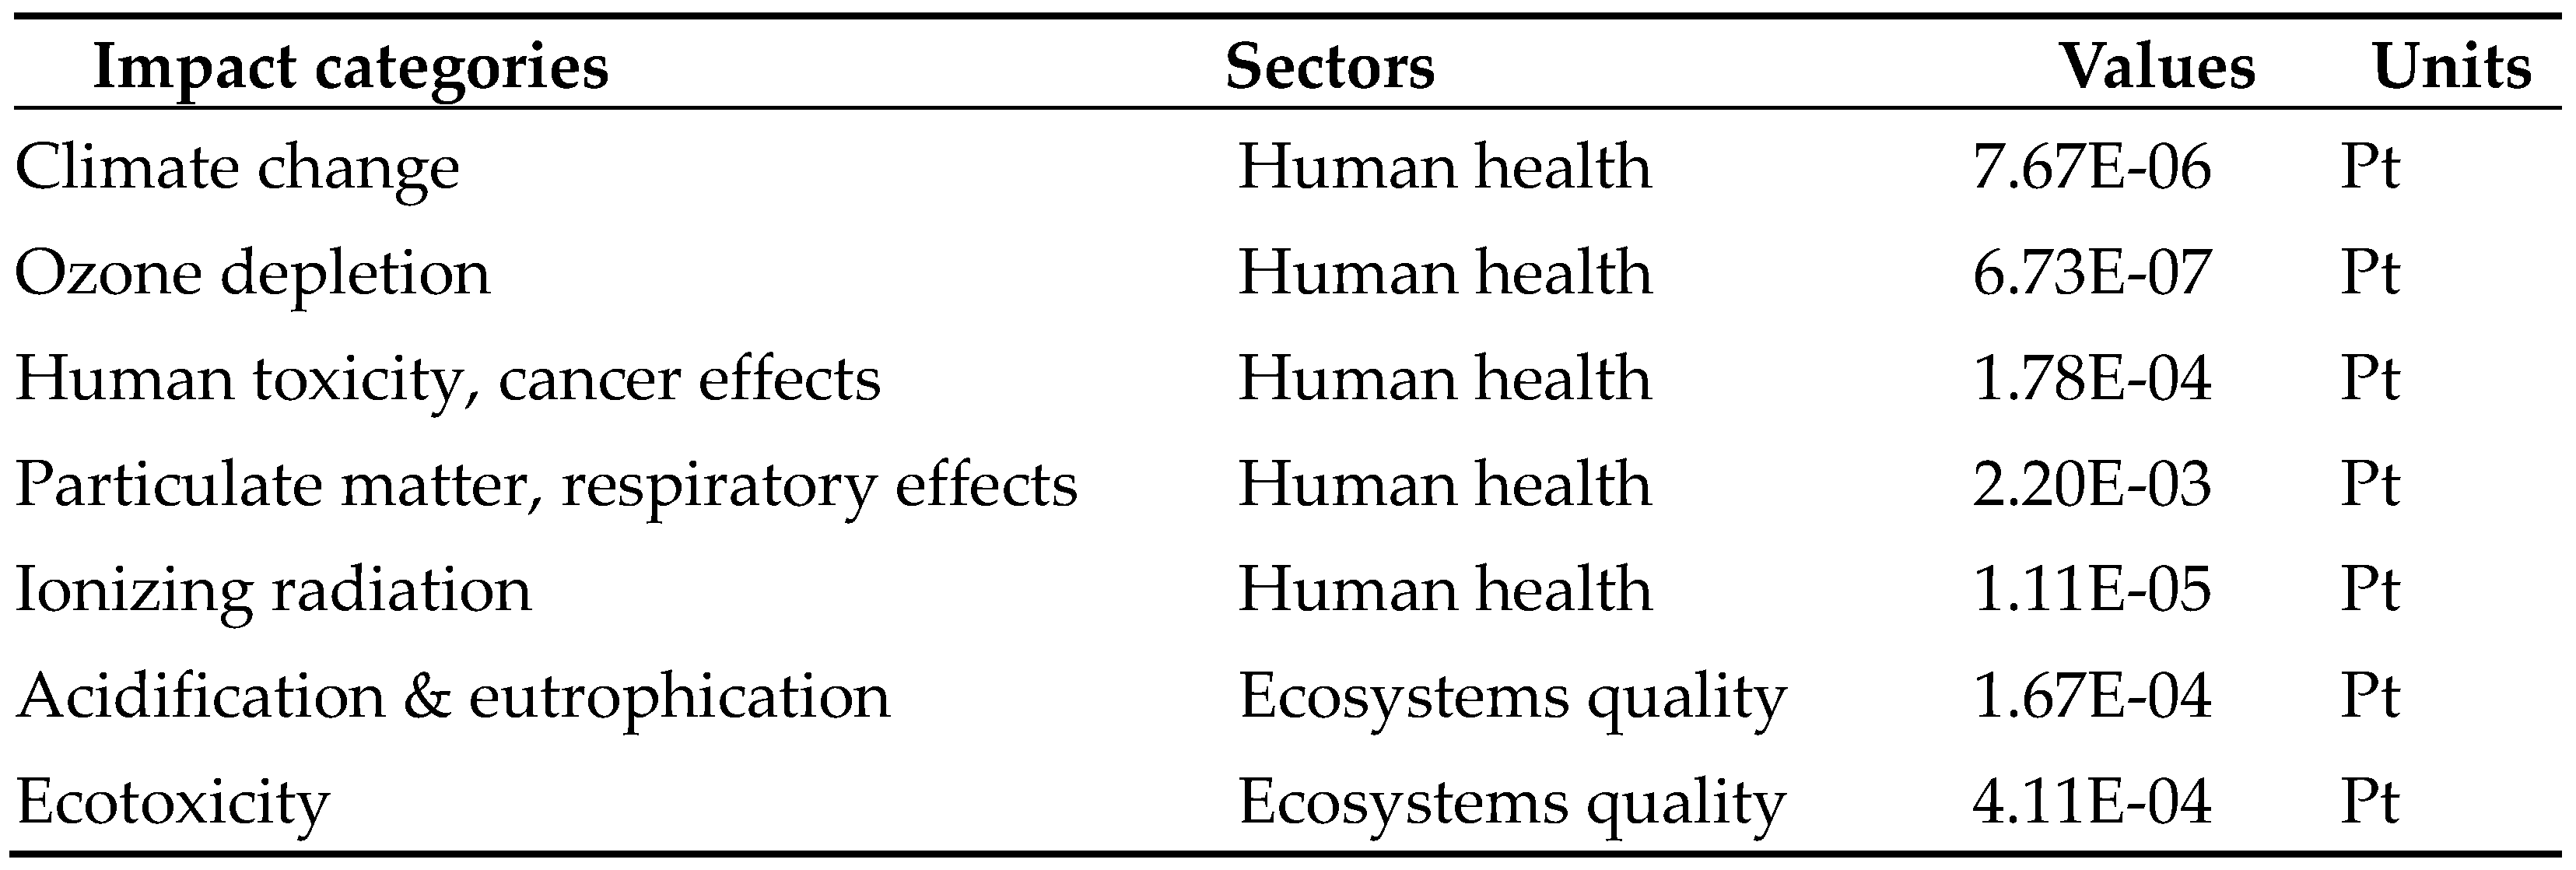
- Health of humans: This includes the effect categories of ozone depletion, ionising radiation, particulate matter, and human toxicity that can be harmful to human health. • Ecosystem quality: This covers the middle category of terrestrial acidification, which may be measured in terms of time and space per kilogramme of released material, as well as a potentially extinct portion. Additionally, it covers ecotoxicity, the midway assessment of which is contingent upon time and volume and may impact a subset of species.
- Climate change: Modelling has been done up to the point where it affects ecosystem quality and human health, but the accuracy is not high enough to produce reliable damage characterisation variables.
- Resources: This comprises the two midway categories—mineral extraction and non-renewable energy consumption—that go towards the end-point category of resources.
- Human health.
- Ecosystems.
- Resources availability.
2.1. System under study
2.2. LCI
2.3. LCIA
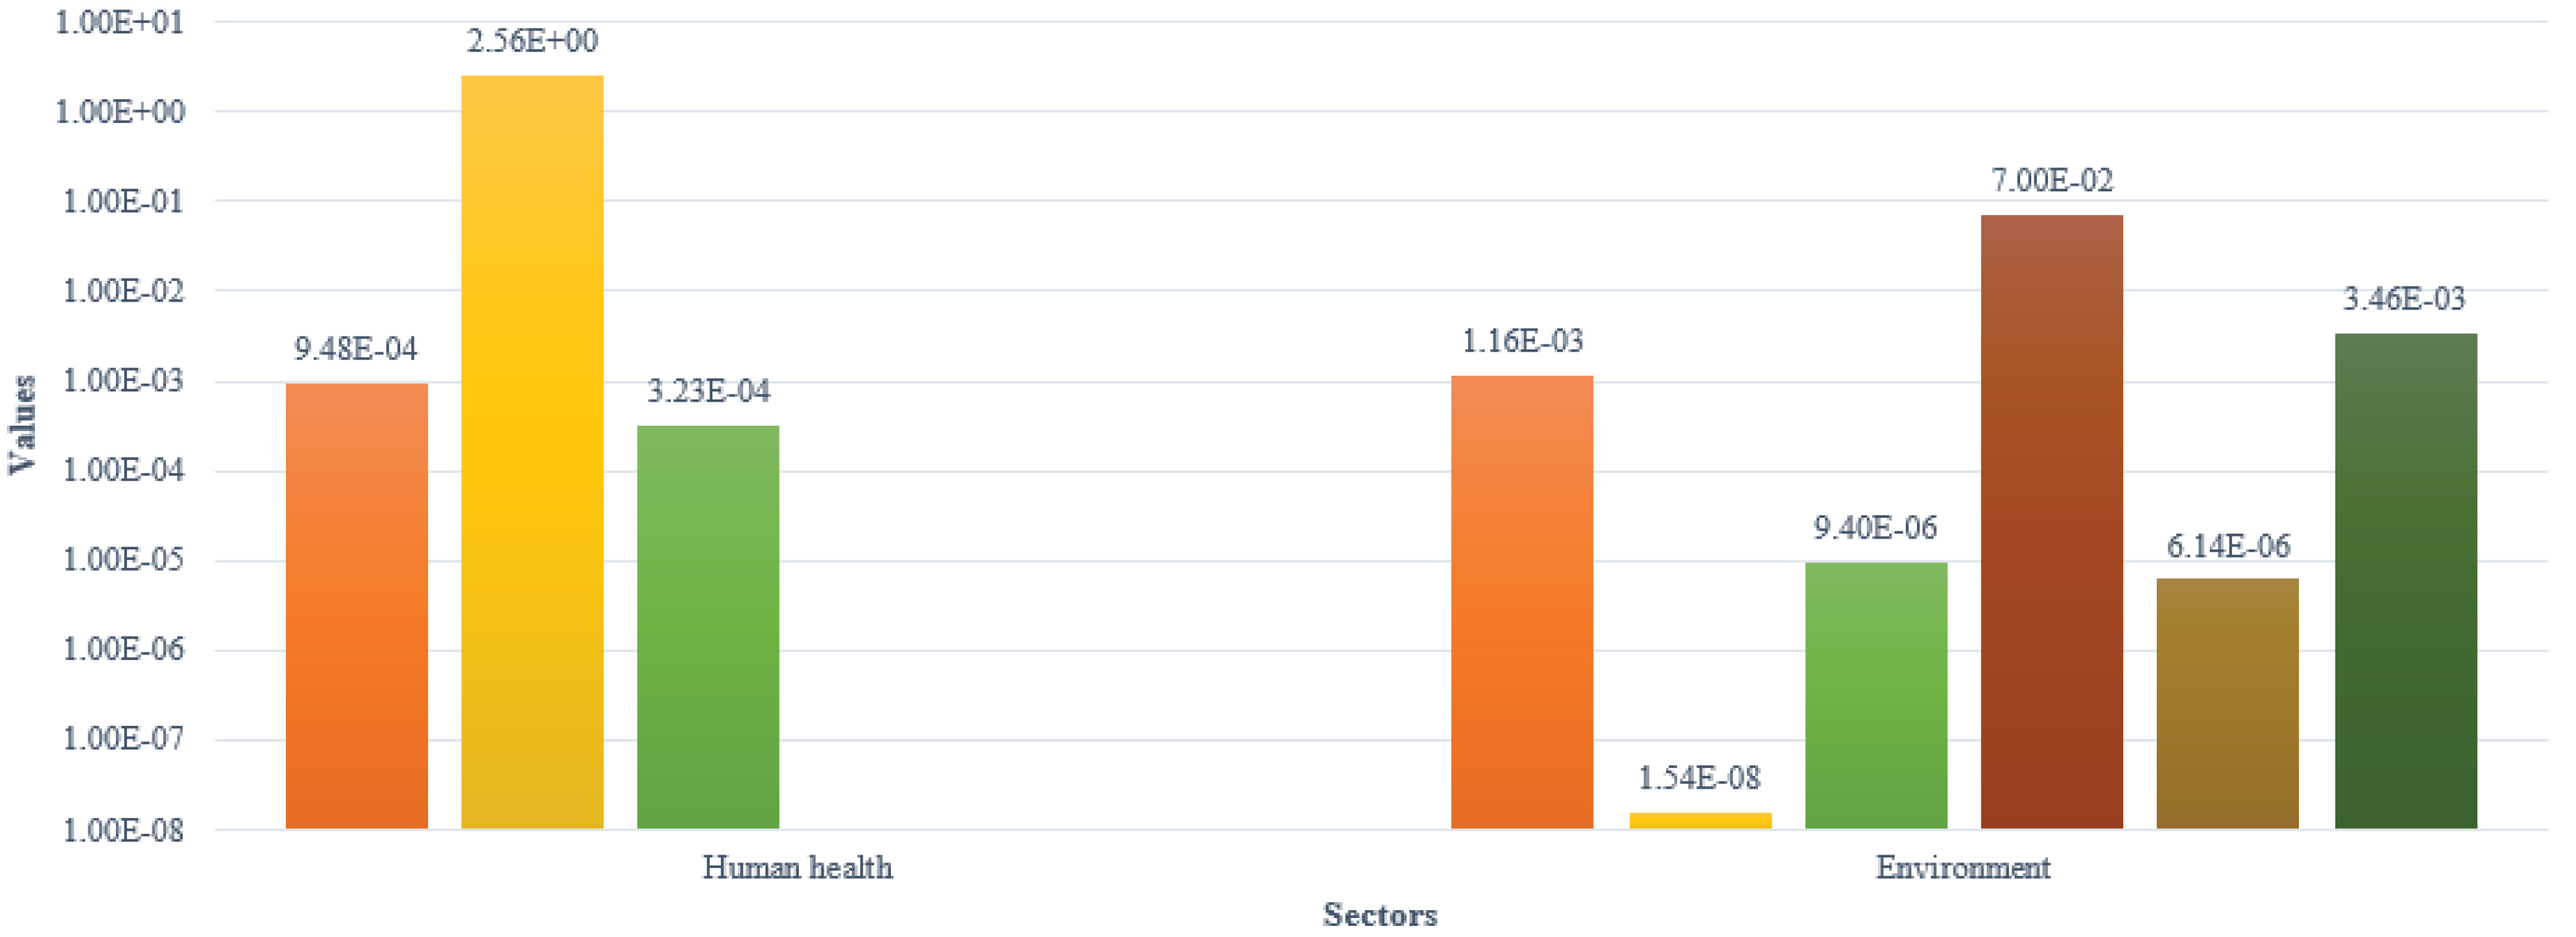
- Human health.
- Ecosystems quality.
- Environment.
3. Results
4. Discussion
5. Conclusions
Author Contributions
Funding
Conflicts of Interest
References
- Dodd, N. , Espinosa N., Van Tichelen P., Peeters K., Soares A.M. “Preparatory study for solar photovoltaic modules, inverters and systems”. Joint Research Centre, European Commission. 2020. [CrossRef]
- Masson, G. , De l’Epine M., Kaizuka I. “Trends in Photovoltaic Applications 2023”. International Energy Agency Photovoltaic Power Systems Programme. 2023. tsk. 1. https://iea-pvps.org/trends_reports/trends-2023/.
- Lian, J.G. , Wu P., Yu P., Li S.A. “Ribbon Silicon Material for Solar Cells”. Advanced Materials Research. 2012. vol. 531. pp. 67-70. [CrossRef]
- Psomopoulos, C.S. “Energy and Environment”. Undergraduate Course Lectures, Department of Electrical & Electronics Engineering, University of West Attica. 2021.
- Gazbour, N. , Razongles G., Schaeffer C., Charbuillet C. “Photovoltaic power goes green”. Electronics Goes Green 2016+. 2016. pp. 1-8. [CrossRef]
- Sala, S. , Reale F., Cristobal Garcia J., Marelli L., Pant R. “Life cycle assessment for the impact assessment of policies”. Joint Research Centre, European Commission. 2016. [CrossRef]
- Masoumian, M. , Kopacek P. “End-of-Life Management of Photovoltaic Modules”. IFAC-PapersOnLine. 2015. vol. 48. iss. 24. pp. 162-167. [CrossRef]
- Fthenakis, V. , Raugei M. “Environmental life-cycle assessment of photovoltaic systems”. The Performance of Photovoltaic (PV) Systems. 2017. pp. 209-232. [CrossRef]
- Wade A., Heath G., Weckend S., Wambach K., Sinha P., Jia Z., Komoto K., Sander K. “End-of-Life Management: Solar Photovoltaic Panels”. International Renewable Energy Agency. International Energy Agency Photovoltaic Power Systems Programme. 2016. 2016. [CrossRef]
- Stolz, P. , Frischknecht R., Wyss F., De Wild-Scholten M. “PEF screening report of electricity from photovoltaic panels in the context of the EU Product Environmental Footprint Category Rules (PEFCR) Pilots”. 2016. ver. 2.0. https://pvthin.org/wp-content/uploads/2016-04-PEFCR-PV-LCA-screening-report.pdf.
- Frischknecht, R. , Heath G., Raugei M., Sinha P., De Wild-Scholten M., Fthenakis V., Kim H.C., Alsema E., Held M. “Methodology Guidelines on Life Cycle Assessment of Photovoltaic Electricity”. International Energy Agency Photovoltaic Power Systems Programme. 2016. 3rd ed. Methodology_Guidelines_on_Life_Cycle_Assessment_of_Photovoltaic_Electricity_3rd_Edition.pdf.
- Hu, A. , Levis S., Meehl G.A., Han W., Washington W.M., Oleson K.W., Van Ruijven B.J., He M., Strand W.G. “Impact of Solar Panels on Global Climate”. Nature Climate Change. 2015. vol. 6. pp. 290-294. [CrossRef]
- Abuzaid H., Samara F. “Environmental and Economic Impact Assessments of a Photovoltaic Rooftop System in the United Arab Emirates”. Energies. 2022. vol. 15. no. 22. p. 8765. 8765. [CrossRef]
- “Potential Health and Environmental Impacts Associated with the Manufacture and Use of Photovoltaic Cells”. Electric Power Research Institute, California Energy Commission. 2003. https://www.epri.com/research/products/1000095.
- Kaldellis, J.K. , Fragos P., Kapsali M. “Systematic Experimental Study of the Pollution Deposition Impact on the Energy Yield of Photovoltaic Installations.” Renewable Energy. 2011. vol. 36. iss. 10. pp. 2717–2724. [CrossRef]
- “Solar energy myths: EMF radiation and sound”. Alliant Energy. 2022. https://www.alliantenergy.com/alliantenergynews/illuminate/cef- 021622-emfradiationsound.
- Nematchoua, M.K. “Strategies for Studying Acidification and Eutrophication Potentials, a Case Study of 150 Countries”. J Multidisciplinary Scientific Journal. 2022. vol. 5. no. 1. pp. 150-165. [CrossRef]
- “Assessment of Ecotoxicity—A Framework to Guide Selection of Chemical Alternatives”. National Center for Biotechnology Information, National Library of Medicine, National Institutes of Health. 2014. https://www.ncbi.nlm.nih.gov/books/NBK253975/.
- “EU renewable electricity has reduced environmental pressures; targeted actions help further reduce impacts”. European Environment Agency. 2023. https://www.eea.europa.eu/publications/eu-renewable-electricity-has-reduced.
- Iswara, A.P. , Farahdiba A.U., Nadhifatin E.N., Pirade F., Andhikaputra G., Muflihah I., Boedisantoso R. “A Comparative Study of Life Cycle Impact Assessment using Different Software Programs”. Institute of Physics Conference Series: Earth and Environmental Science. 2020. vol. 506. [CrossRef]
- “Marketplace”. SimaPro, PRé Sustainability. 2023. https://simapro.com/marketplace/?_product_categories=databases.
- “openLCA Nexus: The Source for LCA Data Sets”. openLCA Nexus, GreenDelta. 2023. https://nexus.openlca.org/databases.
- Jungbluth, N. , Tuchschmid M., De Wild-Scholten M. “Life Cycle Assessment of Photovoltaics: Update of Ecoinvent Data”. 2008. https://www.researchgate.net/publication/237541622_Life_Cycle_Assessment_of_Photovoltaics_Update_of_ecoinvent_data.
- Acero, A.P. , Rodríguez C., Ciroth A. “LCIA methods—Impact assessment methods in Life Cycle Assessment and their impact categories”. GreenDelta. 2015. ver. 1.5.2. https://www.openlca.org/wp-content/uploads/2015/11/LCIA-METHODS-v.1.5.4.pdf.
- “SimaPro database manual—Methods library”. PRé Sustainability. 2023. https://simapro.com/wp-content/uploads/2023/04/DatabaseManualMethods.pdf.
- Goedkoop, M. “The Eco-indicator 99 Methodology”. Journal of Life Cycle Assessment. 2007. vol. 3. no. 1. https://www.jstage.jst.go.jp/article/lca/3/1/3_32/_pdf. [CrossRef]
- Jolliet, O. , Margini M., Charles R., Humbert S., Payet J., Rebitzer G., Rosenbaum R. “IMPACT 2002+: A New Life Cycle Impact Assessment Methodology”. The International Journal of Life Cycle Assessment. 2002. vol. 8. no. 6. pp. 324-330. [CrossRef]
- Huijbregts, M.A.J. , Steinmann Z.J.N., Elshout P.M.F., Stam G., Verones F., Vieira M., Zijp M., Hollander A., Van Zelm R. “ReCiPe2016: A Harmonised Life Cycle Impact Assessment Method at Midpoint and Endpoint Level”. The International Journal of Life Cycle Assessment. 2016. vol. 22. pp. 138–147. [CrossRef]
- Bare, J. “TRACI 2.0: The Tool for the Reduction and Assessment of Chemical and Other Environmental Impacts 2.0”. Clean Technologies and Environmental Policy. 2011. vol. 13. pp. 687–696. [CrossRef]
- Amarakoon, S. , Vallet C., Curran M.A., Haldar P., Metacarpa D., Fobare D., Bell J. “Life cycle assessment of photovoltaic manufacturing consortium (PVMC) copper indium gallium (di)selenide (CIGS) modules”. The International Journal of Life Cycle Assessment. 2017. vol.23. pp. 851–866. [CrossRef]
- Huang, B. , Zhao J., Chai J., Xue B., Zhao F., Wang X. “Environmental influence assessment of China’s multi-crystalline silicon (multi-Si) photovoltaic modules considering recycling process”. Solar Energy. 2017. vol. 143. pp. 132-141. [CrossRef]
- Bracquene, E. , Peeters J.R., Dewulf W., Duflou J.R. “Taking Evolution into Account in a Parametric LCA Model for PV Panels”. Procedia CIRP. 2018. vol. 69. pp. 389-394. [CrossRef]
- Soares, W.M. , Athayde D.D., Nunes E.H.M. “LCA Study of Photovoltaic Systems Based on Different Technologies”. International Journal of Green Energy. 2018. vol. 15. no. 10. pp. 577–583. [CrossRef]
- Rashedi A., Khanam T. “Life cycle assessment of most widely adopted solar photovoltaic energy technologies by mid-point and end-point indicators of ReCiPe method”. Environmental Science and Pollution Research. 2020. vol. 27. pp. 29075–29090. 9075–29090. [CrossRef]
- Lunardi, M.M. , Alvarez-Gaitan J.P., Bilbao J.I., Corkish R. “Comparative Life Cycle Assessment of End-of-Life Silicon Solar Photovoltaic Modules”. Applied Sciences. 2018. vol. 8. no. 8. p. 1396. [CrossRef]
- Lisperguer, R.C. , Cerón E.M., Higueras De La Casa J., Martín R.D. “Environmental Impact Assessment of crystalline solar photovoltaic panels’ End-of-Life phase: Open and Closed-Loop Material Flow scenarios”. Sustainable Production and Consumption. 2020. vol. 23. pp. 157-173. [CrossRef]
- Antonanzas, J. , Quinn J.C. “Net environmental impact of the PV industry from 2000-2025”. Journal of Cleaner Production. 2021. vol. 311. [CrossRef]
- Müller, A. , Friedrich L., Reichel C., Herceg S., Mittag M., Neuhaus D.H. “A comparative life cycle assessment of silicon PV modules: Impact of module design, manufacturing location and inventory”. Solar Energy Materials and Solar Cells. 2021. vol. 23. [CrossRef]
- Vácha, M. , Kodymová J., Lapčík V. “Life-cycle assessment of a photovoltaic panel: Assessment of energy intensity of production and environmental impacts”. IOP Conf. Series: Materials Science and Engineering. 2021. vol. 1209. [CrossRef]

| Flows | Categories | Values | Units |
|---|---|---|---|
| Air | Resource/In air | 2.77E-01 | kg |
| Antimony | Resources from ground/Non-renewable element resources from ground | 8.92E-13 | kg |
| Barite | Resource/In ground | 1.85E-08 | kg |
| Carbon | Resources from ground/Non-renewable material resources from ground | 8.46E-12 | kg |
| Carbon dioxide | Resources from air/Renewable material resources from air | 4.02E-03 | kg |
| Copper | Resource/In ground | 4.00E-04 | kg |
| Lake water | Resources from water/Renewable material resources from water | 20.53E+00 | m3 |
| Land occupation | Land use/Occupation | 4.70E-04 | m2*a |
| Land transformation | Land use/Transformation | 2.47E-05 | m2 |
| Manganese | Resource/In ground | 2.51E-05 | kg |
| Phosphorus | Resource/In ground | 8.75E-07 | kg |
| Primary energy from solar energy | Resources from air/Renewable energy resources from air | 27.01E+00 | MJ |
| Quartz sand | Resources from ground/Non-renewable material resources from ground | 4.00E-03 | kg |
| River water | Resources from water/Renewable material resources from water | 163.02E+00 | m3 |
| Sea water | Resources from water/Renewable material resources from water | 2.34E-01 | kg |
| Silicon | Resource/In ground | 9.16E-08 | kg |
| Silver | Resource/In ground | 7.40E-07 | kg |
| Soil | Resource/In ground | 1.80E-03 | kg |
| Uranium | Resource/In ground | 8.40E-02 | MJ |
| Zinc | Resource/In ground | 3.30E-04 | kg |
| Flows | Categories | Values | Units |
|---|---|---|---|
| Air, used | Air/Unspecified | 1.96E-01 | kg |
| Antimony | Emissions to air/Emissions to air, unspecified | 3.21E-09 | kg |
| Antimony | Emissions to soil/Emissions to non-agricultural soil | 9.06E-16 | kg |
| Antimony | Emissions to water/Emissions to fresh water | 8.43E-12 | kg |
| Carbon dioxide | Emissions to air/Emissions to air, unspecified | 3.31E-02 | kg |
| Copper | Emissions to air/Emissions to air, unspecified | 7.53E-08 | kg |
| Copper | Emissions to soil/Emissions to agricultural soil | 4.80E-09 | kg |
| Copper | Emissions to soil/Emissions to non-agricultural soil | 2.34E-10 | kg |
| Copper | Emissions to water/Emissions to fresh water | 1.80E-08 | kg |
| Electricity | Energy carriers and technologies/Electricity | 3.60E+00 | MJ |
| Manganese | Emissions to air/Emissions to air, unspecified | 8.20E-08 | kg |
| Manganese | Emissions to soil/Emissions to non-agricultural soil | 1.20E-10 | kg |
| Manganese | Emissions to water/Emissions to fresh water | 1.93E-08 | kg |
| Manganese | Emissions to water/Emissions to sea water | 9.80E-13 | kg |
| Silver | Emissions to air/Emissions to air, unspecified | 1.27E-07 | kg |
| Silver | Emissions to water/Emissions to fresh water | 4.40E-11 | kg |
| Silver | Emissions to water/Emissions to sea water | 1.24E-15 | kg |
| Waste heat | Emissions to air/Emissions to air, unspecified | 23.55E+00 | MJ |
| Waste heat | Emissions to water/Emissions to fresh water | 7.46E-02 | MJ |
| Waste heat | Emissions to water/Emissions to sea water | 1.23E-05 | MJ |
Disclaimer/Publisher’s Note: The statements, opinions and data contained in all publications are solely those of the individual author(s) and contributor(s) and not of MDPI and/or the editor(s). MDPI and/or the editor(s) disclaim responsibility for any injury to people or property resulting from any ideas, methods, instructions or products referred to in the content. |
© 2024 by the authors. Licensee MDPI, Basel, Switzerland. This article is an open access article distributed under the terms and conditions of the Creative Commons Attribution (CC BY) license (http://creativecommons.org/licenses/by/4.0/).


